Zip Codes with the Highest Percentage of Population Employed in Transportation & Warehousing in San Bernardino, CA
RELATED REPORTS & OPTIONS
Transportation & Warehousing
San Bernardino
Compare Zip Codes
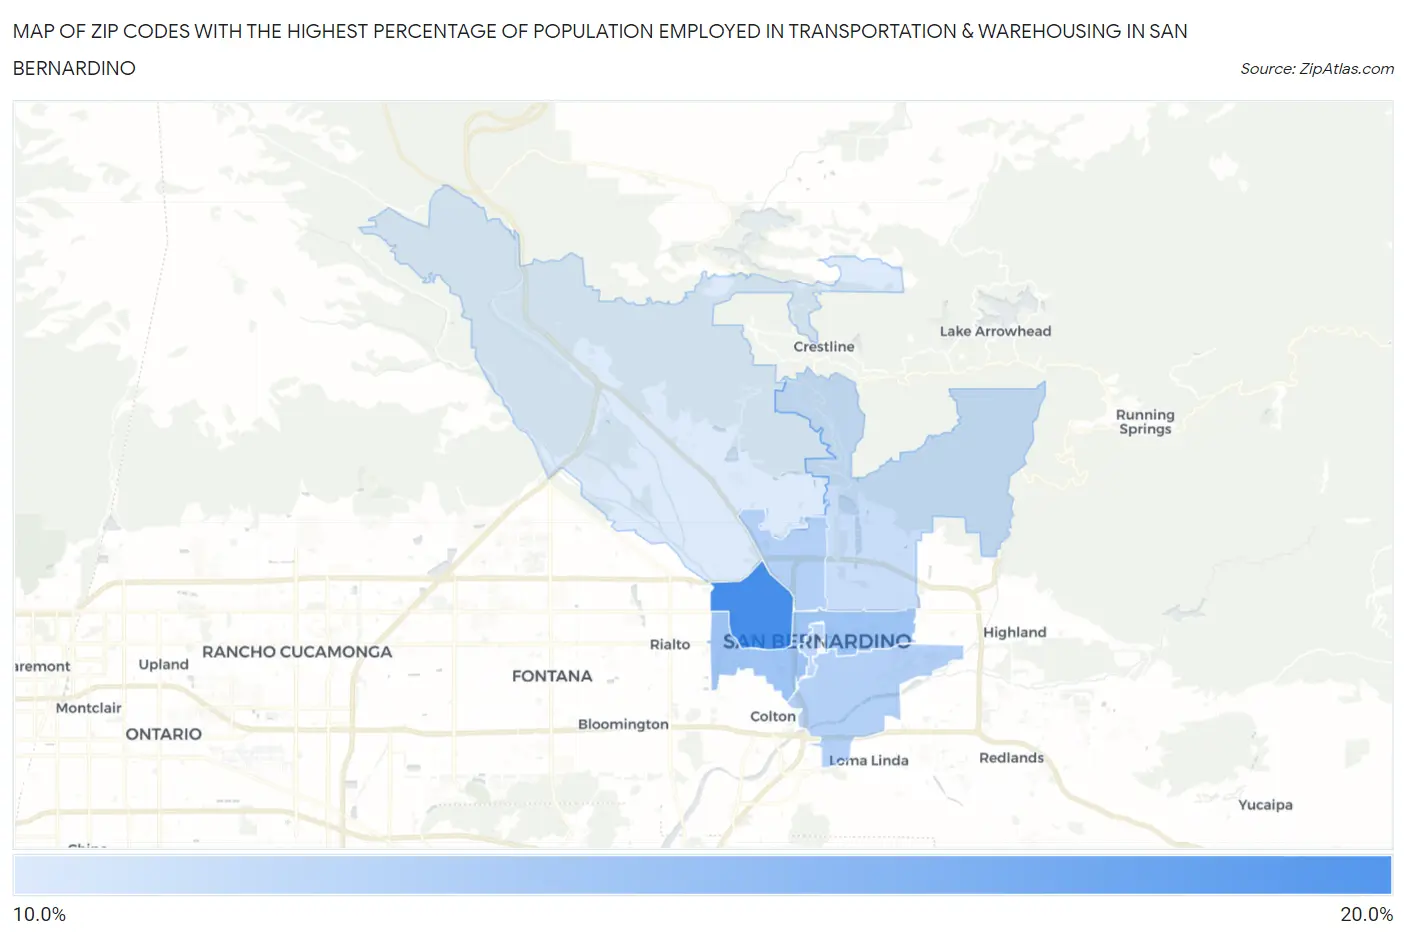
Map of Zip Codes with the Highest Percentage of Population Employed in Transportation & Warehousing in San Bernardino
0.0%
20.0%
Zip Codes with the Highest Percentage of Population Employed in Transportation & Warehousing in San Bernardino, CA
| Zip Code | % Employed | vs State | vs National | |
| 1. | 92411 | 19.2% | 5.1%(+14.1)#19 | 4.9%(+14.3)#578 |
| 2. | 92410 | 15.2% | 5.1%(+10.1)#31 | 4.9%(+10.3)#1,017 |
| 3. | 92408 | 14.3% | 5.1%(+9.16)#42 | 4.9%(+9.34)#1,201 |
| 4. | 92405 | 14.3% | 5.1%(+9.13)#43 | 4.9%(+9.31)#1,226 |
| 5. | 92401 | 13.9% | 5.1%(+8.80)#50 | 4.9%(+8.99)#1,296 |
| 6. | 92404 | 13.3% | 5.1%(+8.21)#54 | 4.9%(+8.39)#1,434 |
| 7. | 92407 | 12.5% | 5.1%(+7.33)#65 | 4.9%(+7.51)#1,696 |
1
Common Questions
What are the Top 5 Zip Codes with the Highest Percentage of Population Employed in Transportation & Warehousing in San Bernardino, CA?
Top 5 Zip Codes with the Highest Percentage of Population Employed in Transportation & Warehousing in San Bernardino, CA are:
What zip code has the Highest Percentage of Population Employed in Transportation & Warehousing in San Bernardino, CA?
92411 has the Highest Percentage of Population Employed in Transportation & Warehousing in San Bernardino, CA with 19.2%.
What is the Percentage of Population Employed in Transportation & Warehousing in San Bernardino, CA?
Percentage of Population Employed in Transportation & Warehousing in San Bernardino is 14.5%.
What is the Percentage of Population Employed in Transportation & Warehousing in California?
Percentage of Population Employed in Transportation & Warehousing in California is 5.1%.
What is the Percentage of Population Employed in Transportation & Warehousing in the United States?
Percentage of Population Employed in Transportation & Warehousing in the United States is 4.9%.