Samoa, CA Map & Demographics
Samoa Map
Samoa Overview
$19,733
PER CAPITA INCOME
$41,641
AVG FAMILY INCOME
$44,737
AVG HOUSEHOLD INCOME
0.26
INEQUALITY / GINI INDEX
223
TOTAL POPULATION
99
MALE POPULATION
124
FEMALE POPULATION
79.84
MALES / 100 FEMALES
125.25
FEMALES / 100 MALES
28.9
MEDIAN AGE
3.6
AVG FAMILY SIZE
3.0
AVG HOUSEHOLD SIZE
121
LABOR FORCE [ PEOPLE ]
70.8%
PERCENT IN LABOR FORCE
34.7%
UNEMPLOYMENT RATE
Samoa Zip Codes
Samoa Area Codes
Income in Samoa
Income Overview in Samoa
Per Capita Income in Samoa is $19,733, while median incomes of families and households are $41,641 and $44,737 respectively.
| Characteristic | Number | Measure |
| Per Capita Income | 223 | $19,733 |
| Median Family Income | 51 | $41,641 |
| Mean Family Income | 51 | $58,110 |
| Median Household Income | 74 | $44,737 |
| Mean Household Income | 74 | $56,235 |
| Income Deficit | 51 | $0 |
| Wage / Income Gap (%) | 223 | 0.00% |
| Wage / Income Gap ($) | 223 | 100.00¢ per $1 |
| Gini / Inequality Index | 223 | 0.26 |
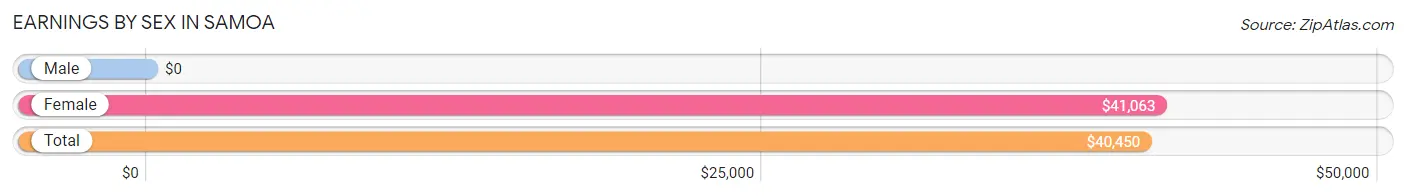
Earnings by Sex in Samoa
| Sex | Number | Average Earnings |
| Male | 44 (53.0%) | $0 |
| Female | 39 (47.0%) | $41,063 |
| Total | 83 (100.0%) | $40,450 |
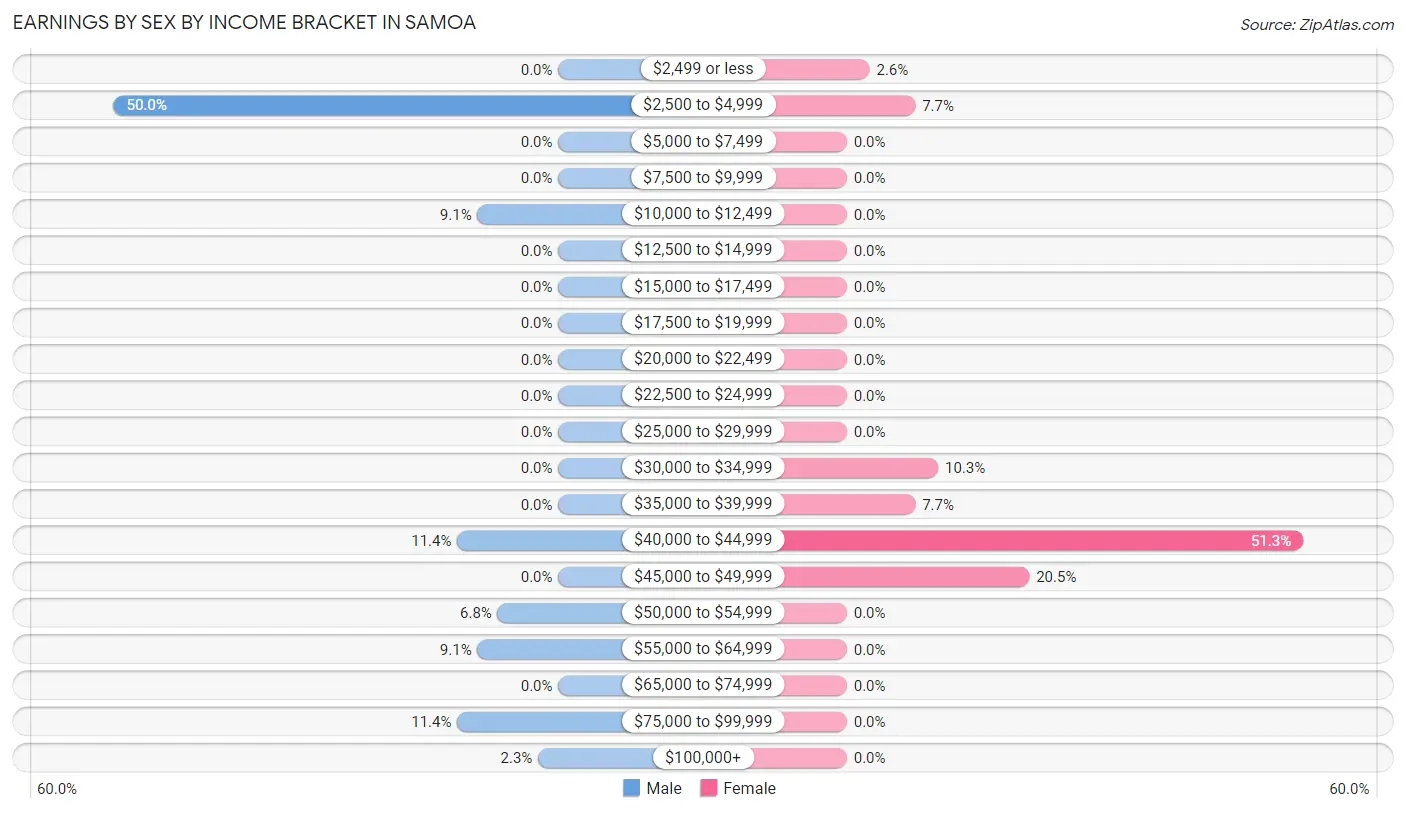
Earnings by Sex by Income Bracket in Samoa
The most common earnings brackets in Samoa are $2,500 to $4,999 for men (22 | 50.0%) and $40,000 to $44,999 for women (20 | 51.3%).
| Income | Male | Female |
| $2,499 or less | 0 (0.0%) | 1 (2.6%) |
| $2,500 to $4,999 | 22 (50.0%) | 3 (7.7%) |
| $5,000 to $7,499 | 0 (0.0%) | 0 (0.0%) |
| $7,500 to $9,999 | 0 (0.0%) | 0 (0.0%) |
| $10,000 to $12,499 | 4 (9.1%) | 0 (0.0%) |
| $12,500 to $14,999 | 0 (0.0%) | 0 (0.0%) |
| $15,000 to $17,499 | 0 (0.0%) | 0 (0.0%) |
| $17,500 to $19,999 | 0 (0.0%) | 0 (0.0%) |
| $20,000 to $22,499 | 0 (0.0%) | 0 (0.0%) |
| $22,500 to $24,999 | 0 (0.0%) | 0 (0.0%) |
| $25,000 to $29,999 | 0 (0.0%) | 0 (0.0%) |
| $30,000 to $34,999 | 0 (0.0%) | 4 (10.3%) |
| $35,000 to $39,999 | 0 (0.0%) | 3 (7.7%) |
| $40,000 to $44,999 | 5 (11.4%) | 20 (51.3%) |
| $45,000 to $49,999 | 0 (0.0%) | 8 (20.5%) |
| $50,000 to $54,999 | 3 (6.8%) | 0 (0.0%) |
| $55,000 to $64,999 | 4 (9.1%) | 0 (0.0%) |
| $65,000 to $74,999 | 0 (0.0%) | 0 (0.0%) |
| $75,000 to $99,999 | 5 (11.4%) | 0 (0.0%) |
| $100,000+ | 1 (2.3%) | 0 (0.0%) |
| Total | 44 (100.0%) | 39 (100.0%) |
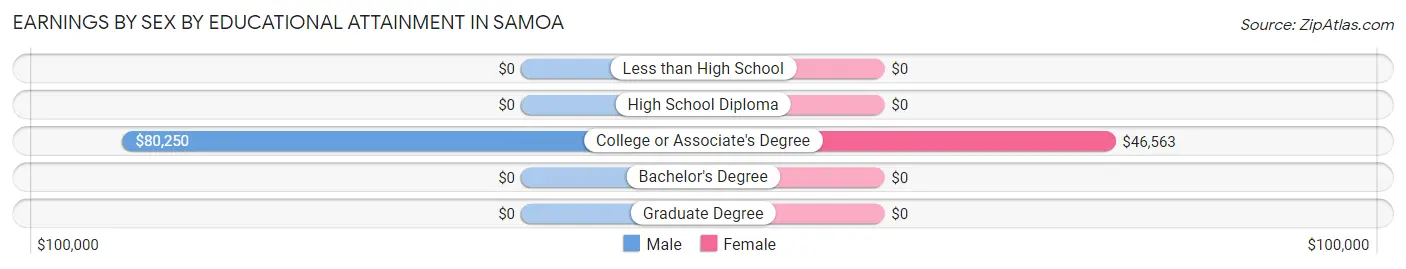
Earnings by Sex by Educational Attainment in Samoa
| Educational Attainment | Male Income | Female Income |
| Less than High School | - | - |
| High School Diploma | - | - |
| College or Associate's Degree | $80,250 | $46,563 |
| Bachelor's Degree | - | - |
| Graduate Degree | - | - |
| Total | - | - |
Family Income in Samoa
Family Income Brackets in Samoa
According to the Samoa family income data, there are 16 families falling into the $35,000 to $49,999 income range, which is the most common income bracket and makes up 31.4% of all families.
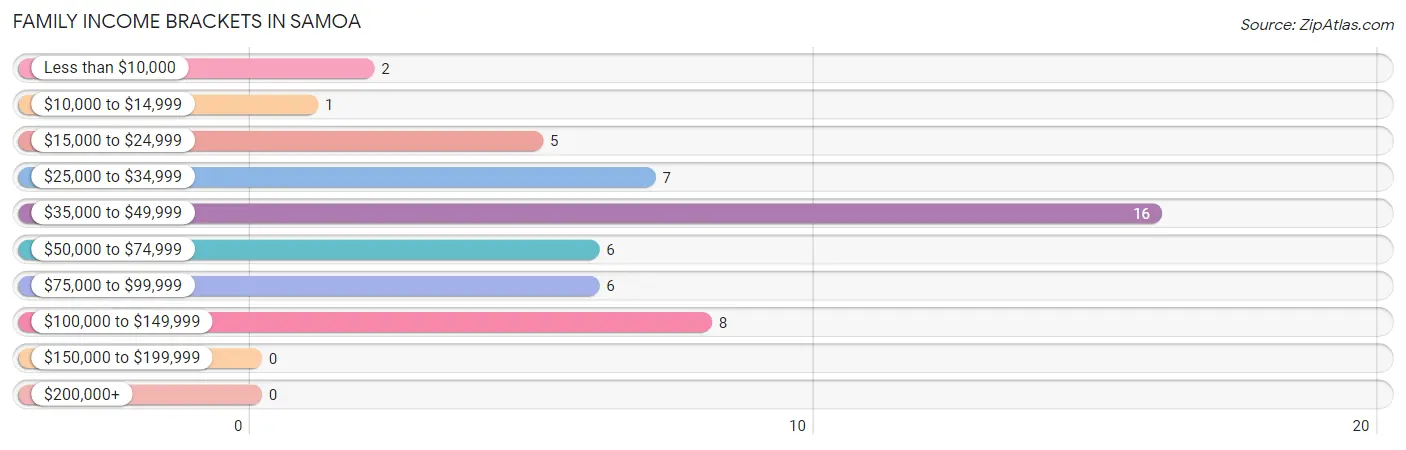
| Income Bracket | # Families | % Families |
| Less than $10,000 | 2 | 3.9% |
| $10,000 to $14,999 | 1 | 2.0% |
| $15,000 to $24,999 | 5 | 9.8% |
| $25,000 to $34,999 | 7 | 13.7% |
| $35,000 to $49,999 | 16 | 31.4% |
| $50,000 to $74,999 | 6 | 11.8% |
| $75,000 to $99,999 | 6 | 11.8% |
| $100,000 to $149,999 | 8 | 15.7% |
| $150,000 to $199,999 | 0 | 0.0% |
| $200,000+ | 0 | 0.0% |
Family Income by Famaliy Size in Samoa
2-person families (23 | 45.1%) account for the highest median family income in Samoa with $41,354 per family, while 2-person families (23 | 45.1%) have the highest median income of $20,677 per family member.
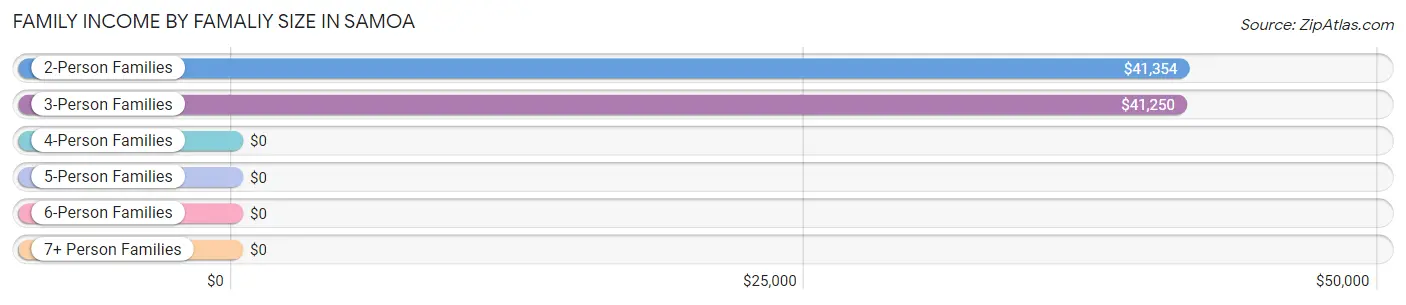
| Income Bracket | # Families | Median Income |
| 2-Person Families | 23 (45.1%) | $41,354 |
| 3-Person Families | 6 (11.8%) | $41,250 |
| 4-Person Families | 17 (33.3%) | $0 |
| 5-Person Families | 0 (0.0%) | $0 |
| 6-Person Families | 5 (9.8%) | $0 |
| 7+ Person Families | 0 (0.0%) | $0 |
| Total | 51 (100.0%) | $41,641 |
Family Income by Number of Earners in Samoa
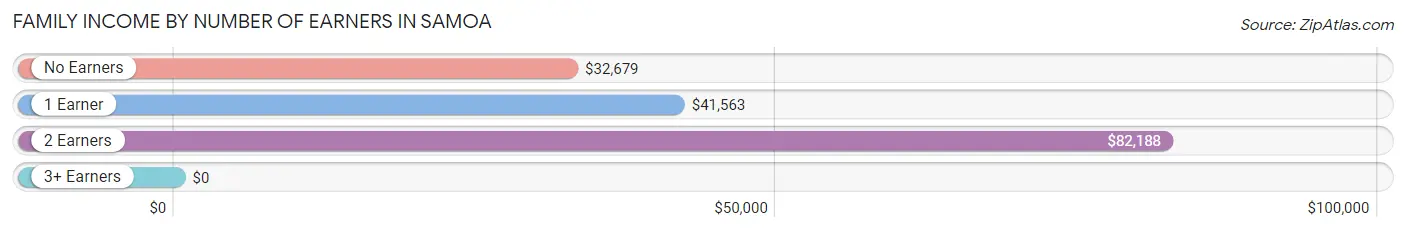
| Number of Earners | # Families | Median Income |
| No Earners | 13 (25.5%) | $32,679 |
| 1 Earner | 20 (39.2%) | $41,563 |
| 2 Earners | 15 (29.4%) | $82,188 |
| 3+ Earners | 3 (5.9%) | $0 |
| Total | 51 (100.0%) | $41,641 |
Household Income in Samoa
Household Income Brackets in Samoa
With 35 households falling in the category, the $35,000 to $49,999 income range is the most frequent in Samoa, accounting for 47.3% of all households.
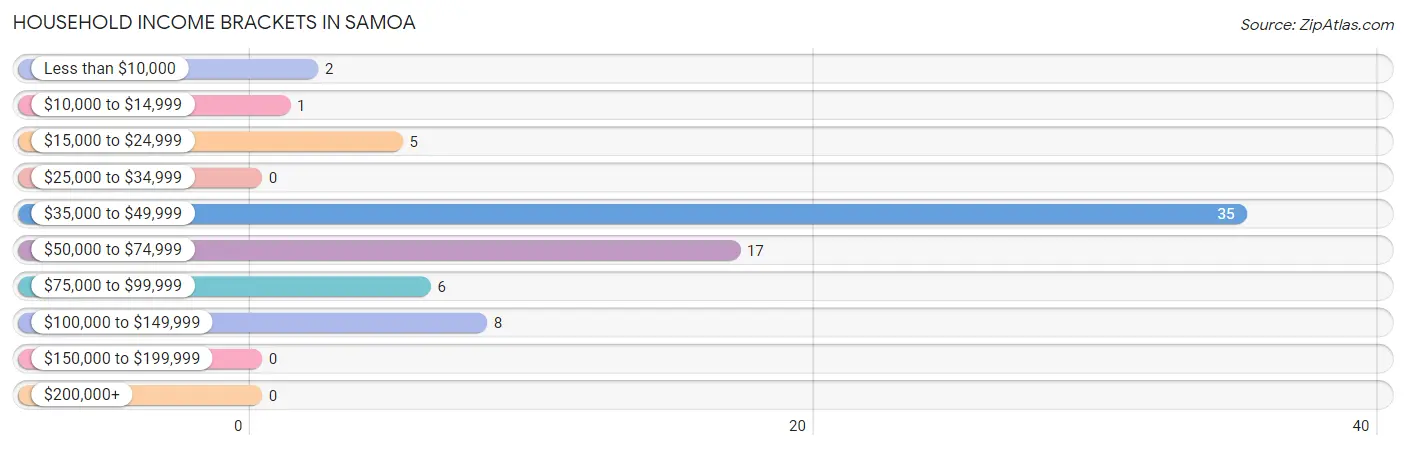
| Income Bracket | # Households | % Households |
| Less than $10,000 | 2 | 2.7% |
| $10,000 to $14,999 | 1 | 1.4% |
| $15,000 to $24,999 | 5 | 6.8% |
| $25,000 to $34,999 | 0 | 0.0% |
| $35,000 to $49,999 | 35 | 47.3% |
| $50,000 to $74,999 | 17 | 23.0% |
| $75,000 to $99,999 | 6 | 8.1% |
| $100,000 to $149,999 | 8 | 10.8% |
| $150,000 to $199,999 | 0 | 0.0% |
| $200,000+ | 0 | 0.0% |
Household Income by Householder Age in Samoa
The median household income in Samoa is $44,737, with the highest median household income of $126,071 found in the 45 to 64 years age bracket for the primary householder. A total of 10 households (13.5%) fall into this category. Meanwhile, the 15 to 24 years age bracket for the primary householder has the lowest median household income of $0, with 16 households (21.6%) in this group.
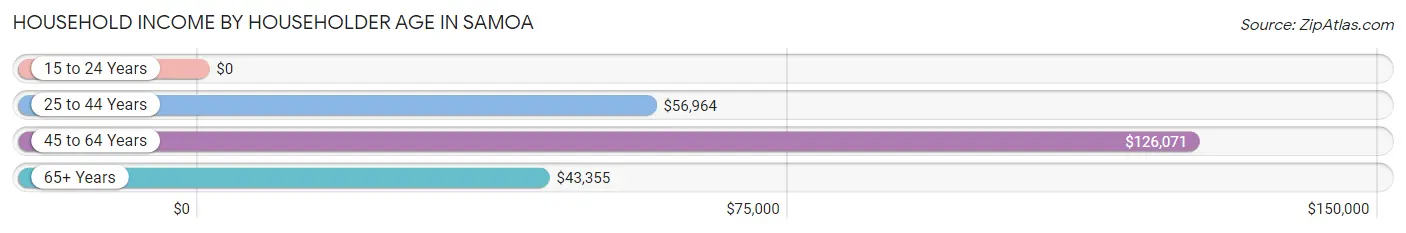
| Income Bracket | # Households | Median Income |
| 15 to 24 Years | 16 (21.6%) | $0 |
| 25 to 44 Years | 23 (31.1%) | $56,964 |
| 45 to 64 Years | 10 (13.5%) | $126,071 |
| 65+ Years | 25 (33.8%) | $43,355 |
| Total | 74 (100.0%) | $44,737 |
Poverty in Samoa
Income Below Poverty by Sex and Age in Samoa
With 13.1% poverty level for males and 1.6% for females among the residents of Samoa, under 5 year old males and 75 year old and over females are the most vulnerable to poverty, with 1 males (100.0%) and 1 females (33.3%) in their respective age groups living below the poverty level.
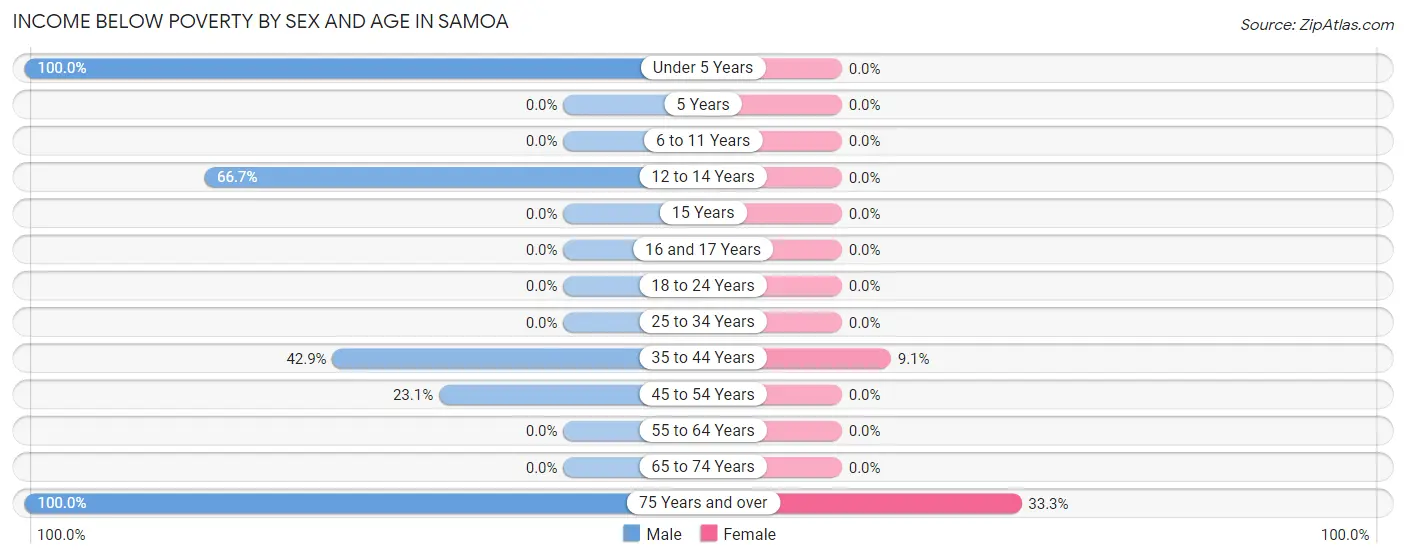
| Age Bracket | Male | Female |
| Under 5 Years | 1 (100.0%) | 0 (0.0%) |
| 5 Years | 0 (0.0%) | 0 (0.0%) |
| 6 to 11 Years | 0 (0.0%) | 0 (0.0%) |
| 12 to 14 Years | 2 (66.7%) | 0 (0.0%) |
| 15 Years | 0 (0.0%) | 0 (0.0%) |
| 16 and 17 Years | 0 (0.0%) | 0 (0.0%) |
| 18 to 24 Years | 0 (0.0%) | 0 (0.0%) |
| 25 to 34 Years | 0 (0.0%) | 0 (0.0%) |
| 35 to 44 Years | 6 (42.9%) | 1 (9.1%) |
| 45 to 54 Years | 3 (23.1%) | 0 (0.0%) |
| 55 to 64 Years | 0 (0.0%) | 0 (0.0%) |
| 65 to 74 Years | 0 (0.0%) | 0 (0.0%) |
| 75 Years and over | 1 (100.0%) | 1 (33.3%) |
| Total | 13 (13.1%) | 2 (1.6%) |
Income Above Poverty by Sex and Age in Samoa
According to the poverty statistics in Samoa, males aged 5 years and females aged under 5 years are the age groups that are most secure financially, with 100.0% of males and 100.0% of females in these age groups living above the poverty line.
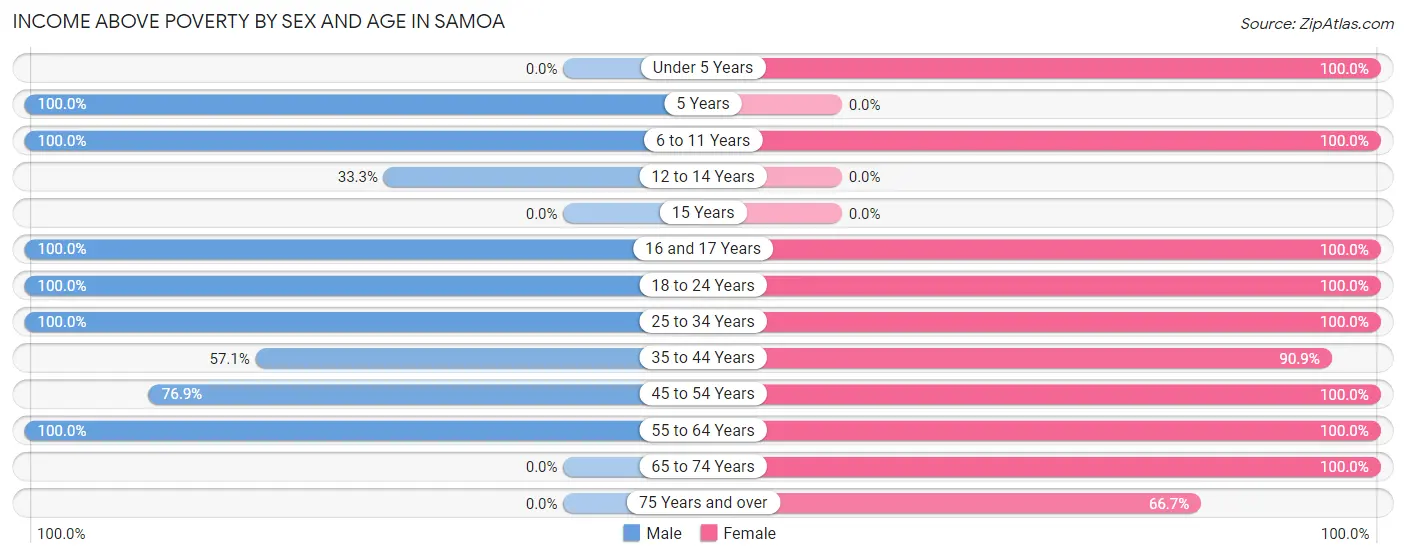
| Age Bracket | Male | Female |
| Under 5 Years | 0 (0.0%) | 20 (100.0%) |
| 5 Years | 6 (100.0%) | 0 (0.0%) |
| 6 to 11 Years | 7 (100.0%) | 15 (100.0%) |
| 12 to 14 Years | 1 (33.3%) | 0 (0.0%) |
| 15 Years | 0 (0.0%) | 0 (0.0%) |
| 16 and 17 Years | 13 (100.0%) | 11 (100.0%) |
| 18 to 24 Years | 4 (100.0%) | 25 (100.0%) |
| 25 to 34 Years | 31 (100.0%) | 5 (100.0%) |
| 35 to 44 Years | 8 (57.1%) | 10 (90.9%) |
| 45 to 54 Years | 10 (76.9%) | 5 (100.0%) |
| 55 to 64 Years | 6 (100.0%) | 5 (100.0%) |
| 65 to 74 Years | 0 (0.0%) | 24 (100.0%) |
| 75 Years and over | 0 (0.0%) | 2 (66.7%) |
| Total | 86 (86.9%) | 122 (98.4%) |
Income Below Poverty Among Married-Couple Families in Samoa
The poverty statistics for married-couple families in Samoa show that 9.1% or 3 of the total 33 families live below the poverty line. Families with 1 or 2 children have the highest poverty rate of 15.4%, comprising of 2 families. On the other hand, families with 3 or 4 children have the lowest poverty rate of 0.0%, which includes 0 families.
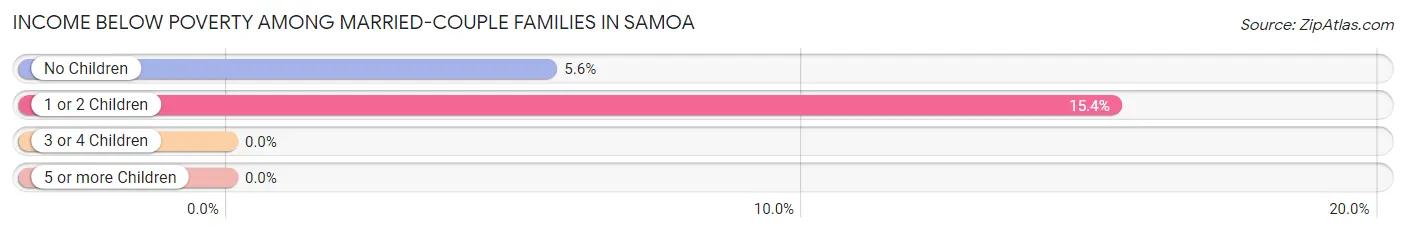
| Children | Above Poverty | Below Poverty |
| No Children | 17 (94.4%) | 1 (5.6%) |
| 1 or 2 Children | 11 (84.6%) | 2 (15.4%) |
| 3 or 4 Children | 2 (100.0%) | 0 (0.0%) |
| 5 or more Children | 0 (0.0%) | 0 (0.0%) |
| Total | 30 (90.9%) | 3 (9.1%) |
Income Below Poverty Among Single-Parent Households in Samoa
| Children | Single Father | Single Mother |
| No Children | 0 (0.0%) | 0 (0.0%) |
| 1 or 2 Children | 0 (0.0%) | 0 (0.0%) |
| 3 or 4 Children | 0 (0.0%) | 0 (0.0%) |
| 5 or more Children | 0 (0.0%) | 0 (0.0%) |
| Total | 0 (0.0%) | 0 (0.0%) |
Income Below Poverty Among Married-Couple vs Single-Parent Households in Samoa
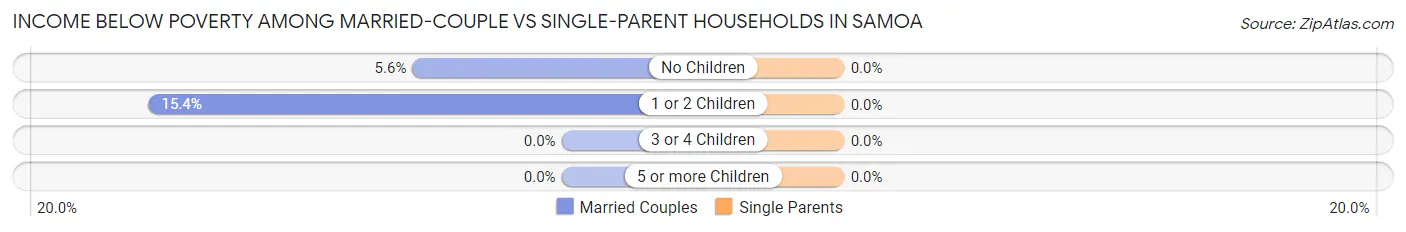
| Children | Married-Couple Families | Single-Parent Households |
| No Children | 1 (5.6%) | 0 (0.0%) |
| 1 or 2 Children | 2 (15.4%) | 0 (0.0%) |
| 3 or 4 Children | 0 (0.0%) | 0 (0.0%) |
| 5 or more Children | 0 (0.0%) | 0 (0.0%) |
| Total | 3 (9.1%) | 0 (0.0%) |
Race in Samoa
The most populous races in Samoa are White / Caucasian (174 | 78.0%), Two or more Races (41 | 18.4%), and Hispanic or Latino (19 | 8.5%).
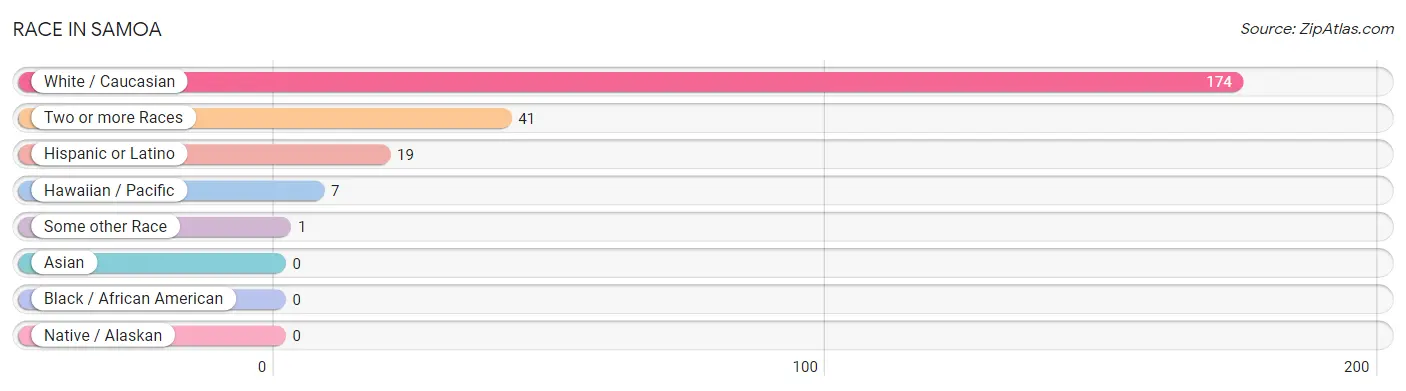
| Race | # Population | % Population |
| Asian | 0 | 0.0% |
| Black / African American | 0 | 0.0% |
| Hawaiian / Pacific | 7 | 3.1% |
| Hispanic or Latino | 19 | 8.5% |
| Native / Alaskan | 0 | 0.0% |
| White / Caucasian | 174 | 78.0% |
| Two or more Races | 41 | 18.4% |
| Some other Race | 1 | 0.4% |
| Total | 223 | 100.0% |
Ancestry in Samoa
The most populous ancestries reported in Samoa are German (51 | 22.9%), Irish (45 | 20.2%), Native Hawaiian (41 | 18.4%), Mexican (19 | 8.5%), and Norwegian (19 | 8.5%), together accounting for 78.5% of all Samoa residents.
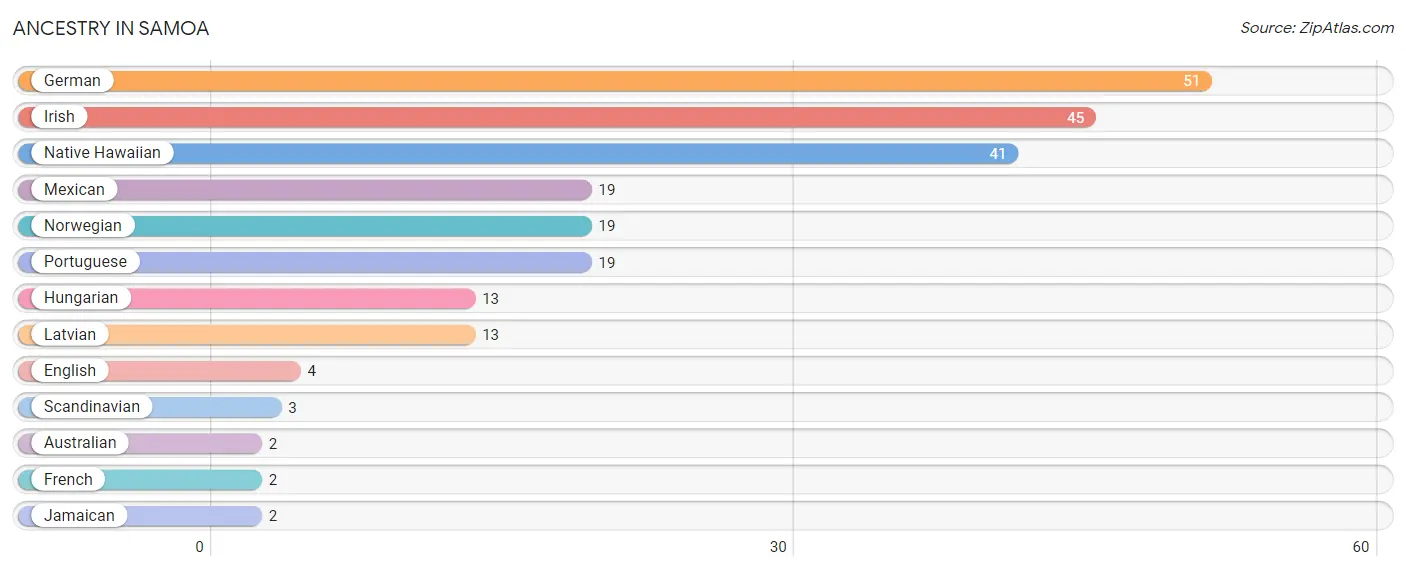
| Ancestry | # Population | % Population |
| Australian | 2 | 0.9% |
| English | 4 | 1.8% |
| French | 2 | 0.9% |
| German | 51 | 22.9% |
| Hungarian | 13 | 5.8% |
| Irish | 45 | 20.2% |
| Jamaican | 2 | 0.9% |
| Latvian | 13 | 5.8% |
| Mexican | 19 | 8.5% |
| Native Hawaiian | 41 | 18.4% |
| Norwegian | 19 | 8.5% |
| Portuguese | 19 | 8.5% |
| Scandinavian | 3 | 1.3% | View All 13 Rows |
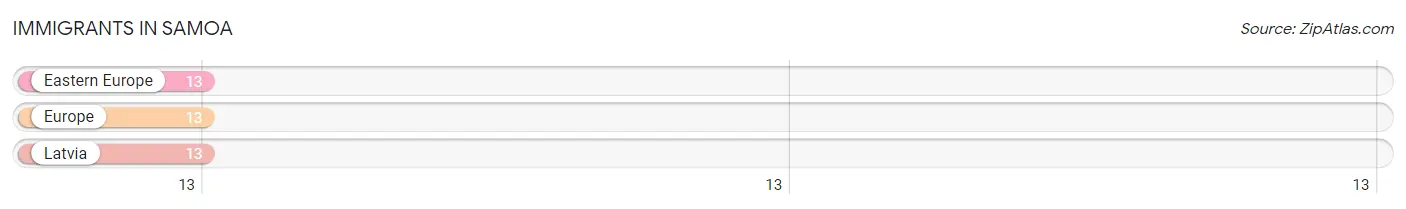
Immigrants in Samoa
The most numerous immigrant groups reported in Samoa came from Eastern Europe (13 | 5.8%), Europe (13 | 5.8%), and Latvia (13 | 5.8%), together accounting for 17.5% of all Samoa residents.
| Immigration Origin | # Population | % Population |
| Eastern Europe | 13 | 5.8% |
| Europe | 13 | 5.8% |
| Latvia | 13 | 5.8% | View All 3 Rows |
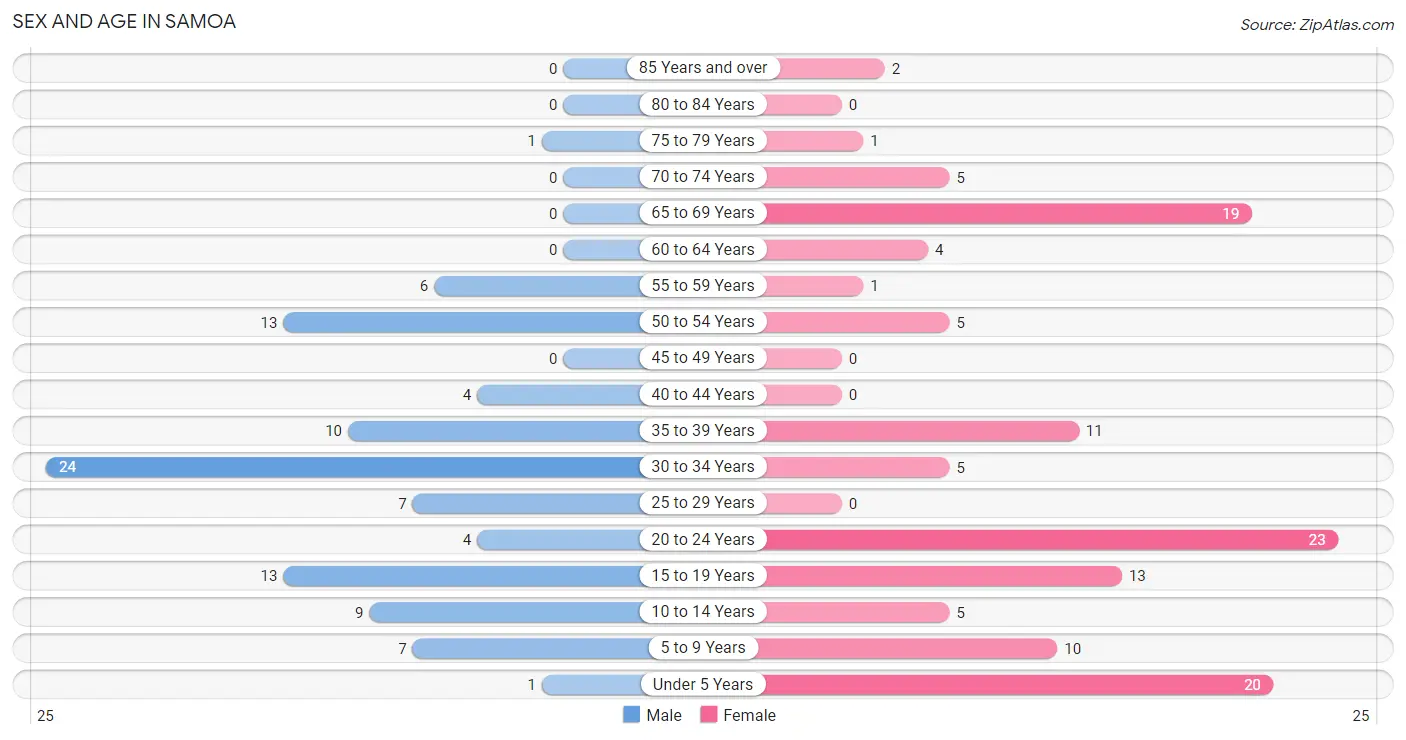
Sex and Age in Samoa
Sex and Age in Samoa
The most populous age groups in Samoa are 30 to 34 Years (24 | 24.2%) for men and 20 to 24 Years (23 | 18.5%) for women.
| Age Bracket | Male | Female |
| Under 5 Years | 1 (1.0%) | 20 (16.1%) |
| 5 to 9 Years | 7 (7.1%) | 10 (8.1%) |
| 10 to 14 Years | 9 (9.1%) | 5 (4.0%) |
| 15 to 19 Years | 13 (13.1%) | 13 (10.5%) |
| 20 to 24 Years | 4 (4.0%) | 23 (18.5%) |
| 25 to 29 Years | 7 (7.1%) | 0 (0.0%) |
| 30 to 34 Years | 24 (24.2%) | 5 (4.0%) |
| 35 to 39 Years | 10 (10.1%) | 11 (8.9%) |
| 40 to 44 Years | 4 (4.0%) | 0 (0.0%) |
| 45 to 49 Years | 0 (0.0%) | 0 (0.0%) |
| 50 to 54 Years | 13 (13.1%) | 5 (4.0%) |
| 55 to 59 Years | 6 (6.1%) | 1 (0.8%) |
| 60 to 64 Years | 0 (0.0%) | 4 (3.2%) |
| 65 to 69 Years | 0 (0.0%) | 19 (15.3%) |
| 70 to 74 Years | 0 (0.0%) | 5 (4.0%) |
| 75 to 79 Years | 1 (1.0%) | 1 (0.8%) |
| 80 to 84 Years | 0 (0.0%) | 0 (0.0%) |
| 85 Years and over | 0 (0.0%) | 2 (1.6%) |
| Total | 99 (100.0%) | 124 (100.0%) |
Families and Households in Samoa
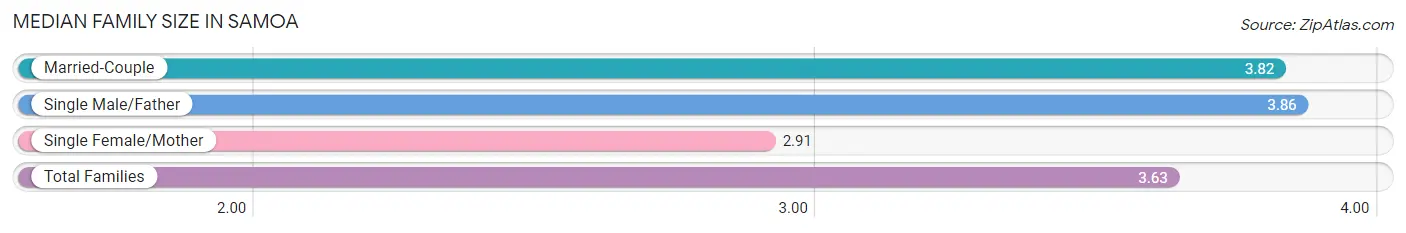
Median Family Size in Samoa
The median family size in Samoa is 3.63 persons per family, with single male/father families (7 | 13.7%) accounting for the largest median family size of 3.86 persons per family. On the other hand, single female/mother families (11 | 21.6%) represent the smallest median family size with 2.91 persons per family.
| Family Type | # Families | Family Size |
| Married-Couple | 33 (64.7%) | 3.82 |
| Single Male/Father | 7 (13.7%) | 3.86 |
| Single Female/Mother | 11 (21.6%) | 2.91 |
| Total Families | 51 (100.0%) | 3.63 |
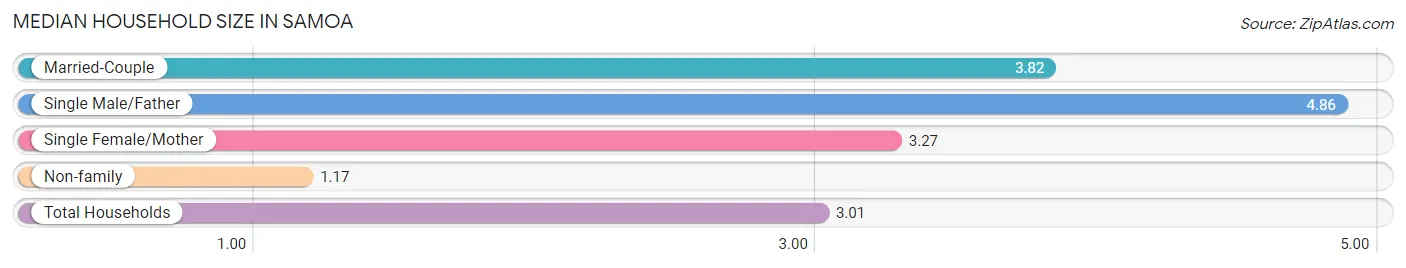
Median Household Size in Samoa
The median household size in Samoa is 3.01 persons per household, with single male/father households (7 | 9.5%) accounting for the largest median household size of 4.86 persons per household. non-family households (23 | 31.1%) represent the smallest median household size with 1.17 persons per household.
| Household Type | # Households | Household Size |
| Married-Couple | 33 (44.6%) | 3.82 |
| Single Male/Father | 7 (9.5%) | 4.86 |
| Single Female/Mother | 11 (14.9%) | 3.27 |
| Non-family | 23 (31.1%) | 1.17 |
| Total Households | 74 (100.0%) | 3.01 |
Household Size by Marriage Status in Samoa
Out of a total of 74 households in Samoa, 51 (68.9%) are family households, while 23 (31.1%) are nonfamily households. The most numerous type of family households are 2-person households, comprising 23, and the most common type of nonfamily households are 1-person households, comprising 19.
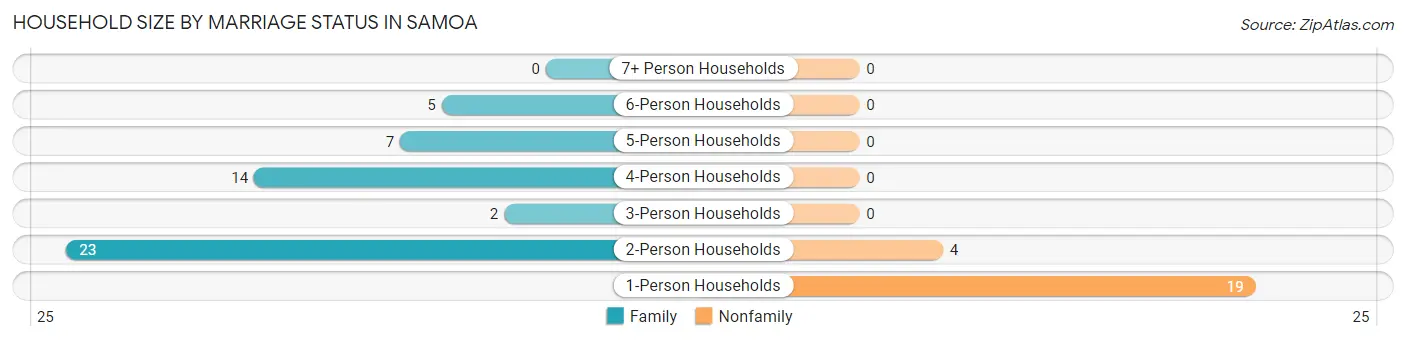
| Household Size | Family Households | Nonfamily Households |
| 1-Person Households | - | 19 (25.7%) |
| 2-Person Households | 23 (31.1%) | 4 (5.4%) |
| 3-Person Households | 2 (2.7%) | 0 (0.0%) |
| 4-Person Households | 14 (18.9%) | 0 (0.0%) |
| 5-Person Households | 7 (9.5%) | 0 (0.0%) |
| 6-Person Households | 5 (6.8%) | 0 (0.0%) |
| 7+ Person Households | 0 (0.0%) | 0 (0.0%) |
| Total | 51 (68.9%) | 23 (31.1%) |
Female Fertility in Samoa
Fertility by Age in Samoa
Average fertility rate in Samoa is 135.0 births per 1,000 women. Women in the age bracket of 20 to 34 years have the highest fertility rate with 250.0 births per 1,000 women. Women in the age bracket of 20 to 34 years acount for 100.0% of all women with births.
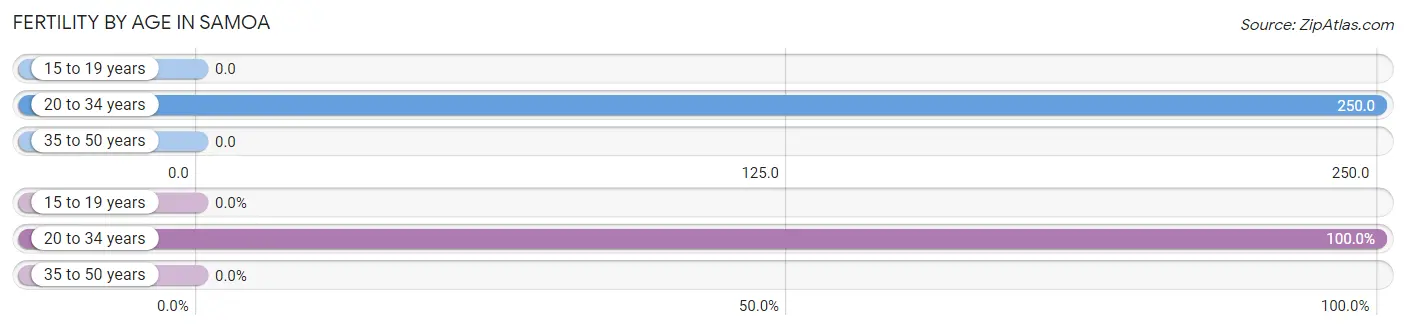
| Age Bracket | Women with Births | Births / 1,000 Women |
| 15 to 19 years | 0 (0.0%) | 0.0 |
| 20 to 34 years | 7 (100.0%) | 250.0 |
| 35 to 50 years | 0 (0.0%) | 0.0 |
| Total | 7 (100.0%) | 135.0 |
Fertility by Age by Marriage Status in Samoa
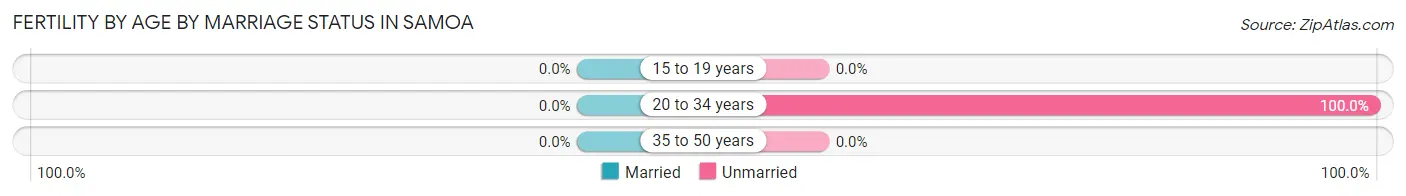
| Age Bracket | Married | Unmarried |
| 15 to 19 years | 0 (0.0%) | 0 (0.0%) |
| 20 to 34 years | 0 (0.0%) | 7 (100.0%) |
| 35 to 50 years | 0 (0.0%) | 0 (0.0%) |
| Total | 0 (0.0%) | 7 (100.0%) |
Fertility by Education in Samoa
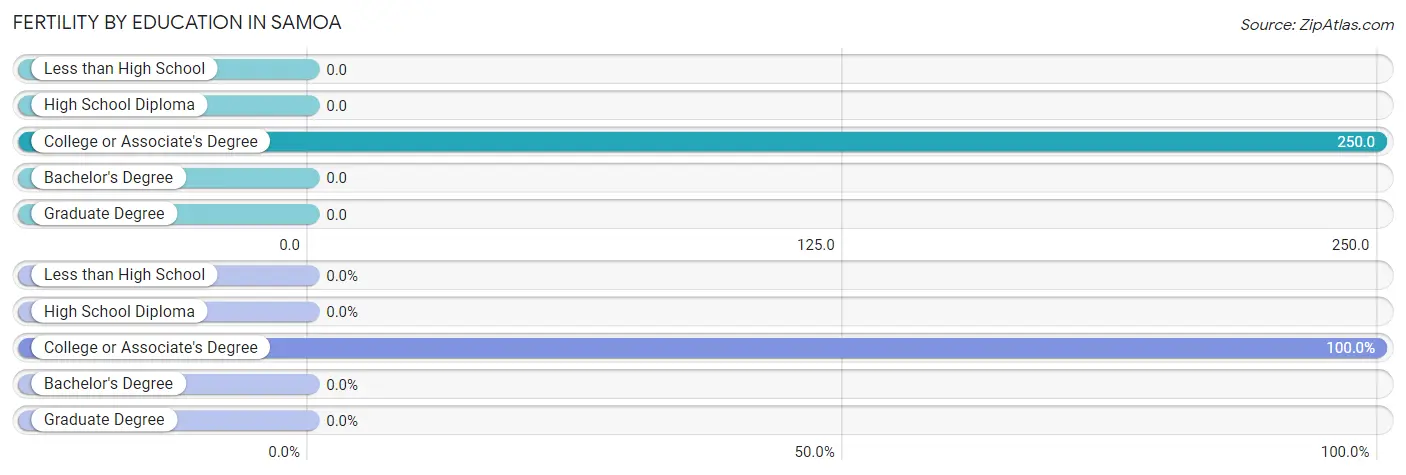
| Educational Attainment | Women with Births | Births / 1,000 Women |
| Less than High School | 0 (0.0%) | 0.0 |
| High School Diploma | 0 (0.0%) | 0.0 |
| College or Associate's Degree | 7 (100.0%) | 250.0 |
| Bachelor's Degree | 0 (0.0%) | 0.0 |
| Graduate Degree | 0 (0.0%) | 0.0 |
| Total | 7 (100.0%) | 135.0 |
Fertility by Education by Marriage Status in Samoa
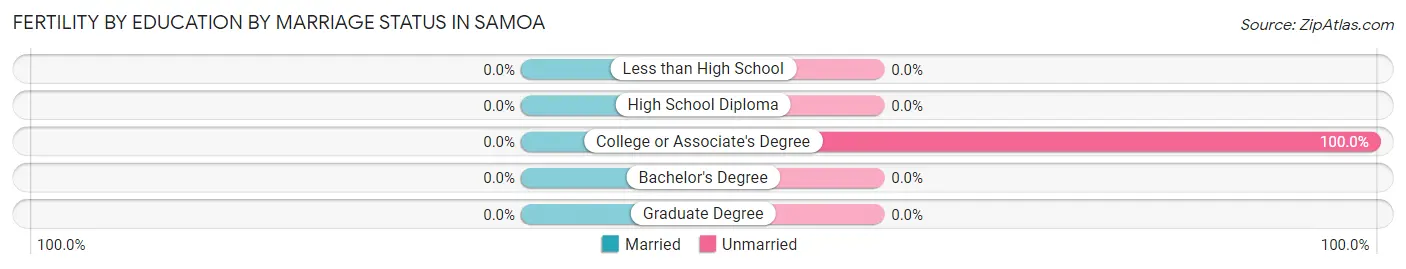
| Educational Attainment | Married | Unmarried |
| Less than High School | 0 (0.0%) | 0 (0.0%) |
| High School Diploma | 0 (0.0%) | 0 (0.0%) |
| College or Associate's Degree | 0 (0.0%) | 7 (100.0%) |
| Bachelor's Degree | 0 (0.0%) | 0 (0.0%) |
| Graduate Degree | 0 (0.0%) | 0 (0.0%) |
| Total | 0 (0.0%) | 7 (100.0%) |
Employment Characteristics in Samoa
Employment by Class of Employer in Samoa
Among the 79 employed individuals in Samoa, not-for-profit organizations (28 | 35.4%), local government employees (18 | 22.8%), and private company employees (16 | 20.3%) make up the most common classes of employment.
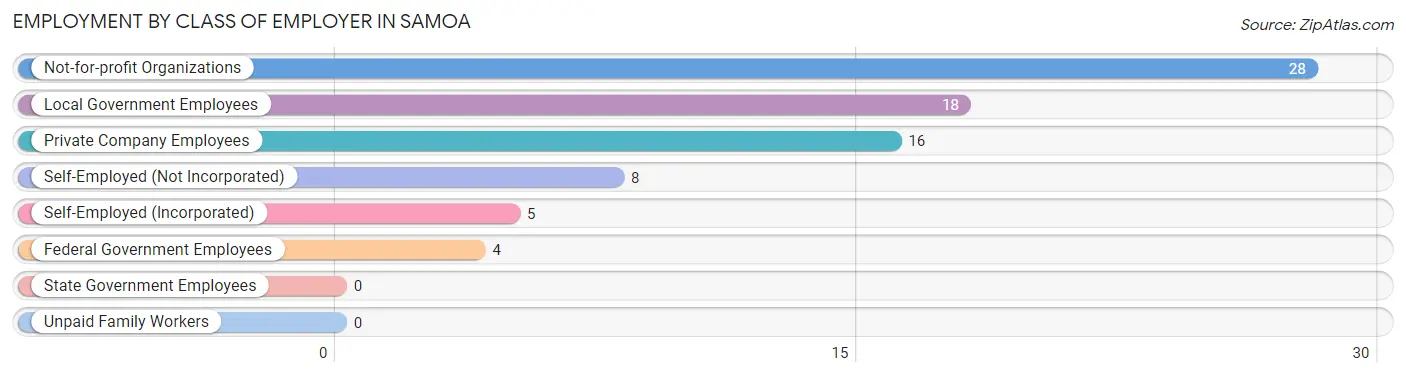
| Employer Class | # Employees | % Employees |
| Private Company Employees | 16 | 20.3% |
| Self-Employed (Incorporated) | 5 | 6.3% |
| Self-Employed (Not Incorporated) | 8 | 10.1% |
| Not-for-profit Organizations | 28 | 35.4% |
| Local Government Employees | 18 | 22.8% |
| State Government Employees | 0 | 0.0% |
| Federal Government Employees | 4 | 5.1% |
| Unpaid Family Workers | 0 | 0.0% |
| Total | 79 | 100.0% |
Employment Status by Age in Samoa
According to the labor force statistics for Samoa, out of the total population over 16 years of age (171), 70.8% or 121 individuals are in the labor force, with 34.7% or 42 of them unemployed. The age group with the highest labor force participation rate is 20 to 24 years, with 100.0% or 27 individuals in the labor force. Within the labor force, the 25 to 29 years age range has the highest percentage of unemployed individuals, with 100.0% or 7 of them being unemployed.
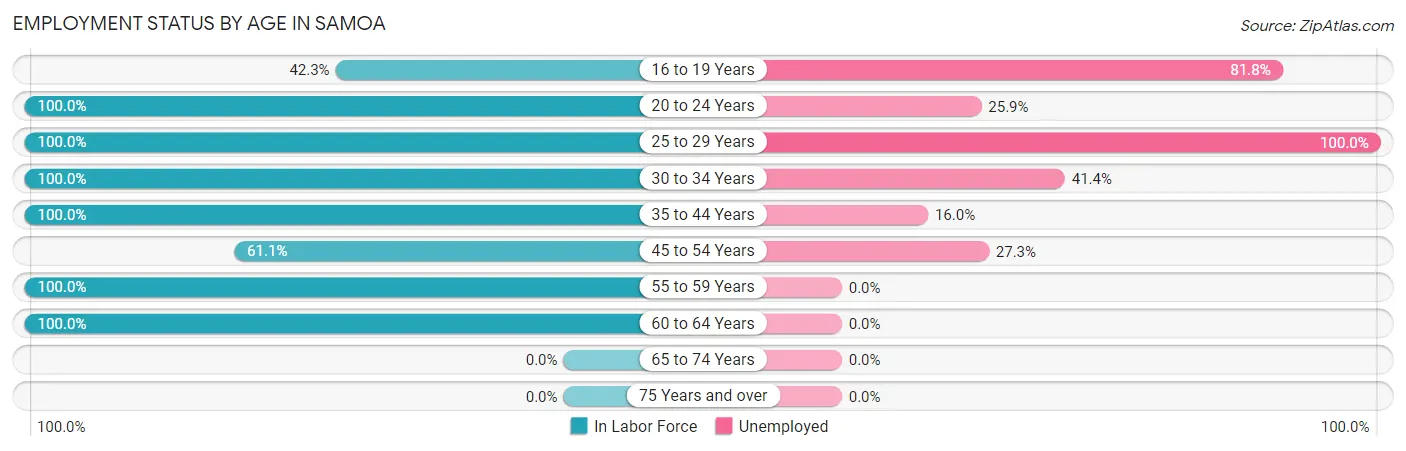
| Age Bracket | In Labor Force | Unemployed |
| 16 to 19 Years | 11 (42.3%) | 9 (81.8%) |
| 20 to 24 Years | 27 (100.0%) | 7 (25.9%) |
| 25 to 29 Years | 7 (100.0%) | 7 (100.0%) |
| 30 to 34 Years | 29 (100.0%) | 12 (41.4%) |
| 35 to 44 Years | 25 (100.0%) | 4 (16.0%) |
| 45 to 54 Years | 11 (61.1%) | 3 (27.3%) |
| 55 to 59 Years | 7 (100.0%) | 0 (0.0%) |
| 60 to 64 Years | 4 (100.0%) | 0 (0.0%) |
| 65 to 74 Years | 0 (0.0%) | 0 (0.0%) |
| 75 Years and over | 0 (0.0%) | 0 (0.0%) |
| Total | 121 (70.8%) | 42 (34.7%) |
Employment Status by Educational Attainment in Samoa
According to labor force statistics for Samoa, 92.2% of individuals (83) out of the total population between 25 and 64 years of age (90) are in the labor force, with 31.3% or 26 of them being unemployed. The group with the highest labor force participation rate are those with the educational attainment of less than high school, with 100.0% or 16 individuals in the labor force. Within the labor force, individuals with high school diploma education have the highest percentage of unemployment, with 58.8% or 10 of them being unemployed.
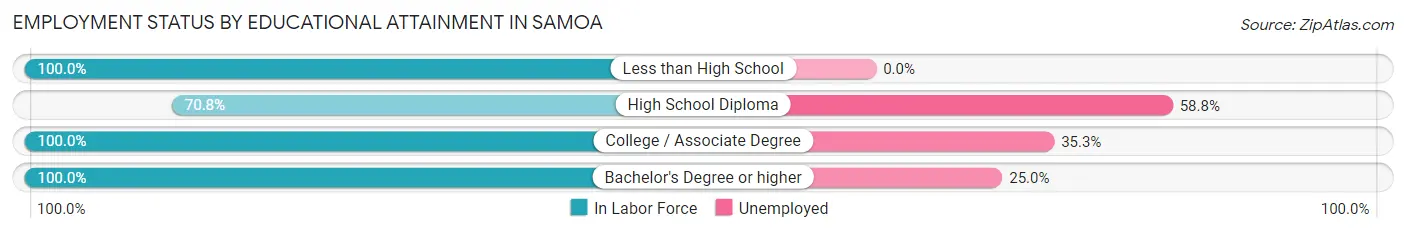
| Educational Attainment | In Labor Force | Unemployed |
| Less than High School | 16 (100.0%) | 0 (0.0%) |
| High School Diploma | 17 (70.8%) | 14 (58.8%) |
| College / Associate Degree | 34 (100.0%) | 12 (35.3%) |
| Bachelor's Degree or higher | 16 (100.0%) | 4 (25.0%) |
| Total | 83 (92.2%) | 28 (31.3%) |
Employment Occupations by Sex in Samoa
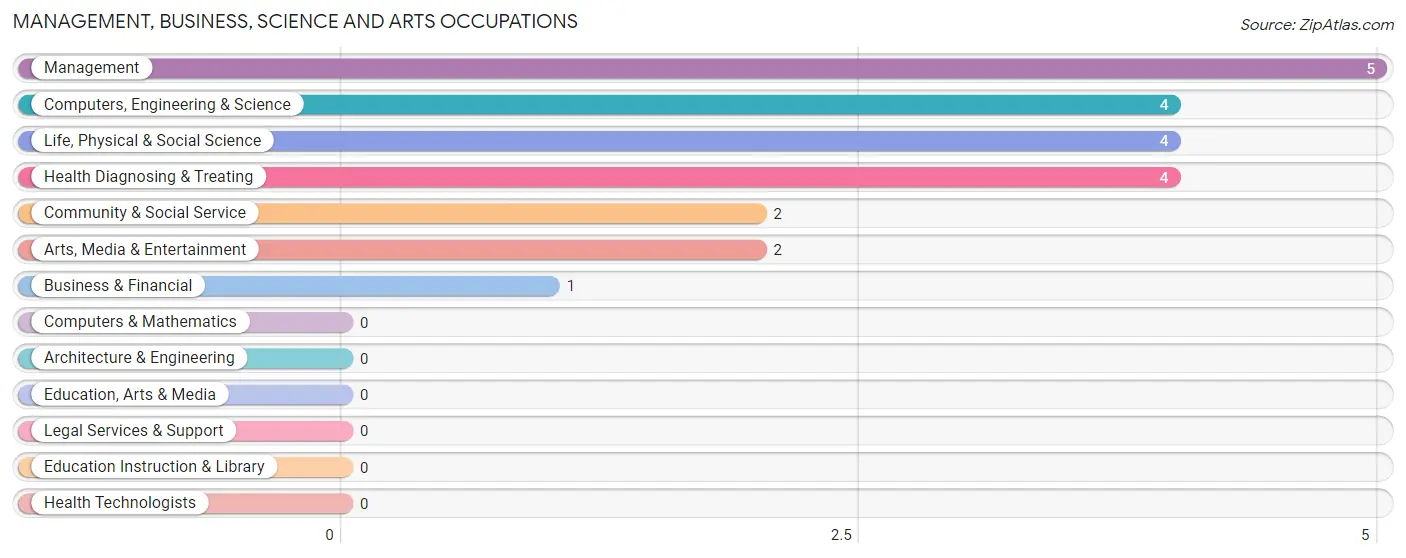
Management, Business, Science and Arts Occupations
The most common Management, Business, Science and Arts occupations in Samoa are Management (5 | 6.3%), Computers, Engineering & Science (4 | 5.1%), Life, Physical & Social Science (4 | 5.1%), Health Diagnosing & Treating (4 | 5.1%), and Community & Social Service (2 | 2.5%).
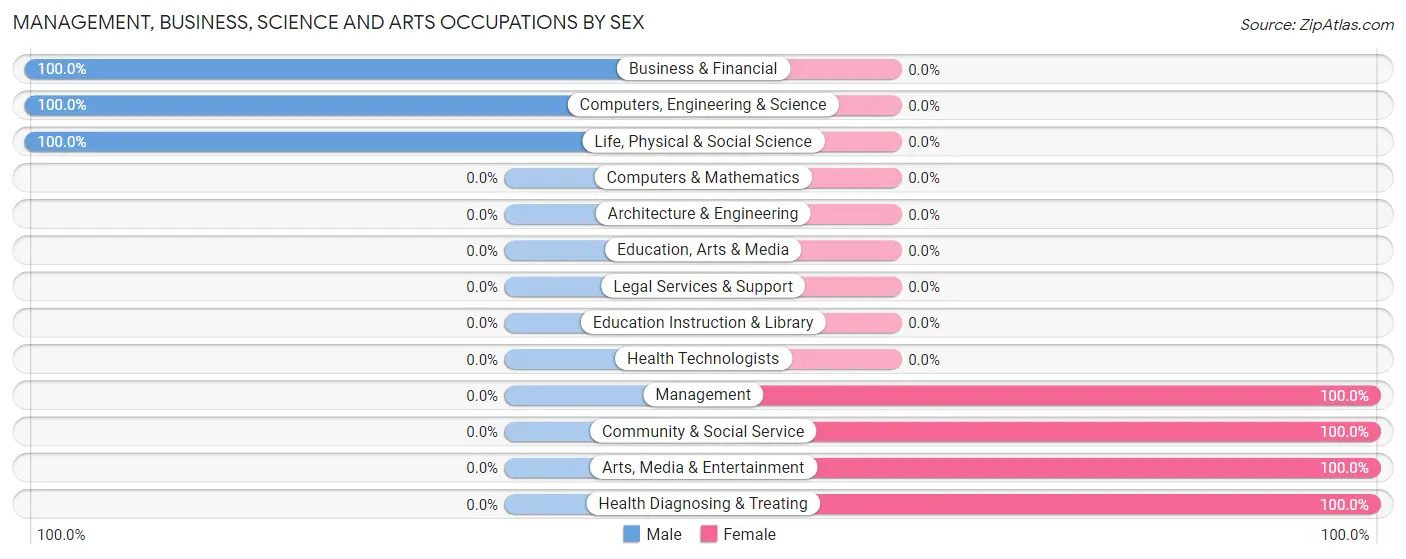
Management, Business, Science and Arts Occupations by Sex
Within the Management, Business, Science and Arts occupations in Samoa, the most male-oriented occupations are Business & Financial (100.0%), Computers, Engineering & Science (100.0%), and Life, Physical & Social Science (100.0%), while the most female-oriented occupations are Management (100.0%), Community & Social Service (100.0%), and Arts, Media & Entertainment (100.0%).
| Occupation | Male | Female |
| Management | 0 (0.0%) | 5 (100.0%) |
| Business & Financial | 1 (100.0%) | 0 (0.0%) |
| Computers, Engineering & Science | 4 (100.0%) | 0 (0.0%) |
| Computers & Mathematics | 0 (0.0%) | 0 (0.0%) |
| Architecture & Engineering | 0 (0.0%) | 0 (0.0%) |
| Life, Physical & Social Science | 4 (100.0%) | 0 (0.0%) |
| Community & Social Service | 0 (0.0%) | 2 (100.0%) |
| Education, Arts & Media | 0 (0.0%) | 0 (0.0%) |
| Legal Services & Support | 0 (0.0%) | 0 (0.0%) |
| Education Instruction & Library | 0 (0.0%) | 0 (0.0%) |
| Arts, Media & Entertainment | 0 (0.0%) | 2 (100.0%) |
| Health Diagnosing & Treating | 0 (0.0%) | 4 (100.0%) |
| Health Technologists | 0 (0.0%) | 0 (0.0%) |
| Total (Category) | 5 (31.2%) | 11 (68.8%) |
| Total (Overall) | 40 (50.6%) | 39 (49.4%) |
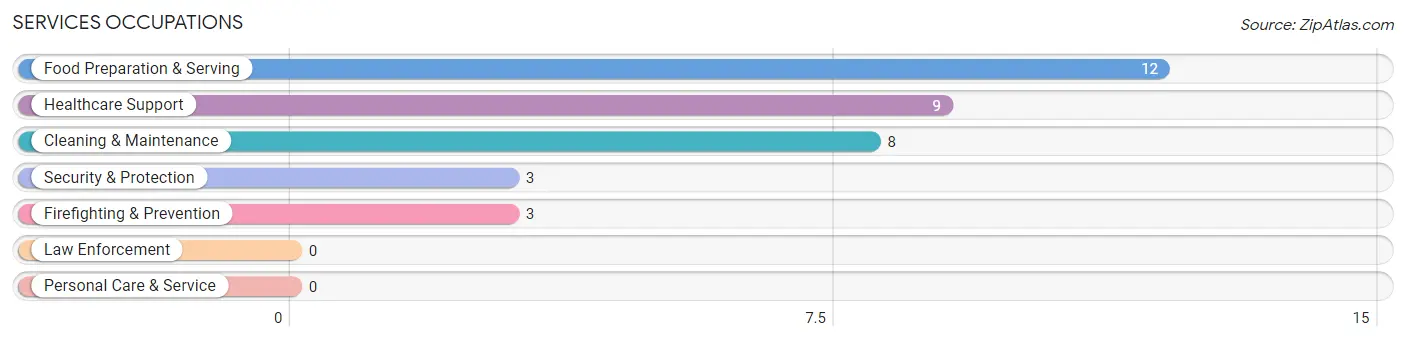
Services Occupations
The most common Services occupations in Samoa are Food Preparation & Serving (12 | 15.2%), Healthcare Support (9 | 11.4%), Cleaning & Maintenance (8 | 10.1%), Security & Protection (3 | 3.8%), and Firefighting & Prevention (3 | 3.8%).
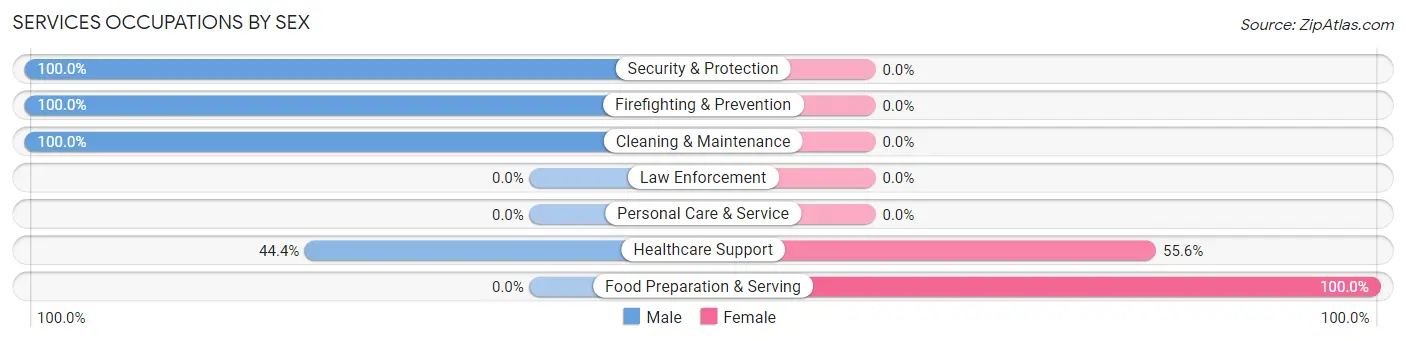
Services Occupations by Sex
Within the Services occupations in Samoa, the most male-oriented occupations are Security & Protection (100.0%), Firefighting & Prevention (100.0%), and Cleaning & Maintenance (100.0%), while the most female-oriented occupations are Food Preparation & Serving (100.0%), and Healthcare Support (55.6%).
| Occupation | Male | Female |
| Healthcare Support | 4 (44.4%) | 5 (55.6%) |
| Security & Protection | 3 (100.0%) | 0 (0.0%) |
| Firefighting & Prevention | 3 (100.0%) | 0 (0.0%) |
| Law Enforcement | 0 (0.0%) | 0 (0.0%) |
| Food Preparation & Serving | 0 (0.0%) | 12 (100.0%) |
| Cleaning & Maintenance | 8 (100.0%) | 0 (0.0%) |
| Personal Care & Service | 0 (0.0%) | 0 (0.0%) |
| Total (Category) | 15 (46.9%) | 17 (53.1%) |
| Total (Overall) | 40 (50.6%) | 39 (49.4%) |
Sales and Office Occupations
The most common Sales and Office occupations in Samoa are Office & Administration (9 | 11.4%), and Sales & Related (2 | 2.5%).
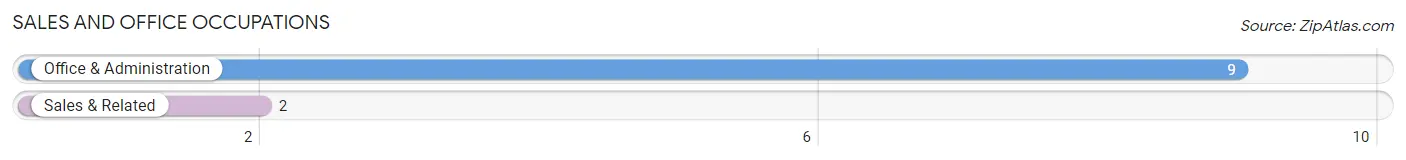
Sales and Office Occupations by Sex
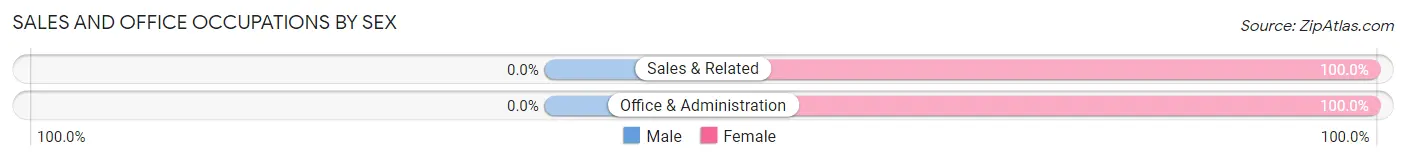
| Occupation | Male | Female |
| Sales & Related | 0 (0.0%) | 2 (100.0%) |
| Office & Administration | 0 (0.0%) | 9 (100.0%) |
| Total (Category) | 0 (0.0%) | 11 (100.0%) |
| Total (Overall) | 40 (50.6%) | 39 (49.4%) |
Natural Resources, Construction and Maintenance Occupations
The most common Natural Resources, Construction and Maintenance occupations in Samoa are Construction & Extraction (5 | 6.3%), and Installation, Maintenance & Repair (2 | 2.5%).
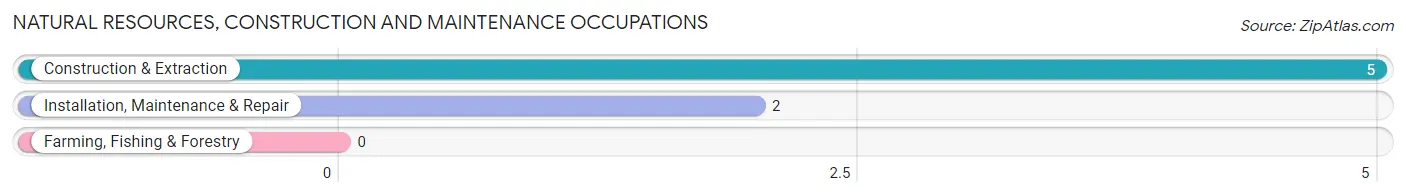
Natural Resources, Construction and Maintenance Occupations by Sex
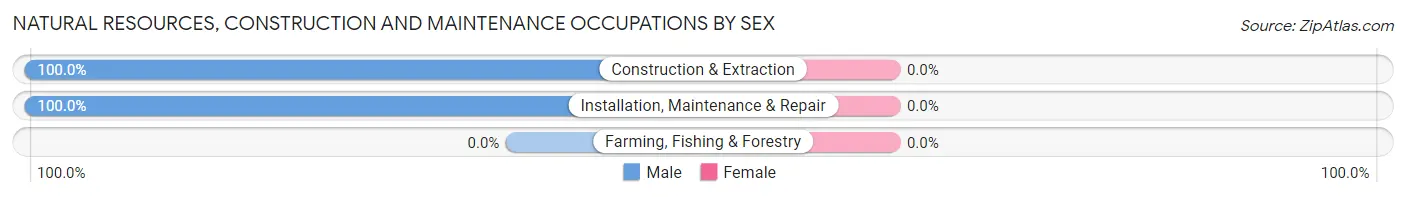
| Occupation | Male | Female |
| Farming, Fishing & Forestry | 0 (0.0%) | 0 (0.0%) |
| Construction & Extraction | 5 (100.0%) | 0 (0.0%) |
| Installation, Maintenance & Repair | 2 (100.0%) | 0 (0.0%) |
| Total (Category) | 7 (100.0%) | 0 (0.0%) |
| Total (Overall) | 40 (50.6%) | 39 (49.4%) |
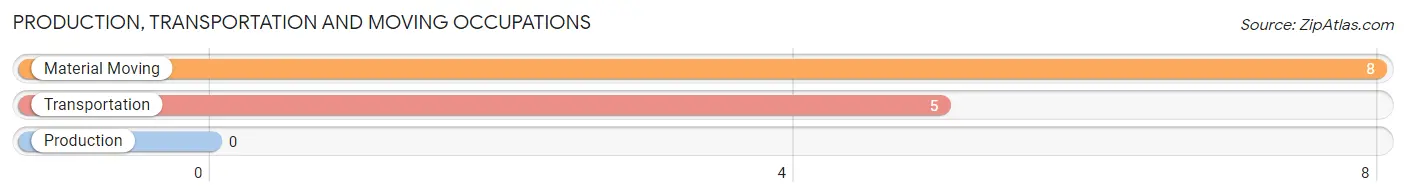
Production, Transportation and Moving Occupations
The most common Production, Transportation and Moving occupations in Samoa are Material Moving (8 | 10.1%), and Transportation (5 | 6.3%).
Production, Transportation and Moving Occupations by Sex
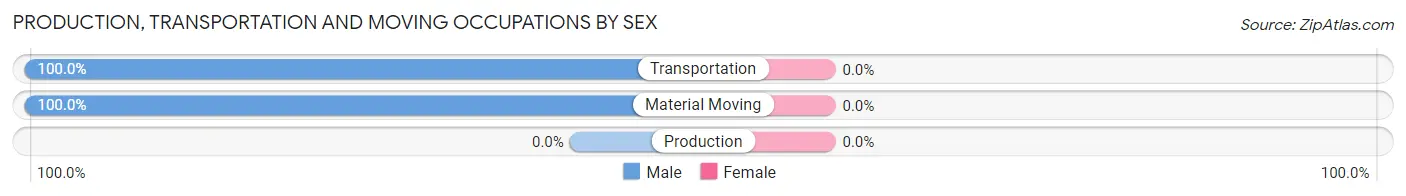
| Occupation | Male | Female |
| Production | 0 (0.0%) | 0 (0.0%) |
| Transportation | 5 (100.0%) | 0 (0.0%) |
| Material Moving | 8 (100.0%) | 0 (0.0%) |
| Total (Category) | 13 (100.0%) | 0 (0.0%) |
| Total (Overall) | 40 (50.6%) | 39 (49.4%) |
Employment Industries by Sex in Samoa
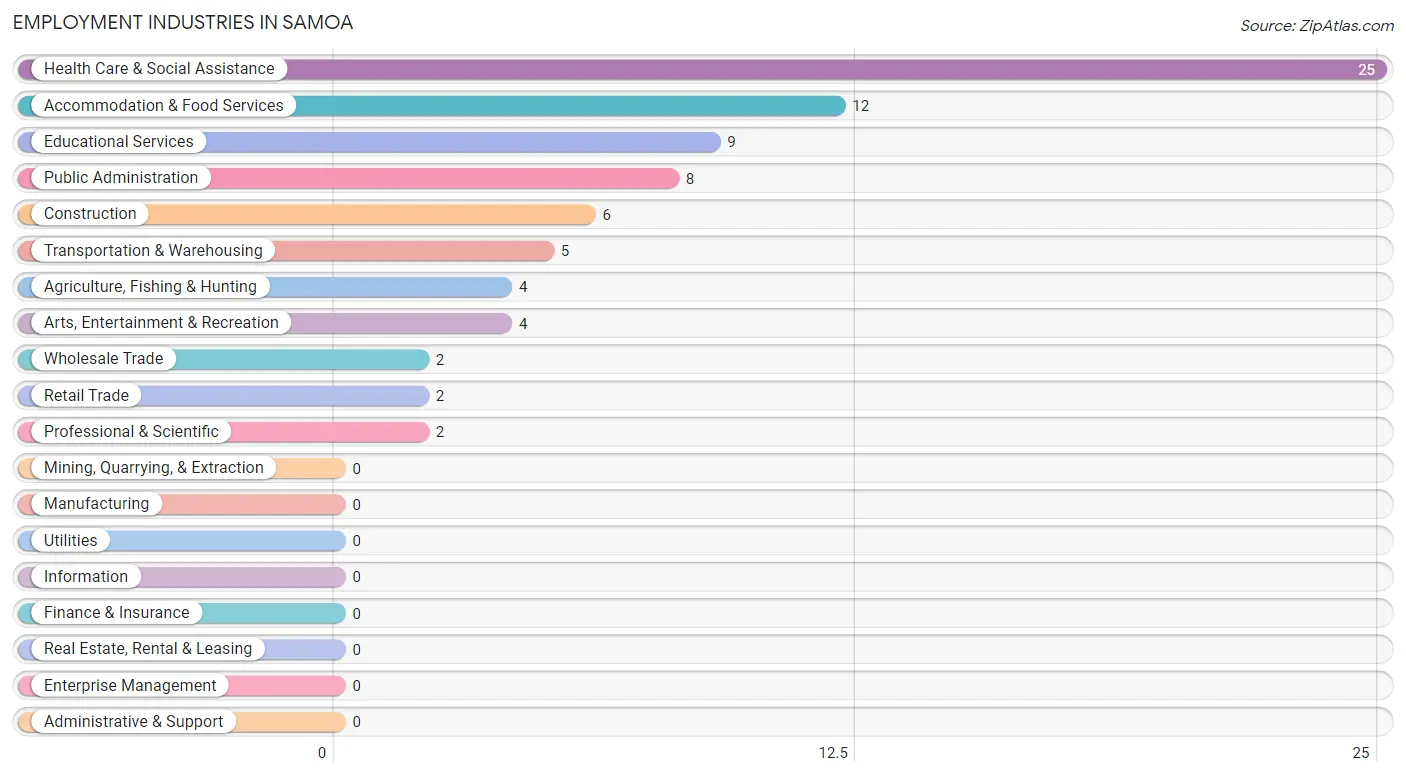
Employment Industries in Samoa
The major employment industries in Samoa include Health Care & Social Assistance (25 | 31.7%), Accommodation & Food Services (12 | 15.2%), Educational Services (9 | 11.4%), Public Administration (8 | 10.1%), and Construction (6 | 7.6%).
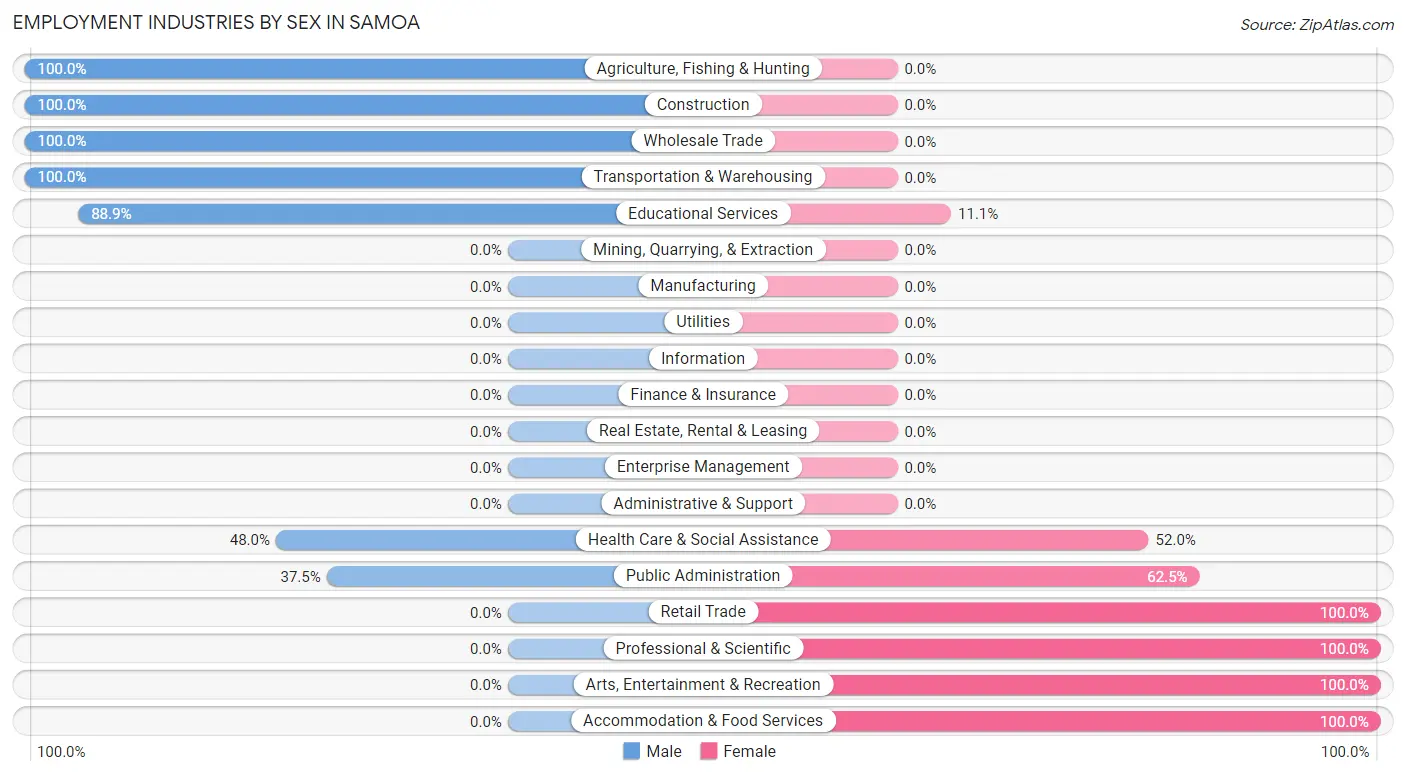
Employment Industries by Sex in Samoa
The Samoa industries that see more men than women are Agriculture, Fishing & Hunting (100.0%), Construction (100.0%), and Wholesale Trade (100.0%), whereas the industries that tend to have a higher number of women are Retail Trade (100.0%), Professional & Scientific (100.0%), and Arts, Entertainment & Recreation (100.0%).
| Industry | Male | Female |
| Agriculture, Fishing & Hunting | 4 (100.0%) | 0 (0.0%) |
| Mining, Quarrying, & Extraction | 0 (0.0%) | 0 (0.0%) |
| Construction | 6 (100.0%) | 0 (0.0%) |
| Manufacturing | 0 (0.0%) | 0 (0.0%) |
| Wholesale Trade | 2 (100.0%) | 0 (0.0%) |
| Retail Trade | 0 (0.0%) | 2 (100.0%) |
| Transportation & Warehousing | 5 (100.0%) | 0 (0.0%) |
| Utilities | 0 (0.0%) | 0 (0.0%) |
| Information | 0 (0.0%) | 0 (0.0%) |
| Finance & Insurance | 0 (0.0%) | 0 (0.0%) |
| Real Estate, Rental & Leasing | 0 (0.0%) | 0 (0.0%) |
| Professional & Scientific | 0 (0.0%) | 2 (100.0%) |
| Enterprise Management | 0 (0.0%) | 0 (0.0%) |
| Administrative & Support | 0 (0.0%) | 0 (0.0%) |
| Educational Services | 8 (88.9%) | 1 (11.1%) |
| Health Care & Social Assistance | 12 (48.0%) | 13 (52.0%) |
| Arts, Entertainment & Recreation | 0 (0.0%) | 4 (100.0%) |
| Accommodation & Food Services | 0 (0.0%) | 12 (100.0%) |
| Public Administration | 3 (37.5%) | 5 (62.5%) |
| Total | 40 (50.6%) | 39 (49.4%) |
Education in Samoa
School Enrollment in Samoa
The most common levels of schooling among the 55 students in Samoa are high school (24 | 43.6%), middle school (14 | 25.5%), and elementary school (11 | 20.0%).
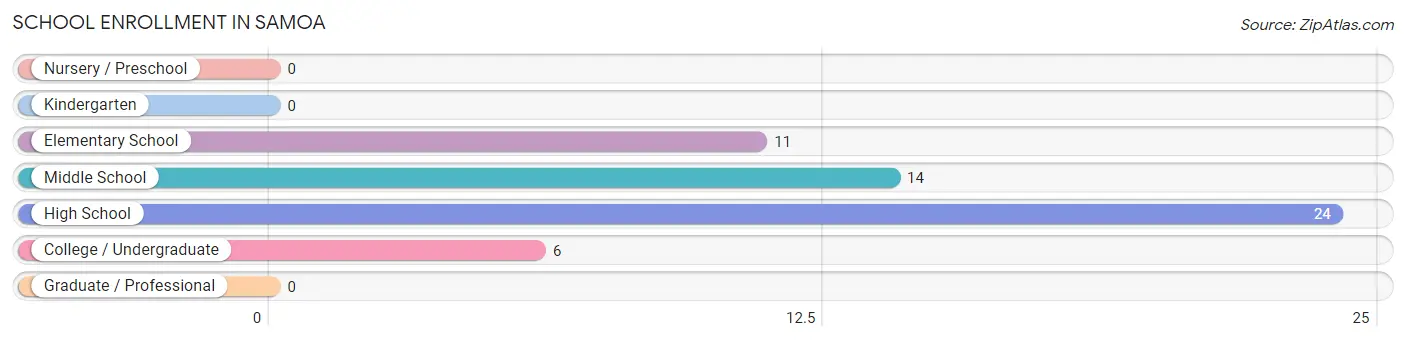
| School Level | # Students | % Students |
| Nursery / Preschool | 0 | 0.0% |
| Kindergarten | 0 | 0.0% |
| Elementary School | 11 | 20.0% |
| Middle School | 14 | 25.5% |
| High School | 24 | 43.6% |
| College / Undergraduate | 6 | 10.9% |
| Graduate / Professional | 0 | 0.0% |
| Total | 55 | 100.0% |
School Enrollment by Age by Funding Source in Samoa
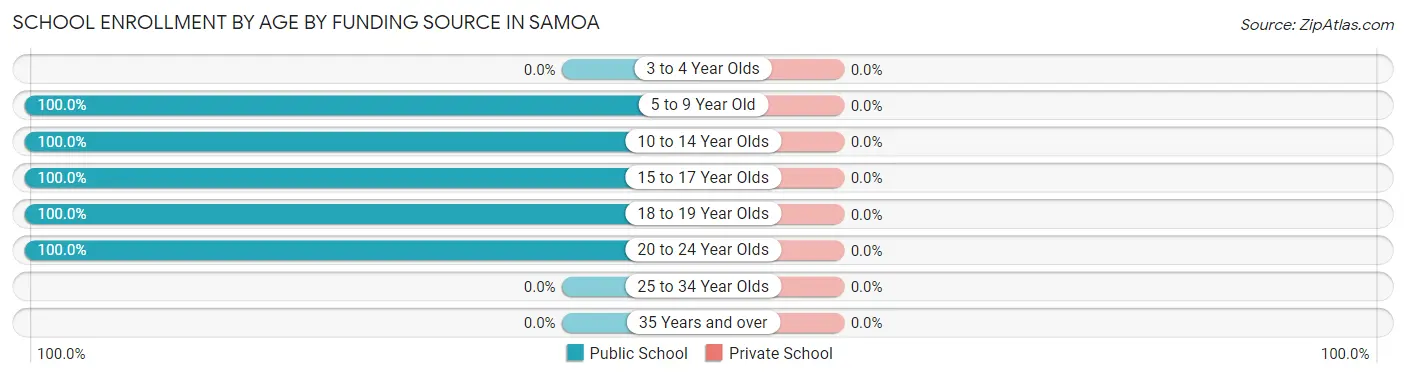
| Age Bracket | Public School | Private School |
| 3 to 4 Year Olds | 0 (0.0%) | 0 (0.0%) |
| 5 to 9 Year Old | 11 (100.0%) | 0 (0.0%) |
| 10 to 14 Year Olds | 14 (100.0%) | 0 (0.0%) |
| 15 to 17 Year Olds | 24 (100.0%) | 0 (0.0%) |
| 18 to 19 Year Olds | 2 (100.0%) | 0 (0.0%) |
| 20 to 24 Year Olds | 4 (100.0%) | 0 (0.0%) |
| 25 to 34 Year Olds | 0 (0.0%) | 0 (0.0%) |
| 35 Years and over | 0 (0.0%) | 0 (0.0%) |
| Total | 55 (100.0%) | 0 (0.0%) |
Educational Attainment by Field of Study in Samoa
Arts & humanities (8 | 44.4%), science & technology (4 | 22.2%), visual & performing arts (4 | 22.2%), and bio, nature & agricultural (2 | 11.1%) are the most common fields of study among 18 individuals in Samoa who have obtained a bachelor's degree or higher.
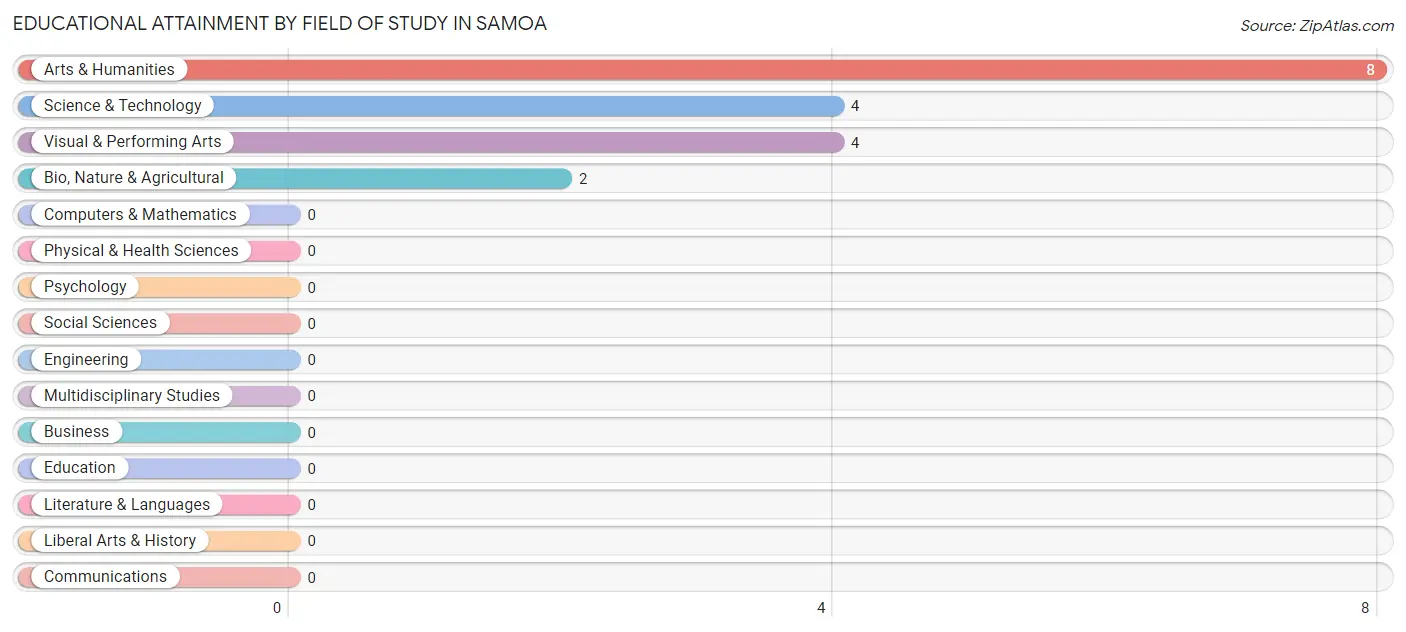
| Field of Study | # Graduates | % Graduates |
| Computers & Mathematics | 0 | 0.0% |
| Bio, Nature & Agricultural | 2 | 11.1% |
| Physical & Health Sciences | 0 | 0.0% |
| Psychology | 0 | 0.0% |
| Social Sciences | 0 | 0.0% |
| Engineering | 0 | 0.0% |
| Multidisciplinary Studies | 0 | 0.0% |
| Science & Technology | 4 | 22.2% |
| Business | 0 | 0.0% |
| Education | 0 | 0.0% |
| Literature & Languages | 0 | 0.0% |
| Liberal Arts & History | 0 | 0.0% |
| Visual & Performing Arts | 4 | 22.2% |
| Communications | 0 | 0.0% |
| Arts & Humanities | 8 | 44.4% |
| Total | 18 | 100.0% |
Transportation & Commute in Samoa
Vehicle Availability by Sex in Samoa
The most prevalent vehicle ownership categories in Samoa are males with 2 vehicles (35, accounting for 87.5%) and females with 2 vehicles (19, making up 89.7%).
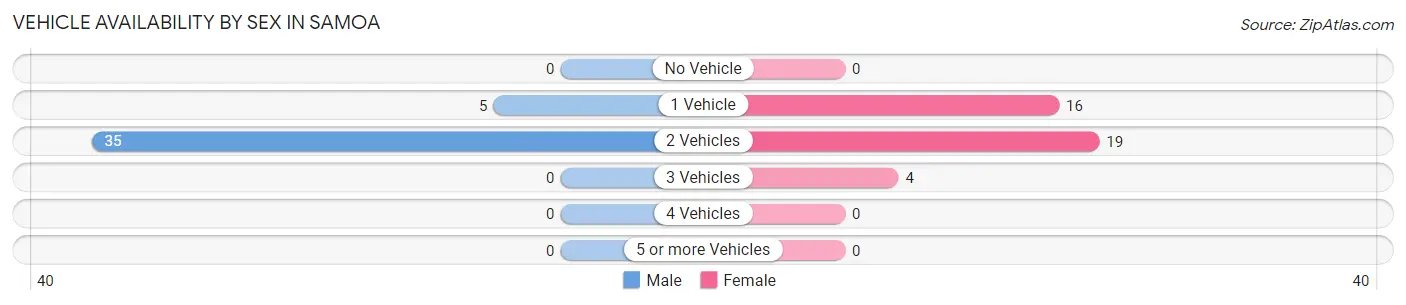
| Vehicles Available | Male | Female |
| No Vehicle | 0 (0.0%) | 0 (0.0%) |
| 1 Vehicle | 5 (12.5%) | 16 (41.0%) |
| 2 Vehicles | 35 (87.5%) | 19 (48.7%) |
| 3 Vehicles | 0 (0.0%) | 4 (10.3%) |
| 4 Vehicles | 0 (0.0%) | 0 (0.0%) |
| 5 or more Vehicles | 0 (0.0%) | 0 (0.0%) |
| Total | 40 (100.0%) | 39 (100.0%) |
Commute Time in Samoa
The most frequently occuring commute durations in Samoa are 5 to 9 minutes (18 commuters, 24.7%), 15 to 19 minutes (16 commuters, 21.9%), and 60 to 89 minutes (16 commuters, 21.9%).
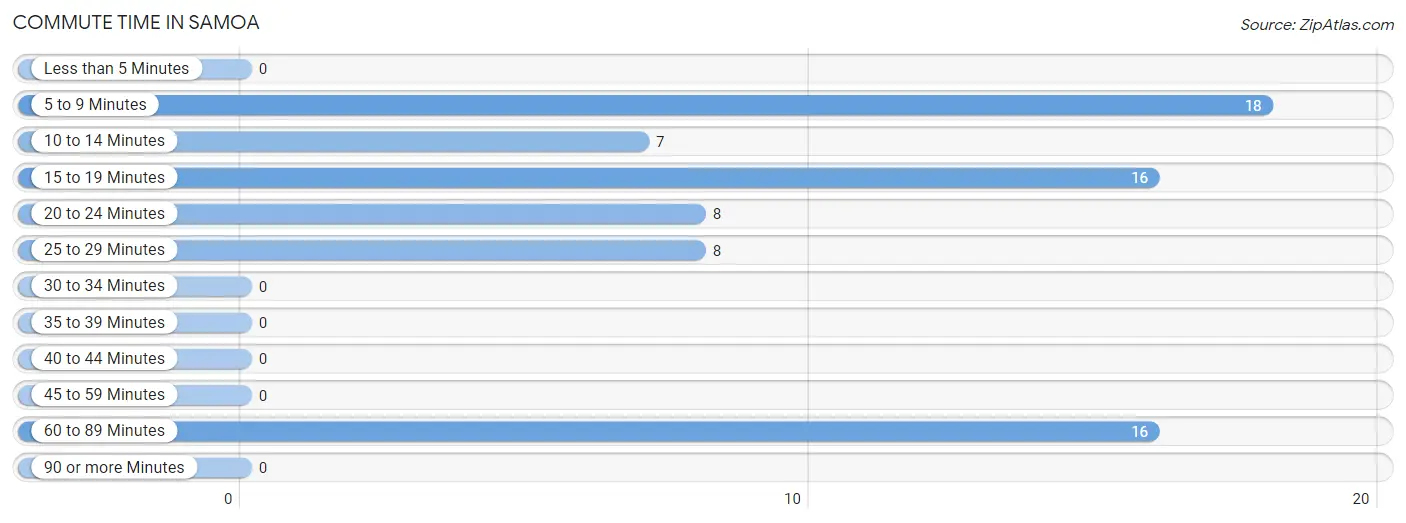
| Commute Time | # Commuters | % Commuters |
| Less than 5 Minutes | 0 | 0.0% |
| 5 to 9 Minutes | 18 | 24.7% |
| 10 to 14 Minutes | 7 | 9.6% |
| 15 to 19 Minutes | 16 | 21.9% |
| 20 to 24 Minutes | 8 | 11.0% |
| 25 to 29 Minutes | 8 | 11.0% |
| 30 to 34 Minutes | 0 | 0.0% |
| 35 to 39 Minutes | 0 | 0.0% |
| 40 to 44 Minutes | 0 | 0.0% |
| 45 to 59 Minutes | 0 | 0.0% |
| 60 to 89 Minutes | 16 | 21.9% |
| 90 or more Minutes | 0 | 0.0% |
Commute Time by Sex in Samoa
The most common commute times in Samoa are 60 to 89 minutes (16 commuters, 43.2%) for males and 5 to 9 minutes (13 commuters, 36.1%) for females.
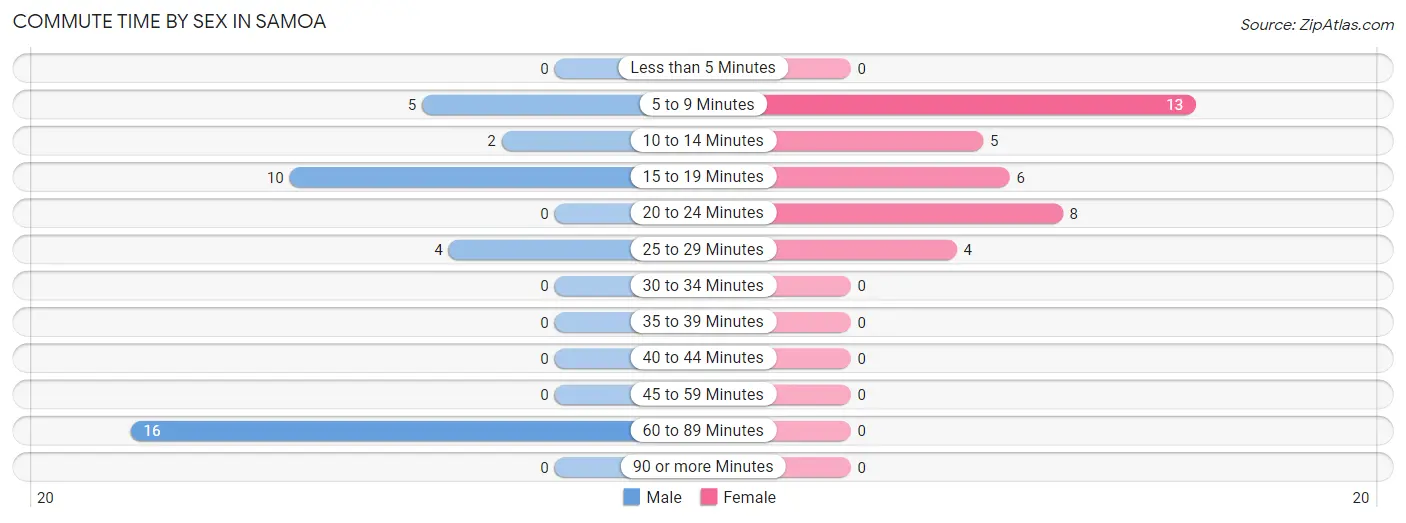
| Commute Time | Male | Female |
| Less than 5 Minutes | 0 (0.0%) | 0 (0.0%) |
| 5 to 9 Minutes | 5 (13.5%) | 13 (36.1%) |
| 10 to 14 Minutes | 2 (5.4%) | 5 (13.9%) |
| 15 to 19 Minutes | 10 (27.0%) | 6 (16.7%) |
| 20 to 24 Minutes | 0 (0.0%) | 8 (22.2%) |
| 25 to 29 Minutes | 4 (10.8%) | 4 (11.1%) |
| 30 to 34 Minutes | 0 (0.0%) | 0 (0.0%) |
| 35 to 39 Minutes | 0 (0.0%) | 0 (0.0%) |
| 40 to 44 Minutes | 0 (0.0%) | 0 (0.0%) |
| 45 to 59 Minutes | 0 (0.0%) | 0 (0.0%) |
| 60 to 89 Minutes | 16 (43.2%) | 0 (0.0%) |
| 90 or more Minutes | 0 (0.0%) | 0 (0.0%) |
Time of Departure to Work by Sex in Samoa
The most frequent times of departure to work in Samoa are 7:00 AM to 7:29 AM (18, 48.6%) for males and 12:00 PM to 3:59 PM (12, 33.3%) for females.
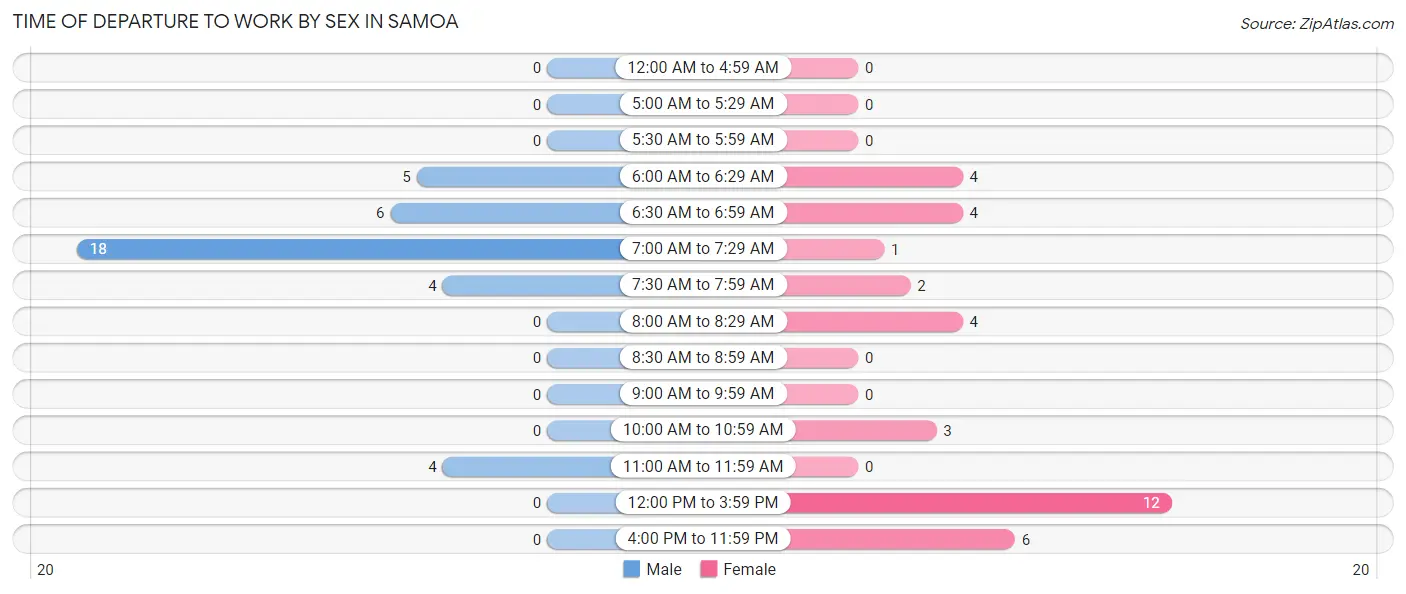
| Time of Departure | Male | Female |
| 12:00 AM to 4:59 AM | 0 (0.0%) | 0 (0.0%) |
| 5:00 AM to 5:29 AM | 0 (0.0%) | 0 (0.0%) |
| 5:30 AM to 5:59 AM | 0 (0.0%) | 0 (0.0%) |
| 6:00 AM to 6:29 AM | 5 (13.5%) | 4 (11.1%) |
| 6:30 AM to 6:59 AM | 6 (16.2%) | 4 (11.1%) |
| 7:00 AM to 7:29 AM | 18 (48.6%) | 1 (2.8%) |
| 7:30 AM to 7:59 AM | 4 (10.8%) | 2 (5.6%) |
| 8:00 AM to 8:29 AM | 0 (0.0%) | 4 (11.1%) |
| 8:30 AM to 8:59 AM | 0 (0.0%) | 0 (0.0%) |
| 9:00 AM to 9:59 AM | 0 (0.0%) | 0 (0.0%) |
| 10:00 AM to 10:59 AM | 0 (0.0%) | 3 (8.3%) |
| 11:00 AM to 11:59 AM | 4 (10.8%) | 0 (0.0%) |
| 12:00 PM to 3:59 PM | 0 (0.0%) | 12 (33.3%) |
| 4:00 PM to 11:59 PM | 0 (0.0%) | 6 (16.7%) |
| Total | 37 (100.0%) | 36 (100.0%) |
Housing Occupancy in Samoa
Occupancy by Ownership in Samoa
Of the total 74 dwellings in Samoa, owner-occupied units account for 0 (0.0%), while renter-occupied units make up 74 (100.0%).
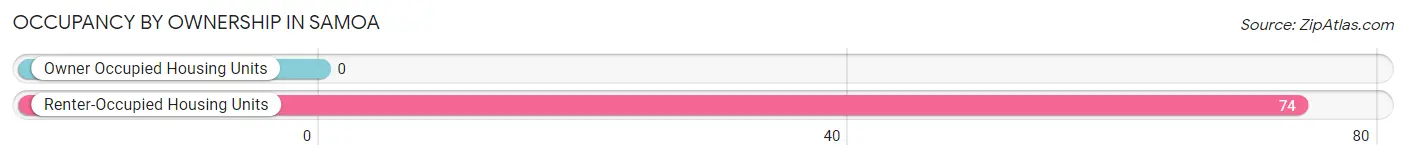
| Occupancy | # Housing Units | % Housing Units |
| Owner Occupied Housing Units | 0 | 0.0% |
| Renter-Occupied Housing Units | 74 | 100.0% |
| Total Occupied Housing Units | 74 | 100.0% |
Occupancy by Household Size in Samoa
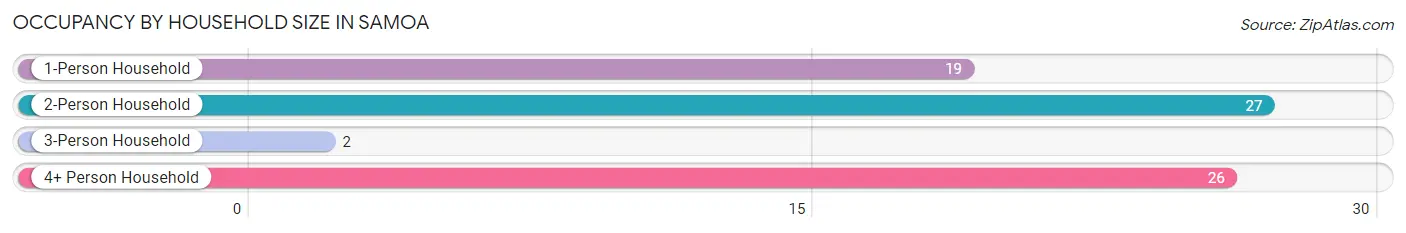
| Household Size | # Housing Units | % Housing Units |
| 1-Person Household | 19 | 25.7% |
| 2-Person Household | 27 | 36.5% |
| 3-Person Household | 2 | 2.7% |
| 4+ Person Household | 26 | 35.1% |
| Total Housing Units | 74 | 100.0% |
Occupancy by Ownership by Household Size in Samoa
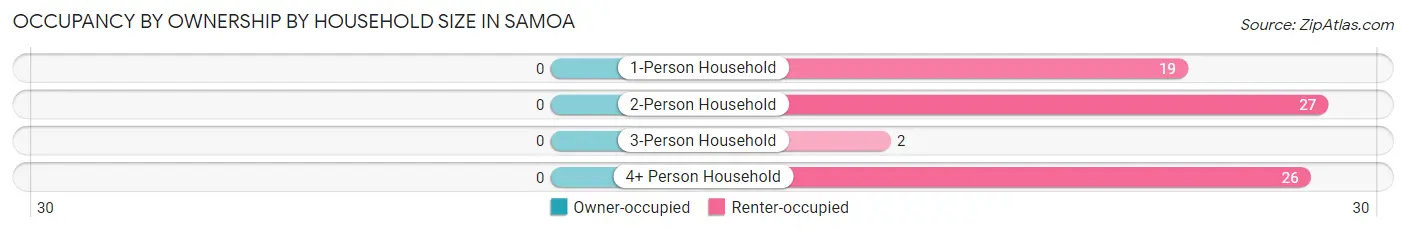
| Household Size | Owner-occupied | Renter-occupied |
| 1-Person Household | 0 (0.0%) | 19 (100.0%) |
| 2-Person Household | 0 (0.0%) | 27 (100.0%) |
| 3-Person Household | 0 (0.0%) | 2 (100.0%) |
| 4+ Person Household | 0 (0.0%) | 26 (100.0%) |
| Total Housing Units | 0 (0.0%) | 74 (100.0%) |
Occupancy by Educational Attainment in Samoa
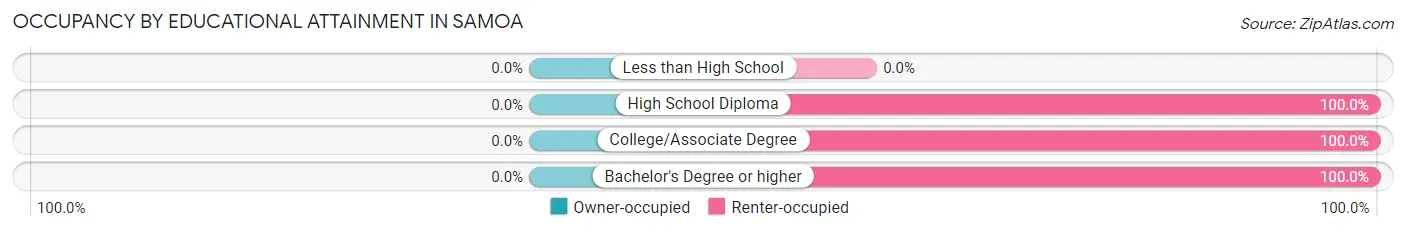
| Household Size | Owner-occupied | Renter-occupied |
| Less than High School | 0 (0.0%) | 0 (0.0%) |
| High School Diploma | 0 (0.0%) | 13 (100.0%) |
| College/Associate Degree | 0 (0.0%) | 49 (100.0%) |
| Bachelor's Degree or higher | 0 (0.0%) | 12 (100.0%) |
Occupancy by Age of Householder in Samoa
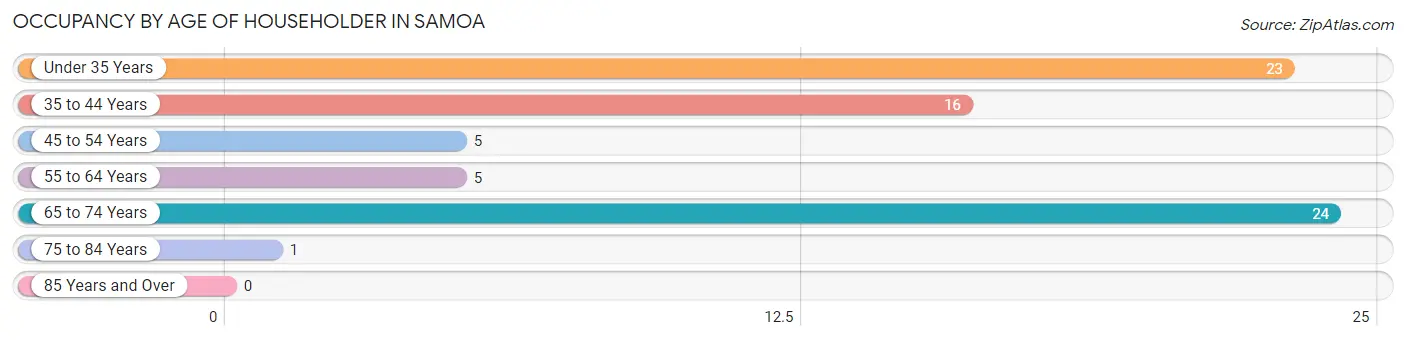
| Age Bracket | # Households | % Households |
| Under 35 Years | 23 | 31.1% |
| 35 to 44 Years | 16 | 21.6% |
| 45 to 54 Years | 5 | 6.8% |
| 55 to 64 Years | 5 | 6.8% |
| 65 to 74 Years | 24 | 32.4% |
| 75 to 84 Years | 1 | 1.3% |
| 85 Years and Over | 0 | 0.0% |
| Total | 74 | 100.0% |
Housing Finances in Samoa
Median Income by Occupancy in Samoa
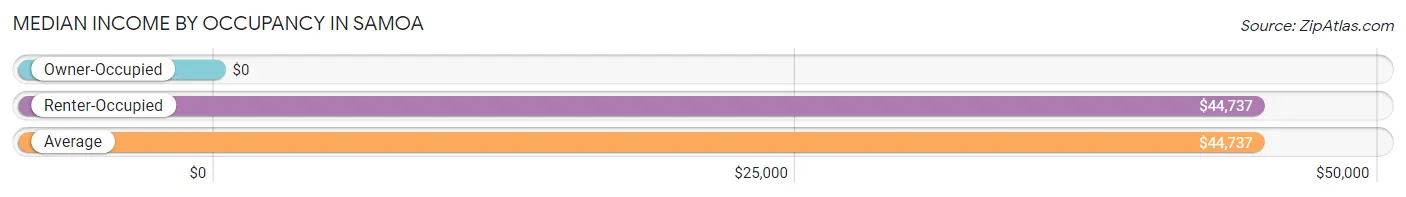
| Occupancy Type | # Households | Median Income |
| Owner-Occupied | 0 (0.0%) | $0 |
| Renter-Occupied | 74 (100.0%) | $44,737 |
| Average | 74 (100.0%) | $44,737 |
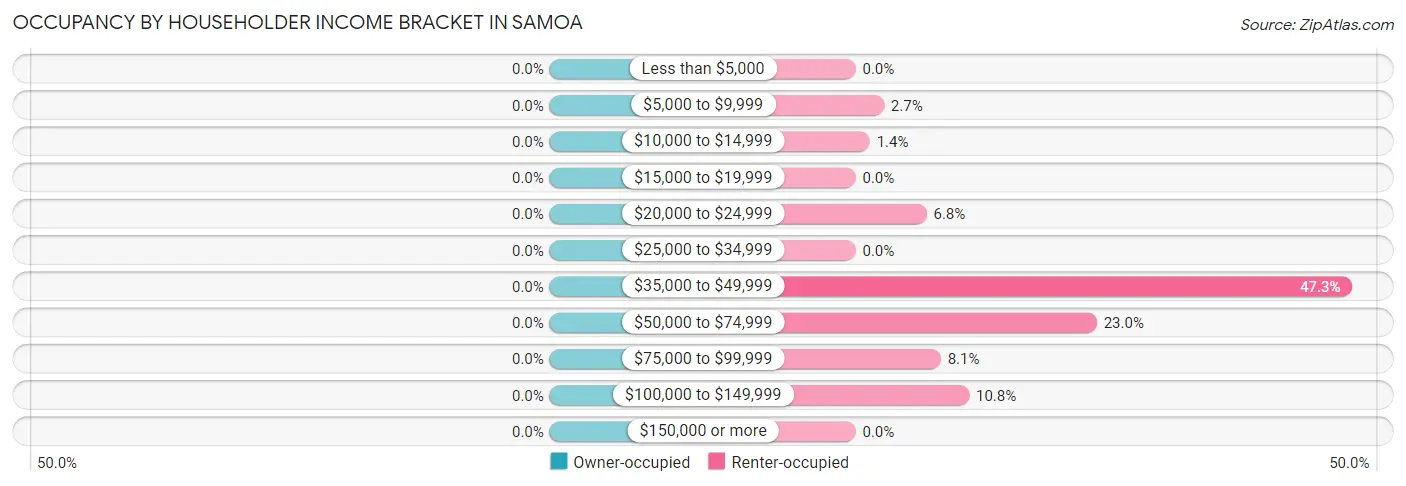
Occupancy by Householder Income Bracket in Samoa
| Income Bracket | Owner-occupied | Renter-occupied |
| Less than $5,000 | 0 (0.0%) | 0 (0.0%) |
| $5,000 to $9,999 | 0 (0.0%) | 2 (2.7%) |
| $10,000 to $14,999 | 0 (0.0%) | 1 (1.3%) |
| $15,000 to $19,999 | 0 (0.0%) | 0 (0.0%) |
| $20,000 to $24,999 | 0 (0.0%) | 5 (6.8%) |
| $25,000 to $34,999 | 0 (0.0%) | 0 (0.0%) |
| $35,000 to $49,999 | 0 (0.0%) | 35 (47.3%) |
| $50,000 to $74,999 | 0 (0.0%) | 17 (23.0%) |
| $75,000 to $99,999 | 0 (0.0%) | 6 (8.1%) |
| $100,000 to $149,999 | 0 (0.0%) | 8 (10.8%) |
| $150,000 or more | 0 (0.0%) | 0 (0.0%) |
| Total | 0 (0.0%) | 74 (100.0%) |
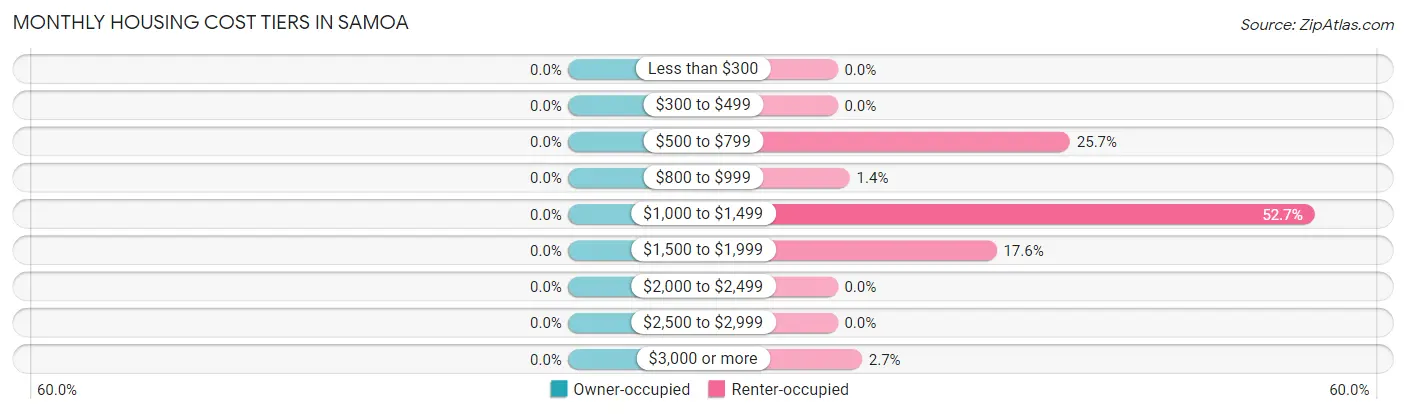
Monthly Housing Cost Tiers in Samoa
| Monthly Cost | Owner-occupied | Renter-occupied |
| Less than $300 | 0 (0.0%) | 0 (0.0%) |
| $300 to $499 | 0 (0.0%) | 0 (0.0%) |
| $500 to $799 | 0 (0.0%) | 19 (25.7%) |
| $800 to $999 | 0 (0.0%) | 1 (1.3%) |
| $1,000 to $1,499 | 0 (0.0%) | 39 (52.7%) |
| $1,500 to $1,999 | 0 (0.0%) | 13 (17.6%) |
| $2,000 to $2,499 | 0 (0.0%) | 0 (0.0%) |
| $2,500 to $2,999 | 0 (0.0%) | 0 (0.0%) |
| $3,000 or more | 0 (0.0%) | 2 (2.7%) |
| Total | 0 (0.0%) | 74 (100.0%) |
Physical Housing Characteristics in Samoa
Housing Structures in Samoa
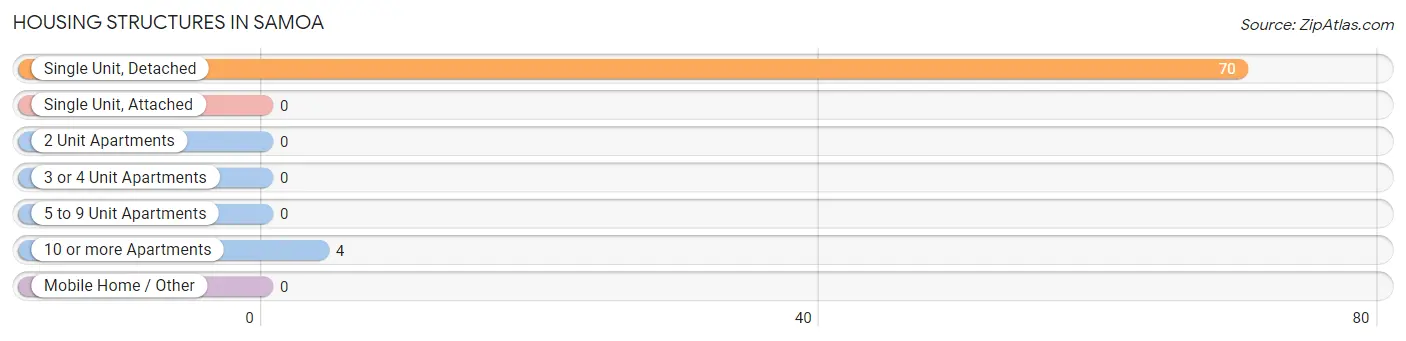
| Structure Type | # Housing Units | % Housing Units |
| Single Unit, Detached | 70 | 94.6% |
| Single Unit, Attached | 0 | 0.0% |
| 2 Unit Apartments | 0 | 0.0% |
| 3 or 4 Unit Apartments | 0 | 0.0% |
| 5 to 9 Unit Apartments | 0 | 0.0% |
| 10 or more Apartments | 4 | 5.4% |
| Mobile Home / Other | 0 | 0.0% |
| Total | 74 | 100.0% |
Housing Structures by Occupancy in Samoa
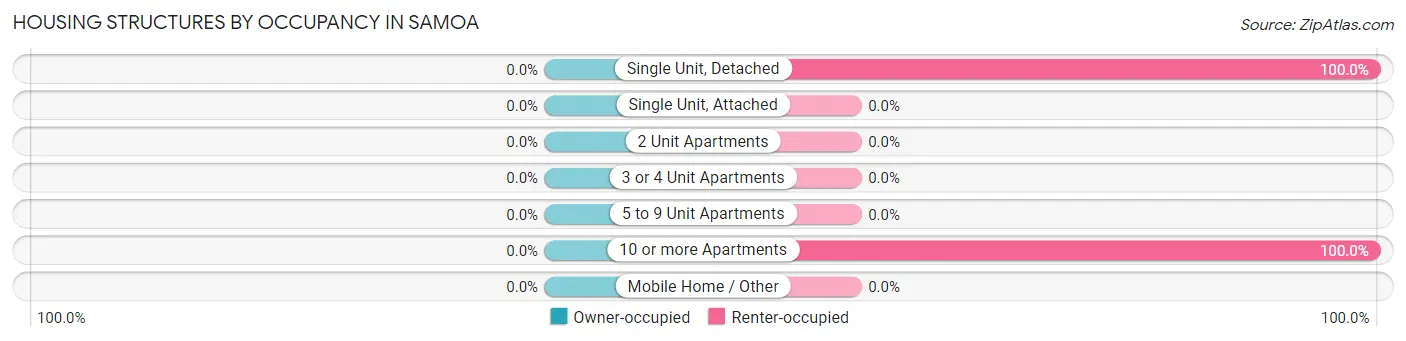
| Structure Type | Owner-occupied | Renter-occupied |
| Single Unit, Detached | 0 (0.0%) | 70 (100.0%) |
| Single Unit, Attached | 0 (0.0%) | 0 (0.0%) |
| 2 Unit Apartments | 0 (0.0%) | 0 (0.0%) |
| 3 or 4 Unit Apartments | 0 (0.0%) | 0 (0.0%) |
| 5 to 9 Unit Apartments | 0 (0.0%) | 0 (0.0%) |
| 10 or more Apartments | 0 (0.0%) | 4 (100.0%) |
| Mobile Home / Other | 0 (0.0%) | 0 (0.0%) |
| Total | 0 (0.0%) | 74 (100.0%) |
Housing Structures by Number of Rooms in Samoa
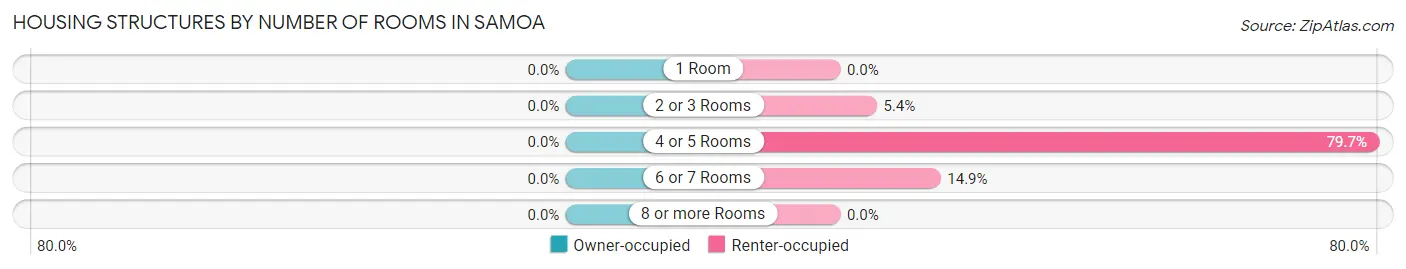
| Number of Rooms | Owner-occupied | Renter-occupied |
| 1 Room | 0 (0.0%) | 0 (0.0%) |
| 2 or 3 Rooms | 0 (0.0%) | 4 (5.4%) |
| 4 or 5 Rooms | 0 (0.0%) | 59 (79.7%) |
| 6 or 7 Rooms | 0 (0.0%) | 11 (14.9%) |
| 8 or more Rooms | 0 (0.0%) | 0 (0.0%) |
| Total | 0 (0.0%) | 74 (100.0%) |
Housing Structure by Heating Type in Samoa
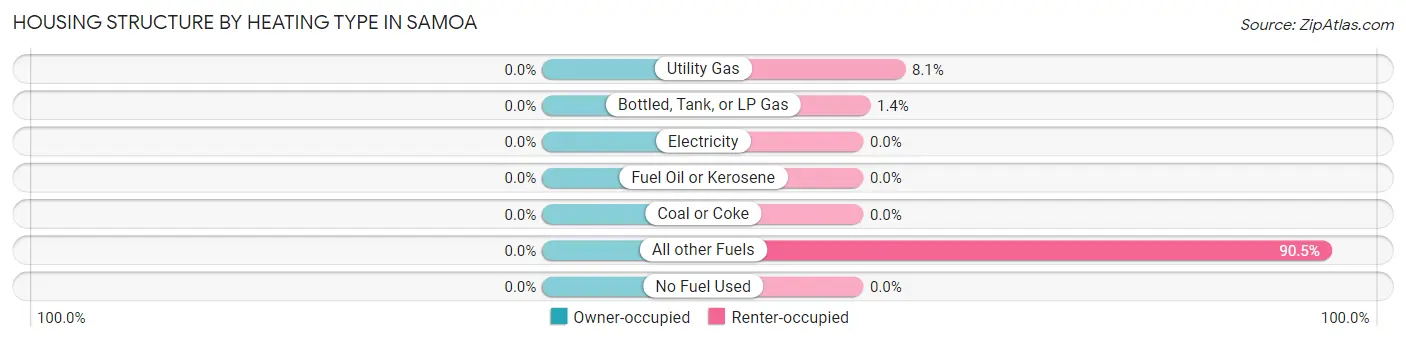
| Heating Type | Owner-occupied | Renter-occupied |
| Utility Gas | 0 (0.0%) | 6 (8.1%) |
| Bottled, Tank, or LP Gas | 0 (0.0%) | 1 (1.3%) |
| Electricity | 0 (0.0%) | 0 (0.0%) |
| Fuel Oil or Kerosene | 0 (0.0%) | 0 (0.0%) |
| Coal or Coke | 0 (0.0%) | 0 (0.0%) |
| All other Fuels | 0 (0.0%) | 67 (90.5%) |
| No Fuel Used | 0 (0.0%) | 0 (0.0%) |
| Total | 0 (0.0%) | 74 (100.0%) |
Household Vehicle Usage in Samoa
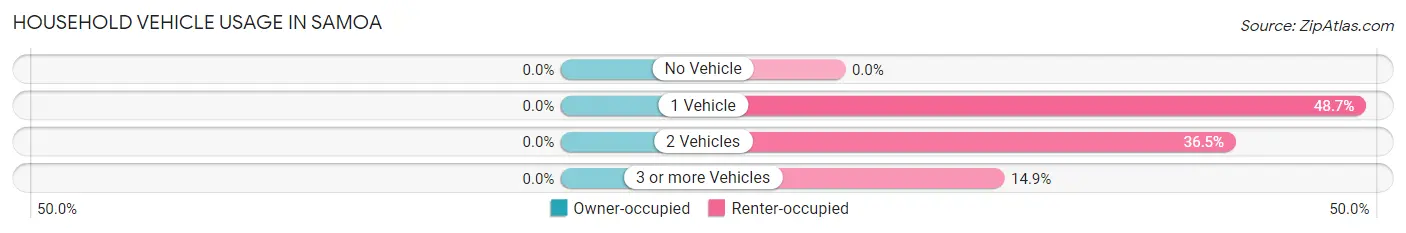
| Vehicles per Household | Owner-occupied | Renter-occupied |
| No Vehicle | 0 (0.0%) | 0 (0.0%) |
| 1 Vehicle | 0 (0.0%) | 36 (48.6%) |
| 2 Vehicles | 0 (0.0%) | 27 (36.5%) |
| 3 or more Vehicles | 0 (0.0%) | 11 (14.9%) |
| Total | 0 (0.0%) | 74 (100.0%) |
Real Estate & Mortgages in Samoa
Real Estate and Mortgage Overview in Samoa
| Characteristic | Without Mortgage | With Mortgage |
| Housing Units | 0 | 0 |
| Median Property Value | - | - |
| Median Household Income | - | - |
| Monthly Housing Costs | - | - |
| Real Estate Taxes | - | - |
Property Value by Mortgage Status in Samoa
| Property Value | Without Mortgage | With Mortgage |
| Less than $50,000 | 0 (0.0%) | 0 (0.0%) |
| $50,000 to $99,999 | 0 (0.0%) | 0 (0.0%) |
| $100,000 to $299,999 | 0 (0.0%) | 0 (0.0%) |
| $300,000 to $499,999 | 0 (0.0%) | 0 (0.0%) |
| $500,000 to $749,999 | 0 (0.0%) | 0 (0.0%) |
| $750,000 to $999,999 | 0 (0.0%) | 0 (0.0%) |
| $1,000,000 or more | 0 (0.0%) | 0 (0.0%) |
| Total | 0 (0.0%) | 0 (0.0%) |
Household Income by Mortgage Status in Samoa
| Household Income | Without Mortgage | With Mortgage |
| Less than $10,000 | 0 (0.0%) | 0 (0.0%) |
| $10,000 to $24,999 | 0 (0.0%) | 0 (0.0%) |
| $25,000 to $34,999 | 0 (0.0%) | 0 (0.0%) |
| $35,000 to $49,999 | 0 (0.0%) | 0 (0.0%) |
| $50,000 to $74,999 | 0 (0.0%) | 0 (0.0%) |
| $75,000 to $99,999 | 0 (0.0%) | 0 (0.0%) |
| $100,000 to $149,999 | 0 (0.0%) | 0 (0.0%) |
| $150,000 or more | 0 (0.0%) | 0 (0.0%) |
| Total | 0 (0.0%) | 0 (0.0%) |
Property Value to Household Income Ratio in Samoa
| Value-to-Income Ratio | Without Mortgage | With Mortgage |
| Less than 2.0x | 0 (0.0%) | 0 (0.0%) |
| 2.0x to 2.9x | 0 (0.0%) | 0 (0.0%) |
| 3.0x to 3.9x | 0 (0.0%) | 0 (0.0%) |
| 4.0x or more | 0 (0.0%) | 0 (0.0%) |
| Total | 0 (0.0%) | 0 (0.0%) |
Real Estate Taxes by Mortgage Status in Samoa
| Property Taxes | Without Mortgage | With Mortgage |
| Less than $800 | 0 (0.0%) | 0 (0.0%) |
| $800 to $1,499 | 0 (0.0%) | 0 (0.0%) |
| $800 to $1,499 | 0 (0.0%) | 0 (0.0%) |
| Total | 0 (0.0%) | 0 (0.0%) |
Health & Disability in Samoa
Health Insurance Coverage by Age in Samoa
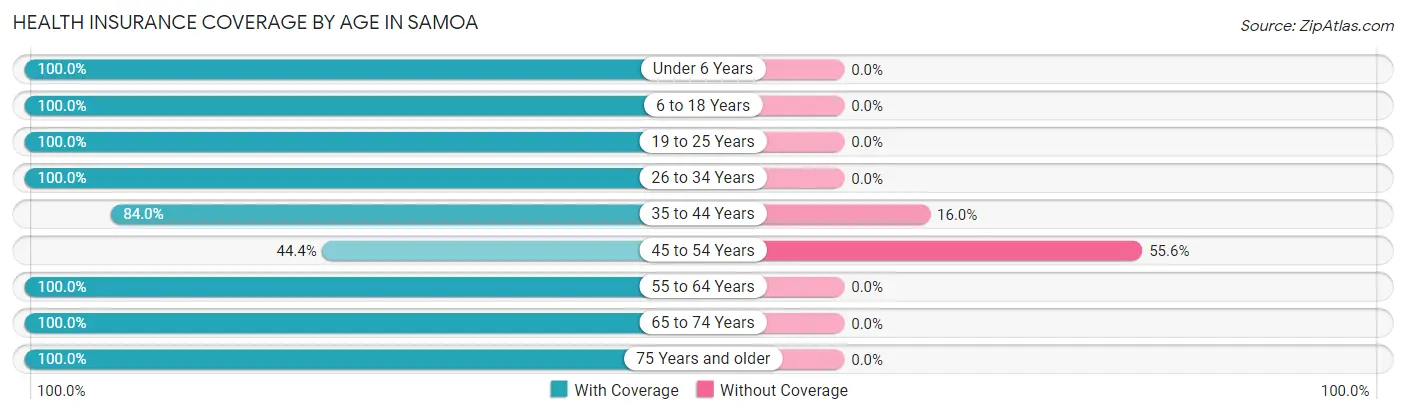
| Age Bracket | With Coverage | Without Coverage |
| Under 6 Years | 27 (100.0%) | 0 (0.0%) |
| 6 to 18 Years | 49 (100.0%) | 0 (0.0%) |
| 19 to 25 Years | 29 (100.0%) | 0 (0.0%) |
| 26 to 34 Years | 36 (100.0%) | 0 (0.0%) |
| 35 to 44 Years | 21 (84.0%) | 4 (16.0%) |
| 45 to 54 Years | 8 (44.4%) | 10 (55.6%) |
| 55 to 64 Years | 11 (100.0%) | 0 (0.0%) |
| 65 to 74 Years | 24 (100.0%) | 0 (0.0%) |
| 75 Years and older | 4 (100.0%) | 0 (0.0%) |
| Total | 209 (93.7%) | 14 (6.3%) |
Health Insurance Coverage by Citizenship Status in Samoa
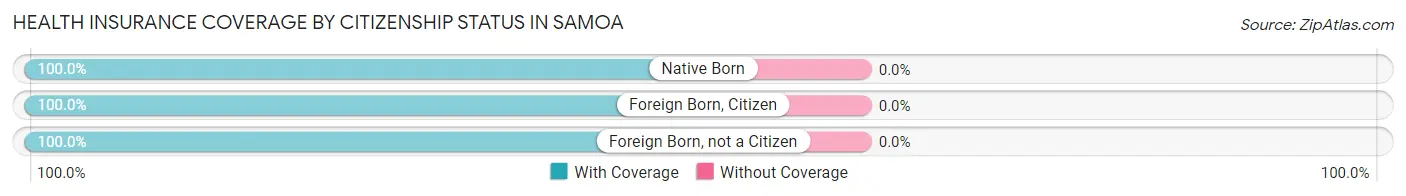
| Citizenship Status | With Coverage | Without Coverage |
| Native Born | 27 (100.0%) | 0 (0.0%) |
| Foreign Born, Citizen | 49 (100.0%) | 0 (0.0%) |
| Foreign Born, not a Citizen | 29 (100.0%) | 0 (0.0%) |
Health Insurance Coverage by Household Income in Samoa
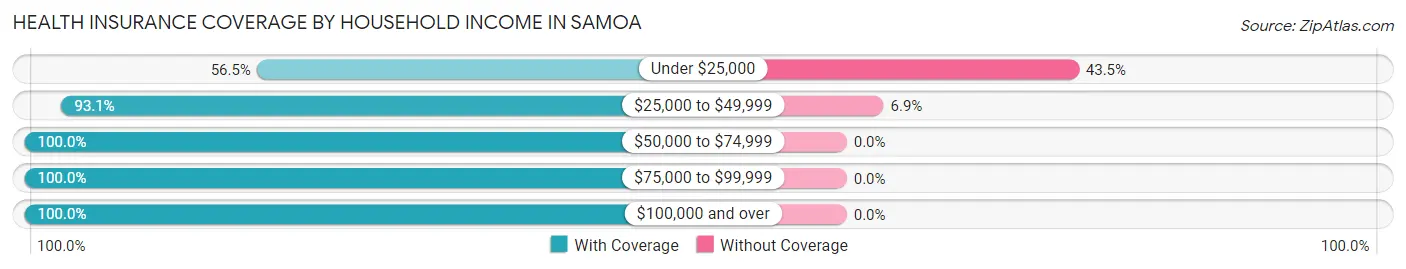
| Household Income | With Coverage | Without Coverage |
| Under $25,000 | 13 (56.5%) | 10 (43.5%) |
| $25,000 to $49,999 | 54 (93.1%) | 4 (6.9%) |
| $50,000 to $74,999 | 55 (100.0%) | 0 (0.0%) |
| $75,000 to $99,999 | 25 (100.0%) | 0 (0.0%) |
| $100,000 and over | 62 (100.0%) | 0 (0.0%) |
Public vs Private Health Insurance Coverage by Age in Samoa
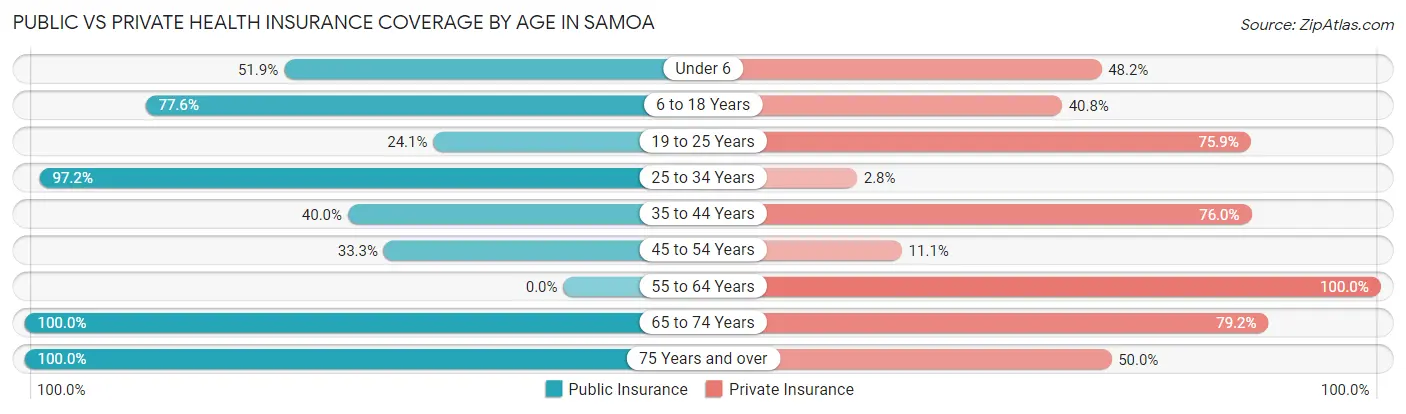
| Age Bracket | Public Insurance | Private Insurance |
| Under 6 | 14 (51.8%) | 13 (48.1%) |
| 6 to 18 Years | 38 (77.5%) | 20 (40.8%) |
| 19 to 25 Years | 7 (24.1%) | 22 (75.9%) |
| 25 to 34 Years | 35 (97.2%) | 1 (2.8%) |
| 35 to 44 Years | 10 (40.0%) | 19 (76.0%) |
| 45 to 54 Years | 6 (33.3%) | 2 (11.1%) |
| 55 to 64 Years | 0 (0.0%) | 11 (100.0%) |
| 65 to 74 Years | 24 (100.0%) | 19 (79.2%) |
| 75 Years and over | 4 (100.0%) | 2 (50.0%) |
| Total | 138 (61.9%) | 109 (48.9%) |
Disability Status by Sex by Age in Samoa
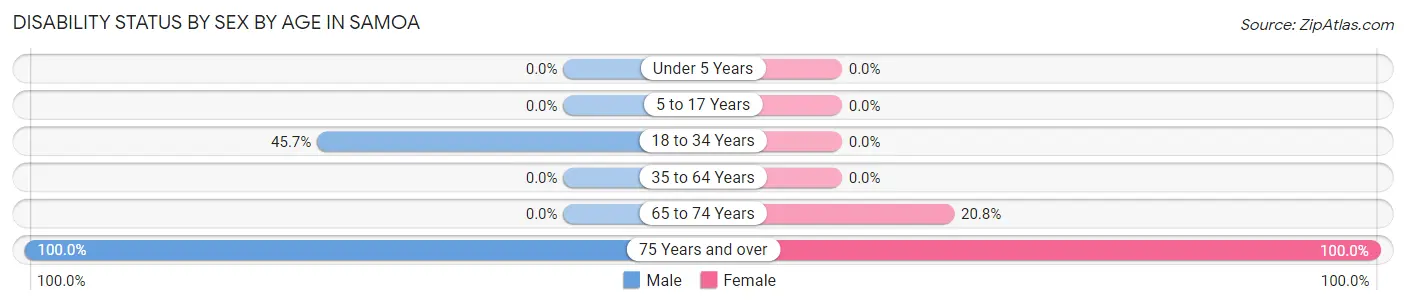
| Age Bracket | Male | Female |
| Under 5 Years | 0 (0.0%) | 0 (0.0%) |
| 5 to 17 Years | 0 (0.0%) | 0 (0.0%) |
| 18 to 34 Years | 16 (45.7%) | 0 (0.0%) |
| 35 to 64 Years | 0 (0.0%) | 0 (0.0%) |
| 65 to 74 Years | 0 (0.0%) | 5 (20.8%) |
| 75 Years and over | 1 (100.0%) | 3 (100.0%) |
Disability Class by Sex by Age in Samoa
Disability Class: Hearing Difficulty
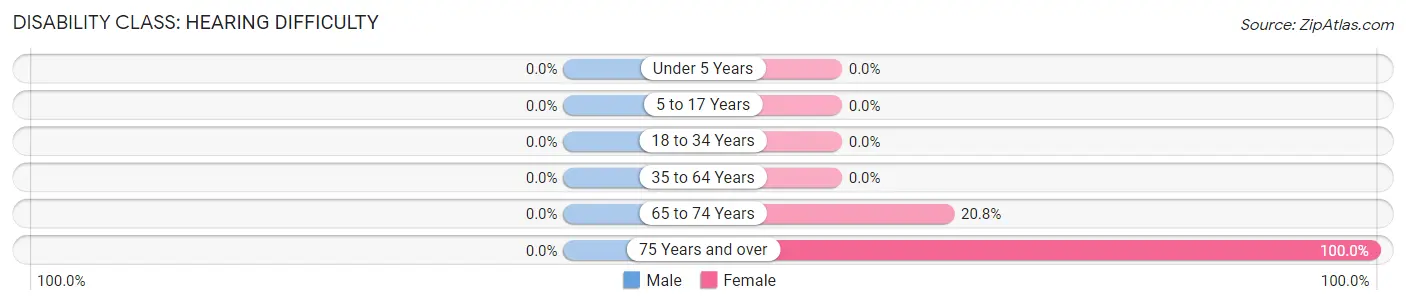
| Age Bracket | Male | Female |
| Under 5 Years | 0 (0.0%) | 0 (0.0%) |
| 5 to 17 Years | 0 (0.0%) | 0 (0.0%) |
| 18 to 34 Years | 0 (0.0%) | 0 (0.0%) |
| 35 to 64 Years | 0 (0.0%) | 0 (0.0%) |
| 65 to 74 Years | 0 (0.0%) | 5 (20.8%) |
| 75 Years and over | 0 (0.0%) | 3 (100.0%) |
Disability Class: Vision Difficulty
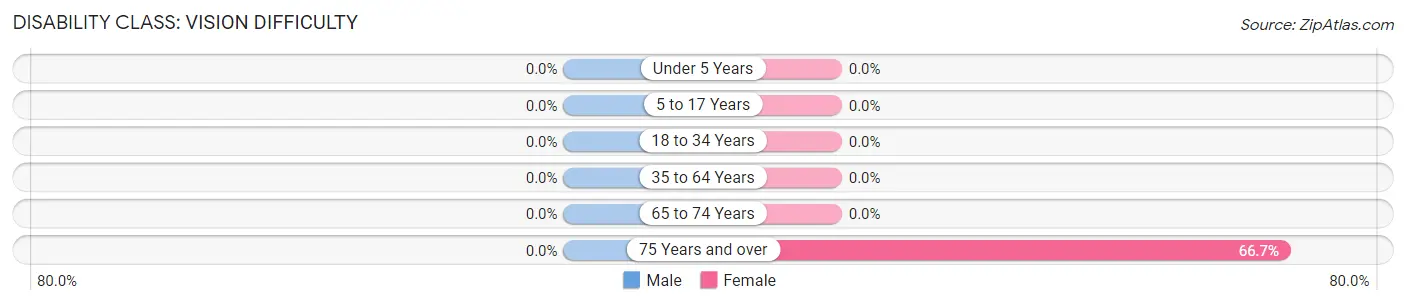
| Age Bracket | Male | Female |
| Under 5 Years | 0 (0.0%) | 0 (0.0%) |
| 5 to 17 Years | 0 (0.0%) | 0 (0.0%) |
| 18 to 34 Years | 0 (0.0%) | 0 (0.0%) |
| 35 to 64 Years | 0 (0.0%) | 0 (0.0%) |
| 65 to 74 Years | 0 (0.0%) | 0 (0.0%) |
| 75 Years and over | 0 (0.0%) | 2 (66.7%) |
Disability Class: Cognitive Difficulty
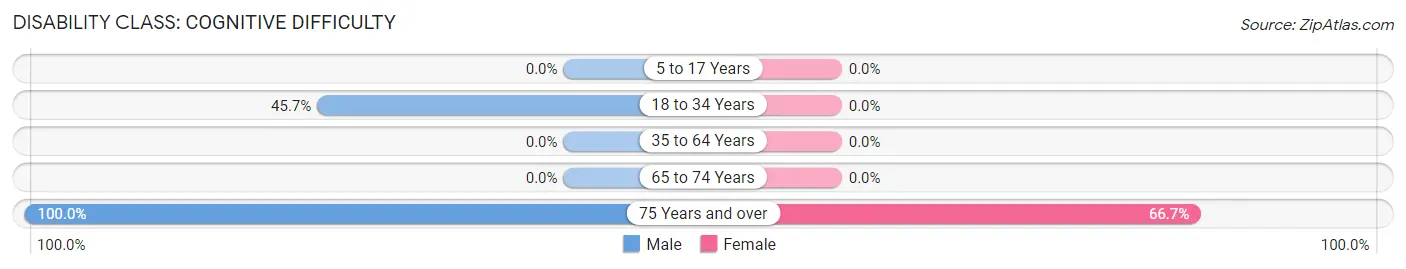
| Age Bracket | Male | Female |
| 5 to 17 Years | 0 (0.0%) | 0 (0.0%) |
| 18 to 34 Years | 16 (45.7%) | 0 (0.0%) |
| 35 to 64 Years | 0 (0.0%) | 0 (0.0%) |
| 65 to 74 Years | 0 (0.0%) | 0 (0.0%) |
| 75 Years and over | 1 (100.0%) | 2 (66.7%) |
Disability Class: Ambulatory Difficulty
| Age Bracket | Male | Female |
| 5 to 17 Years | 0 (0.0%) | 0 (0.0%) |
| 18 to 34 Years | 0 (0.0%) | 0 (0.0%) |
| 35 to 64 Years | 0 (0.0%) | 0 (0.0%) |
| 65 to 74 Years | 0 (0.0%) | 0 (0.0%) |
| 75 Years and over | 0 (0.0%) | 0 (0.0%) |
Disability Class: Self-Care Difficulty
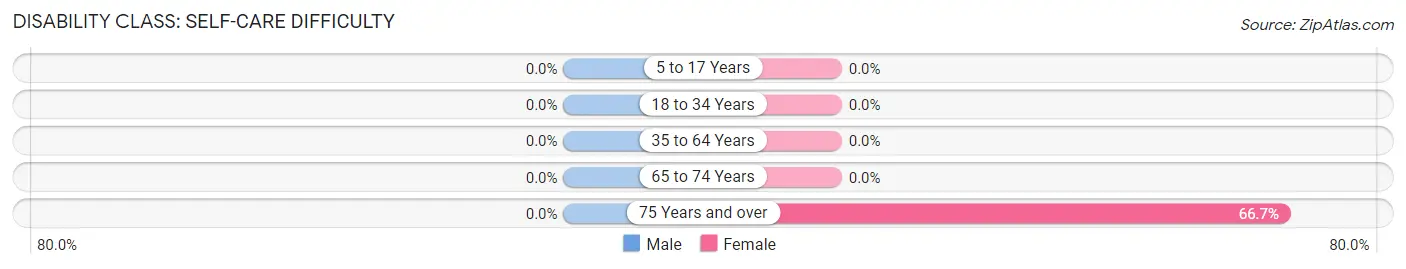
| Age Bracket | Male | Female |
| 5 to 17 Years | 0 (0.0%) | 0 (0.0%) |
| 18 to 34 Years | 0 (0.0%) | 0 (0.0%) |
| 35 to 64 Years | 0 (0.0%) | 0 (0.0%) |
| 65 to 74 Years | 0 (0.0%) | 0 (0.0%) |
| 75 Years and over | 0 (0.0%) | 2 (66.7%) |
Technology Access in Samoa
Computing Device Access in Samoa
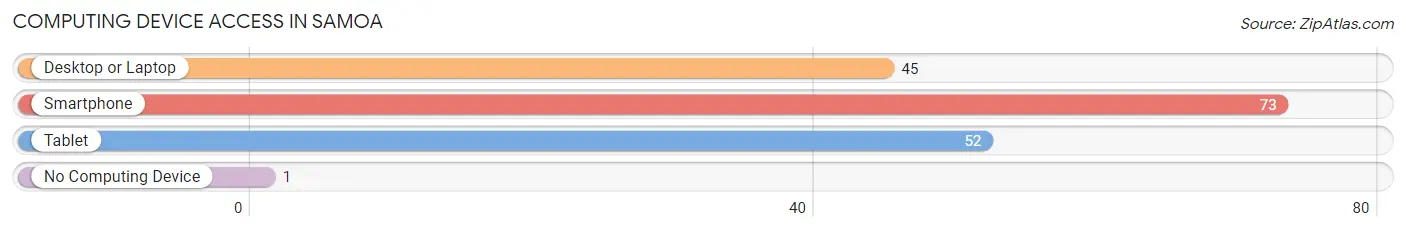
| Device Type | # Households | % Households |
| Desktop or Laptop | 45 | 60.8% |
| Smartphone | 73 | 98.7% |
| Tablet | 52 | 70.3% |
| No Computing Device | 1 | 1.3% |
| Total | 74 | 100.0% |
Internet Access in Samoa
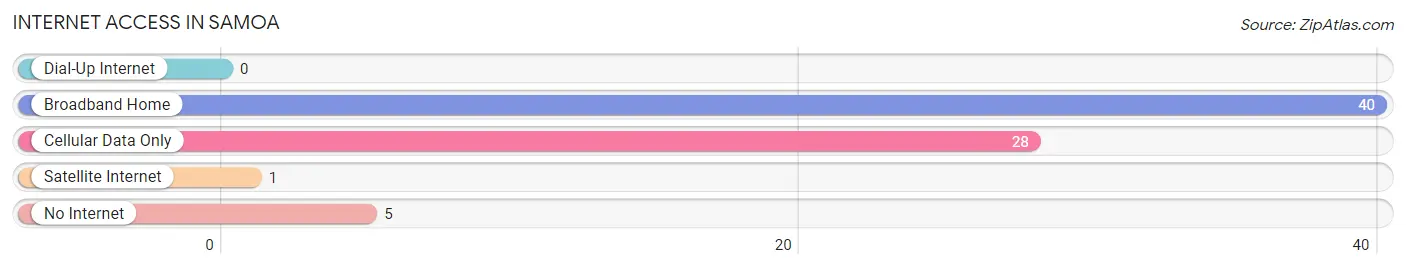
| Internet Type | # Households | % Households |
| Dial-Up Internet | 0 | 0.0% |
| Broadband Home | 40 | 54.0% |
| Cellular Data Only | 28 | 37.8% |
| Satellite Internet | 1 | 1.3% |
| No Internet | 5 | 6.8% |
| Total | 74 | 100.0% |
Samoa Summary
Samoa is a small island nation located in the South Pacific Ocean, about halfway between Hawaii and New Zealand. It is made up of two main islands, Upolu and Savai’i, and several smaller islands. The total land area of Samoa is 2,831 square kilometers (1,093 square miles). The population of Samoa was estimated to be around 200,000 in 2020.
Geography
Samoa is located in the South Pacific Ocean, about halfway between Hawaii and New Zealand. It is made up of two main islands, Upolu and Savai’i, and several smaller islands. The total land area of Samoa is 2,831 square kilometers (1,093 square miles). The islands are volcanic in origin and are surrounded by coral reefs. The highest point in Samoa is Mauga Silisili, which is 1,857 meters (6,092 feet) above sea level.
The climate of Samoa is tropical, with temperatures ranging from 21 to 32 degrees Celsius (70 to 90 degrees Fahrenheit). The rainy season runs from November to April, and the dry season from May to October.
Economy
The economy of Samoa is largely based on agriculture, fishing, and tourism. The main agricultural products are coconuts, bananas, taro, and yams. Fishing is also an important industry, with tuna being the main catch. Tourism is a growing sector, with visitors coming to enjoy the beaches, rainforests, and cultural attractions.
The currency of Samoa is the Samoan Tala (WST). The GDP of Samoa was estimated to be around $1.2 billion in 2020. The unemployment rate was estimated to be around 8.2% in 2020.
Demographics
The population of Samoa was estimated to be around 200,000 in 2020. The majority of the population is of Samoan descent, with smaller numbers of Europeans, Chinese, and other Pacific Islanders. The official language of Samoa is Samoan, although English is also widely spoken. The majority of the population is Christian, with the largest denominations being the Congregational Christian Church of Samoa and the Roman Catholic Church.
The life expectancy in Samoa is 74.3 years for males and 78.2 years for females. The infant mortality rate is 11.3 per 1,000 live births. The literacy rate is 98.7%.
Conclusion
Samoa is a small island nation located in the South Pacific Ocean, about halfway between Hawaii and New Zealand. It is made up of two main islands, Upolu and Savai’i, and several smaller islands. The total land area of Samoa is 2,831 square kilometers (1,093 square miles). The population of Samoa was estimated to be around 200,000 in 2020. The economy of Samoa is largely based on agriculture, fishing, and tourism. The majority of the population is of Samoan descent, with smaller numbers of Europeans, Chinese, and other Pacific Islanders. The official language of Samoa is Samoan, although English is also widely spoken. The life expectancy in Samoa is 74.3 years for males and 78.2 years for females. The literacy rate is 98.7%.
Common Questions
What is Per Capita Income in Samoa?
Per Capita income in Samoa is $19,733.
What is the Median Family Income in Samoa?
Median Family Income in Samoa is $41,641.
What is the Median Household income in Samoa?
Median Household Income in Samoa is $44,737.
What is Inequality or Gini Index in Samoa?
Inequality or Gini Index in Samoa is 0.26.
What is the Total Population of Samoa?
Total Population of Samoa is 223.
What is the Total Male Population of Samoa?
Total Male Population of Samoa is 99.
What is the Total Female Population of Samoa?
Total Female Population of Samoa is 124.
What is the Ratio of Males per 100 Females in Samoa?
There are 79.84 Males per 100 Females in Samoa.
What is the Ratio of Females per 100 Males in Samoa?
There are 125.25 Females per 100 Males in Samoa.
What is the Median Population Age in Samoa?
Median Population Age in Samoa is 28.9 Years.
What is the Average Family Size in Samoa
Average Family Size in Samoa is 3.6 People.
What is the Average Household Size in Samoa
Average Household Size in Samoa is 3.0 People.
How Large is the Labor Force in Samoa?
There are 121 People in the Labor Forcein in Samoa.
What is the Percentage of People in the Labor Force in Samoa?
70.8% of People are in the Labor Force in Samoa.
What is the Unemployment Rate in Samoa?
Unemployment Rate in Samoa is 34.7%.