Salton City, CA Map & Demographics
Salton City Map
Salton City Overview
$18,717
PER CAPITA INCOME
$51,875
AVG FAMILY INCOME
$33,850
AVG HOUSEHOLD INCOME
45.9%
WAGE / INCOME GAP [ % ]
54.1¢/ $1
WAGE / INCOME GAP [ $ ]
0.35
INEQUALITY / GINI INDEX
6,202
TOTAL POPULATION
3,439
MALE POPULATION
2,763
FEMALE POPULATION
124.47
MALES / 100 FEMALES
80.34
FEMALES / 100 MALES
36.7
MEDIAN AGE
4.1
AVG FAMILY SIZE
2.6
AVG HOUSEHOLD SIZE
2,369
LABOR FORCE [ PEOPLE ]
46.0%
PERCENT IN LABOR FORCE
10.1%
UNEMPLOYMENT RATE
Salton City Zip Codes
Salton City Area Codes
Income in Salton City
Income Overview in Salton City
Per Capita Income in Salton City is $18,717, while median incomes of families and households are $51,875 and $33,850 respectively.
| Characteristic | Number | Measure |
| Per Capita Income | 6,202 | $18,717 |
| Median Family Income | 1,187 | $51,875 |
| Mean Family Income | 1,187 | $55,670 |
| Median Household Income | 2,368 | $33,850 |
| Mean Household Income | 2,368 | $44,579 |
| Income Deficit | 1,187 | $0 |
| Wage / Income Gap (%) | 6,202 | 45.93% |
| Wage / Income Gap ($) | 6,202 | 54.07¢ per $1 |
| Gini / Inequality Index | 6,202 | 0.35 |
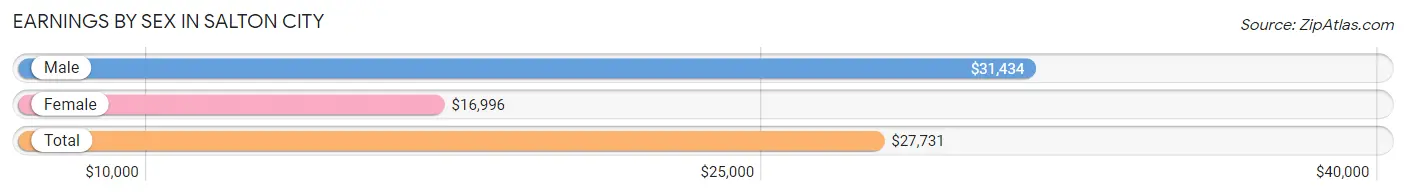
Earnings by Sex in Salton City
Average Earnings in Salton City are $27,731, $31,434 for men and $16,996 for women, a difference of 45.9%.
| Sex | Number | Average Earnings |
| Male | 1,622 (65.4%) | $31,434 |
| Female | 857 (34.6%) | $16,996 |
| Total | 2,479 (100.0%) | $27,731 |
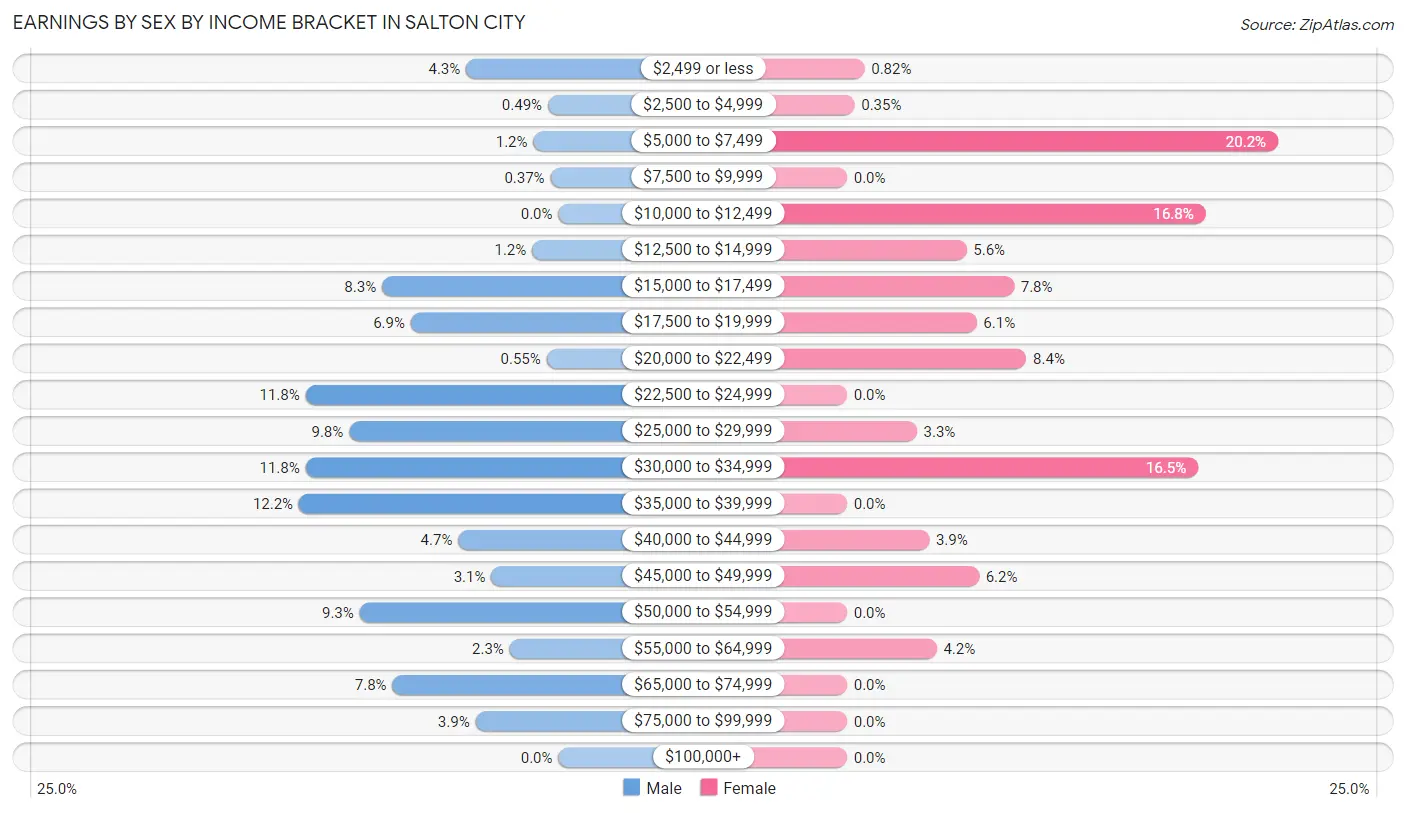
Earnings by Sex by Income Bracket in Salton City
The most common earnings brackets in Salton City are $35,000 to $39,999 for men (197 | 12.1%) and $5,000 to $7,499 for women (173 | 20.2%).
| Income | Male | Female |
| $2,499 or less | 70 (4.3%) | 7 (0.8%) |
| $2,500 to $4,999 | 8 (0.5%) | 3 (0.4%) |
| $5,000 to $7,499 | 19 (1.2%) | 173 (20.2%) |
| $7,500 to $9,999 | 6 (0.4%) | 0 (0.0%) |
| $10,000 to $12,499 | 0 (0.0%) | 144 (16.8%) |
| $12,500 to $14,999 | 20 (1.2%) | 48 (5.6%) |
| $15,000 to $17,499 | 134 (8.3%) | 67 (7.8%) |
| $17,500 to $19,999 | 112 (6.9%) | 52 (6.1%) |
| $20,000 to $22,499 | 9 (0.5%) | 72 (8.4%) |
| $22,500 to $24,999 | 192 (11.8%) | 0 (0.0%) |
| $25,000 to $29,999 | 159 (9.8%) | 28 (3.3%) |
| $30,000 to $34,999 | 192 (11.8%) | 141 (16.5%) |
| $35,000 to $39,999 | 197 (12.1%) | 0 (0.0%) |
| $40,000 to $44,999 | 76 (4.7%) | 33 (3.8%) |
| $45,000 to $49,999 | 51 (3.1%) | 53 (6.2%) |
| $50,000 to $54,999 | 151 (9.3%) | 0 (0.0%) |
| $55,000 to $64,999 | 37 (2.3%) | 36 (4.2%) |
| $65,000 to $74,999 | 126 (7.8%) | 0 (0.0%) |
| $75,000 to $99,999 | 63 (3.9%) | 0 (0.0%) |
| $100,000+ | 0 (0.0%) | 0 (0.0%) |
| Total | 1,622 (100.0%) | 857 (100.0%) |
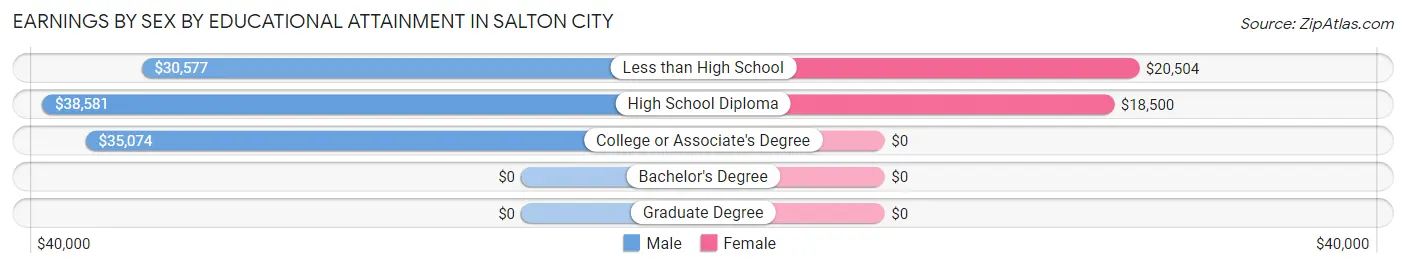
Earnings by Sex by Educational Attainment in Salton City
Average earnings in Salton City are $31,757 for men and $20,044 for women, a difference of 36.9%. Men with an educational attainment of high school diploma enjoy the highest average annual earnings of $38,581, while those with less than high school education earn the least with $30,577. Women with an educational attainment of less than high school earn the most with the average annual earnings of $20,504, while those with high school diploma education have the smallest earnings of $18,500.
| Educational Attainment | Male Income | Female Income |
| Less than High School | $30,577 | $20,504 |
| High School Diploma | $38,581 | $18,500 |
| College or Associate's Degree | $35,074 | $0 |
| Bachelor's Degree | - | - |
| Graduate Degree | - | - |
| Total | $31,757 | $20,044 |
Family Income in Salton City
Family Income Brackets in Salton City
According to the Salton City family income data, there are 337 families falling into the $50,000 to $74,999 income range, which is the most common income bracket and makes up 28.4% of all families.
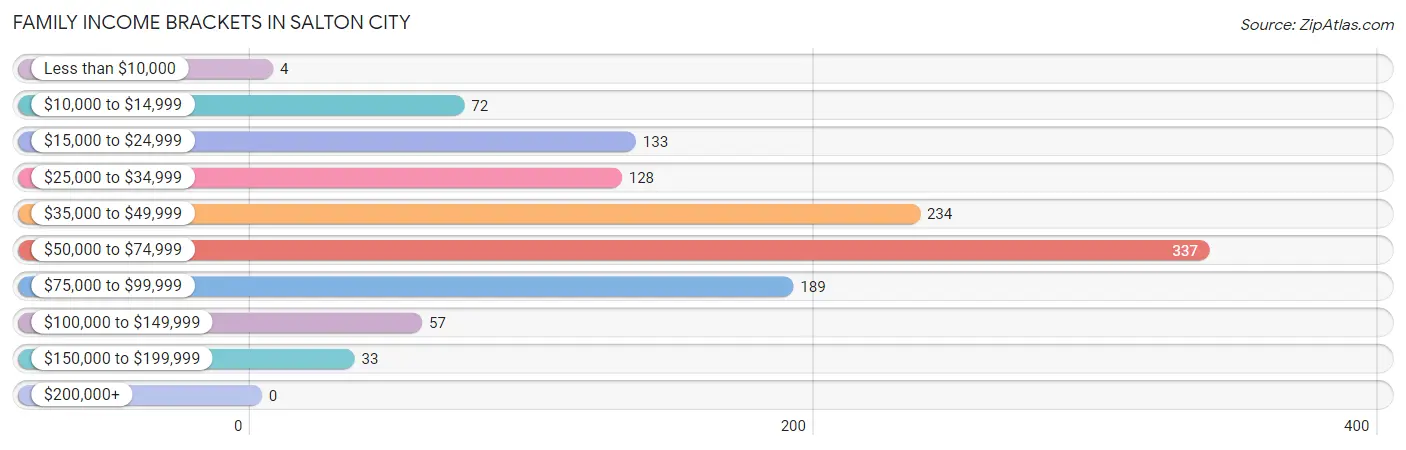
| Income Bracket | # Families | % Families |
| Less than $10,000 | 4 | 0.3% |
| $10,000 to $14,999 | 72 | 6.1% |
| $15,000 to $24,999 | 133 | 11.2% |
| $25,000 to $34,999 | 128 | 10.8% |
| $35,000 to $49,999 | 234 | 19.7% |
| $50,000 to $74,999 | 337 | 28.4% |
| $75,000 to $99,999 | 189 | 15.9% |
| $100,000 to $149,999 | 57 | 4.8% |
| $150,000 to $199,999 | 33 | 2.8% |
| $200,000+ | 0 | 0.0% |
Family Income by Famaliy Size in Salton City
5-person families (159 | 13.4%) account for the highest median family income in Salton City with $80,721 per family, while 2-person families (564 | 47.5%) have the highest median income of $22,443 per family member.
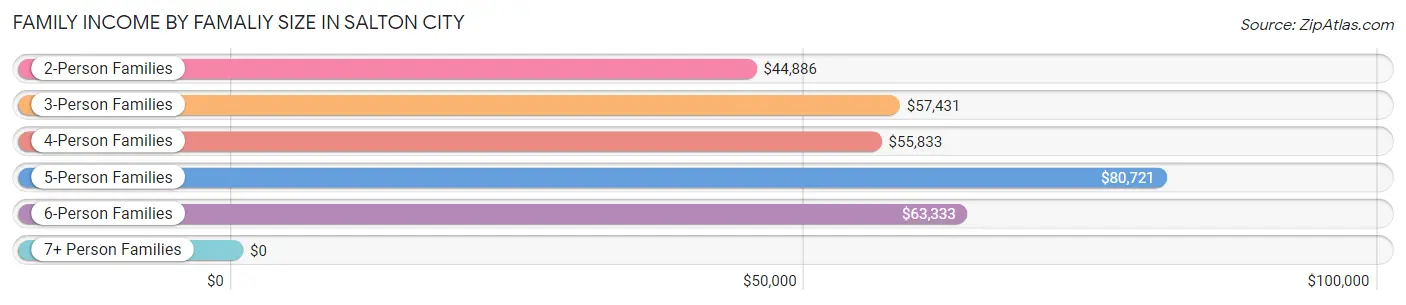
| Income Bracket | # Families | Median Income |
| 2-Person Families | 564 (47.5%) | $44,886 |
| 3-Person Families | 110 (9.3%) | $57,431 |
| 4-Person Families | 218 (18.4%) | $55,833 |
| 5-Person Families | 159 (13.4%) | $80,721 |
| 6-Person Families | 116 (9.8%) | $63,333 |
| 7+ Person Families | 20 (1.7%) | $0 |
| Total | 1,187 (100.0%) | $51,875 |
Family Income by Number of Earners in Salton City
The median family income in Salton City is $51,875, with families comprising 3+ earners (166) having the highest median family income of $80,609, while families with no earners (323) have the lowest median family income of $39,904, accounting for 14.0% and 27.2% of families, respectively.
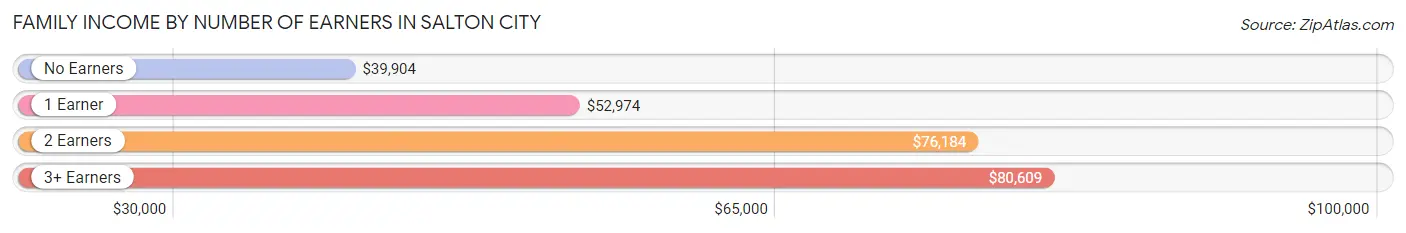
| Number of Earners | # Families | Median Income |
| No Earners | 323 (27.2%) | $39,904 |
| 1 Earner | 534 (45.0%) | $52,974 |
| 2 Earners | 164 (13.8%) | $76,184 |
| 3+ Earners | 166 (14.0%) | $80,609 |
| Total | 1,187 (100.0%) | $51,875 |
Household Income in Salton City
Household Income Brackets in Salton City
With 613 households falling in the category, the $15,000 to $24,999 income range is the most frequent in Salton City, accounting for 25.9% of all households.
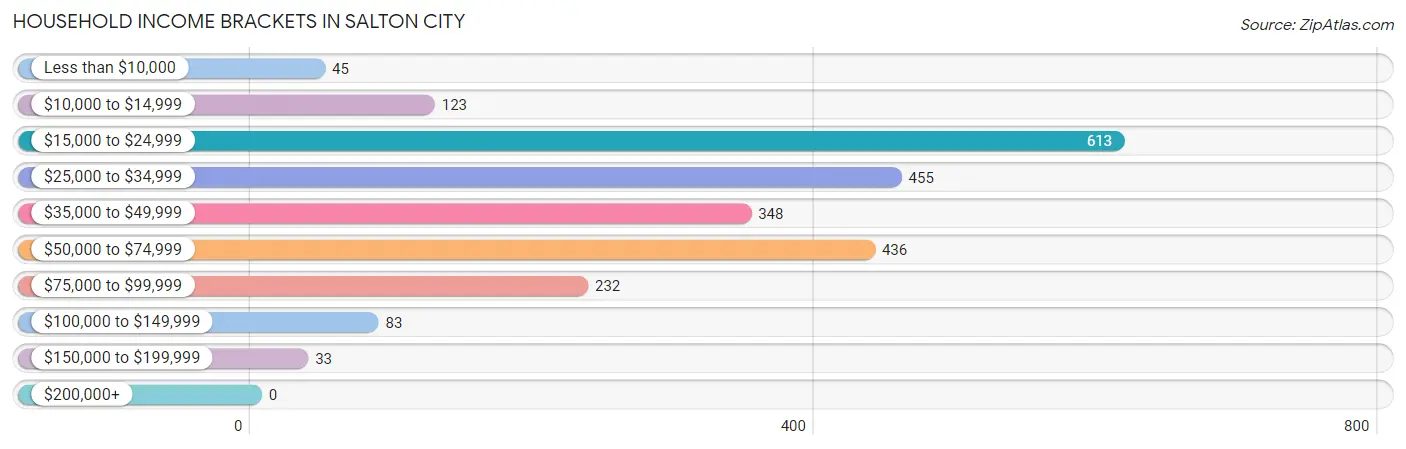
| Income Bracket | # Households | % Households |
| Less than $10,000 | 45 | 1.9% |
| $10,000 to $14,999 | 123 | 5.2% |
| $15,000 to $24,999 | 613 | 25.9% |
| $25,000 to $34,999 | 455 | 19.2% |
| $35,000 to $49,999 | 348 | 14.7% |
| $50,000 to $74,999 | 436 | 18.4% |
| $75,000 to $99,999 | 232 | 9.8% |
| $100,000 to $149,999 | 83 | 3.5% |
| $150,000 to $199,999 | 33 | 1.4% |
| $200,000+ | 0 | 0.0% |
Household Income by Householder Age in Salton City
The median household income in Salton City is $33,850, with the highest median household income of $65,250 found in the 45 to 64 years age bracket for the primary householder. A total of 457 households (19.3%) fall into this category. Meanwhile, the 15 to 24 years age bracket for the primary householder has the lowest median household income of $0, with 19 households (0.8%) in this group.
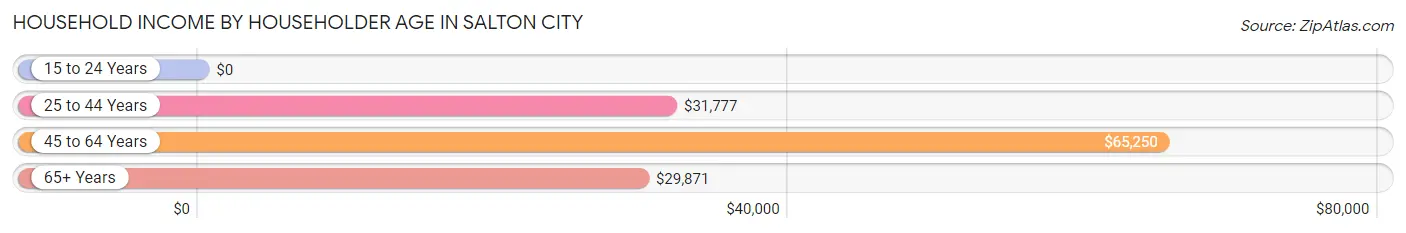
| Income Bracket | # Households | Median Income |
| 15 to 24 Years | 19 (0.8%) | $0 |
| 25 to 44 Years | 1,021 (43.1%) | $31,777 |
| 45 to 64 Years | 457 (19.3%) | $65,250 |
| 65+ Years | 871 (36.8%) | $29,871 |
| Total | 2,368 (100.0%) | $33,850 |
Poverty in Salton City
Income Below Poverty by Sex and Age in Salton City
With 11.7% poverty level for males and 12.8% for females among the residents of Salton City, 16 and 17 year old males and 5 year old females are the most vulnerable to poverty, with 56 males (57.1%) and 28 females (100.0%) in their respective age groups living below the poverty level.
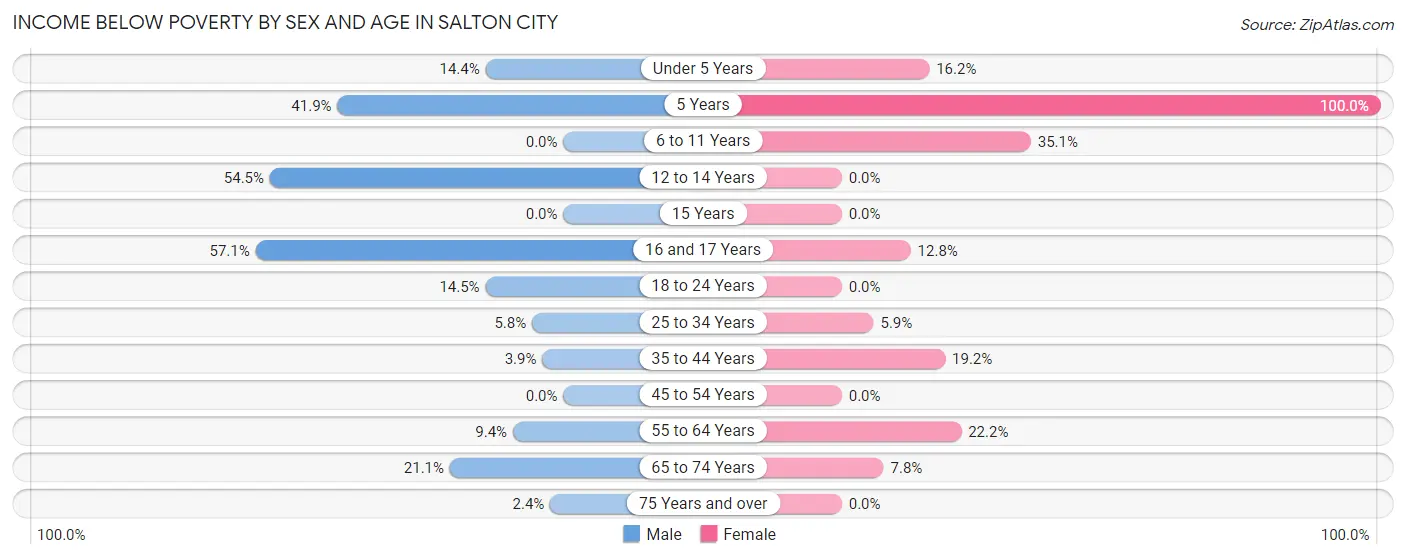
| Age Bracket | Male | Female |
| Under 5 Years | 26 (14.4%) | 31 (16.2%) |
| 5 Years | 13 (41.9%) | 28 (100.0%) |
| 6 to 11 Years | 0 (0.0%) | 67 (35.1%) |
| 12 to 14 Years | 73 (54.5%) | 0 (0.0%) |
| 15 Years | 0 (0.0%) | 0 (0.0%) |
| 16 and 17 Years | 56 (57.1%) | 17 (12.8%) |
| 18 to 24 Years | 58 (14.5%) | 0 (0.0%) |
| 25 to 34 Years | 30 (5.8%) | 28 (5.9%) |
| 35 to 44 Years | 25 (3.9%) | 56 (19.2%) |
| 45 to 54 Years | 0 (0.0%) | 0 (0.0%) |
| 55 to 64 Years | 22 (9.4%) | 100 (22.2%) |
| 65 to 74 Years | 91 (21.1%) | 26 (7.8%) |
| 75 Years and over | 7 (2.4%) | 0 (0.0%) |
| Total | 401 (11.7%) | 353 (12.8%) |
Income Above Poverty by Sex and Age in Salton City
According to the poverty statistics in Salton City, males aged 6 to 11 years and females aged 12 to 14 years are the age groups that are most secure financially, with 100.0% of males and 100.0% of females in these age groups living above the poverty line.
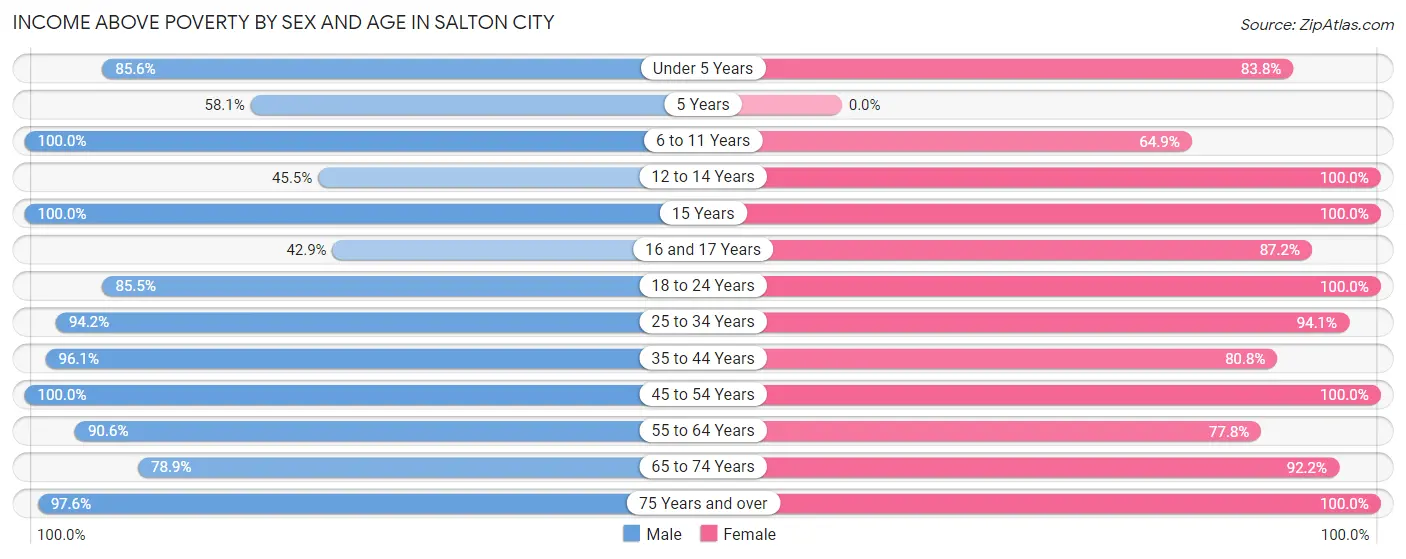
| Age Bracket | Male | Female |
| Under 5 Years | 154 (85.6%) | 160 (83.8%) |
| 5 Years | 18 (58.1%) | 0 (0.0%) |
| 6 to 11 Years | 136 (100.0%) | 124 (64.9%) |
| 12 to 14 Years | 61 (45.5%) | 117 (100.0%) |
| 15 Years | 37 (100.0%) | 7 (100.0%) |
| 16 and 17 Years | 42 (42.9%) | 116 (87.2%) |
| 18 to 24 Years | 343 (85.5%) | 243 (100.0%) |
| 25 to 34 Years | 486 (94.2%) | 447 (94.1%) |
| 35 to 44 Years | 614 (96.1%) | 236 (80.8%) |
| 45 to 54 Years | 313 (100.0%) | 71 (100.0%) |
| 55 to 64 Years | 213 (90.6%) | 351 (77.8%) |
| 65 to 74 Years | 341 (78.9%) | 309 (92.2%) |
| 75 Years and over | 280 (97.6%) | 229 (100.0%) |
| Total | 3,038 (88.3%) | 2,410 (87.2%) |
Income Below Poverty Among Married-Couple Families in Salton City
The poverty statistics for married-couple families in Salton City show that 12.8% or 116 of the total 906 families live below the poverty line. Families with 3 or 4 children have the highest poverty rate of 33.3%, comprising of 43 families. On the other hand, families with 1 or 2 children have the lowest poverty rate of 0.0%, which includes 0 families.
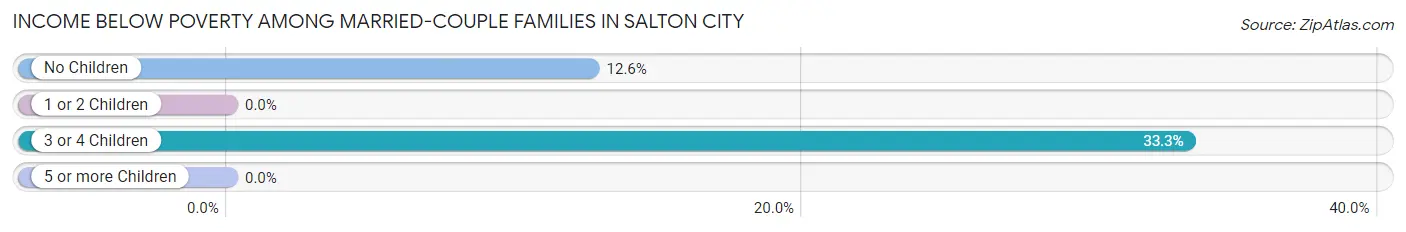
| Children | Above Poverty | Below Poverty |
| No Children | 507 (87.4%) | 73 (12.6%) |
| 1 or 2 Children | 197 (100.0%) | 0 (0.0%) |
| 3 or 4 Children | 86 (66.7%) | 43 (33.3%) |
| 5 or more Children | 0 (0.0%) | 0 (0.0%) |
| Total | 790 (87.2%) | 116 (12.8%) |
Income Below Poverty Among Single-Parent Households in Salton City
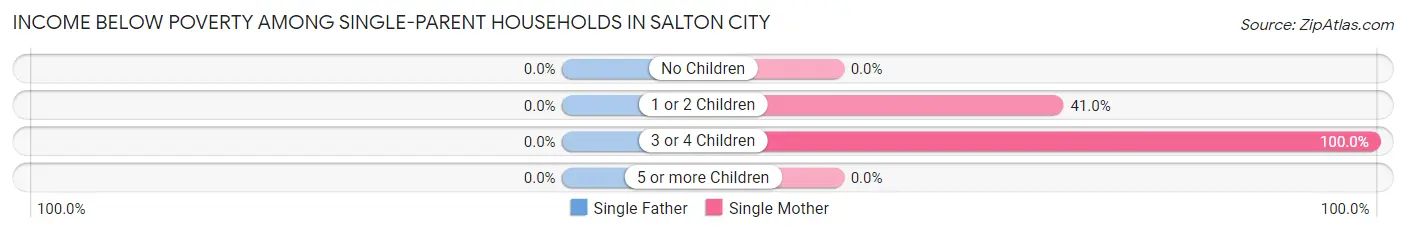
| Children | Single Father | Single Mother |
| No Children | 0 (0.0%) | 0 (0.0%) |
| 1 or 2 Children | 0 (0.0%) | 43 (40.9%) |
| 3 or 4 Children | 0 (0.0%) | 3 (100.0%) |
| 5 or more Children | 0 (0.0%) | 0 (0.0%) |
| Total | 0 (0.0%) | 46 (20.5%) |
Income Below Poverty Among Married-Couple vs Single-Parent Households in Salton City
The poverty data for Salton City shows that 116 of the married-couple family households (12.8%) and 46 of the single-parent households (16.4%) are living below the poverty level. Within the married-couple family households, those with 3 or 4 children have the highest poverty rate, with 43 households (33.3%) falling below the poverty line. Among the single-parent households, those with 1 or 2 children have the highest poverty rate, with 43 household (40.9%) living below poverty.
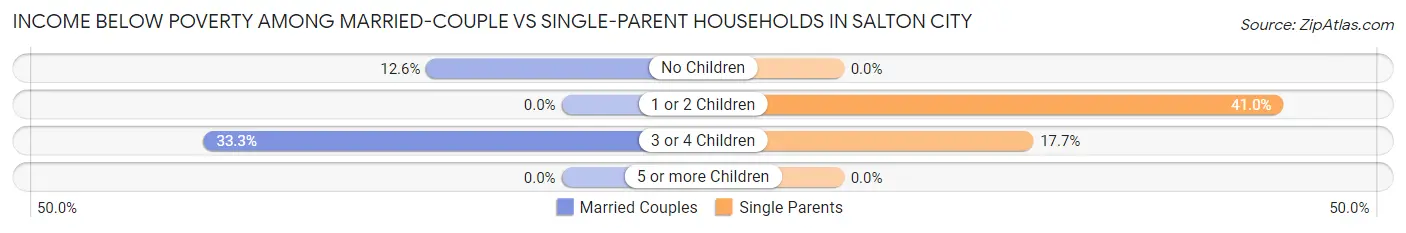
| Children | Married-Couple Families | Single-Parent Households |
| No Children | 73 (12.6%) | 0 (0.0%) |
| 1 or 2 Children | 0 (0.0%) | 43 (40.9%) |
| 3 or 4 Children | 43 (33.3%) | 3 (17.6%) |
| 5 or more Children | 0 (0.0%) | 0 (0.0%) |
| Total | 116 (12.8%) | 46 (16.4%) |
Race in Salton City
The most populous races in Salton City are Hispanic or Latino (5,044 | 81.3%), Some other Race (3,087 | 49.8%), and White / Caucasian (1,534 | 24.7%).
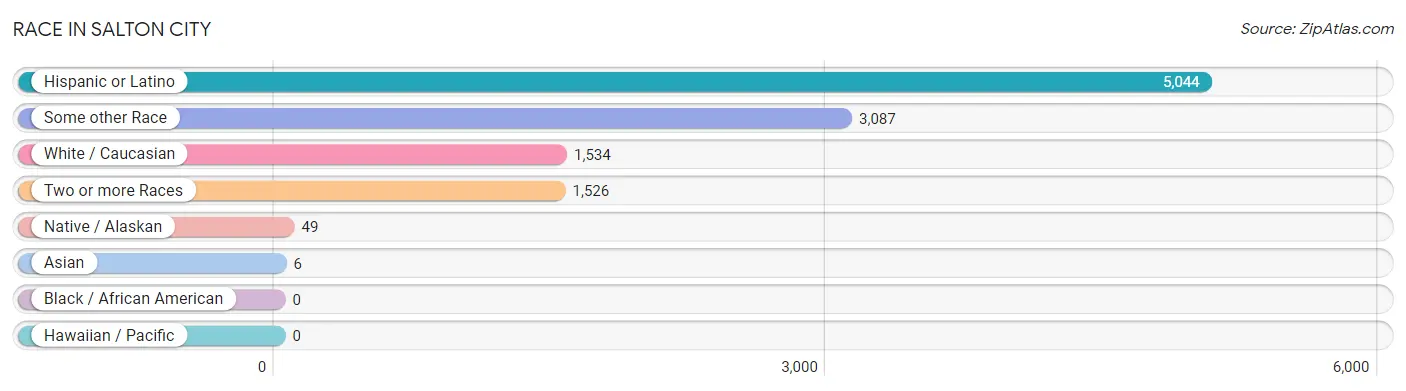
| Race | # Population | % Population |
| Asian | 6 | 0.1% |
| Black / African American | 0 | 0.0% |
| Hawaiian / Pacific | 0 | 0.0% |
| Hispanic or Latino | 5,044 | 81.3% |
| Native / Alaskan | 49 | 0.8% |
| White / Caucasian | 1,534 | 24.7% |
| Two or more Races | 1,526 | 24.6% |
| Some other Race | 3,087 | 49.8% |
| Total | 6,202 | 100.0% |
Ancestry in Salton City
The most populous ancestries reported in Salton City are Mexican (4,996 | 80.5%), Irish (185 | 3.0%), American (155 | 2.5%), English (126 | 2.0%), and German (104 | 1.7%), together accounting for 89.7% of all Salton City residents.
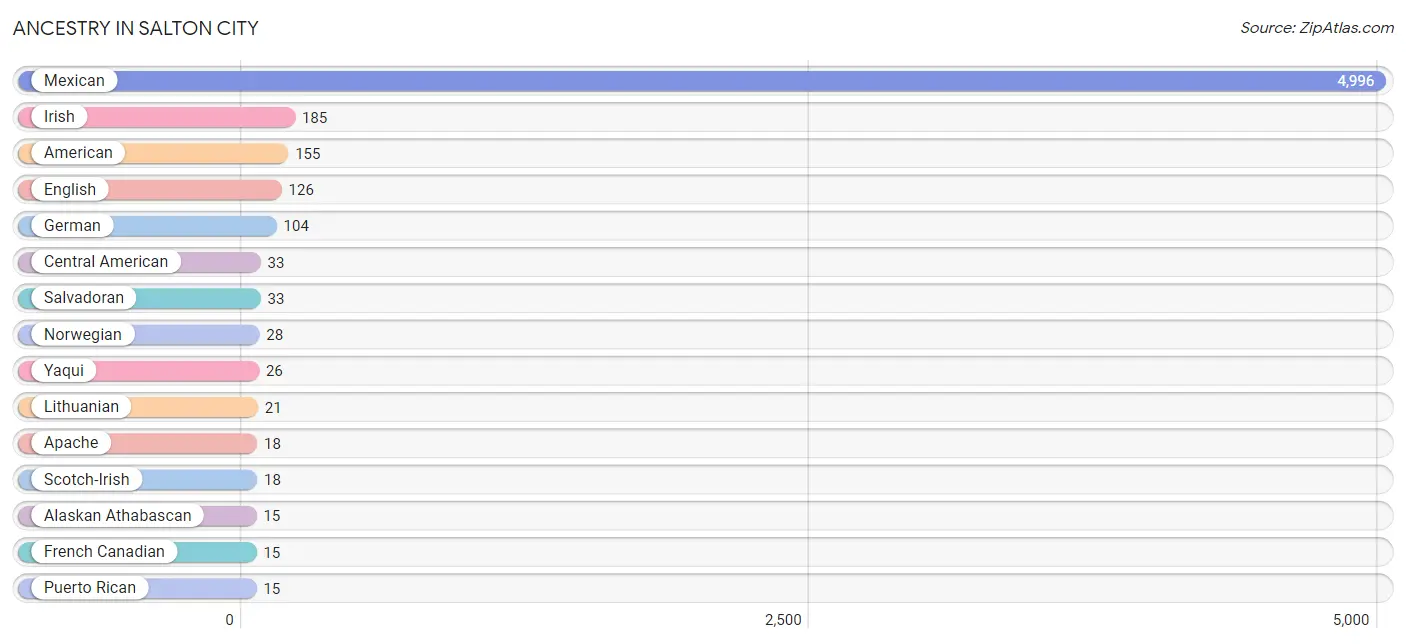
| Ancestry | # Population | % Population |
| Alaskan Athabascan | 15 | 0.2% |
| American | 155 | 2.5% |
| Apache | 18 | 0.3% |
| Central American | 33 | 0.5% |
| Danish | 14 | 0.2% |
| Dutch | 13 | 0.2% |
| English | 126 | 2.0% |
| European | 10 | 0.2% |
| French | 9 | 0.2% |
| French Canadian | 15 | 0.2% |
| German | 104 | 1.7% |
| Irish | 185 | 3.0% |
| Italian | 14 | 0.2% |
| Lithuanian | 21 | 0.3% |
| Mexican | 4,996 | 80.5% |
| Norwegian | 28 | 0.4% |
| Portuguese | 9 | 0.2% |
| Puerto Rican | 15 | 0.2% |
| Salvadoran | 33 | 0.5% |
| Scandinavian | 14 | 0.2% |
| Scotch-Irish | 18 | 0.3% |
| Swedish | 10 | 0.2% |
| Yaqui | 26 | 0.4% | View All 23 Rows |
Immigrants in Salton City
The most numerous immigrant groups reported in Salton City came from Central America (1,942 | 31.3%), Latin America (1,942 | 31.3%), Mexico (1,915 | 30.9%), El Salvador (27 | 0.4%), and Asia (6 | 0.1%), together accounting for 94.0% of all Salton City residents.
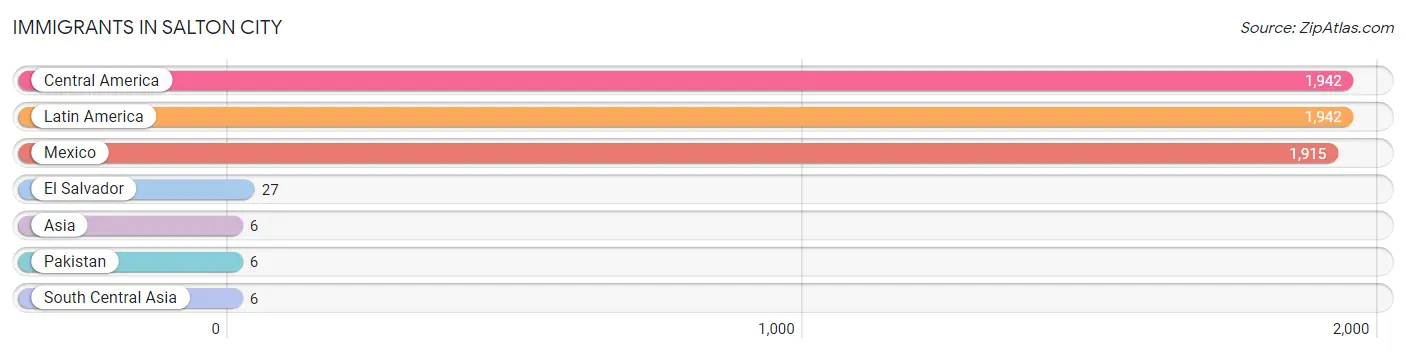
| Immigration Origin | # Population | % Population |
| Asia | 6 | 0.1% |
| Central America | 1,942 | 31.3% |
| El Salvador | 27 | 0.4% |
| Latin America | 1,942 | 31.3% |
| Mexico | 1,915 | 30.9% |
| Pakistan | 6 | 0.1% |
| South Central Asia | 6 | 0.1% | View All 7 Rows |
Sex and Age in Salton City
Sex and Age in Salton City
The most populous age groups in Salton City are 35 to 39 Years (419 | 12.2%) for men and 25 to 29 Years (363 | 13.1%) for women.
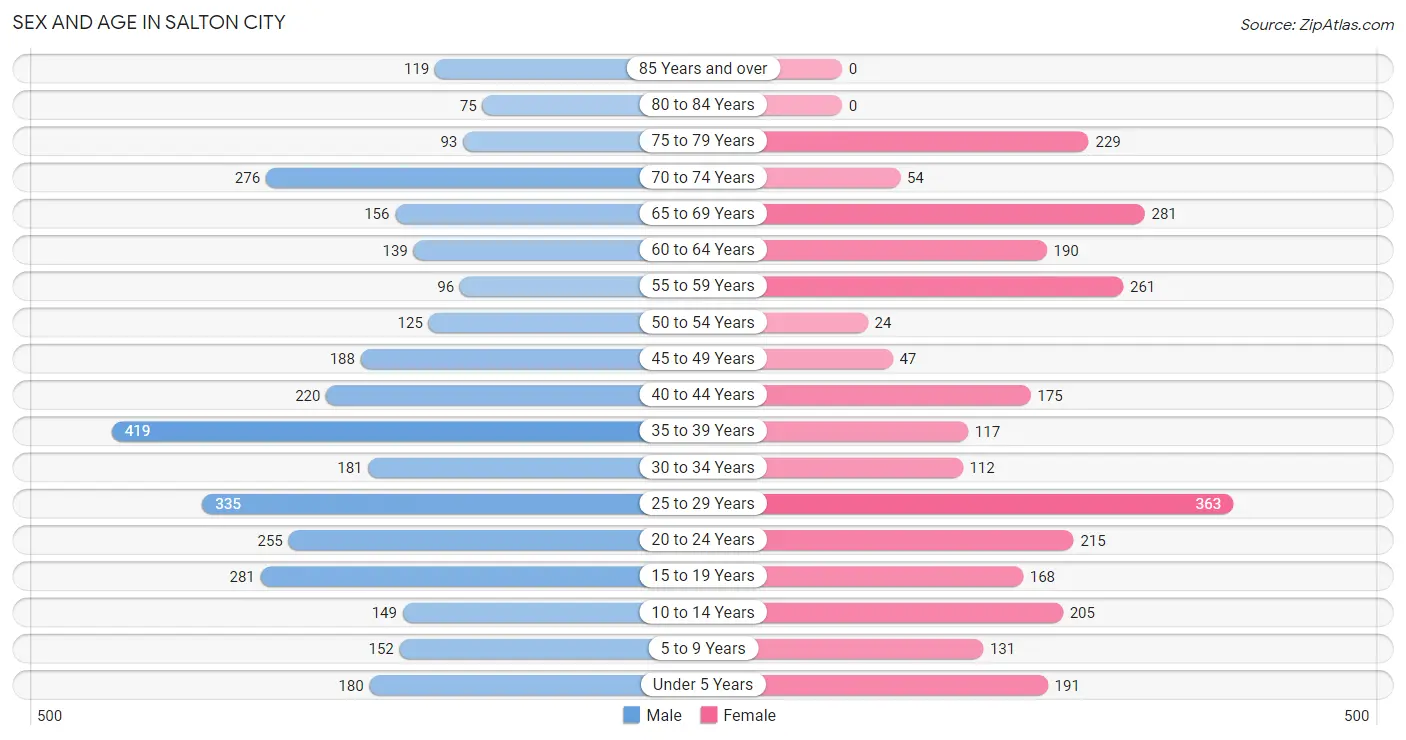
| Age Bracket | Male | Female |
| Under 5 Years | 180 (5.2%) | 191 (6.9%) |
| 5 to 9 Years | 152 (4.4%) | 131 (4.7%) |
| 10 to 14 Years | 149 (4.3%) | 205 (7.4%) |
| 15 to 19 Years | 281 (8.2%) | 168 (6.1%) |
| 20 to 24 Years | 255 (7.4%) | 215 (7.8%) |
| 25 to 29 Years | 335 (9.7%) | 363 (13.1%) |
| 30 to 34 Years | 181 (5.3%) | 112 (4.1%) |
| 35 to 39 Years | 419 (12.2%) | 117 (4.2%) |
| 40 to 44 Years | 220 (6.4%) | 175 (6.3%) |
| 45 to 49 Years | 188 (5.5%) | 47 (1.7%) |
| 50 to 54 Years | 125 (3.6%) | 24 (0.9%) |
| 55 to 59 Years | 96 (2.8%) | 261 (9.5%) |
| 60 to 64 Years | 139 (4.0%) | 190 (6.9%) |
| 65 to 69 Years | 156 (4.5%) | 281 (10.2%) |
| 70 to 74 Years | 276 (8.0%) | 54 (1.9%) |
| 75 to 79 Years | 93 (2.7%) | 229 (8.3%) |
| 80 to 84 Years | 75 (2.2%) | 0 (0.0%) |
| 85 Years and over | 119 (3.5%) | 0 (0.0%) |
| Total | 3,439 (100.0%) | 2,763 (100.0%) |
Families and Households in Salton City
Median Family Size in Salton City
The median family size in Salton City is 4.09 persons per family, with single female/mother families (224 | 18.9%) accounting for the largest median family size of 4.75 persons per family. On the other hand, single male/father families (57 | 4.8%) represent the smallest median family size with 3.44 persons per family.
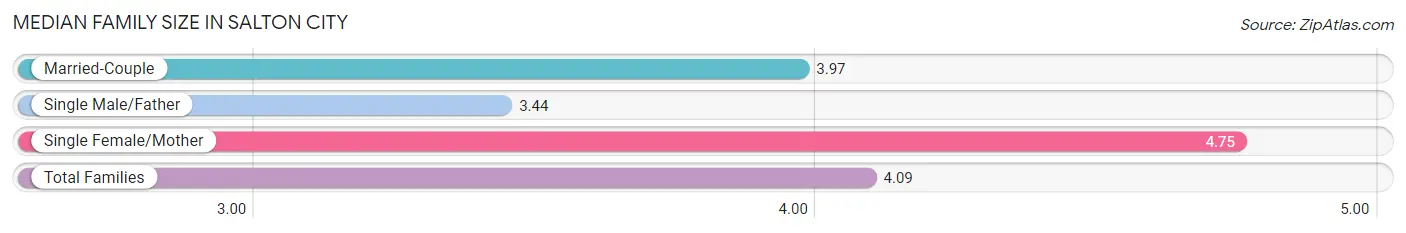
| Family Type | # Families | Family Size |
| Married-Couple | 906 (76.3%) | 3.97 |
| Single Male/Father | 57 (4.8%) | 3.44 |
| Single Female/Mother | 224 (18.9%) | 4.75 |
| Total Families | 1,187 (100.0%) | 4.09 |
Median Household Size in Salton City
The median household size in Salton City is 2.62 persons per household, with single female/mother households (224 | 9.5%) accounting for the largest median household size of 5.27 persons per household. non-family households (1,181 | 49.9%) represent the smallest median household size with 1.04 persons per household.
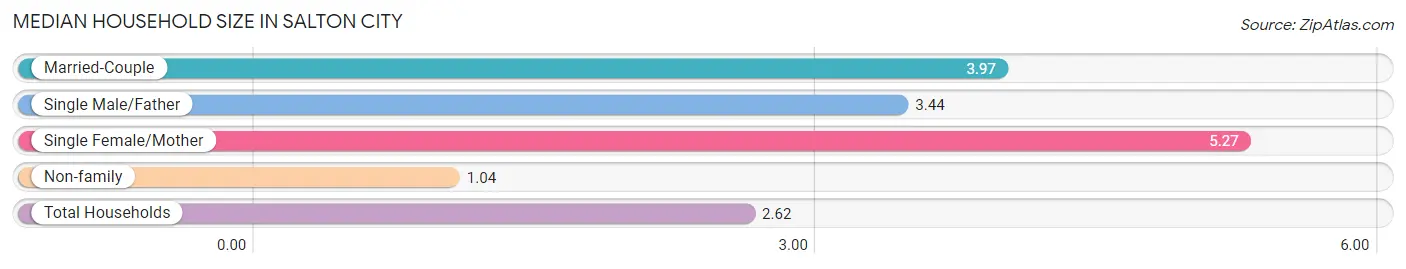
| Household Type | # Households | Household Size |
| Married-Couple | 906 (38.3%) | 3.97 |
| Single Male/Father | 57 (2.4%) | 3.44 |
| Single Female/Mother | 224 (9.5%) | 5.27 |
| Non-family | 1,181 (49.9%) | 1.04 |
| Total Households | 2,368 (100.0%) | 2.62 |
Household Size by Marriage Status in Salton City
Out of a total of 2,368 households in Salton City, 1,187 (50.1%) are family households, while 1,181 (49.9%) are nonfamily households. The most numerous type of family households are 2-person households, comprising 542, and the most common type of nonfamily households are 1-person households, comprising 1,147.
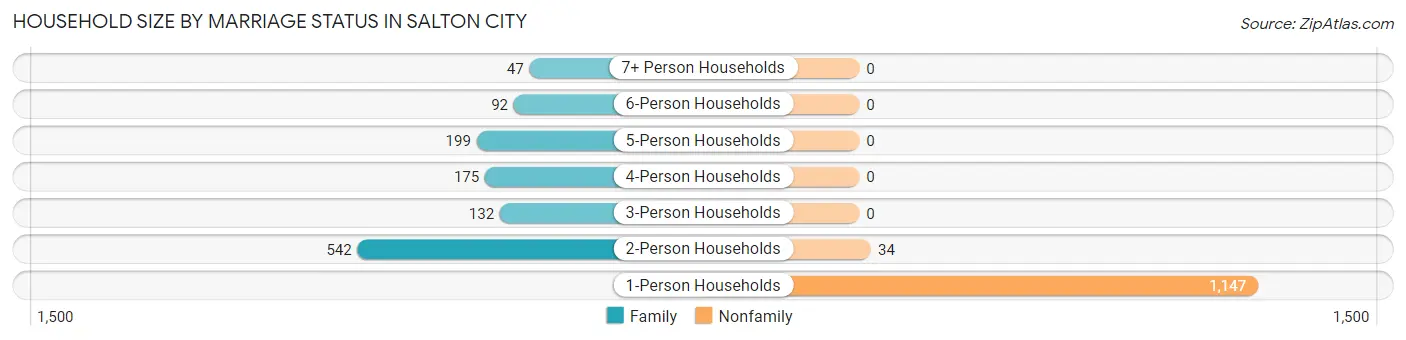
| Household Size | Family Households | Nonfamily Households |
| 1-Person Households | - | 1,147 (48.4%) |
| 2-Person Households | 542 (22.9%) | 34 (1.4%) |
| 3-Person Households | 132 (5.6%) | 0 (0.0%) |
| 4-Person Households | 175 (7.4%) | 0 (0.0%) |
| 5-Person Households | 199 (8.4%) | 0 (0.0%) |
| 6-Person Households | 92 (3.9%) | 0 (0.0%) |
| 7+ Person Households | 47 (2.0%) | 0 (0.0%) |
| Total | 1,187 (50.1%) | 1,181 (49.9%) |
Female Fertility in Salton City
Fertility by Age in Salton City
Average fertility rate in Salton City is 27.0 births per 1,000 women. Women in the age bracket of 20 to 34 years have the highest fertility rate with 46.0 births per 1,000 women. Women in the age bracket of 20 to 34 years acount for 100.0% of all women with births.
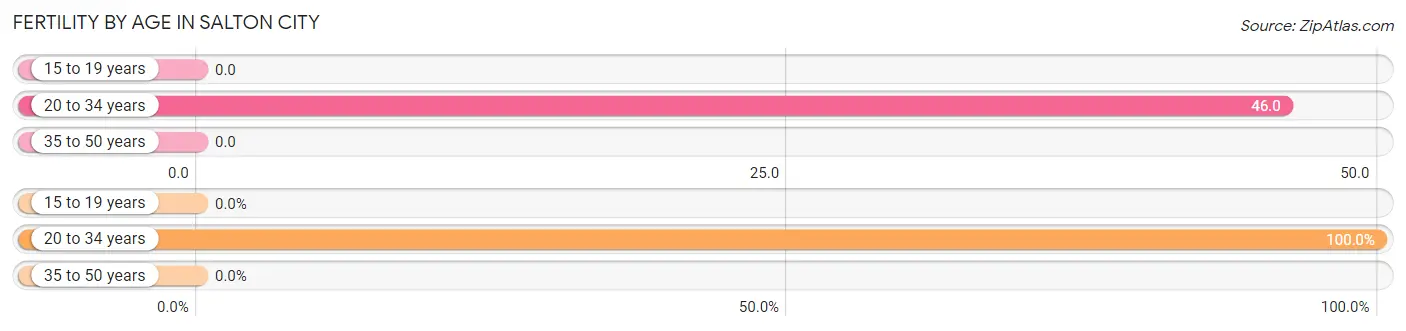
| Age Bracket | Women with Births | Births / 1,000 Women |
| 15 to 19 years | 0 (0.0%) | 0.0 |
| 20 to 34 years | 32 (100.0%) | 46.0 |
| 35 to 50 years | 0 (0.0%) | 0.0 |
| Total | 32 (100.0%) | 27.0 |
Fertility by Age by Marriage Status in Salton City
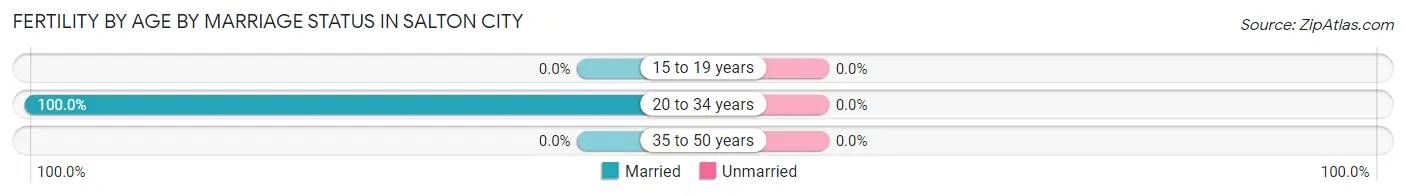
| Age Bracket | Married | Unmarried |
| 15 to 19 years | 0 (0.0%) | 0 (0.0%) |
| 20 to 34 years | 32 (100.0%) | 0 (0.0%) |
| 35 to 50 years | 0 (0.0%) | 0 (0.0%) |
| Total | 32 (100.0%) | 0 (0.0%) |
Fertility by Education in Salton City
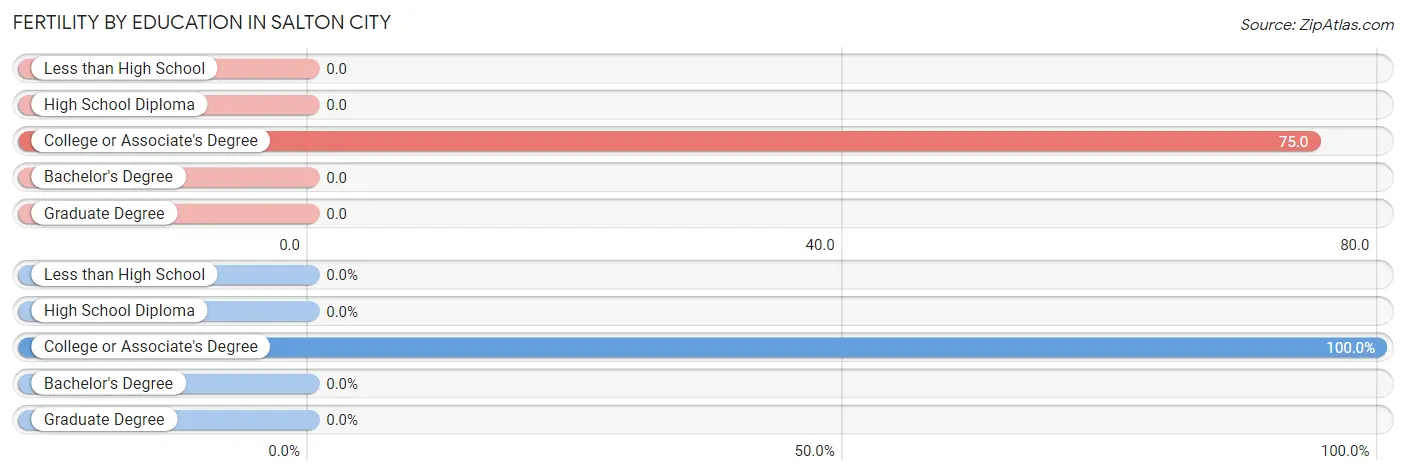
| Educational Attainment | Women with Births | Births / 1,000 Women |
| Less than High School | 0 (0.0%) | 0.0 |
| High School Diploma | 0 (0.0%) | 0.0 |
| College or Associate's Degree | 32 (100.0%) | 75.0 |
| Bachelor's Degree | 0 (0.0%) | 0.0 |
| Graduate Degree | 0 (0.0%) | 0.0 |
| Total | 32 (100.0%) | 27.0 |
Fertility by Education by Marriage Status in Salton City
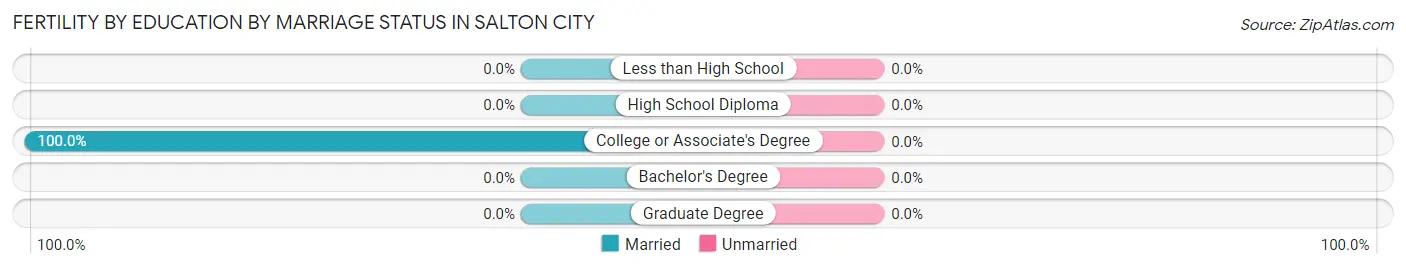
| Educational Attainment | Married | Unmarried |
| Less than High School | 0 (0.0%) | 0 (0.0%) |
| High School Diploma | 0 (0.0%) | 0 (0.0%) |
| College or Associate's Degree | 32 (100.0%) | 0 (0.0%) |
| Bachelor's Degree | 0 (0.0%) | 0 (0.0%) |
| Graduate Degree | 0 (0.0%) | 0 (0.0%) |
| Total | 32 (100.0%) | 0 (0.0%) |
Employment Characteristics in Salton City
Employment by Class of Employer in Salton City
Among the 2,099 employed individuals in Salton City, private company employees (1,833 | 87.3%), local government employees (122 | 5.8%), and state government employees (54 | 2.6%) make up the most common classes of employment.
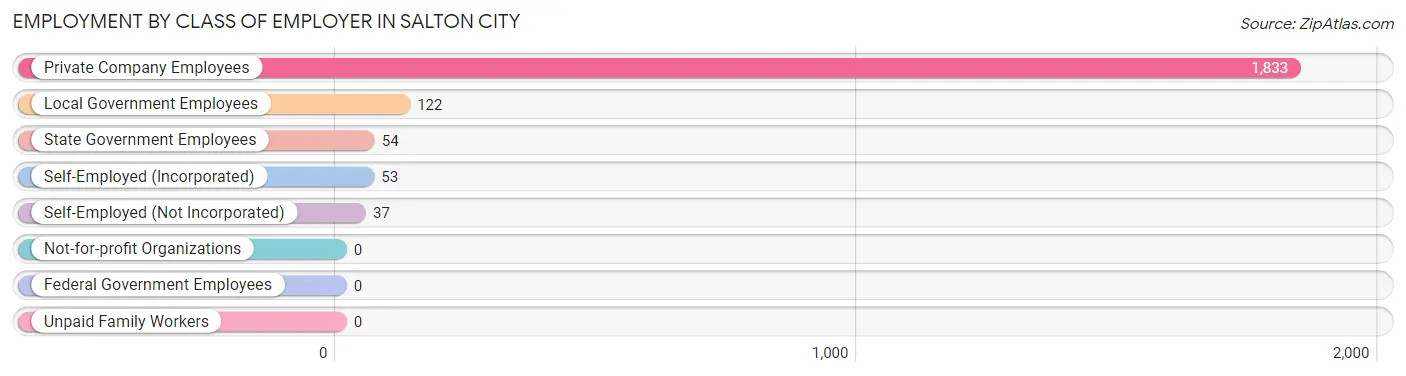
| Employer Class | # Employees | % Employees |
| Private Company Employees | 1,833 | 87.3% |
| Self-Employed (Incorporated) | 53 | 2.5% |
| Self-Employed (Not Incorporated) | 37 | 1.8% |
| Not-for-profit Organizations | 0 | 0.0% |
| Local Government Employees | 122 | 5.8% |
| State Government Employees | 54 | 2.6% |
| Federal Government Employees | 0 | 0.0% |
| Unpaid Family Workers | 0 | 0.0% |
| Total | 2,099 | 100.0% |
Employment Status by Age in Salton City
According to the labor force statistics for Salton City, out of the total population over 16 years of age (5,150), 46.0% or 2,369 individuals are in the labor force, with 10.1% or 239 of them unemployed. The age group with the highest labor force participation rate is 30 to 34 years, with 100.0% or 293 individuals in the labor force. Within the labor force, the 75 years and over age range has the highest percentage of unemployed individuals, with 100.0% or 7 of them being unemployed.
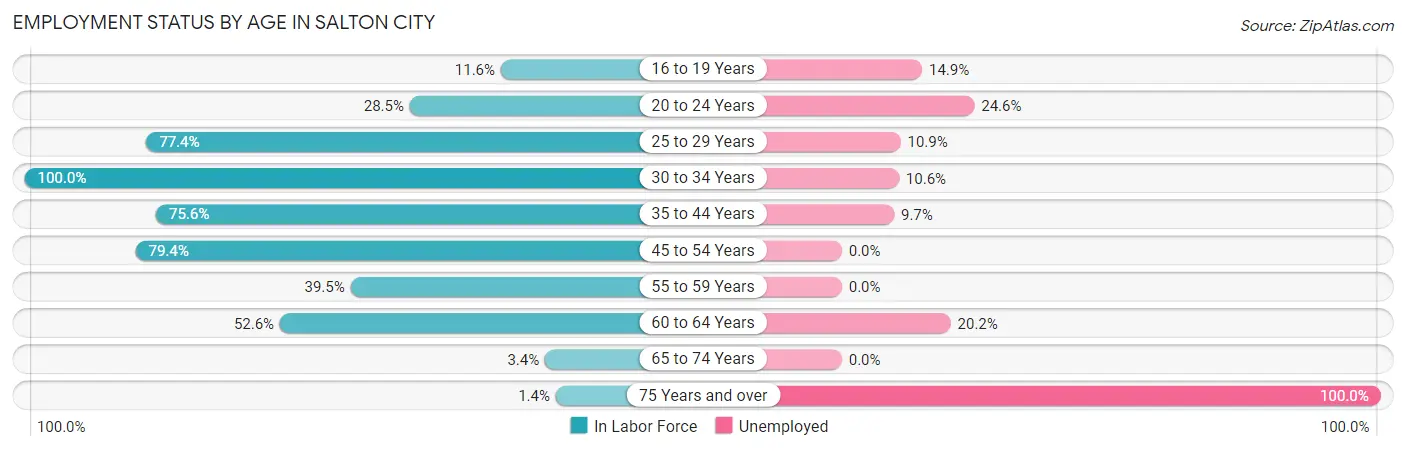
| Age Bracket | In Labor Force | Unemployed |
| 16 to 19 Years | 47 (11.6%) | 7 (14.9%) |
| 20 to 24 Years | 134 (28.5%) | 33 (24.6%) |
| 25 to 29 Years | 540 (77.4%) | 59 (10.9%) |
| 30 to 34 Years | 293 (100.0%) | 31 (10.6%) |
| 35 to 44 Years | 704 (75.6%) | 68 (9.7%) |
| 45 to 54 Years | 305 (79.4%) | 0 (0.0%) |
| 55 to 59 Years | 141 (39.5%) | 0 (0.0%) |
| 60 to 64 Years | 173 (52.6%) | 35 (20.2%) |
| 65 to 74 Years | 26 (3.4%) | 0 (0.0%) |
| 75 Years and over | 7 (1.4%) | 7 (100.0%) |
| Total | 2,369 (46.0%) | 239 (10.1%) |
Employment Status by Educational Attainment in Salton City
According to labor force statistics for Salton City, 72.1% of individuals (2,157) out of the total population between 25 and 64 years of age (2,992) are in the labor force, with 9.0% or 194 of them being unemployed. The group with the highest labor force participation rate are those with the educational attainment of bachelor's degree or higher, with 86.8% or 171 individuals in the labor force. Within the labor force, individuals with high school diploma education have the highest percentage of unemployment, with 12.1% or 124 of them being unemployed.
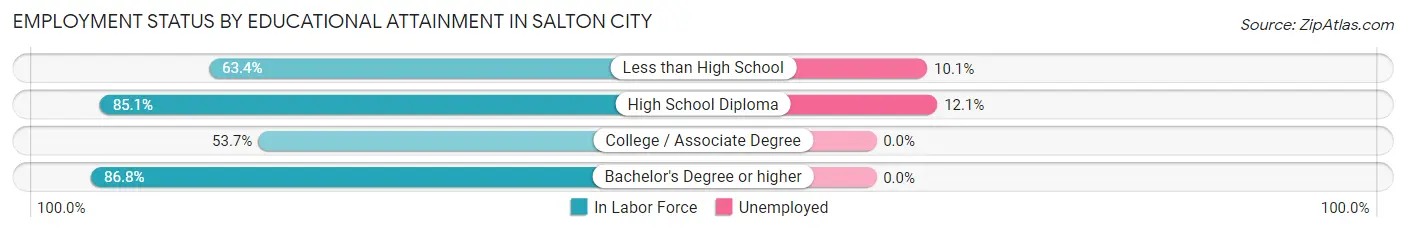
| Educational Attainment | In Labor Force | Unemployed |
| Less than High School | 685 (63.4%) | 109 (10.1%) |
| High School Diploma | 1,025 (85.1%) | 146 (12.1%) |
| College / Associate Degree | 274 (53.7%) | 0 (0.0%) |
| Bachelor's Degree or higher | 171 (86.8%) | 0 (0.0%) |
| Total | 2,157 (72.1%) | 269 (9.0%) |
Employment Occupations by Sex in Salton City
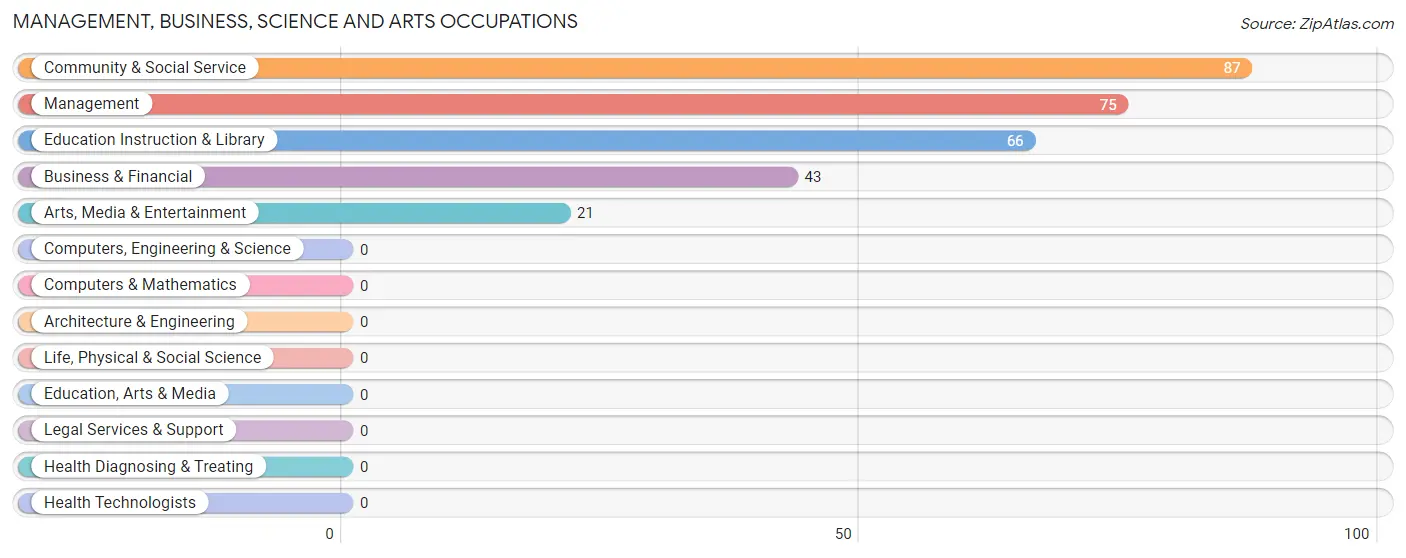
Management, Business, Science and Arts Occupations
The most common Management, Business, Science and Arts occupations in Salton City are Community & Social Service (87 | 4.1%), Management (75 | 3.5%), Education Instruction & Library (66 | 3.1%), Business & Financial (43 | 2.0%), and Arts, Media & Entertainment (21 | 1.0%).
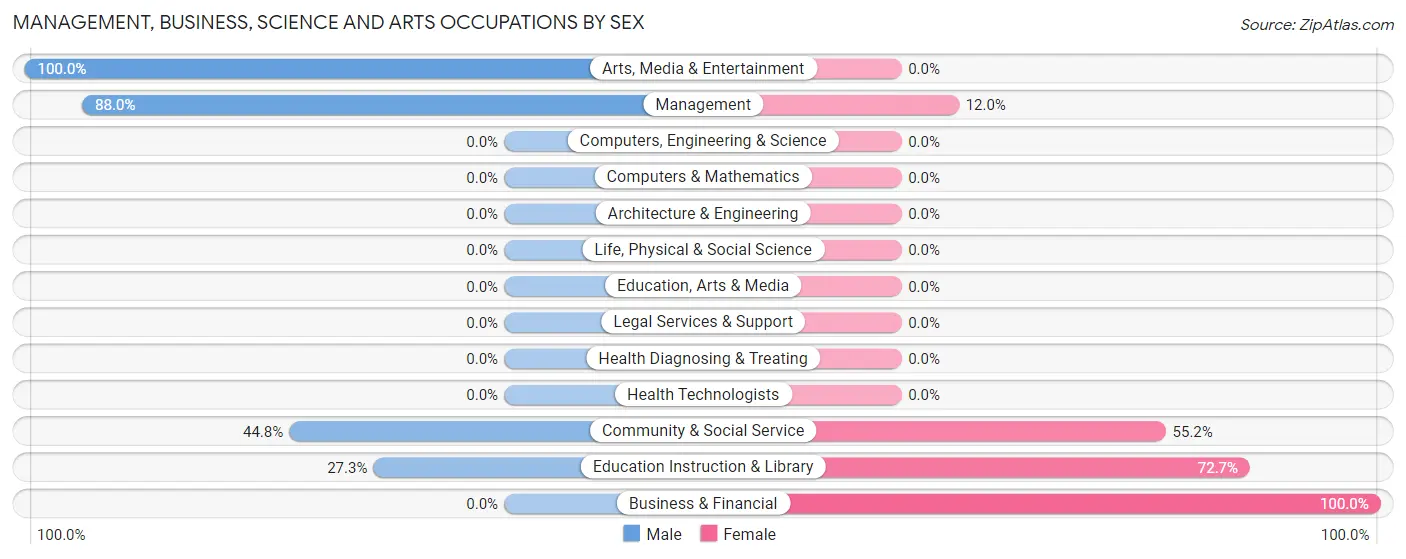
Management, Business, Science and Arts Occupations by Sex
Within the Management, Business, Science and Arts occupations in Salton City, the most male-oriented occupations are Arts, Media & Entertainment (100.0%), Management (88.0%), and Community & Social Service (44.8%), while the most female-oriented occupations are Business & Financial (100.0%), Education Instruction & Library (72.7%), and Community & Social Service (55.2%).
| Occupation | Male | Female |
| Management | 66 (88.0%) | 9 (12.0%) |
| Business & Financial | 0 (0.0%) | 43 (100.0%) |
| Computers, Engineering & Science | 0 (0.0%) | 0 (0.0%) |
| Computers & Mathematics | 0 (0.0%) | 0 (0.0%) |
| Architecture & Engineering | 0 (0.0%) | 0 (0.0%) |
| Life, Physical & Social Science | 0 (0.0%) | 0 (0.0%) |
| Community & Social Service | 39 (44.8%) | 48 (55.2%) |
| Education, Arts & Media | 0 (0.0%) | 0 (0.0%) |
| Legal Services & Support | 0 (0.0%) | 0 (0.0%) |
| Education Instruction & Library | 18 (27.3%) | 48 (72.7%) |
| Arts, Media & Entertainment | 21 (100.0%) | 0 (0.0%) |
| Health Diagnosing & Treating | 0 (0.0%) | 0 (0.0%) |
| Health Technologists | 0 (0.0%) | 0 (0.0%) |
| Total (Category) | 105 (51.2%) | 100 (48.8%) |
| Total (Overall) | 1,518 (71.3%) | 612 (28.7%) |
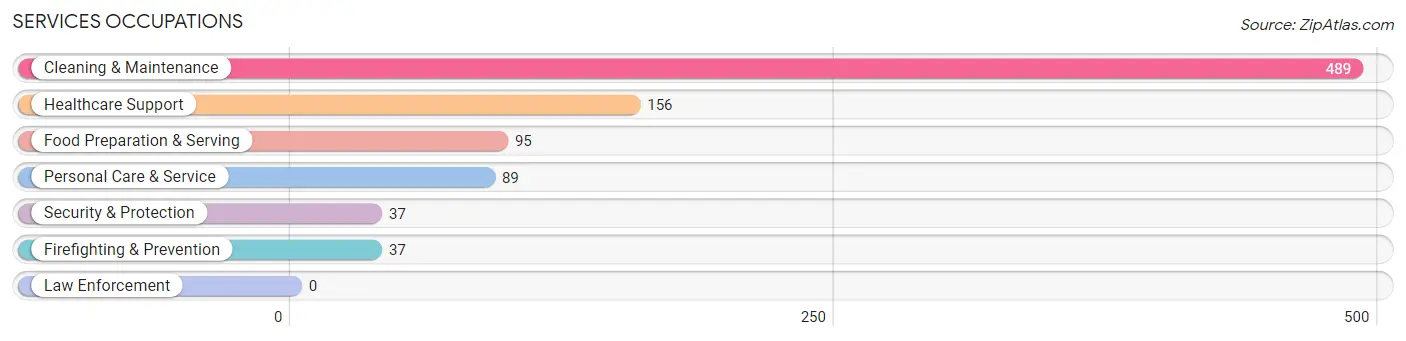
Services Occupations
The most common Services occupations in Salton City are Cleaning & Maintenance (489 | 23.0%), Healthcare Support (156 | 7.3%), Food Preparation & Serving (95 | 4.5%), Personal Care & Service (89 | 4.2%), and Security & Protection (37 | 1.7%).
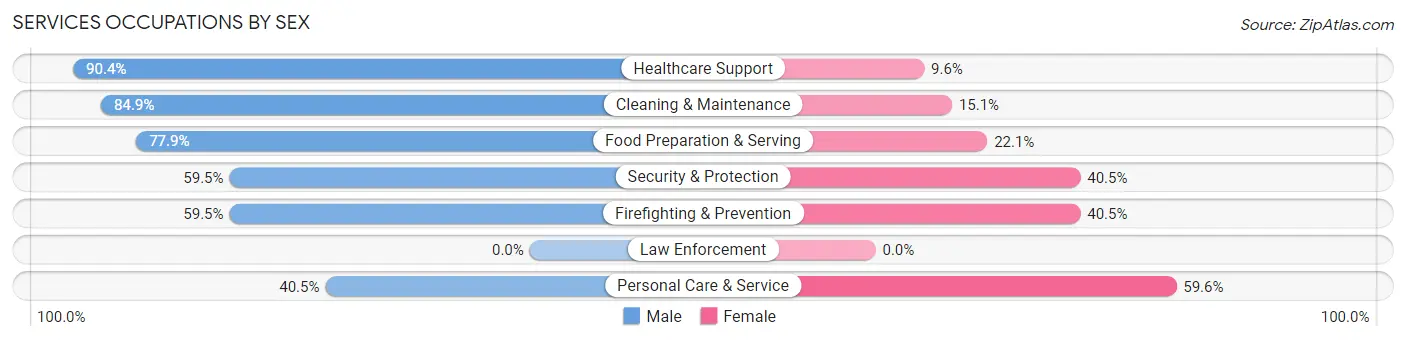
Services Occupations by Sex
Within the Services occupations in Salton City, the most male-oriented occupations are Healthcare Support (90.4%), Cleaning & Maintenance (84.9%), and Food Preparation & Serving (77.9%), while the most female-oriented occupations are Personal Care & Service (59.6%), Security & Protection (40.5%), and Firefighting & Prevention (40.5%).
| Occupation | Male | Female |
| Healthcare Support | 141 (90.4%) | 15 (9.6%) |
| Security & Protection | 22 (59.5%) | 15 (40.5%) |
| Firefighting & Prevention | 22 (59.5%) | 15 (40.5%) |
| Law Enforcement | 0 (0.0%) | 0 (0.0%) |
| Food Preparation & Serving | 74 (77.9%) | 21 (22.1%) |
| Cleaning & Maintenance | 415 (84.9%) | 74 (15.1%) |
| Personal Care & Service | 36 (40.5%) | 53 (59.6%) |
| Total (Category) | 688 (79.4%) | 178 (20.5%) |
| Total (Overall) | 1,518 (71.3%) | 612 (28.7%) |
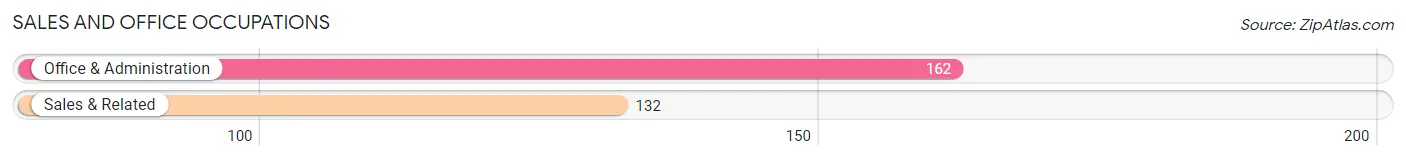
Sales and Office Occupations
The most common Sales and Office occupations in Salton City are Office & Administration (162 | 7.6%), and Sales & Related (132 | 6.2%).
Sales and Office Occupations by Sex
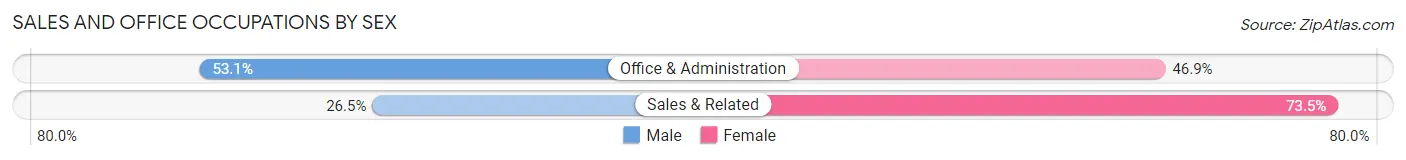
| Occupation | Male | Female |
| Sales & Related | 35 (26.5%) | 97 (73.5%) |
| Office & Administration | 86 (53.1%) | 76 (46.9%) |
| Total (Category) | 121 (41.2%) | 173 (58.8%) |
| Total (Overall) | 1,518 (71.3%) | 612 (28.7%) |
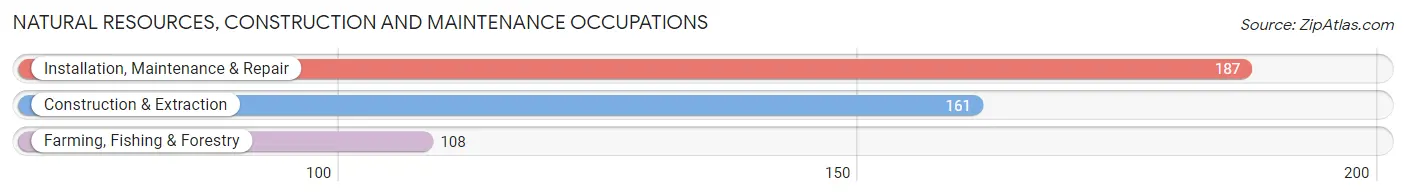
Natural Resources, Construction and Maintenance Occupations
The most common Natural Resources, Construction and Maintenance occupations in Salton City are Installation, Maintenance & Repair (187 | 8.8%), Construction & Extraction (161 | 7.6%), and Farming, Fishing & Forestry (108 | 5.1%).
Natural Resources, Construction and Maintenance Occupations by Sex
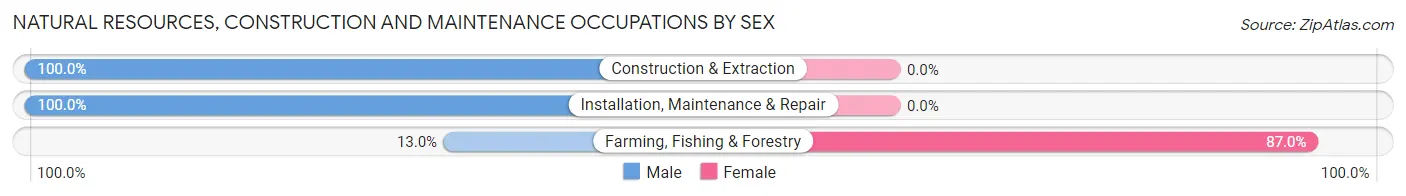
| Occupation | Male | Female |
| Farming, Fishing & Forestry | 14 (13.0%) | 94 (87.0%) |
| Construction & Extraction | 161 (100.0%) | 0 (0.0%) |
| Installation, Maintenance & Repair | 187 (100.0%) | 0 (0.0%) |
| Total (Category) | 362 (79.4%) | 94 (20.6%) |
| Total (Overall) | 1,518 (71.3%) | 612 (28.7%) |
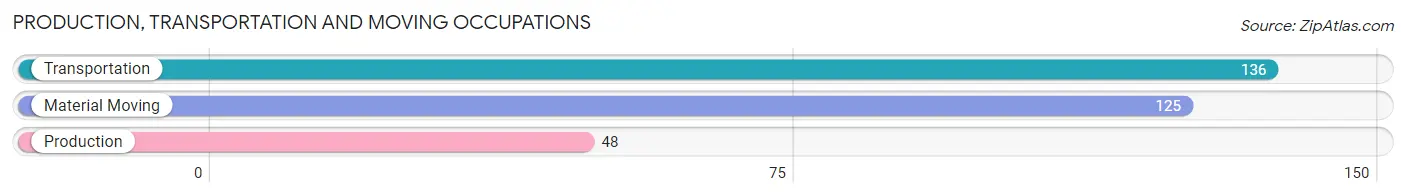
Production, Transportation and Moving Occupations
The most common Production, Transportation and Moving occupations in Salton City are Transportation (136 | 6.4%), Material Moving (125 | 5.9%), and Production (48 | 2.2%).
Production, Transportation and Moving Occupations by Sex
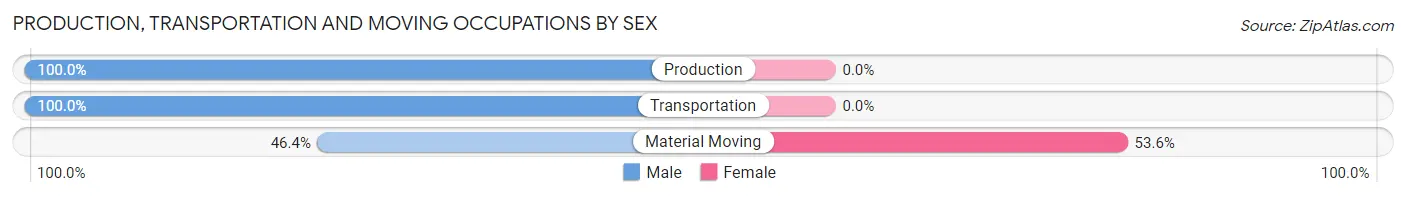
| Occupation | Male | Female |
| Production | 48 (100.0%) | 0 (0.0%) |
| Transportation | 136 (100.0%) | 0 (0.0%) |
| Material Moving | 58 (46.4%) | 67 (53.6%) |
| Total (Category) | 242 (78.3%) | 67 (21.7%) |
| Total (Overall) | 1,518 (71.3%) | 612 (28.7%) |
Employment Industries by Sex in Salton City
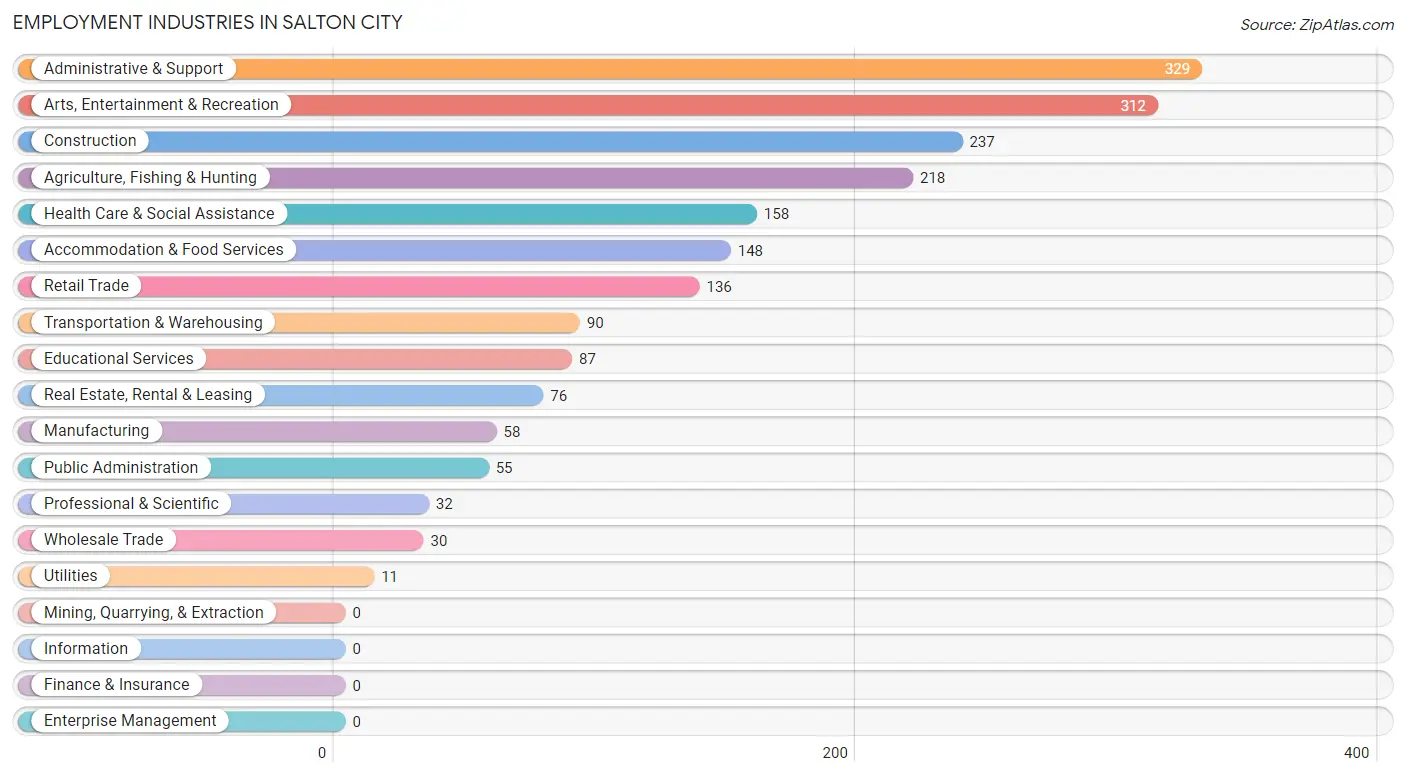
Employment Industries in Salton City
The major employment industries in Salton City include Administrative & Support (329 | 15.4%), Arts, Entertainment & Recreation (312 | 14.6%), Construction (237 | 11.1%), Agriculture, Fishing & Hunting (218 | 10.2%), and Health Care & Social Assistance (158 | 7.4%).
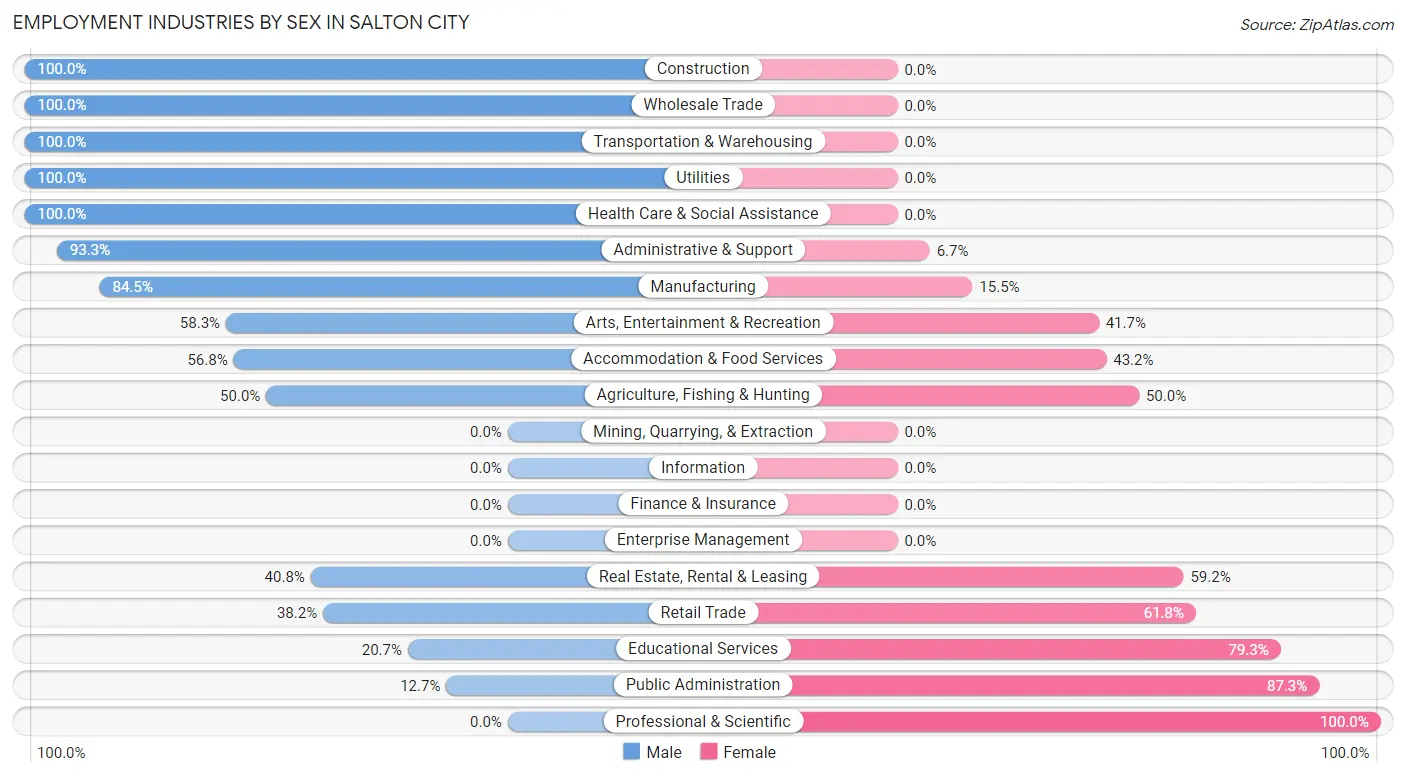
Employment Industries by Sex in Salton City
The Salton City industries that see more men than women are Construction (100.0%), Wholesale Trade (100.0%), and Transportation & Warehousing (100.0%), whereas the industries that tend to have a higher number of women are Professional & Scientific (100.0%), Public Administration (87.3%), and Educational Services (79.3%).
| Industry | Male | Female |
| Agriculture, Fishing & Hunting | 109 (50.0%) | 109 (50.0%) |
| Mining, Quarrying, & Extraction | 0 (0.0%) | 0 (0.0%) |
| Construction | 237 (100.0%) | 0 (0.0%) |
| Manufacturing | 49 (84.5%) | 9 (15.5%) |
| Wholesale Trade | 30 (100.0%) | 0 (0.0%) |
| Retail Trade | 52 (38.2%) | 84 (61.8%) |
| Transportation & Warehousing | 90 (100.0%) | 0 (0.0%) |
| Utilities | 11 (100.0%) | 0 (0.0%) |
| Information | 0 (0.0%) | 0 (0.0%) |
| Finance & Insurance | 0 (0.0%) | 0 (0.0%) |
| Real Estate, Rental & Leasing | 31 (40.8%) | 45 (59.2%) |
| Professional & Scientific | 0 (0.0%) | 32 (100.0%) |
| Enterprise Management | 0 (0.0%) | 0 (0.0%) |
| Administrative & Support | 307 (93.3%) | 22 (6.7%) |
| Educational Services | 18 (20.7%) | 69 (79.3%) |
| Health Care & Social Assistance | 158 (100.0%) | 0 (0.0%) |
| Arts, Entertainment & Recreation | 182 (58.3%) | 130 (41.7%) |
| Accommodation & Food Services | 84 (56.8%) | 64 (43.2%) |
| Public Administration | 7 (12.7%) | 48 (87.3%) |
| Total | 1,518 (71.3%) | 612 (28.7%) |
Education in Salton City
School Enrollment in Salton City
The most common levels of schooling among the 1,265 students in Salton City are high school (464 | 36.7%), college / undergraduate (306 | 24.2%), and elementary school (246 | 19.5%).
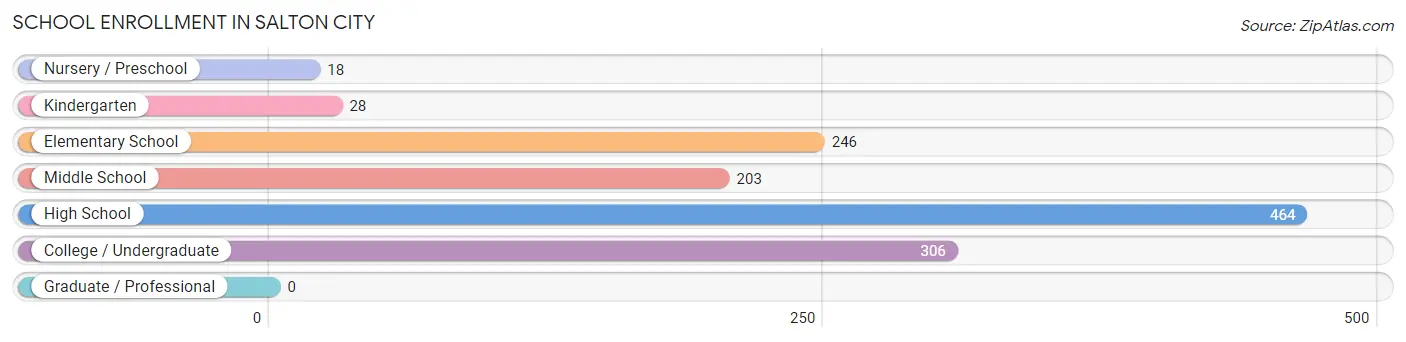
| School Level | # Students | % Students |
| Nursery / Preschool | 18 | 1.4% |
| Kindergarten | 28 | 2.2% |
| Elementary School | 246 | 19.5% |
| Middle School | 203 | 16.1% |
| High School | 464 | 36.7% |
| College / Undergraduate | 306 | 24.2% |
| Graduate / Professional | 0 | 0.0% |
| Total | 1,265 | 100.0% |
School Enrollment by Age by Funding Source in Salton City
Out of a total of 1,265 students who are enrolled in schools in Salton City, 61 (4.8%) attend a private institution, while the remaining 1,204 (95.2%) are enrolled in public schools. The age group of 5 to 9 year old has the highest likelihood of being enrolled in private schools, with 29 (11.0% in the age bracket) enrolled. Conversely, the age group of 15 to 17 year olds has the lowest likelihood of being enrolled in a private school, with 275 (100.0% in the age bracket) attending a public institution.
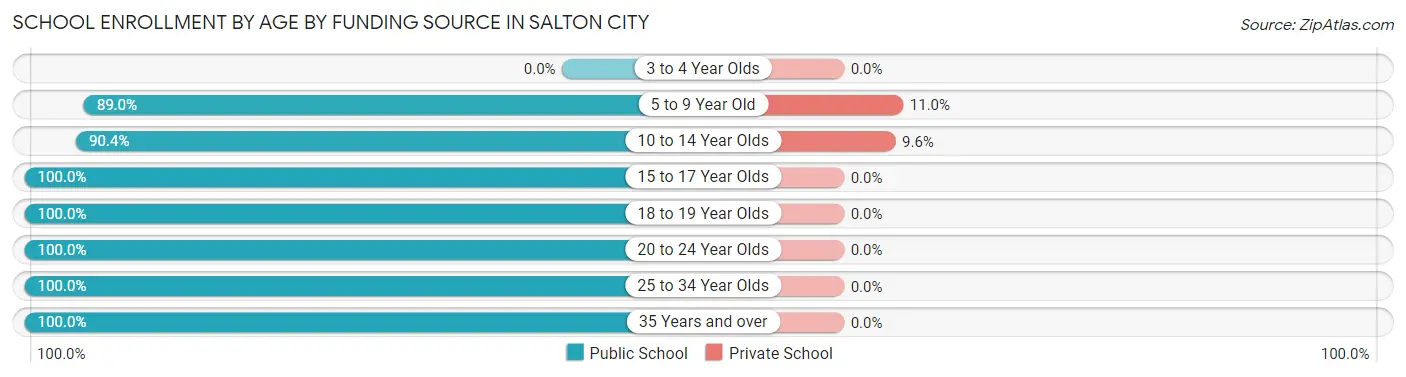
| Age Bracket | Public School | Private School |
| 3 to 4 Year Olds | 0 (0.0%) | 0 (0.0%) |
| 5 to 9 Year Old | 234 (89.0%) | 29 (11.0%) |
| 10 to 14 Year Olds | 302 (90.4%) | 32 (9.6%) |
| 15 to 17 Year Olds | 275 (100.0%) | 0 (0.0%) |
| 18 to 19 Year Olds | 102 (100.0%) | 0 (0.0%) |
| 20 to 24 Year Olds | 40 (100.0%) | 0 (0.0%) |
| 25 to 34 Year Olds | 187 (100.0%) | 0 (0.0%) |
| 35 Years and over | 64 (100.0%) | 0 (0.0%) |
| Total | 1,204 (95.2%) | 61 (4.8%) |
Educational Attainment by Field of Study in Salton City
Psychology (124 | 50.4%), engineering (24 | 9.8%), bio, nature & agricultural (23 | 9.3%), arts & humanities (22 | 8.9%), and social sciences (17 | 6.9%) are the most common fields of study among 246 individuals in Salton City who have obtained a bachelor's degree or higher.
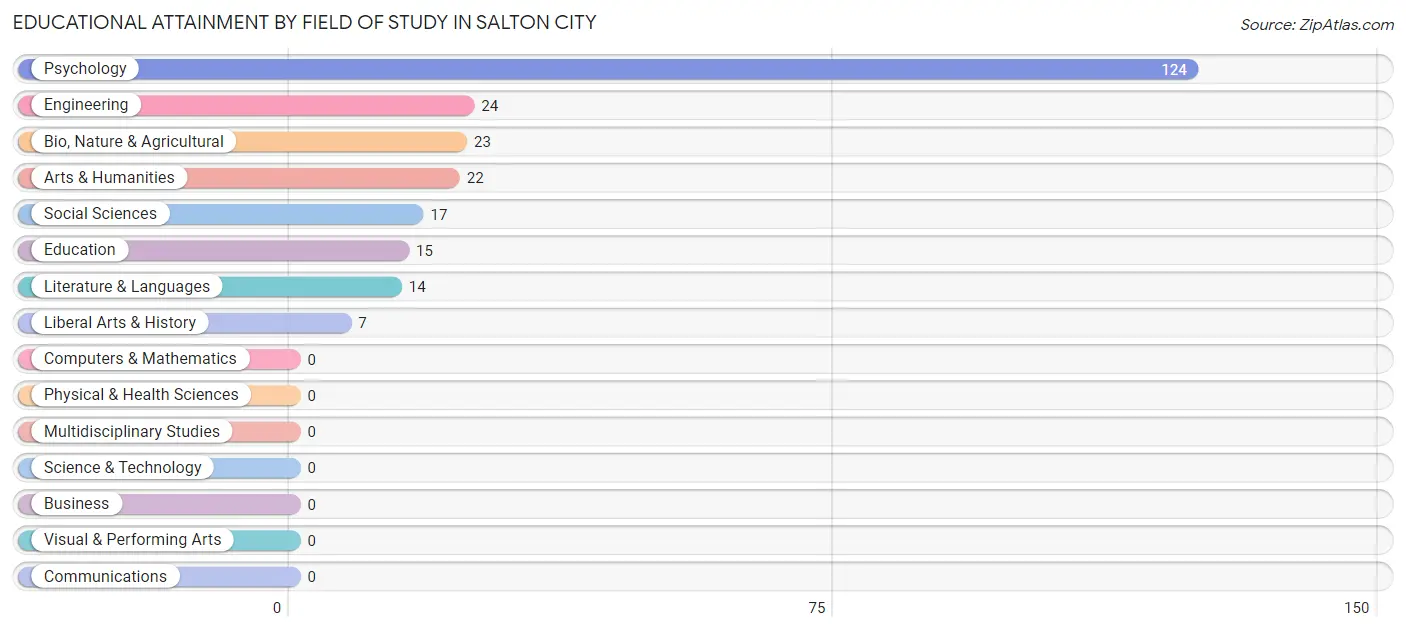
| Field of Study | # Graduates | % Graduates |
| Computers & Mathematics | 0 | 0.0% |
| Bio, Nature & Agricultural | 23 | 9.3% |
| Physical & Health Sciences | 0 | 0.0% |
| Psychology | 124 | 50.4% |
| Social Sciences | 17 | 6.9% |
| Engineering | 24 | 9.8% |
| Multidisciplinary Studies | 0 | 0.0% |
| Science & Technology | 0 | 0.0% |
| Business | 0 | 0.0% |
| Education | 15 | 6.1% |
| Literature & Languages | 14 | 5.7% |
| Liberal Arts & History | 7 | 2.9% |
| Visual & Performing Arts | 0 | 0.0% |
| Communications | 0 | 0.0% |
| Arts & Humanities | 22 | 8.9% |
| Total | 246 | 100.0% |
Transportation & Commute in Salton City
Vehicle Availability by Sex in Salton City
The most prevalent vehicle ownership categories in Salton City are males with 2 vehicles (484, accounting for 32.6%) and females with 2 vehicles (219, making up 79.1%).
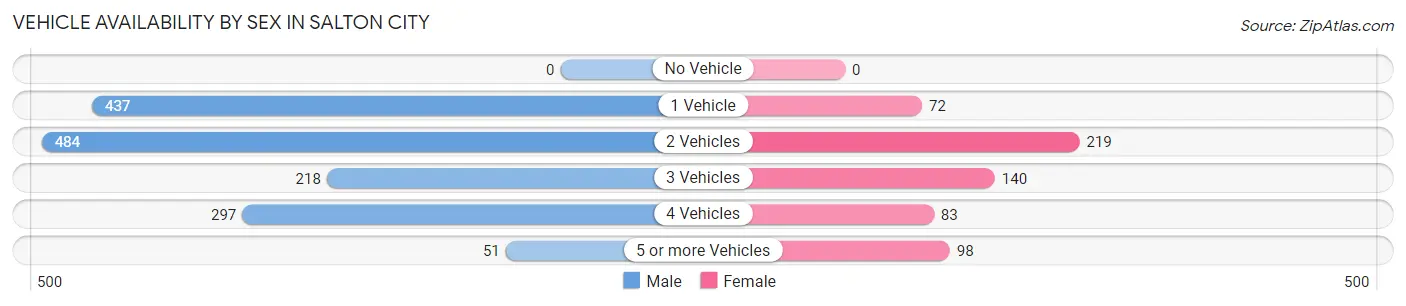
| Vehicles Available | Male | Female |
| No Vehicle | 0 (0.0%) | 0 (0.0%) |
| 1 Vehicle | 437 (29.4%) | 72 (11.8%) |
| 2 Vehicles | 484 (32.6%) | 219 (35.8%) |
| 3 Vehicles | 218 (14.7%) | 140 (22.9%) |
| 4 Vehicles | 297 (20.0%) | 83 (13.6%) |
| 5 or more Vehicles | 51 (3.4%) | 98 (16.0%) |
| Total | 1,487 (100.0%) | 612 (100.0%) |
Commute Time in Salton City
The most frequently occuring commute durations in Salton City are 40 to 44 minutes (469 commuters, 22.9%), 20 to 24 minutes (384 commuters, 18.8%), and 45 to 59 minutes (292 commuters, 14.3%).
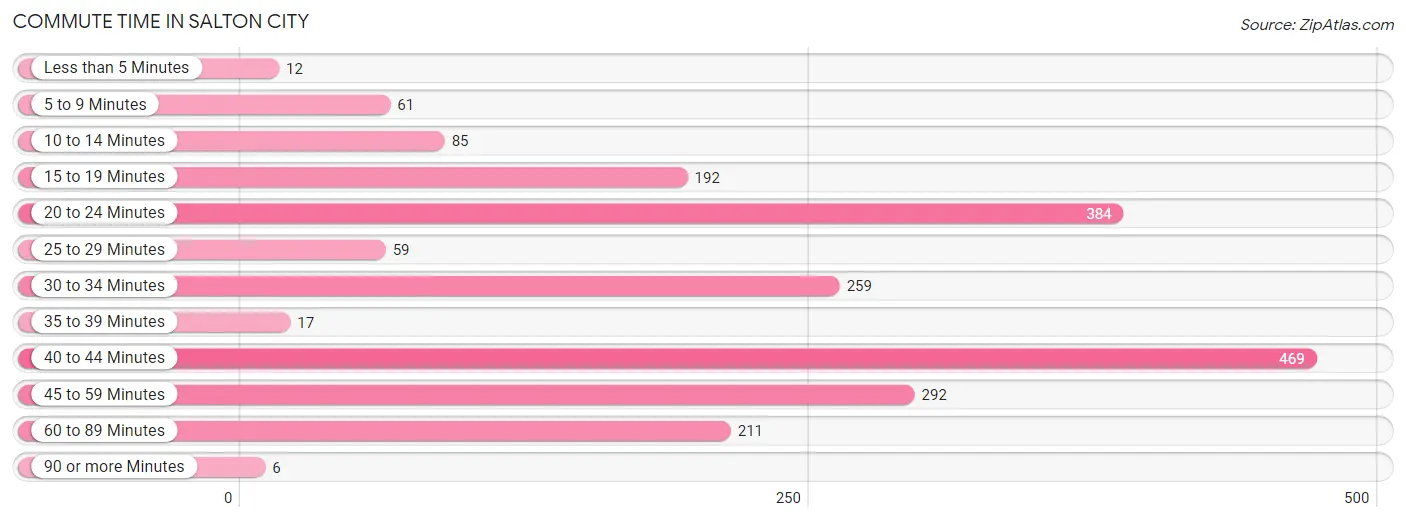
| Commute Time | # Commuters | % Commuters |
| Less than 5 Minutes | 12 | 0.6% |
| 5 to 9 Minutes | 61 | 3.0% |
| 10 to 14 Minutes | 85 | 4.2% |
| 15 to 19 Minutes | 192 | 9.4% |
| 20 to 24 Minutes | 384 | 18.8% |
| 25 to 29 Minutes | 59 | 2.9% |
| 30 to 34 Minutes | 259 | 12.7% |
| 35 to 39 Minutes | 17 | 0.8% |
| 40 to 44 Minutes | 469 | 22.9% |
| 45 to 59 Minutes | 292 | 14.3% |
| 60 to 89 Minutes | 211 | 10.3% |
| 90 or more Minutes | 6 | 0.3% |
Commute Time by Sex in Salton City
The most common commute times in Salton City are 20 to 24 minutes (300 commuters, 20.7%) for males and 40 to 44 minutes (205 commuters, 34.1%) for females.
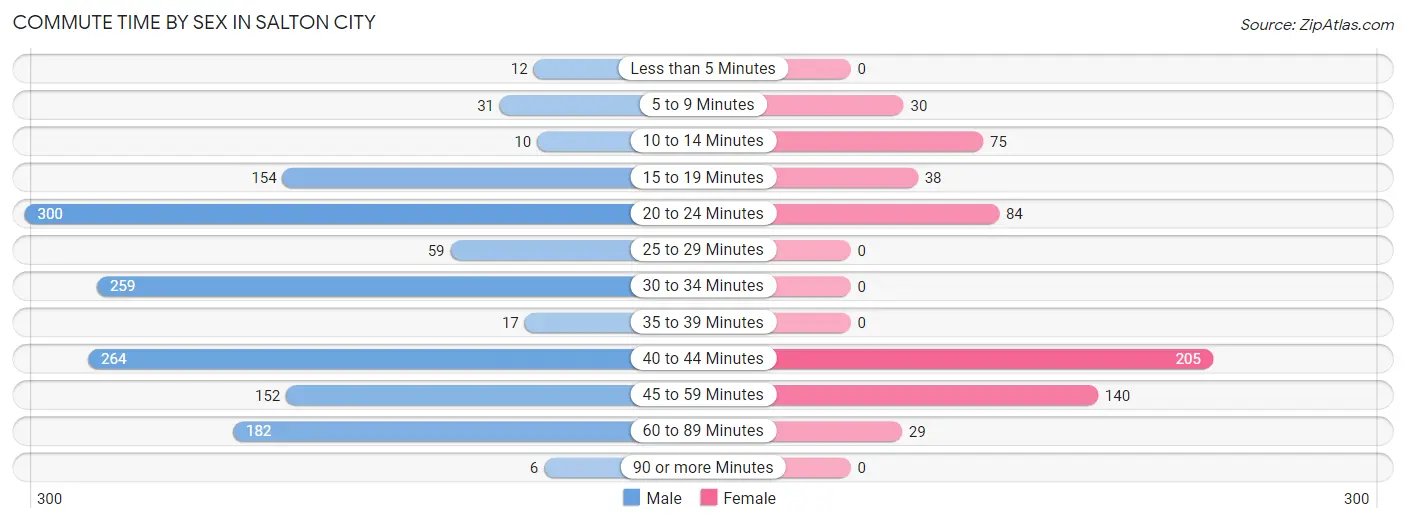
| Commute Time | Male | Female |
| Less than 5 Minutes | 12 (0.8%) | 0 (0.0%) |
| 5 to 9 Minutes | 31 (2.1%) | 30 (5.0%) |
| 10 to 14 Minutes | 10 (0.7%) | 75 (12.5%) |
| 15 to 19 Minutes | 154 (10.6%) | 38 (6.3%) |
| 20 to 24 Minutes | 300 (20.7%) | 84 (14.0%) |
| 25 to 29 Minutes | 59 (4.1%) | 0 (0.0%) |
| 30 to 34 Minutes | 259 (17.9%) | 0 (0.0%) |
| 35 to 39 Minutes | 17 (1.2%) | 0 (0.0%) |
| 40 to 44 Minutes | 264 (18.3%) | 205 (34.1%) |
| 45 to 59 Minutes | 152 (10.5%) | 140 (23.3%) |
| 60 to 89 Minutes | 182 (12.6%) | 29 (4.8%) |
| 90 or more Minutes | 6 (0.4%) | 0 (0.0%) |
Time of Departure to Work by Sex in Salton City
The most frequent times of departure to work in Salton City are 5:30 AM to 5:59 AM (396, 27.4%) for males and 6:30 AM to 6:59 AM (205, 34.1%) for females.
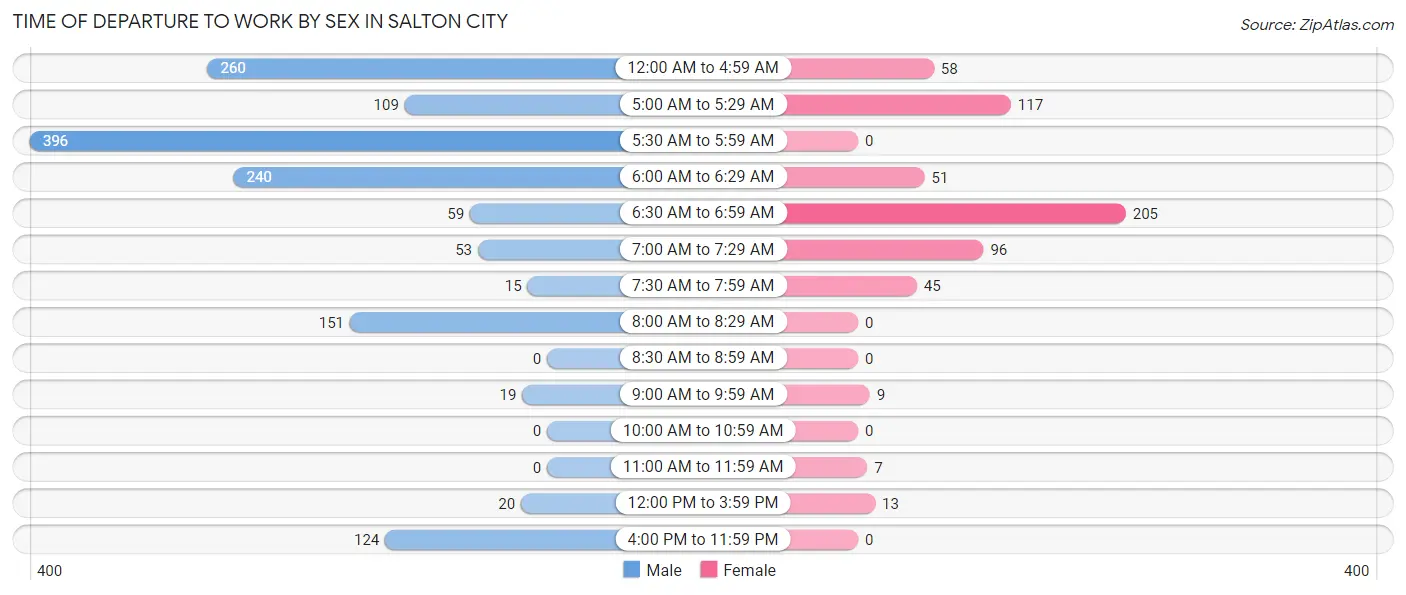
| Time of Departure | Male | Female |
| 12:00 AM to 4:59 AM | 260 (18.0%) | 58 (9.7%) |
| 5:00 AM to 5:29 AM | 109 (7.5%) | 117 (19.5%) |
| 5:30 AM to 5:59 AM | 396 (27.4%) | 0 (0.0%) |
| 6:00 AM to 6:29 AM | 240 (16.6%) | 51 (8.5%) |
| 6:30 AM to 6:59 AM | 59 (4.1%) | 205 (34.1%) |
| 7:00 AM to 7:29 AM | 53 (3.7%) | 96 (16.0%) |
| 7:30 AM to 7:59 AM | 15 (1.0%) | 45 (7.5%) |
| 8:00 AM to 8:29 AM | 151 (10.4%) | 0 (0.0%) |
| 8:30 AM to 8:59 AM | 0 (0.0%) | 0 (0.0%) |
| 9:00 AM to 9:59 AM | 19 (1.3%) | 9 (1.5%) |
| 10:00 AM to 10:59 AM | 0 (0.0%) | 0 (0.0%) |
| 11:00 AM to 11:59 AM | 0 (0.0%) | 7 (1.2%) |
| 12:00 PM to 3:59 PM | 20 (1.4%) | 13 (2.2%) |
| 4:00 PM to 11:59 PM | 124 (8.6%) | 0 (0.0%) |
| Total | 1,446 (100.0%) | 601 (100.0%) |
Housing Occupancy in Salton City
Occupancy by Ownership in Salton City
Of the total 2,368 dwellings in Salton City, owner-occupied units account for 2,267 (95.7%), while renter-occupied units make up 101 (4.3%).
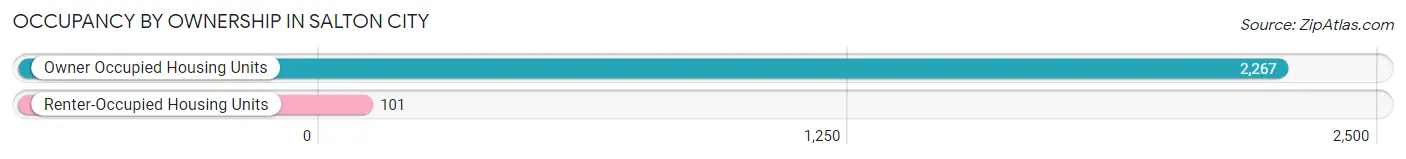
| Occupancy | # Housing Units | % Housing Units |
| Owner Occupied Housing Units | 2,267 | 95.7% |
| Renter-Occupied Housing Units | 101 | 4.3% |
| Total Occupied Housing Units | 2,368 | 100.0% |
Occupancy by Household Size in Salton City
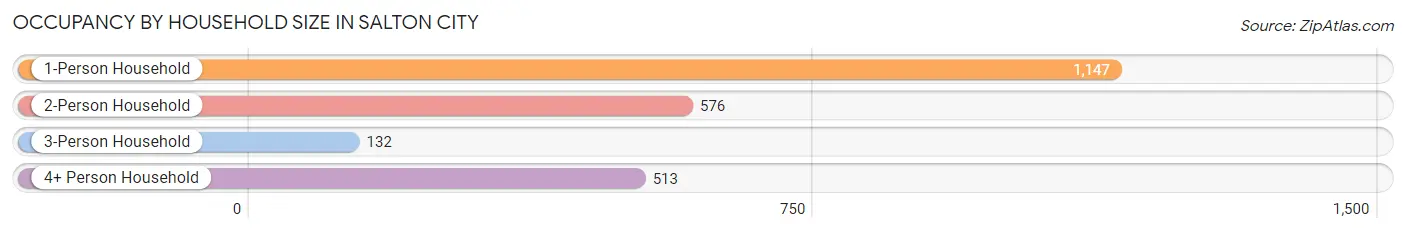
| Household Size | # Housing Units | % Housing Units |
| 1-Person Household | 1,147 | 48.4% |
| 2-Person Household | 576 | 24.3% |
| 3-Person Household | 132 | 5.6% |
| 4+ Person Household | 513 | 21.7% |
| Total Housing Units | 2,368 | 100.0% |
Occupancy by Ownership by Household Size in Salton City
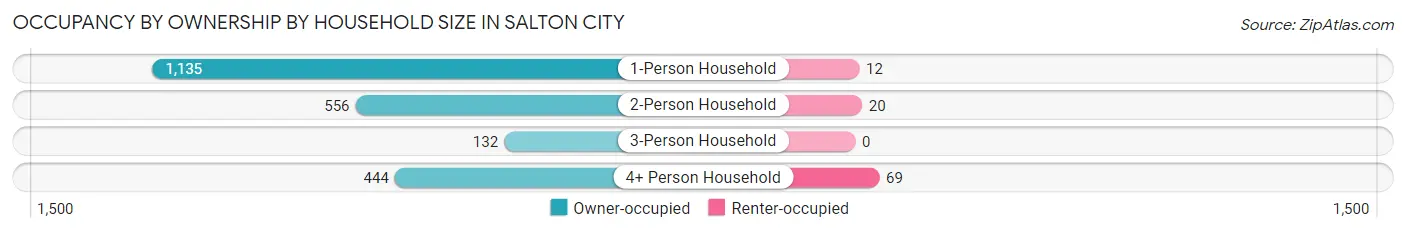
| Household Size | Owner-occupied | Renter-occupied |
| 1-Person Household | 1,135 (99.0%) | 12 (1.1%) |
| 2-Person Household | 556 (96.5%) | 20 (3.5%) |
| 3-Person Household | 132 (100.0%) | 0 (0.0%) |
| 4+ Person Household | 444 (86.6%) | 69 (13.5%) |
| Total Housing Units | 2,267 (95.7%) | 101 (4.3%) |
Occupancy by Educational Attainment in Salton City
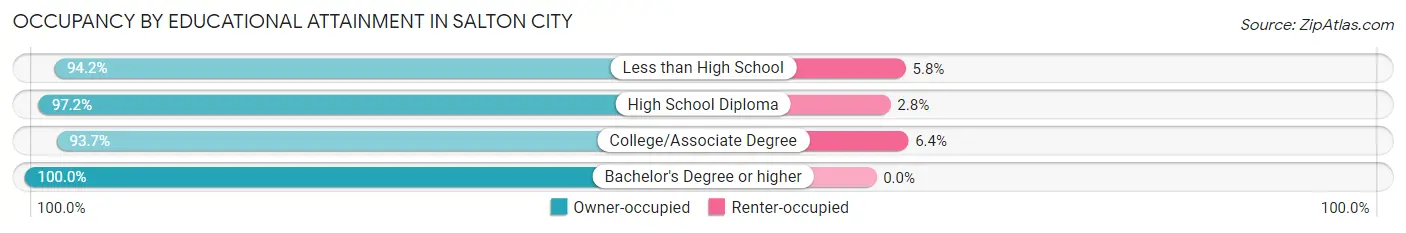
| Household Size | Owner-occupied | Renter-occupied |
| Less than High School | 792 (94.2%) | 49 (5.8%) |
| High School Diploma | 1,102 (97.2%) | 32 (2.8%) |
| College/Associate Degree | 295 (93.6%) | 20 (6.4%) |
| Bachelor's Degree or higher | 78 (100.0%) | 0 (0.0%) |
Occupancy by Age of Householder in Salton City
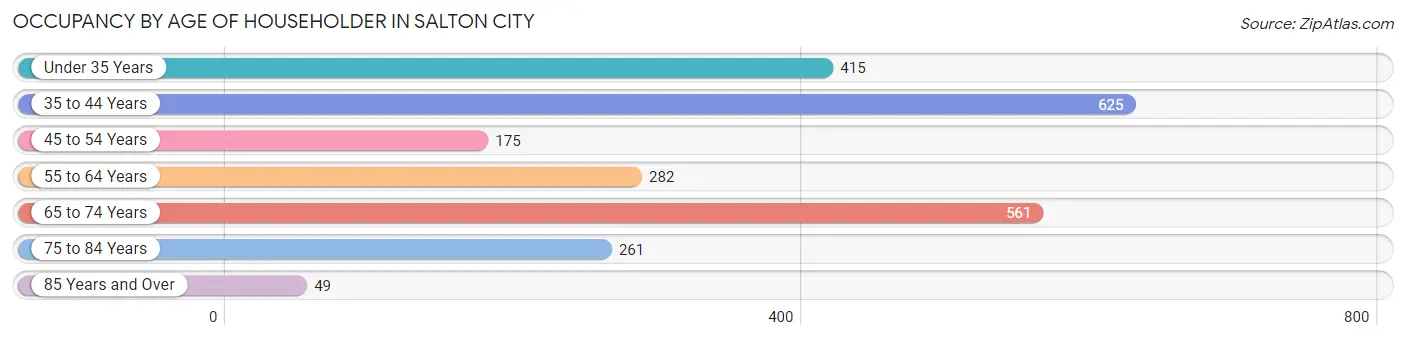
| Age Bracket | # Households | % Households |
| Under 35 Years | 415 | 17.5% |
| 35 to 44 Years | 625 | 26.4% |
| 45 to 54 Years | 175 | 7.4% |
| 55 to 64 Years | 282 | 11.9% |
| 65 to 74 Years | 561 | 23.7% |
| 75 to 84 Years | 261 | 11.0% |
| 85 Years and Over | 49 | 2.1% |
| Total | 2,368 | 100.0% |
Housing Finances in Salton City
Median Income by Occupancy in Salton City
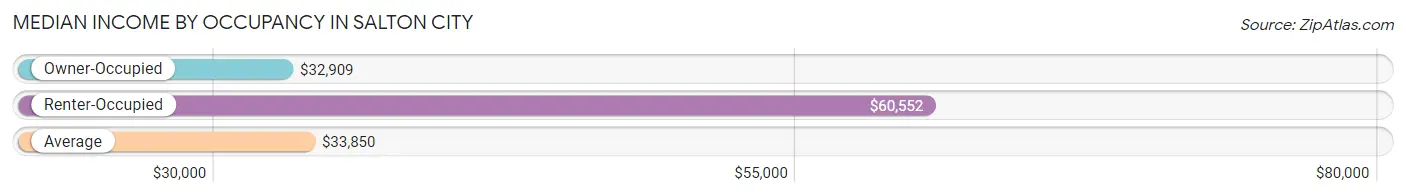
| Occupancy Type | # Households | Median Income |
| Owner-Occupied | 2,267 (95.7%) | $32,909 |
| Renter-Occupied | 101 (4.3%) | $60,552 |
| Average | 2,368 (100.0%) | $33,850 |
Occupancy by Householder Income Bracket in Salton City
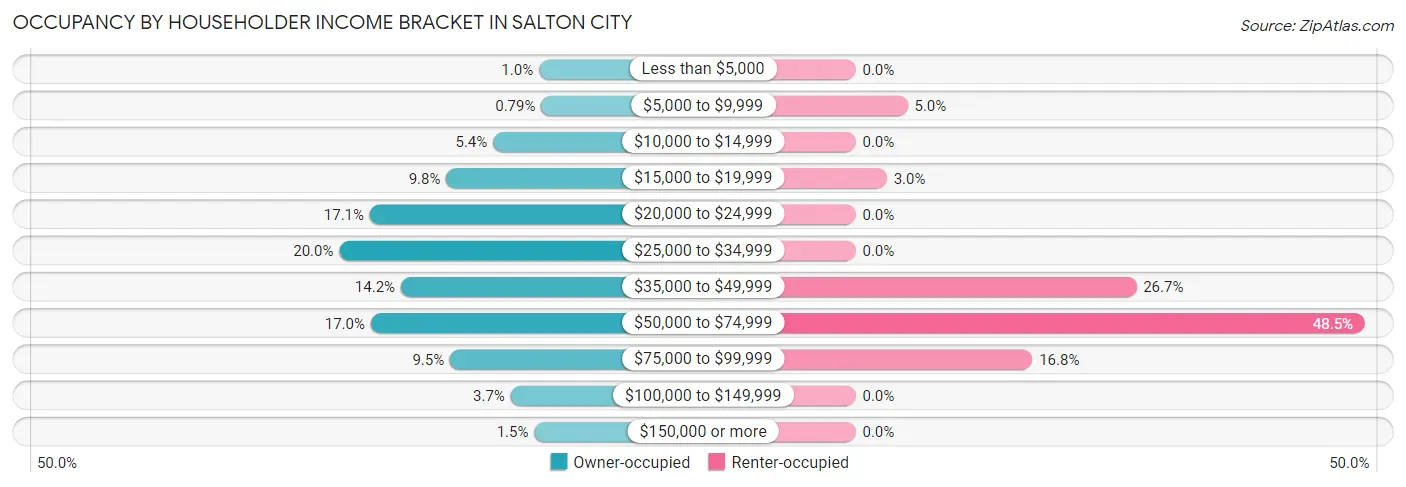
| Income Bracket | Owner-occupied | Renter-occupied |
| Less than $5,000 | 23 (1.0%) | 0 (0.0%) |
| $5,000 to $9,999 | 18 (0.8%) | 5 (5.0%) |
| $10,000 to $14,999 | 122 (5.4%) | 0 (0.0%) |
| $15,000 to $19,999 | 223 (9.8%) | 3 (3.0%) |
| $20,000 to $24,999 | 388 (17.1%) | 0 (0.0%) |
| $25,000 to $34,999 | 454 (20.0%) | 0 (0.0%) |
| $35,000 to $49,999 | 321 (14.2%) | 27 (26.7%) |
| $50,000 to $74,999 | 386 (17.0%) | 49 (48.5%) |
| $75,000 to $99,999 | 215 (9.5%) | 17 (16.8%) |
| $100,000 to $149,999 | 84 (3.7%) | 0 (0.0%) |
| $150,000 or more | 33 (1.5%) | 0 (0.0%) |
| Total | 2,267 (100.0%) | 101 (100.0%) |
Monthly Housing Cost Tiers in Salton City
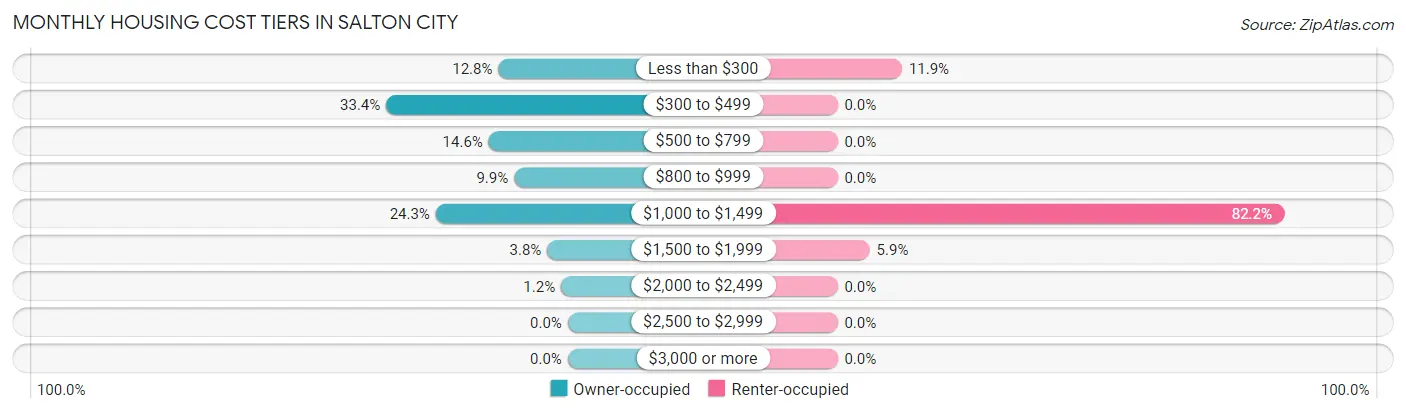
| Monthly Cost | Owner-occupied | Renter-occupied |
| Less than $300 | 290 (12.8%) | 12 (11.9%) |
| $300 to $499 | 758 (33.4%) | 0 (0.0%) |
| $500 to $799 | 330 (14.6%) | 0 (0.0%) |
| $800 to $999 | 224 (9.9%) | 0 (0.0%) |
| $1,000 to $1,499 | 551 (24.3%) | 83 (82.2%) |
| $1,500 to $1,999 | 86 (3.8%) | 6 (5.9%) |
| $2,000 to $2,499 | 28 (1.2%) | 0 (0.0%) |
| $2,500 to $2,999 | 0 (0.0%) | 0 (0.0%) |
| $3,000 or more | 0 (0.0%) | 0 (0.0%) |
| Total | 2,267 (100.0%) | 101 (100.0%) |
Physical Housing Characteristics in Salton City
Housing Structures in Salton City
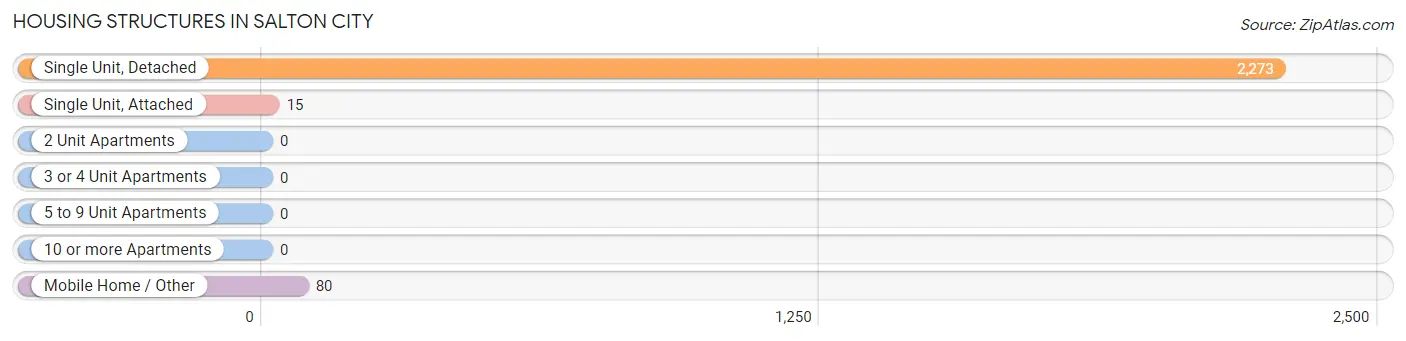
| Structure Type | # Housing Units | % Housing Units |
| Single Unit, Detached | 2,273 | 96.0% |
| Single Unit, Attached | 15 | 0.6% |
| 2 Unit Apartments | 0 | 0.0% |
| 3 or 4 Unit Apartments | 0 | 0.0% |
| 5 to 9 Unit Apartments | 0 | 0.0% |
| 10 or more Apartments | 0 | 0.0% |
| Mobile Home / Other | 80 | 3.4% |
| Total | 2,368 | 100.0% |
Housing Structures by Occupancy in Salton City
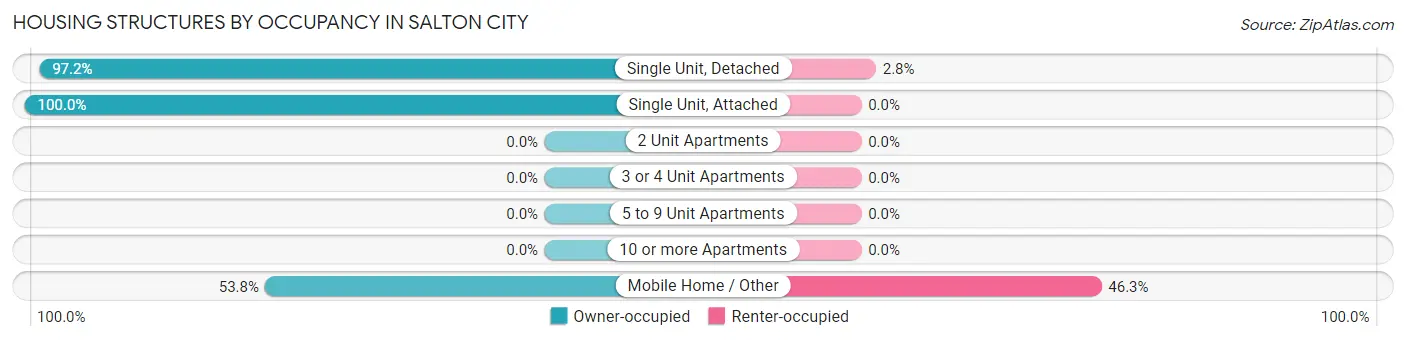
| Structure Type | Owner-occupied | Renter-occupied |
| Single Unit, Detached | 2,209 (97.2%) | 64 (2.8%) |
| Single Unit, Attached | 15 (100.0%) | 0 (0.0%) |
| 2 Unit Apartments | 0 (0.0%) | 0 (0.0%) |
| 3 or 4 Unit Apartments | 0 (0.0%) | 0 (0.0%) |
| 5 to 9 Unit Apartments | 0 (0.0%) | 0 (0.0%) |
| 10 or more Apartments | 0 (0.0%) | 0 (0.0%) |
| Mobile Home / Other | 43 (53.7%) | 37 (46.3%) |
| Total | 2,267 (95.7%) | 101 (4.3%) |
Housing Structures by Number of Rooms in Salton City
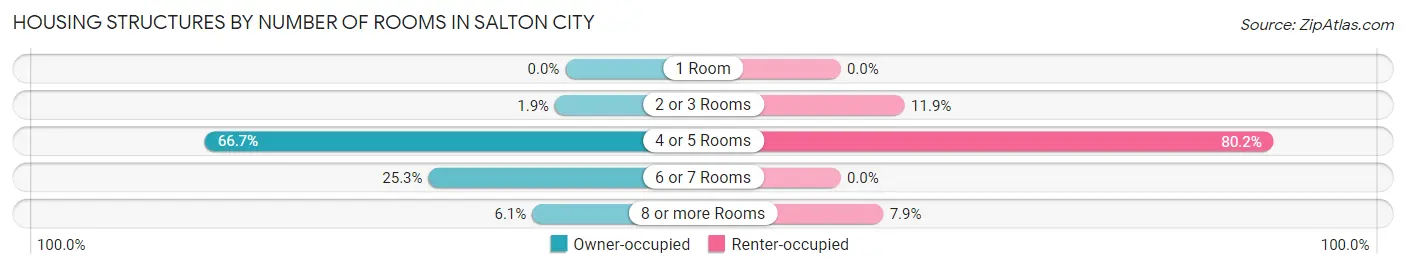
| Number of Rooms | Owner-occupied | Renter-occupied |
| 1 Room | 0 (0.0%) | 0 (0.0%) |
| 2 or 3 Rooms | 43 (1.9%) | 12 (11.9%) |
| 4 or 5 Rooms | 1,511 (66.6%) | 81 (80.2%) |
| 6 or 7 Rooms | 574 (25.3%) | 0 (0.0%) |
| 8 or more Rooms | 139 (6.1%) | 8 (7.9%) |
| Total | 2,267 (100.0%) | 101 (100.0%) |
Housing Structure by Heating Type in Salton City
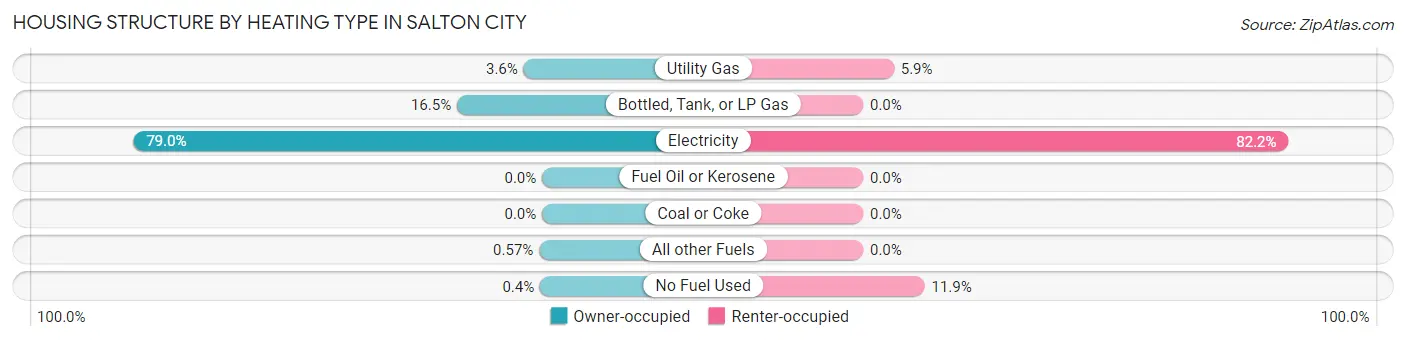
| Heating Type | Owner-occupied | Renter-occupied |
| Utility Gas | 81 (3.6%) | 6 (5.9%) |
| Bottled, Tank, or LP Gas | 373 (16.5%) | 0 (0.0%) |
| Electricity | 1,791 (79.0%) | 83 (82.2%) |
| Fuel Oil or Kerosene | 0 (0.0%) | 0 (0.0%) |
| Coal or Coke | 0 (0.0%) | 0 (0.0%) |
| All other Fuels | 13 (0.6%) | 0 (0.0%) |
| No Fuel Used | 9 (0.4%) | 12 (11.9%) |
| Total | 2,267 (100.0%) | 101 (100.0%) |
Household Vehicle Usage in Salton City
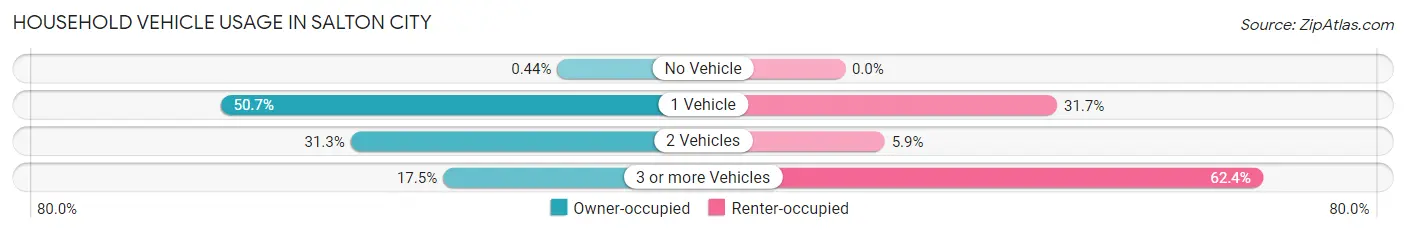
| Vehicles per Household | Owner-occupied | Renter-occupied |
| No Vehicle | 10 (0.4%) | 0 (0.0%) |
| 1 Vehicle | 1,150 (50.7%) | 32 (31.7%) |
| 2 Vehicles | 710 (31.3%) | 6 (5.9%) |
| 3 or more Vehicles | 397 (17.5%) | 63 (62.4%) |
| Total | 2,267 (100.0%) | 101 (100.0%) |
Real Estate & Mortgages in Salton City
Real Estate and Mortgage Overview in Salton City
| Characteristic | Without Mortgage | With Mortgage |
| Housing Units | 1,489 | 778 |
| Median Property Value | $178,200 | $169,900 |
| Median Household Income | $33,281 | $0 |
| Monthly Housing Costs | $423 | $0 |
| Real Estate Taxes | $1,447 | $0 |
Property Value by Mortgage Status in Salton City
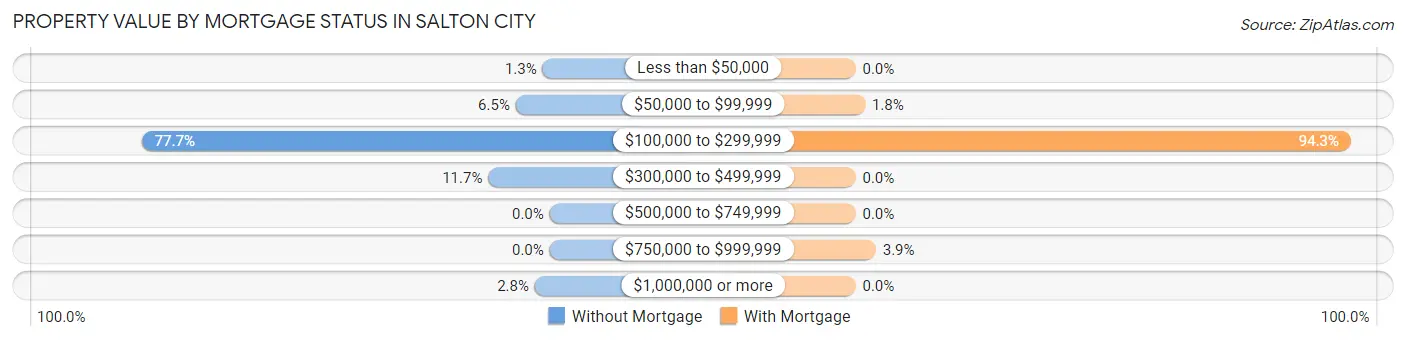
| Property Value | Without Mortgage | With Mortgage |
| Less than $50,000 | 20 (1.3%) | 0 (0.0%) |
| $50,000 to $99,999 | 96 (6.5%) | 14 (1.8%) |
| $100,000 to $299,999 | 1,157 (77.7%) | 734 (94.3%) |
| $300,000 to $499,999 | 174 (11.7%) | 0 (0.0%) |
| $500,000 to $749,999 | 0 (0.0%) | 0 (0.0%) |
| $750,000 to $999,999 | 0 (0.0%) | 30 (3.9%) |
| $1,000,000 or more | 42 (2.8%) | 0 (0.0%) |
| Total | 1,489 (100.0%) | 778 (100.0%) |
Household Income by Mortgage Status in Salton City
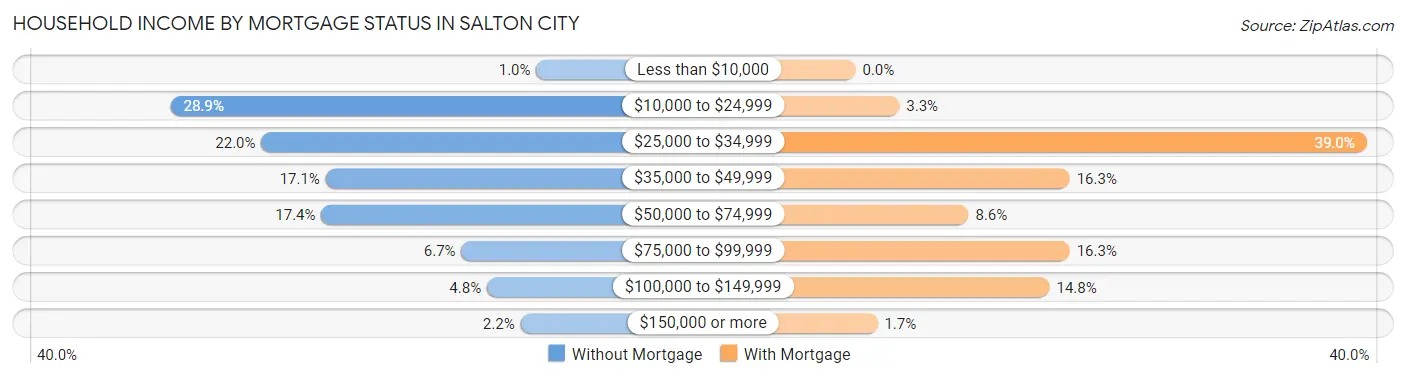
| Household Income | Without Mortgage | With Mortgage |
| Less than $10,000 | 15 (1.0%) | 0 (0.0%) |
| $10,000 to $24,999 | 430 (28.9%) | 26 (3.3%) |
| $25,000 to $34,999 | 327 (22.0%) | 303 (39.0%) |
| $35,000 to $49,999 | 254 (17.1%) | 127 (16.3%) |
| $50,000 to $74,999 | 259 (17.4%) | 67 (8.6%) |
| $75,000 to $99,999 | 100 (6.7%) | 127 (16.3%) |
| $100,000 to $149,999 | 71 (4.8%) | 115 (14.8%) |
| $150,000 or more | 33 (2.2%) | 13 (1.7%) |
| Total | 1,489 (100.0%) | 778 (100.0%) |
Property Value to Household Income Ratio in Salton City
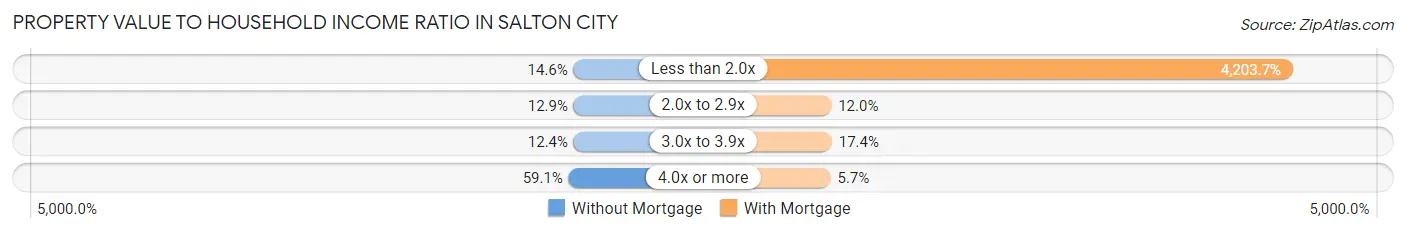
| Value-to-Income Ratio | Without Mortgage | With Mortgage |
| Less than 2.0x | 217 (14.6%) | 32,705 (4,203.7%) |
| 2.0x to 2.9x | 192 (12.9%) | 93 (11.9%) |
| 3.0x to 3.9x | 185 (12.4%) | 135 (17.3%) |
| 4.0x or more | 880 (59.1%) | 44 (5.7%) |
| Total | 1,489 (100.0%) | 778 (100.0%) |
Real Estate Taxes by Mortgage Status in Salton City
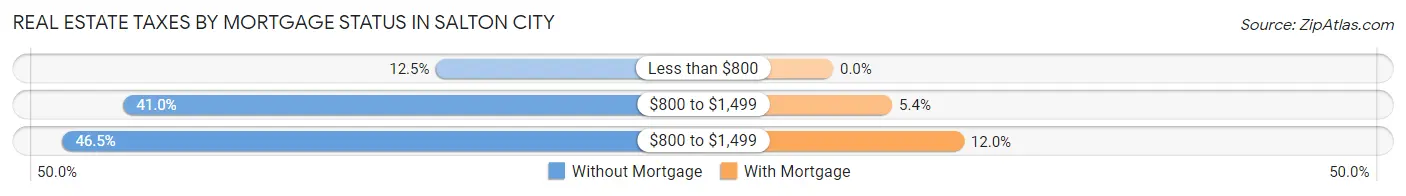
| Property Taxes | Without Mortgage | With Mortgage |
| Less than $800 | 186 (12.5%) | 0 (0.0%) |
| $800 to $1,499 | 610 (41.0%) | 42 (5.4%) |
| $800 to $1,499 | 693 (46.5%) | 93 (11.9%) |
| Total | 1,489 (100.0%) | 778 (100.0%) |
Health & Disability in Salton City
Health Insurance Coverage by Age in Salton City
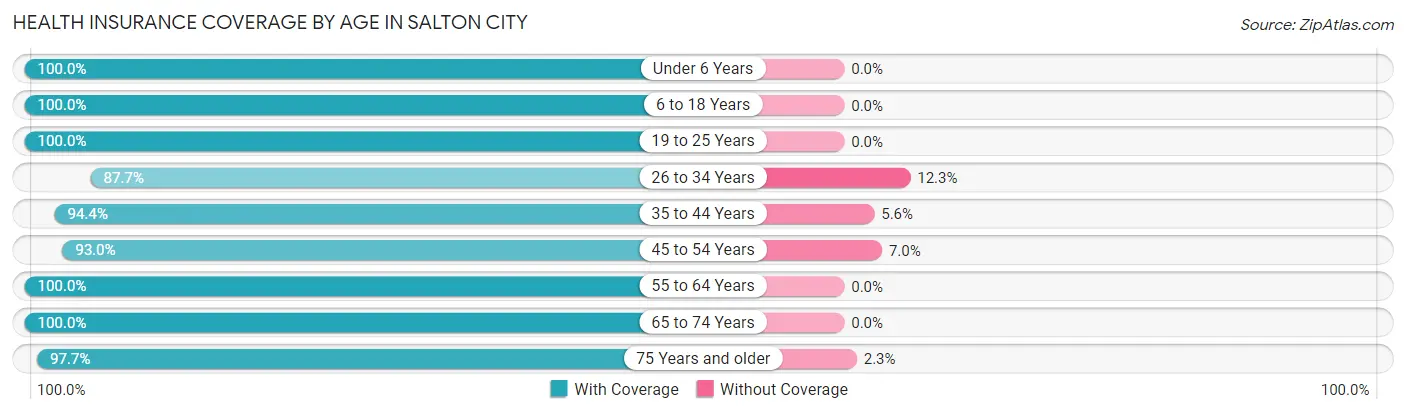
| Age Bracket | With Coverage | Without Coverage |
| Under 6 Years | 430 (100.0%) | 0 (0.0%) |
| 6 to 18 Years | 922 (100.0%) | 0 (0.0%) |
| 19 to 25 Years | 883 (100.0%) | 0 (0.0%) |
| 26 to 34 Years | 599 (87.7%) | 84 (12.3%) |
| 35 to 44 Years | 879 (94.4%) | 52 (5.6%) |
| 45 to 54 Years | 357 (93.0%) | 27 (7.0%) |
| 55 to 64 Years | 686 (100.0%) | 0 (0.0%) |
| 65 to 74 Years | 767 (100.0%) | 0 (0.0%) |
| 75 Years and older | 504 (97.7%) | 12 (2.3%) |
| Total | 6,027 (97.2%) | 175 (2.8%) |
Health Insurance Coverage by Citizenship Status in Salton City
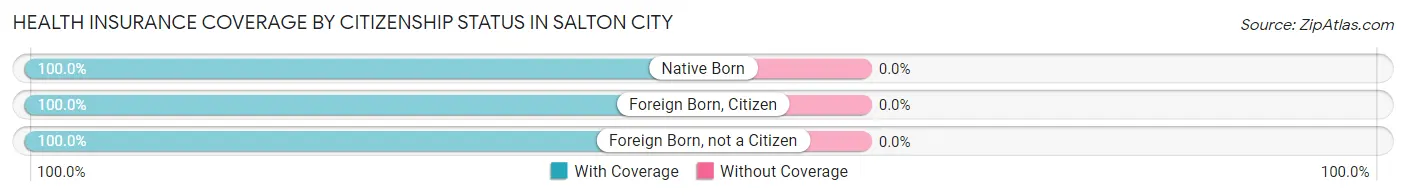
| Citizenship Status | With Coverage | Without Coverage |
| Native Born | 430 (100.0%) | 0 (0.0%) |
| Foreign Born, Citizen | 922 (100.0%) | 0 (0.0%) |
| Foreign Born, not a Citizen | 883 (100.0%) | 0 (0.0%) |
Health Insurance Coverage by Household Income in Salton City
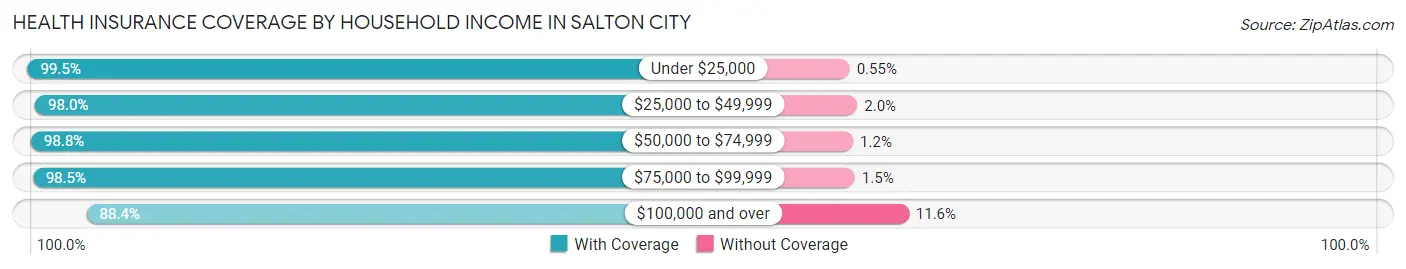
| Household Income | With Coverage | Without Coverage |
| Under $25,000 | 1,078 (99.5%) | 6 (0.5%) |
| $25,000 to $49,999 | 1,534 (98.0%) | 31 (2.0%) |
| $50,000 to $74,999 | 1,661 (98.8%) | 20 (1.2%) |
| $75,000 to $99,999 | 971 (98.5%) | 15 (1.5%) |
| $100,000 and over | 783 (88.4%) | 103 (11.6%) |
Public vs Private Health Insurance Coverage by Age in Salton City
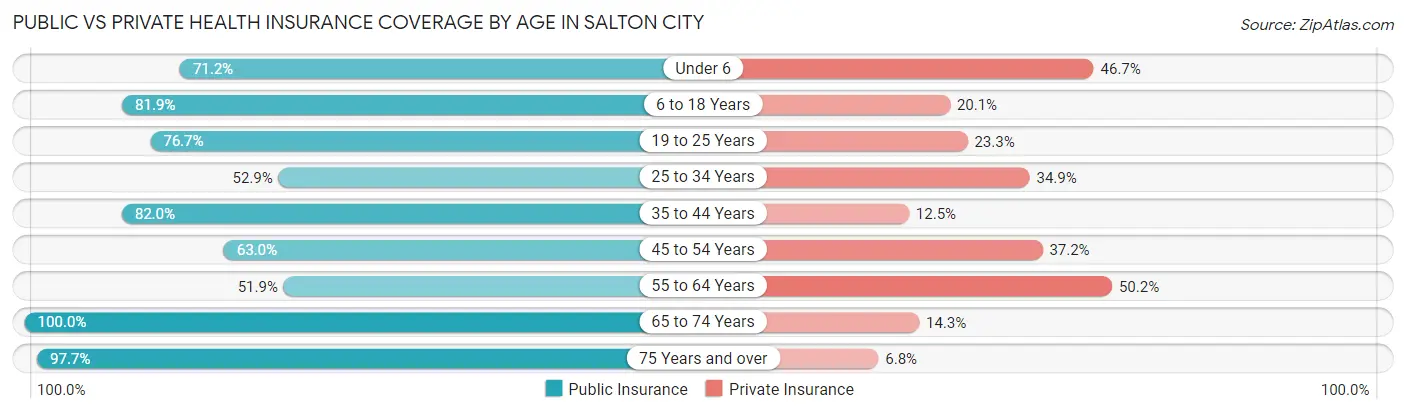
| Age Bracket | Public Insurance | Private Insurance |
| Under 6 | 306 (71.2%) | 201 (46.7%) |
| 6 to 18 Years | 755 (81.9%) | 185 (20.1%) |
| 19 to 25 Years | 677 (76.7%) | 206 (23.3%) |
| 25 to 34 Years | 361 (52.9%) | 238 (34.8%) |
| 35 to 44 Years | 763 (82.0%) | 116 (12.5%) |
| 45 to 54 Years | 242 (63.0%) | 143 (37.2%) |
| 55 to 64 Years | 356 (51.9%) | 344 (50.1%) |
| 65 to 74 Years | 767 (100.0%) | 110 (14.3%) |
| 75 Years and over | 504 (97.7%) | 35 (6.8%) |
| Total | 4,731 (76.3%) | 1,578 (25.4%) |
Disability Status by Sex by Age in Salton City
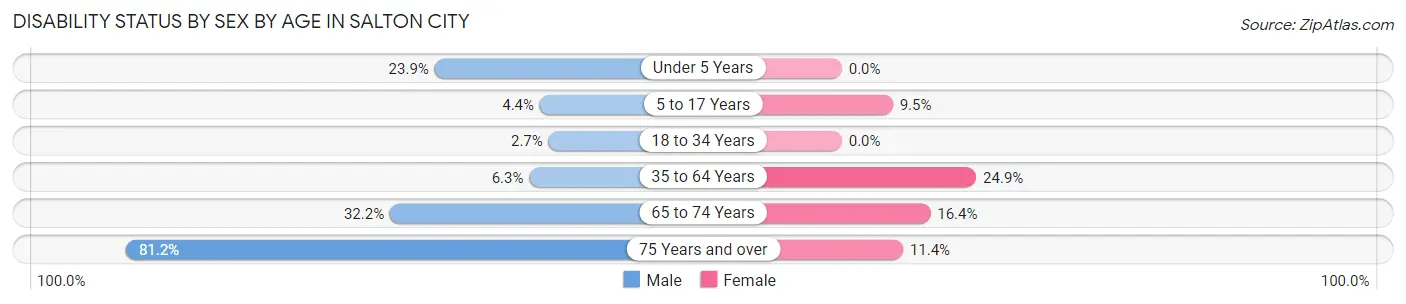
| Age Bracket | Male | Female |
| Under 5 Years | 43 (23.9%) | 0 (0.0%) |
| 5 to 17 Years | 19 (4.4%) | 45 (9.5%) |
| 18 to 34 Years | 25 (2.7%) | 0 (0.0%) |
| 35 to 64 Years | 75 (6.3%) | 203 (24.9%) |
| 65 to 74 Years | 139 (32.2%) | 55 (16.4%) |
| 75 Years and over | 233 (81.2%) | 26 (11.4%) |
Disability Class by Sex by Age in Salton City
Disability Class: Hearing Difficulty
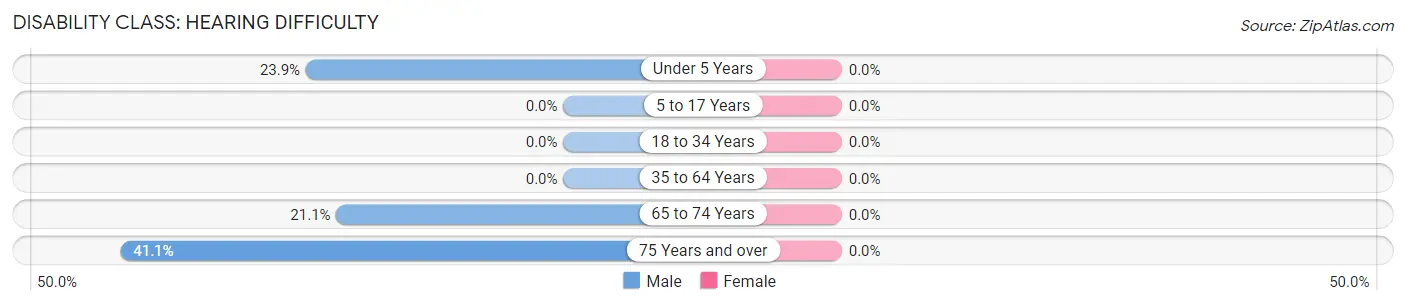
| Age Bracket | Male | Female |
| Under 5 Years | 43 (23.9%) | 0 (0.0%) |
| 5 to 17 Years | 0 (0.0%) | 0 (0.0%) |
| 18 to 34 Years | 0 (0.0%) | 0 (0.0%) |
| 35 to 64 Years | 0 (0.0%) | 0 (0.0%) |
| 65 to 74 Years | 91 (21.1%) | 0 (0.0%) |
| 75 Years and over | 118 (41.1%) | 0 (0.0%) |
Disability Class: Vision Difficulty
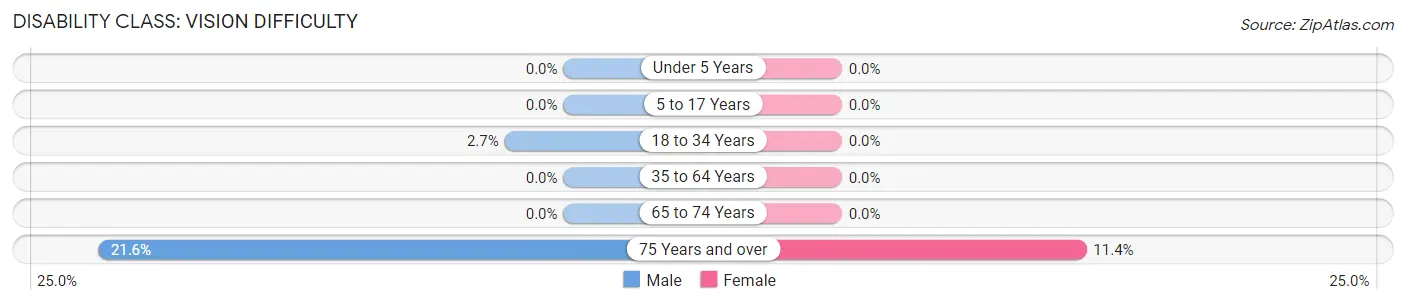
| Age Bracket | Male | Female |
| Under 5 Years | 0 (0.0%) | 0 (0.0%) |
| 5 to 17 Years | 0 (0.0%) | 0 (0.0%) |
| 18 to 34 Years | 25 (2.7%) | 0 (0.0%) |
| 35 to 64 Years | 0 (0.0%) | 0 (0.0%) |
| 65 to 74 Years | 0 (0.0%) | 0 (0.0%) |
| 75 Years and over | 62 (21.6%) | 26 (11.4%) |
Disability Class: Cognitive Difficulty
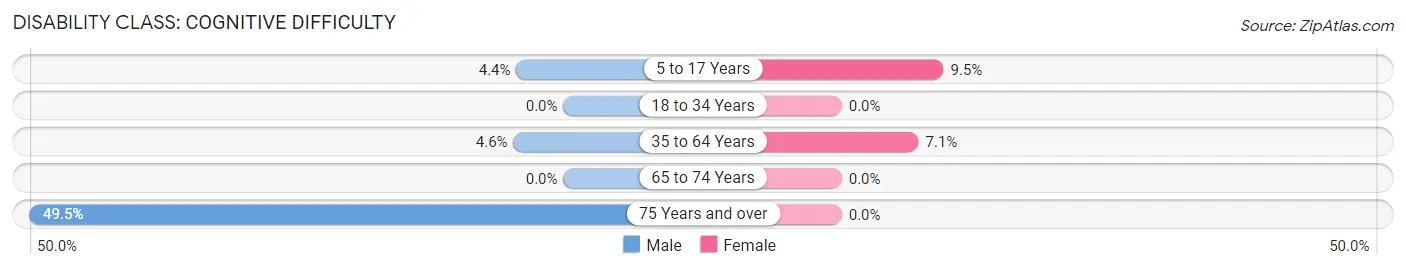
| Age Bracket | Male | Female |
| 5 to 17 Years | 19 (4.4%) | 45 (9.5%) |
| 18 to 34 Years | 0 (0.0%) | 0 (0.0%) |
| 35 to 64 Years | 55 (4.6%) | 58 (7.1%) |
| 65 to 74 Years | 0 (0.0%) | 0 (0.0%) |
| 75 Years and over | 142 (49.5%) | 0 (0.0%) |
Disability Class: Ambulatory Difficulty
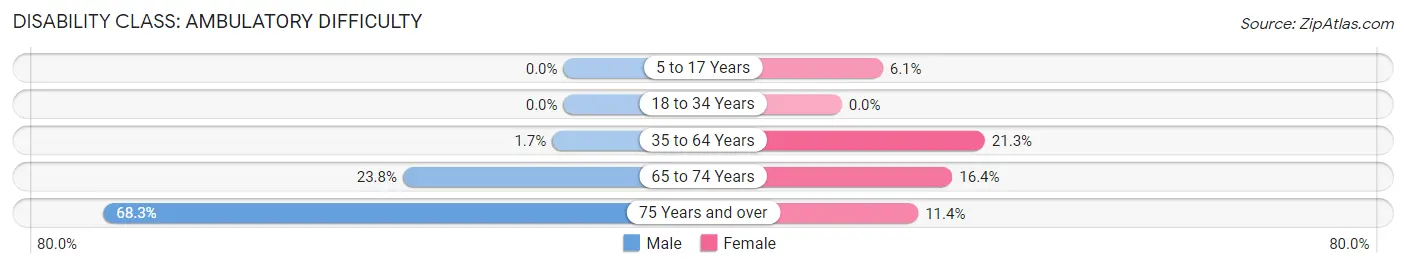
| Age Bracket | Male | Female |
| 5 to 17 Years | 0 (0.0%) | 29 (6.1%) |
| 18 to 34 Years | 0 (0.0%) | 0 (0.0%) |
| 35 to 64 Years | 20 (1.7%) | 173 (21.2%) |
| 65 to 74 Years | 103 (23.8%) | 55 (16.4%) |
| 75 Years and over | 196 (68.3%) | 26 (11.4%) |
Disability Class: Self-Care Difficulty
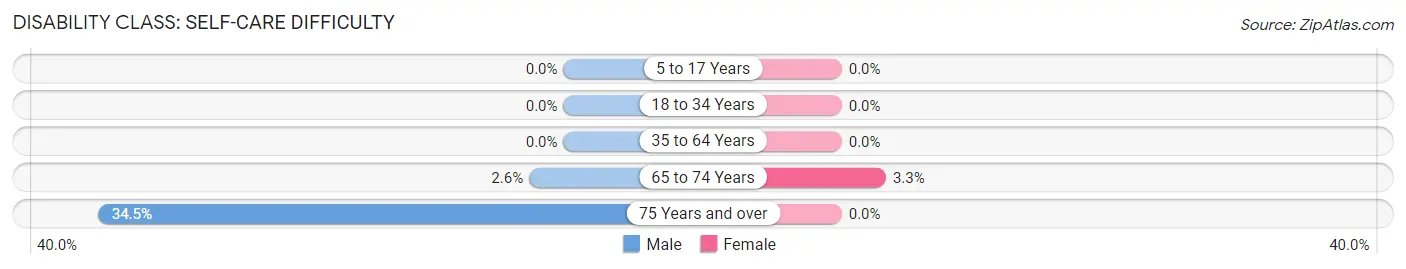
| Age Bracket | Male | Female |
| 5 to 17 Years | 0 (0.0%) | 0 (0.0%) |
| 18 to 34 Years | 0 (0.0%) | 0 (0.0%) |
| 35 to 64 Years | 0 (0.0%) | 0 (0.0%) |
| 65 to 74 Years | 11 (2.5%) | 11 (3.3%) |
| 75 Years and over | 99 (34.5%) | 0 (0.0%) |
Technology Access in Salton City
Computing Device Access in Salton City
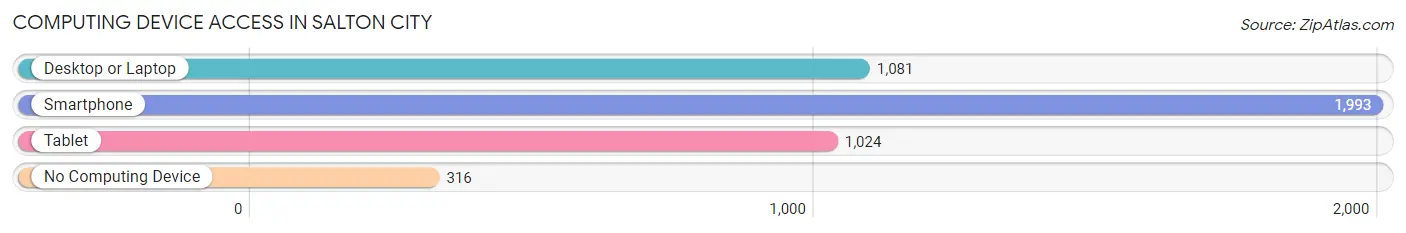
| Device Type | # Households | % Households |
| Desktop or Laptop | 1,081 | 45.7% |
| Smartphone | 1,993 | 84.2% |
| Tablet | 1,024 | 43.2% |
| No Computing Device | 316 | 13.3% |
| Total | 2,368 | 100.0% |
Internet Access in Salton City
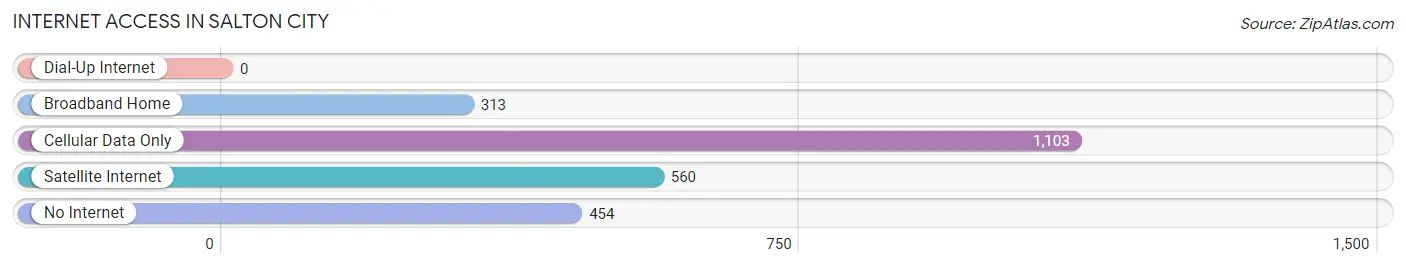
| Internet Type | # Households | % Households |
| Dial-Up Internet | 0 | 0.0% |
| Broadband Home | 313 | 13.2% |
| Cellular Data Only | 1,103 | 46.6% |
| Satellite Internet | 560 | 23.6% |
| No Internet | 454 | 19.2% |
| Total | 2,368 | 100.0% |
Salton City Summary
Salton City is a census-designated place (CDP) located in Imperial County, California, United States. It is located on the Salton Sea, a large, saline lake in the Colorado Desert. The population was 1,971 at the 2010 census, up from 1,922 at the 2000 census.
History
Salton City was founded in 1958 as a planned community by the Salton Sea Reclamation District. The district was created in 1950 by the California State Legislature to develop the area around the Salton Sea. The district was given the authority to sell land, issue bonds, and levy taxes to finance the development of the area.
The original plan for Salton City was to create a resort community with a marina, golf course, and other amenities. However, the plan was never fully realized due to a lack of funding and the area's remote location.
Geography
Salton City is located in Imperial County, California, at 33°17′N 115°37′W (33.28, -115.62). It is located on the Salton Sea, a large, saline lake in the Colorado Desert.
The CDP has a total area of 4 2 square miles 10 8 km2 all of it land
Economy
The economy of Salton City is largely based on tourism and agriculture. The area is home to several resorts, including the Salton Sea Beach Resort and the Salton Sea Marina. The area also has several agricultural operations, including date farms and fish farms.
Demographics
As of the 2010 census, there were 1,971 people, 645 households, and 486 families residing in the CDP. The population density was 468.2 people per square mile (180.9/km2). There were 745 housing units at an average density of 178.3 per square mile (68.9/km2). The racial makeup of the CDP was 64.2% White, 0.7% African American, 1.2% Native American, 0.3% Asian, 0.1% Pacific Islander, 30.3% from other races, and 3.3% from two or more races. Hispanic or Latino of any race were 57.2% of the population.
There were 645 households, out of which 37.2% had children under the age of 18 living with them, 48.2% were married couples living together, 17.2% had a female householder with no husband present, and 25.2% were non-families. 20.2% of all households were made up of individuals, and 8.2% had someone living alone who was 65 years of age or older. The average household size was 3.06 and the average family size was 3.54.
In the CDP, the population was spread out, with 32.2% under the age of 18, 10.2% from 18 to 24, 25.2% from 25 to 44, 21.2% from 45 to 64, and 11.2% who were 65 years of age or older. The median age was 32 years. For every 100 females, there were 103.2 males. For every 100 females age 18 and over, there were 103.2 males.
The median income for a household in the CDP was $25,000, and the median income for a family was $27,500. Males had a median income of $25,000 versus $17,500 for females. The per capita income for the CDP was $10,890. About 24.2% of families and 28.2% of the population were below the poverty line, including 37.2% of those under age 18 and none of those age 65 or over.
Common Questions
What is Per Capita Income in Salton City?
Per Capita income in Salton City is $18,717.
What is the Median Family Income in Salton City?
Median Family Income in Salton City is $51,875.
What is the Median Household income in Salton City?
Median Household Income in Salton City is $33,850.
What is Income or Wage Gap in Salton City?
Income or Wage Gap in Salton City is 45.9%.
Women in Salton City earn 54.1 cents for every dollar earned by a man.
What is Inequality or Gini Index in Salton City?
Inequality or Gini Index in Salton City is 0.35.
What is the Total Population of Salton City?
Total Population of Salton City is 6,202.
What is the Total Male Population of Salton City?
Total Male Population of Salton City is 3,439.
What is the Total Female Population of Salton City?
Total Female Population of Salton City is 2,763.
What is the Ratio of Males per 100 Females in Salton City?
There are 124.47 Males per 100 Females in Salton City.
What is the Ratio of Females per 100 Males in Salton City?
There are 80.34 Females per 100 Males in Salton City.
What is the Median Population Age in Salton City?
Median Population Age in Salton City is 36.7 Years.
What is the Average Family Size in Salton City
Average Family Size in Salton City is 4.1 People.
What is the Average Household Size in Salton City
Average Household Size in Salton City is 2.6 People.
How Large is the Labor Force in Salton City?
There are 2,369 People in the Labor Forcein in Salton City.
What is the Percentage of People in the Labor Force in Salton City?
46.0% of People are in the Labor Force in Salton City.
What is the Unemployment Rate in Salton City?
Unemployment Rate in Salton City is 10.1%.