Zip Codes with the Highest Percentage of Population Employed in Farming, Fishing & Forestry in Salinas, CA
RELATED REPORTS & OPTIONS
Farming, Fishing & Forestry
Salinas
Compare Zip Codes
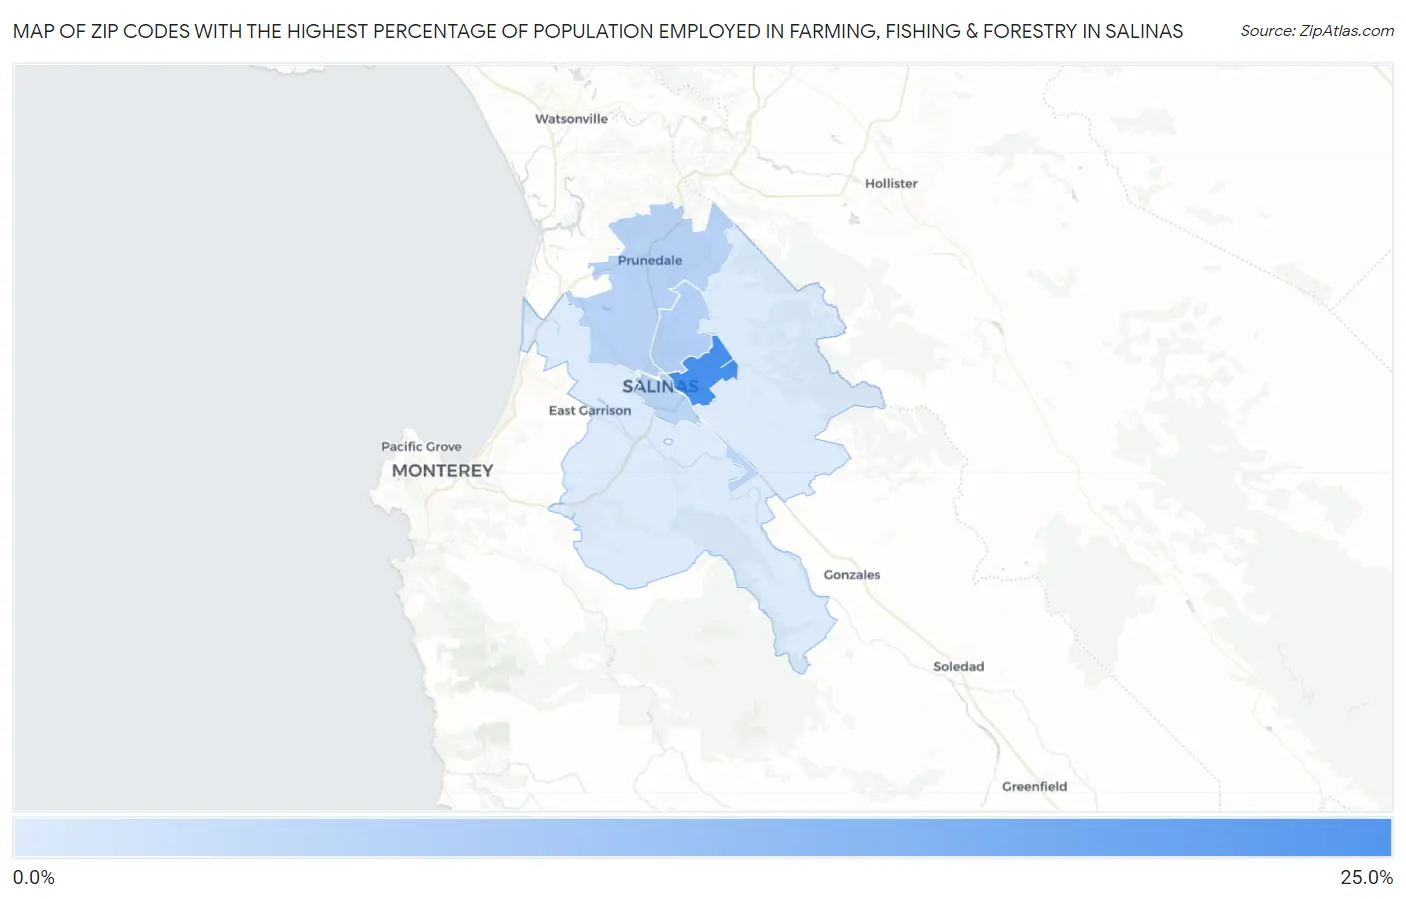
Map of Zip Codes with the Highest Percentage of Population Employed in Farming, Fishing & Forestry in Salinas
0.0%
25.0%
Zip Codes with the Highest Percentage of Population Employed in Farming, Fishing & Forestry in Salinas, CA
| Zip Code | % Employed | vs State | vs National | |
| 1. | 93905 | 22.3% | 1.4%(+20.9)#66 | 0.61%(+21.7)#334 |
| 2. | 93906 | 8.8% | 1.4%(+7.35)#171 | 0.61%(+8.15)#1,465 |
| 3. | 93907 | 8.3% | 1.4%(+6.88)#181 | 0.61%(+7.68)#1,580 |
| 4. | 93901 | 8.0% | 1.4%(+6.62)#188 | 0.61%(+7.42)#1,658 |
| 5. | 93908 | 4.0% | 1.4%(+2.55)#274 | 0.61%(+3.36)#3,750 |
1
Common Questions
What are the Top 3 Zip Codes with the Highest Percentage of Population Employed in Farming, Fishing & Forestry in Salinas, CA?
Top 3 Zip Codes with the Highest Percentage of Population Employed in Farming, Fishing & Forestry in Salinas, CA are:
What zip code has the Highest Percentage of Population Employed in Farming, Fishing & Forestry in Salinas, CA?
93905 has the Highest Percentage of Population Employed in Farming, Fishing & Forestry in Salinas, CA with 22.3%.
What is the Percentage of Population Employed in Farming, Fishing & Forestry in Salinas, CA?
Percentage of Population Employed in Farming, Fishing & Forestry in Salinas is 13.4%.
What is the Percentage of Population Employed in Farming, Fishing & Forestry in California?
Percentage of Population Employed in Farming, Fishing & Forestry in California is 1.4%.
What is the Percentage of Population Employed in Farming, Fishing & Forestry in the United States?
Percentage of Population Employed in Farming, Fishing & Forestry in the United States is 0.61%.