Zip Codes with the Highest Percentage of Population Employed in Farming, Fishing & Forestry in Rocklin, CA
RELATED REPORTS & OPTIONS
Farming, Fishing & Forestry
Rocklin
Compare Zip Codes
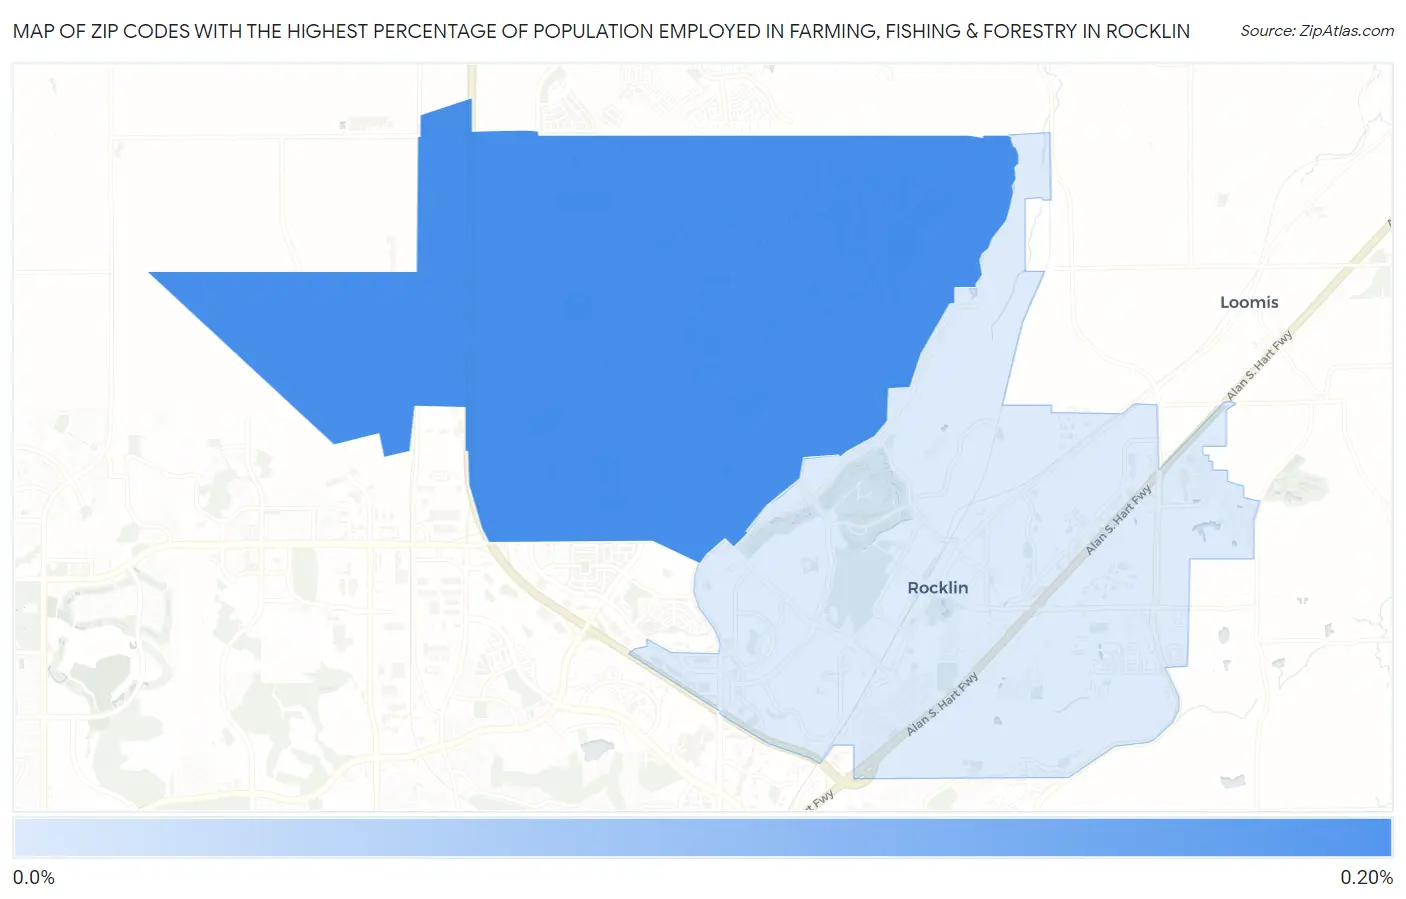
Map of Zip Codes with the Highest Percentage of Population Employed in Farming, Fishing & Forestry in Rocklin
0.0%
0.20%
Zip Codes with the Highest Percentage of Population Employed in Farming, Fishing & Forestry in Rocklin, CA
| Zip Code | % Employed | vs State | vs National | |
| 1. | 95765 | 0.18% | 1.4%(-1.23)#975 | 0.61%(-0.430)#16,493 |
| 2. | 95677 | 0.082% | 1.4%(-1.33)#1,105 | 0.61%(-0.523)#18,083 |
1
Common Questions
What are the Top Zip Codes with the Highest Percentage of Population Employed in Farming, Fishing & Forestry in Rocklin, CA?
Top Zip Codes with the Highest Percentage of Population Employed in Farming, Fishing & Forestry in Rocklin, CA are:
What zip code has the Highest Percentage of Population Employed in Farming, Fishing & Forestry in Rocklin, CA?
95765 has the Highest Percentage of Population Employed in Farming, Fishing & Forestry in Rocklin, CA with 0.18%.
What is the Percentage of Population Employed in Farming, Fishing & Forestry in Rocklin, CA?
Percentage of Population Employed in Farming, Fishing & Forestry in Rocklin is 0.14%.
What is the Percentage of Population Employed in Farming, Fishing & Forestry in California?
Percentage of Population Employed in Farming, Fishing & Forestry in California is 1.4%.
What is the Percentage of Population Employed in Farming, Fishing & Forestry in the United States?
Percentage of Population Employed in Farming, Fishing & Forestry in the United States is 0.61%.