Ridgecrest, CA Map & Demographics
Ridgecrest Map
Ridgecrest Overview
$39,623
PER CAPITA INCOME
$97,167
AVG FAMILY INCOME
$85,872
AVG HOUSEHOLD INCOME
47.8%
WAGE / INCOME GAP [ % ]
52.2¢/ $1
WAGE / INCOME GAP [ $ ]
$9,379
FAMILY INCOME DEFICIT
0.39
INEQUALITY / GINI INDEX
28,118
TOTAL POPULATION
13,641
MALE POPULATION
14,477
FEMALE POPULATION
94.23
MALES / 100 FEMALES
106.13
FEMALES / 100 MALES
35.4
MEDIAN AGE
3.2
AVG FAMILY SIZE
2.5
AVG HOUSEHOLD SIZE
13,639
LABOR FORCE [ PEOPLE ]
63.8%
PERCENT IN LABOR FORCE
9.2%
UNEMPLOYMENT RATE
Ridgecrest Zip Codes
Ridgecrest Area Codes
Income in Ridgecrest
Income Overview in Ridgecrest
Per Capita Income in Ridgecrest is $39,623, while median incomes of families and households are $97,167 and $85,872 respectively.
| Characteristic | Number | Measure |
| Per Capita Income | 28,118 | $39,623 |
| Median Family Income | 6,637 | $97,167 |
| Mean Family Income | 6,637 | $112,335 |
| Median Household Income | 11,144 | $85,872 |
| Mean Household Income | 11,144 | $98,249 |
| Income Deficit | 6,637 | $9,379 |
| Wage / Income Gap (%) | 28,118 | 47.83% |
| Wage / Income Gap ($) | 28,118 | 52.17¢ per $1 |
| Gini / Inequality Index | 28,118 | 0.39 |
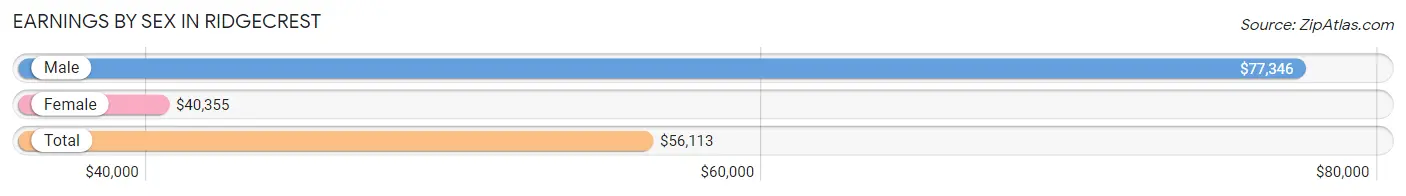
Earnings by Sex in Ridgecrest
Average Earnings in Ridgecrest are $56,113, $77,346 for men and $40,355 for women, a difference of 47.8%.
| Sex | Number | Average Earnings |
| Male | 7,482 (54.8%) | $77,346 |
| Female | 6,172 (45.2%) | $40,355 |
| Total | 13,654 (100.0%) | $56,113 |
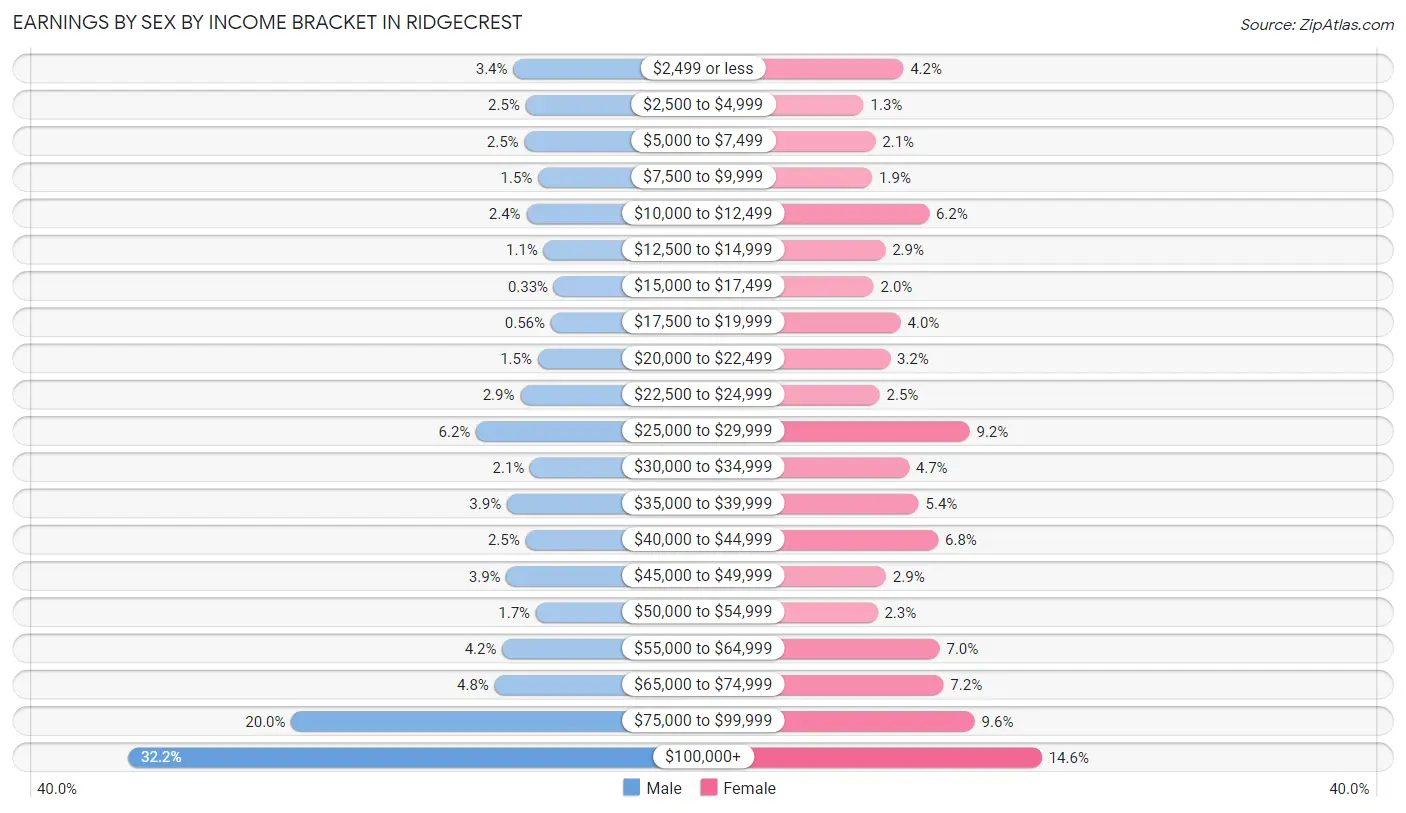
Earnings by Sex by Income Bracket in Ridgecrest
The most common earnings brackets in Ridgecrest are $100,000+ for men (2,412 | 32.2%) and $100,000+ for women (902 | 14.6%).
| Income | Male | Female |
| $2,499 or less | 252 (3.4%) | 261 (4.2%) |
| $2,500 to $4,999 | 183 (2.5%) | 78 (1.3%) |
| $5,000 to $7,499 | 190 (2.5%) | 132 (2.1%) |
| $7,500 to $9,999 | 113 (1.5%) | 117 (1.9%) |
| $10,000 to $12,499 | 179 (2.4%) | 380 (6.2%) |
| $12,500 to $14,999 | 82 (1.1%) | 178 (2.9%) |
| $15,000 to $17,499 | 25 (0.3%) | 124 (2.0%) |
| $17,500 to $19,999 | 42 (0.6%) | 249 (4.0%) |
| $20,000 to $22,499 | 115 (1.5%) | 200 (3.2%) |
| $22,500 to $24,999 | 213 (2.9%) | 152 (2.5%) |
| $25,000 to $29,999 | 461 (6.2%) | 568 (9.2%) |
| $30,000 to $34,999 | 158 (2.1%) | 287 (4.6%) |
| $35,000 to $39,999 | 288 (3.8%) | 332 (5.4%) |
| $40,000 to $44,999 | 184 (2.5%) | 422 (6.8%) |
| $45,000 to $49,999 | 291 (3.9%) | 181 (2.9%) |
| $50,000 to $54,999 | 126 (1.7%) | 142 (2.3%) |
| $55,000 to $64,999 | 314 (4.2%) | 429 (7.0%) |
| $65,000 to $74,999 | 357 (4.8%) | 447 (7.2%) |
| $75,000 to $99,999 | 1,497 (20.0%) | 591 (9.6%) |
| $100,000+ | 2,412 (32.2%) | 902 (14.6%) |
| Total | 7,482 (100.0%) | 6,172 (100.0%) |
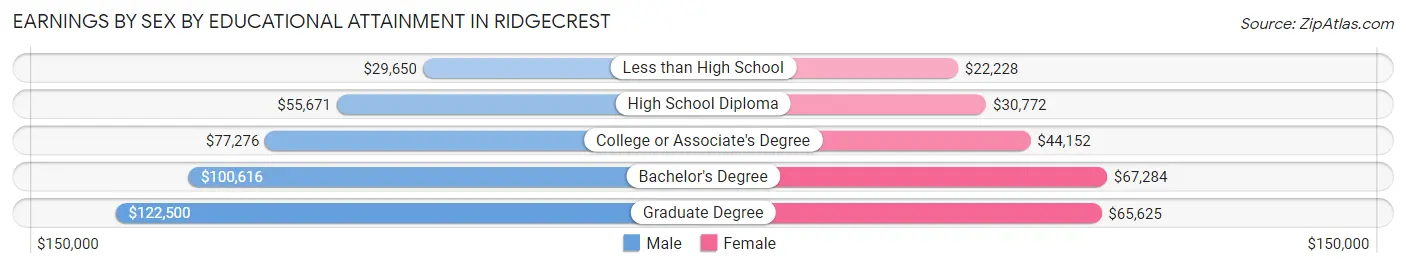
Earnings by Sex by Educational Attainment in Ridgecrest
Average earnings in Ridgecrest are $85,625 for men and $45,214 for women, a difference of 47.2%. Men with an educational attainment of graduate degree enjoy the highest average annual earnings of $122,500, while those with less than high school education earn the least with $29,650. Women with an educational attainment of bachelor's degree earn the most with the average annual earnings of $67,284, while those with less than high school education have the smallest earnings of $22,228.
| Educational Attainment | Male Income | Female Income |
| Less than High School | $29,650 | $22,228 |
| High School Diploma | $55,671 | $30,772 |
| College or Associate's Degree | $77,276 | $44,152 |
| Bachelor's Degree | $100,616 | $67,284 |
| Graduate Degree | $122,500 | $65,625 |
| Total | $85,625 | $45,214 |
Family Income in Ridgecrest
Family Income Brackets in Ridgecrest
According to the Ridgecrest family income data, there are 1,487 families falling into the $100,000 to $149,999 income range, which is the most common income bracket and makes up 22.4% of all families. Conversely, the less than $10,000 income bracket is the least frequent group with only 119 families (1.8%) belonging to this category.
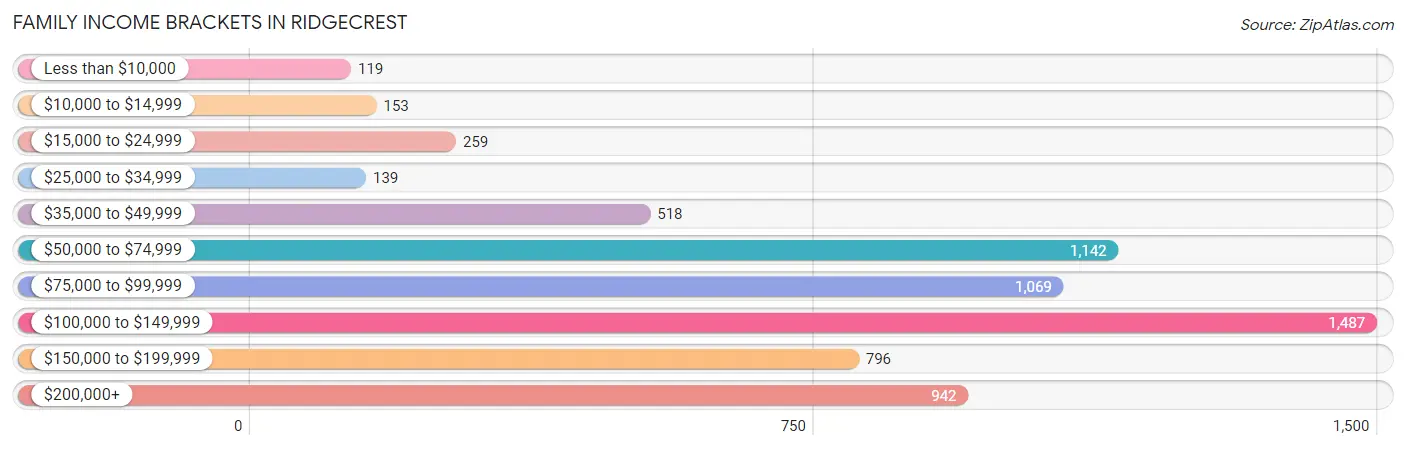
| Income Bracket | # Families | % Families |
| Less than $10,000 | 119 | 1.8% |
| $10,000 to $14,999 | 153 | 2.3% |
| $15,000 to $24,999 | 259 | 3.9% |
| $25,000 to $34,999 | 139 | 2.1% |
| $35,000 to $49,999 | 518 | 7.8% |
| $50,000 to $74,999 | 1,142 | 17.2% |
| $75,000 to $99,999 | 1,069 | 16.1% |
| $100,000 to $149,999 | 1,487 | 22.4% |
| $150,000 to $199,999 | 796 | 12.0% |
| $200,000+ | 942 | 14.2% |
Family Income by Famaliy Size in Ridgecrest
3-person families (2,092 | 31.5%) account for the highest median family income in Ridgecrest with $119,412 per family, while 2-person families (2,691 | 40.6%) have the highest median income of $47,593 per family member.
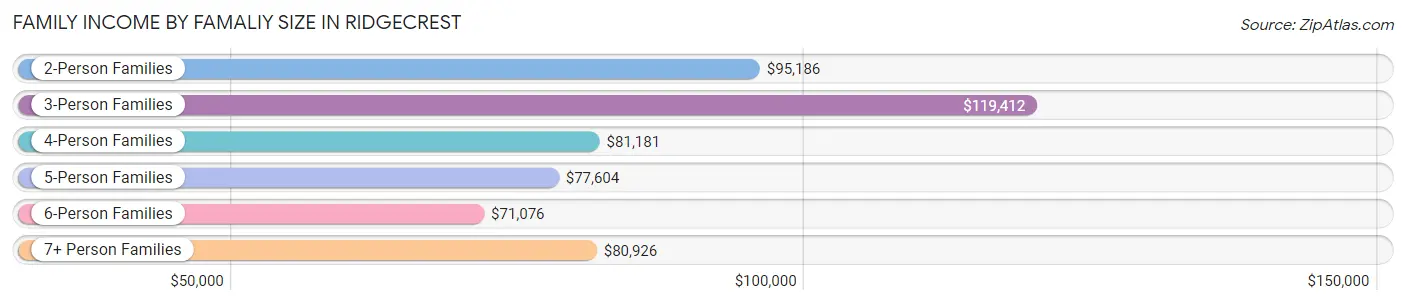
| Income Bracket | # Families | Median Income |
| 2-Person Families | 2,691 (40.6%) | $95,186 |
| 3-Person Families | 2,092 (31.5%) | $119,412 |
| 4-Person Families | 962 (14.5%) | $81,181 |
| 5-Person Families | 497 (7.5%) | $77,604 |
| 6-Person Families | 203 (3.1%) | $71,076 |
| 7+ Person Families | 192 (2.9%) | $80,926 |
| Total | 6,637 (100.0%) | $97,167 |
Family Income by Number of Earners in Ridgecrest
The median family income in Ridgecrest is $97,167, with families comprising 3+ earners (320) having the highest median family income of $144,028, while families with no earners (1,012) have the lowest median family income of $62,000, accounting for 4.8% and 15.2% of families, respectively.
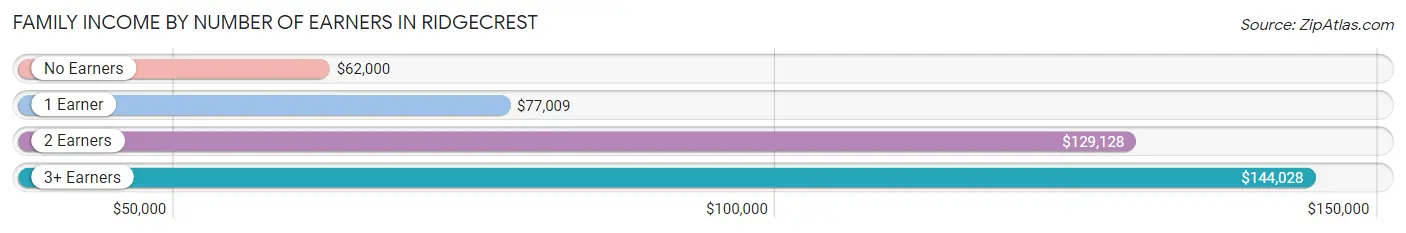
| Number of Earners | # Families | Median Income |
| No Earners | 1,012 (15.2%) | $62,000 |
| 1 Earner | 2,424 (36.5%) | $77,009 |
| 2 Earners | 2,881 (43.4%) | $129,128 |
| 3+ Earners | 320 (4.8%) | $144,028 |
| Total | 6,637 (100.0%) | $97,167 |
Household Income in Ridgecrest
Household Income Brackets in Ridgecrest
With 2,396 households falling in the category, the $100,000 to $149,999 income range is the most frequent in Ridgecrest, accounting for 21.5% of all households. In contrast, only 379 households (3.4%) fall into the $10,000 to $14,999 income bracket, making it the least populous group.
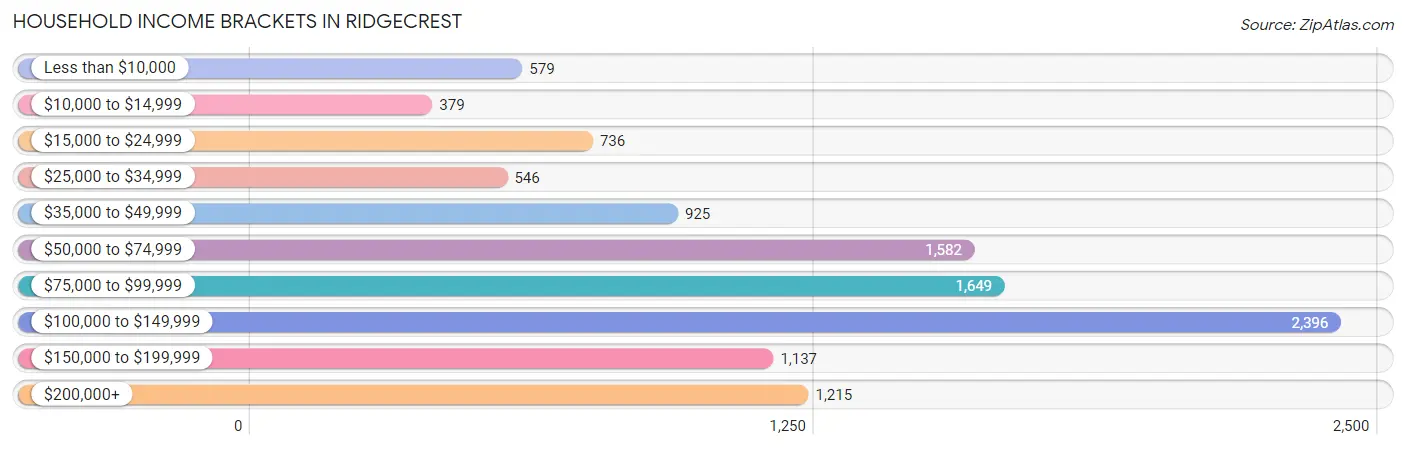
| Income Bracket | # Households | % Households |
| Less than $10,000 | 579 | 5.2% |
| $10,000 to $14,999 | 379 | 3.4% |
| $15,000 to $24,999 | 736 | 6.6% |
| $25,000 to $34,999 | 546 | 4.9% |
| $35,000 to $49,999 | 925 | 8.3% |
| $50,000 to $74,999 | 1,582 | 14.2% |
| $75,000 to $99,999 | 1,649 | 14.8% |
| $100,000 to $149,999 | 2,396 | 21.5% |
| $150,000 to $199,999 | 1,137 | 10.2% |
| $200,000+ | 1,215 | 10.9% |
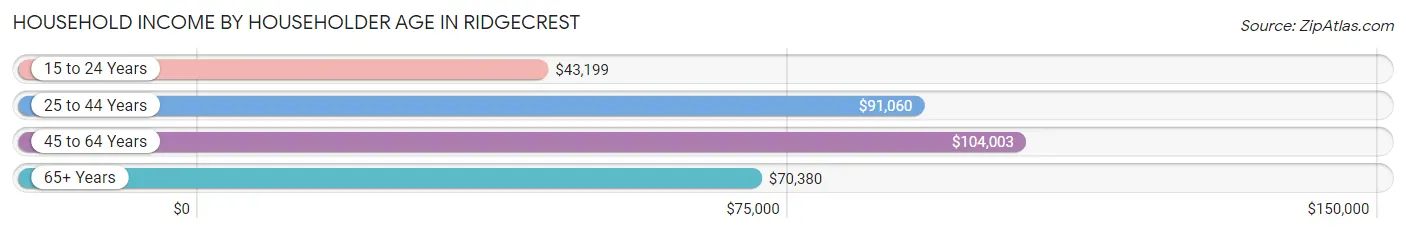
Household Income by Householder Age in Ridgecrest
The median household income in Ridgecrest is $85,872, with the highest median household income of $104,003 found in the 45 to 64 years age bracket for the primary householder. A total of 3,723 households (33.4%) fall into this category. Meanwhile, the 15 to 24 years age bracket for the primary householder has the lowest median household income of $43,199, with 359 households (3.2%) in this group.
| Income Bracket | # Households | Median Income |
| 15 to 24 Years | 359 (3.2%) | $43,199 |
| 25 to 44 Years | 4,547 (40.8%) | $91,060 |
| 45 to 64 Years | 3,723 (33.4%) | $104,003 |
| 65+ Years | 2,515 (22.6%) | $70,380 |
| Total | 11,144 (100.0%) | $85,872 |
Poverty in Ridgecrest
Income Below Poverty by Sex and Age in Ridgecrest
With 10.7% poverty level for males and 10.5% for females among the residents of Ridgecrest, 25 to 34 year old males and 55 to 64 year old females are the most vulnerable to poverty, with 391 males (17.9%) and 307 females (17.8%) in their respective age groups living below the poverty level.
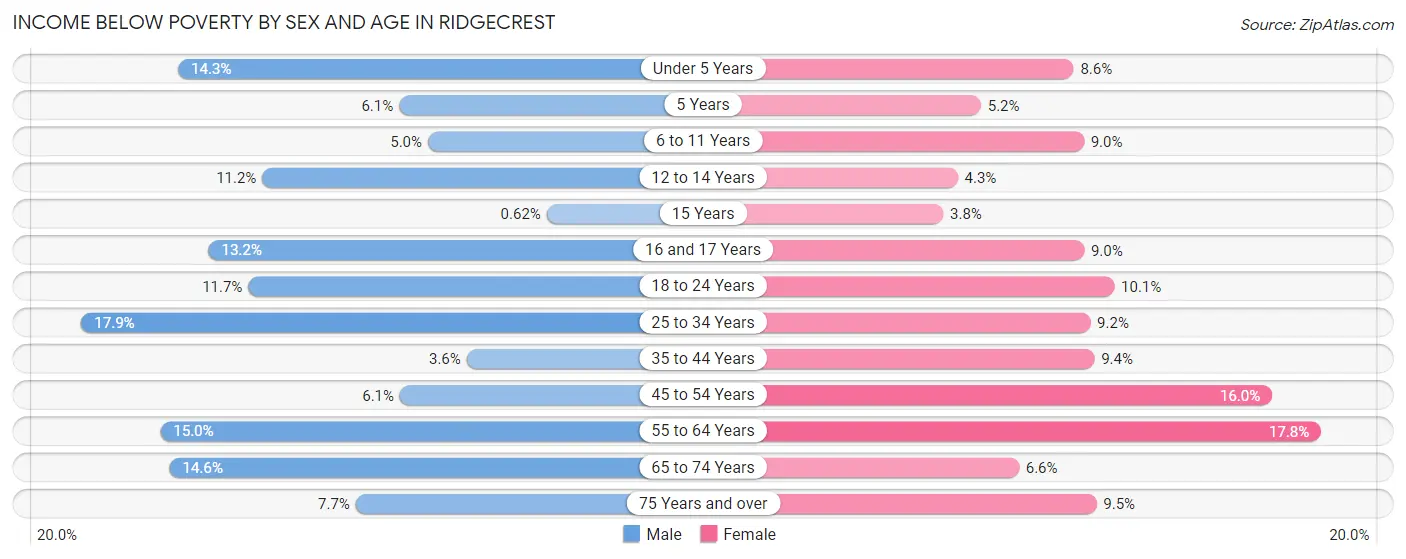
| Age Bracket | Male | Female |
| Under 5 Years | 119 (14.3%) | 75 (8.6%) |
| 5 Years | 5 (6.1%) | 11 (5.2%) |
| 6 to 11 Years | 47 (5.0%) | 159 (9.0%) |
| 12 to 14 Years | 72 (11.2%) | 32 (4.3%) |
| 15 Years | 2 (0.6%) | 7 (3.8%) |
| 16 and 17 Years | 42 (13.2%) | 24 (9.0%) |
| 18 to 24 Years | 129 (11.7%) | 126 (10.1%) |
| 25 to 34 Years | 391 (17.9%) | 177 (9.2%) |
| 35 to 44 Years | 73 (3.6%) | 201 (9.4%) |
| 45 to 54 Years | 90 (6.1%) | 247 (16.0%) |
| 55 to 64 Years | 227 (15.0%) | 307 (17.8%) |
| 65 to 74 Years | 180 (14.6%) | 56 (6.6%) |
| 75 Years and over | 60 (7.7%) | 81 (9.5%) |
| Total | 1,437 (10.7%) | 1,503 (10.5%) |
Income Above Poverty by Sex and Age in Ridgecrest
According to the poverty statistics in Ridgecrest, males aged 15 years and females aged 15 years are the age groups that are most secure financially, with 99.4% of males and 96.2% of females in these age groups living above the poverty line.
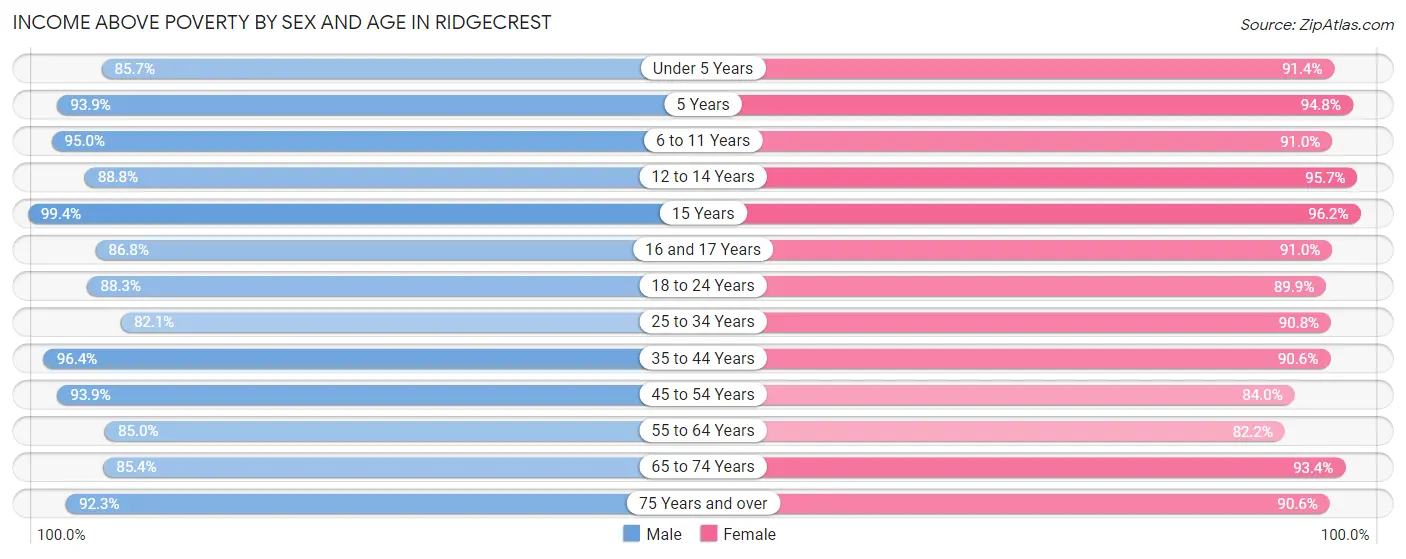
| Age Bracket | Male | Female |
| Under 5 Years | 713 (85.7%) | 797 (91.4%) |
| 5 Years | 77 (93.9%) | 202 (94.8%) |
| 6 to 11 Years | 888 (95.0%) | 1,611 (91.0%) |
| 12 to 14 Years | 572 (88.8%) | 712 (95.7%) |
| 15 Years | 321 (99.4%) | 179 (96.2%) |
| 16 and 17 Years | 277 (86.8%) | 243 (91.0%) |
| 18 to 24 Years | 974 (88.3%) | 1,120 (89.9%) |
| 25 to 34 Years | 1,795 (82.1%) | 1,742 (90.8%) |
| 35 to 44 Years | 1,959 (96.4%) | 1,945 (90.6%) |
| 45 to 54 Years | 1,392 (93.9%) | 1,300 (84.0%) |
| 55 to 64 Years | 1,290 (85.0%) | 1,419 (82.2%) |
| 65 to 74 Years | 1,051 (85.4%) | 796 (93.4%) |
| 75 Years and over | 718 (92.3%) | 776 (90.5%) |
| Total | 12,027 (89.3%) | 12,842 (89.5%) |
Income Below Poverty Among Married-Couple Families in Ridgecrest
The poverty statistics for married-couple families in Ridgecrest show that 3.7% or 179 of the total 4,826 families live below the poverty line. Families with no children have the highest poverty rate of 5.5%, comprising of 130 families. On the other hand, families with 5 or more children have the lowest poverty rate of 0.0%, which includes 0 families.
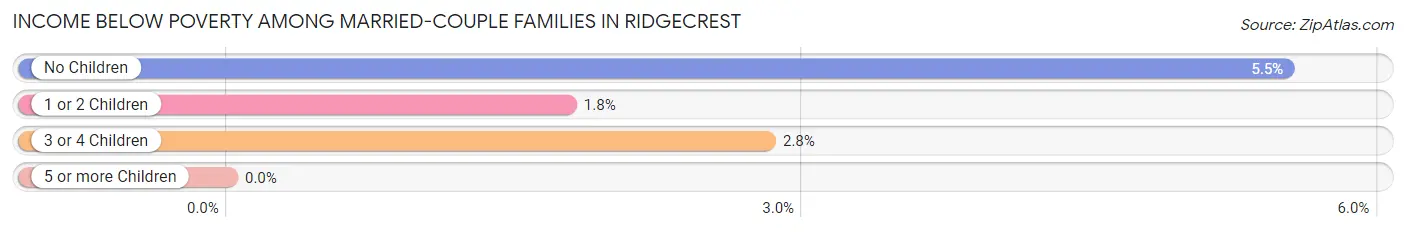
| Children | Above Poverty | Below Poverty |
| No Children | 2,225 (94.5%) | 130 (5.5%) |
| 1 or 2 Children | 1,721 (98.2%) | 31 (1.8%) |
| 3 or 4 Children | 622 (97.2%) | 18 (2.8%) |
| 5 or more Children | 79 (100.0%) | 0 (0.0%) |
| Total | 4,647 (96.3%) | 179 (3.7%) |
Income Below Poverty Among Single-Parent Households in Ridgecrest
According to the poverty data in Ridgecrest, 10.6% or 65 single-father households and 17.1% or 204 single-mother households are living below the poverty line. Among single-father households, those with 3 or 4 children have the highest poverty rate, with 5 households (12.5%) experiencing poverty. Likewise, among single-mother households, those with 5 or more children have the highest poverty rate, with 14 households (100.0%) falling below the poverty line.
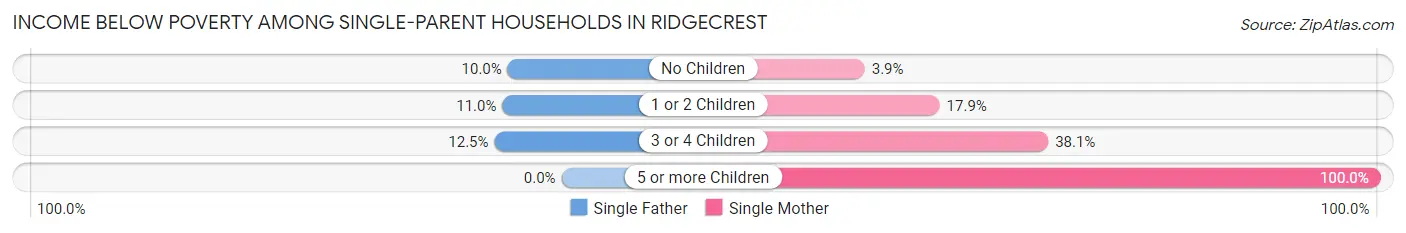
| Children | Single Father | Single Mother |
| No Children | 34 (10.0%) | 12 (3.9%) |
| 1 or 2 Children | 26 (11.0%) | 138 (17.9%) |
| 3 or 4 Children | 5 (12.5%) | 40 (38.1%) |
| 5 or more Children | 0 (0.0%) | 14 (100.0%) |
| Total | 65 (10.6%) | 204 (17.1%) |
Income Below Poverty Among Married-Couple vs Single-Parent Households in Ridgecrest
The poverty data for Ridgecrest shows that 179 of the married-couple family households (3.7%) and 269 of the single-parent households (14.8%) are living below the poverty level. Within the married-couple family households, those with no children have the highest poverty rate, with 130 households (5.5%) falling below the poverty line. Among the single-parent households, those with 5 or more children have the highest poverty rate, with 14 household (100.0%) living below poverty.
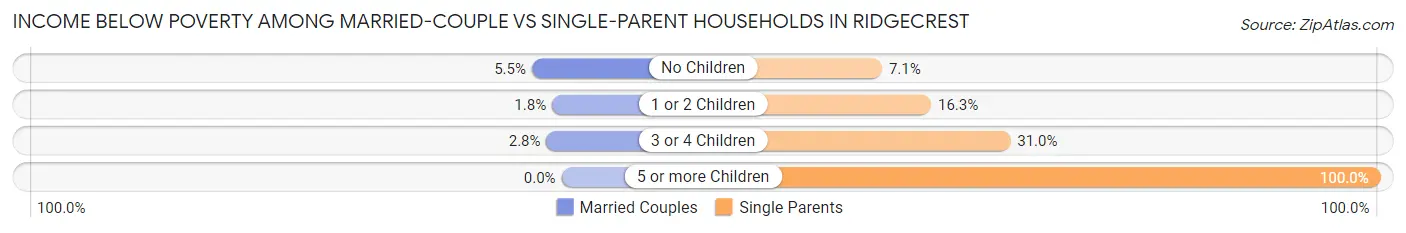
| Children | Married-Couple Families | Single-Parent Households |
| No Children | 130 (5.5%) | 46 (7.1%) |
| 1 or 2 Children | 31 (1.8%) | 164 (16.3%) |
| 3 or 4 Children | 18 (2.8%) | 45 (31.0%) |
| 5 or more Children | 0 (0.0%) | 14 (100.0%) |
| Total | 179 (3.7%) | 269 (14.8%) |
Race in Ridgecrest
The most populous races in Ridgecrest are White / Caucasian (20,424 | 72.6%), Hispanic or Latino (6,109 | 21.7%), and Two or more Races (2,693 | 9.6%).
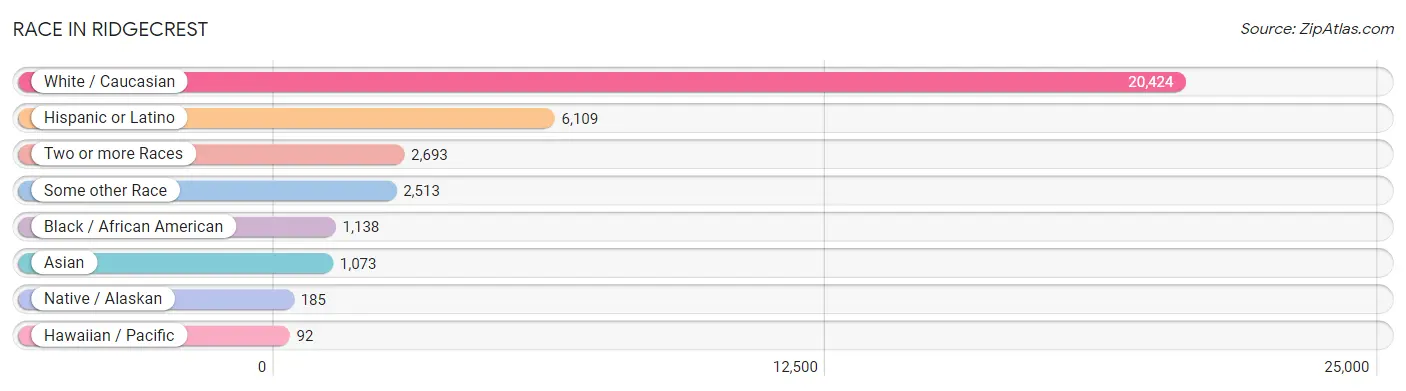
| Race | # Population | % Population |
| Asian | 1,073 | 3.8% |
| Black / African American | 1,138 | 4.1% |
| Hawaiian / Pacific | 92 | 0.3% |
| Hispanic or Latino | 6,109 | 21.7% |
| Native / Alaskan | 185 | 0.7% |
| White / Caucasian | 20,424 | 72.6% |
| Two or more Races | 2,693 | 9.6% |
| Some other Race | 2,513 | 8.9% |
| Total | 28,118 | 100.0% |
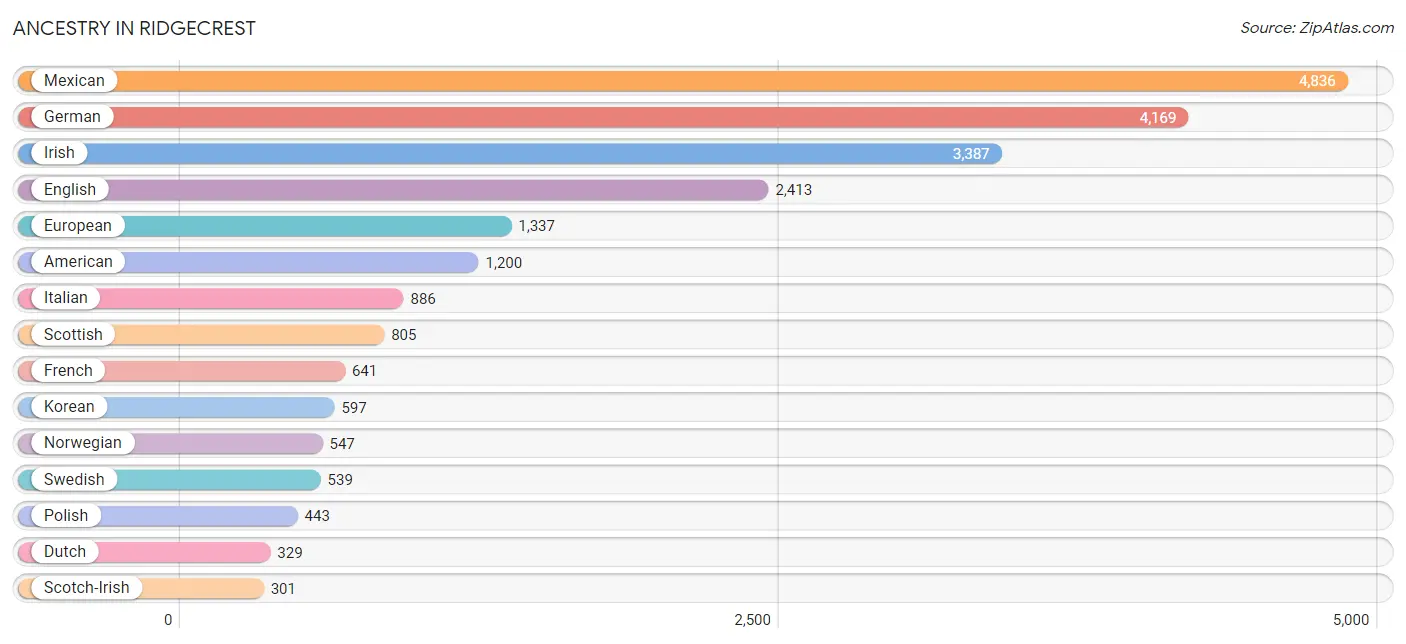
Ancestry in Ridgecrest
The most populous ancestries reported in Ridgecrest are Mexican (4,836 | 17.2%), German (4,169 | 14.8%), Irish (3,387 | 12.0%), English (2,413 | 8.6%), and European (1,337 | 4.8%), together accounting for 57.4% of all Ridgecrest residents.
| Ancestry | # Population | % Population |
| African | 1 | 0.0% |
| American | 1,200 | 4.3% |
| Apache | 12 | 0.0% |
| Arab | 192 | 0.7% |
| Armenian | 164 | 0.6% |
| Australian | 12 | 0.0% |
| Austrian | 47 | 0.2% |
| Belgian | 24 | 0.1% |
| Bhutanese | 188 | 0.7% |
| Blackfeet | 42 | 0.2% |
| Bolivian | 22 | 0.1% |
| British | 175 | 0.6% |
| Bulgarian | 16 | 0.1% |
| Burmese | 60 | 0.2% |
| Canadian | 231 | 0.8% |
| Celtic | 13 | 0.1% |
| Central American | 137 | 0.5% |
| Central American Indian | 7 | 0.0% |
| Cherokee | 97 | 0.3% |
| Chippewa | 18 | 0.1% |
| Colombian | 51 | 0.2% |
| Croatian | 12 | 0.0% |
| Czech | 20 | 0.1% |
| Danish | 256 | 0.9% |
| Dominican | 33 | 0.1% |
| Dutch | 329 | 1.2% |
| Eastern European | 29 | 0.1% |
| Egyptian | 169 | 0.6% |
| English | 2,413 | 8.6% |
| European | 1,337 | 4.8% |
| Finnish | 63 | 0.2% |
| French | 641 | 2.3% |
| French Canadian | 147 | 0.5% |
| German | 4,169 | 14.8% |
| Greek | 13 | 0.1% |
| Guamanian / Chamorro | 32 | 0.1% |
| Guatemalan | 60 | 0.2% |
| Hungarian | 39 | 0.1% |
| Indian (Asian) | 206 | 0.7% |
| Iranian | 22 | 0.1% |
| Irish | 3,387 | 12.0% |
| Iroquois | 37 | 0.1% |
| Italian | 886 | 3.2% |
| Jamaican | 46 | 0.2% |
| Japanese | 50 | 0.2% |
| Korean | 597 | 2.1% |
| Laotian | 11 | 0.0% |
| Lebanese | 23 | 0.1% |
| Malaysian | 17 | 0.1% |
| Mexican | 4,836 | 17.2% |
| Mexican American Indian | 99 | 0.4% |
| Native Hawaiian | 216 | 0.8% |
| Navajo | 23 | 0.1% |
| Nicaraguan | 21 | 0.1% |
| Nigerian | 9 | 0.0% |
| Northern European | 239 | 0.9% |
| Norwegian | 547 | 1.9% |
| Pakistani | 212 | 0.7% |
| Panamanian | 16 | 0.1% |
| Peruvian | 113 | 0.4% |
| Polish | 443 | 1.6% |
| Portuguese | 271 | 1.0% |
| Puerto Rican | 151 | 0.5% |
| Romanian | 51 | 0.2% |
| Russian | 54 | 0.2% |
| Salvadoran | 40 | 0.1% |
| Samoan | 39 | 0.1% |
| Scandinavian | 81 | 0.3% |
| Scotch-Irish | 301 | 1.1% |
| Scottish | 805 | 2.9% |
| Seminole | 28 | 0.1% |
| Slavic | 12 | 0.0% |
| Slovak | 11 | 0.0% |
| South American | 186 | 0.7% |
| Spaniard | 93 | 0.3% |
| Spanish | 56 | 0.2% |
| Spanish American | 124 | 0.4% |
| Sri Lankan | 128 | 0.5% |
| Subsaharan African | 16 | 0.1% |
| Swedish | 539 | 1.9% |
| Swiss | 77 | 0.3% |
| Thai | 68 | 0.2% |
| Ukrainian | 43 | 0.2% |
| Welsh | 297 | 1.1% | View All 84 Rows |
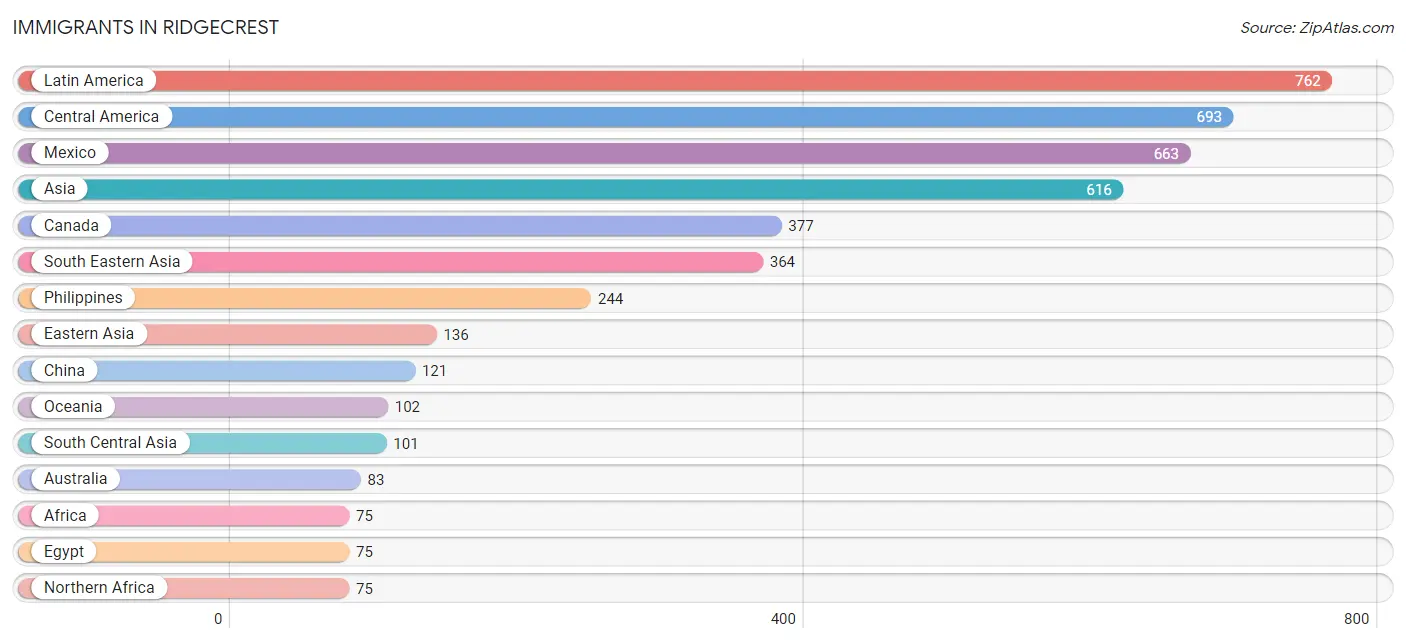
Immigrants in Ridgecrest
The most numerous immigrant groups reported in Ridgecrest came from Latin America (762 | 2.7%), Central America (693 | 2.5%), Mexico (663 | 2.4%), Asia (616 | 2.2%), and Canada (377 | 1.3%), together accounting for 11.1% of all Ridgecrest residents.
| Immigration Origin | # Population | % Population |
| Africa | 75 | 0.3% |
| Asia | 616 | 2.2% |
| Australia | 83 | 0.3% |
| Bangladesh | 34 | 0.1% |
| Bolivia | 24 | 0.1% |
| Bulgaria | 16 | 0.1% |
| Cambodia | 17 | 0.1% |
| Canada | 377 | 1.3% |
| Caribbean | 10 | 0.0% |
| Central America | 693 | 2.5% |
| China | 121 | 0.4% |
| Colombia | 35 | 0.1% |
| Eastern Asia | 136 | 0.5% |
| Eastern Europe | 16 | 0.1% |
| Egypt | 75 | 0.3% |
| Europe | 42 | 0.2% |
| France | 8 | 0.0% |
| Germany | 6 | 0.0% |
| Guatemala | 30 | 0.1% |
| Haiti | 4 | 0.0% |
| Hong Kong | 58 | 0.2% |
| India | 45 | 0.2% |
| Iran | 22 | 0.1% |
| Jamaica | 6 | 0.0% |
| Japan | 15 | 0.1% |
| Latin America | 762 | 2.7% |
| Lebanon | 15 | 0.1% |
| Mexico | 663 | 2.4% |
| Northern Africa | 75 | 0.3% |
| Northern Europe | 12 | 0.0% |
| Oceania | 102 | 0.4% |
| Philippines | 244 | 0.9% |
| South America | 59 | 0.2% |
| South Central Asia | 101 | 0.4% |
| South Eastern Asia | 364 | 1.3% |
| Thailand | 40 | 0.1% |
| Vietnam | 63 | 0.2% |
| Western Asia | 15 | 0.1% |
| Western Europe | 14 | 0.1% | View All 39 Rows |
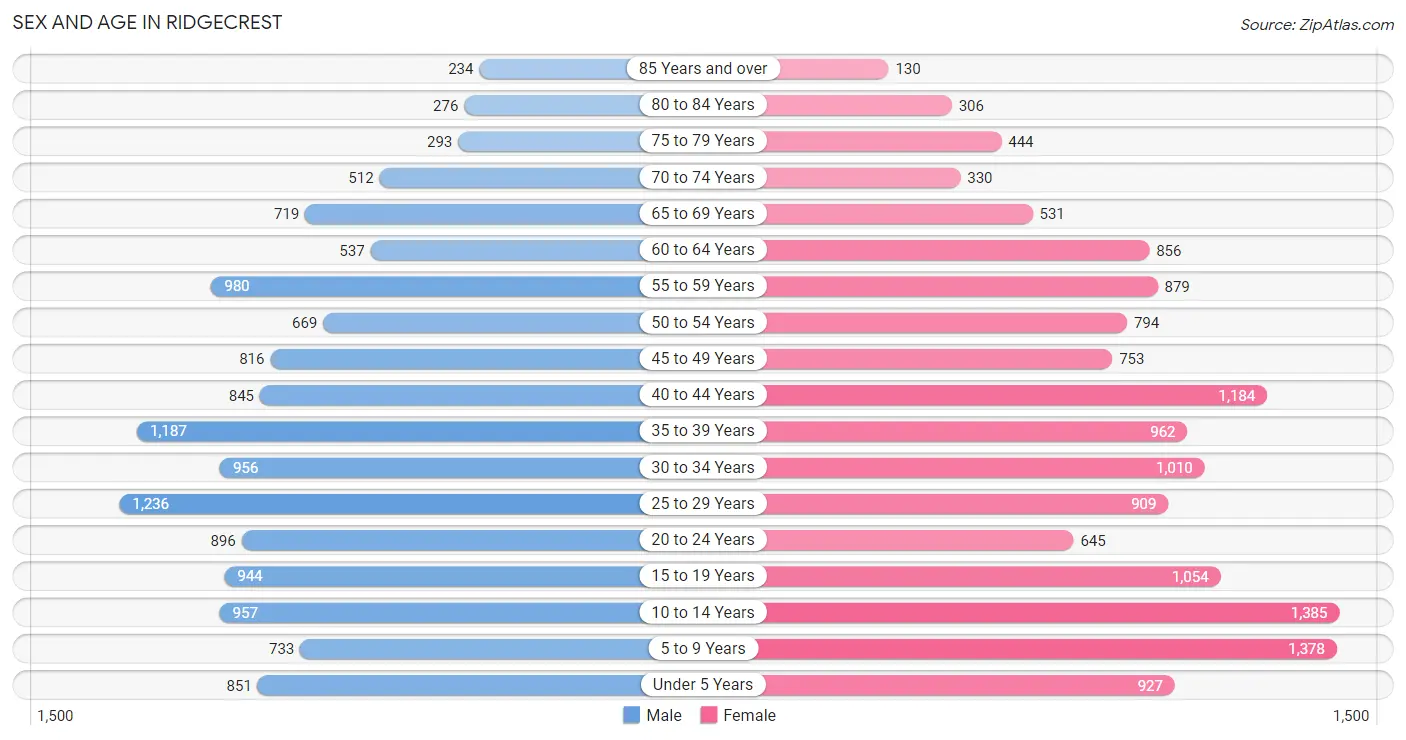
Sex and Age in Ridgecrest
Sex and Age in Ridgecrest
The most populous age groups in Ridgecrest are 25 to 29 Years (1,236 | 9.1%) for men and 10 to 14 Years (1,385 | 9.6%) for women.
| Age Bracket | Male | Female |
| Under 5 Years | 851 (6.2%) | 927 (6.4%) |
| 5 to 9 Years | 733 (5.4%) | 1,378 (9.5%) |
| 10 to 14 Years | 957 (7.0%) | 1,385 (9.6%) |
| 15 to 19 Years | 944 (6.9%) | 1,054 (7.3%) |
| 20 to 24 Years | 896 (6.6%) | 645 (4.5%) |
| 25 to 29 Years | 1,236 (9.1%) | 909 (6.3%) |
| 30 to 34 Years | 956 (7.0%) | 1,010 (7.0%) |
| 35 to 39 Years | 1,187 (8.7%) | 962 (6.7%) |
| 40 to 44 Years | 845 (6.2%) | 1,184 (8.2%) |
| 45 to 49 Years | 816 (6.0%) | 753 (5.2%) |
| 50 to 54 Years | 669 (4.9%) | 794 (5.5%) |
| 55 to 59 Years | 980 (7.2%) | 879 (6.1%) |
| 60 to 64 Years | 537 (3.9%) | 856 (5.9%) |
| 65 to 69 Years | 719 (5.3%) | 531 (3.7%) |
| 70 to 74 Years | 512 (3.7%) | 330 (2.3%) |
| 75 to 79 Years | 293 (2.1%) | 444 (3.1%) |
| 80 to 84 Years | 276 (2.0%) | 306 (2.1%) |
| 85 Years and over | 234 (1.7%) | 130 (0.9%) |
| Total | 13,641 (100.0%) | 14,477 (100.0%) |
Families and Households in Ridgecrest
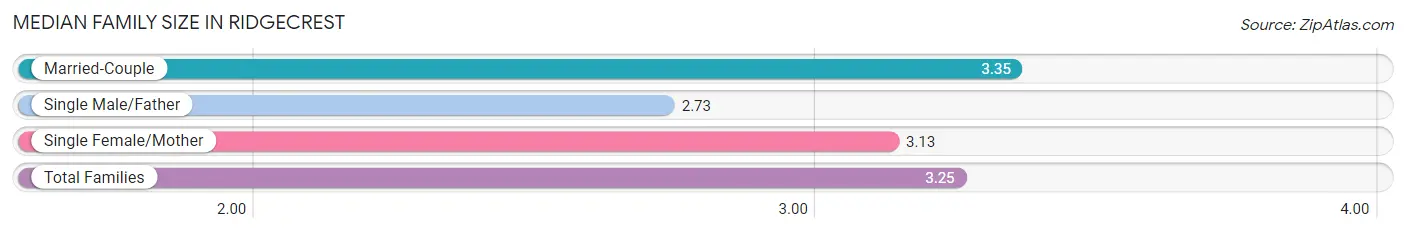
Median Family Size in Ridgecrest
The median family size in Ridgecrest is 3.25 persons per family, with married-couple families (4,826 | 72.7%) accounting for the largest median family size of 3.35 persons per family. On the other hand, single male/father families (615 | 9.3%) represent the smallest median family size with 2.73 persons per family.
| Family Type | # Families | Family Size |
| Married-Couple | 4,826 (72.7%) | 3.35 |
| Single Male/Father | 615 (9.3%) | 2.73 |
| Single Female/Mother | 1,196 (18.0%) | 3.13 |
| Total Families | 6,637 (100.0%) | 3.25 |
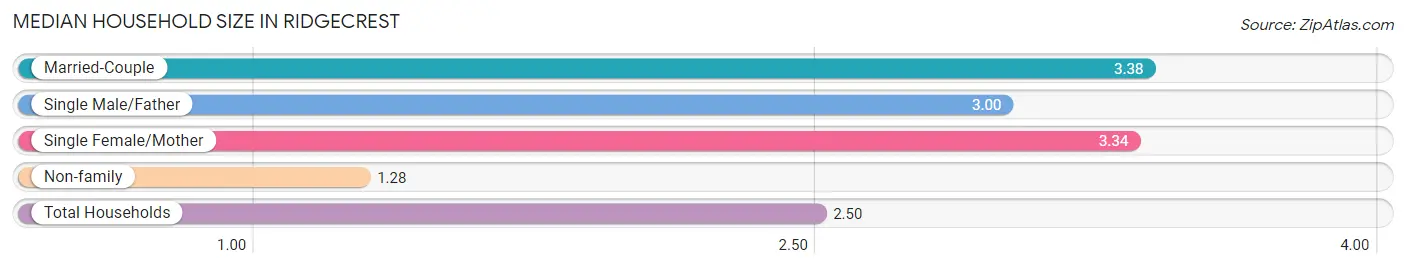
Median Household Size in Ridgecrest
The median household size in Ridgecrest is 2.50 persons per household, with married-couple households (4,826 | 43.3%) accounting for the largest median household size of 3.38 persons per household. non-family households (4,507 | 40.4%) represent the smallest median household size with 1.28 persons per household.
| Household Type | # Households | Household Size |
| Married-Couple | 4,826 (43.3%) | 3.38 |
| Single Male/Father | 615 (5.5%) | 3.00 |
| Single Female/Mother | 1,196 (10.7%) | 3.34 |
| Non-family | 4,507 (40.4%) | 1.28 |
| Total Households | 11,144 (100.0%) | 2.50 |
Household Size by Marriage Status in Ridgecrest
Out of a total of 11,144 households in Ridgecrest, 6,637 (59.6%) are family households, while 4,507 (40.4%) are nonfamily households. The most numerous type of family households are 2-person households, comprising 2,536, and the most common type of nonfamily households are 1-person households, comprising 3,586.
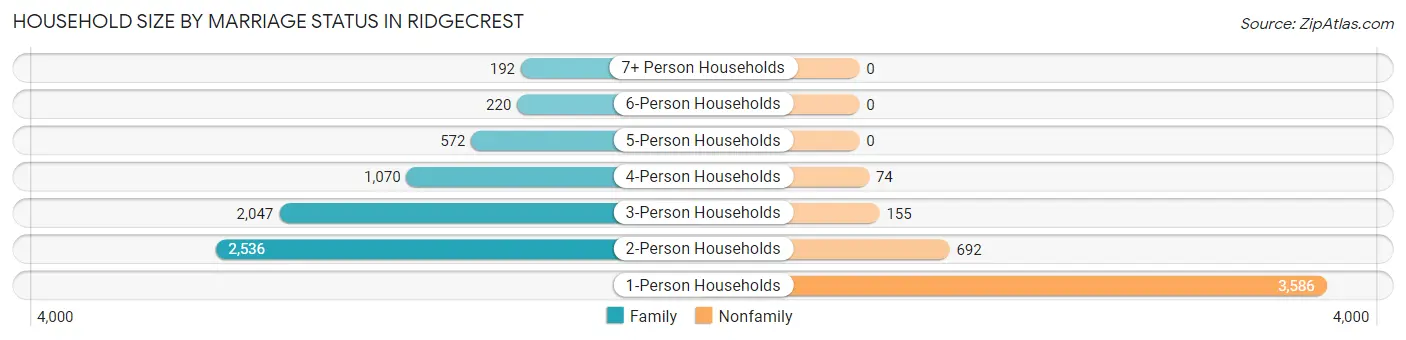
| Household Size | Family Households | Nonfamily Households |
| 1-Person Households | - | 3,586 (32.2%) |
| 2-Person Households | 2,536 (22.8%) | 692 (6.2%) |
| 3-Person Households | 2,047 (18.4%) | 155 (1.4%) |
| 4-Person Households | 1,070 (9.6%) | 74 (0.7%) |
| 5-Person Households | 572 (5.1%) | 0 (0.0%) |
| 6-Person Households | 220 (2.0%) | 0 (0.0%) |
| 7+ Person Households | 192 (1.7%) | 0 (0.0%) |
| Total | 6,637 (59.6%) | 4,507 (40.4%) |
Female Fertility in Ridgecrest
Fertility by Age in Ridgecrest
Average fertility rate in Ridgecrest is 23.0 births per 1,000 women. Women in the age bracket of 20 to 34 years have the highest fertility rate with 53.0 births per 1,000 women. Women in the age bracket of 20 to 34 years acount for 86.5% of all women with births.
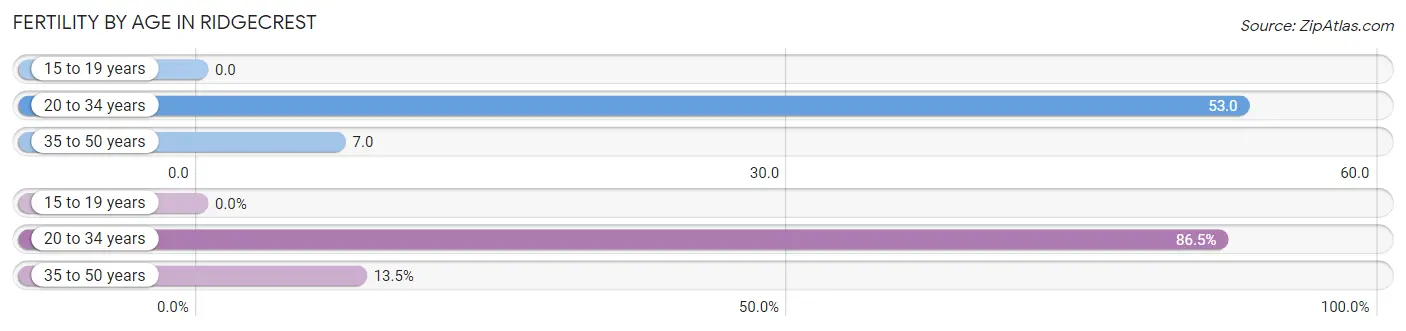
| Age Bracket | Women with Births | Births / 1,000 Women |
| 15 to 19 years | 0 (0.0%) | 0.0 |
| 20 to 34 years | 135 (86.5%) | 53.0 |
| 35 to 50 years | 21 (13.5%) | 7.0 |
| Total | 156 (100.0%) | 23.0 |
Fertility by Age by Marriage Status in Ridgecrest
76.9% of women with births (156) in Ridgecrest are married. The highest percentage of unmarried women with births falls into 20 to 34 years age bracket with 24.4% of them unmarried at the time of birth, while the lowest percentage of unmarried women with births belong to 35 to 50 years age bracket with 14.3% of them unmarried.
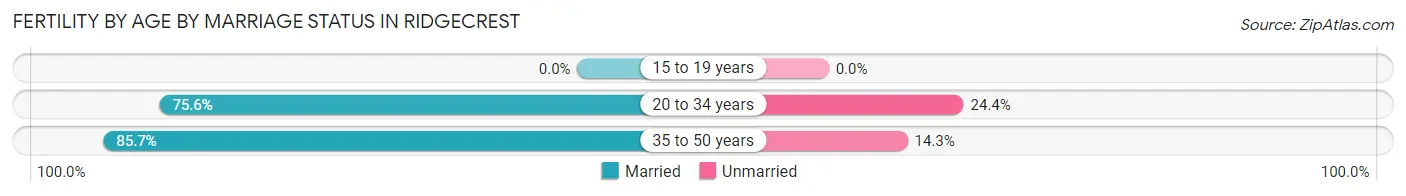
| Age Bracket | Married | Unmarried |
| 15 to 19 years | 0 (0.0%) | 0 (0.0%) |
| 20 to 34 years | 102 (75.6%) | 33 (24.4%) |
| 35 to 50 years | 18 (85.7%) | 3 (14.3%) |
| Total | 120 (76.9%) | 36 (23.1%) |
Fertility by Education in Ridgecrest
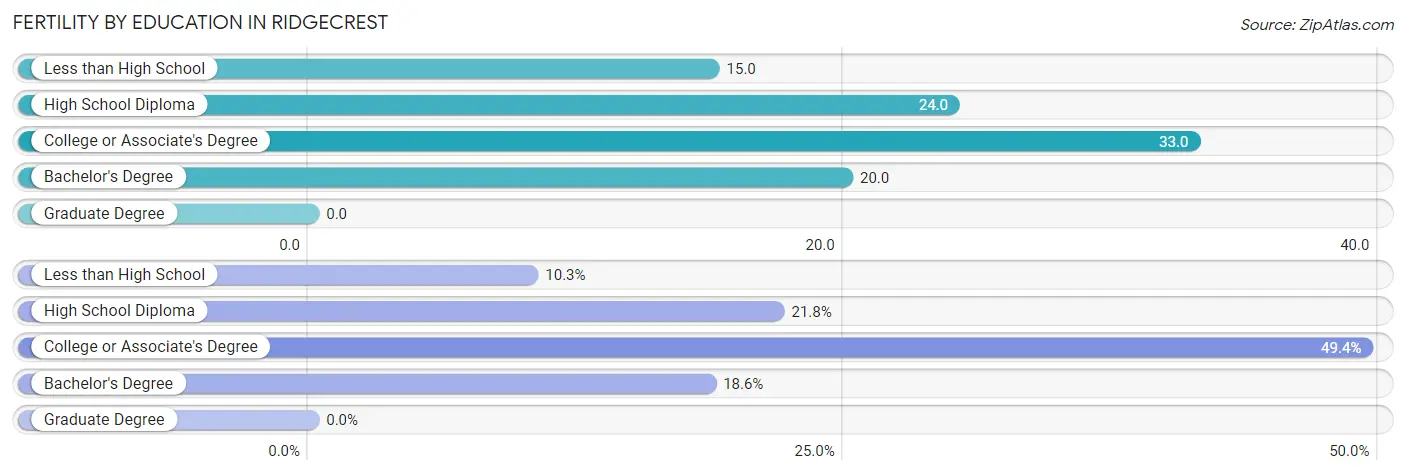
| Educational Attainment | Women with Births | Births / 1,000 Women |
| Less than High School | 16 (10.3%) | 15.0 |
| High School Diploma | 34 (21.8%) | 24.0 |
| College or Associate's Degree | 77 (49.4%) | 33.0 |
| Bachelor's Degree | 29 (18.6%) | 20.0 |
| Graduate Degree | 0 (0.0%) | 0.0 |
| Total | 156 (100.0%) | 23.0 |
Fertility by Education by Marriage Status in Ridgecrest
23.1% of women with births in Ridgecrest are unmarried. Women with the educational attainment of less than high school are most likely to be married with 100.0% of them married at childbirth, while women with the educational attainment of high school diploma are least likely to be married with 67.6% of them unmarried at childbirth.
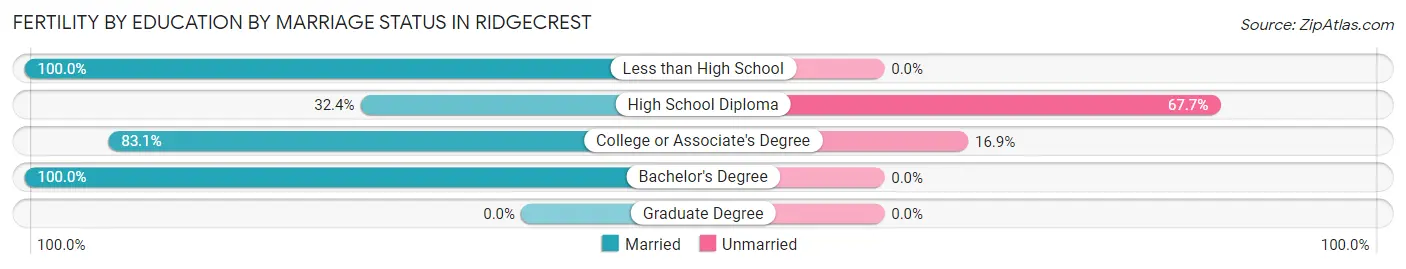
| Educational Attainment | Married | Unmarried |
| Less than High School | 16 (100.0%) | 0 (0.0%) |
| High School Diploma | 11 (32.4%) | 23 (67.6%) |
| College or Associate's Degree | 64 (83.1%) | 13 (16.9%) |
| Bachelor's Degree | 29 (100.0%) | 0 (0.0%) |
| Graduate Degree | 0 (0.0%) | 0 (0.0%) |
| Total | 120 (76.9%) | 36 (23.1%) |
Employment Characteristics in Ridgecrest
Employment by Class of Employer in Ridgecrest
Among the 12,289 employed individuals in Ridgecrest, private company employees (4,935 | 40.2%), federal government employees (4,521 | 36.8%), and local government employees (1,522 | 12.4%) make up the most common classes of employment.
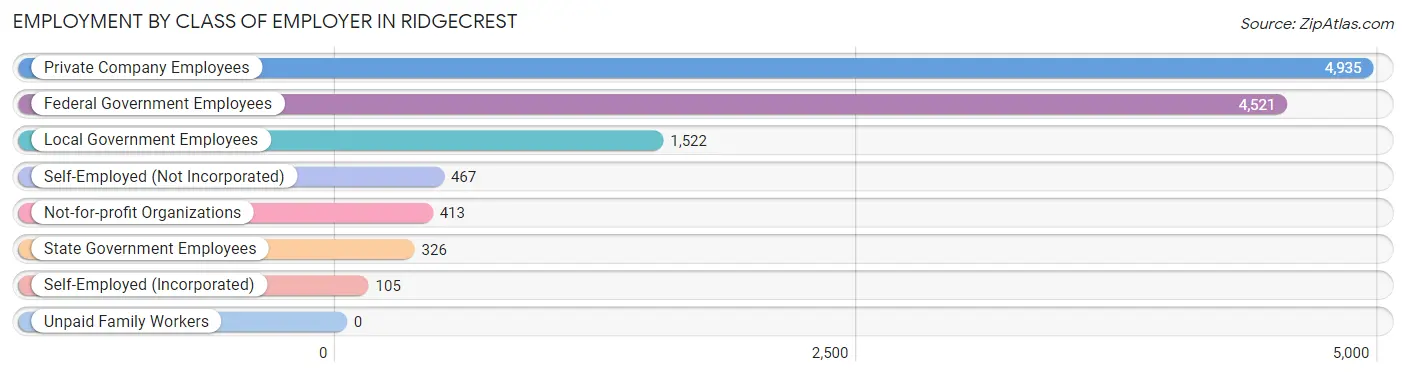
| Employer Class | # Employees | % Employees |
| Private Company Employees | 4,935 | 40.2% |
| Self-Employed (Incorporated) | 105 | 0.9% |
| Self-Employed (Not Incorporated) | 467 | 3.8% |
| Not-for-profit Organizations | 413 | 3.4% |
| Local Government Employees | 1,522 | 12.4% |
| State Government Employees | 326 | 2.6% |
| Federal Government Employees | 4,521 | 36.8% |
| Unpaid Family Workers | 0 | 0.0% |
| Total | 12,289 | 100.0% |
Employment Status by Age in Ridgecrest
According to the labor force statistics for Ridgecrest, out of the total population over 16 years of age (21,378), 63.8% or 13,639 individuals are in the labor force, with 9.2% or 1,255 of them unemployed. The age group with the highest labor force participation rate is 20 to 24 years, with 84.5% or 1,302 individuals in the labor force. Within the labor force, the 20 to 24 years age range has the highest percentage of unemployed individuals, with 24.6% or 320 of them being unemployed.
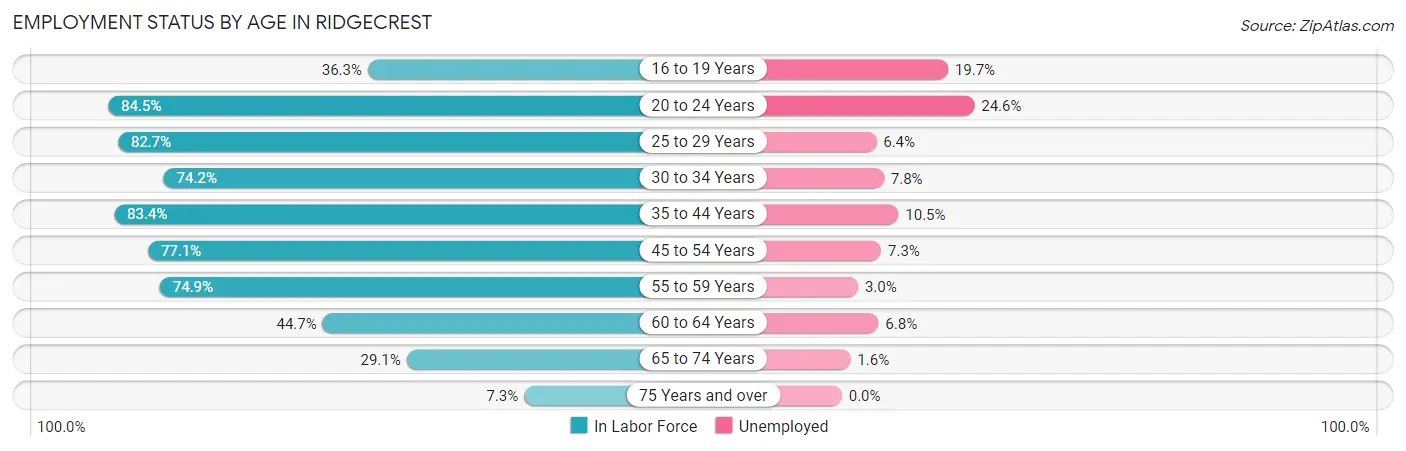
| Age Bracket | In Labor Force | Unemployed |
| 16 to 19 Years | 541 (36.3%) | 107 (19.7%) |
| 20 to 24 Years | 1,302 (84.5%) | 320 (24.6%) |
| 25 to 29 Years | 1,774 (82.7%) | 114 (6.4%) |
| 30 to 34 Years | 1,459 (74.2%) | 114 (7.8%) |
| 35 to 44 Years | 3,484 (83.4%) | 366 (10.5%) |
| 45 to 54 Years | 2,338 (77.1%) | 171 (7.3%) |
| 55 to 59 Years | 1,392 (74.9%) | 42 (3.0%) |
| 60 to 64 Years | 623 (44.7%) | 42 (6.8%) |
| 65 to 74 Years | 609 (29.1%) | 10 (1.6%) |
| 75 Years and over | 123 (7.3%) | 0 (0.0%) |
| Total | 13,639 (63.8%) | 1,255 (9.2%) |
Employment Status by Educational Attainment in Ridgecrest
According to labor force statistics for Ridgecrest, 76.0% of individuals (11,075) out of the total population between 25 and 64 years of age (14,573) are in the labor force, with 7.7% or 853 of them being unemployed. The group with the highest labor force participation rate are those with the educational attainment of bachelor's degree or higher, with 88.2% or 4,328 individuals in the labor force. Within the labor force, individuals with less than high school education have the highest percentage of unemployment, with 24.4% or 196 of them being unemployed.
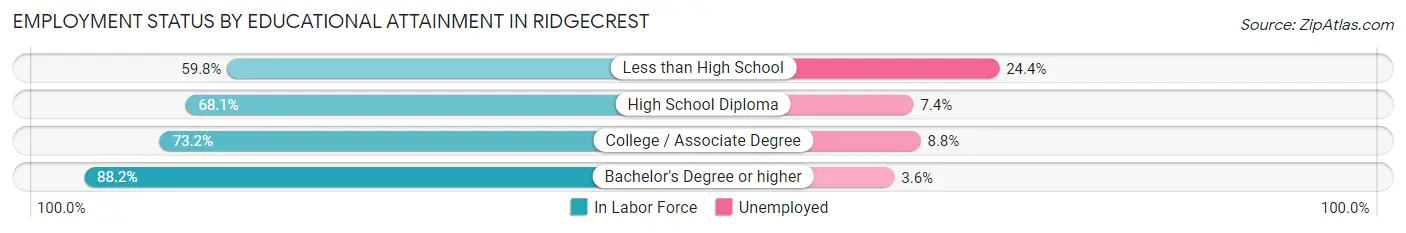
| Educational Attainment | In Labor Force | Unemployed |
| Less than High School | 804 (59.8%) | 328 (24.4%) |
| High School Diploma | 2,084 (68.1%) | 226 (7.4%) |
| College / Associate Degree | 3,852 (73.2%) | 463 (8.8%) |
| Bachelor's Degree or higher | 4,328 (88.2%) | 177 (3.6%) |
| Total | 11,075 (76.0%) | 1,122 (7.7%) |
Employment Occupations by Sex in Ridgecrest
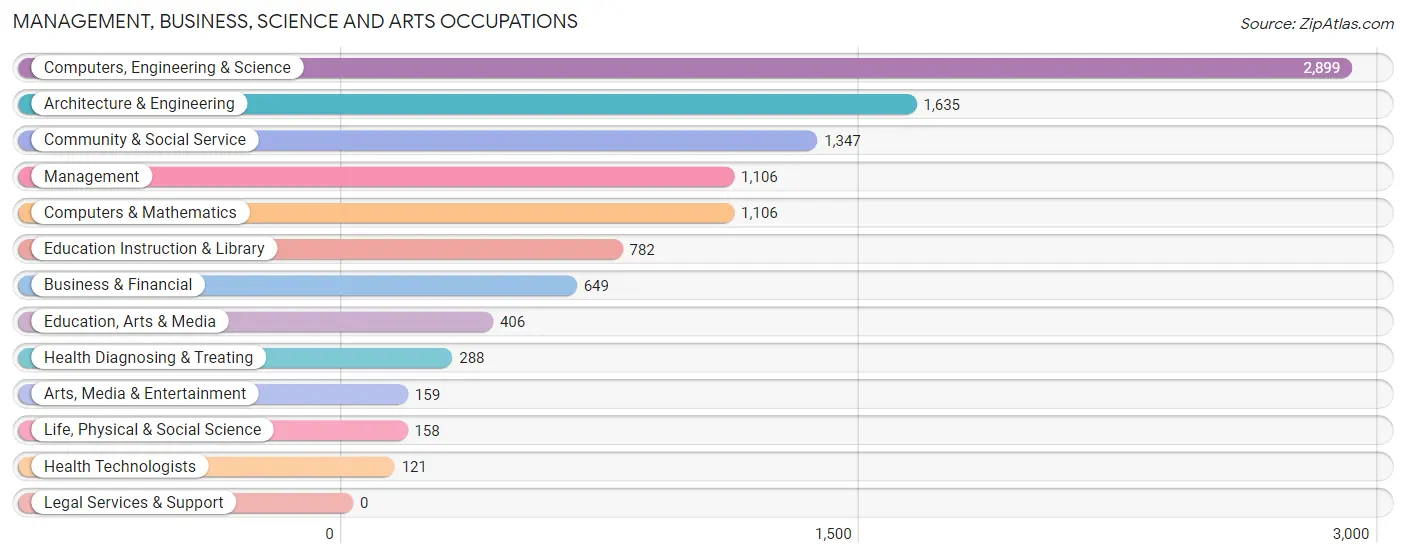
Management, Business, Science and Arts Occupations
The most common Management, Business, Science and Arts occupations in Ridgecrest are Computers, Engineering & Science (2,899 | 24.5%), Architecture & Engineering (1,635 | 13.8%), Community & Social Service (1,347 | 11.4%), Management (1,106 | 9.3%), and Computers & Mathematics (1,106 | 9.3%).
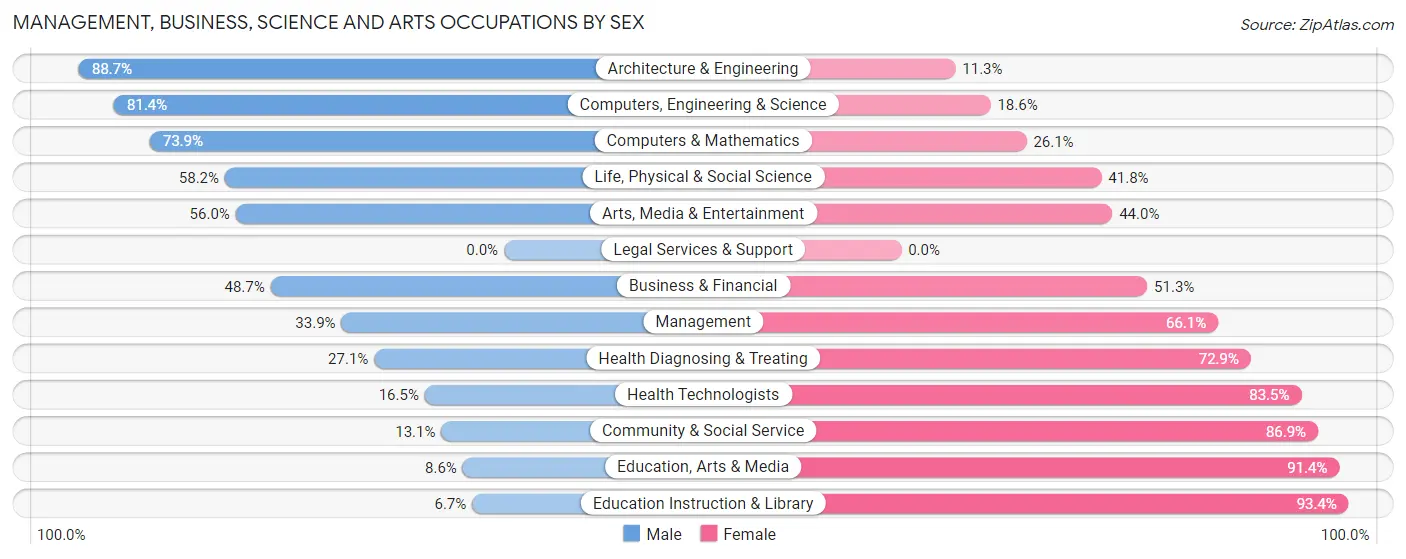
Management, Business, Science and Arts Occupations by Sex
Within the Management, Business, Science and Arts occupations in Ridgecrest, the most male-oriented occupations are Architecture & Engineering (88.7%), Computers, Engineering & Science (81.4%), and Computers & Mathematics (73.9%), while the most female-oriented occupations are Education Instruction & Library (93.3%), Education, Arts & Media (91.4%), and Community & Social Service (86.9%).
| Occupation | Male | Female |
| Management | 375 (33.9%) | 731 (66.1%) |
| Business & Financial | 316 (48.7%) | 333 (51.3%) |
| Computers, Engineering & Science | 2,359 (81.4%) | 540 (18.6%) |
| Computers & Mathematics | 817 (73.9%) | 289 (26.1%) |
| Architecture & Engineering | 1,450 (88.7%) | 185 (11.3%) |
| Life, Physical & Social Science | 92 (58.2%) | 66 (41.8%) |
| Community & Social Service | 176 (13.1%) | 1,171 (86.9%) |
| Education, Arts & Media | 35 (8.6%) | 371 (91.4%) |
| Legal Services & Support | 0 (0.0%) | 0 (0.0%) |
| Education Instruction & Library | 52 (6.7%) | 730 (93.3%) |
| Arts, Media & Entertainment | 89 (56.0%) | 70 (44.0%) |
| Health Diagnosing & Treating | 78 (27.1%) | 210 (72.9%) |
| Health Technologists | 20 (16.5%) | 101 (83.5%) |
| Total (Category) | 3,304 (52.5%) | 2,985 (47.5%) |
| Total (Overall) | 6,179 (52.2%) | 5,661 (47.8%) |
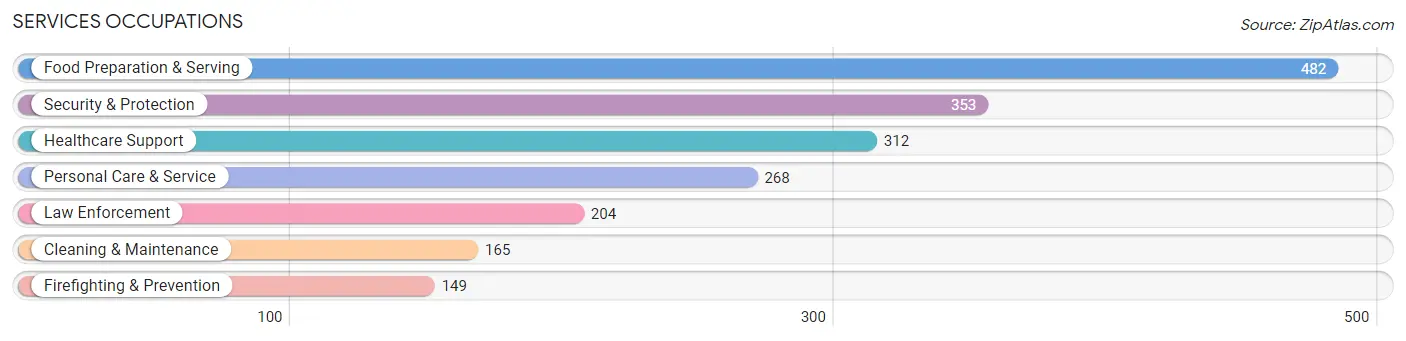
Services Occupations
The most common Services occupations in Ridgecrest are Food Preparation & Serving (482 | 4.1%), Security & Protection (353 | 3.0%), Healthcare Support (312 | 2.6%), Personal Care & Service (268 | 2.3%), and Law Enforcement (204 | 1.7%).
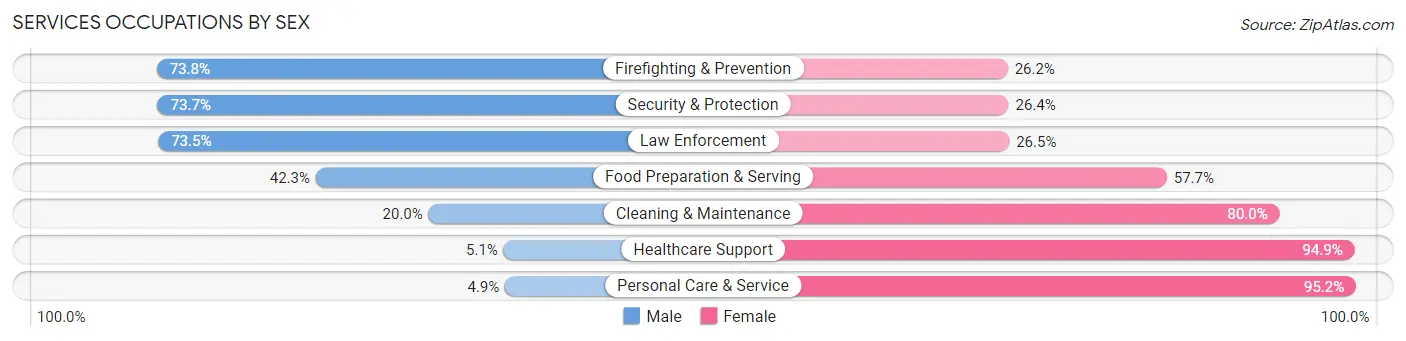
Services Occupations by Sex
Within the Services occupations in Ridgecrest, the most male-oriented occupations are Firefighting & Prevention (73.8%), Security & Protection (73.7%), and Law Enforcement (73.5%), while the most female-oriented occupations are Personal Care & Service (95.2%), Healthcare Support (94.9%), and Cleaning & Maintenance (80.0%).
| Occupation | Male | Female |
| Healthcare Support | 16 (5.1%) | 296 (94.9%) |
| Security & Protection | 260 (73.7%) | 93 (26.4%) |
| Firefighting & Prevention | 110 (73.8%) | 39 (26.2%) |
| Law Enforcement | 150 (73.5%) | 54 (26.5%) |
| Food Preparation & Serving | 204 (42.3%) | 278 (57.7%) |
| Cleaning & Maintenance | 33 (20.0%) | 132 (80.0%) |
| Personal Care & Service | 13 (4.9%) | 255 (95.2%) |
| Total (Category) | 526 (33.3%) | 1,054 (66.7%) |
| Total (Overall) | 6,179 (52.2%) | 5,661 (47.8%) |
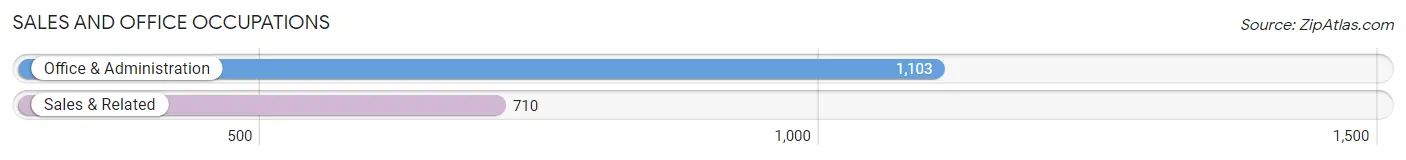
Sales and Office Occupations
The most common Sales and Office occupations in Ridgecrest are Office & Administration (1,103 | 9.3%), and Sales & Related (710 | 6.0%).
Sales and Office Occupations by Sex
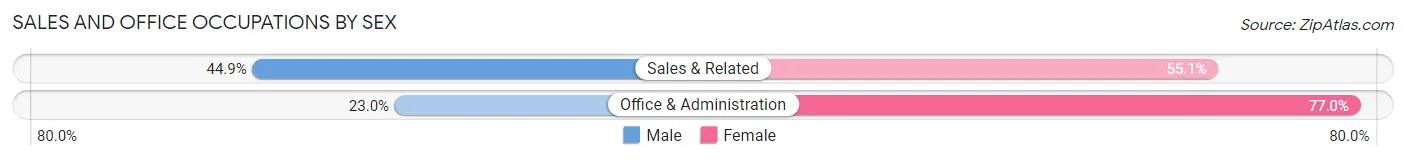
| Occupation | Male | Female |
| Sales & Related | 319 (44.9%) | 391 (55.1%) |
| Office & Administration | 254 (23.0%) | 849 (77.0%) |
| Total (Category) | 573 (31.6%) | 1,240 (68.4%) |
| Total (Overall) | 6,179 (52.2%) | 5,661 (47.8%) |
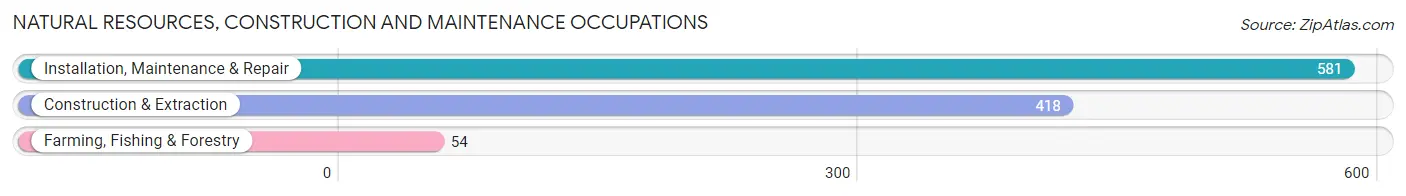
Natural Resources, Construction and Maintenance Occupations
The most common Natural Resources, Construction and Maintenance occupations in Ridgecrest are Installation, Maintenance & Repair (581 | 4.9%), Construction & Extraction (418 | 3.5%), and Farming, Fishing & Forestry (54 | 0.5%).
Natural Resources, Construction and Maintenance Occupations by Sex
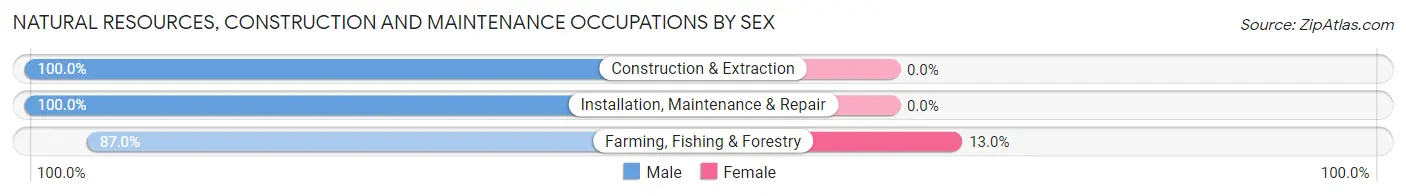
| Occupation | Male | Female |
| Farming, Fishing & Forestry | 47 (87.0%) | 7 (13.0%) |
| Construction & Extraction | 418 (100.0%) | 0 (0.0%) |
| Installation, Maintenance & Repair | 581 (100.0%) | 0 (0.0%) |
| Total (Category) | 1,046 (99.3%) | 7 (0.7%) |
| Total (Overall) | 6,179 (52.2%) | 5,661 (47.8%) |
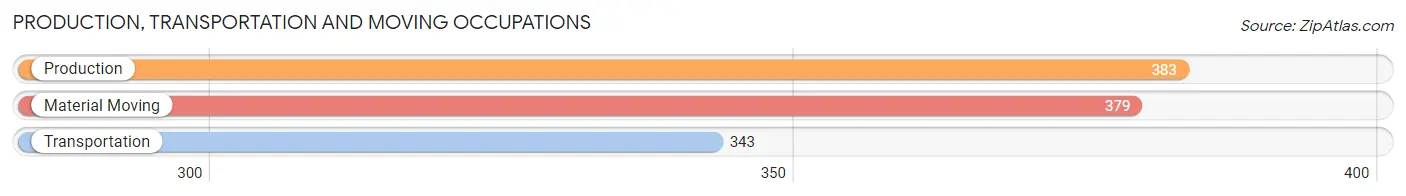
Production, Transportation and Moving Occupations
The most common Production, Transportation and Moving occupations in Ridgecrest are Production (383 | 3.2%), Material Moving (379 | 3.2%), and Transportation (343 | 2.9%).
Production, Transportation and Moving Occupations by Sex
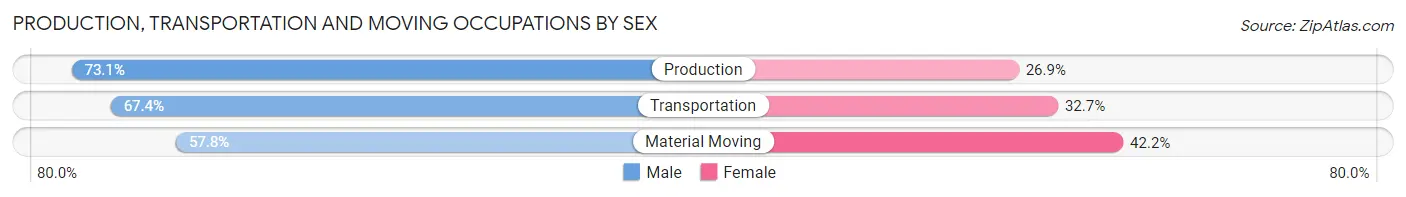
| Occupation | Male | Female |
| Production | 280 (73.1%) | 103 (26.9%) |
| Transportation | 231 (67.3%) | 112 (32.7%) |
| Material Moving | 219 (57.8%) | 160 (42.2%) |
| Total (Category) | 730 (66.1%) | 375 (33.9%) |
| Total (Overall) | 6,179 (52.2%) | 5,661 (47.8%) |
Employment Industries by Sex in Ridgecrest
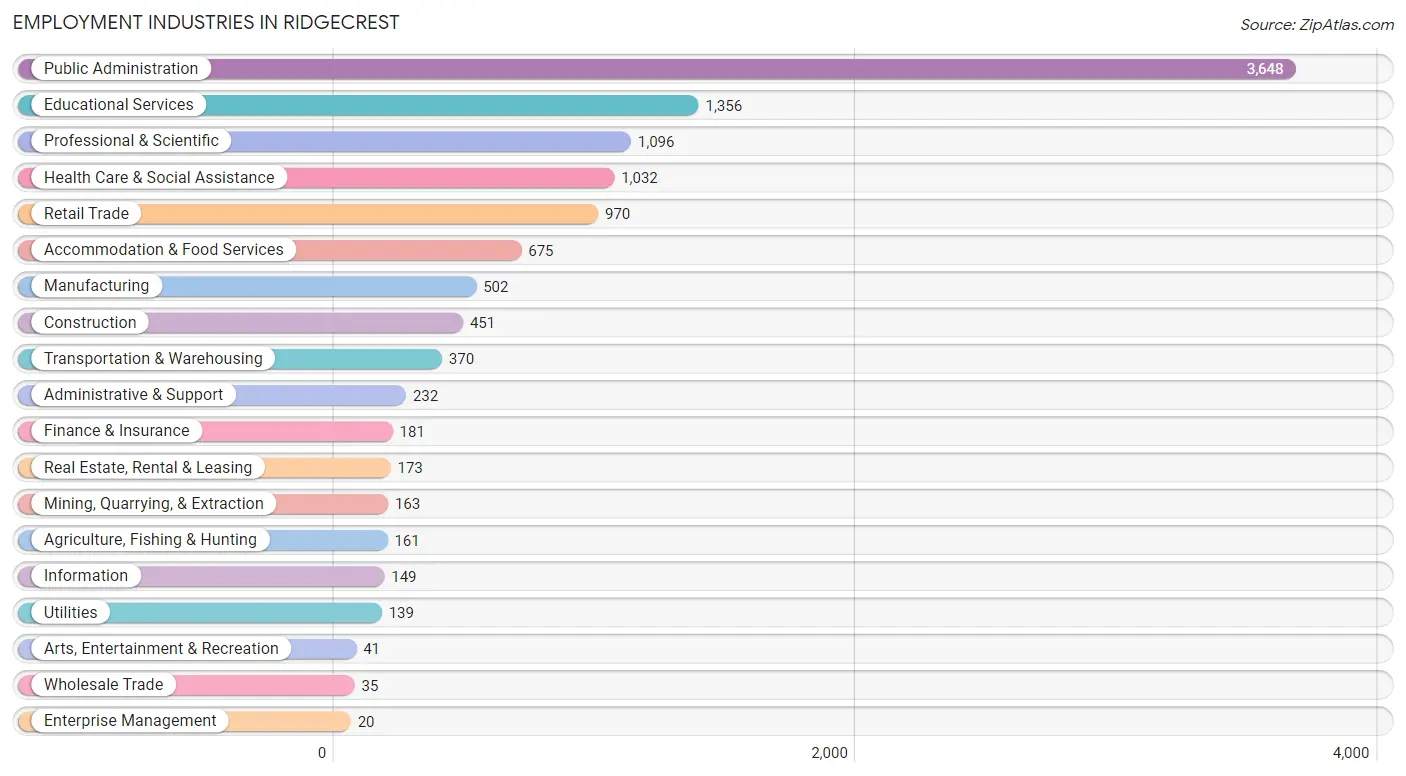
Employment Industries in Ridgecrest
The major employment industries in Ridgecrest include Public Administration (3,648 | 30.8%), Educational Services (1,356 | 11.5%), Professional & Scientific (1,096 | 9.3%), Health Care & Social Assistance (1,032 | 8.7%), and Retail Trade (970 | 8.2%).
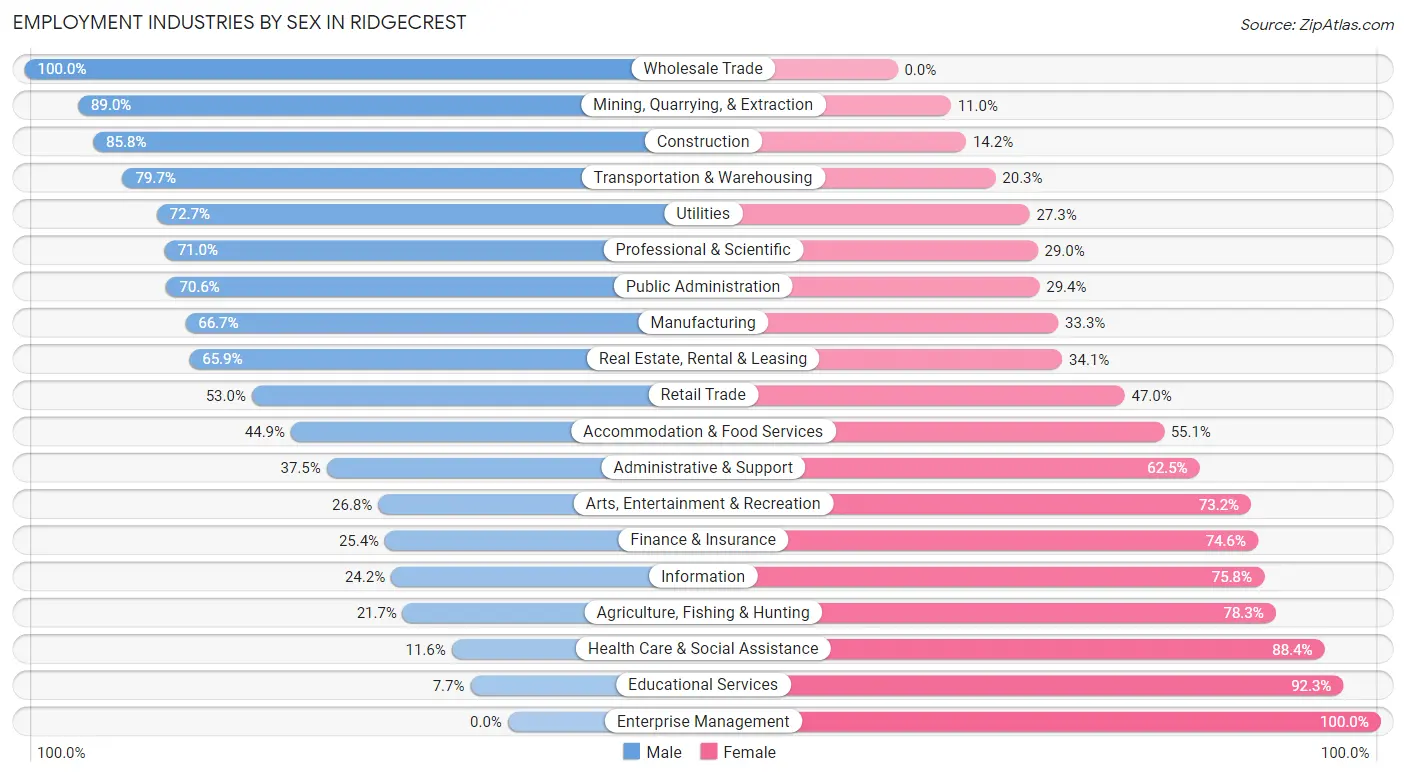
Employment Industries by Sex in Ridgecrest
The Ridgecrest industries that see more men than women are Wholesale Trade (100.0%), Mining, Quarrying, & Extraction (89.0%), and Construction (85.8%), whereas the industries that tend to have a higher number of women are Enterprise Management (100.0%), Educational Services (92.3%), and Health Care & Social Assistance (88.4%).
| Industry | Male | Female |
| Agriculture, Fishing & Hunting | 35 (21.7%) | 126 (78.3%) |
| Mining, Quarrying, & Extraction | 145 (89.0%) | 18 (11.0%) |
| Construction | 387 (85.8%) | 64 (14.2%) |
| Manufacturing | 335 (66.7%) | 167 (33.3%) |
| Wholesale Trade | 35 (100.0%) | 0 (0.0%) |
| Retail Trade | 514 (53.0%) | 456 (47.0%) |
| Transportation & Warehousing | 295 (79.7%) | 75 (20.3%) |
| Utilities | 101 (72.7%) | 38 (27.3%) |
| Information | 36 (24.2%) | 113 (75.8%) |
| Finance & Insurance | 46 (25.4%) | 135 (74.6%) |
| Real Estate, Rental & Leasing | 114 (65.9%) | 59 (34.1%) |
| Professional & Scientific | 778 (71.0%) | 318 (29.0%) |
| Enterprise Management | 0 (0.0%) | 20 (100.0%) |
| Administrative & Support | 87 (37.5%) | 145 (62.5%) |
| Educational Services | 105 (7.7%) | 1,251 (92.3%) |
| Health Care & Social Assistance | 120 (11.6%) | 912 (88.4%) |
| Arts, Entertainment & Recreation | 11 (26.8%) | 30 (73.2%) |
| Accommodation & Food Services | 303 (44.9%) | 372 (55.1%) |
| Public Administration | 2,577 (70.6%) | 1,071 (29.4%) |
| Total | 6,179 (52.2%) | 5,661 (47.8%) |
Education in Ridgecrest
School Enrollment in Ridgecrest
The most common levels of schooling among the 7,666 students in Ridgecrest are elementary school (2,000 | 26.1%), middle school (1,679 | 21.9%), and high school (1,467 | 19.1%).
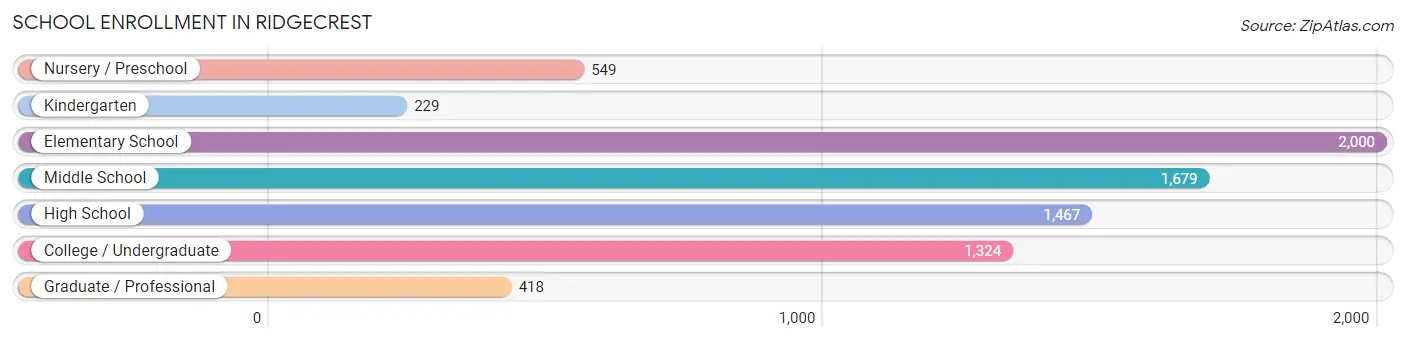
| School Level | # Students | % Students |
| Nursery / Preschool | 549 | 7.2% |
| Kindergarten | 229 | 3.0% |
| Elementary School | 2,000 | 26.1% |
| Middle School | 1,679 | 21.9% |
| High School | 1,467 | 19.1% |
| College / Undergraduate | 1,324 | 17.3% |
| Graduate / Professional | 418 | 5.4% |
| Total | 7,666 | 100.0% |
School Enrollment by Age by Funding Source in Ridgecrest
Out of a total of 7,666 students who are enrolled in schools in Ridgecrest, 989 (12.9%) attend a private institution, while the remaining 6,677 (87.1%) are enrolled in public schools. The age group of 20 to 24 year olds has the highest likelihood of being enrolled in private schools, with 79 (25.4% in the age bracket) enrolled. Conversely, the age group of 15 to 17 year olds has the lowest likelihood of being enrolled in a private school, with 849 (92.6% in the age bracket) attending a public institution.
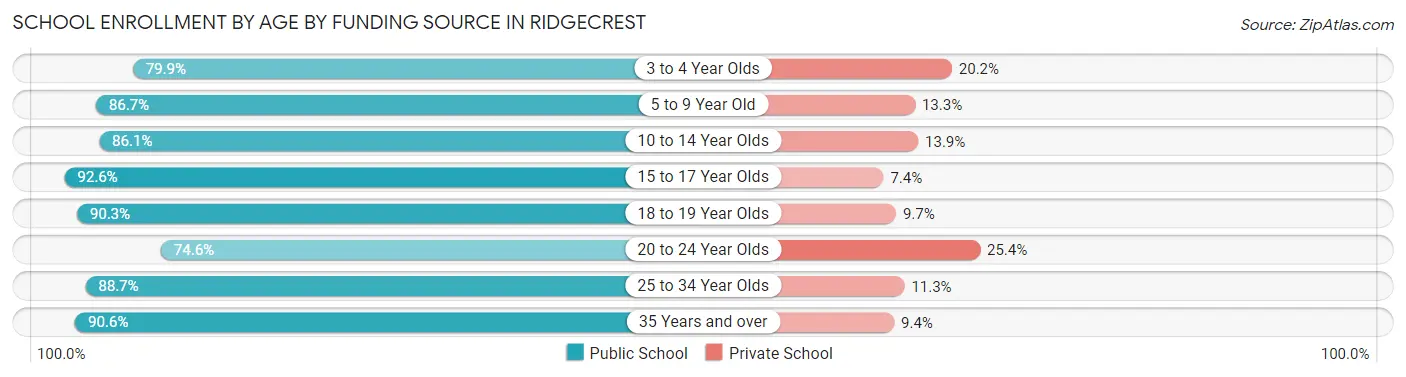
| Age Bracket | Public School | Private School |
| 3 to 4 Year Olds | 313 (79.8%) | 79 (20.2%) |
| 5 to 9 Year Old | 1,803 (86.7%) | 276 (13.3%) |
| 10 to 14 Year Olds | 1,907 (86.1%) | 307 (13.9%) |
| 15 to 17 Year Olds | 849 (92.6%) | 68 (7.4%) |
| 18 to 19 Year Olds | 528 (90.3%) | 57 (9.7%) |
| 20 to 24 Year Olds | 232 (74.6%) | 79 (25.4%) |
| 25 to 34 Year Olds | 470 (88.7%) | 60 (11.3%) |
| 35 Years and over | 578 (90.6%) | 60 (9.4%) |
| Total | 6,677 (87.1%) | 989 (12.9%) |
Educational Attainment by Field of Study in Ridgecrest
Engineering (1,567 | 23.4%), business (842 | 12.6%), education (609 | 9.1%), psychology (455 | 6.8%), and liberal arts & history (455 | 6.8%) are the most common fields of study among 6,688 individuals in Ridgecrest who have obtained a bachelor's degree or higher.
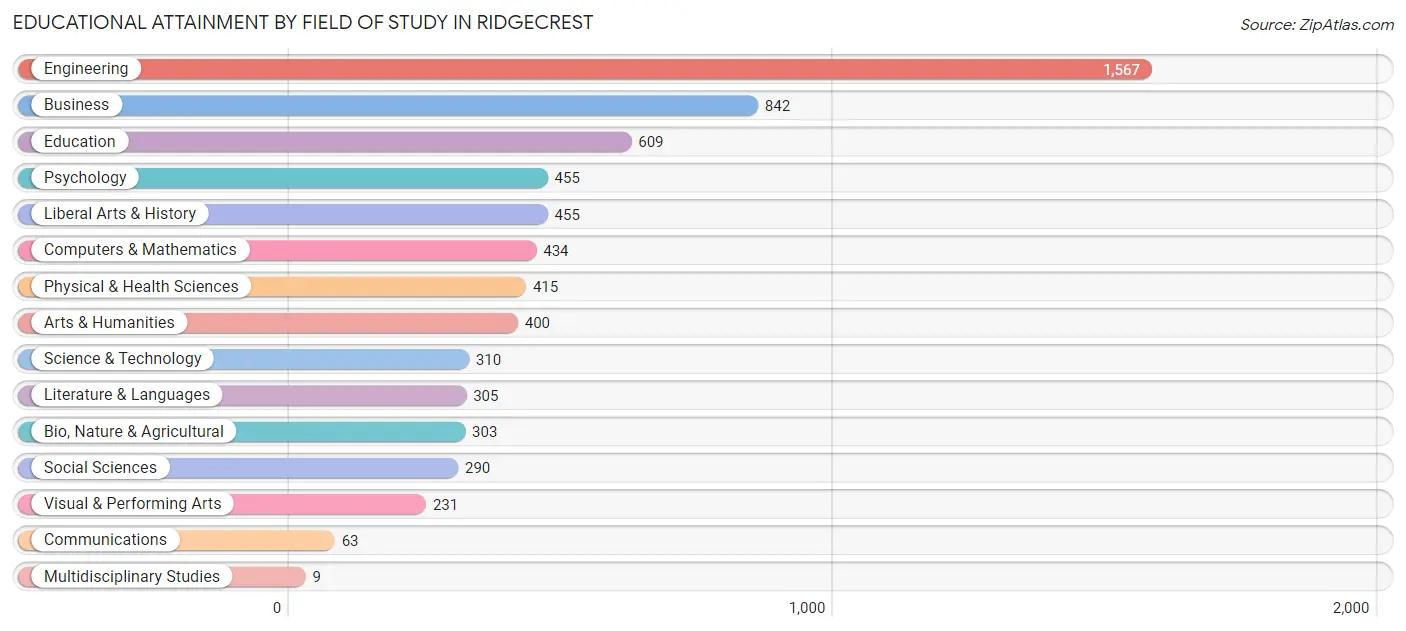
| Field of Study | # Graduates | % Graduates |
| Computers & Mathematics | 434 | 6.5% |
| Bio, Nature & Agricultural | 303 | 4.5% |
| Physical & Health Sciences | 415 | 6.2% |
| Psychology | 455 | 6.8% |
| Social Sciences | 290 | 4.3% |
| Engineering | 1,567 | 23.4% |
| Multidisciplinary Studies | 9 | 0.1% |
| Science & Technology | 310 | 4.6% |
| Business | 842 | 12.6% |
| Education | 609 | 9.1% |
| Literature & Languages | 305 | 4.6% |
| Liberal Arts & History | 455 | 6.8% |
| Visual & Performing Arts | 231 | 3.5% |
| Communications | 63 | 0.9% |
| Arts & Humanities | 400 | 6.0% |
| Total | 6,688 | 100.0% |
Transportation & Commute in Ridgecrest
Vehicle Availability by Sex in Ridgecrest
The most prevalent vehicle ownership categories in Ridgecrest are males with 2 vehicles (3,015, accounting for 45.8%) and females with 2 vehicles (2,478, making up 53.7%).
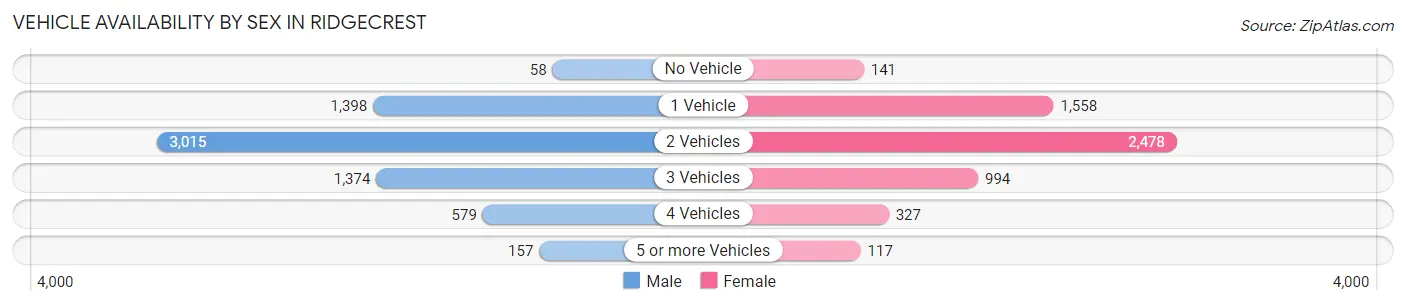
| Vehicles Available | Male | Female |
| No Vehicle | 58 (0.9%) | 141 (2.5%) |
| 1 Vehicle | 1,398 (21.2%) | 1,558 (27.8%) |
| 2 Vehicles | 3,015 (45.8%) | 2,478 (44.1%) |
| 3 Vehicles | 1,374 (20.9%) | 994 (17.7%) |
| 4 Vehicles | 579 (8.8%) | 327 (5.8%) |
| 5 or more Vehicles | 157 (2.4%) | 117 (2.1%) |
| Total | 6,581 (100.0%) | 5,615 (100.0%) |
Commute Time in Ridgecrest
The most frequently occuring commute durations in Ridgecrest are 10 to 14 minutes (3,164 commuters, 28.1%), 5 to 9 minutes (2,682 commuters, 23.9%), and 15 to 19 minutes (2,149 commuters, 19.1%).
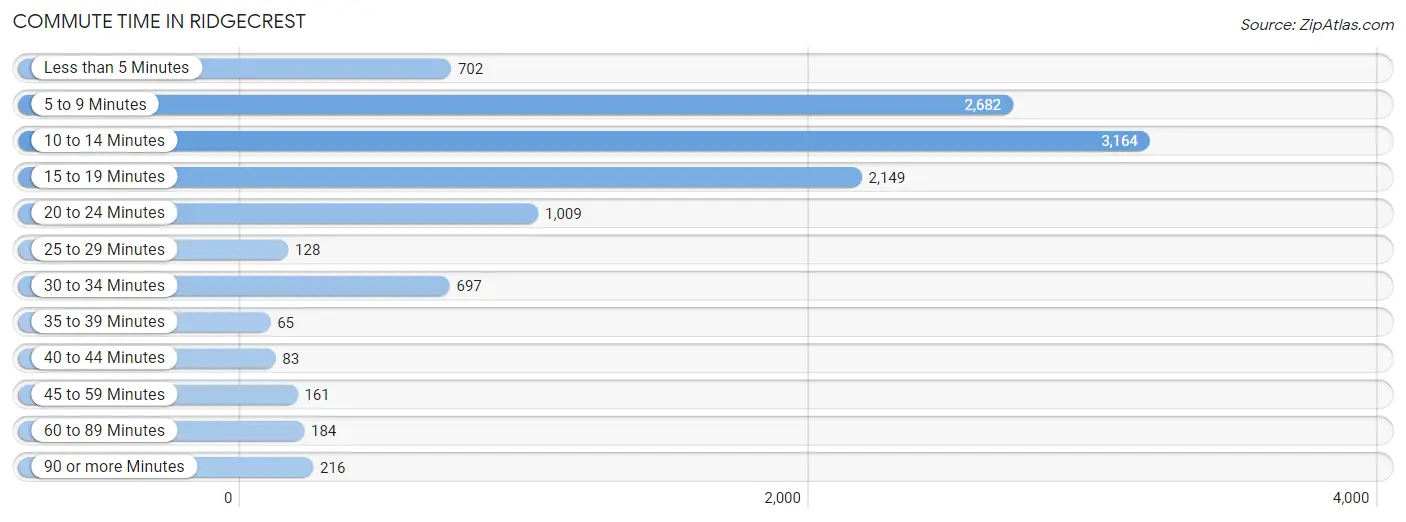
| Commute Time | # Commuters | % Commuters |
| Less than 5 Minutes | 702 | 6.2% |
| 5 to 9 Minutes | 2,682 | 23.9% |
| 10 to 14 Minutes | 3,164 | 28.1% |
| 15 to 19 Minutes | 2,149 | 19.1% |
| 20 to 24 Minutes | 1,009 | 9.0% |
| 25 to 29 Minutes | 128 | 1.1% |
| 30 to 34 Minutes | 697 | 6.2% |
| 35 to 39 Minutes | 65 | 0.6% |
| 40 to 44 Minutes | 83 | 0.7% |
| 45 to 59 Minutes | 161 | 1.4% |
| 60 to 89 Minutes | 184 | 1.6% |
| 90 or more Minutes | 216 | 1.9% |
Commute Time by Sex in Ridgecrest
The most common commute times in Ridgecrest are 10 to 14 minutes (1,696 commuters, 26.4%) for males and 10 to 14 minutes (1,468 commuters, 30.5%) for females.
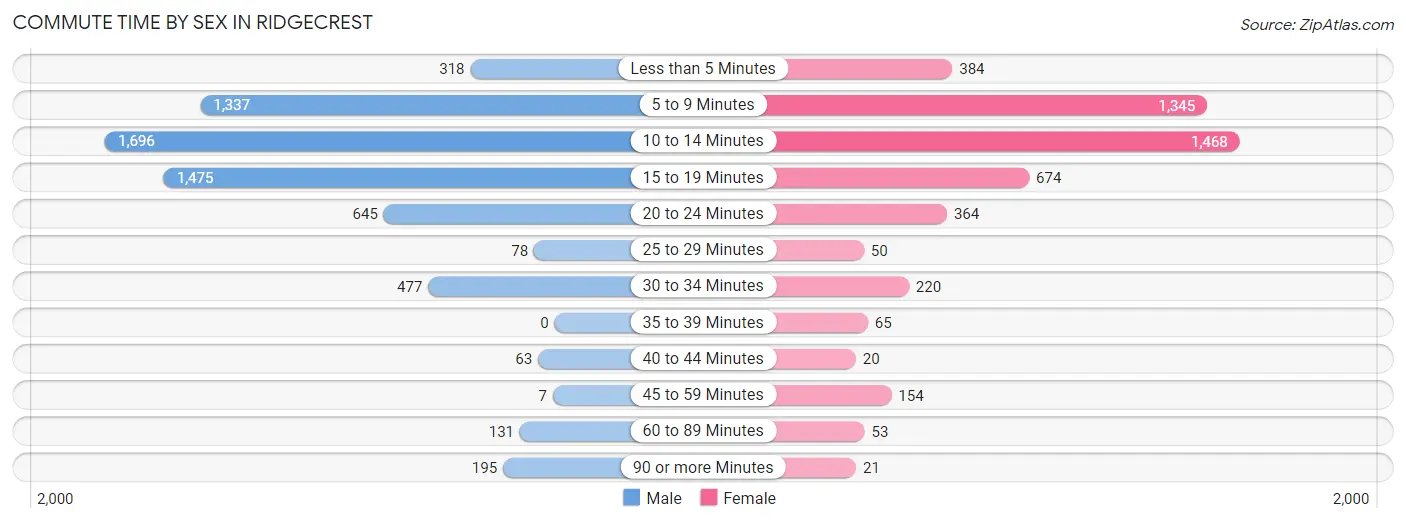
| Commute Time | Male | Female |
| Less than 5 Minutes | 318 (5.0%) | 384 (8.0%) |
| 5 to 9 Minutes | 1,337 (20.8%) | 1,345 (27.9%) |
| 10 to 14 Minutes | 1,696 (26.4%) | 1,468 (30.5%) |
| 15 to 19 Minutes | 1,475 (23.0%) | 674 (14.0%) |
| 20 to 24 Minutes | 645 (10.0%) | 364 (7.6%) |
| 25 to 29 Minutes | 78 (1.2%) | 50 (1.0%) |
| 30 to 34 Minutes | 477 (7.4%) | 220 (4.6%) |
| 35 to 39 Minutes | 0 (0.0%) | 65 (1.3%) |
| 40 to 44 Minutes | 63 (1.0%) | 20 (0.4%) |
| 45 to 59 Minutes | 7 (0.1%) | 154 (3.2%) |
| 60 to 89 Minutes | 131 (2.0%) | 53 (1.1%) |
| 90 or more Minutes | 195 (3.0%) | 21 (0.4%) |
Time of Departure to Work by Sex in Ridgecrest
The most frequent times of departure to work in Ridgecrest are 6:00 AM to 6:29 AM (1,161, 18.1%) for males and 6:30 AM to 6:59 AM (917, 19.0%) for females.
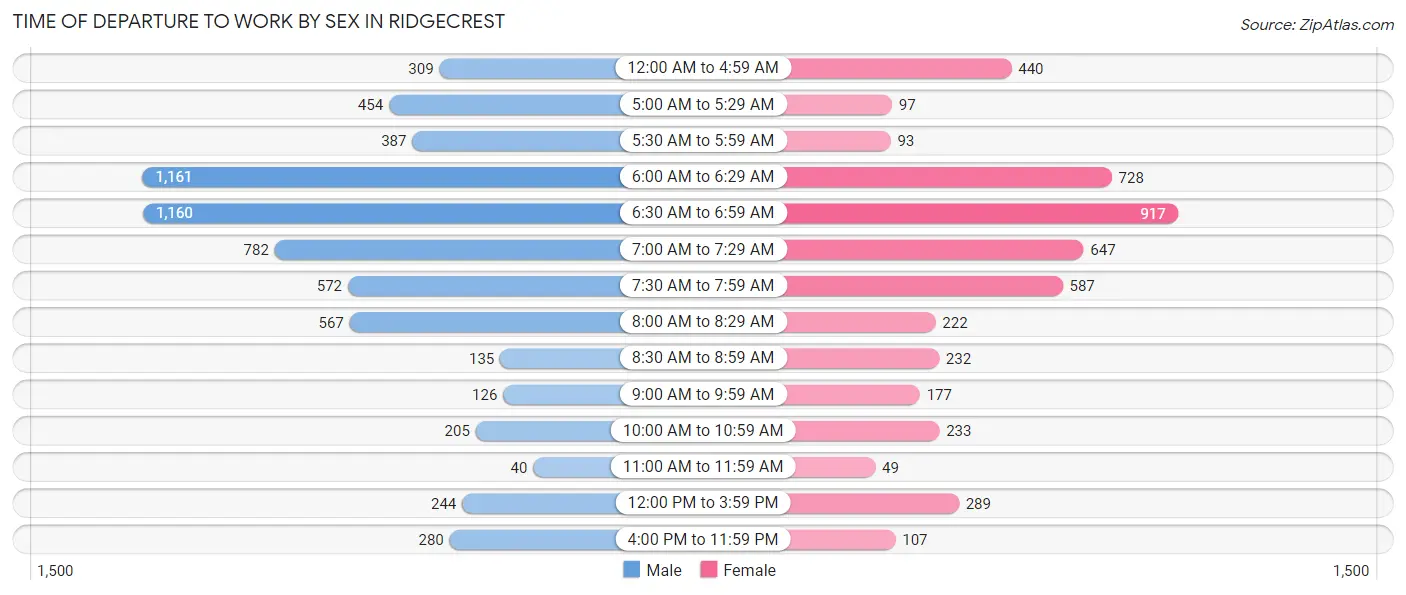
| Time of Departure | Male | Female |
| 12:00 AM to 4:59 AM | 309 (4.8%) | 440 (9.1%) |
| 5:00 AM to 5:29 AM | 454 (7.1%) | 97 (2.0%) |
| 5:30 AM to 5:59 AM | 387 (6.0%) | 93 (1.9%) |
| 6:00 AM to 6:29 AM | 1,161 (18.1%) | 728 (15.1%) |
| 6:30 AM to 6:59 AM | 1,160 (18.1%) | 917 (19.0%) |
| 7:00 AM to 7:29 AM | 782 (12.2%) | 647 (13.4%) |
| 7:30 AM to 7:59 AM | 572 (8.9%) | 587 (12.2%) |
| 8:00 AM to 8:29 AM | 567 (8.8%) | 222 (4.6%) |
| 8:30 AM to 8:59 AM | 135 (2.1%) | 232 (4.8%) |
| 9:00 AM to 9:59 AM | 126 (2.0%) | 177 (3.7%) |
| 10:00 AM to 10:59 AM | 205 (3.2%) | 233 (4.8%) |
| 11:00 AM to 11:59 AM | 40 (0.6%) | 49 (1.0%) |
| 12:00 PM to 3:59 PM | 244 (3.8%) | 289 (6.0%) |
| 4:00 PM to 11:59 PM | 280 (4.4%) | 107 (2.2%) |
| Total | 6,422 (100.0%) | 4,818 (100.0%) |
Housing Occupancy in Ridgecrest
Occupancy by Ownership in Ridgecrest
Of the total 11,144 dwellings in Ridgecrest, owner-occupied units account for 6,675 (59.9%), while renter-occupied units make up 4,469 (40.1%).
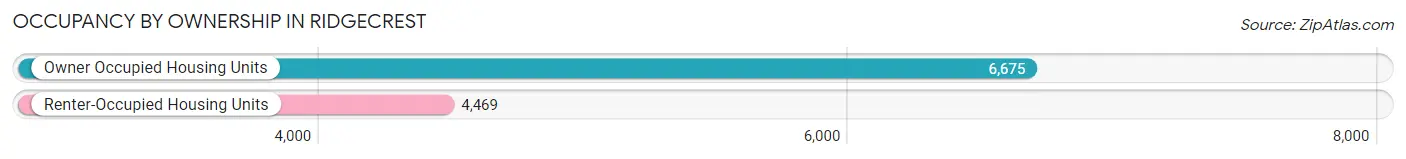
| Occupancy | # Housing Units | % Housing Units |
| Owner Occupied Housing Units | 6,675 | 59.9% |
| Renter-Occupied Housing Units | 4,469 | 40.1% |
| Total Occupied Housing Units | 11,144 | 100.0% |
Occupancy by Household Size in Ridgecrest
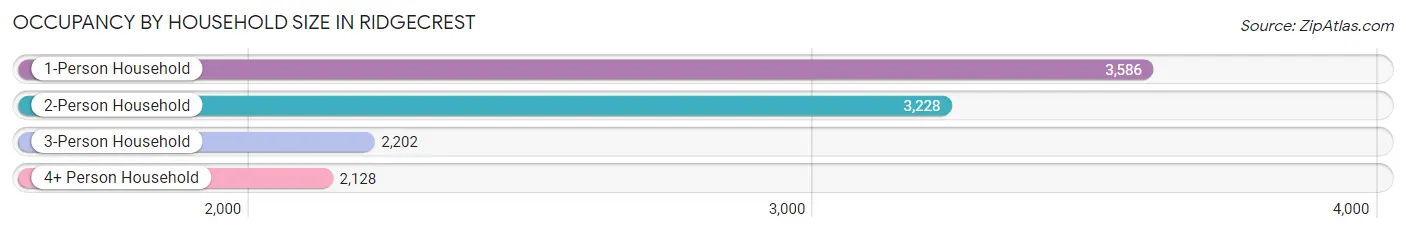
| Household Size | # Housing Units | % Housing Units |
| 1-Person Household | 3,586 | 32.2% |
| 2-Person Household | 3,228 | 29.0% |
| 3-Person Household | 2,202 | 19.8% |
| 4+ Person Household | 2,128 | 19.1% |
| Total Housing Units | 11,144 | 100.0% |
Occupancy by Ownership by Household Size in Ridgecrest
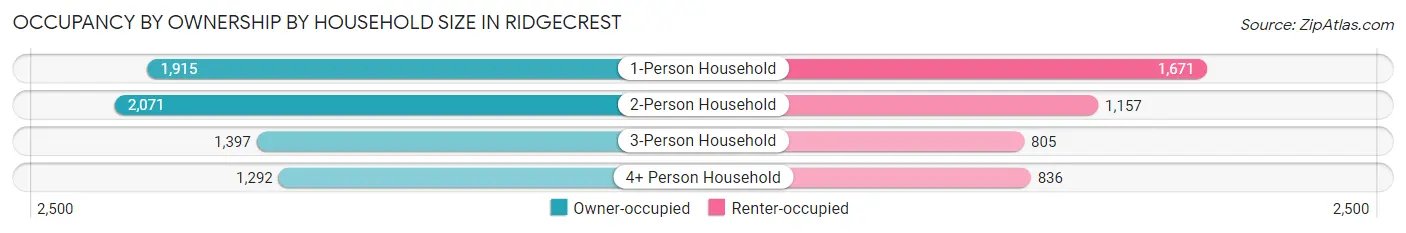
| Household Size | Owner-occupied | Renter-occupied |
| 1-Person Household | 1,915 (53.4%) | 1,671 (46.6%) |
| 2-Person Household | 2,071 (64.2%) | 1,157 (35.8%) |
| 3-Person Household | 1,397 (63.4%) | 805 (36.6%) |
| 4+ Person Household | 1,292 (60.7%) | 836 (39.3%) |
| Total Housing Units | 6,675 (59.9%) | 4,469 (40.1%) |
Occupancy by Educational Attainment in Ridgecrest
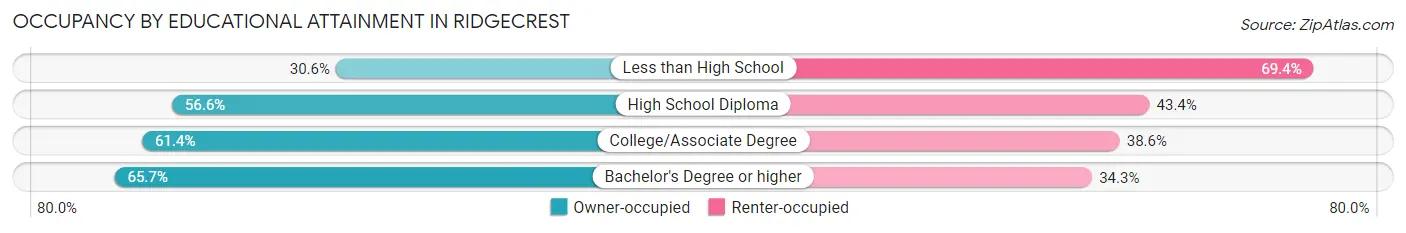
| Household Size | Owner-occupied | Renter-occupied |
| Less than High School | 250 (30.6%) | 566 (69.4%) |
| High School Diploma | 1,085 (56.6%) | 831 (43.4%) |
| College/Associate Degree | 2,653 (61.4%) | 1,671 (38.6%) |
| Bachelor's Degree or higher | 2,687 (65.7%) | 1,401 (34.3%) |
Occupancy by Age of Householder in Ridgecrest
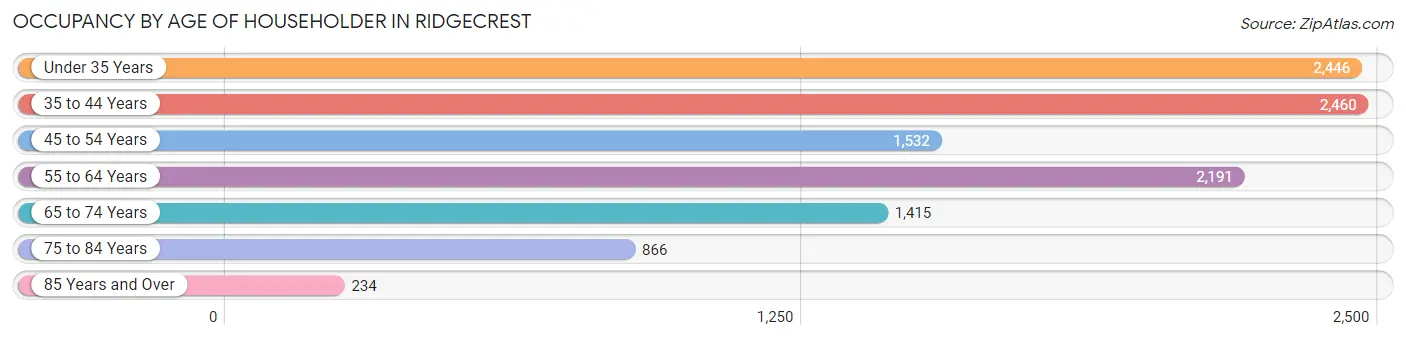
| Age Bracket | # Households | % Households |
| Under 35 Years | 2,446 | 22.0% |
| 35 to 44 Years | 2,460 | 22.1% |
| 45 to 54 Years | 1,532 | 13.8% |
| 55 to 64 Years | 2,191 | 19.7% |
| 65 to 74 Years | 1,415 | 12.7% |
| 75 to 84 Years | 866 | 7.8% |
| 85 Years and Over | 234 | 2.1% |
| Total | 11,144 | 100.0% |
Housing Finances in Ridgecrest
Median Income by Occupancy in Ridgecrest
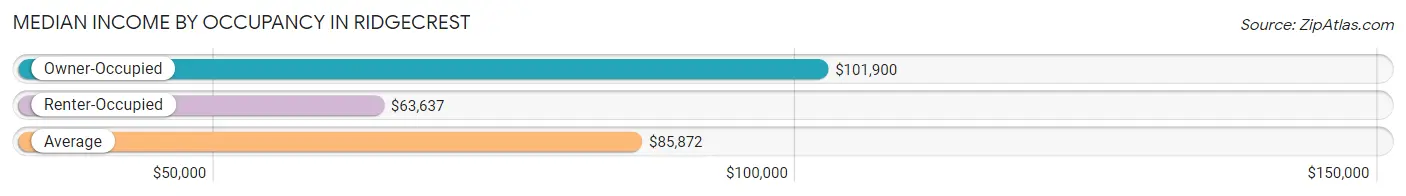
| Occupancy Type | # Households | Median Income |
| Owner-Occupied | 6,675 (59.9%) | $101,900 |
| Renter-Occupied | 4,469 (40.1%) | $63,637 |
| Average | 11,144 (100.0%) | $85,872 |
Occupancy by Householder Income Bracket in Ridgecrest
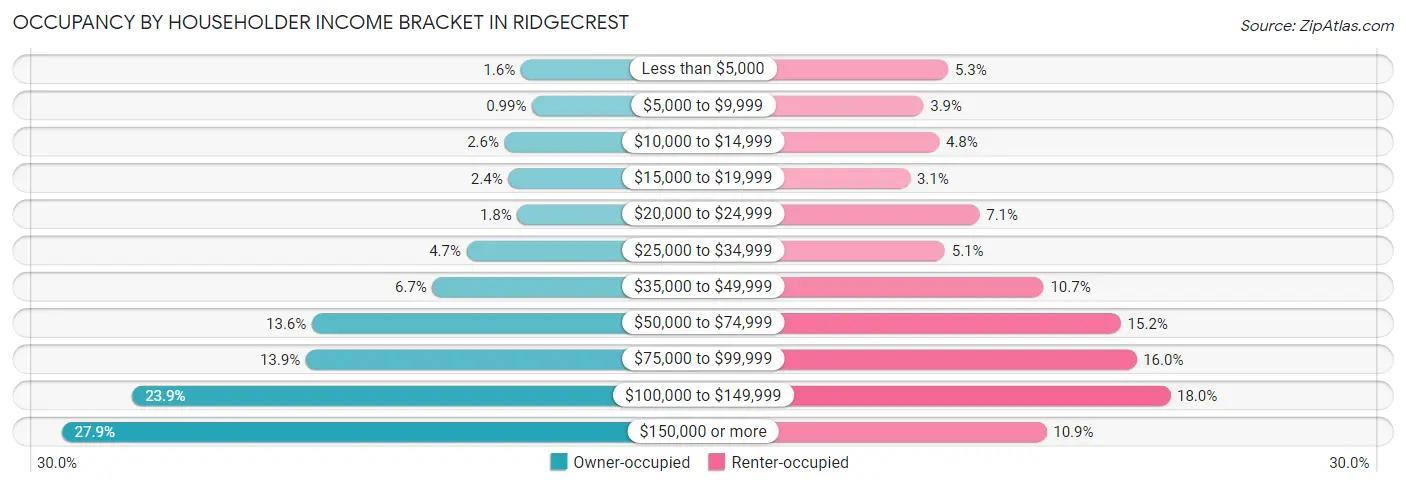
| Income Bracket | Owner-occupied | Renter-occupied |
| Less than $5,000 | 109 (1.6%) | 236 (5.3%) |
| $5,000 to $9,999 | 66 (1.0%) | 173 (3.9%) |
| $10,000 to $14,999 | 171 (2.6%) | 213 (4.8%) |
| $15,000 to $19,999 | 157 (2.4%) | 139 (3.1%) |
| $20,000 to $24,999 | 122 (1.8%) | 316 (7.1%) |
| $25,000 to $34,999 | 316 (4.7%) | 228 (5.1%) |
| $35,000 to $49,999 | 446 (6.7%) | 480 (10.7%) |
| $50,000 to $74,999 | 906 (13.6%) | 677 (15.1%) |
| $75,000 to $99,999 | 929 (13.9%) | 717 (16.0%) |
| $100,000 to $149,999 | 1,592 (23.8%) | 803 (18.0%) |
| $150,000 or more | 1,861 (27.9%) | 487 (10.9%) |
| Total | 6,675 (100.0%) | 4,469 (100.0%) |
Monthly Housing Cost Tiers in Ridgecrest
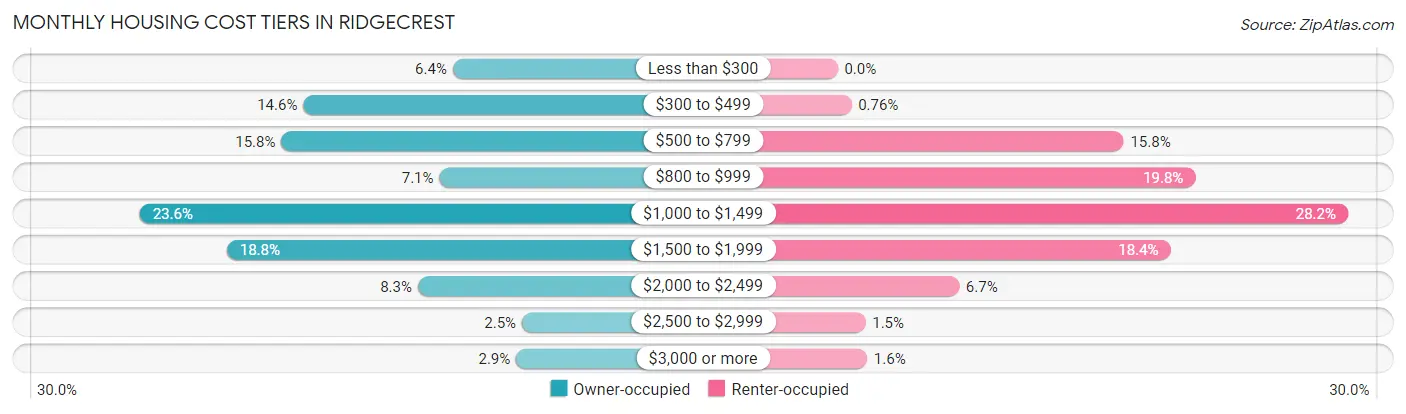
| Monthly Cost | Owner-occupied | Renter-occupied |
| Less than $300 | 424 (6.4%) | 0 (0.0%) |
| $300 to $499 | 975 (14.6%) | 34 (0.8%) |
| $500 to $799 | 1,056 (15.8%) | 706 (15.8%) |
| $800 to $999 | 473 (7.1%) | 883 (19.8%) |
| $1,000 to $1,499 | 1,578 (23.6%) | 1,260 (28.2%) |
| $1,500 to $1,999 | 1,257 (18.8%) | 822 (18.4%) |
| $2,000 to $2,499 | 553 (8.3%) | 300 (6.7%) |
| $2,500 to $2,999 | 169 (2.5%) | 69 (1.5%) |
| $3,000 or more | 190 (2.9%) | 73 (1.6%) |
| Total | 6,675 (100.0%) | 4,469 (100.0%) |
Physical Housing Characteristics in Ridgecrest
Housing Structures in Ridgecrest
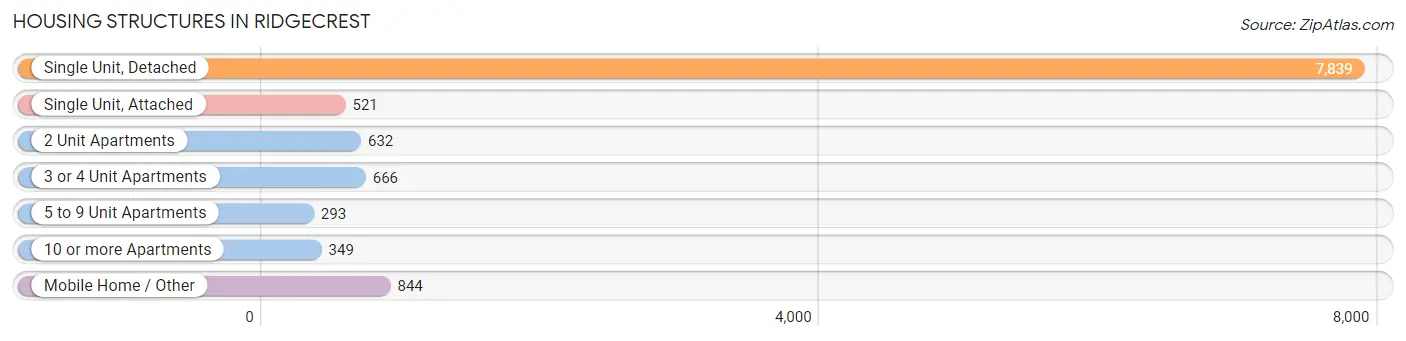
| Structure Type | # Housing Units | % Housing Units |
| Single Unit, Detached | 7,839 | 70.3% |
| Single Unit, Attached | 521 | 4.7% |
| 2 Unit Apartments | 632 | 5.7% |
| 3 or 4 Unit Apartments | 666 | 6.0% |
| 5 to 9 Unit Apartments | 293 | 2.6% |
| 10 or more Apartments | 349 | 3.1% |
| Mobile Home / Other | 844 | 7.6% |
| Total | 11,144 | 100.0% |
Housing Structures by Occupancy in Ridgecrest
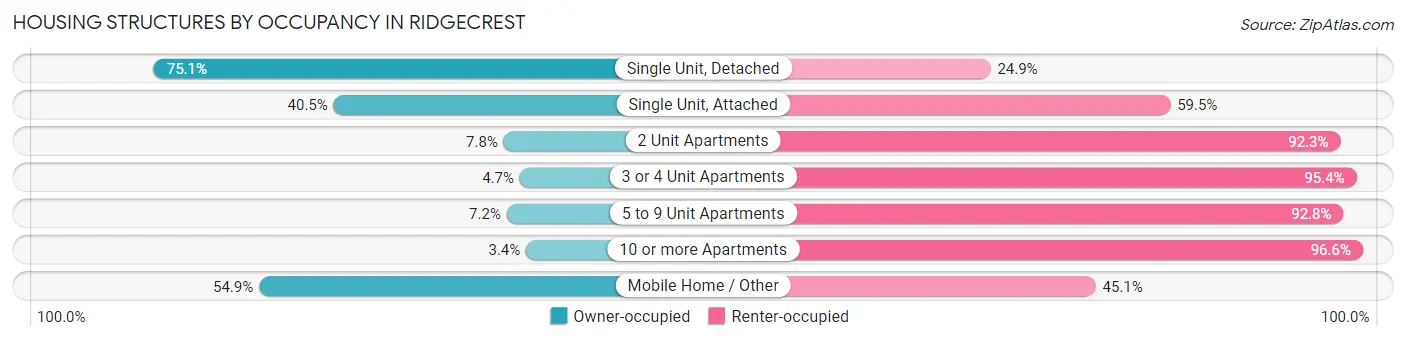
| Structure Type | Owner-occupied | Renter-occupied |
| Single Unit, Detached | 5,888 (75.1%) | 1,951 (24.9%) |
| Single Unit, Attached | 211 (40.5%) | 310 (59.5%) |
| 2 Unit Apartments | 49 (7.7%) | 583 (92.2%) |
| 3 or 4 Unit Apartments | 31 (4.6%) | 635 (95.4%) |
| 5 to 9 Unit Apartments | 21 (7.2%) | 272 (92.8%) |
| 10 or more Apartments | 12 (3.4%) | 337 (96.6%) |
| Mobile Home / Other | 463 (54.9%) | 381 (45.1%) |
| Total | 6,675 (59.9%) | 4,469 (40.1%) |
Housing Structures by Number of Rooms in Ridgecrest
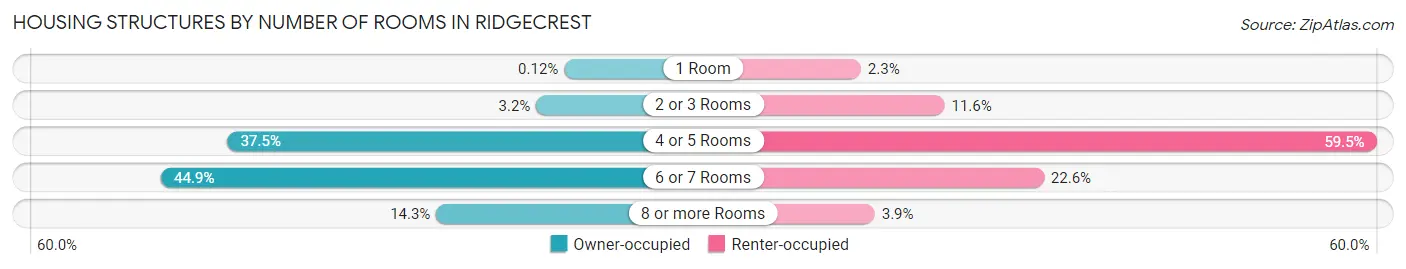
| Number of Rooms | Owner-occupied | Renter-occupied |
| 1 Room | 8 (0.1%) | 104 (2.3%) |
| 2 or 3 Rooms | 215 (3.2%) | 519 (11.6%) |
| 4 or 5 Rooms | 2,502 (37.5%) | 2,661 (59.5%) |
| 6 or 7 Rooms | 2,994 (44.9%) | 1,012 (22.6%) |
| 8 or more Rooms | 956 (14.3%) | 173 (3.9%) |
| Total | 6,675 (100.0%) | 4,469 (100.0%) |
Housing Structure by Heating Type in Ridgecrest
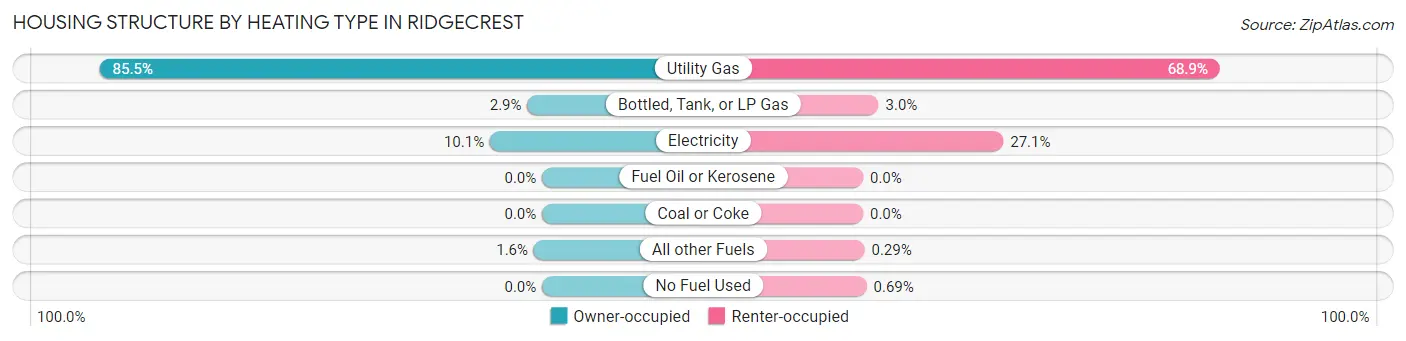
| Heating Type | Owner-occupied | Renter-occupied |
| Utility Gas | 5,707 (85.5%) | 3,080 (68.9%) |
| Bottled, Tank, or LP Gas | 190 (2.9%) | 134 (3.0%) |
| Electricity | 672 (10.1%) | 1,211 (27.1%) |
| Fuel Oil or Kerosene | 0 (0.0%) | 0 (0.0%) |
| Coal or Coke | 0 (0.0%) | 0 (0.0%) |
| All other Fuels | 106 (1.6%) | 13 (0.3%) |
| No Fuel Used | 0 (0.0%) | 31 (0.7%) |
| Total | 6,675 (100.0%) | 4,469 (100.0%) |
Household Vehicle Usage in Ridgecrest
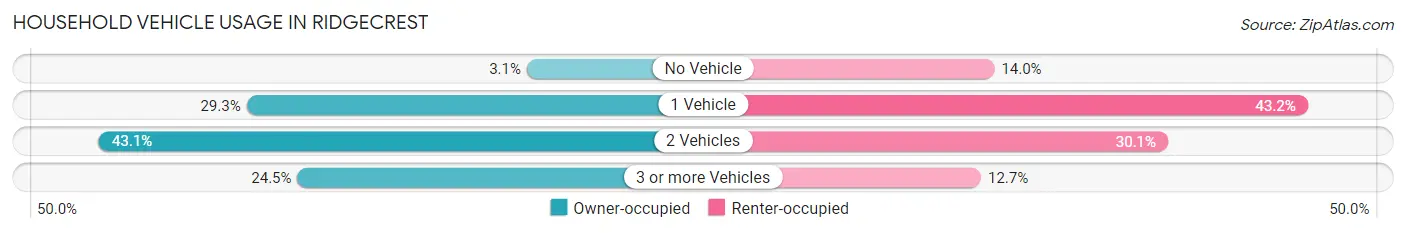
| Vehicles per Household | Owner-occupied | Renter-occupied |
| No Vehicle | 208 (3.1%) | 624 (14.0%) |
| 1 Vehicle | 1,955 (29.3%) | 1,930 (43.2%) |
| 2 Vehicles | 2,874 (43.1%) | 1,347 (30.1%) |
| 3 or more Vehicles | 1,638 (24.5%) | 568 (12.7%) |
| Total | 6,675 (100.0%) | 4,469 (100.0%) |
Real Estate & Mortgages in Ridgecrest
Real Estate and Mortgage Overview in Ridgecrest
| Characteristic | Without Mortgage | With Mortgage |
| Housing Units | 2,384 | 4,291 |
| Median Property Value | $206,100 | $231,900 |
| Median Household Income | $90,000 | $1,316 |
| Monthly Housing Costs | $472 | $190 |
| Real Estate Taxes | $1,854 | $44 |
Property Value by Mortgage Status in Ridgecrest
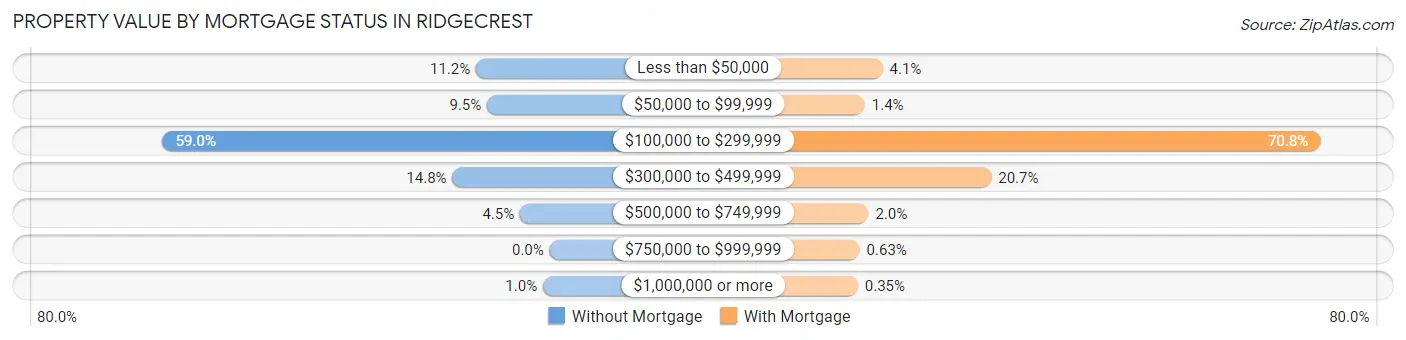
| Property Value | Without Mortgage | With Mortgage |
| Less than $50,000 | 267 (11.2%) | 177 (4.1%) |
| $50,000 to $99,999 | 227 (9.5%) | 61 (1.4%) |
| $100,000 to $299,999 | 1,406 (59.0%) | 3,038 (70.8%) |
| $300,000 to $499,999 | 353 (14.8%) | 888 (20.7%) |
| $500,000 to $749,999 | 107 (4.5%) | 85 (2.0%) |
| $750,000 to $999,999 | 0 (0.0%) | 27 (0.6%) |
| $1,000,000 or more | 24 (1.0%) | 15 (0.4%) |
| Total | 2,384 (100.0%) | 4,291 (100.0%) |
Household Income by Mortgage Status in Ridgecrest
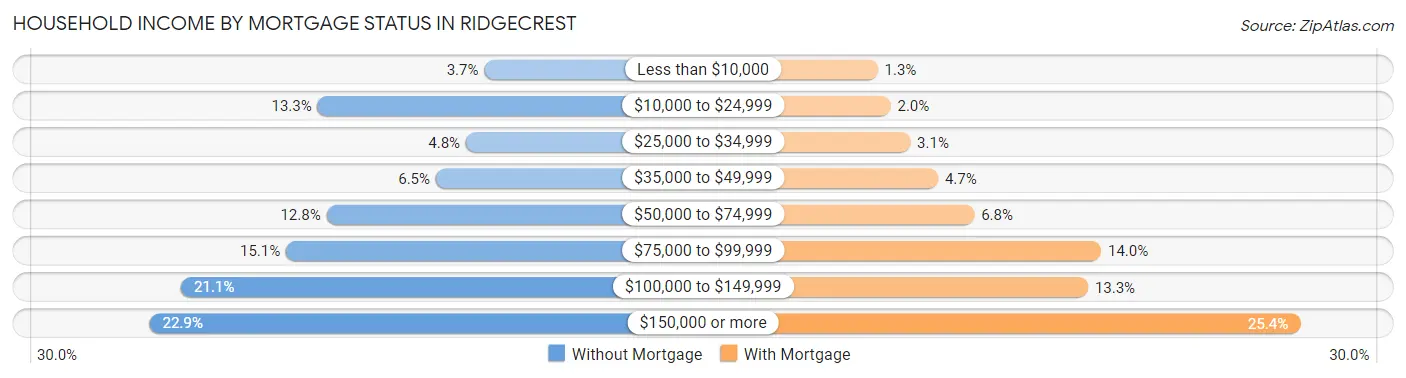
| Household Income | Without Mortgage | With Mortgage |
| Less than $10,000 | 89 (3.7%) | 54 (1.3%) |
| $10,000 to $24,999 | 316 (13.3%) | 86 (2.0%) |
| $25,000 to $34,999 | 114 (4.8%) | 134 (3.1%) |
| $35,000 to $49,999 | 155 (6.5%) | 202 (4.7%) |
| $50,000 to $74,999 | 304 (12.8%) | 291 (6.8%) |
| $75,000 to $99,999 | 359 (15.1%) | 602 (14.0%) |
| $100,000 to $149,999 | 502 (21.1%) | 570 (13.3%) |
| $150,000 or more | 545 (22.9%) | 1,090 (25.4%) |
| Total | 2,384 (100.0%) | 4,291 (100.0%) |
Property Value to Household Income Ratio in Ridgecrest
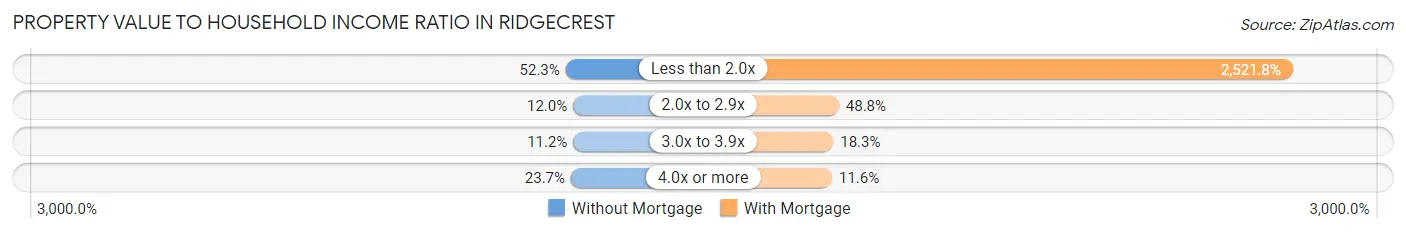
| Value-to-Income Ratio | Without Mortgage | With Mortgage |
| Less than 2.0x | 1,246 (52.3%) | 108,209 (2,521.8%) |
| 2.0x to 2.9x | 285 (11.9%) | 2,095 (48.8%) |
| 3.0x to 3.9x | 266 (11.2%) | 785 (18.3%) |
| 4.0x or more | 565 (23.7%) | 497 (11.6%) |
| Total | 2,384 (100.0%) | 4,291 (100.0%) |
Real Estate Taxes by Mortgage Status in Ridgecrest
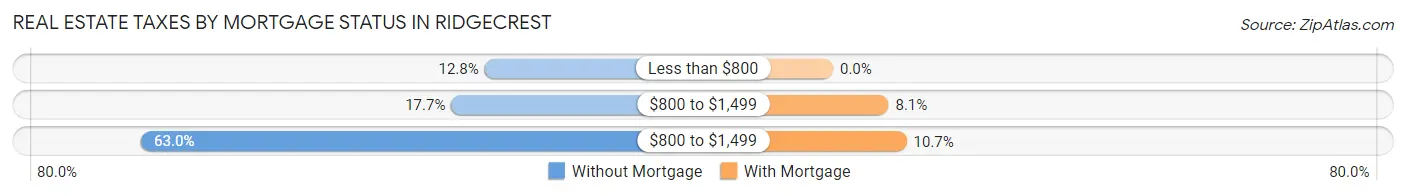
| Property Taxes | Without Mortgage | With Mortgage |
| Less than $800 | 305 (12.8%) | 0 (0.0%) |
| $800 to $1,499 | 421 (17.7%) | 348 (8.1%) |
| $800 to $1,499 | 1,501 (63.0%) | 461 (10.7%) |
| Total | 2,384 (100.0%) | 4,291 (100.0%) |
Health & Disability in Ridgecrest
Health Insurance Coverage by Age in Ridgecrest
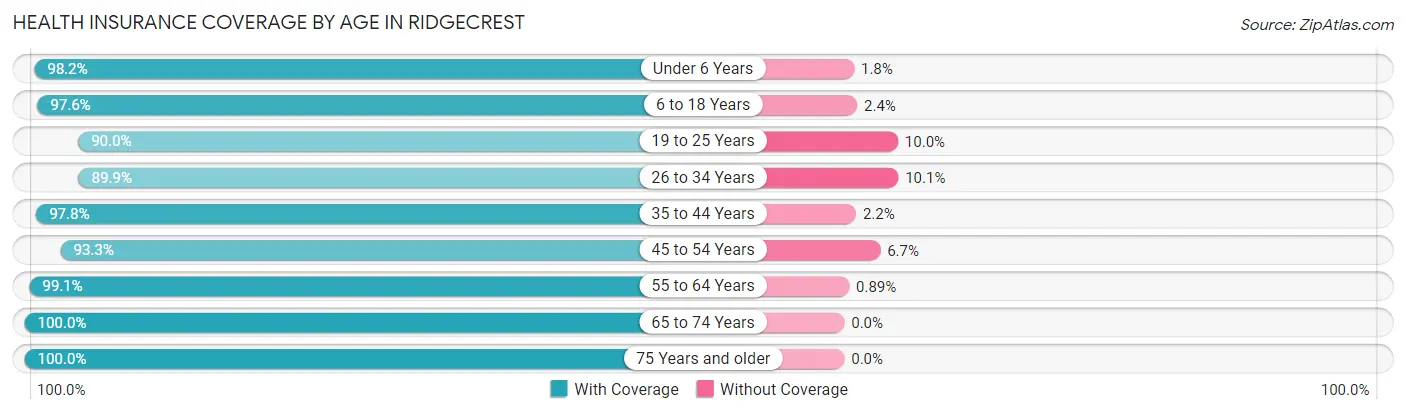
| Age Bracket | With Coverage | Without Coverage |
| Under 6 Years | 2,053 (98.2%) | 38 (1.8%) |
| 6 to 18 Years | 5,762 (97.6%) | 141 (2.4%) |
| 19 to 25 Years | 1,810 (90.0%) | 201 (10.0%) |
| 26 to 34 Years | 3,095 (89.9%) | 346 (10.1%) |
| 35 to 44 Years | 4,047 (97.8%) | 90 (2.2%) |
| 45 to 54 Years | 2,703 (93.3%) | 194 (6.7%) |
| 55 to 64 Years | 3,214 (99.1%) | 29 (0.9%) |
| 65 to 74 Years | 2,083 (100.0%) | 0 (0.0%) |
| 75 Years and older | 1,635 (100.0%) | 0 (0.0%) |
| Total | 26,402 (96.2%) | 1,039 (3.8%) |
Health Insurance Coverage by Citizenship Status in Ridgecrest
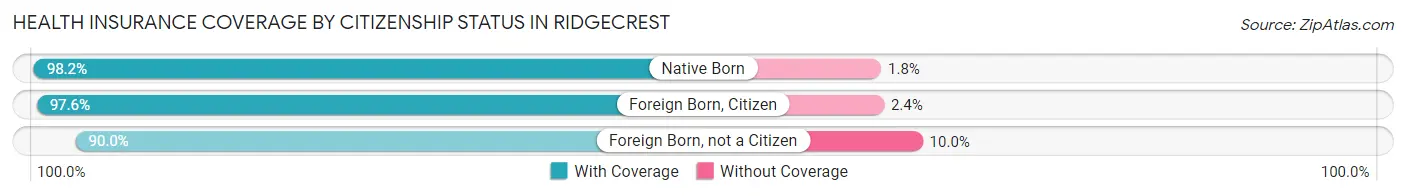
| Citizenship Status | With Coverage | Without Coverage |
| Native Born | 2,053 (98.2%) | 38 (1.8%) |
| Foreign Born, Citizen | 5,762 (97.6%) | 141 (2.4%) |
| Foreign Born, not a Citizen | 1,810 (90.0%) | 201 (10.0%) |
Health Insurance Coverage by Household Income in Ridgecrest
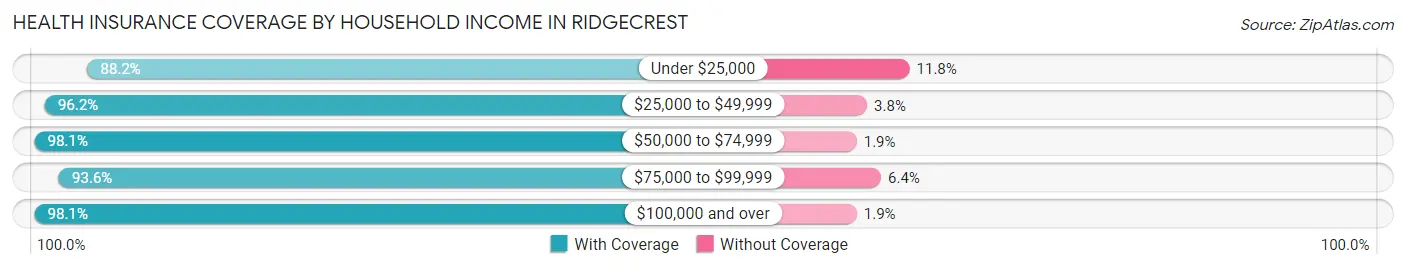
| Household Income | With Coverage | Without Coverage |
| Under $25,000 | 2,413 (88.2%) | 322 (11.8%) |
| $25,000 to $49,999 | 3,157 (96.2%) | 125 (3.8%) |
| $50,000 to $74,999 | 4,419 (98.1%) | 84 (1.9%) |
| $75,000 to $99,999 | 3,927 (93.6%) | 270 (6.4%) |
| $100,000 and over | 12,433 (98.1%) | 238 (1.9%) |
Public vs Private Health Insurance Coverage by Age in Ridgecrest
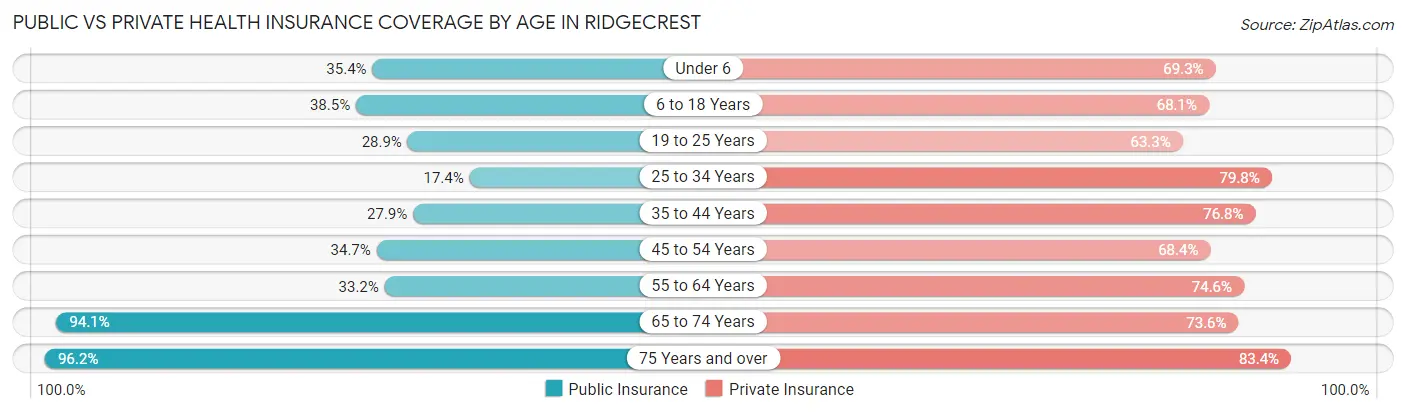
| Age Bracket | Public Insurance | Private Insurance |
| Under 6 | 741 (35.4%) | 1,450 (69.3%) |
| 6 to 18 Years | 2,272 (38.5%) | 4,021 (68.1%) |
| 19 to 25 Years | 581 (28.9%) | 1,272 (63.2%) |
| 25 to 34 Years | 599 (17.4%) | 2,745 (79.8%) |
| 35 to 44 Years | 1,154 (27.9%) | 3,175 (76.7%) |
| 45 to 54 Years | 1,004 (34.7%) | 1,981 (68.4%) |
| 55 to 64 Years | 1,076 (33.2%) | 2,420 (74.6%) |
| 65 to 74 Years | 1,960 (94.1%) | 1,533 (73.6%) |
| 75 Years and over | 1,573 (96.2%) | 1,363 (83.4%) |
| Total | 10,960 (39.9%) | 19,960 (72.7%) |
Disability Status by Sex by Age in Ridgecrest
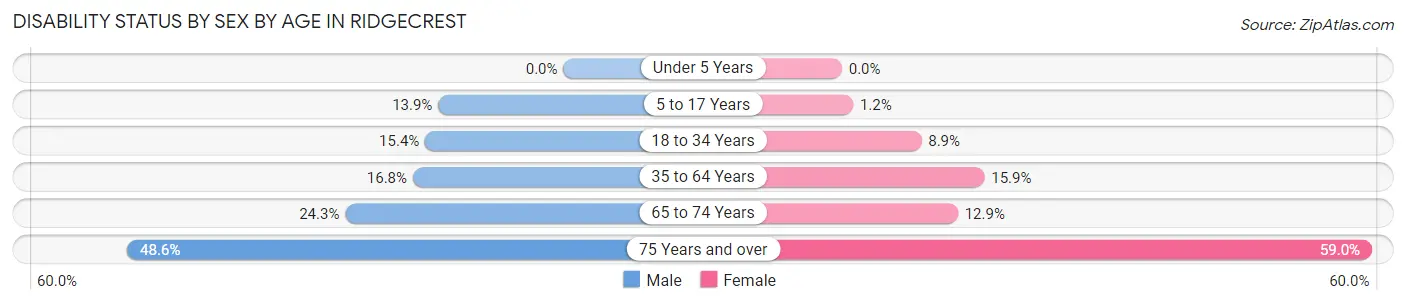
| Age Bracket | Male | Female |
| Under 5 Years | 0 (0.0%) | 0 (0.0%) |
| 5 to 17 Years | 325 (13.9%) | 40 (1.2%) |
| 18 to 34 Years | 462 (15.4%) | 276 (8.8%) |
| 35 to 64 Years | 814 (16.8%) | 860 (15.9%) |
| 65 to 74 Years | 299 (24.3%) | 110 (12.9%) |
| 75 Years and over | 378 (48.6%) | 506 (59.0%) |
Disability Class by Sex by Age in Ridgecrest
Disability Class: Hearing Difficulty
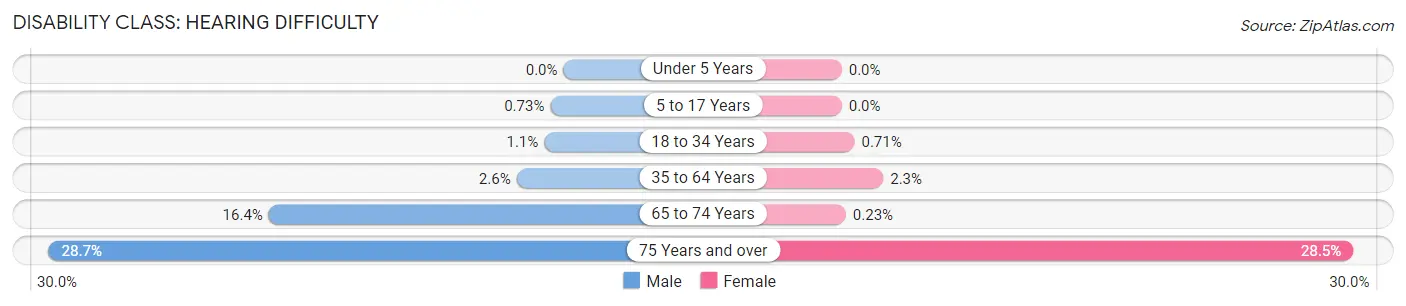
| Age Bracket | Male | Female |
| Under 5 Years | 0 (0.0%) | 0 (0.0%) |
| 5 to 17 Years | 17 (0.7%) | 0 (0.0%) |
| 18 to 34 Years | 32 (1.1%) | 22 (0.7%) |
| 35 to 64 Years | 127 (2.6%) | 125 (2.3%) |
| 65 to 74 Years | 202 (16.4%) | 2 (0.2%) |
| 75 Years and over | 223 (28.7%) | 244 (28.5%) |
Disability Class: Vision Difficulty
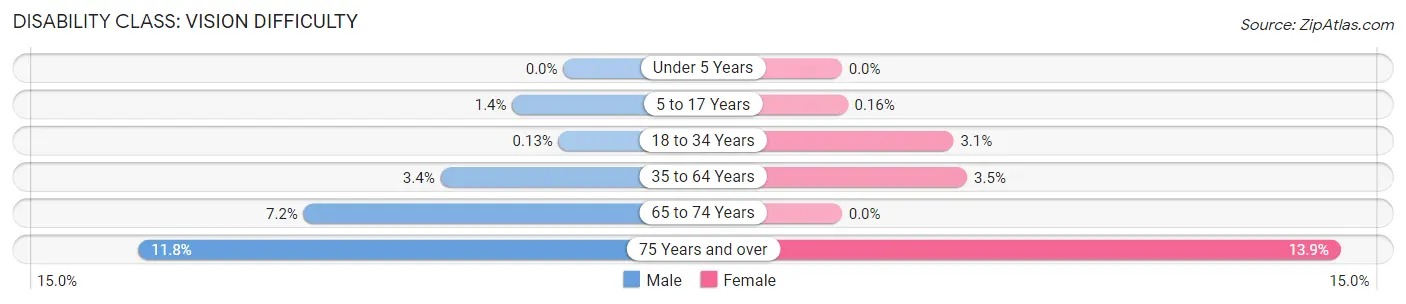
| Age Bracket | Male | Female |
| Under 5 Years | 0 (0.0%) | 0 (0.0%) |
| 5 to 17 Years | 33 (1.4%) | 5 (0.2%) |
| 18 to 34 Years | 4 (0.1%) | 97 (3.1%) |
| 35 to 64 Years | 166 (3.4%) | 189 (3.5%) |
| 65 to 74 Years | 89 (7.2%) | 0 (0.0%) |
| 75 Years and over | 92 (11.8%) | 119 (13.9%) |
Disability Class: Cognitive Difficulty
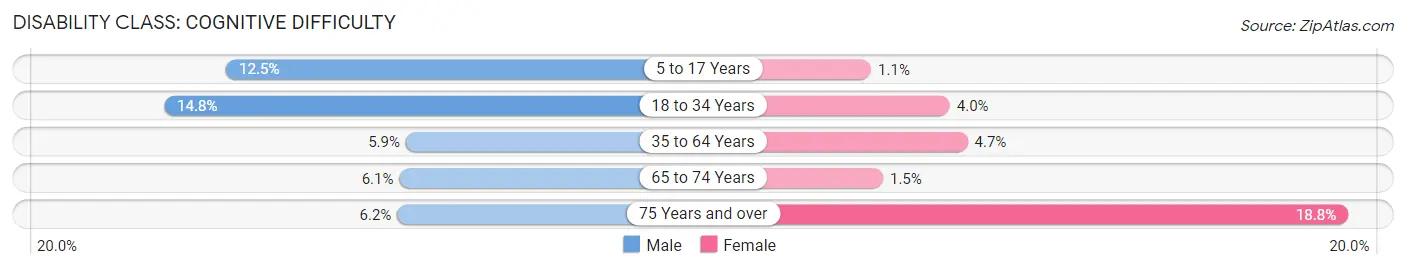
| Age Bracket | Male | Female |
| 5 to 17 Years | 292 (12.5%) | 35 (1.1%) |
| 18 to 34 Years | 445 (14.8%) | 125 (4.0%) |
| 35 to 64 Years | 284 (5.9%) | 253 (4.7%) |
| 65 to 74 Years | 75 (6.1%) | 13 (1.5%) |
| 75 Years and over | 48 (6.2%) | 161 (18.8%) |
Disability Class: Ambulatory Difficulty
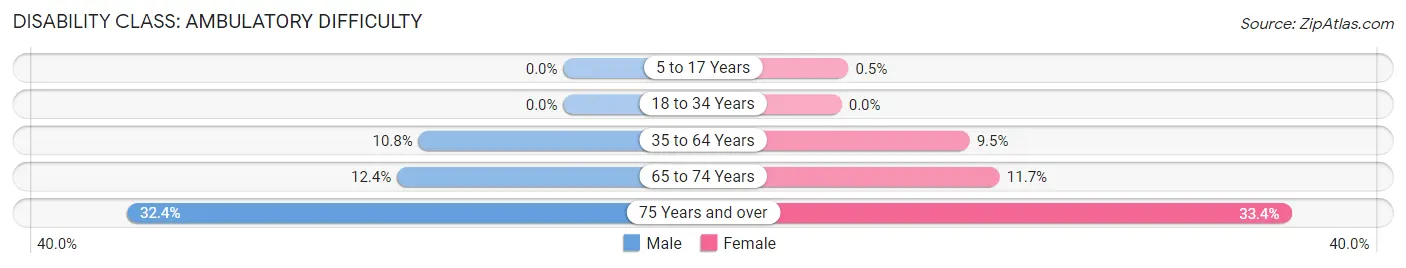
| Age Bracket | Male | Female |
| 5 to 17 Years | 0 (0.0%) | 16 (0.5%) |
| 18 to 34 Years | 0 (0.0%) | 0 (0.0%) |
| 35 to 64 Years | 522 (10.7%) | 515 (9.5%) |
| 65 to 74 Years | 152 (12.3%) | 100 (11.7%) |
| 75 Years and over | 252 (32.4%) | 286 (33.4%) |
Disability Class: Self-Care Difficulty
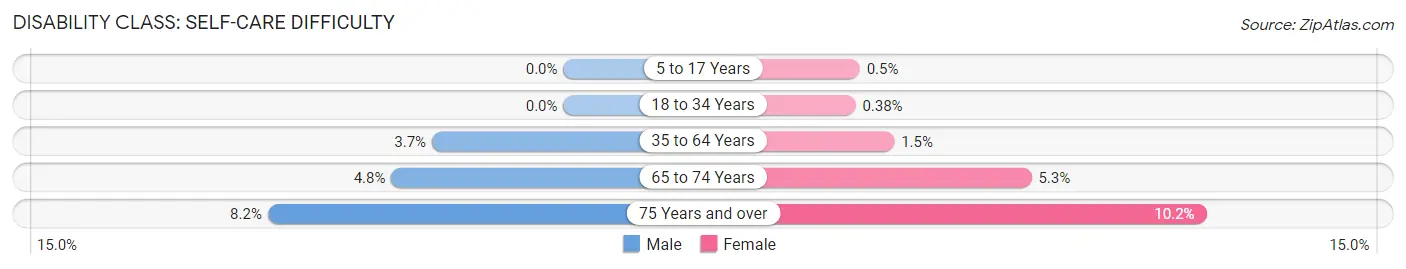
| Age Bracket | Male | Female |
| 5 to 17 Years | 0 (0.0%) | 16 (0.5%) |
| 18 to 34 Years | 0 (0.0%) | 12 (0.4%) |
| 35 to 64 Years | 178 (3.7%) | 79 (1.5%) |
| 65 to 74 Years | 59 (4.8%) | 45 (5.3%) |
| 75 Years and over | 64 (8.2%) | 87 (10.2%) |
Technology Access in Ridgecrest
Computing Device Access in Ridgecrest
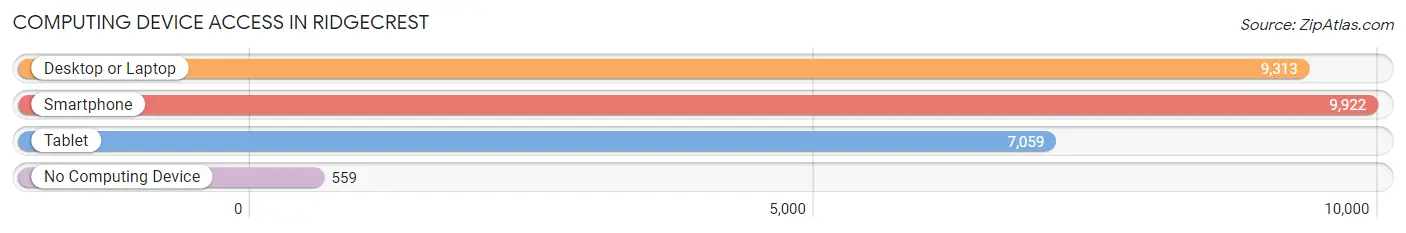
| Device Type | # Households | % Households |
| Desktop or Laptop | 9,313 | 83.6% |
| Smartphone | 9,922 | 89.0% |
| Tablet | 7,059 | 63.3% |
| No Computing Device | 559 | 5.0% |
| Total | 11,144 | 100.0% |
Internet Access in Ridgecrest
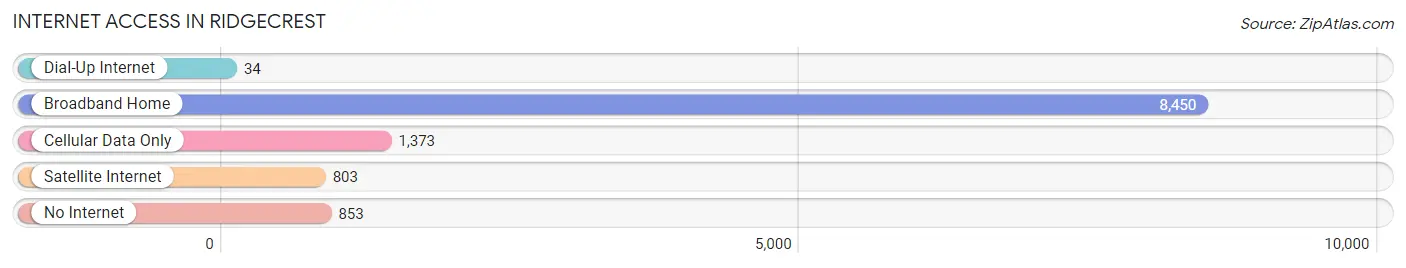
| Internet Type | # Households | % Households |
| Dial-Up Internet | 34 | 0.3% |
| Broadband Home | 8,450 | 75.8% |
| Cellular Data Only | 1,373 | 12.3% |
| Satellite Internet | 803 | 7.2% |
| No Internet | 853 | 7.6% |
| Total | 11,144 | 100.0% |
Ridgecrest Summary
Ridgecrest is a city located in Kern County, California, United States. It is situated in the Indian Wells Valley, near the base of the Sierra Nevada mountain range. The city is located approximately 120 miles northeast of Los Angeles and is part of the Greater Los Angeles Area. As of the 2010 census, the population of Ridgecrest was 27,616.
History
Ridgecrest was founded in 1910 by the Southern Pacific Railroad. The city was named after the nearby mountain range, which was named for its resemblance to a ridge of crescents. The area was originally inhabited by the Paiute and Shoshone Native American tribes. The first settlers in the area were ranchers and miners, who were attracted by the area’s abundant natural resources.
In the early 20th century, the area was developed for agriculture and ranching. The city was incorporated in 1963. In the late 1960s, the U.S. Navy established a base in the area, which has since become the Naval Air Weapons Station China Lake. The base is now the largest employer in the city.
Geography
Ridgecrest is located in the Indian Wells Valley, at the base of the Sierra Nevada mountain range. The city is situated at an elevation of 2,835 feet. The climate is semi-arid, with hot summers and mild winters. The average annual precipitation is 5.5 inches.
The city covers an area of 24.3 square miles, of which 0.2 square miles is water. The city is surrounded by the Indian Wells Valley, which is a large alluvial valley that is bounded by the Sierra Nevada mountain range to the west and the Argus Range to the east.
Economy
Ridgecrest’s economy is largely driven by the U.S. Navy’s Naval Air Weapons Station China Lake, which is the largest employer in the city. Other major employers include the China Lake Naval Air Weapons Station, the China Lake Naval Air Weapons Station, and the China Lake Naval Air Weapons Station.
The city is also home to several manufacturing companies, including the Ridgecrest Manufacturing Company, which produces a variety of products, including aircraft parts, medical equipment, and industrial tools.
Demographics
As of the 2010 census, the population of Ridgecrest was 27,616. The racial makeup of the city was 73.3% White, 5.2% African American, 1.2% Native American, 1.2% Asian, 0.3% Pacific Islander, 15.2% from other races, and 3.7% from two or more races. Hispanic or Latino of any race were 28.2% of the population.
The median income for a household in the city was $41,945, and the median income for a family was $50,945. The per capita income for the city was $20,945. About 14.2% of families and 17.7% of the population were below the poverty line, including 25.2% of those under age 18 and 8.2% of those age 65 or over.
Common Questions
What is Per Capita Income in Ridgecrest?
Per Capita income in Ridgecrest is $39,623.
What is the Median Family Income in Ridgecrest?
Median Family Income in Ridgecrest is $97,167.
What is the Median Household income in Ridgecrest?
Median Household Income in Ridgecrest is $85,872.
What is Income or Wage Gap in Ridgecrest?
Income or Wage Gap in Ridgecrest is 47.8%.
Women in Ridgecrest earn 52.2 cents for every dollar earned by a man.
What is Family Income Deficit in Ridgecrest?
Family Income Deficit in Ridgecrest is $9,379.
Families that are below poverty line in Ridgecrest earn $9,379 less on average than the poverty threshold level.
What is Inequality or Gini Index in Ridgecrest?
Inequality or Gini Index in Ridgecrest is 0.39.
What is the Total Population of Ridgecrest?
Total Population of Ridgecrest is 28,118.
What is the Total Male Population of Ridgecrest?
Total Male Population of Ridgecrest is 13,641.
What is the Total Female Population of Ridgecrest?
Total Female Population of Ridgecrest is 14,477.
What is the Ratio of Males per 100 Females in Ridgecrest?
There are 94.23 Males per 100 Females in Ridgecrest.
What is the Ratio of Females per 100 Males in Ridgecrest?
There are 106.13 Females per 100 Males in Ridgecrest.
What is the Median Population Age in Ridgecrest?
Median Population Age in Ridgecrest is 35.4 Years.
What is the Average Family Size in Ridgecrest
Average Family Size in Ridgecrest is 3.2 People.
What is the Average Household Size in Ridgecrest
Average Household Size in Ridgecrest is 2.5 People.
How Large is the Labor Force in Ridgecrest?
There are 13,639 People in the Labor Forcein in Ridgecrest.
What is the Percentage of People in the Labor Force in Ridgecrest?
63.8% of People are in the Labor Force in Ridgecrest.
What is the Unemployment Rate in Ridgecrest?
Unemployment Rate in Ridgecrest is 9.2%.