Redwood Valley, CA Map & Demographics
Redwood Valley Map
Redwood Valley Overview
$31,194
PER CAPITA INCOME
$88,828
AVG FAMILY INCOME
$53,600
AVG HOUSEHOLD INCOME
53.9%
WAGE / INCOME GAP [ % ]
46.1¢/ $1
WAGE / INCOME GAP [ $ ]
0.48
INEQUALITY / GINI INDEX
1,623
TOTAL POPULATION
790
MALE POPULATION
833
FEMALE POPULATION
94.84
MALES / 100 FEMALES
105.44
FEMALES / 100 MALES
43.4
MEDIAN AGE
4.1
AVG FAMILY SIZE
2.7
AVG HOUSEHOLD SIZE
854
LABOR FORCE [ PEOPLE ]
59.7%
PERCENT IN LABOR FORCE
2.2%
UNEMPLOYMENT RATE
Redwood Valley Zip Codes
Redwood Valley Area Codes
Income in Redwood Valley
Income Overview in Redwood Valley
Per Capita Income in Redwood Valley is $31,194, while median incomes of families and households are $88,828 and $53,600 respectively.
| Characteristic | Number | Measure |
| Per Capita Income | 1,623 | $31,194 |
| Median Family Income | 317 | $88,828 |
| Mean Family Income | 317 | $117,453 |
| Median Household Income | 604 | $53,600 |
| Mean Household Income | 604 | $77,291 |
| Income Deficit | 317 | $0 |
| Wage / Income Gap (%) | 1,623 | 53.93% |
| Wage / Income Gap ($) | 1,623 | 46.07¢ per $1 |
| Gini / Inequality Index | 1,623 | 0.48 |
Earnings by Sex in Redwood Valley
Average Earnings in Redwood Valley are $29,310, $35,994 for men and $16,584 for women, a difference of 53.9%.
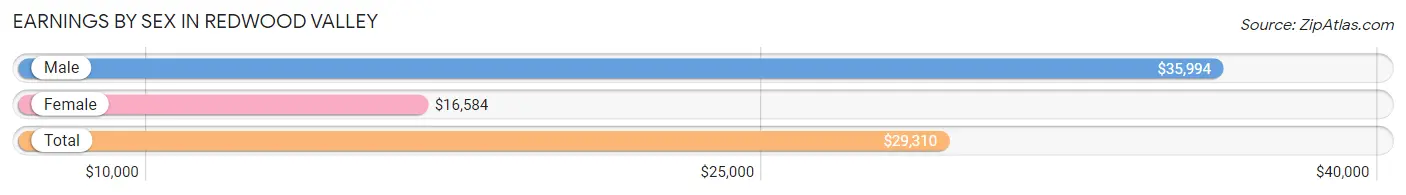
| Sex | Number | Average Earnings |
| Male | 543 (63.6%) | $35,994 |
| Female | 311 (36.4%) | $16,584 |
| Total | 854 (100.0%) | $29,310 |
Earnings by Sex by Income Bracket in Redwood Valley
The most common earnings brackets in Redwood Valley are $25,000 to $29,999 for men (116 | 21.4%) and $15,000 to $17,499 for women (86 | 27.7%).
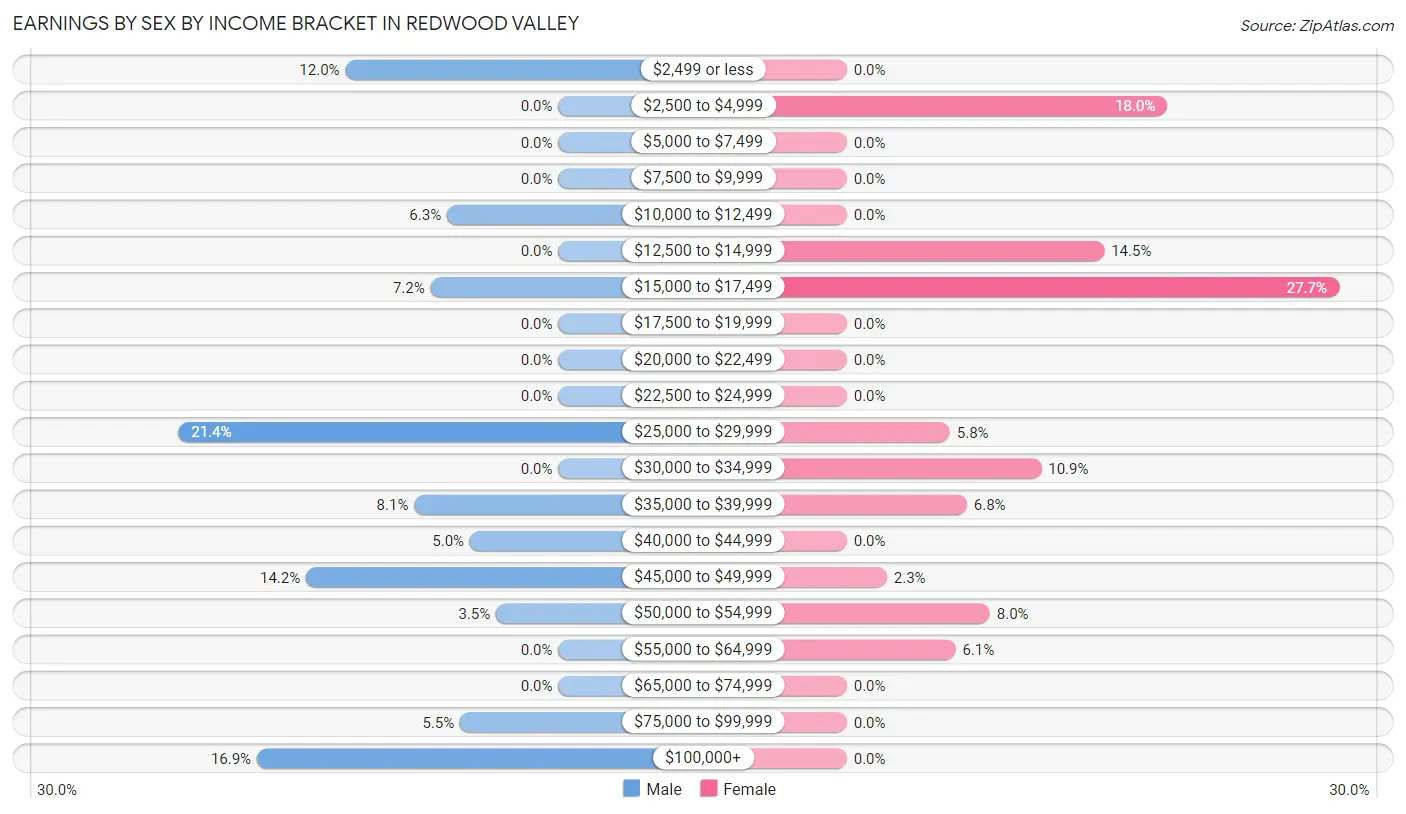
| Income | Male | Female |
| $2,499 or less | 65 (12.0%) | 0 (0.0%) |
| $2,500 to $4,999 | 0 (0.0%) | 56 (18.0%) |
| $5,000 to $7,499 | 0 (0.0%) | 0 (0.0%) |
| $7,500 to $9,999 | 0 (0.0%) | 0 (0.0%) |
| $10,000 to $12,499 | 34 (6.3%) | 0 (0.0%) |
| $12,500 to $14,999 | 0 (0.0%) | 45 (14.5%) |
| $15,000 to $17,499 | 39 (7.2%) | 86 (27.7%) |
| $17,500 to $19,999 | 0 (0.0%) | 0 (0.0%) |
| $20,000 to $22,499 | 0 (0.0%) | 0 (0.0%) |
| $22,500 to $24,999 | 0 (0.0%) | 0 (0.0%) |
| $25,000 to $29,999 | 116 (21.4%) | 18 (5.8%) |
| $30,000 to $34,999 | 0 (0.0%) | 34 (10.9%) |
| $35,000 to $39,999 | 44 (8.1%) | 21 (6.8%) |
| $40,000 to $44,999 | 27 (5.0%) | 0 (0.0%) |
| $45,000 to $49,999 | 77 (14.2%) | 7 (2.2%) |
| $50,000 to $54,999 | 19 (3.5%) | 25 (8.0%) |
| $55,000 to $64,999 | 0 (0.0%) | 19 (6.1%) |
| $65,000 to $74,999 | 0 (0.0%) | 0 (0.0%) |
| $75,000 to $99,999 | 30 (5.5%) | 0 (0.0%) |
| $100,000+ | 92 (16.9%) | 0 (0.0%) |
| Total | 543 (100.0%) | 311 (100.0%) |
Earnings by Sex by Educational Attainment in Redwood Valley
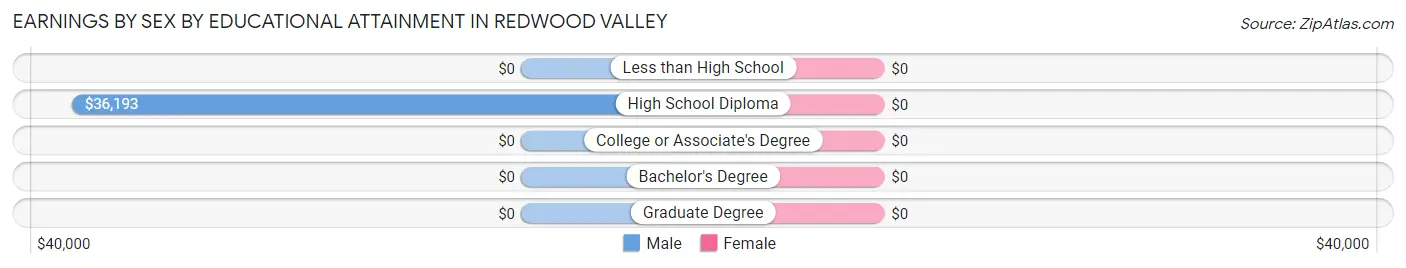
| Educational Attainment | Male Income | Female Income |
| Less than High School | - | - |
| High School Diploma | $36,193 | $0 |
| College or Associate's Degree | - | - |
| Bachelor's Degree | - | - |
| Graduate Degree | - | - |
| Total | - | - |
Family Income in Redwood Valley
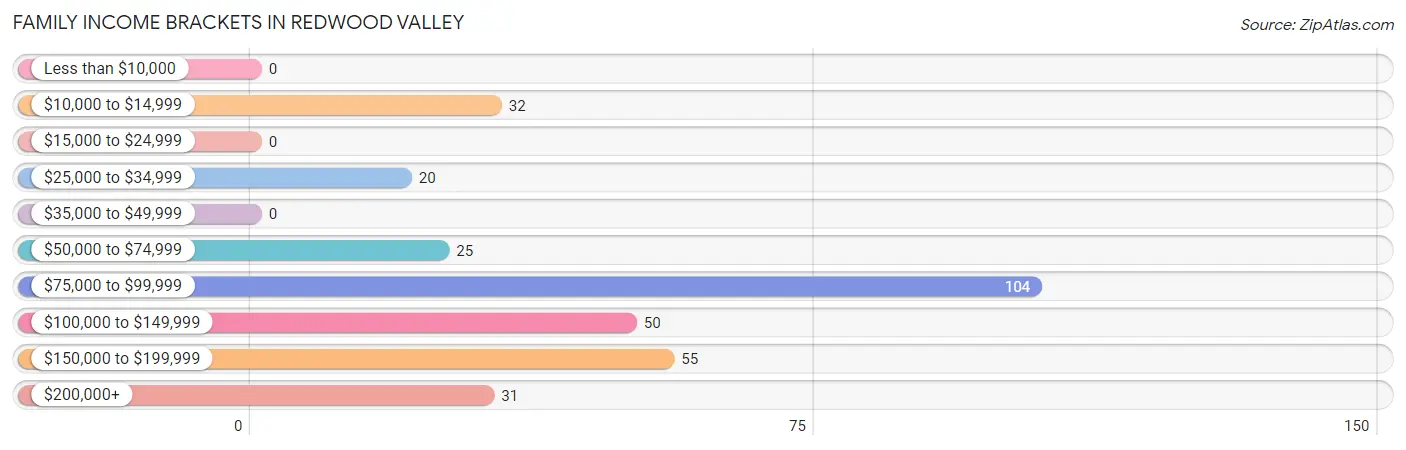
Family Income Brackets in Redwood Valley
According to the Redwood Valley family income data, there are 104 families falling into the $75,000 to $99,999 income range, which is the most common income bracket and makes up 32.8% of all families.
| Income Bracket | # Families | % Families |
| Less than $10,000 | 0 | 0.0% |
| $10,000 to $14,999 | 32 | 10.1% |
| $15,000 to $24,999 | 0 | 0.0% |
| $25,000 to $34,999 | 20 | 6.3% |
| $35,000 to $49,999 | 0 | 0.0% |
| $50,000 to $74,999 | 25 | 7.9% |
| $75,000 to $99,999 | 104 | 32.8% |
| $100,000 to $149,999 | 50 | 15.8% |
| $150,000 to $199,999 | 55 | 17.4% |
| $200,000+ | 31 | 9.8% |
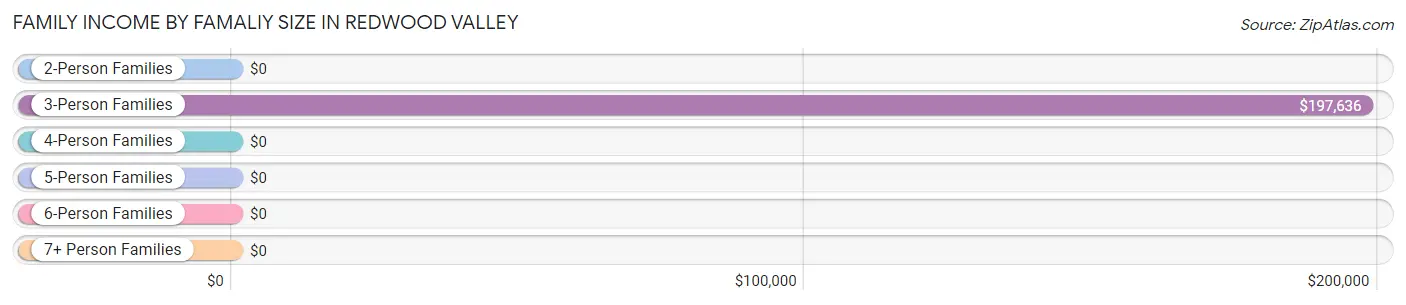
Family Income by Famaliy Size in Redwood Valley
3-person families (104 | 32.8%) account for the highest median family income in Redwood Valley with $197,636 per family, while 3-person families (104 | 32.8%) have the highest median income of $65,879 per family member.
| Income Bracket | # Families | Median Income |
| 2-Person Families | 89 (28.1%) | $0 |
| 3-Person Families | 104 (32.8%) | $197,636 |
| 4-Person Families | 59 (18.6%) | $0 |
| 5-Person Families | 65 (20.5%) | $0 |
| 6-Person Families | 0 (0.0%) | $0 |
| 7+ Person Families | 0 (0.0%) | $0 |
| Total | 317 (100.0%) | $88,828 |
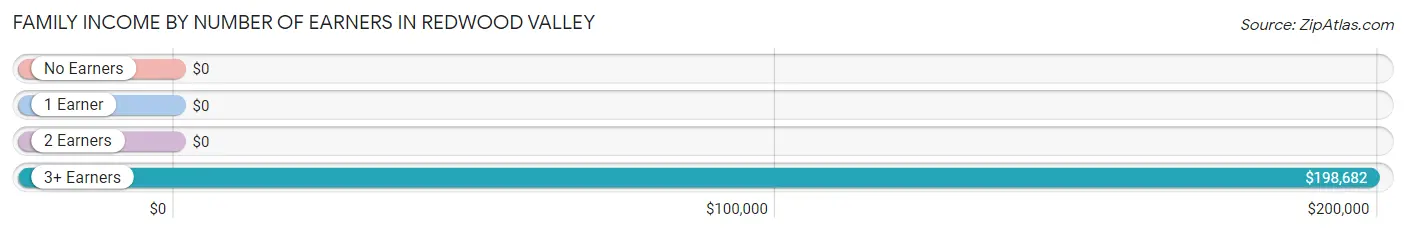
Family Income by Number of Earners in Redwood Valley
| Number of Earners | # Families | Median Income |
| No Earners | 37 (11.7%) | $0 |
| 1 Earner | 85 (26.8%) | $0 |
| 2 Earners | 75 (23.7%) | $0 |
| 3+ Earners | 120 (37.9%) | $198,682 |
| Total | 317 (100.0%) | $88,828 |
Household Income in Redwood Valley
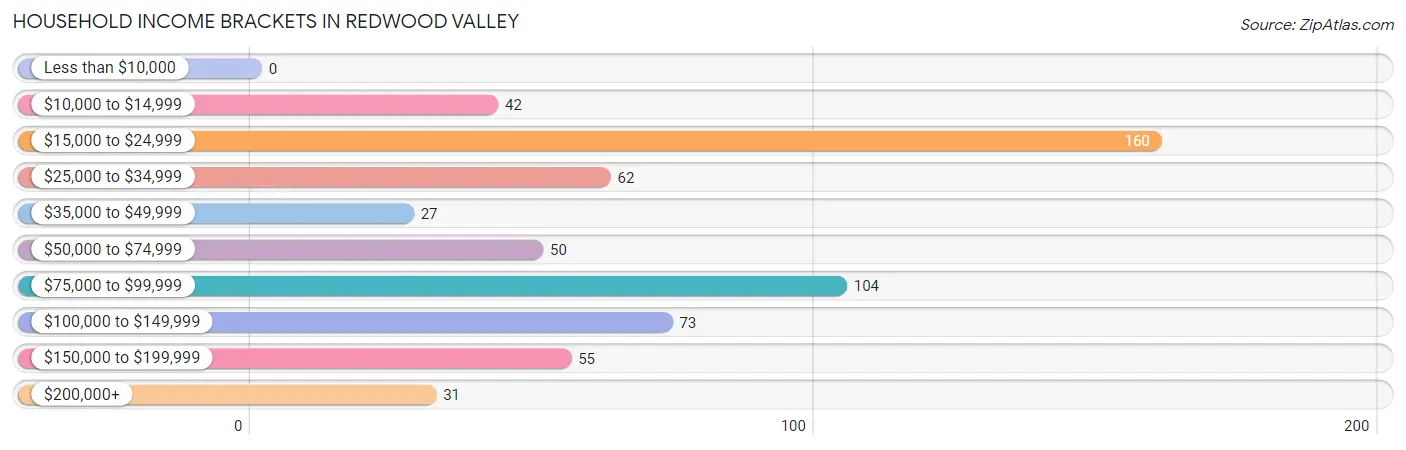
Household Income Brackets in Redwood Valley
With 160 households falling in the category, the $15,000 to $24,999 income range is the most frequent in Redwood Valley, accounting for 26.5% of all households.
| Income Bracket | # Households | % Households |
| Less than $10,000 | 0 | 0.0% |
| $10,000 to $14,999 | 42 | 7.0% |
| $15,000 to $24,999 | 160 | 26.5% |
| $25,000 to $34,999 | 62 | 10.3% |
| $35,000 to $49,999 | 27 | 4.5% |
| $50,000 to $74,999 | 50 | 8.3% |
| $75,000 to $99,999 | 104 | 17.2% |
| $100,000 to $149,999 | 73 | 12.1% |
| $150,000 to $199,999 | 55 | 9.1% |
| $200,000+ | 31 | 5.1% |
Household Income by Householder Age in Redwood Valley
The median household income in Redwood Valley is $53,600, with the highest median household income of $87,917 found in the 45 to 64 years age bracket for the primary householder. A total of 236 households (39.1%) fall into this category.
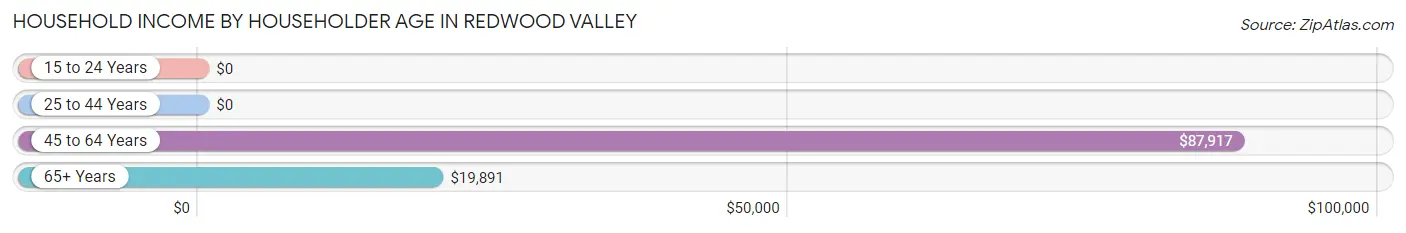
| Income Bracket | # Households | Median Income |
| 15 to 24 Years | 0 (0.0%) | $0 |
| 25 to 44 Years | 87 (14.4%) | $0 |
| 45 to 64 Years | 236 (39.1%) | $87,917 |
| 65+ Years | 281 (46.5%) | $19,891 |
| Total | 604 (100.0%) | $53,600 |
Poverty in Redwood Valley
Income Below Poverty by Sex and Age in Redwood Valley
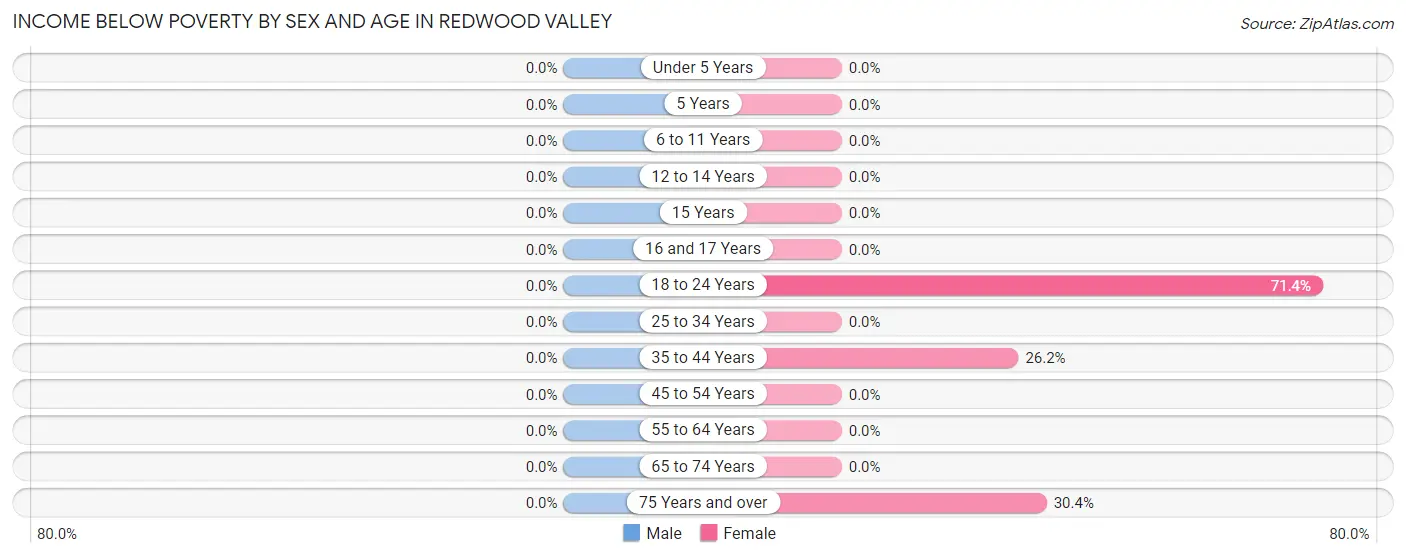
| Age Bracket | Male | Female |
| Under 5 Years | 0 (0.0%) | 0 (0.0%) |
| 5 Years | 0 (0.0%) | 0 (0.0%) |
| 6 to 11 Years | 0 (0.0%) | 0 (0.0%) |
| 12 to 14 Years | 0 (0.0%) | 0 (0.0%) |
| 15 Years | 0 (0.0%) | 0 (0.0%) |
| 16 and 17 Years | 0 (0.0%) | 0 (0.0%) |
| 18 to 24 Years | 0 (0.0%) | 45 (71.4%) |
| 25 to 34 Years | 0 (0.0%) | 0 (0.0%) |
| 35 to 44 Years | 0 (0.0%) | 32 (26.2%) |
| 45 to 54 Years | 0 (0.0%) | 0 (0.0%) |
| 55 to 64 Years | 0 (0.0%) | 0 (0.0%) |
| 65 to 74 Years | 0 (0.0%) | 0 (0.0%) |
| 75 Years and over | 0 (0.0%) | 42 (30.4%) |
| Total | 0 (0.0%) | 119 (14.3%) |
Income Above Poverty by Sex and Age in Redwood Valley
According to the poverty statistics in Redwood Valley, males aged under 5 years and females aged 6 to 11 years are the age groups that are most secure financially, with 100.0% of males and 100.0% of females in these age groups living above the poverty line.
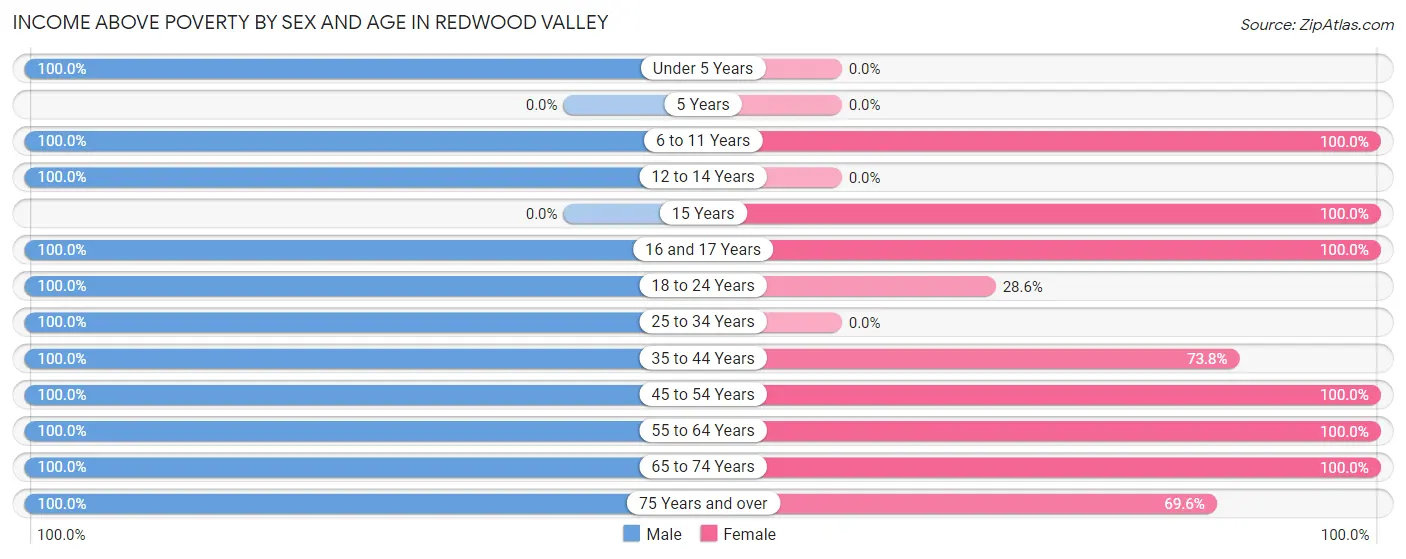
| Age Bracket | Male | Female |
| Under 5 Years | 14 (100.0%) | 0 (0.0%) |
| 5 Years | 0 (0.0%) | 0 (0.0%) |
| 6 to 11 Years | 70 (100.0%) | 47 (100.0%) |
| 12 to 14 Years | 24 (100.0%) | 0 (0.0%) |
| 15 Years | 0 (0.0%) | 38 (100.0%) |
| 16 and 17 Years | 65 (100.0%) | 86 (100.0%) |
| 18 to 24 Years | 203 (100.0%) | 18 (28.6%) |
| 25 to 34 Years | 44 (100.0%) | 0 (0.0%) |
| 35 to 44 Years | 55 (100.0%) | 90 (73.8%) |
| 45 to 54 Years | 143 (100.0%) | 151 (100.0%) |
| 55 to 64 Years | 122 (100.0%) | 48 (100.0%) |
| 65 to 74 Years | 26 (100.0%) | 140 (100.0%) |
| 75 Years and over | 24 (100.0%) | 96 (69.6%) |
| Total | 790 (100.0%) | 714 (85.7%) |
Income Below Poverty Among Married-Couple Families in Redwood Valley
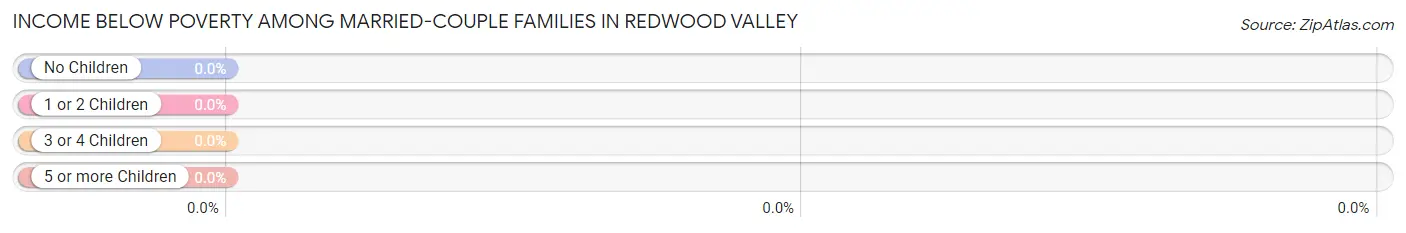
| Children | Above Poverty | Below Poverty |
| No Children | 107 (100.0%) | 0 (0.0%) |
| 1 or 2 Children | 105 (100.0%) | 0 (0.0%) |
| 3 or 4 Children | 31 (100.0%) | 0 (0.0%) |
| 5 or more Children | 0 (0.0%) | 0 (0.0%) |
| Total | 243 (100.0%) | 0 (0.0%) |
Income Below Poverty Among Single-Parent Households in Redwood Valley
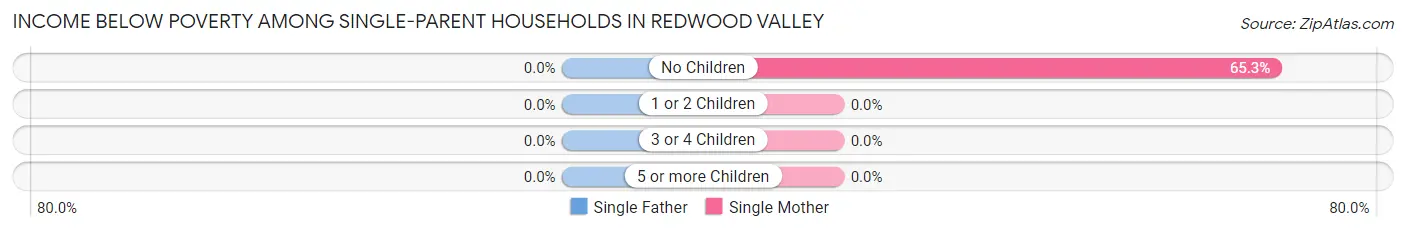
| Children | Single Father | Single Mother |
| No Children | 0 (0.0%) | 32 (65.3%) |
| 1 or 2 Children | 0 (0.0%) | 0 (0.0%) |
| 3 or 4 Children | 0 (0.0%) | 0 (0.0%) |
| 5 or more Children | 0 (0.0%) | 0 (0.0%) |
| Total | 0 (0.0%) | 32 (43.2%) |
Income Below Poverty Among Married-Couple vs Single-Parent Households in Redwood Valley
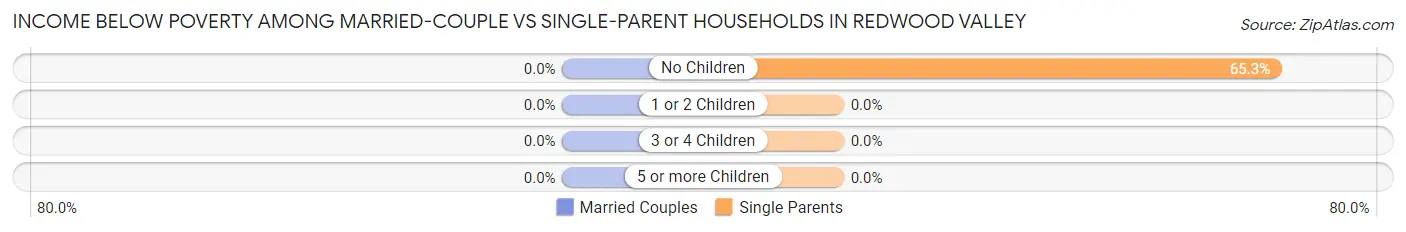
| Children | Married-Couple Families | Single-Parent Households |
| No Children | 0 (0.0%) | 32 (65.3%) |
| 1 or 2 Children | 0 (0.0%) | 0 (0.0%) |
| 3 or 4 Children | 0 (0.0%) | 0 (0.0%) |
| 5 or more Children | 0 (0.0%) | 0 (0.0%) |
| Total | 0 (0.0%) | 32 (43.2%) |
Race in Redwood Valley
The most populous races in Redwood Valley are White / Caucasian (1,169 | 72.0%), Hispanic or Latino (420 | 25.9%), and Some other Race (322 | 19.8%).
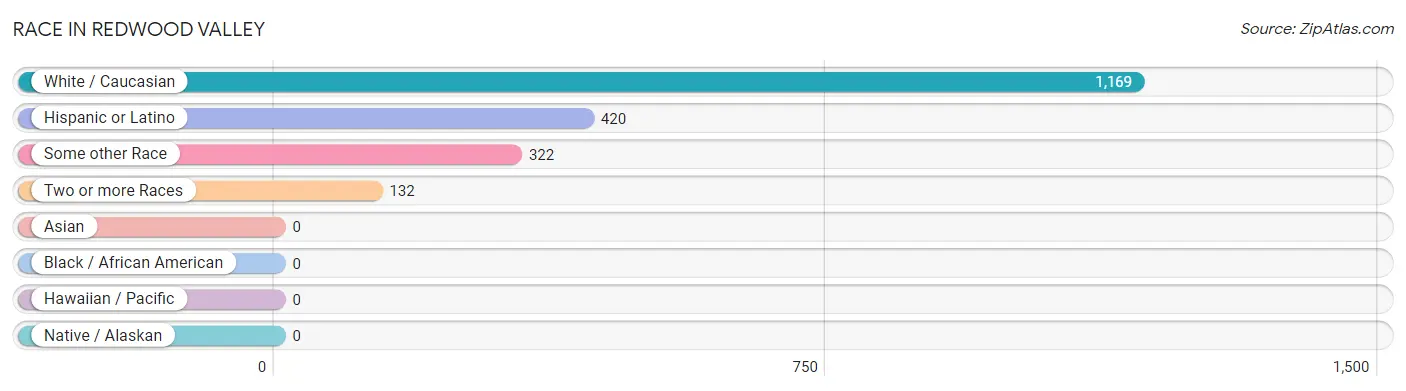
| Race | # Population | % Population |
| Asian | 0 | 0.0% |
| Black / African American | 0 | 0.0% |
| Hawaiian / Pacific | 0 | 0.0% |
| Hispanic or Latino | 420 | 25.9% |
| Native / Alaskan | 0 | 0.0% |
| White / Caucasian | 1,169 | 72.0% |
| Two or more Races | 132 | 8.1% |
| Some other Race | 322 | 19.8% |
| Total | 1,623 | 100.0% |
Ancestry in Redwood Valley
The most populous ancestries reported in Redwood Valley are Mexican (355 | 21.9%), German (258 | 15.9%), English (103 | 6.4%), Irish (101 | 6.2%), and Norwegian (87 | 5.4%), together accounting for 55.7% of all Redwood Valley residents.
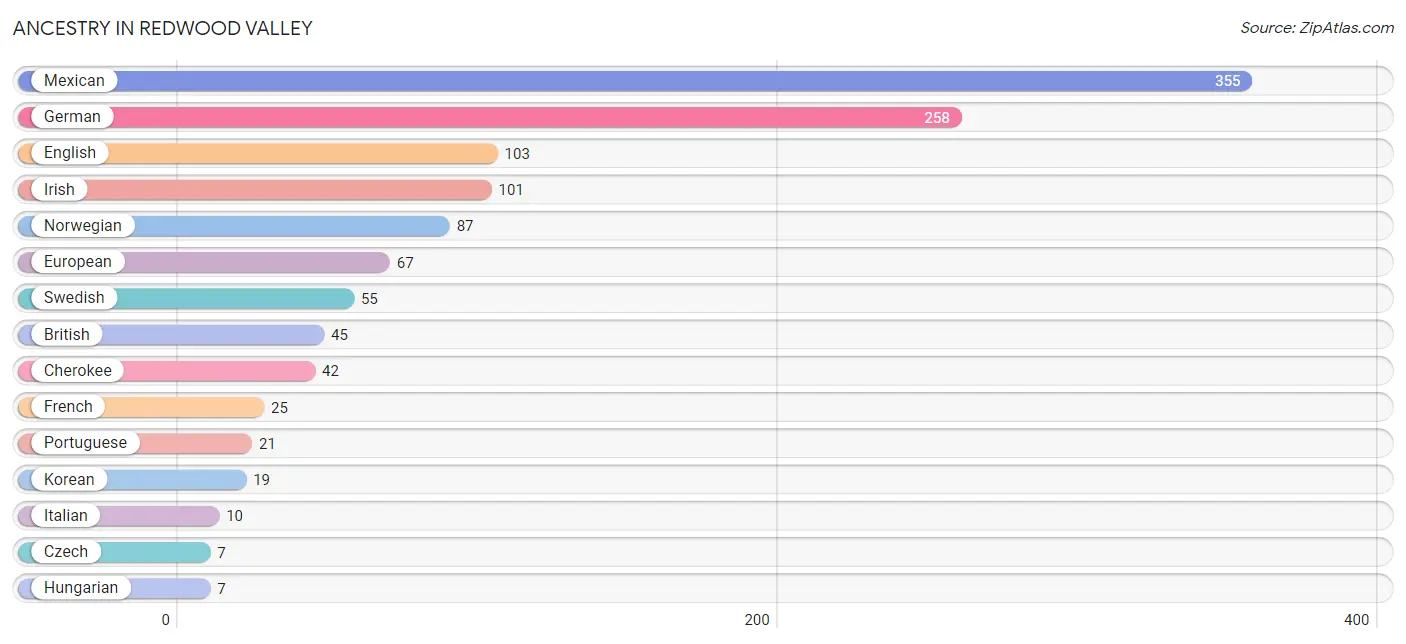
| Ancestry | # Population | % Population |
| British | 45 | 2.8% |
| Cherokee | 42 | 2.6% |
| Czech | 7 | 0.4% |
| English | 103 | 6.4% |
| European | 67 | 4.1% |
| French | 25 | 1.5% |
| German | 258 | 15.9% |
| Hungarian | 7 | 0.4% |
| Irish | 101 | 6.2% |
| Italian | 10 | 0.6% |
| Korean | 19 | 1.2% |
| Mexican | 355 | 21.9% |
| Norwegian | 87 | 5.4% |
| Portuguese | 21 | 1.3% |
| Swedish | 55 | 3.4% | View All 15 Rows |
Immigrants in Redwood Valley
The most numerous immigrant groups reported in Redwood Valley came from Central America (278 | 17.1%), Latin America (278 | 17.1%), and Mexico (278 | 17.1%), together accounting for 51.4% of all Redwood Valley residents.
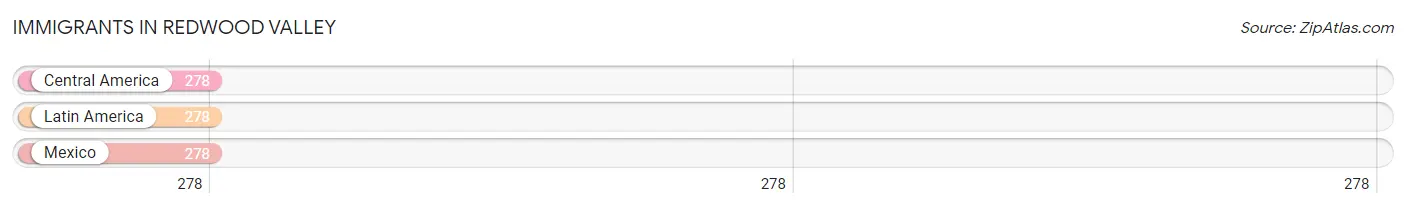
| Immigration Origin | # Population | % Population |
| Central America | 278 | 17.1% |
| Latin America | 278 | 17.1% |
| Mexico | 278 | 17.1% | View All 3 Rows |
Sex and Age in Redwood Valley
Sex and Age in Redwood Valley
The most populous age groups in Redwood Valley are 20 to 24 Years (203 | 25.7%) for men and 15 to 19 Years (124 | 14.9%) for women.
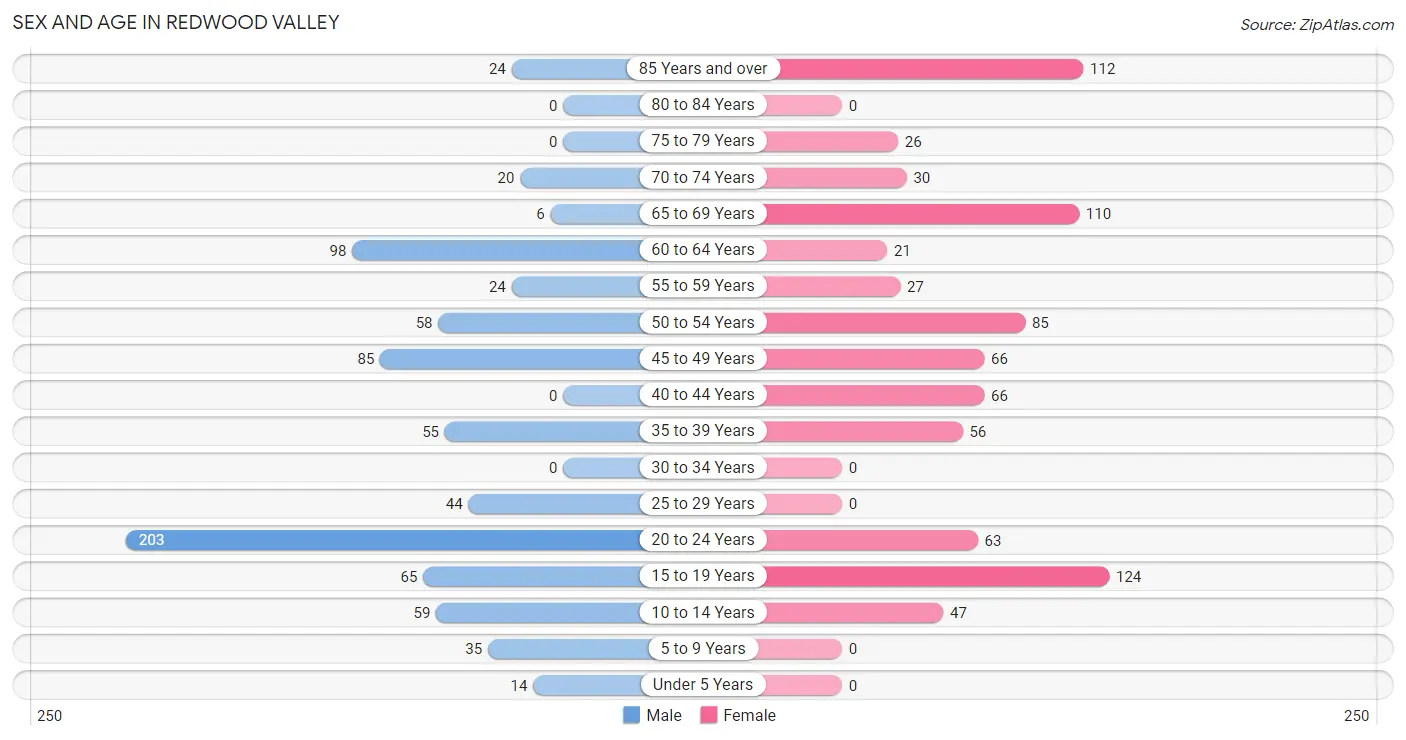
| Age Bracket | Male | Female |
| Under 5 Years | 14 (1.8%) | 0 (0.0%) |
| 5 to 9 Years | 35 (4.4%) | 0 (0.0%) |
| 10 to 14 Years | 59 (7.5%) | 47 (5.6%) |
| 15 to 19 Years | 65 (8.2%) | 124 (14.9%) |
| 20 to 24 Years | 203 (25.7%) | 63 (7.6%) |
| 25 to 29 Years | 44 (5.6%) | 0 (0.0%) |
| 30 to 34 Years | 0 (0.0%) | 0 (0.0%) |
| 35 to 39 Years | 55 (7.0%) | 56 (6.7%) |
| 40 to 44 Years | 0 (0.0%) | 66 (7.9%) |
| 45 to 49 Years | 85 (10.8%) | 66 (7.9%) |
| 50 to 54 Years | 58 (7.3%) | 85 (10.2%) |
| 55 to 59 Years | 24 (3.0%) | 27 (3.2%) |
| 60 to 64 Years | 98 (12.4%) | 21 (2.5%) |
| 65 to 69 Years | 6 (0.8%) | 110 (13.2%) |
| 70 to 74 Years | 20 (2.5%) | 30 (3.6%) |
| 75 to 79 Years | 0 (0.0%) | 26 (3.1%) |
| 80 to 84 Years | 0 (0.0%) | 0 (0.0%) |
| 85 Years and over | 24 (3.0%) | 112 (13.5%) |
| Total | 790 (100.0%) | 833 (100.0%) |
Families and Households in Redwood Valley
Median Family Size in Redwood Valley
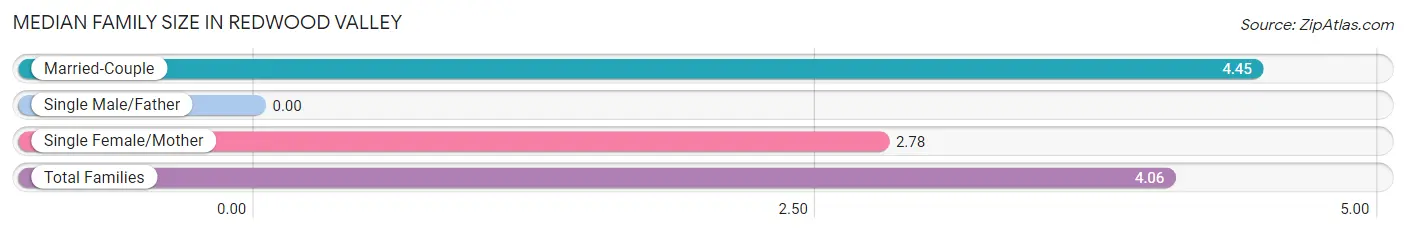
| Family Type | # Families | Family Size |
| Married-Couple | 243 (76.7%) | 4.45 |
| Single Male/Father | 0 (0.0%) | - |
| Single Female/Mother | 74 (23.3%) | 2.78 |
| Total Families | 317 (100.0%) | 4.06 |
Median Household Size in Redwood Valley
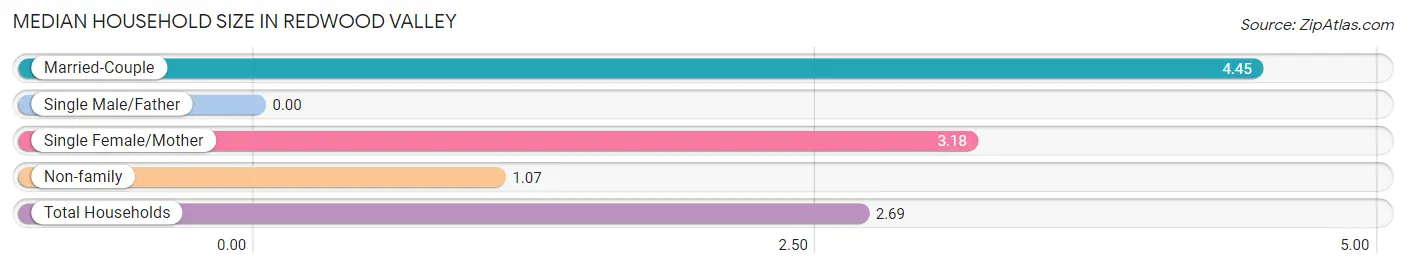
| Household Type | # Households | Household Size |
| Married-Couple | 243 (40.2%) | 4.45 |
| Single Male/Father | 0 (0.0%) | - |
| Single Female/Mother | 74 (12.2%) | 3.18 |
| Non-family | 287 (47.5%) | 1.07 |
| Total Households | 604 (100.0%) | 2.69 |
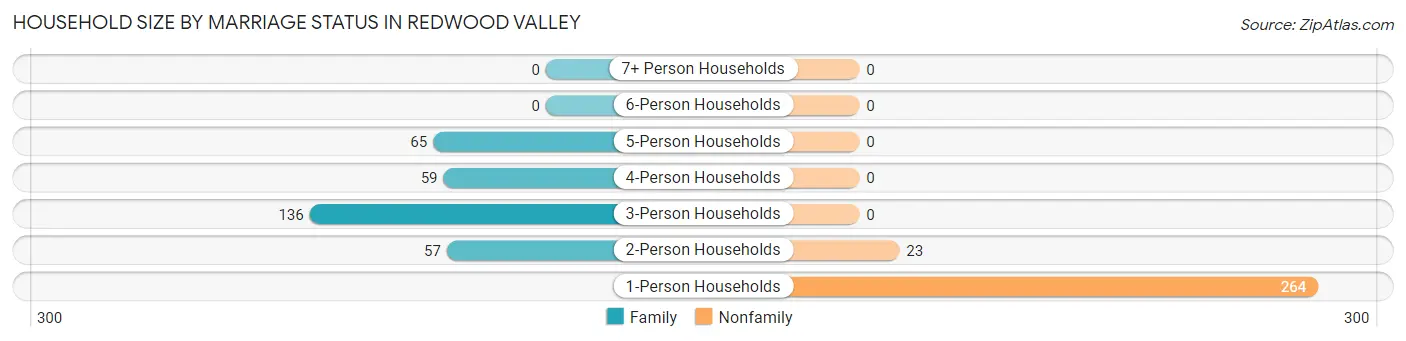
Household Size by Marriage Status in Redwood Valley
Out of a total of 604 households in Redwood Valley, 317 (52.5%) are family households, while 287 (47.5%) are nonfamily households. The most numerous type of family households are 3-person households, comprising 136, and the most common type of nonfamily households are 1-person households, comprising 264.
| Household Size | Family Households | Nonfamily Households |
| 1-Person Households | - | 264 (43.7%) |
| 2-Person Households | 57 (9.4%) | 23 (3.8%) |
| 3-Person Households | 136 (22.5%) | 0 (0.0%) |
| 4-Person Households | 59 (9.8%) | 0 (0.0%) |
| 5-Person Households | 65 (10.8%) | 0 (0.0%) |
| 6-Person Households | 0 (0.0%) | 0 (0.0%) |
| 7+ Person Households | 0 (0.0%) | 0 (0.0%) |
| Total | 317 (52.5%) | 287 (47.5%) |
Female Fertility in Redwood Valley
Fertility by Age in Redwood Valley
| Age Bracket | Women with Births | Births / 1,000 Women |
| 15 to 19 years | 0 (0.0%) | 0.0 |
| 20 to 34 years | 0 (0.0%) | 0.0 |
| 35 to 50 years | 0 (0.0%) | 0.0 |
| Total | 0 (0.0%) | 0.0 |
Fertility by Age by Marriage Status in Redwood Valley
| Age Bracket | Married | Unmarried |
| 15 to 19 years | 0 (0.0%) | 0 (0.0%) |
| 20 to 34 years | 0 (0.0%) | 0 (0.0%) |
| 35 to 50 years | 0 (0.0%) | 0 (0.0%) |
| Total | 0 (0.0%) | 0 (0.0%) |
Fertility by Education in Redwood Valley
| Educational Attainment | Women with Births | Births / 1,000 Women |
| Less than High School | 0 (0.0%) | 0.0 |
| High School Diploma | 0 (0.0%) | 0.0 |
| College or Associate's Degree | 0 (0.0%) | 0.0 |
| Bachelor's Degree | 0 (0.0%) | 0.0 |
| Graduate Degree | 0 (0.0%) | 0.0 |
| Total | 0 (0.0%) | 0.0 |
Fertility by Education by Marriage Status in Redwood Valley
| Educational Attainment | Married | Unmarried |
| Less than High School | 0 (0.0%) | 0 (0.0%) |
| High School Diploma | 0 (0.0%) | 0 (0.0%) |
| College or Associate's Degree | 0 (0.0%) | 0 (0.0%) |
| Bachelor's Degree | 0 (0.0%) | 0 (0.0%) |
| Graduate Degree | 0 (0.0%) | 0 (0.0%) |
| Total | 0 (0.0%) | 0 (0.0%) |
Employment Characteristics in Redwood Valley
Employment by Class of Employer in Redwood Valley
Among the 835 employed individuals in Redwood Valley, private company employees (668 | 80.0%), state government employees (72 | 8.6%), and not-for-profit organizations (70 | 8.4%) make up the most common classes of employment.
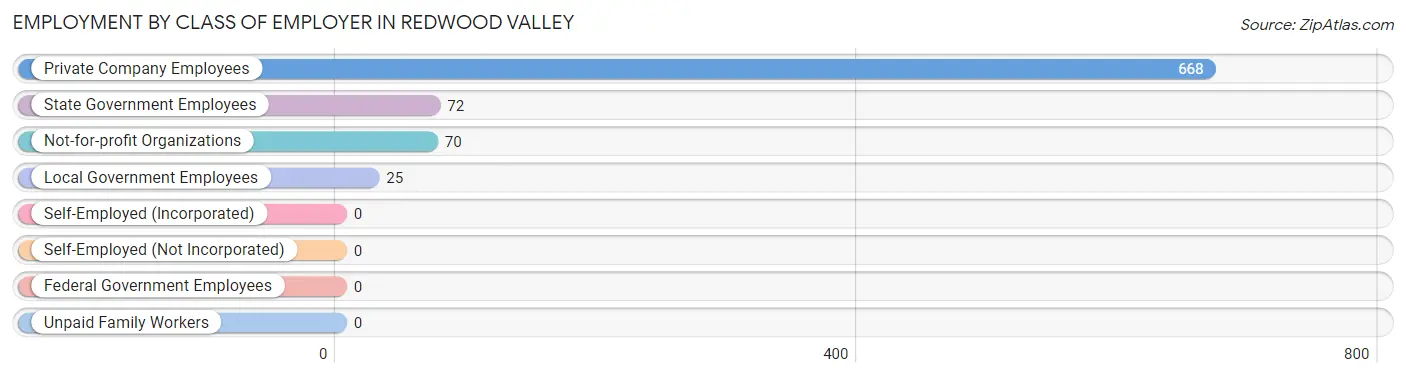
| Employer Class | # Employees | % Employees |
| Private Company Employees | 668 | 80.0% |
| Self-Employed (Incorporated) | 0 | 0.0% |
| Self-Employed (Not Incorporated) | 0 | 0.0% |
| Not-for-profit Organizations | 70 | 8.4% |
| Local Government Employees | 25 | 3.0% |
| State Government Employees | 72 | 8.6% |
| Federal Government Employees | 0 | 0.0% |
| Unpaid Family Workers | 0 | 0.0% |
| Total | 835 | 100.0% |
Employment Status by Age in Redwood Valley
According to the labor force statistics for Redwood Valley, out of the total population over 16 years of age (1,430), 59.7% or 854 individuals are in the labor force, with 2.2% or 19 of them unemployed. The age group with the highest labor force participation rate is 16 to 19 years, with 100.0% or 151 individuals in the labor force. Within the labor force, the 45 to 54 years age range has the highest percentage of unemployed individuals, with 14.6% or 19 of them being unemployed.
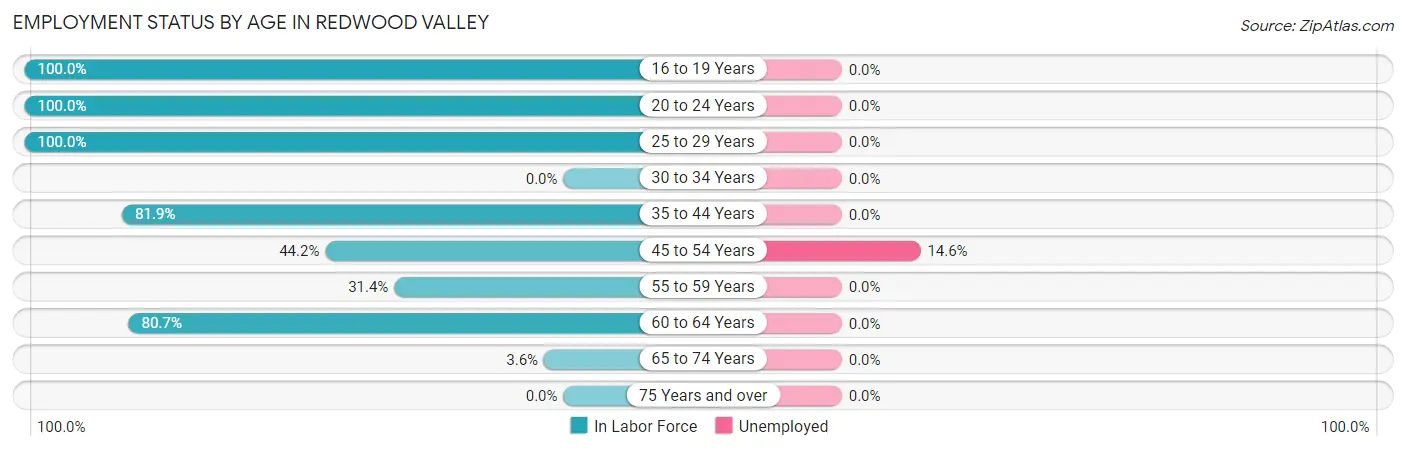
| Age Bracket | In Labor Force | Unemployed |
| 16 to 19 Years | 151 (100.0%) | 0 (0.0%) |
| 20 to 24 Years | 266 (100.0%) | 0 (0.0%) |
| 25 to 29 Years | 44 (100.0%) | 0 (0.0%) |
| 30 to 34 Years | 0 (0.0%) | 0 (0.0%) |
| 35 to 44 Years | 145 (81.9%) | 0 (0.0%) |
| 45 to 54 Years | 130 (44.2%) | 19 (14.6%) |
| 55 to 59 Years | 16 (31.4%) | 0 (0.0%) |
| 60 to 64 Years | 96 (80.7%) | 0 (0.0%) |
| 65 to 74 Years | 6 (3.6%) | 0 (0.0%) |
| 75 Years and over | 0 (0.0%) | 0 (0.0%) |
| Total | 854 (59.7%) | 19 (2.2%) |
Employment Status by Educational Attainment in Redwood Valley
According to labor force statistics for Redwood Valley, 62.9% of individuals (431) out of the total population between 25 and 64 years of age (685) are in the labor force, with 4.4% or 19 of them being unemployed. The group with the highest labor force participation rate are those with the educational attainment of college / associate degree, with 96.0% or 191 individuals in the labor force. Within the labor force, individuals with bachelor's degree or higher education have the highest percentage of unemployment, with 19.2% or 19 of them being unemployed.
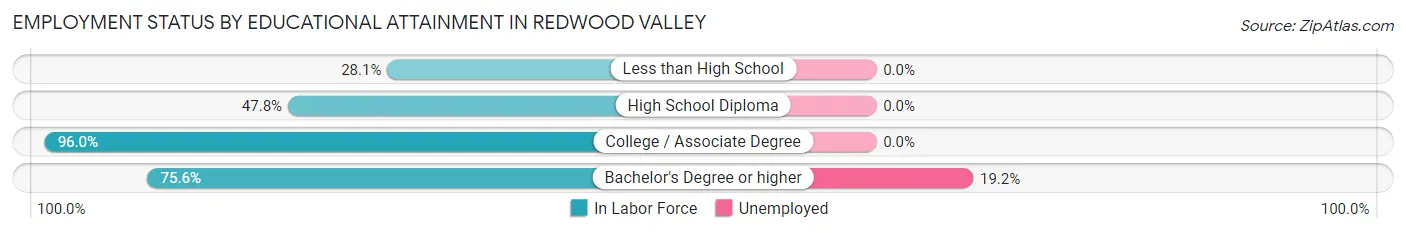
| Educational Attainment | In Labor Force | Unemployed |
| Less than High School | 41 (28.1%) | 0 (0.0%) |
| High School Diploma | 100 (47.8%) | 0 (0.0%) |
| College / Associate Degree | 191 (96.0%) | 0 (0.0%) |
| Bachelor's Degree or higher | 99 (75.6%) | 25 (19.2%) |
| Total | 431 (62.9%) | 30 (4.4%) |
Employment Occupations by Sex in Redwood Valley
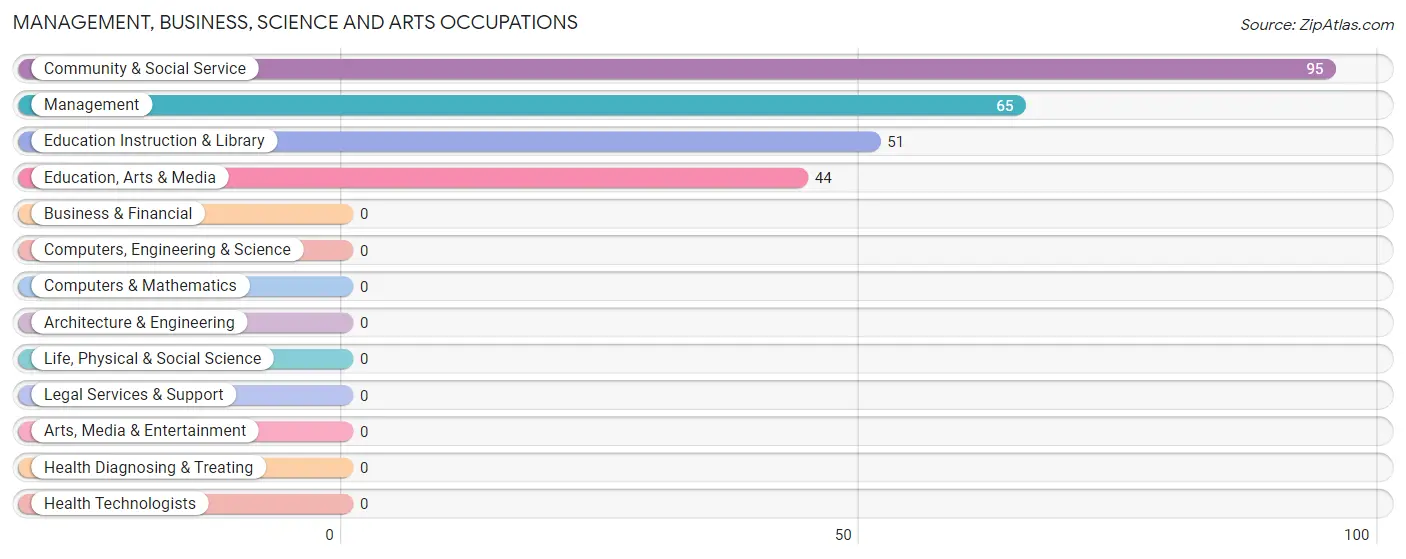
Management, Business, Science and Arts Occupations
The most common Management, Business, Science and Arts occupations in Redwood Valley are Community & Social Service (95 | 11.4%), Management (65 | 7.8%), Education Instruction & Library (51 | 6.1%), and Education, Arts & Media (44 | 5.3%).
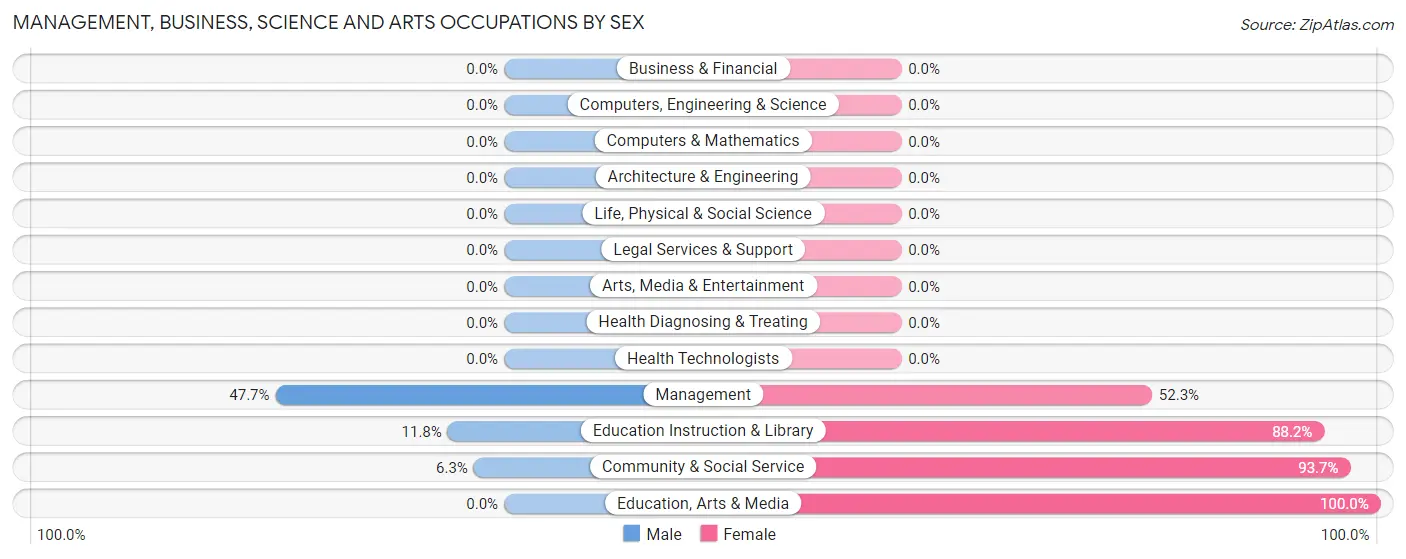
Management, Business, Science and Arts Occupations by Sex
Within the Management, Business, Science and Arts occupations in Redwood Valley, the most male-oriented occupations are Management (47.7%), Education Instruction & Library (11.8%), and Community & Social Service (6.3%), while the most female-oriented occupations are Education, Arts & Media (100.0%), Community & Social Service (93.7%), and Education Instruction & Library (88.2%).
| Occupation | Male | Female |
| Management | 31 (47.7%) | 34 (52.3%) |
| Business & Financial | 0 (0.0%) | 0 (0.0%) |
| Computers, Engineering & Science | 0 (0.0%) | 0 (0.0%) |
| Computers & Mathematics | 0 (0.0%) | 0 (0.0%) |
| Architecture & Engineering | 0 (0.0%) | 0 (0.0%) |
| Life, Physical & Social Science | 0 (0.0%) | 0 (0.0%) |
| Community & Social Service | 6 (6.3%) | 89 (93.7%) |
| Education, Arts & Media | 0 (0.0%) | 44 (100.0%) |
| Legal Services & Support | 0 (0.0%) | 0 (0.0%) |
| Education Instruction & Library | 6 (11.8%) | 45 (88.2%) |
| Arts, Media & Entertainment | 0 (0.0%) | 0 (0.0%) |
| Health Diagnosing & Treating | 0 (0.0%) | 0 (0.0%) |
| Health Technologists | 0 (0.0%) | 0 (0.0%) |
| Total (Category) | 37 (23.1%) | 123 (76.9%) |
| Total (Overall) | 524 (62.7%) | 311 (37.2%) |
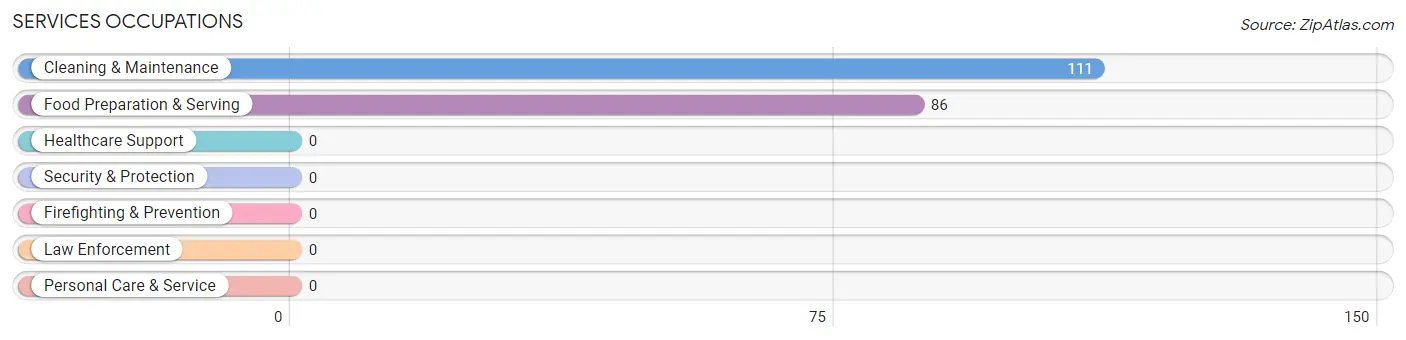
Services Occupations
The most common Services occupations in Redwood Valley are Cleaning & Maintenance (111 | 13.3%), and Food Preparation & Serving (86 | 10.3%).
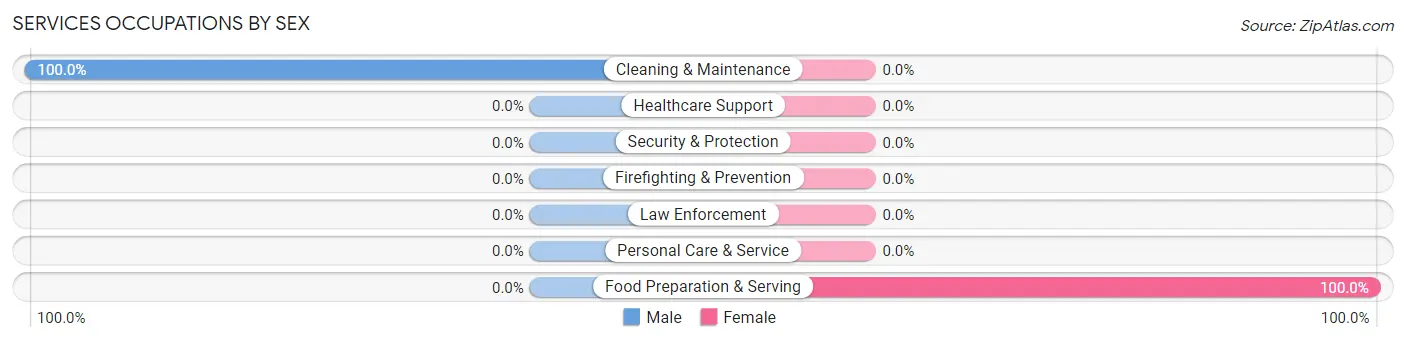
Services Occupations by Sex
| Occupation | Male | Female |
| Healthcare Support | 0 (0.0%) | 0 (0.0%) |
| Security & Protection | 0 (0.0%) | 0 (0.0%) |
| Firefighting & Prevention | 0 (0.0%) | 0 (0.0%) |
| Law Enforcement | 0 (0.0%) | 0 (0.0%) |
| Food Preparation & Serving | 0 (0.0%) | 86 (100.0%) |
| Cleaning & Maintenance | 111 (100.0%) | 0 (0.0%) |
| Personal Care & Service | 0 (0.0%) | 0 (0.0%) |
| Total (Category) | 111 (56.4%) | 86 (43.6%) |
| Total (Overall) | 524 (62.7%) | 311 (37.2%) |
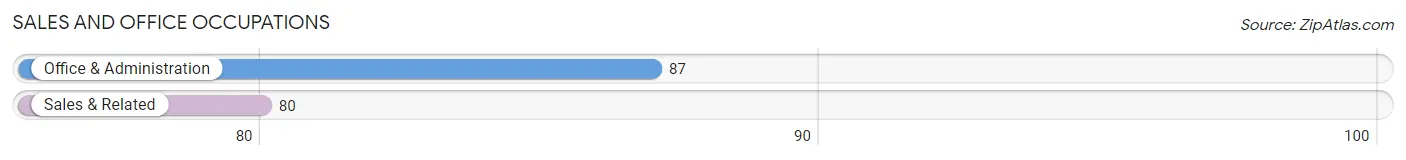
Sales and Office Occupations
The most common Sales and Office occupations in Redwood Valley are Office & Administration (87 | 10.4%), and Sales & Related (80 | 9.6%).
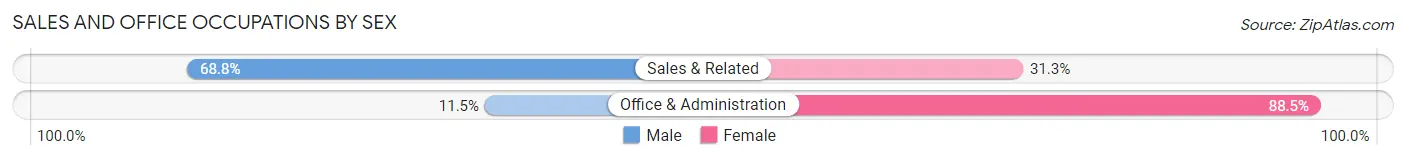
Sales and Office Occupations by Sex
| Occupation | Male | Female |
| Sales & Related | 55 (68.8%) | 25 (31.2%) |
| Office & Administration | 10 (11.5%) | 77 (88.5%) |
| Total (Category) | 65 (38.9%) | 102 (61.1%) |
| Total (Overall) | 524 (62.7%) | 311 (37.2%) |
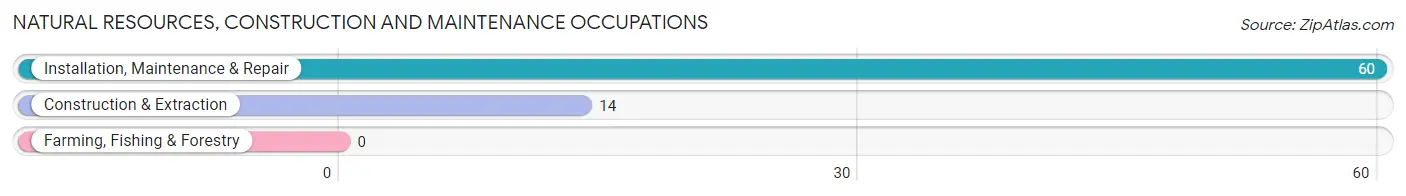
Natural Resources, Construction and Maintenance Occupations
The most common Natural Resources, Construction and Maintenance occupations in Redwood Valley are Installation, Maintenance & Repair (60 | 7.2%), and Construction & Extraction (14 | 1.7%).
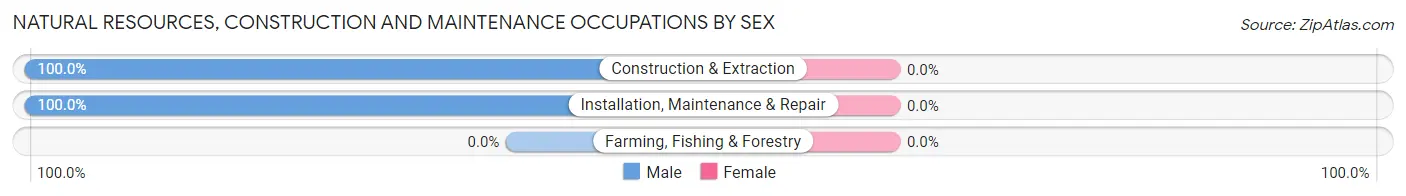
Natural Resources, Construction and Maintenance Occupations by Sex
| Occupation | Male | Female |
| Farming, Fishing & Forestry | 0 (0.0%) | 0 (0.0%) |
| Construction & Extraction | 14 (100.0%) | 0 (0.0%) |
| Installation, Maintenance & Repair | 60 (100.0%) | 0 (0.0%) |
| Total (Category) | 74 (100.0%) | 0 (0.0%) |
| Total (Overall) | 524 (62.7%) | 311 (37.2%) |
Production, Transportation and Moving Occupations
The most common Production, Transportation and Moving occupations in Redwood Valley are Material Moving (134 | 16.1%), Production (74 | 8.9%), and Transportation (29 | 3.5%).
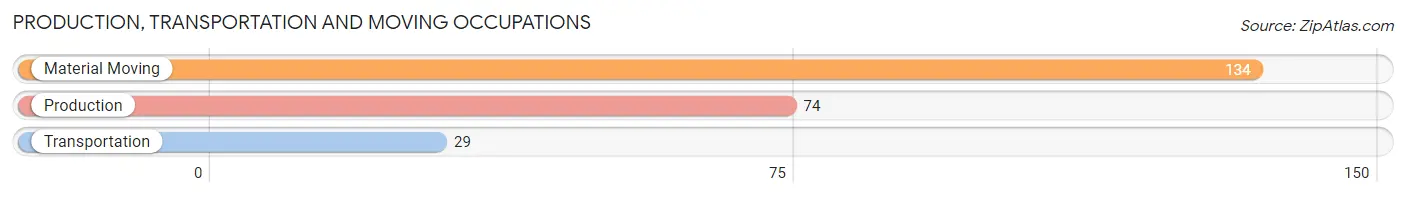
Production, Transportation and Moving Occupations by Sex
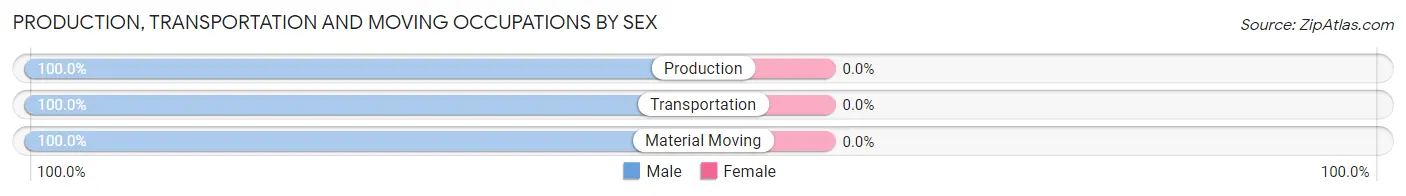
| Occupation | Male | Female |
| Production | 74 (100.0%) | 0 (0.0%) |
| Transportation | 29 (100.0%) | 0 (0.0%) |
| Material Moving | 134 (100.0%) | 0 (0.0%) |
| Total (Category) | 237 (100.0%) | 0 (0.0%) |
| Total (Overall) | 524 (62.7%) | 311 (37.2%) |
Employment Industries by Sex in Redwood Valley
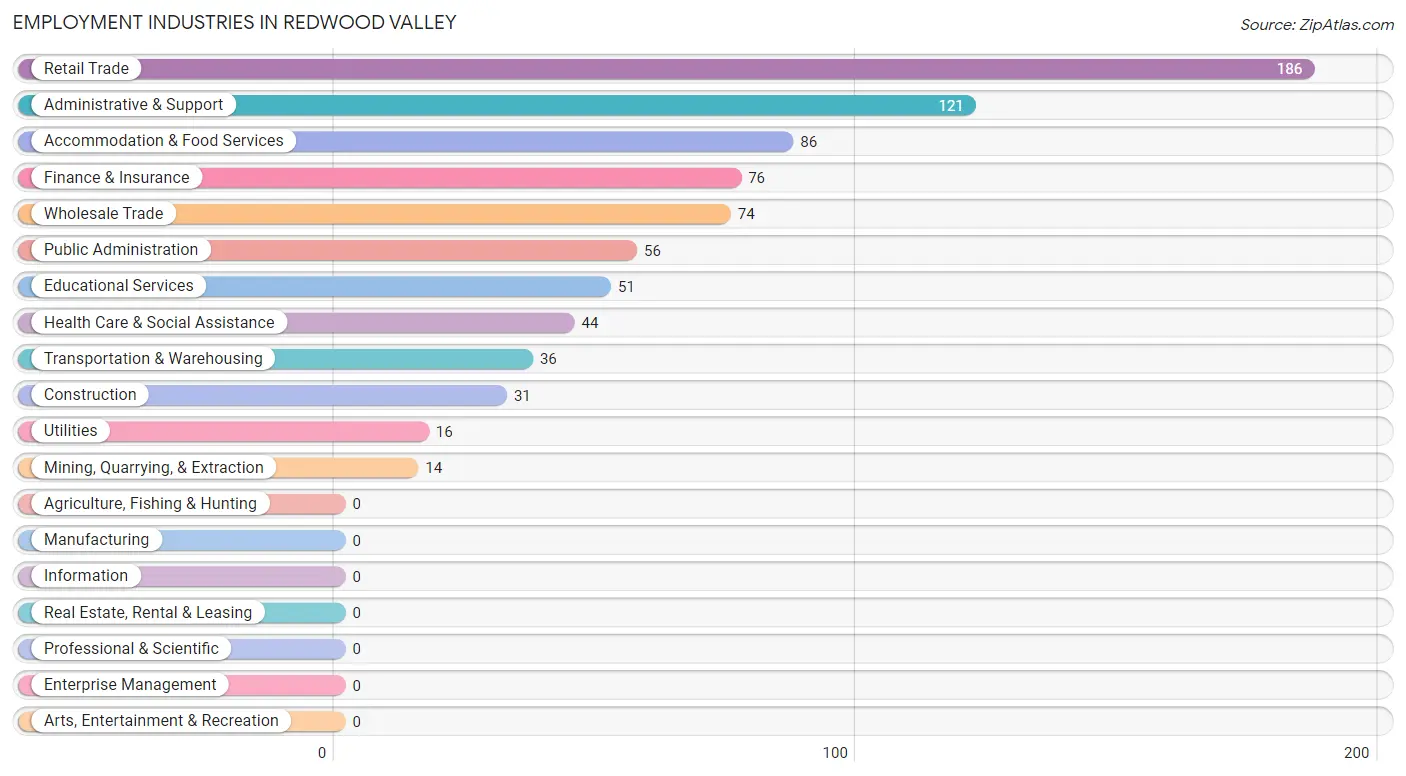
Employment Industries in Redwood Valley
The major employment industries in Redwood Valley include Retail Trade (186 | 22.3%), Administrative & Support (121 | 14.5%), Accommodation & Food Services (86 | 10.3%), Finance & Insurance (76 | 9.1%), and Wholesale Trade (74 | 8.9%).
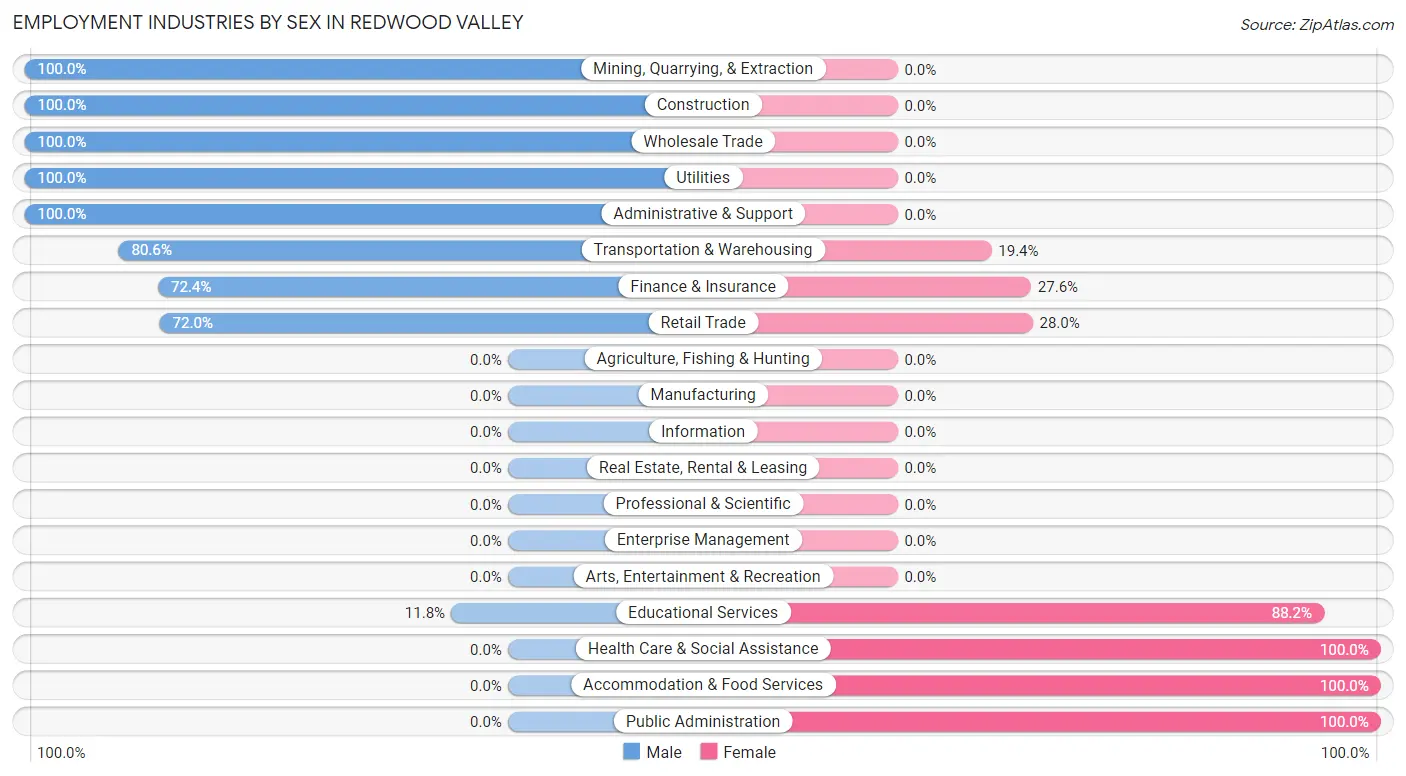
Employment Industries by Sex in Redwood Valley
The Redwood Valley industries that see more men than women are Mining, Quarrying, & Extraction (100.0%), Construction (100.0%), and Wholesale Trade (100.0%), whereas the industries that tend to have a higher number of women are Health Care & Social Assistance (100.0%), Accommodation & Food Services (100.0%), and Public Administration (100.0%).
| Industry | Male | Female |
| Agriculture, Fishing & Hunting | 0 (0.0%) | 0 (0.0%) |
| Mining, Quarrying, & Extraction | 14 (100.0%) | 0 (0.0%) |
| Construction | 31 (100.0%) | 0 (0.0%) |
| Manufacturing | 0 (0.0%) | 0 (0.0%) |
| Wholesale Trade | 74 (100.0%) | 0 (0.0%) |
| Retail Trade | 134 (72.0%) | 52 (28.0%) |
| Transportation & Warehousing | 29 (80.6%) | 7 (19.4%) |
| Utilities | 16 (100.0%) | 0 (0.0%) |
| Information | 0 (0.0%) | 0 (0.0%) |
| Finance & Insurance | 55 (72.4%) | 21 (27.6%) |
| Real Estate, Rental & Leasing | 0 (0.0%) | 0 (0.0%) |
| Professional & Scientific | 0 (0.0%) | 0 (0.0%) |
| Enterprise Management | 0 (0.0%) | 0 (0.0%) |
| Administrative & Support | 121 (100.0%) | 0 (0.0%) |
| Educational Services | 6 (11.8%) | 45 (88.2%) |
| Health Care & Social Assistance | 0 (0.0%) | 44 (100.0%) |
| Arts, Entertainment & Recreation | 0 (0.0%) | 0 (0.0%) |
| Accommodation & Food Services | 0 (0.0%) | 86 (100.0%) |
| Public Administration | 0 (0.0%) | 56 (100.0%) |
| Total | 524 (62.7%) | 311 (37.2%) |
Education in Redwood Valley
School Enrollment in Redwood Valley
The most common levels of schooling among the 522 students in Redwood Valley are high school (189 | 36.2%), college / undergraduate (135 | 25.9%), and middle school (106 | 20.3%).
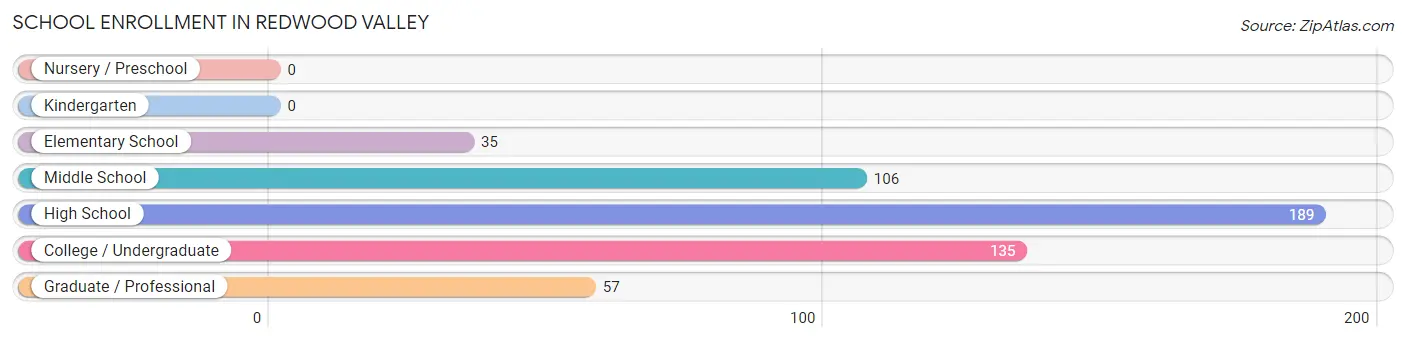
| School Level | # Students | % Students |
| Nursery / Preschool | 0 | 0.0% |
| Kindergarten | 0 | 0.0% |
| Elementary School | 35 | 6.7% |
| Middle School | 106 | 20.3% |
| High School | 189 | 36.2% |
| College / Undergraduate | 135 | 25.9% |
| Graduate / Professional | 57 | 10.9% |
| Total | 522 | 100.0% |
School Enrollment by Age by Funding Source in Redwood Valley
Out of a total of 522 students who are enrolled in schools in Redwood Valley, 57 (10.9%) attend a private institution, while the remaining 465 (89.1%) are enrolled in public schools. The age group of 35 years and over has the highest likelihood of being enrolled in private schools, with 57 (78.1% in the age bracket) enrolled. Conversely, the age group of 5 to 9 year old has the lowest likelihood of being enrolled in a private school, with 35 (100.0% in the age bracket) attending a public institution.
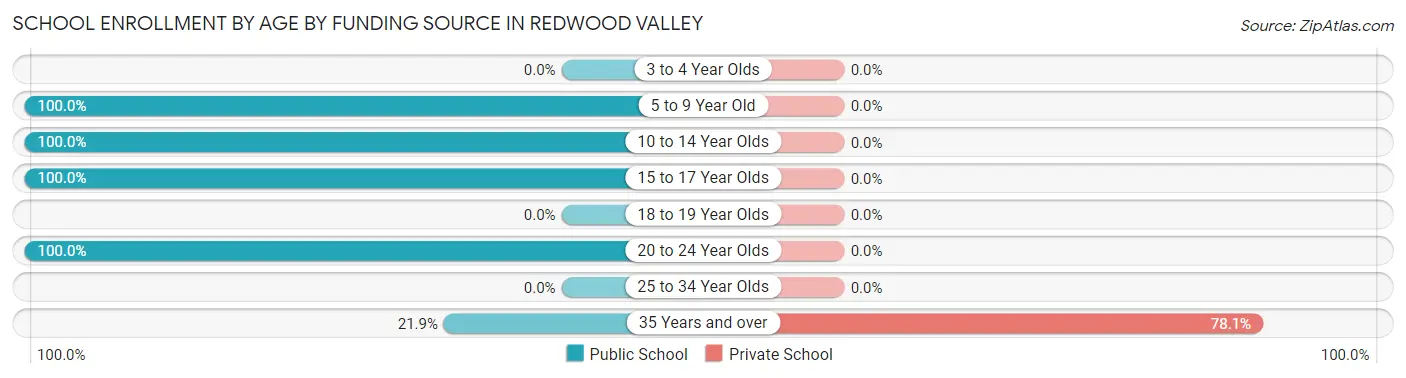
| Age Bracket | Public School | Private School |
| 3 to 4 Year Olds | 0 (0.0%) | 0 (0.0%) |
| 5 to 9 Year Old | 35 (100.0%) | 0 (0.0%) |
| 10 to 14 Year Olds | 106 (100.0%) | 0 (0.0%) |
| 15 to 17 Year Olds | 189 (100.0%) | 0 (0.0%) |
| 18 to 19 Year Olds | 0 (0.0%) | 0 (0.0%) |
| 20 to 24 Year Olds | 119 (100.0%) | 0 (0.0%) |
| 25 to 34 Year Olds | 0 (0.0%) | 0 (0.0%) |
| 35 Years and over | 16 (21.9%) | 57 (78.1%) |
| Total | 465 (89.1%) | 57 (10.9%) |
Educational Attainment by Field of Study in Redwood Valley
Business (55 | 25.7%), psychology (32 | 14.9%), science & technology (32 | 14.9%), arts & humanities (32 | 14.9%), and communications (25 | 11.7%) are the most common fields of study among 214 individuals in Redwood Valley who have obtained a bachelor's degree or higher.
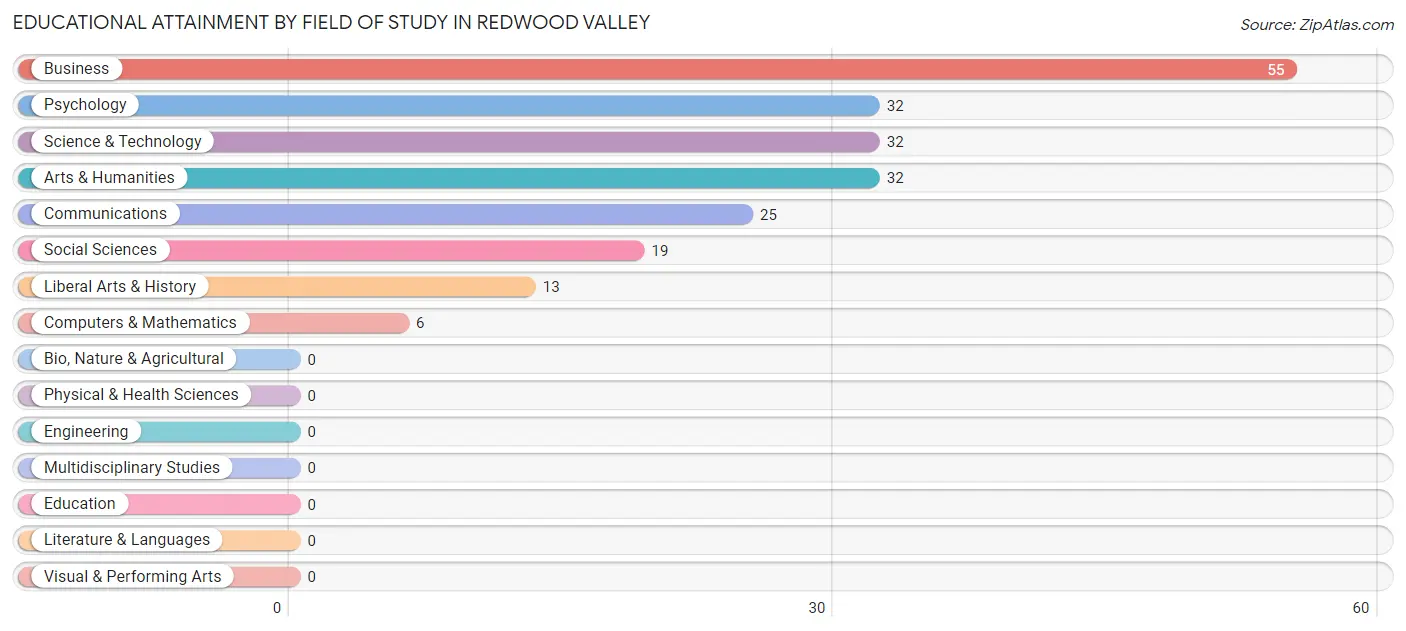
| Field of Study | # Graduates | % Graduates |
| Computers & Mathematics | 6 | 2.8% |
| Bio, Nature & Agricultural | 0 | 0.0% |
| Physical & Health Sciences | 0 | 0.0% |
| Psychology | 32 | 14.9% |
| Social Sciences | 19 | 8.9% |
| Engineering | 0 | 0.0% |
| Multidisciplinary Studies | 0 | 0.0% |
| Science & Technology | 32 | 14.9% |
| Business | 55 | 25.7% |
| Education | 0 | 0.0% |
| Literature & Languages | 0 | 0.0% |
| Liberal Arts & History | 13 | 6.1% |
| Visual & Performing Arts | 0 | 0.0% |
| Communications | 25 | 11.7% |
| Arts & Humanities | 32 | 14.9% |
| Total | 214 | 100.0% |
Transportation & Commute in Redwood Valley
Vehicle Availability by Sex in Redwood Valley
The most prevalent vehicle ownership categories in Redwood Valley are males with 4 vehicles (281, accounting for 53.6%) and females with 4 vehicles (34, making up 90.3%).
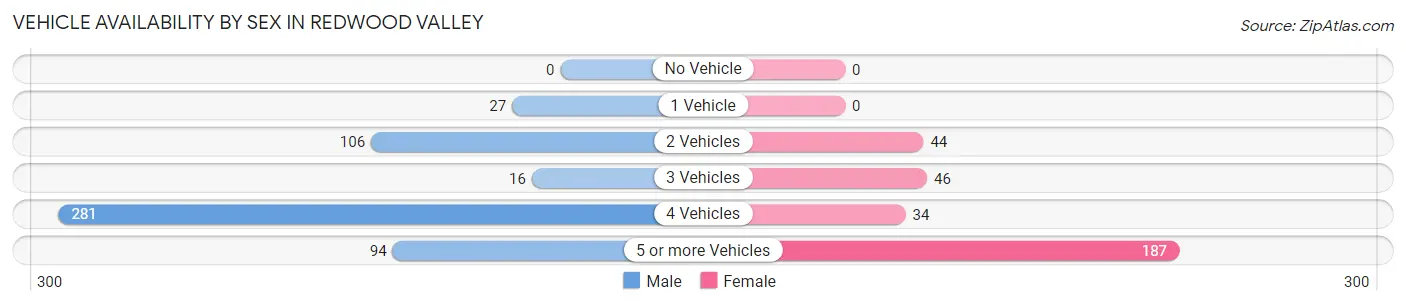
| Vehicles Available | Male | Female |
| No Vehicle | 0 (0.0%) | 0 (0.0%) |
| 1 Vehicle | 27 (5.1%) | 0 (0.0%) |
| 2 Vehicles | 106 (20.2%) | 44 (14.1%) |
| 3 Vehicles | 16 (3.0%) | 46 (14.8%) |
| 4 Vehicles | 281 (53.6%) | 34 (10.9%) |
| 5 or more Vehicles | 94 (17.9%) | 187 (60.1%) |
| Total | 524 (100.0%) | 311 (100.0%) |
Commute Time in Redwood Valley
The most frequently occuring commute durations in Redwood Valley are 90 or more minutes (269 commuters, 34.5%), 15 to 19 minutes (181 commuters, 23.2%), and 10 to 14 minutes (152 commuters, 19.5%).
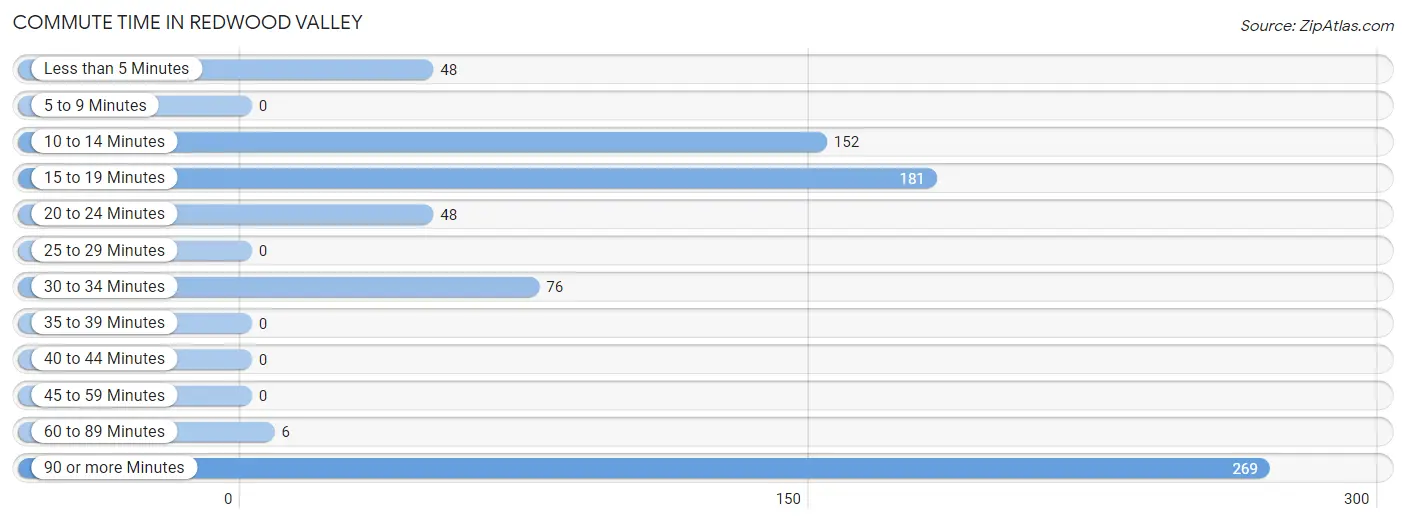
| Commute Time | # Commuters | % Commuters |
| Less than 5 Minutes | 48 | 6.1% |
| 5 to 9 Minutes | 0 | 0.0% |
| 10 to 14 Minutes | 152 | 19.5% |
| 15 to 19 Minutes | 181 | 23.2% |
| 20 to 24 Minutes | 48 | 6.1% |
| 25 to 29 Minutes | 0 | 0.0% |
| 30 to 34 Minutes | 76 | 9.7% |
| 35 to 39 Minutes | 0 | 0.0% |
| 40 to 44 Minutes | 0 | 0.0% |
| 45 to 59 Minutes | 0 | 0.0% |
| 60 to 89 Minutes | 6 | 0.8% |
| 90 or more Minutes | 269 | 34.5% |
Commute Time by Sex in Redwood Valley
The most common commute times in Redwood Valley are 90 or more minutes (224 commuters, 47.8%) for males and 10 to 14 minutes (142 commuters, 45.7%) for females.
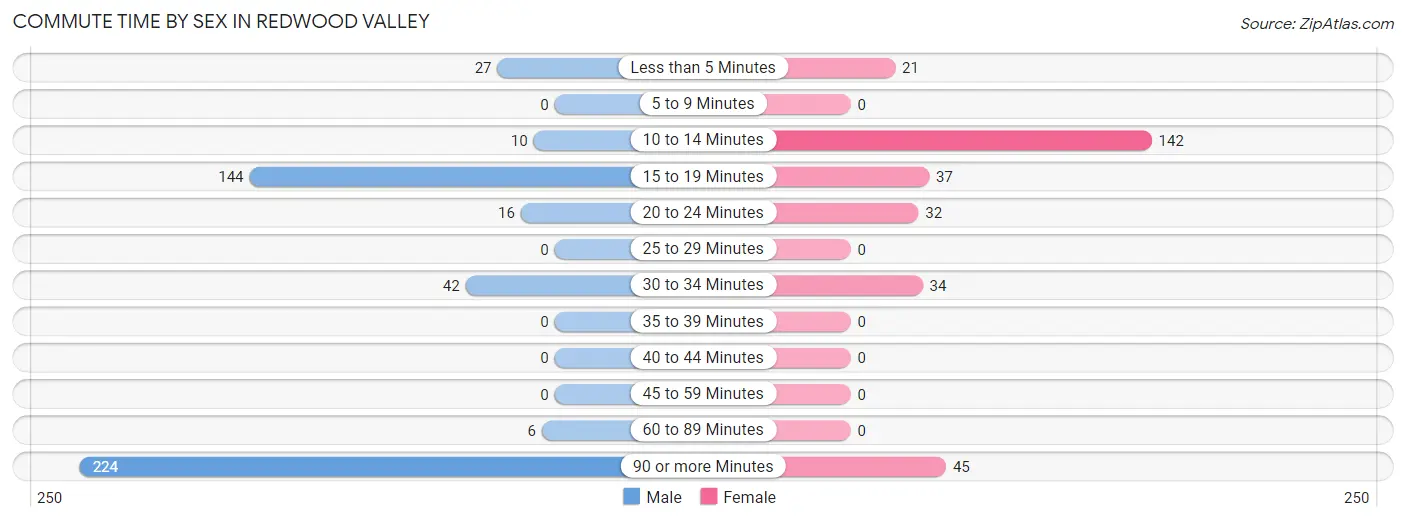
| Commute Time | Male | Female |
| Less than 5 Minutes | 27 (5.8%) | 21 (6.8%) |
| 5 to 9 Minutes | 0 (0.0%) | 0 (0.0%) |
| 10 to 14 Minutes | 10 (2.1%) | 142 (45.7%) |
| 15 to 19 Minutes | 144 (30.7%) | 37 (11.9%) |
| 20 to 24 Minutes | 16 (3.4%) | 32 (10.3%) |
| 25 to 29 Minutes | 0 (0.0%) | 0 (0.0%) |
| 30 to 34 Minutes | 42 (9.0%) | 34 (10.9%) |
| 35 to 39 Minutes | 0 (0.0%) | 0 (0.0%) |
| 40 to 44 Minutes | 0 (0.0%) | 0 (0.0%) |
| 45 to 59 Minutes | 0 (0.0%) | 0 (0.0%) |
| 60 to 89 Minutes | 6 (1.3%) | 0 (0.0%) |
| 90 or more Minutes | 224 (47.8%) | 45 (14.5%) |
Time of Departure to Work by Sex in Redwood Valley
The most frequent times of departure to work in Redwood Valley are 12:00 PM to 3:59 PM (181, 38.6%) for males and 7:30 AM to 7:59 AM (104, 33.4%) for females.
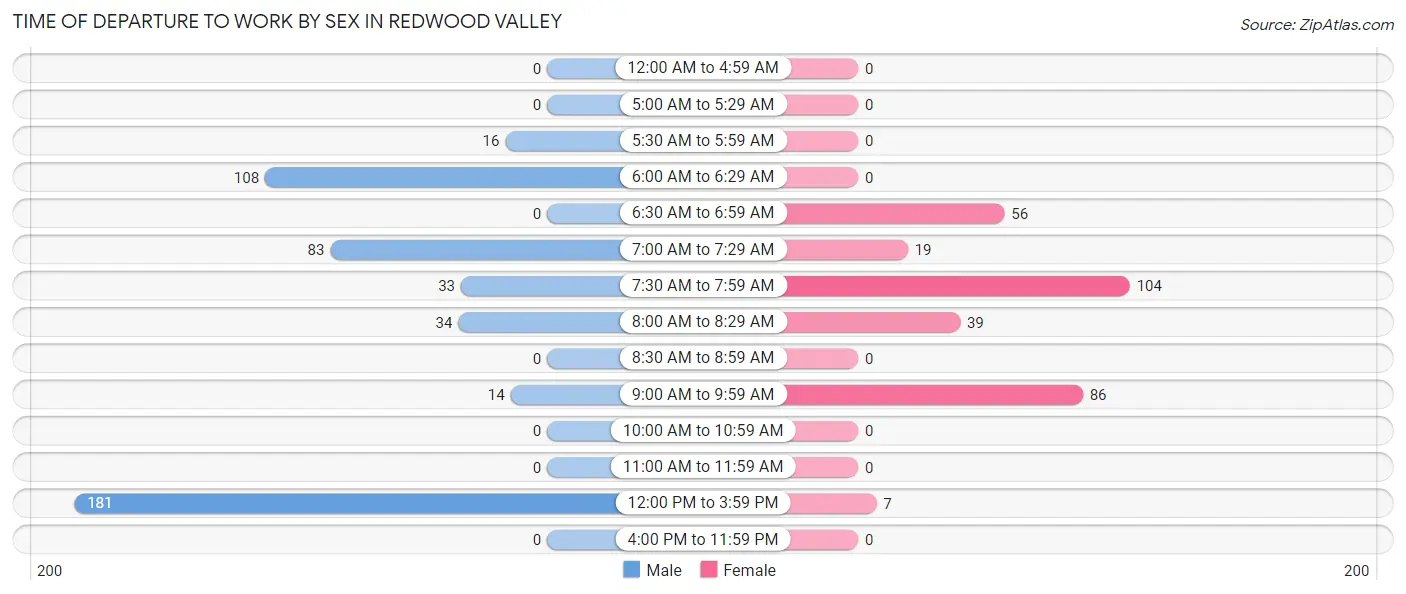
| Time of Departure | Male | Female |
| 12:00 AM to 4:59 AM | 0 (0.0%) | 0 (0.0%) |
| 5:00 AM to 5:29 AM | 0 (0.0%) | 0 (0.0%) |
| 5:30 AM to 5:59 AM | 16 (3.4%) | 0 (0.0%) |
| 6:00 AM to 6:29 AM | 108 (23.0%) | 0 (0.0%) |
| 6:30 AM to 6:59 AM | 0 (0.0%) | 56 (18.0%) |
| 7:00 AM to 7:29 AM | 83 (17.7%) | 19 (6.1%) |
| 7:30 AM to 7:59 AM | 33 (7.0%) | 104 (33.4%) |
| 8:00 AM to 8:29 AM | 34 (7.2%) | 39 (12.5%) |
| 8:30 AM to 8:59 AM | 0 (0.0%) | 0 (0.0%) |
| 9:00 AM to 9:59 AM | 14 (3.0%) | 86 (27.7%) |
| 10:00 AM to 10:59 AM | 0 (0.0%) | 0 (0.0%) |
| 11:00 AM to 11:59 AM | 0 (0.0%) | 0 (0.0%) |
| 12:00 PM to 3:59 PM | 181 (38.6%) | 7 (2.2%) |
| 4:00 PM to 11:59 PM | 0 (0.0%) | 0 (0.0%) |
| Total | 469 (100.0%) | 311 (100.0%) |
Housing Occupancy in Redwood Valley
Occupancy by Ownership in Redwood Valley
Of the total 604 dwellings in Redwood Valley, owner-occupied units account for 308 (51.0%), while renter-occupied units make up 296 (49.0%).
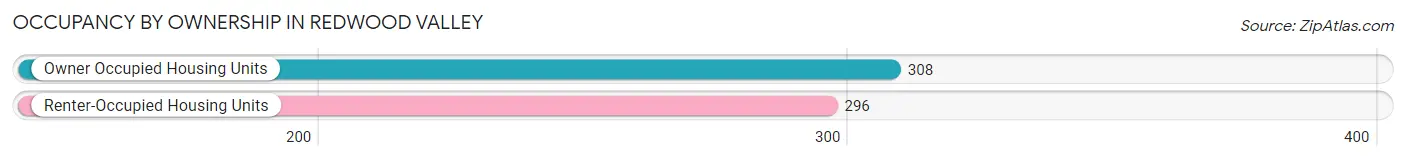
| Occupancy | # Housing Units | % Housing Units |
| Owner Occupied Housing Units | 308 | 51.0% |
| Renter-Occupied Housing Units | 296 | 49.0% |
| Total Occupied Housing Units | 604 | 100.0% |
Occupancy by Household Size in Redwood Valley
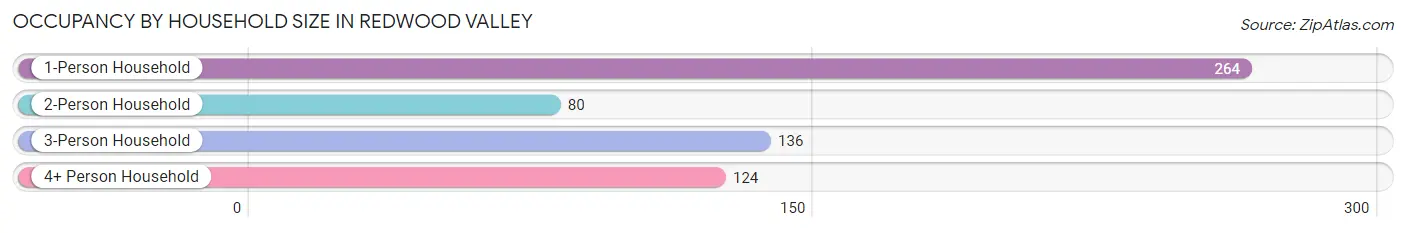
| Household Size | # Housing Units | % Housing Units |
| 1-Person Household | 264 | 43.7% |
| 2-Person Household | 80 | 13.3% |
| 3-Person Household | 136 | 22.5% |
| 4+ Person Household | 124 | 20.5% |
| Total Housing Units | 604 | 100.0% |
Occupancy by Ownership by Household Size in Redwood Valley
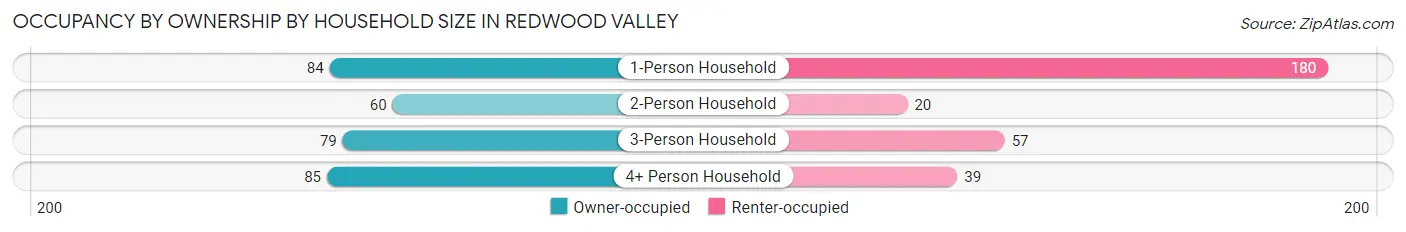
| Household Size | Owner-occupied | Renter-occupied |
| 1-Person Household | 84 (31.8%) | 180 (68.2%) |
| 2-Person Household | 60 (75.0%) | 20 (25.0%) |
| 3-Person Household | 79 (58.1%) | 57 (41.9%) |
| 4+ Person Household | 85 (68.5%) | 39 (31.5%) |
| Total Housing Units | 308 (51.0%) | 296 (49.0%) |
Occupancy by Educational Attainment in Redwood Valley
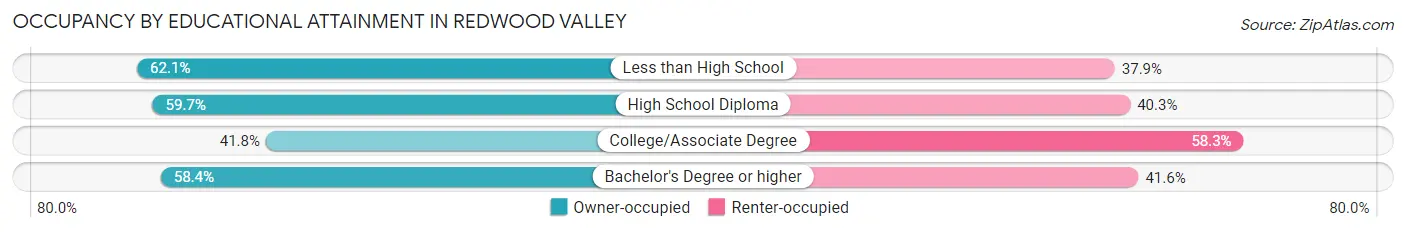
| Household Size | Owner-occupied | Renter-occupied |
| Less than High School | 64 (62.1%) | 39 (37.9%) |
| High School Diploma | 40 (59.7%) | 27 (40.3%) |
| College/Associate Degree | 124 (41.7%) | 173 (58.3%) |
| Bachelor's Degree or higher | 80 (58.4%) | 57 (41.6%) |
Occupancy by Age of Householder in Redwood Valley
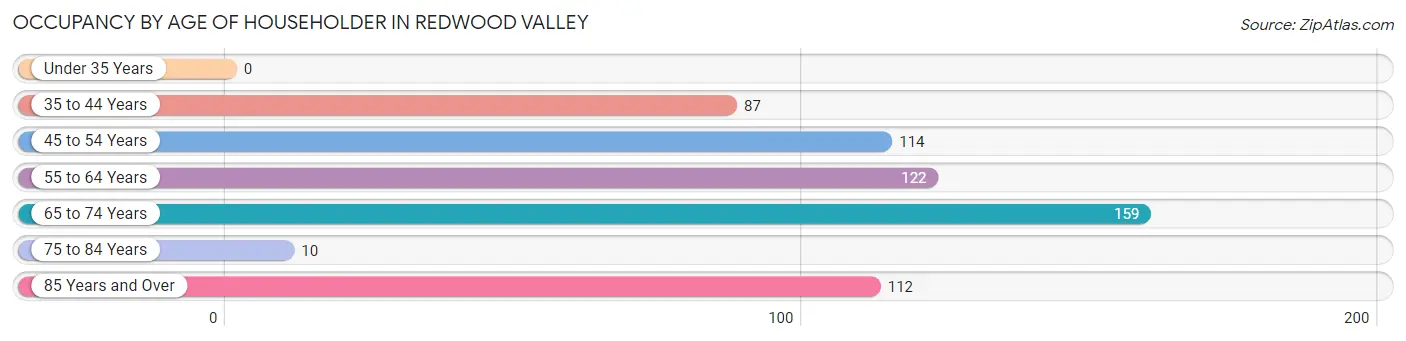
| Age Bracket | # Households | % Households |
| Under 35 Years | 0 | 0.0% |
| 35 to 44 Years | 87 | 14.4% |
| 45 to 54 Years | 114 | 18.9% |
| 55 to 64 Years | 122 | 20.2% |
| 65 to 74 Years | 159 | 26.3% |
| 75 to 84 Years | 10 | 1.7% |
| 85 Years and Over | 112 | 18.5% |
| Total | 604 | 100.0% |
Housing Finances in Redwood Valley
Median Income by Occupancy in Redwood Valley
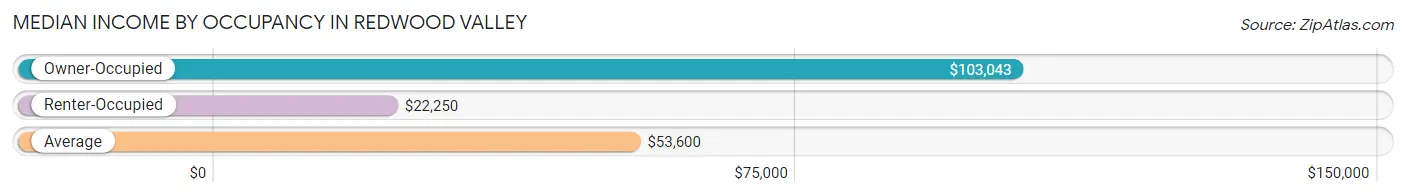
| Occupancy Type | # Households | Median Income |
| Owner-Occupied | 308 (51.0%) | $103,043 |
| Renter-Occupied | 296 (49.0%) | $22,250 |
| Average | 604 (100.0%) | $53,600 |
Occupancy by Householder Income Bracket in Redwood Valley
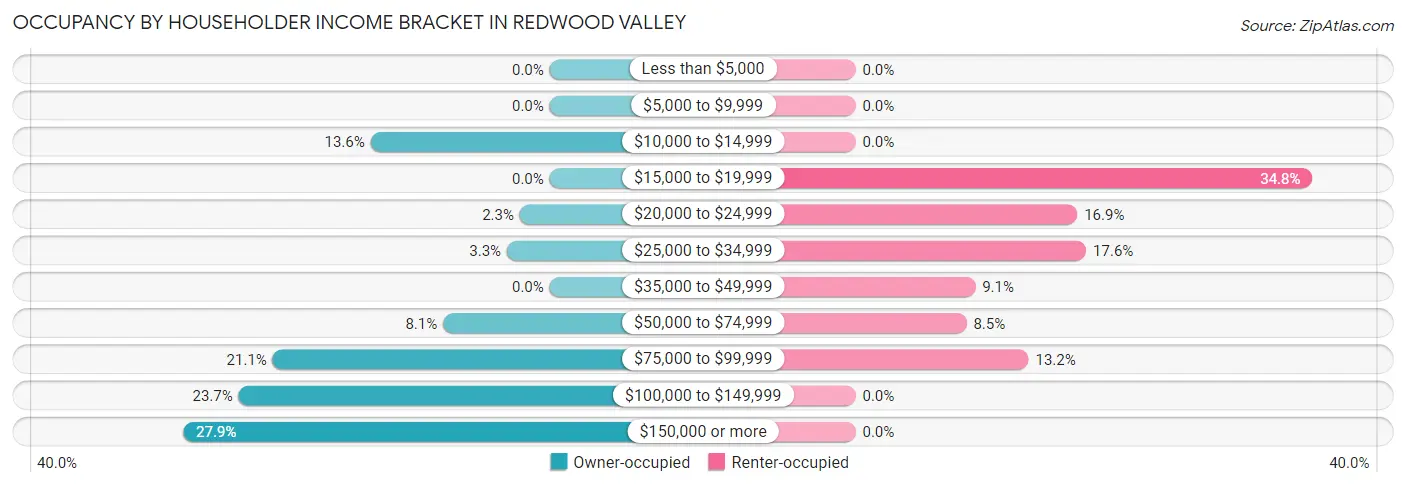
| Income Bracket | Owner-occupied | Renter-occupied |
| Less than $5,000 | 0 (0.0%) | 0 (0.0%) |
| $5,000 to $9,999 | 0 (0.0%) | 0 (0.0%) |
| $10,000 to $14,999 | 42 (13.6%) | 0 (0.0%) |
| $15,000 to $19,999 | 0 (0.0%) | 103 (34.8%) |
| $20,000 to $24,999 | 7 (2.3%) | 50 (16.9%) |
| $25,000 to $34,999 | 10 (3.3%) | 52 (17.6%) |
| $35,000 to $49,999 | 0 (0.0%) | 27 (9.1%) |
| $50,000 to $74,999 | 25 (8.1%) | 25 (8.5%) |
| $75,000 to $99,999 | 65 (21.1%) | 39 (13.2%) |
| $100,000 to $149,999 | 73 (23.7%) | 0 (0.0%) |
| $150,000 or more | 86 (27.9%) | 0 (0.0%) |
| Total | 308 (100.0%) | 296 (100.0%) |
Monthly Housing Cost Tiers in Redwood Valley
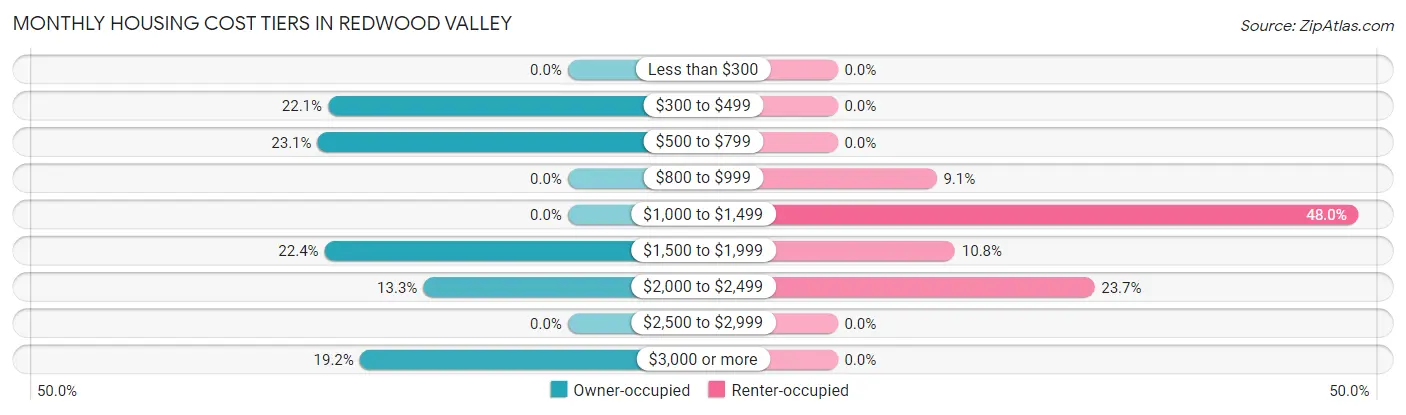
| Monthly Cost | Owner-occupied | Renter-occupied |
| Less than $300 | 0 (0.0%) | 0 (0.0%) |
| $300 to $499 | 68 (22.1%) | 0 (0.0%) |
| $500 to $799 | 71 (23.1%) | 0 (0.0%) |
| $800 to $999 | 0 (0.0%) | 27 (9.1%) |
| $1,000 to $1,499 | 0 (0.0%) | 142 (48.0%) |
| $1,500 to $1,999 | 69 (22.4%) | 32 (10.8%) |
| $2,000 to $2,499 | 41 (13.3%) | 70 (23.6%) |
| $2,500 to $2,999 | 0 (0.0%) | 0 (0.0%) |
| $3,000 or more | 59 (19.2%) | 0 (0.0%) |
| Total | 308 (100.0%) | 296 (100.0%) |
Physical Housing Characteristics in Redwood Valley
Housing Structures in Redwood Valley
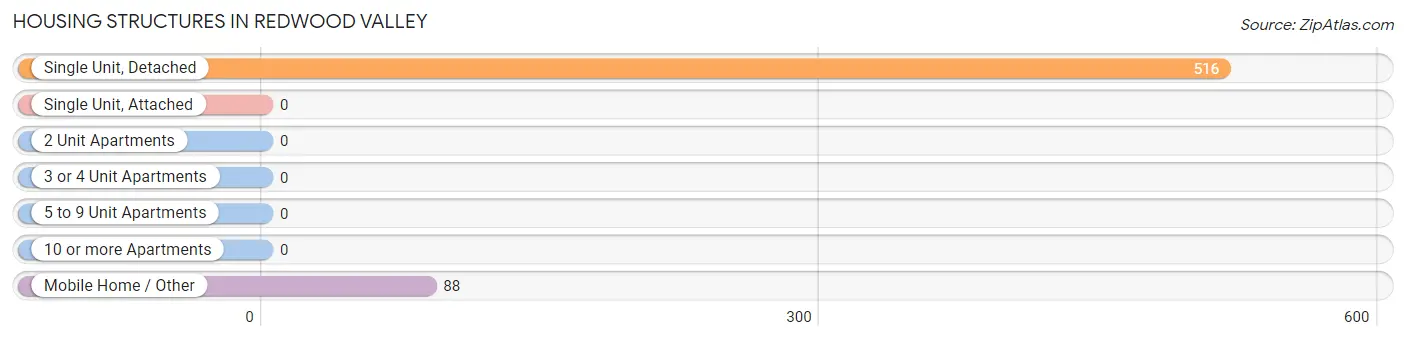
| Structure Type | # Housing Units | % Housing Units |
| Single Unit, Detached | 516 | 85.4% |
| Single Unit, Attached | 0 | 0.0% |
| 2 Unit Apartments | 0 | 0.0% |
| 3 or 4 Unit Apartments | 0 | 0.0% |
| 5 to 9 Unit Apartments | 0 | 0.0% |
| 10 or more Apartments | 0 | 0.0% |
| Mobile Home / Other | 88 | 14.6% |
| Total | 604 | 100.0% |
Housing Structures by Occupancy in Redwood Valley
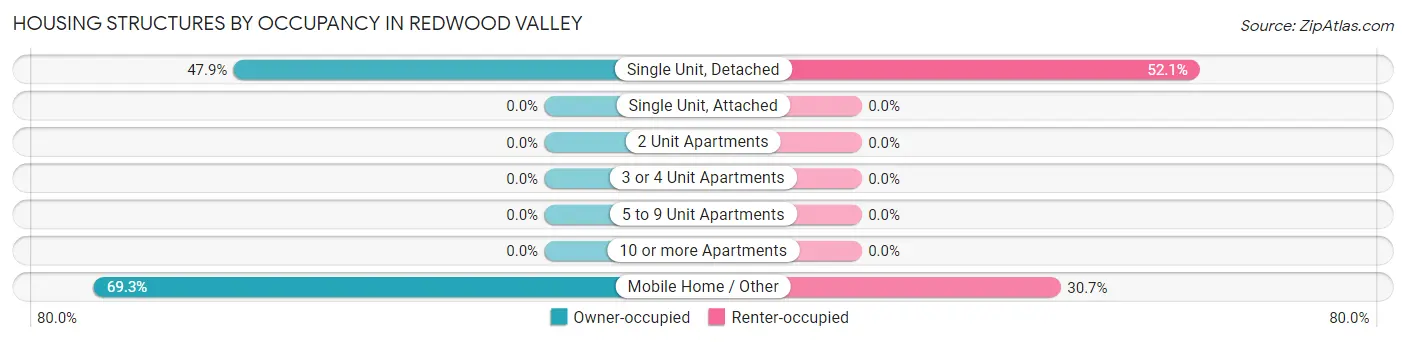
| Structure Type | Owner-occupied | Renter-occupied |
| Single Unit, Detached | 247 (47.9%) | 269 (52.1%) |
| Single Unit, Attached | 0 (0.0%) | 0 (0.0%) |
| 2 Unit Apartments | 0 (0.0%) | 0 (0.0%) |
| 3 or 4 Unit Apartments | 0 (0.0%) | 0 (0.0%) |
| 5 to 9 Unit Apartments | 0 (0.0%) | 0 (0.0%) |
| 10 or more Apartments | 0 (0.0%) | 0 (0.0%) |
| Mobile Home / Other | 61 (69.3%) | 27 (30.7%) |
| Total | 308 (51.0%) | 296 (49.0%) |
Housing Structures by Number of Rooms in Redwood Valley
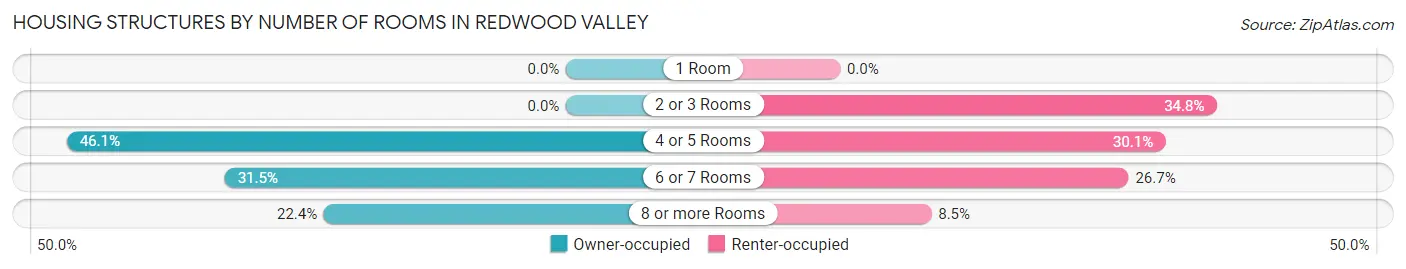
| Number of Rooms | Owner-occupied | Renter-occupied |
| 1 Room | 0 (0.0%) | 0 (0.0%) |
| 2 or 3 Rooms | 0 (0.0%) | 103 (34.8%) |
| 4 or 5 Rooms | 142 (46.1%) | 89 (30.1%) |
| 6 or 7 Rooms | 97 (31.5%) | 79 (26.7%) |
| 8 or more Rooms | 69 (22.4%) | 25 (8.5%) |
| Total | 308 (100.0%) | 296 (100.0%) |
Housing Structure by Heating Type in Redwood Valley
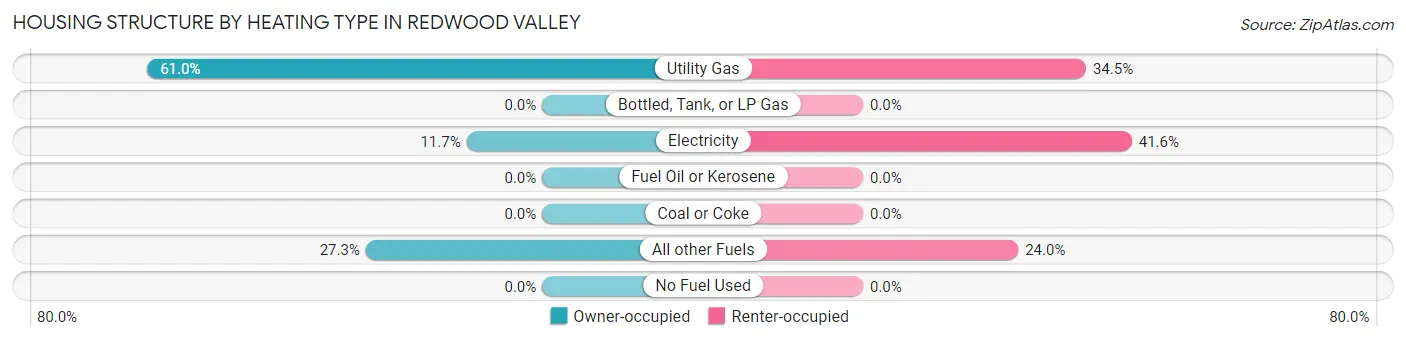
| Heating Type | Owner-occupied | Renter-occupied |
| Utility Gas | 188 (61.0%) | 102 (34.5%) |
| Bottled, Tank, or LP Gas | 0 (0.0%) | 0 (0.0%) |
| Electricity | 36 (11.7%) | 123 (41.5%) |
| Fuel Oil or Kerosene | 0 (0.0%) | 0 (0.0%) |
| Coal or Coke | 0 (0.0%) | 0 (0.0%) |
| All other Fuels | 84 (27.3%) | 71 (24.0%) |
| No Fuel Used | 0 (0.0%) | 0 (0.0%) |
| Total | 308 (100.0%) | 296 (100.0%) |
Household Vehicle Usage in Redwood Valley
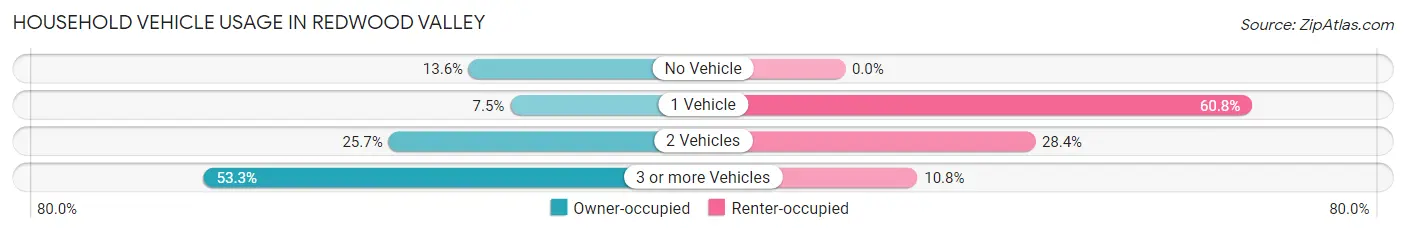
| Vehicles per Household | Owner-occupied | Renter-occupied |
| No Vehicle | 42 (13.6%) | 0 (0.0%) |
| 1 Vehicle | 23 (7.5%) | 180 (60.8%) |
| 2 Vehicles | 79 (25.7%) | 84 (28.4%) |
| 3 or more Vehicles | 164 (53.2%) | 32 (10.8%) |
| Total | 308 (100.0%) | 296 (100.0%) |
Real Estate & Mortgages in Redwood Valley
Real Estate and Mortgage Overview in Redwood Valley
| Characteristic | Without Mortgage | With Mortgage |
| Housing Units | 139 | 169 |
| Median Property Value | $540,700 | $563,500 |
| Median Household Income | $76,544 | $86 |
| Monthly Housing Costs | $507 | $59 |
| Real Estate Taxes | $3,638 | $0 |
Property Value by Mortgage Status in Redwood Valley
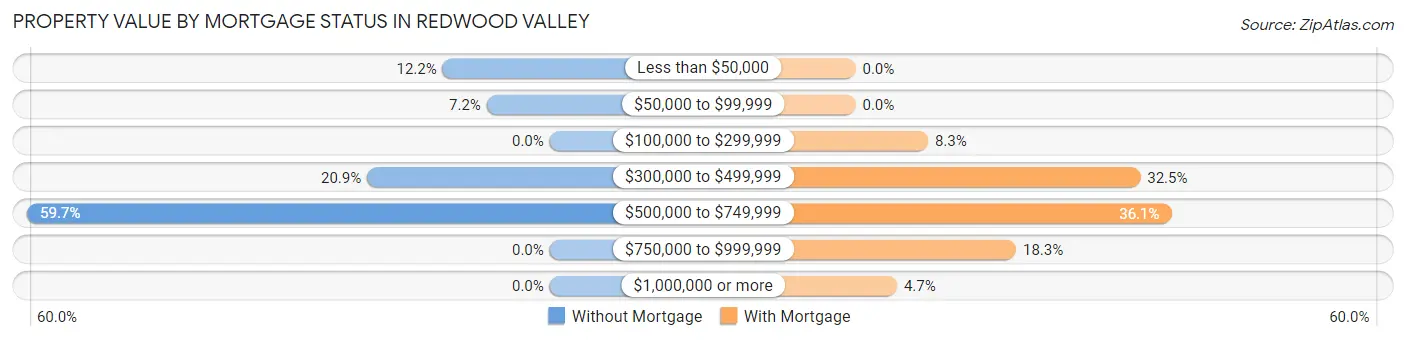
| Property Value | Without Mortgage | With Mortgage |
| Less than $50,000 | 17 (12.2%) | 0 (0.0%) |
| $50,000 to $99,999 | 10 (7.2%) | 0 (0.0%) |
| $100,000 to $299,999 | 0 (0.0%) | 14 (8.3%) |
| $300,000 to $499,999 | 29 (20.9%) | 55 (32.5%) |
| $500,000 to $749,999 | 83 (59.7%) | 61 (36.1%) |
| $750,000 to $999,999 | 0 (0.0%) | 31 (18.3%) |
| $1,000,000 or more | 0 (0.0%) | 8 (4.7%) |
| Total | 139 (100.0%) | 169 (100.0%) |
Household Income by Mortgage Status in Redwood Valley
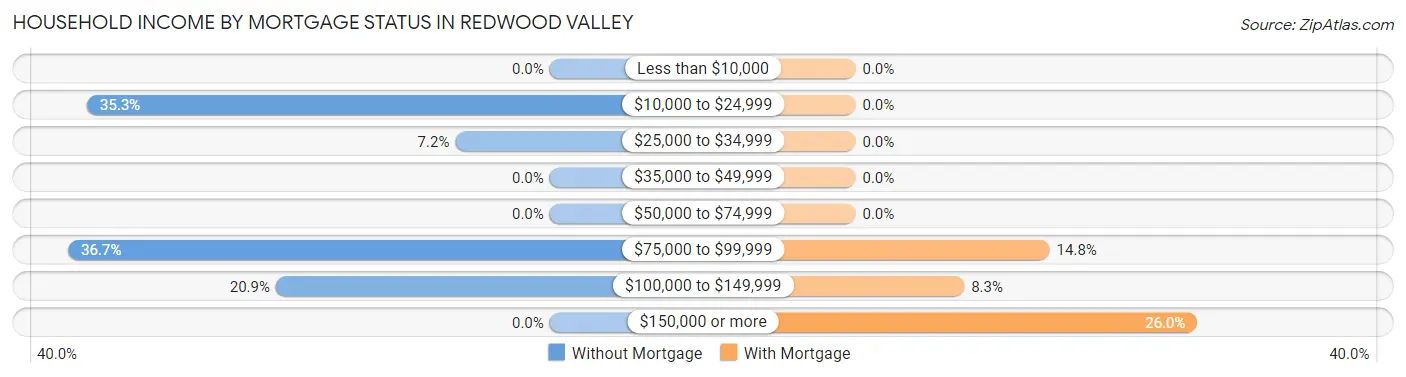
| Household Income | Without Mortgage | With Mortgage |
| Less than $10,000 | 0 (0.0%) | 0 (0.0%) |
| $10,000 to $24,999 | 49 (35.2%) | 0 (0.0%) |
| $25,000 to $34,999 | 10 (7.2%) | 0 (0.0%) |
| $35,000 to $49,999 | 0 (0.0%) | 0 (0.0%) |
| $50,000 to $74,999 | 0 (0.0%) | 0 (0.0%) |
| $75,000 to $99,999 | 51 (36.7%) | 25 (14.8%) |
| $100,000 to $149,999 | 29 (20.9%) | 14 (8.3%) |
| $150,000 or more | 0 (0.0%) | 44 (26.0%) |
| Total | 139 (100.0%) | 169 (100.0%) |
Property Value to Household Income Ratio in Redwood Valley
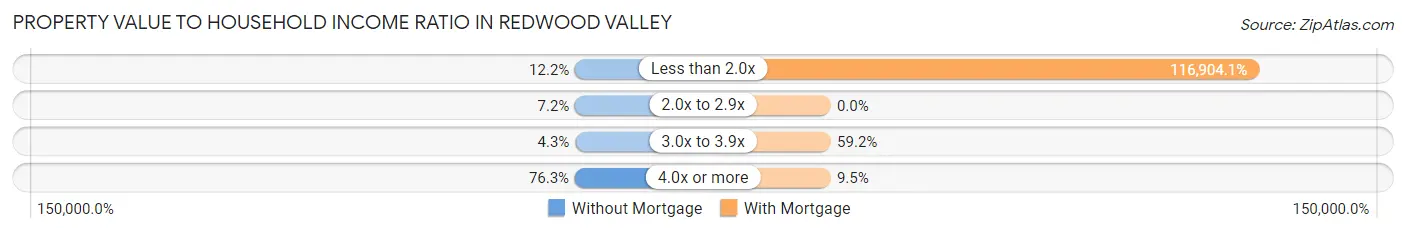
| Value-to-Income Ratio | Without Mortgage | With Mortgage |
| Less than 2.0x | 17 (12.2%) | 197,568 (116,904.1%) |
| 2.0x to 2.9x | 10 (7.2%) | 0 (0.0%) |
| 3.0x to 3.9x | 6 (4.3%) | 100 (59.2%) |
| 4.0x or more | 106 (76.3%) | 16 (9.5%) |
| Total | 139 (100.0%) | 169 (100.0%) |
Real Estate Taxes by Mortgage Status in Redwood Valley
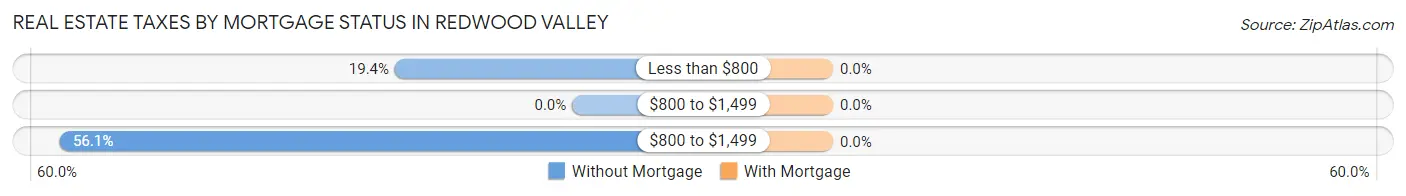
| Property Taxes | Without Mortgage | With Mortgage |
| Less than $800 | 27 (19.4%) | 0 (0.0%) |
| $800 to $1,499 | 0 (0.0%) | 0 (0.0%) |
| $800 to $1,499 | 78 (56.1%) | 0 (0.0%) |
| Total | 139 (100.0%) | 169 (100.0%) |
Health & Disability in Redwood Valley
Health Insurance Coverage by Age in Redwood Valley
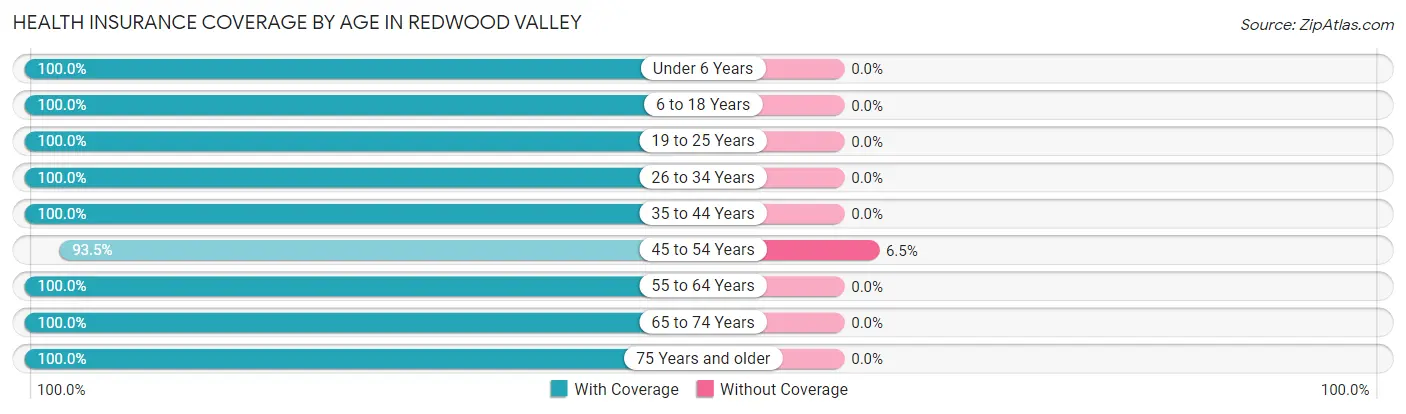
| Age Bracket | With Coverage | Without Coverage |
| Under 6 Years | 14 (100.0%) | 0 (0.0%) |
| 6 to 18 Years | 330 (100.0%) | 0 (0.0%) |
| 19 to 25 Years | 266 (100.0%) | 0 (0.0%) |
| 26 to 34 Years | 44 (100.0%) | 0 (0.0%) |
| 35 to 44 Years | 177 (100.0%) | 0 (0.0%) |
| 45 to 54 Years | 275 (93.5%) | 19 (6.5%) |
| 55 to 64 Years | 170 (100.0%) | 0 (0.0%) |
| 65 to 74 Years | 166 (100.0%) | 0 (0.0%) |
| 75 Years and older | 162 (100.0%) | 0 (0.0%) |
| Total | 1,604 (98.8%) | 19 (1.2%) |
Health Insurance Coverage by Citizenship Status in Redwood Valley
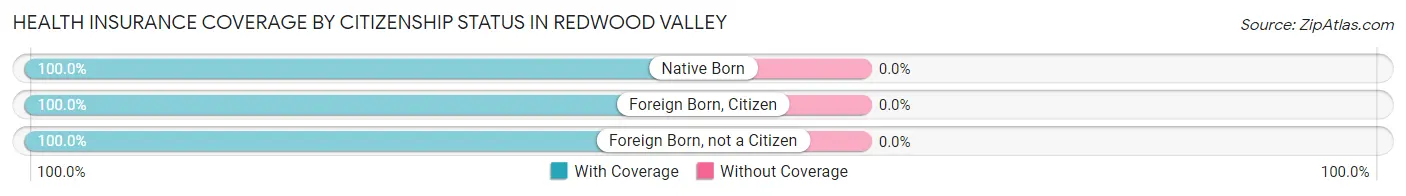
| Citizenship Status | With Coverage | Without Coverage |
| Native Born | 14 (100.0%) | 0 (0.0%) |
| Foreign Born, Citizen | 330 (100.0%) | 0 (0.0%) |
| Foreign Born, not a Citizen | 266 (100.0%) | 0 (0.0%) |
Health Insurance Coverage by Household Income in Redwood Valley
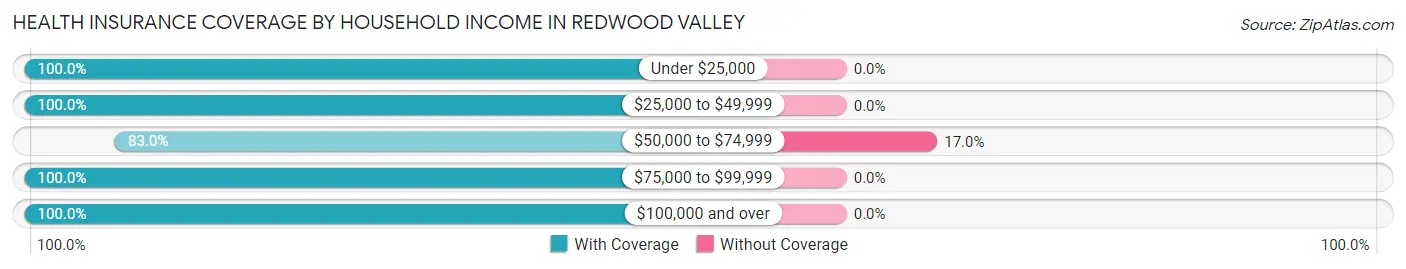
| Household Income | With Coverage | Without Coverage |
| Under $25,000 | 202 (100.0%) | 0 (0.0%) |
| $25,000 to $49,999 | 179 (100.0%) | 0 (0.0%) |
| $50,000 to $74,999 | 93 (83.0%) | 19 (17.0%) |
| $75,000 to $99,999 | 537 (100.0%) | 0 (0.0%) |
| $100,000 and over | 593 (100.0%) | 0 (0.0%) |
Public vs Private Health Insurance Coverage by Age in Redwood Valley
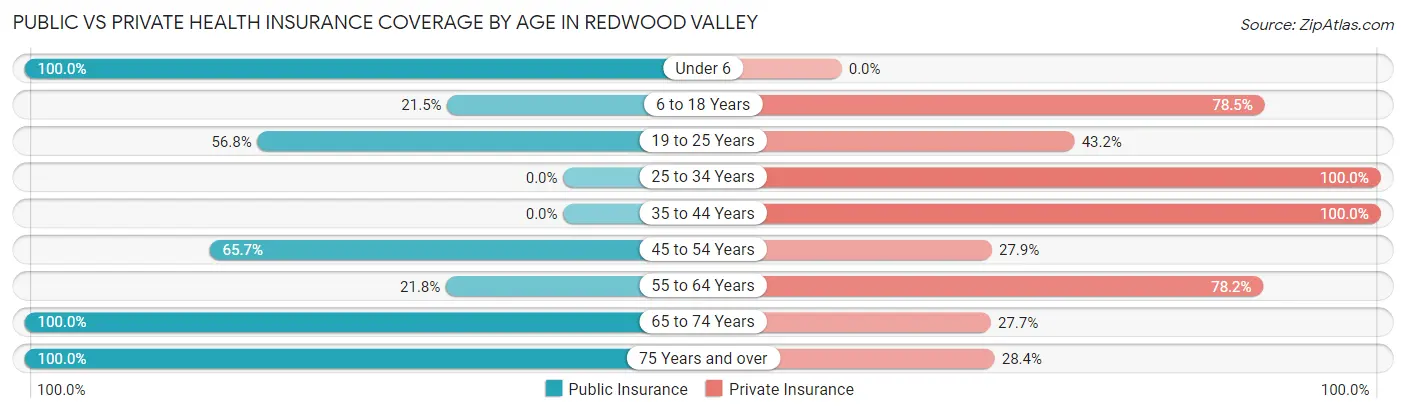
| Age Bracket | Public Insurance | Private Insurance |
| Under 6 | 14 (100.0%) | 0 (0.0%) |
| 6 to 18 Years | 71 (21.5%) | 259 (78.5%) |
| 19 to 25 Years | 151 (56.8%) | 115 (43.2%) |
| 25 to 34 Years | 0 (0.0%) | 44 (100.0%) |
| 35 to 44 Years | 0 (0.0%) | 177 (100.0%) |
| 45 to 54 Years | 193 (65.6%) | 82 (27.9%) |
| 55 to 64 Years | 37 (21.8%) | 133 (78.2%) |
| 65 to 74 Years | 166 (100.0%) | 46 (27.7%) |
| 75 Years and over | 162 (100.0%) | 46 (28.4%) |
| Total | 794 (48.9%) | 902 (55.6%) |
Disability Status by Sex by Age in Redwood Valley
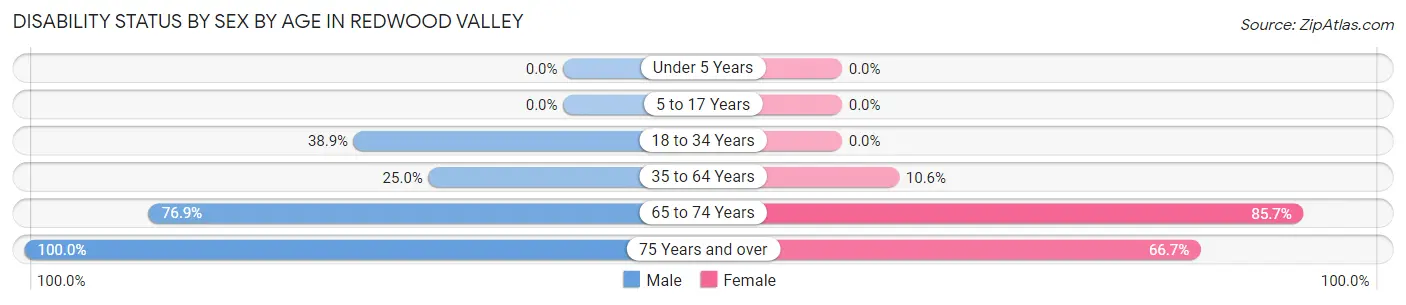
| Age Bracket | Male | Female |
| Under 5 Years | 0 (0.0%) | 0 (0.0%) |
| 5 to 17 Years | 0 (0.0%) | 0 (0.0%) |
| 18 to 34 Years | 96 (38.9%) | 0 (0.0%) |
| 35 to 64 Years | 80 (25.0%) | 34 (10.6%) |
| 65 to 74 Years | 20 (76.9%) | 120 (85.7%) |
| 75 Years and over | 24 (100.0%) | 92 (66.7%) |
Disability Class by Sex by Age in Redwood Valley
Disability Class: Hearing Difficulty
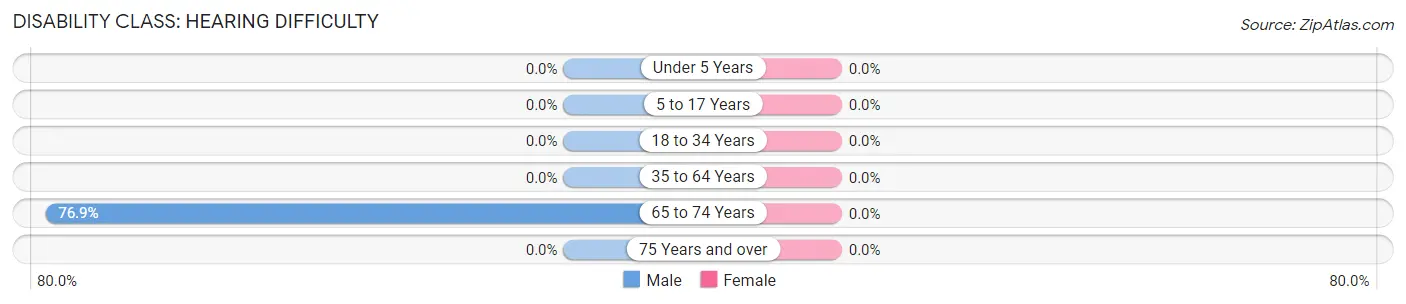
| Age Bracket | Male | Female |
| Under 5 Years | 0 (0.0%) | 0 (0.0%) |
| 5 to 17 Years | 0 (0.0%) | 0 (0.0%) |
| 18 to 34 Years | 0 (0.0%) | 0 (0.0%) |
| 35 to 64 Years | 0 (0.0%) | 0 (0.0%) |
| 65 to 74 Years | 20 (76.9%) | 0 (0.0%) |
| 75 Years and over | 0 (0.0%) | 0 (0.0%) |
Disability Class: Vision Difficulty
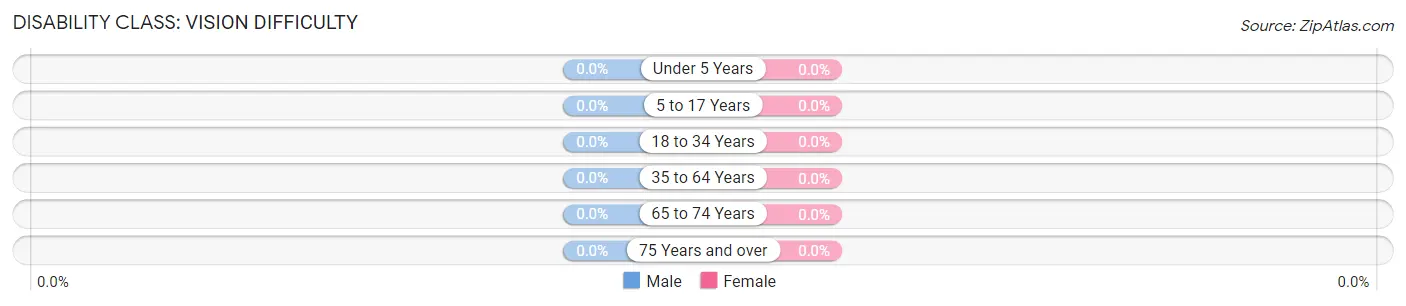
| Age Bracket | Male | Female |
| Under 5 Years | 0 (0.0%) | 0 (0.0%) |
| 5 to 17 Years | 0 (0.0%) | 0 (0.0%) |
| 18 to 34 Years | 0 (0.0%) | 0 (0.0%) |
| 35 to 64 Years | 0 (0.0%) | 0 (0.0%) |
| 65 to 74 Years | 0 (0.0%) | 0 (0.0%) |
| 75 Years and over | 0 (0.0%) | 0 (0.0%) |
Disability Class: Cognitive Difficulty
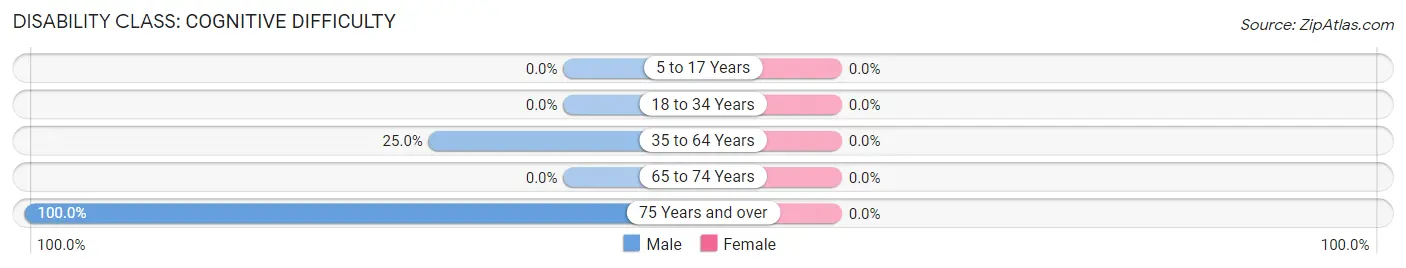
| Age Bracket | Male | Female |
| 5 to 17 Years | 0 (0.0%) | 0 (0.0%) |
| 18 to 34 Years | 0 (0.0%) | 0 (0.0%) |
| 35 to 64 Years | 80 (25.0%) | 0 (0.0%) |
| 65 to 74 Years | 0 (0.0%) | 0 (0.0%) |
| 75 Years and over | 24 (100.0%) | 0 (0.0%) |
Disability Class: Ambulatory Difficulty
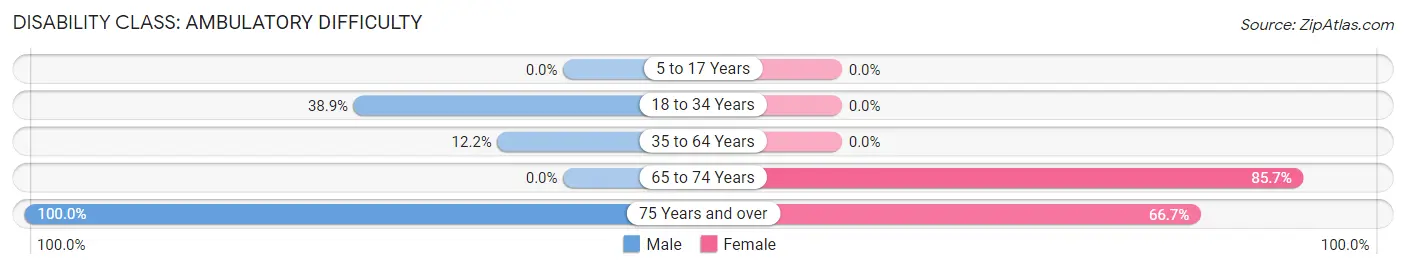
| Age Bracket | Male | Female |
| 5 to 17 Years | 0 (0.0%) | 0 (0.0%) |
| 18 to 34 Years | 96 (38.9%) | 0 (0.0%) |
| 35 to 64 Years | 39 (12.2%) | 0 (0.0%) |
| 65 to 74 Years | 0 (0.0%) | 120 (85.7%) |
| 75 Years and over | 24 (100.0%) | 92 (66.7%) |
Disability Class: Self-Care Difficulty
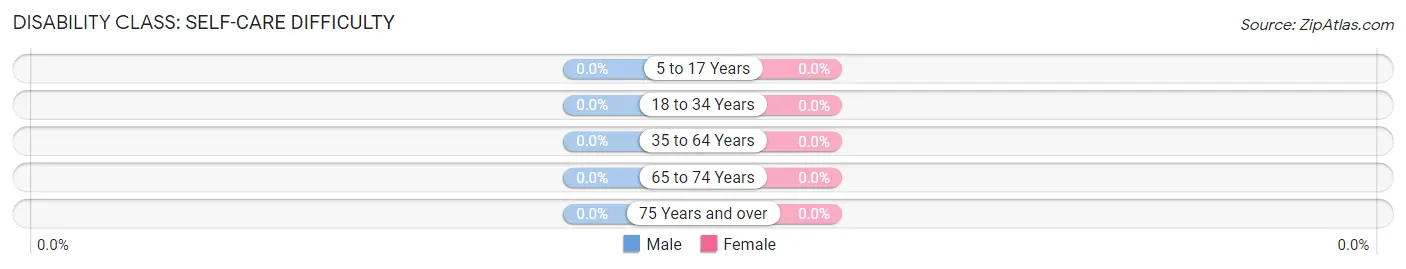
| Age Bracket | Male | Female |
| 5 to 17 Years | 0 (0.0%) | 0 (0.0%) |
| 18 to 34 Years | 0 (0.0%) | 0 (0.0%) |
| 35 to 64 Years | 0 (0.0%) | 0 (0.0%) |
| 65 to 74 Years | 0 (0.0%) | 0 (0.0%) |
| 75 Years and over | 0 (0.0%) | 0 (0.0%) |
Technology Access in Redwood Valley
Computing Device Access in Redwood Valley
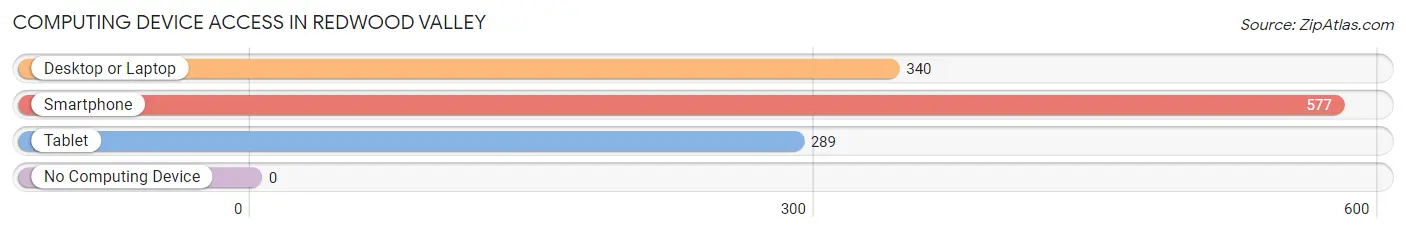
| Device Type | # Households | % Households |
| Desktop or Laptop | 340 | 56.3% |
| Smartphone | 577 | 95.5% |
| Tablet | 289 | 47.8% |
| No Computing Device | 0 | 0.0% |
| Total | 604 | 100.0% |
Internet Access in Redwood Valley
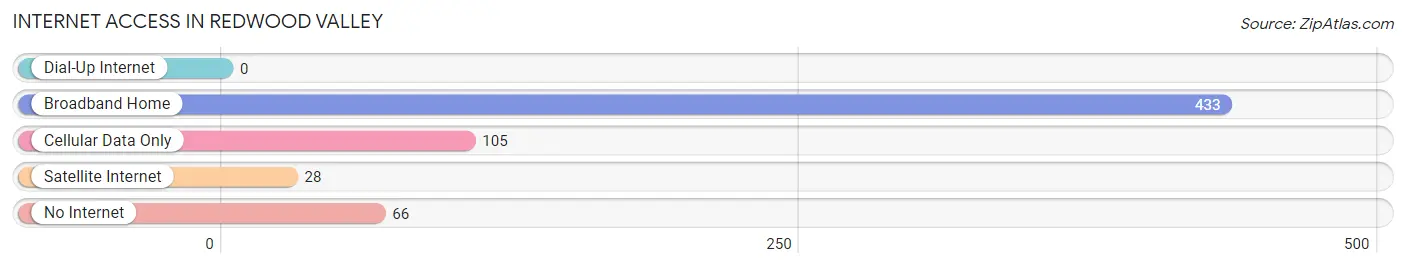
| Internet Type | # Households | % Households |
| Dial-Up Internet | 0 | 0.0% |
| Broadband Home | 433 | 71.7% |
| Cellular Data Only | 105 | 17.4% |
| Satellite Internet | 28 | 4.6% |
| No Internet | 66 | 10.9% |
| Total | 604 | 100.0% |
Redwood Valley Summary
Redwood Valley, California is a small unincorporated community located in Mendocino County, California. It is situated in the northern part of the county, about 10 miles east of Ukiah and about 20 miles west of Willits. The population of Redwood Valley was estimated to be 1,845 in 2019.
History
The area now known as Redwood Valley was originally inhabited by the Pomo people, who lived in the area for thousands of years before the arrival of European settlers. The first European settlers arrived in the area in the 1850s, and the town of Redwood Valley was officially established in 1858. The town was named after the redwood trees that grew in the area.
In the late 19th century, Redwood Valley was a thriving agricultural community, with many farms and ranches in the area. The town was also home to a number of businesses, including a general store, a blacksmith shop, and a hotel.
In the early 20th century, Redwood Valley began to experience a decline in population as many of the farms and ranches in the area were sold off or abandoned. The town also suffered from a lack of infrastructure, with no paved roads or electricity until the 1950s.
Geography
Redwood Valley is located in the northern part of Mendocino County, about 10 miles east of Ukiah and about 20 miles west of Willits. The town is situated in a valley surrounded by hills and mountains, with the Eel River running through the center of town. The area is known for its redwood forests, which are home to a variety of wildlife, including black bears, mountain lions, and deer.
The climate in Redwood Valley is mild, with temperatures ranging from the mid-50s to the mid-70s in the summer and the mid-30s to the mid-50s in the winter. The area receives an average of 35 inches of rain per year.
Economy
The economy of Redwood Valley is largely based on agriculture, with many of the farms and ranches in the area producing a variety of crops, including grapes, apples, and walnuts. The town is also home to a number of businesses, including restaurants, stores, and a winery.
Demographics
As of 2019, the population of Redwood Valley was estimated to be 1,845. The population is predominantly white (90.2%), with smaller percentages of Hispanic (4.2%), Asian (2.2%), and African American (1.2%) residents. The median household income in Redwood Valley is $50,945, and the median home value is $323,400. The town has a poverty rate of 11.2%.
Common Questions
What is Per Capita Income in Redwood Valley?
Per Capita income in Redwood Valley is $31,194.
What is the Median Family Income in Redwood Valley?
Median Family Income in Redwood Valley is $88,828.
What is the Median Household income in Redwood Valley?
Median Household Income in Redwood Valley is $53,600.
What is Income or Wage Gap in Redwood Valley?
Income or Wage Gap in Redwood Valley is 53.9%.
Women in Redwood Valley earn 46.1 cents for every dollar earned by a man.
What is Inequality or Gini Index in Redwood Valley?
Inequality or Gini Index in Redwood Valley is 0.48.
What is the Total Population of Redwood Valley?
Total Population of Redwood Valley is 1,623.
What is the Total Male Population of Redwood Valley?
Total Male Population of Redwood Valley is 790.
What is the Total Female Population of Redwood Valley?
Total Female Population of Redwood Valley is 833.
What is the Ratio of Males per 100 Females in Redwood Valley?
There are 94.84 Males per 100 Females in Redwood Valley.
What is the Ratio of Females per 100 Males in Redwood Valley?
There are 105.44 Females per 100 Males in Redwood Valley.
What is the Median Population Age in Redwood Valley?
Median Population Age in Redwood Valley is 43.4 Years.
What is the Average Family Size in Redwood Valley
Average Family Size in Redwood Valley is 4.1 People.
What is the Average Household Size in Redwood Valley
Average Household Size in Redwood Valley is 2.7 People.
How Large is the Labor Force in Redwood Valley?
There are 854 People in the Labor Forcein in Redwood Valley.
What is the Percentage of People in the Labor Force in Redwood Valley?
59.7% of People are in the Labor Force in Redwood Valley.
What is the Unemployment Rate in Redwood Valley?
Unemployment Rate in Redwood Valley is 2.2%.