Redway, CA Map & Demographics
Redway Map
Redway Overview
$28,323
PER CAPITA INCOME
$93,246
AVG FAMILY INCOME
$66,378
AVG HOUSEHOLD INCOME
0.32
INEQUALITY / GINI INDEX
1,257
TOTAL POPULATION
487
MALE POPULATION
770
FEMALE POPULATION
63.25
MALES / 100 FEMALES
158.11
FEMALES / 100 MALES
46.1
MEDIAN AGE
2.7
AVG FAMILY SIZE
2.1
AVG HOUSEHOLD SIZE
606
LABOR FORCE [ PEOPLE ]
60.4%
PERCENT IN LABOR FORCE
Redway Zip Codes
Redway Area Codes
Income in Redway
Income Overview in Redway
Per Capita Income in Redway is $28,323, while median incomes of families and households are $93,246 and $66,378 respectively.
| Characteristic | Number | Measure |
| Per Capita Income | 1,257 | $28,323 |
| Median Family Income | 278 | $93,246 |
| Mean Family Income | 278 | $75,361 |
| Median Household Income | 600 | $66,378 |
| Mean Household Income | 600 | $57,877 |
| Income Deficit | 278 | $0 |
| Wage / Income Gap (%) | 1,257 | 0.00% |
| Wage / Income Gap ($) | 1,257 | 100.00¢ per $1 |
| Gini / Inequality Index | 1,257 | 0.32 |
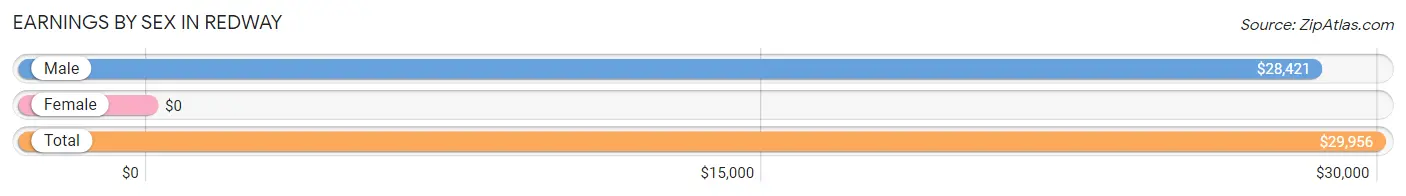
Earnings by Sex in Redway
| Sex | Number | Average Earnings |
| Male | 318 (52.5%) | $28,421 |
| Female | 288 (47.5%) | $0 |
| Total | 606 (100.0%) | $29,956 |
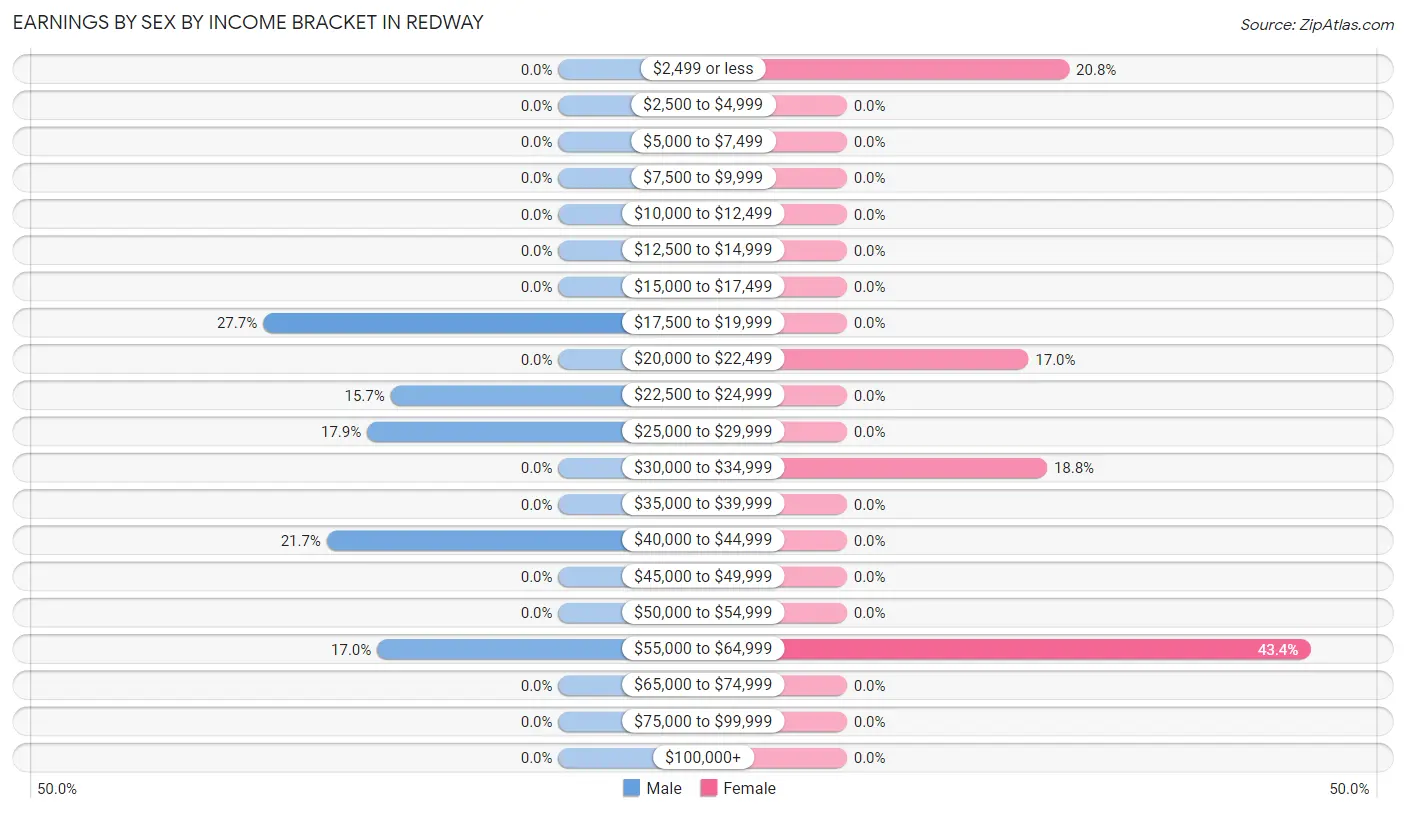
Earnings by Sex by Income Bracket in Redway
The most common earnings brackets in Redway are $17,500 to $19,999 for men (88 | 27.7%) and $55,000 to $64,999 for women (125 | 43.4%).
| Income | Male | Female |
| $2,499 or less | 0 (0.0%) | 60 (20.8%) |
| $2,500 to $4,999 | 0 (0.0%) | 0 (0.0%) |
| $5,000 to $7,499 | 0 (0.0%) | 0 (0.0%) |
| $7,500 to $9,999 | 0 (0.0%) | 0 (0.0%) |
| $10,000 to $12,499 | 0 (0.0%) | 0 (0.0%) |
| $12,500 to $14,999 | 0 (0.0%) | 0 (0.0%) |
| $15,000 to $17,499 | 0 (0.0%) | 0 (0.0%) |
| $17,500 to $19,999 | 88 (27.7%) | 0 (0.0%) |
| $20,000 to $22,499 | 0 (0.0%) | 49 (17.0%) |
| $22,500 to $24,999 | 50 (15.7%) | 0 (0.0%) |
| $25,000 to $29,999 | 57 (17.9%) | 0 (0.0%) |
| $30,000 to $34,999 | 0 (0.0%) | 54 (18.8%) |
| $35,000 to $39,999 | 0 (0.0%) | 0 (0.0%) |
| $40,000 to $44,999 | 69 (21.7%) | 0 (0.0%) |
| $45,000 to $49,999 | 0 (0.0%) | 0 (0.0%) |
| $50,000 to $54,999 | 0 (0.0%) | 0 (0.0%) |
| $55,000 to $64,999 | 54 (17.0%) | 125 (43.4%) |
| $65,000 to $74,999 | 0 (0.0%) | 0 (0.0%) |
| $75,000 to $99,999 | 0 (0.0%) | 0 (0.0%) |
| $100,000+ | 0 (0.0%) | 0 (0.0%) |
| Total | 318 (100.0%) | 288 (100.0%) |
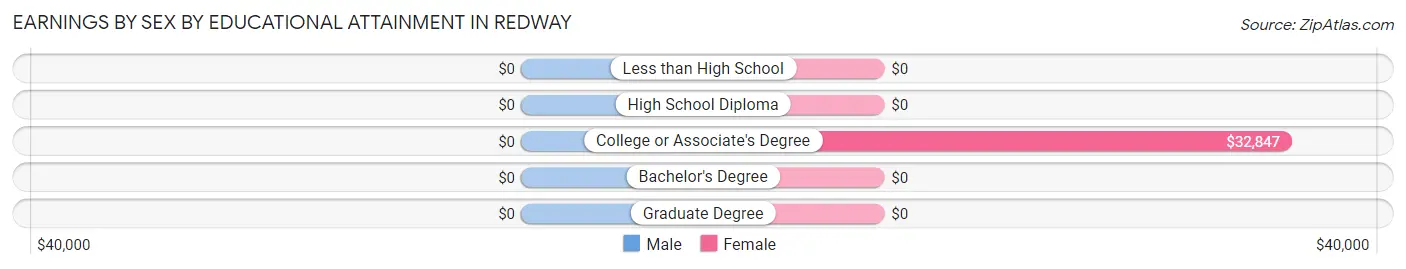
Earnings by Sex by Educational Attainment in Redway
| Educational Attainment | Male Income | Female Income |
| Less than High School | - | - |
| High School Diploma | - | - |
| College or Associate's Degree | - | - |
| Bachelor's Degree | - | - |
| Graduate Degree | - | - |
| Total | $42,790 | $0 |
Family Income in Redway
Family Income Brackets in Redway
According to the Redway family income data, there are 109 families falling into the $75,000 to $99,999 income range, which is the most common income bracket and makes up 39.2% of all families.
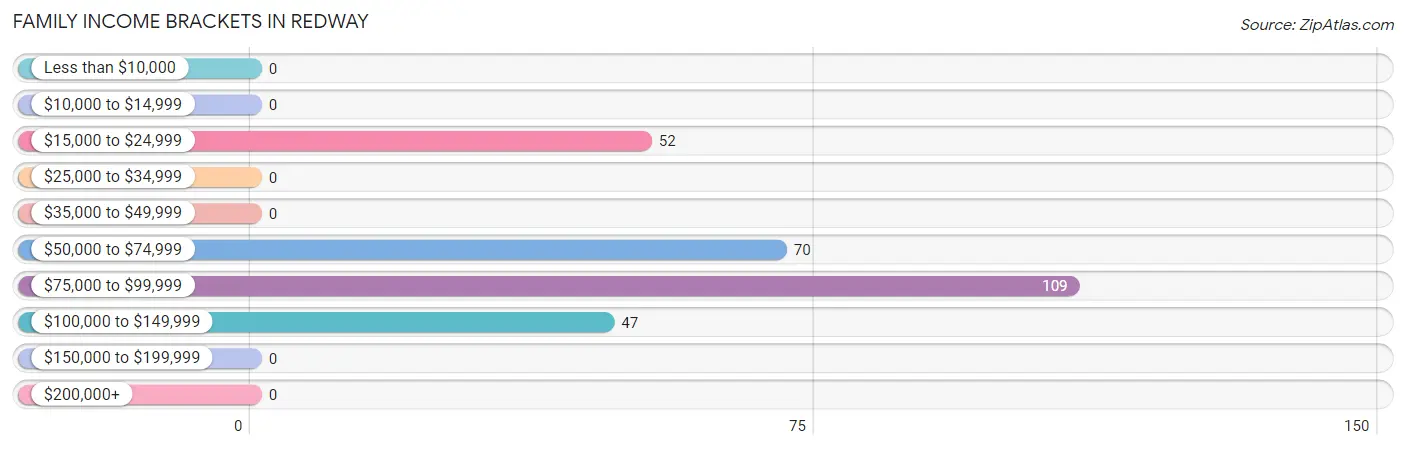
| Income Bracket | # Families | % Families |
| Less than $10,000 | 0 | 0.0% |
| $10,000 to $14,999 | 0 | 0.0% |
| $15,000 to $24,999 | 52 | 18.7% |
| $25,000 to $34,999 | 0 | 0.0% |
| $35,000 to $49,999 | 0 | 0.0% |
| $50,000 to $74,999 | 70 | 25.2% |
| $75,000 to $99,999 | 109 | 39.2% |
| $100,000 to $149,999 | 47 | 16.9% |
| $150,000 to $199,999 | 0 | 0.0% |
| $200,000+ | 0 | 0.0% |
Family Income by Famaliy Size in Redway
2-person families (226 | 81.3%) account for the highest median family income in Redway with $94,386 per family, while 2-person families (226 | 81.3%) have the highest median income of $47,193 per family member.
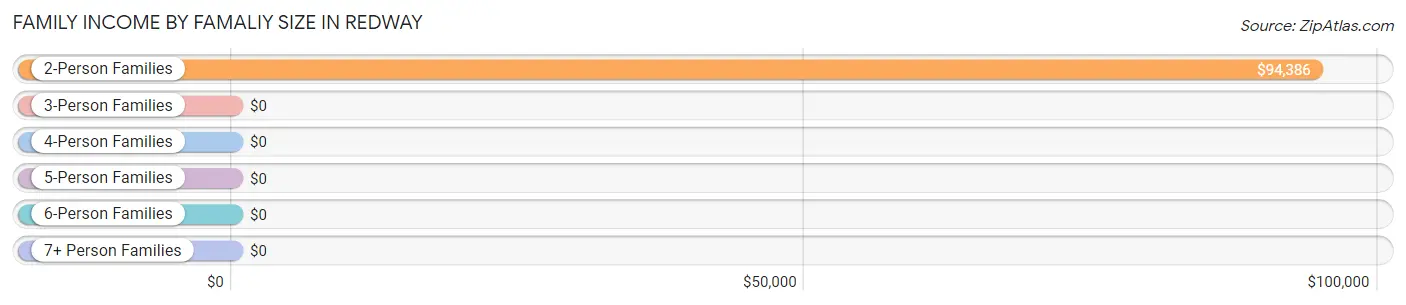
| Income Bracket | # Families | Median Income |
| 2-Person Families | 226 (81.3%) | $94,386 |
| 3-Person Families | 52 (18.7%) | $0 |
| 4-Person Families | 0 (0.0%) | $0 |
| 5-Person Families | 0 (0.0%) | $0 |
| 6-Person Families | 0 (0.0%) | $0 |
| 7+ Person Families | 0 (0.0%) | $0 |
| Total | 278 (100.0%) | $93,246 |
Family Income by Number of Earners in Redway
| Number of Earners | # Families | Median Income |
| No Earners | 99 (35.6%) | $0 |
| 1 Earner | 122 (43.9%) | $0 |
| 2 Earners | 57 (20.5%) | $0 |
| 3+ Earners | 0 (0.0%) | $0 |
| Total | 278 (100.0%) | $93,246 |
Household Income in Redway
Household Income Brackets in Redway
With 173 households falling in the category, the $50,000 to $74,999 income range is the most frequent in Redway, accounting for 28.8% of all households.
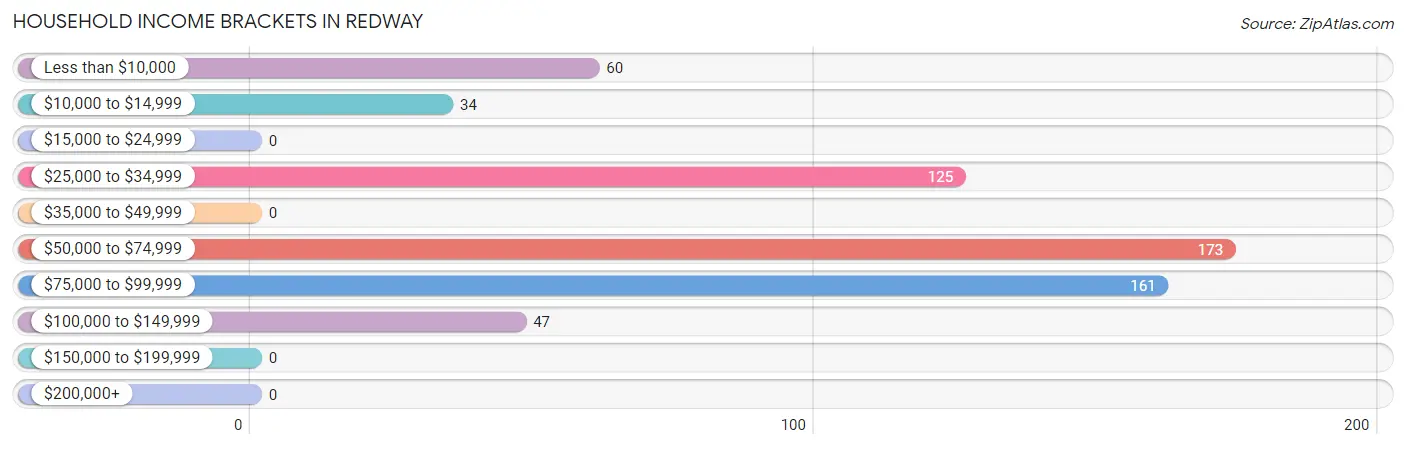
| Income Bracket | # Households | % Households |
| Less than $10,000 | 60 | 10.0% |
| $10,000 to $14,999 | 34 | 5.7% |
| $15,000 to $24,999 | 0 | 0.0% |
| $25,000 to $34,999 | 125 | 20.8% |
| $35,000 to $49,999 | 0 | 0.0% |
| $50,000 to $74,999 | 173 | 28.8% |
| $75,000 to $99,999 | 161 | 26.8% |
| $100,000 to $149,999 | 47 | 7.8% |
| $150,000 to $199,999 | 0 | 0.0% |
| $200,000+ | 0 | 0.0% |
Household Income by Householder Age in Redway
The median household income in Redway is $66,378, with the highest median household income of $68,714 found in the 25 to 44 years age bracket for the primary householder. A total of 176 households (29.3%) fall into this category.
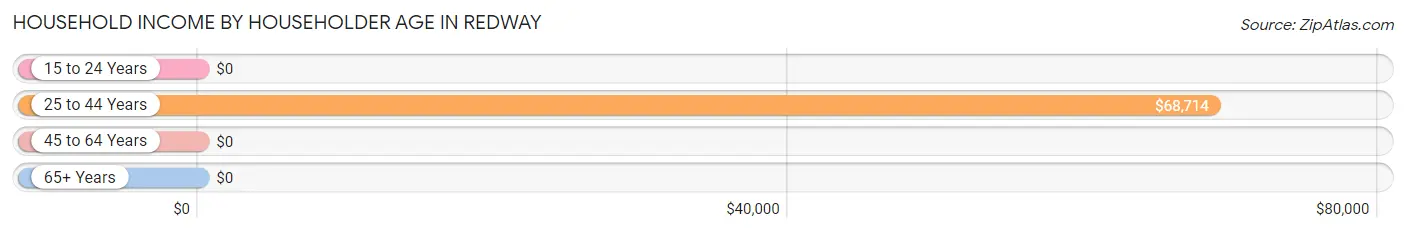
| Income Bracket | # Households | Median Income |
| 15 to 24 Years | 0 (0.0%) | $0 |
| 25 to 44 Years | 176 (29.3%) | $68,714 |
| 45 to 64 Years | 200 (33.3%) | $0 |
| 65+ Years | 224 (37.3%) | $0 |
| Total | 600 (100.0%) | $66,378 |
Poverty in Redway
Income Below Poverty by Sex and Age in Redway
With 34.7% poverty level for males and 14.5% for females among the residents of Redway, 6 to 11 year old males and 45 to 54 year old females are the most vulnerable to poverty, with 47 males (100.0%) and 60 females (100.0%) in their respective age groups living below the poverty level.
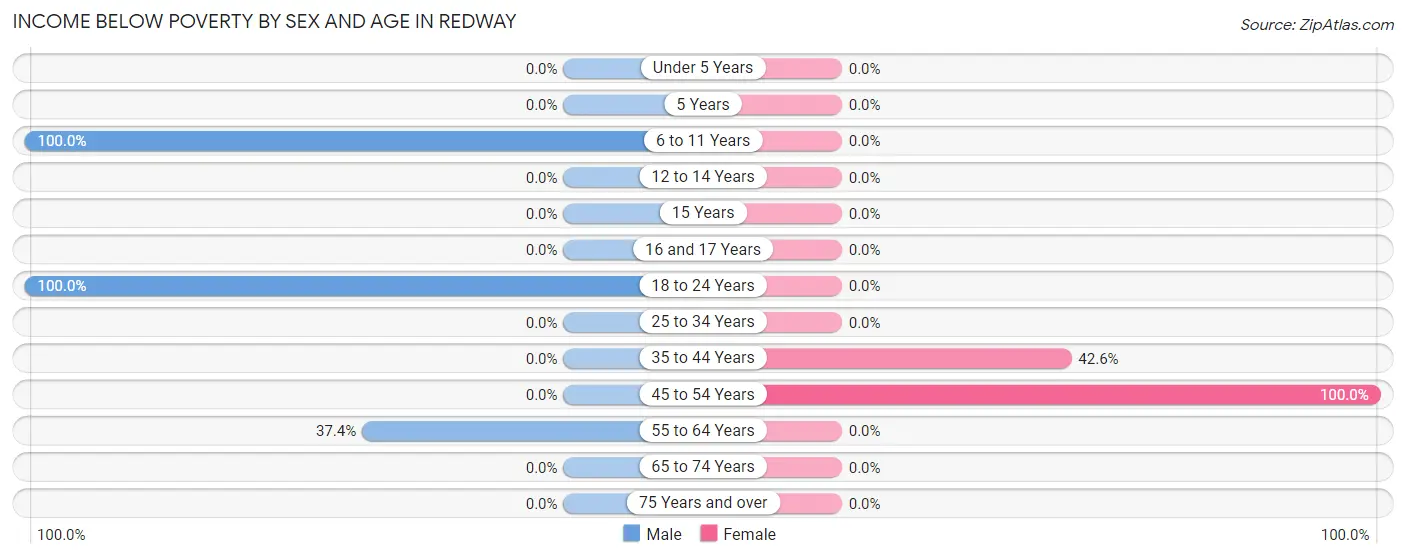
| Age Bracket | Male | Female |
| Under 5 Years | 0 (0.0%) | 0 (0.0%) |
| 5 Years | 0 (0.0%) | 0 (0.0%) |
| 6 to 11 Years | 47 (100.0%) | 0 (0.0%) |
| 12 to 14 Years | 0 (0.0%) | 0 (0.0%) |
| 15 Years | 0 (0.0%) | 0 (0.0%) |
| 16 and 17 Years | 0 (0.0%) | 0 (0.0%) |
| 18 to 24 Years | 88 (100.0%) | 0 (0.0%) |
| 25 to 34 Years | 0 (0.0%) | 0 (0.0%) |
| 35 to 44 Years | 0 (0.0%) | 52 (42.6%) |
| 45 to 54 Years | 0 (0.0%) | 60 (100.0%) |
| 55 to 64 Years | 34 (37.4%) | 0 (0.0%) |
| 65 to 74 Years | 0 (0.0%) | 0 (0.0%) |
| 75 Years and over | 0 (0.0%) | 0 (0.0%) |
| Total | 169 (34.7%) | 112 (14.5%) |
Income Above Poverty by Sex and Age in Redway
According to the poverty statistics in Redway, males aged 25 to 34 years and females aged 5 years are the age groups that are most secure financially, with 100.0% of males and 100.0% of females in these age groups living above the poverty line.
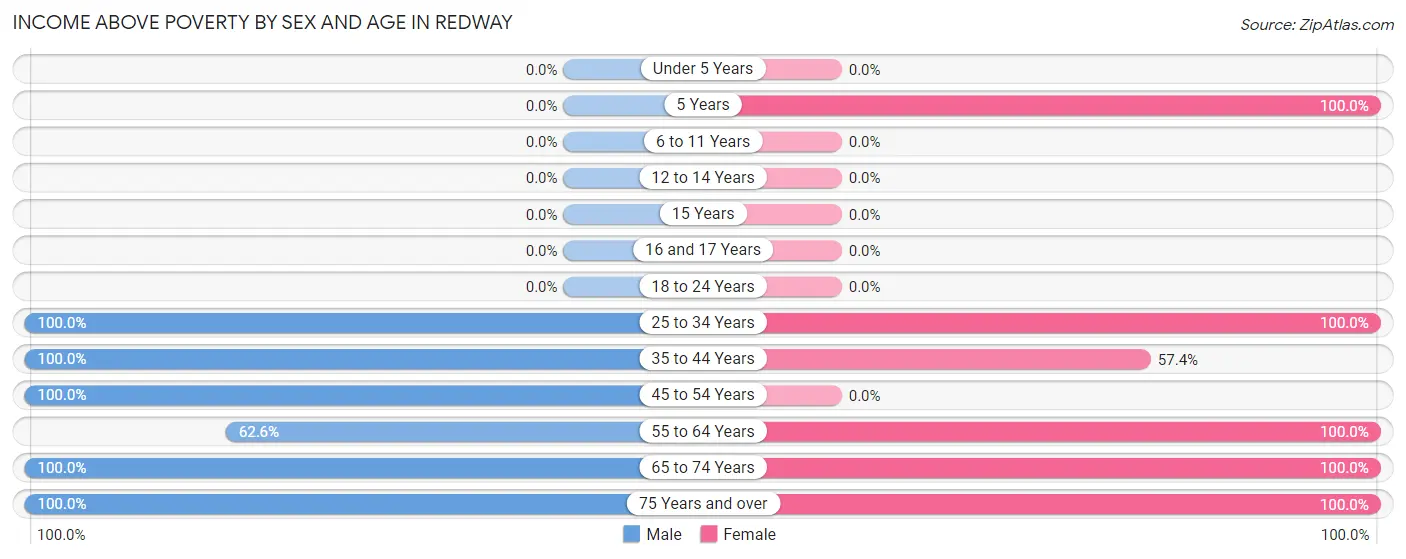
| Age Bracket | Male | Female |
| Under 5 Years | 0 (0.0%) | 0 (0.0%) |
| 5 Years | 0 (0.0%) | 206 (100.0%) |
| 6 to 11 Years | 0 (0.0%) | 0 (0.0%) |
| 12 to 14 Years | 0 (0.0%) | 0 (0.0%) |
| 15 Years | 0 (0.0%) | 0 (0.0%) |
| 16 and 17 Years | 0 (0.0%) | 0 (0.0%) |
| 18 to 24 Years | 0 (0.0%) | 0 (0.0%) |
| 25 to 34 Years | 50 (100.0%) | 54 (100.0%) |
| 35 to 44 Years | 54 (100.0%) | 70 (57.4%) |
| 45 to 54 Years | 69 (100.0%) | 0 (0.0%) |
| 55 to 64 Years | 57 (62.6%) | 104 (100.0%) |
| 65 to 74 Years | 49 (100.0%) | 177 (100.0%) |
| 75 Years and over | 39 (100.0%) | 47 (100.0%) |
| Total | 318 (65.3%) | 658 (85.5%) |
Income Below Poverty Among Married-Couple Families in Redway
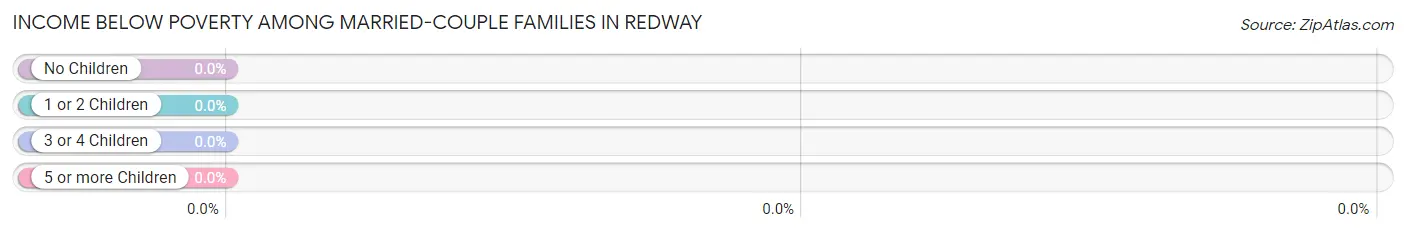
| Children | Above Poverty | Below Poverty |
| No Children | 156 (100.0%) | 0 (0.0%) |
| 1 or 2 Children | 0 (0.0%) | 0 (0.0%) |
| 3 or 4 Children | 0 (0.0%) | 0 (0.0%) |
| 5 or more Children | 0 (0.0%) | 0 (0.0%) |
| Total | 156 (100.0%) | 0 (0.0%) |
Income Below Poverty Among Single-Parent Households in Redway
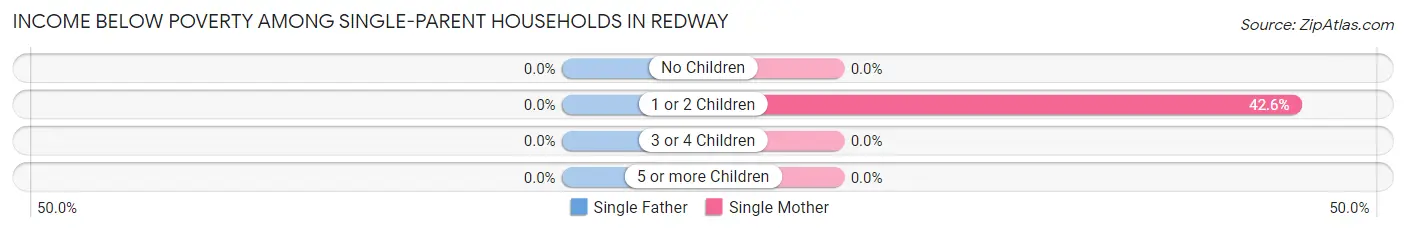
| Children | Single Father | Single Mother |
| No Children | 0 (0.0%) | 0 (0.0%) |
| 1 or 2 Children | 0 (0.0%) | 52 (42.6%) |
| 3 or 4 Children | 0 (0.0%) | 0 (0.0%) |
| 5 or more Children | 0 (0.0%) | 0 (0.0%) |
| Total | 0 (0.0%) | 52 (42.6%) |
Income Below Poverty Among Married-Couple vs Single-Parent Households in Redway
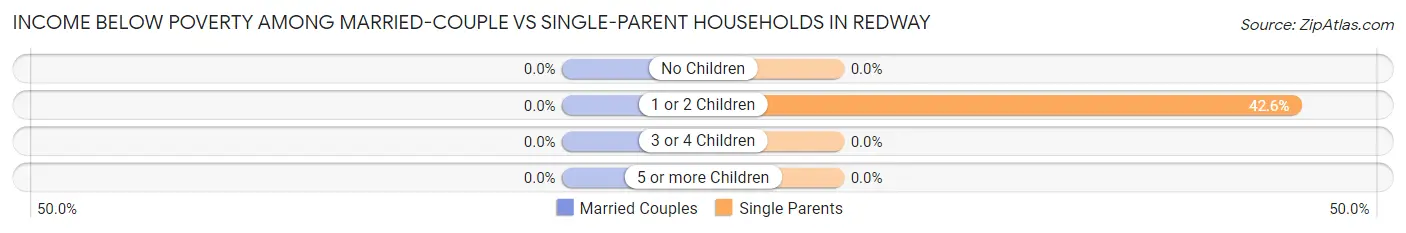
| Children | Married-Couple Families | Single-Parent Households |
| No Children | 0 (0.0%) | 0 (0.0%) |
| 1 or 2 Children | 0 (0.0%) | 52 (42.6%) |
| 3 or 4 Children | 0 (0.0%) | 0 (0.0%) |
| 5 or more Children | 0 (0.0%) | 0 (0.0%) |
| Total | 0 (0.0%) | 52 (42.6%) |
Race in Redway
The most populous races in Redway are , and White / Caucasian (1,257 | 100.0%).
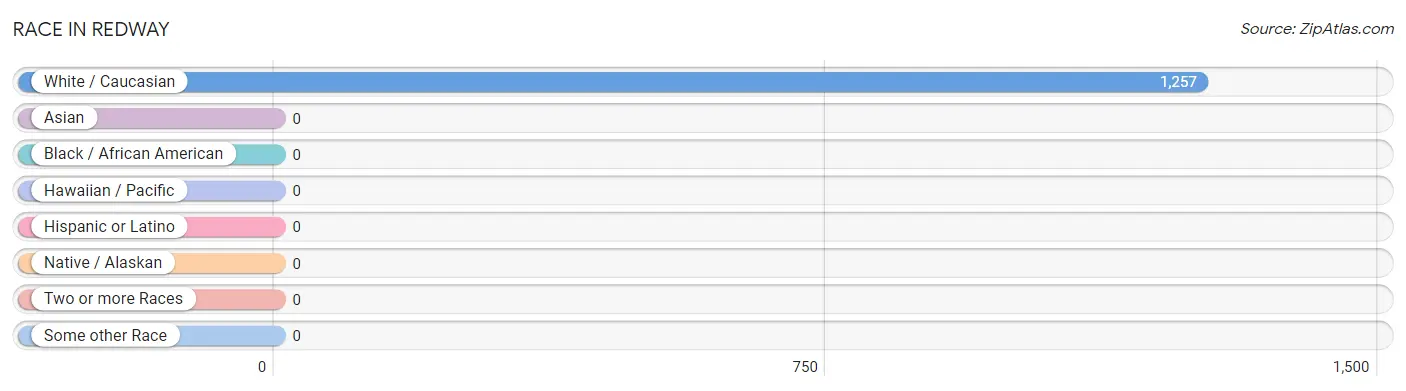
| Race | # Population | % Population |
| Asian | 0 | 0.0% |
| Black / African American | 0 | 0.0% |
| Hawaiian / Pacific | 0 | 0.0% |
| Hispanic or Latino | 0 | 0.0% |
| Native / Alaskan | 0 | 0.0% |
| White / Caucasian | 1,257 | 100.0% |
| Two or more Races | 0 | 0.0% |
| Some other Race | 0 | 0.0% |
| Total | 1,257 | 100.0% |
Ancestry in Redway
The most populous ancestries reported in Redway are European (276 | 22.0%), German (185 | 14.7%), Scottish (185 | 14.7%), Irish (161 | 12.8%), and Italian (111 | 8.8%), together accounting for 73.0% of all Redway residents.
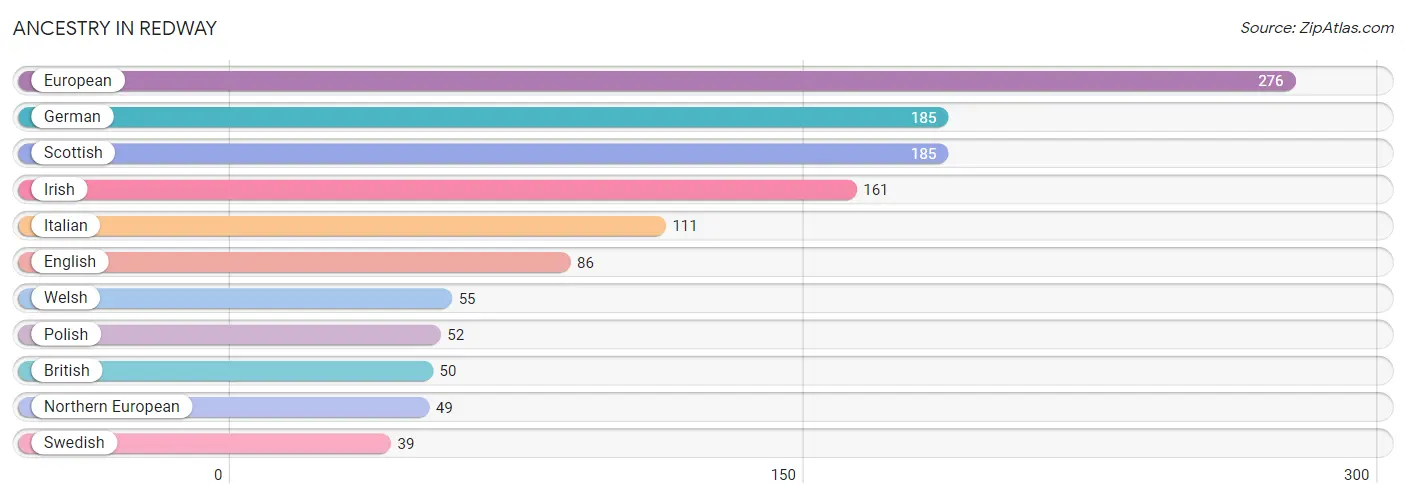
| Ancestry | # Population | % Population |
| British | 50 | 4.0% |
| English | 86 | 6.8% |
| European | 276 | 22.0% |
| German | 185 | 14.7% |
| Irish | 161 | 12.8% |
| Italian | 111 | 8.8% |
| Northern European | 49 | 3.9% |
| Polish | 52 | 4.1% |
| Scottish | 185 | 14.7% |
| Swedish | 39 | 3.1% |
| Welsh | 55 | 4.4% | View All 11 Rows |
Immigrants in Redway

| Immigration Origin | # Population | % Population | View All 0 Rows |
Sex and Age in Redway
Sex and Age in Redway
The most populous age groups in Redway are 60 to 64 Years (91 | 18.7%) for men and 5 to 9 Years (206 | 26.8%) for women.
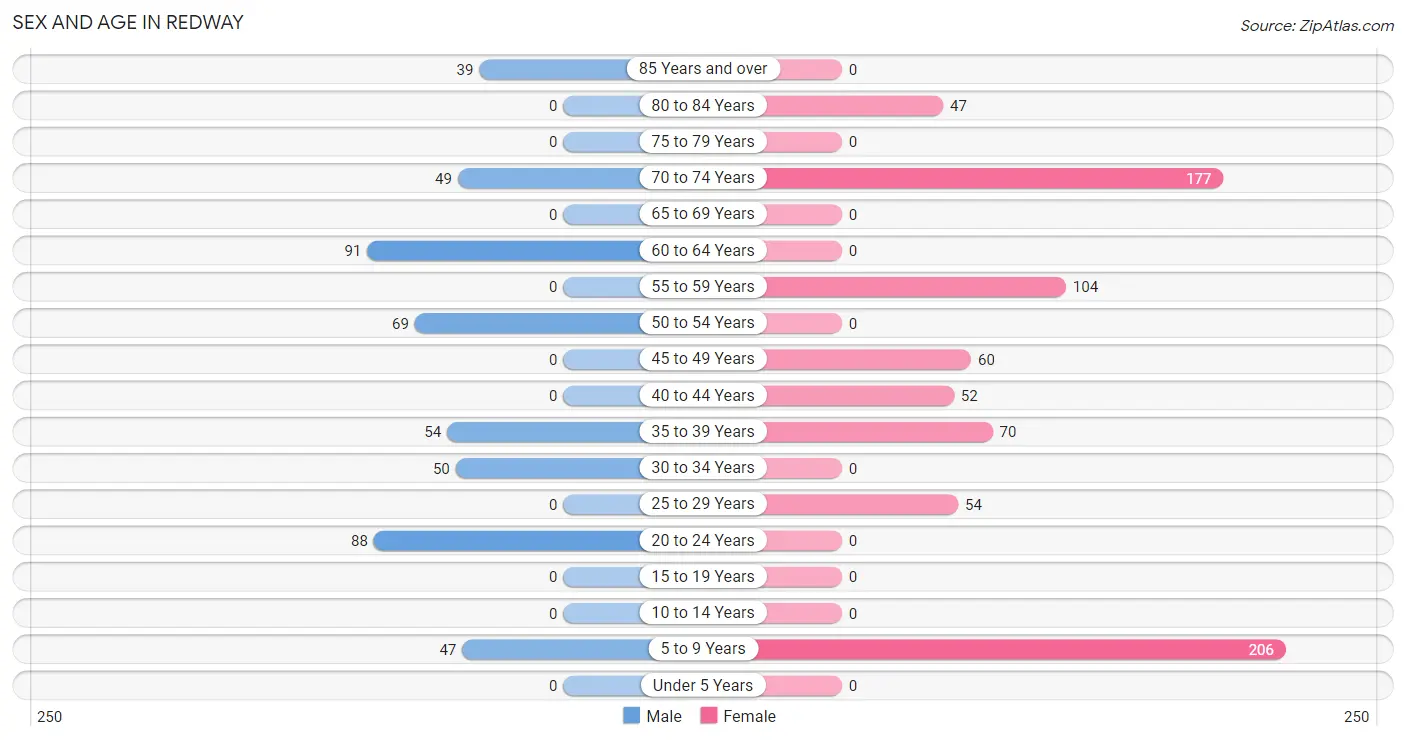
| Age Bracket | Male | Female |
| Under 5 Years | 0 (0.0%) | 0 (0.0%) |
| 5 to 9 Years | 47 (9.7%) | 206 (26.8%) |
| 10 to 14 Years | 0 (0.0%) | 0 (0.0%) |
| 15 to 19 Years | 0 (0.0%) | 0 (0.0%) |
| 20 to 24 Years | 88 (18.1%) | 0 (0.0%) |
| 25 to 29 Years | 0 (0.0%) | 54 (7.0%) |
| 30 to 34 Years | 50 (10.3%) | 0 (0.0%) |
| 35 to 39 Years | 54 (11.1%) | 70 (9.1%) |
| 40 to 44 Years | 0 (0.0%) | 52 (6.8%) |
| 45 to 49 Years | 0 (0.0%) | 60 (7.8%) |
| 50 to 54 Years | 69 (14.2%) | 0 (0.0%) |
| 55 to 59 Years | 0 (0.0%) | 104 (13.5%) |
| 60 to 64 Years | 91 (18.7%) | 0 (0.0%) |
| 65 to 69 Years | 0 (0.0%) | 0 (0.0%) |
| 70 to 74 Years | 49 (10.1%) | 177 (23.0%) |
| 75 to 79 Years | 0 (0.0%) | 0 (0.0%) |
| 80 to 84 Years | 0 (0.0%) | 47 (6.1%) |
| 85 Years and over | 39 (8.0%) | 0 (0.0%) |
| Total | 487 (100.0%) | 770 (100.0%) |
Families and Households in Redway
Median Family Size in Redway
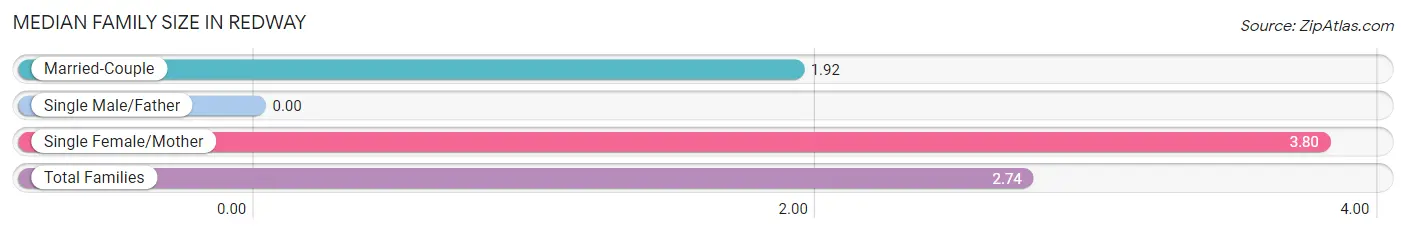
| Family Type | # Families | Family Size |
| Married-Couple | 156 (56.1%) | 1.92 |
| Single Male/Father | 0 (0.0%) | - |
| Single Female/Mother | 122 (43.9%) | 3.80 |
| Total Families | 278 (100.0%) | 2.74 |
Median Household Size in Redway
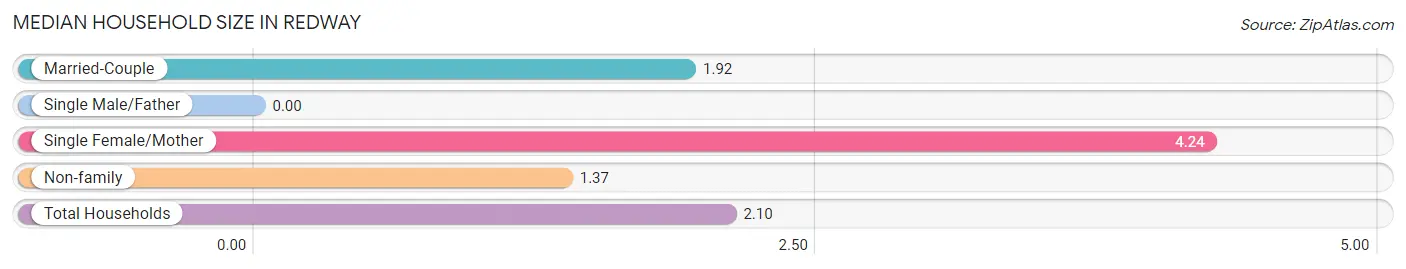
| Household Type | # Households | Household Size |
| Married-Couple | 156 (26.0%) | 1.92 |
| Single Male/Father | 0 (0.0%) | - |
| Single Female/Mother | 122 (20.3%) | 4.24 |
| Non-family | 322 (53.7%) | 1.37 |
| Total Households | 600 (100.0%) | 2.10 |
Household Size by Marriage Status in Redway
Out of a total of 600 households in Redway, 278 (46.3%) are family households, while 322 (53.7%) are nonfamily households. The most numerous type of family households are 2-person households, comprising 226, and the most common type of nonfamily households are 1-person households, comprising 219.
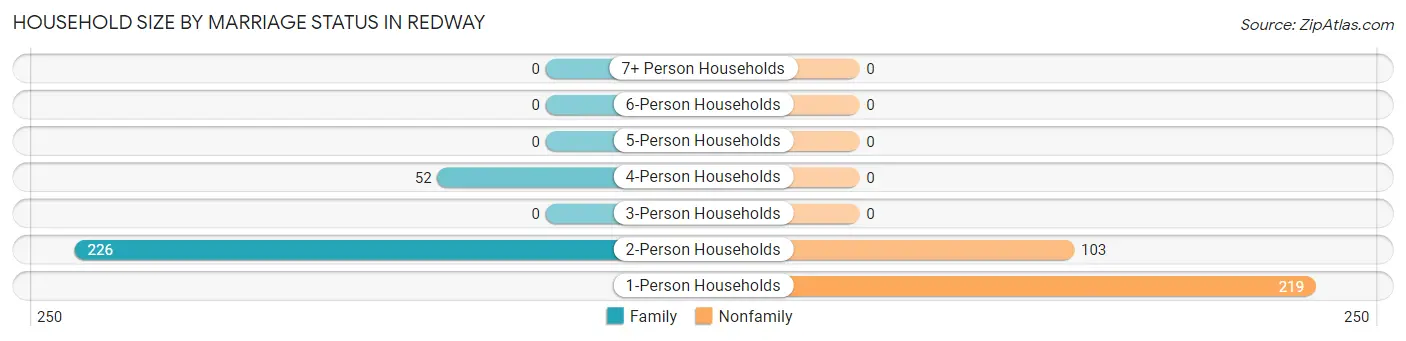
| Household Size | Family Households | Nonfamily Households |
| 1-Person Households | - | 219 (36.5%) |
| 2-Person Households | 226 (37.7%) | 103 (17.2%) |
| 3-Person Households | 0 (0.0%) | 0 (0.0%) |
| 4-Person Households | 52 (8.7%) | 0 (0.0%) |
| 5-Person Households | 0 (0.0%) | 0 (0.0%) |
| 6-Person Households | 0 (0.0%) | 0 (0.0%) |
| 7+ Person Households | 0 (0.0%) | 0 (0.0%) |
| Total | 278 (46.3%) | 322 (53.7%) |
Female Fertility in Redway
Fertility by Age in Redway
| Age Bracket | Women with Births | Births / 1,000 Women |
| 15 to 19 years | 0 (0.0%) | 0.0 |
| 20 to 34 years | 0 (0.0%) | 0.0 |
| 35 to 50 years | 0 (0.0%) | 0.0 |
| Total | 0 (0.0%) | 0.0 |
Fertility by Age by Marriage Status in Redway
| Age Bracket | Married | Unmarried |
| 15 to 19 years | 0 (0.0%) | 0 (0.0%) |
| 20 to 34 years | 0 (0.0%) | 0 (0.0%) |
| 35 to 50 years | 0 (0.0%) | 0 (0.0%) |
| Total | 0 (0.0%) | 0 (0.0%) |
Fertility by Education in Redway
| Educational Attainment | Women with Births | Births / 1,000 Women |
| Less than High School | 0 (0.0%) | 0.0 |
| High School Diploma | 0 (0.0%) | 0.0 |
| College or Associate's Degree | 0 (0.0%) | 0.0 |
| Bachelor's Degree | 0 (0.0%) | 0.0 |
| Graduate Degree | 0 (0.0%) | 0.0 |
| Total | 0 (0.0%) | 0.0 |
Fertility by Education by Marriage Status in Redway
| Educational Attainment | Married | Unmarried |
| Less than High School | 0 (0.0%) | 0 (0.0%) |
| High School Diploma | 0 (0.0%) | 0 (0.0%) |
| College or Associate's Degree | 0 (0.0%) | 0 (0.0%) |
| Bachelor's Degree | 0 (0.0%) | 0 (0.0%) |
| Graduate Degree | 0 (0.0%) | 0 (0.0%) |
| Total | 0 (0.0%) | 0 (0.0%) |
Employment Characteristics in Redway
Employment by Class of Employer in Redway
Among the 606 employed individuals in Redway, private company employees (352 | 58.1%), self-employed (not incorporated) (130 | 21.4%), and state government employees (69 | 11.4%) make up the most common classes of employment.
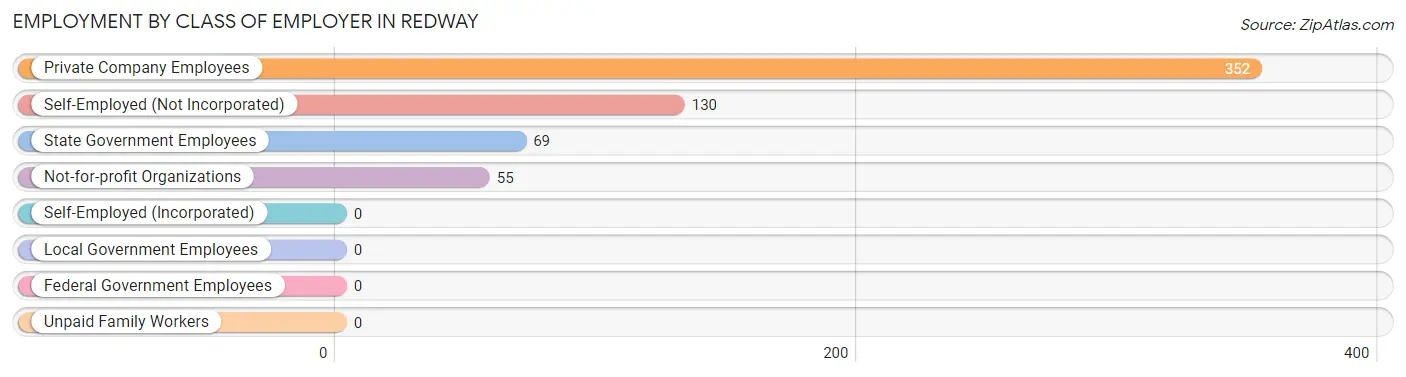
| Employer Class | # Employees | % Employees |
| Private Company Employees | 352 | 58.1% |
| Self-Employed (Incorporated) | 0 | 0.0% |
| Self-Employed (Not Incorporated) | 130 | 21.4% |
| Not-for-profit Organizations | 55 | 9.1% |
| Local Government Employees | 0 | 0.0% |
| State Government Employees | 69 | 11.4% |
| Federal Government Employees | 0 | 0.0% |
| Unpaid Family Workers | 0 | 0.0% |
| Total | 606 | 100.0% |
Employment Status by Age in Redway
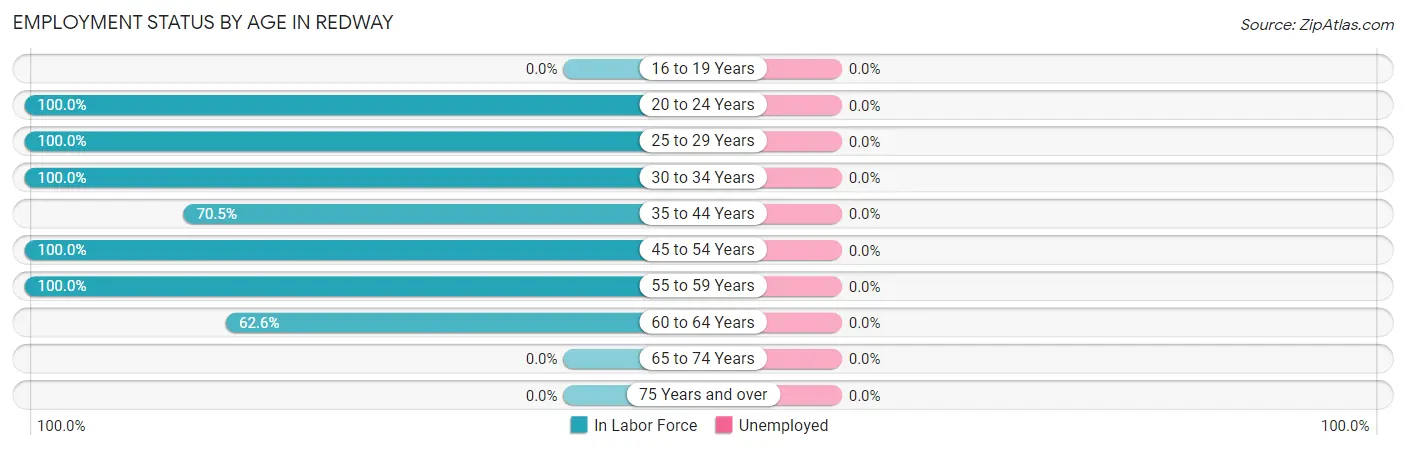
| Age Bracket | In Labor Force | Unemployed |
| 16 to 19 Years | 0 (0.0%) | 0 (0.0%) |
| 20 to 24 Years | 88 (100.0%) | 0 (0.0%) |
| 25 to 29 Years | 54 (100.0%) | 0 (0.0%) |
| 30 to 34 Years | 50 (100.0%) | 0 (0.0%) |
| 35 to 44 Years | 124 (70.5%) | 0 (0.0%) |
| 45 to 54 Years | 129 (100.0%) | 0 (0.0%) |
| 55 to 59 Years | 104 (100.0%) | 0 (0.0%) |
| 60 to 64 Years | 57 (62.6%) | 0 (0.0%) |
| 65 to 74 Years | 0 (0.0%) | 0 (0.0%) |
| 75 Years and over | 0 (0.0%) | 0 (0.0%) |
| Total | 606 (60.4%) | 0 (0.0%) |
Employment Status by Educational Attainment in Redway
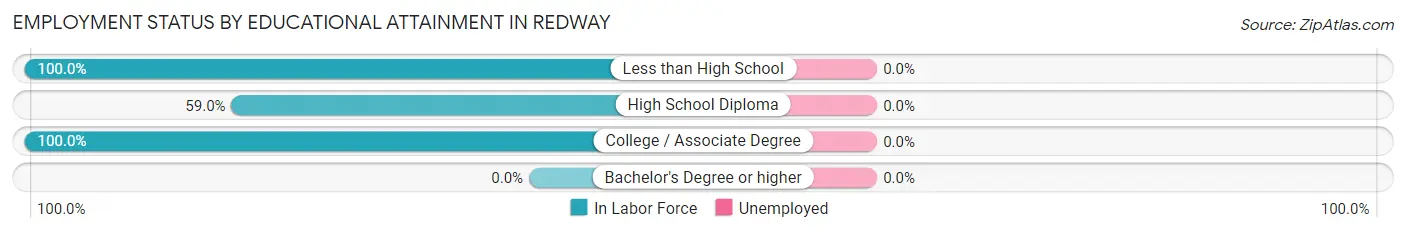
| Educational Attainment | In Labor Force | Unemployed |
| Less than High School | 54 (100.0%) | 0 (0.0%) |
| High School Diploma | 124 (59.0%) | 0 (0.0%) |
| College / Associate Degree | 340 (100.0%) | 0 (0.0%) |
| Bachelor's Degree or higher | 0 (0.0%) | 0 (0.0%) |
| Total | 518 (85.8%) | 0 (0.0%) |
Employment Occupations by Sex in Redway
Management, Business, Science and Arts Occupations
The most common Management, Business, Science and Arts occupations in Redway are Management (164 | 27.1%), and Business & Financial (55 | 9.1%).
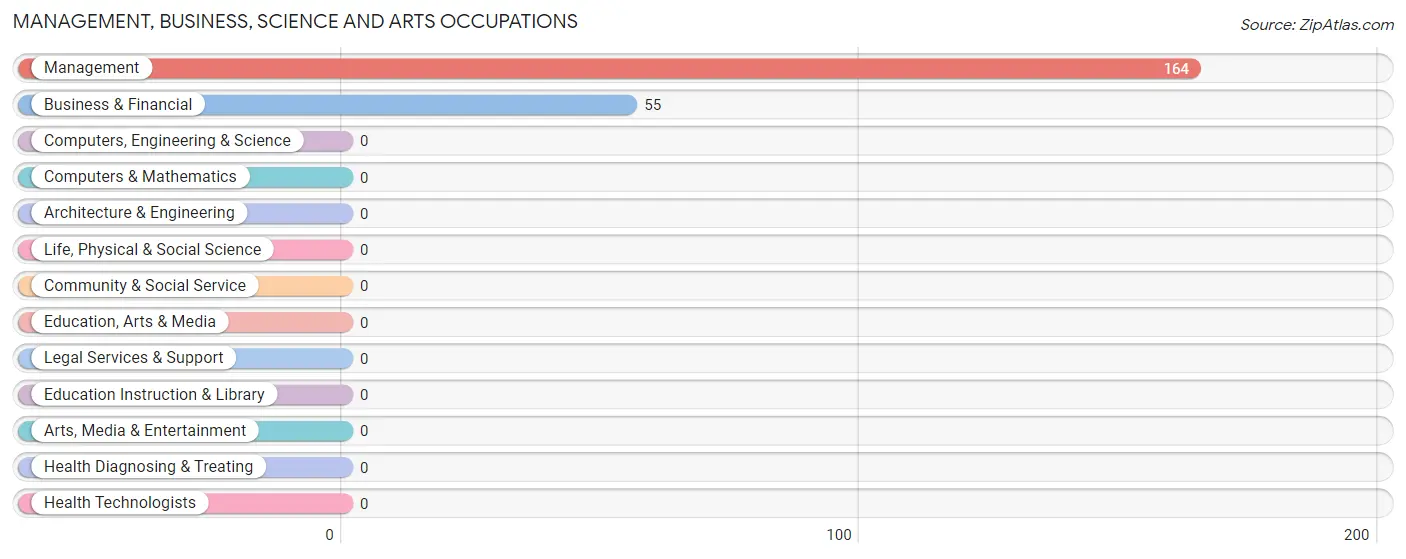
Management, Business, Science and Arts Occupations by Sex
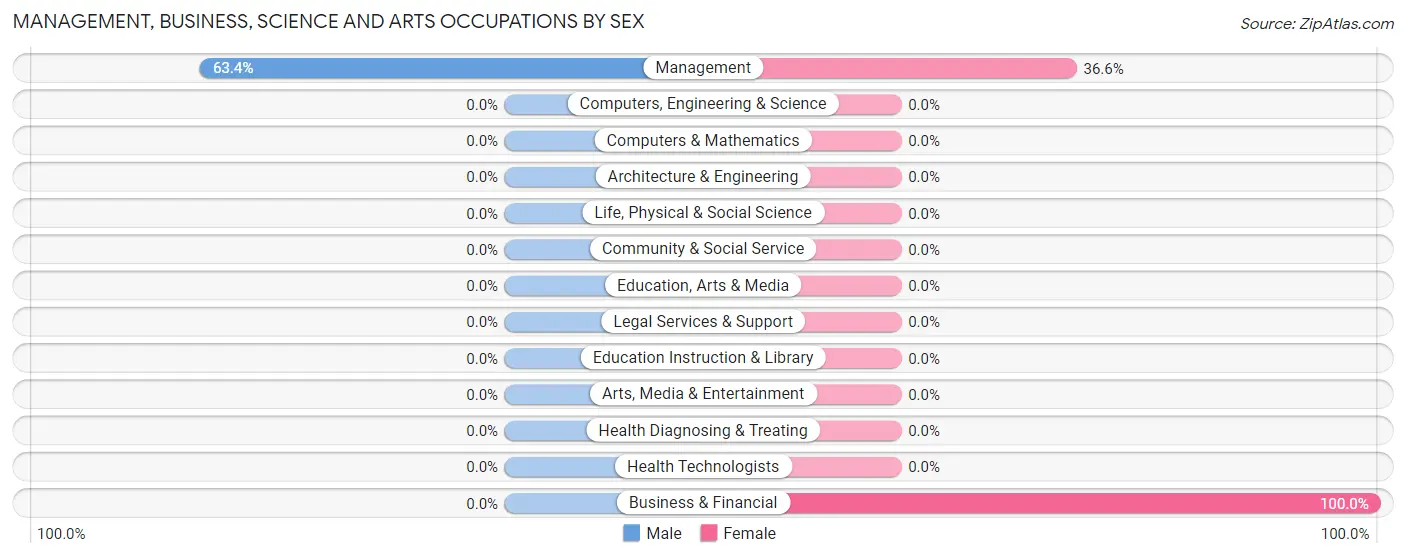
| Occupation | Male | Female |
| Management | 104 (63.4%) | 60 (36.6%) |
| Business & Financial | 0 (0.0%) | 55 (100.0%) |
| Computers, Engineering & Science | 0 (0.0%) | 0 (0.0%) |
| Computers & Mathematics | 0 (0.0%) | 0 (0.0%) |
| Architecture & Engineering | 0 (0.0%) | 0 (0.0%) |
| Life, Physical & Social Science | 0 (0.0%) | 0 (0.0%) |
| Community & Social Service | 0 (0.0%) | 0 (0.0%) |
| Education, Arts & Media | 0 (0.0%) | 0 (0.0%) |
| Legal Services & Support | 0 (0.0%) | 0 (0.0%) |
| Education Instruction & Library | 0 (0.0%) | 0 (0.0%) |
| Arts, Media & Entertainment | 0 (0.0%) | 0 (0.0%) |
| Health Diagnosing & Treating | 0 (0.0%) | 0 (0.0%) |
| Health Technologists | 0 (0.0%) | 0 (0.0%) |
| Total (Category) | 104 (47.5%) | 115 (52.5%) |
| Total (Overall) | 318 (52.5%) | 288 (47.5%) |
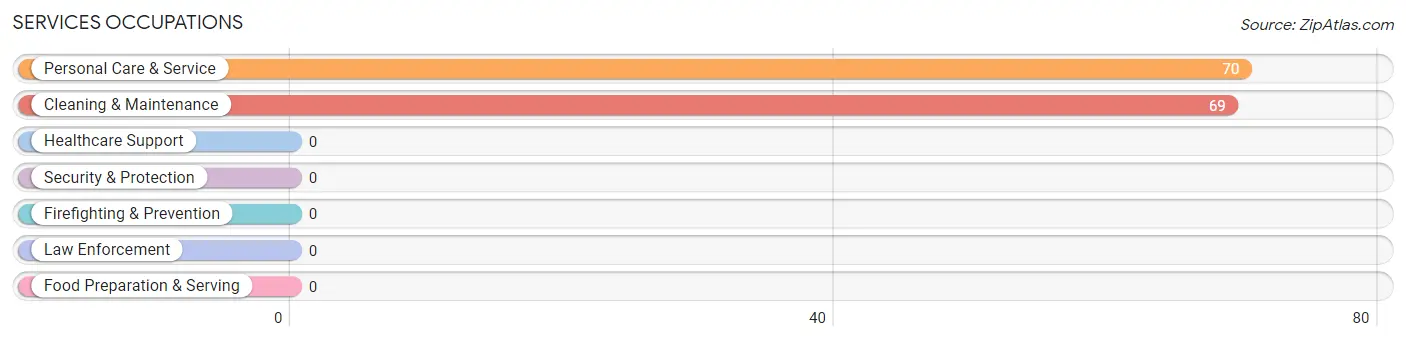
Services Occupations
The most common Services occupations in Redway are Personal Care & Service (70 | 11.6%), and Cleaning & Maintenance (69 | 11.4%).
Services Occupations by Sex
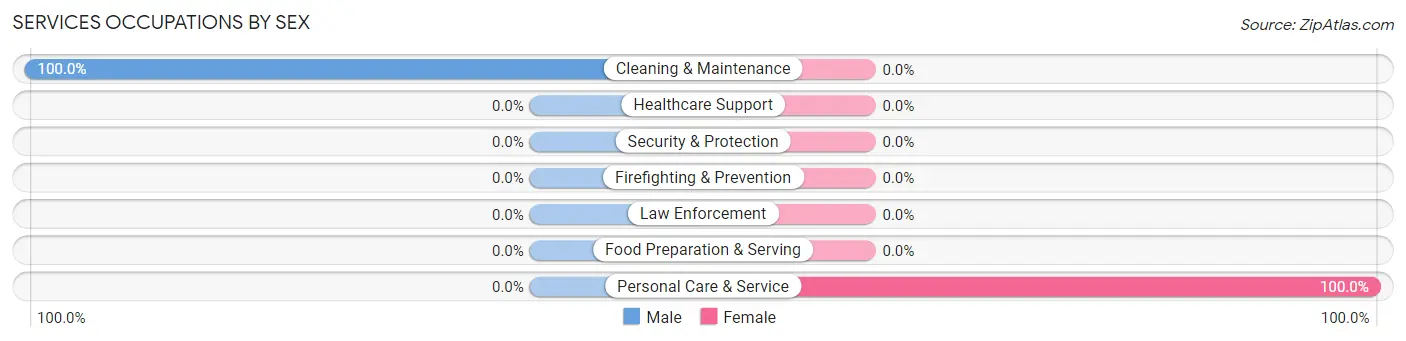
| Occupation | Male | Female |
| Healthcare Support | 0 (0.0%) | 0 (0.0%) |
| Security & Protection | 0 (0.0%) | 0 (0.0%) |
| Firefighting & Prevention | 0 (0.0%) | 0 (0.0%) |
| Law Enforcement | 0 (0.0%) | 0 (0.0%) |
| Food Preparation & Serving | 0 (0.0%) | 0 (0.0%) |
| Cleaning & Maintenance | 69 (100.0%) | 0 (0.0%) |
| Personal Care & Service | 0 (0.0%) | 70 (100.0%) |
| Total (Category) | 69 (49.6%) | 70 (50.4%) |
| Total (Overall) | 318 (52.5%) | 288 (47.5%) |
Sales and Office Occupations
The most common Sales and Office occupations in Redway are , and Office & Administration (49 | 8.1%).
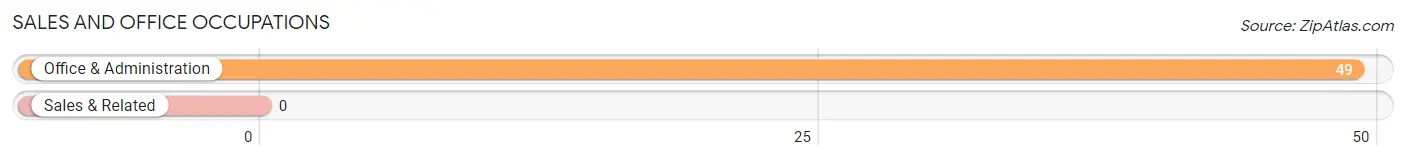
Sales and Office Occupations by Sex
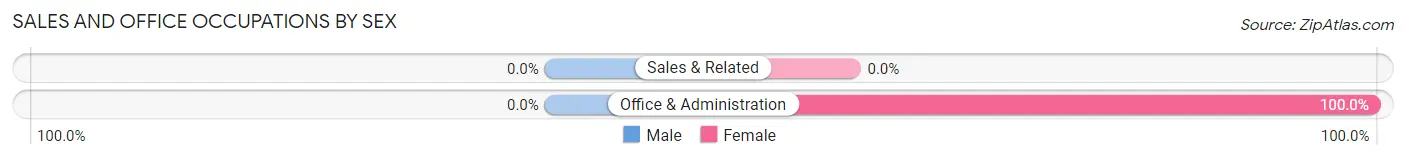
| Occupation | Male | Female |
| Sales & Related | 0 (0.0%) | 0 (0.0%) |
| Office & Administration | 0 (0.0%) | 49 (100.0%) |
| Total (Category) | 0 (0.0%) | 49 (100.0%) |
| Total (Overall) | 318 (52.5%) | 288 (47.5%) |
Natural Resources, Construction and Maintenance Occupations
The most common Natural Resources, Construction and Maintenance occupations in Redway are , and Farming, Fishing & Forestry (54 | 8.9%).
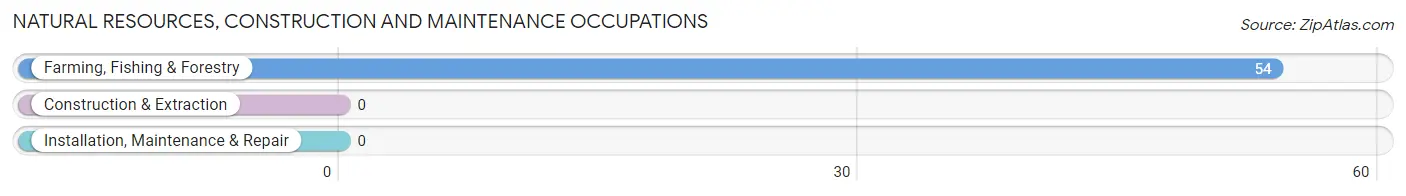
Natural Resources, Construction and Maintenance Occupations by Sex
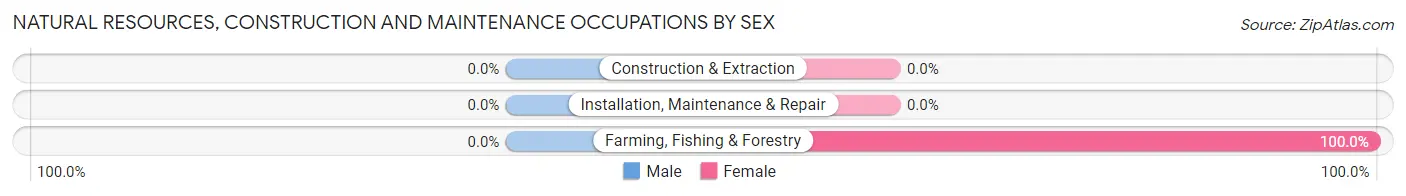
| Occupation | Male | Female |
| Farming, Fishing & Forestry | 0 (0.0%) | 54 (100.0%) |
| Construction & Extraction | 0 (0.0%) | 0 (0.0%) |
| Installation, Maintenance & Repair | 0 (0.0%) | 0 (0.0%) |
| Total (Category) | 0 (0.0%) | 54 (100.0%) |
| Total (Overall) | 318 (52.5%) | 288 (47.5%) |
Production, Transportation and Moving Occupations
The most common Production, Transportation and Moving occupations in Redway are Transportation (88 | 14.5%), and Production (57 | 9.4%).
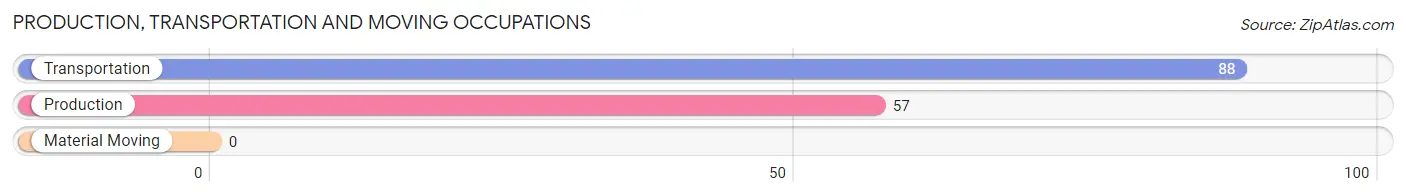
Production, Transportation and Moving Occupations by Sex
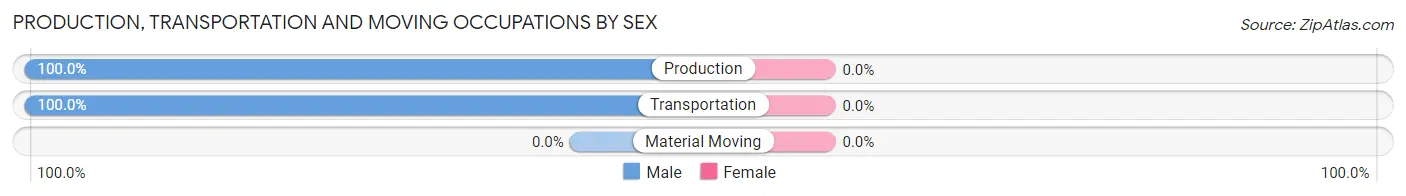
| Occupation | Male | Female |
| Production | 57 (100.0%) | 0 (0.0%) |
| Transportation | 88 (100.0%) | 0 (0.0%) |
| Material Moving | 0 (0.0%) | 0 (0.0%) |
| Total (Category) | 145 (100.0%) | 0 (0.0%) |
| Total (Overall) | 318 (52.5%) | 288 (47.5%) |
Employment Industries by Sex in Redway
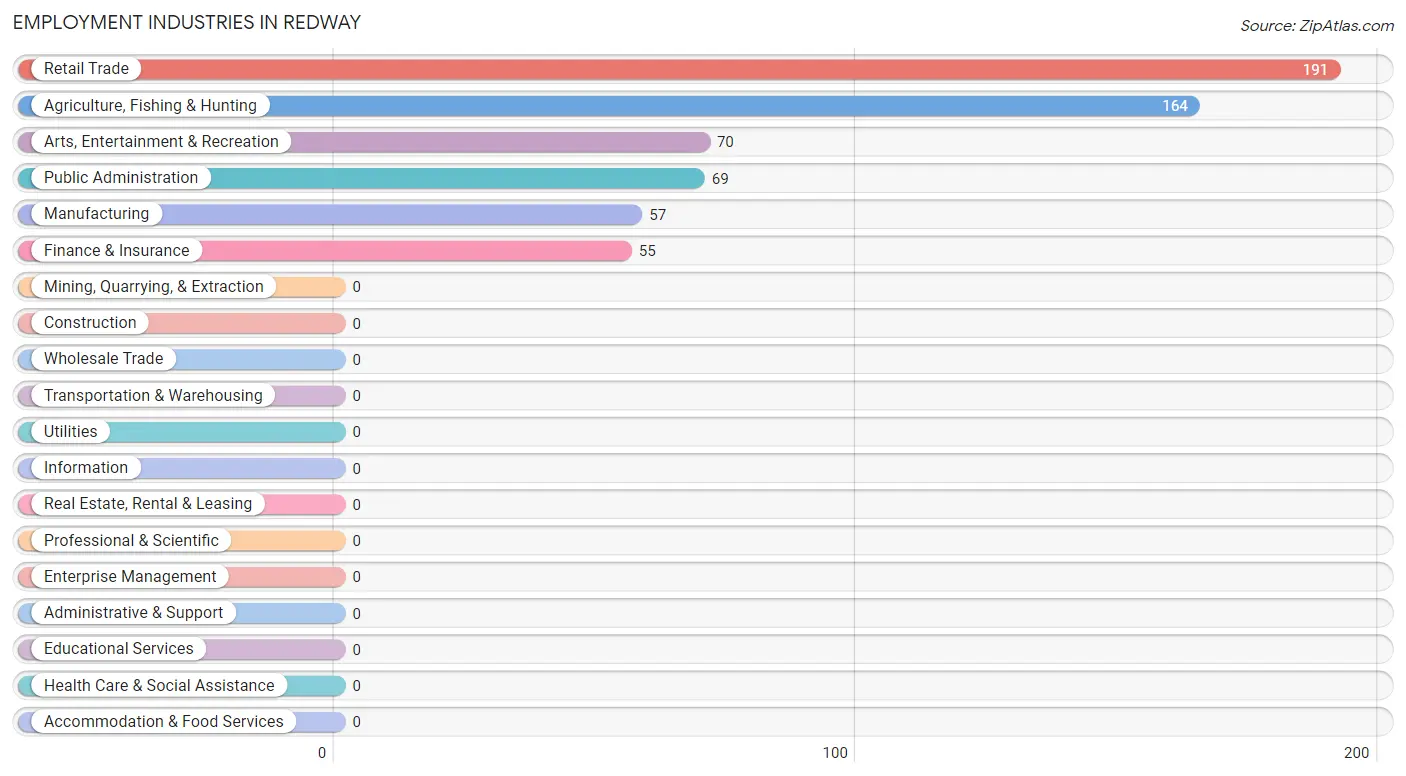
Employment Industries in Redway
The major employment industries in Redway include Retail Trade (191 | 31.5%), Agriculture, Fishing & Hunting (164 | 27.1%), Arts, Entertainment & Recreation (70 | 11.6%), Public Administration (69 | 11.4%), and Manufacturing (57 | 9.4%).
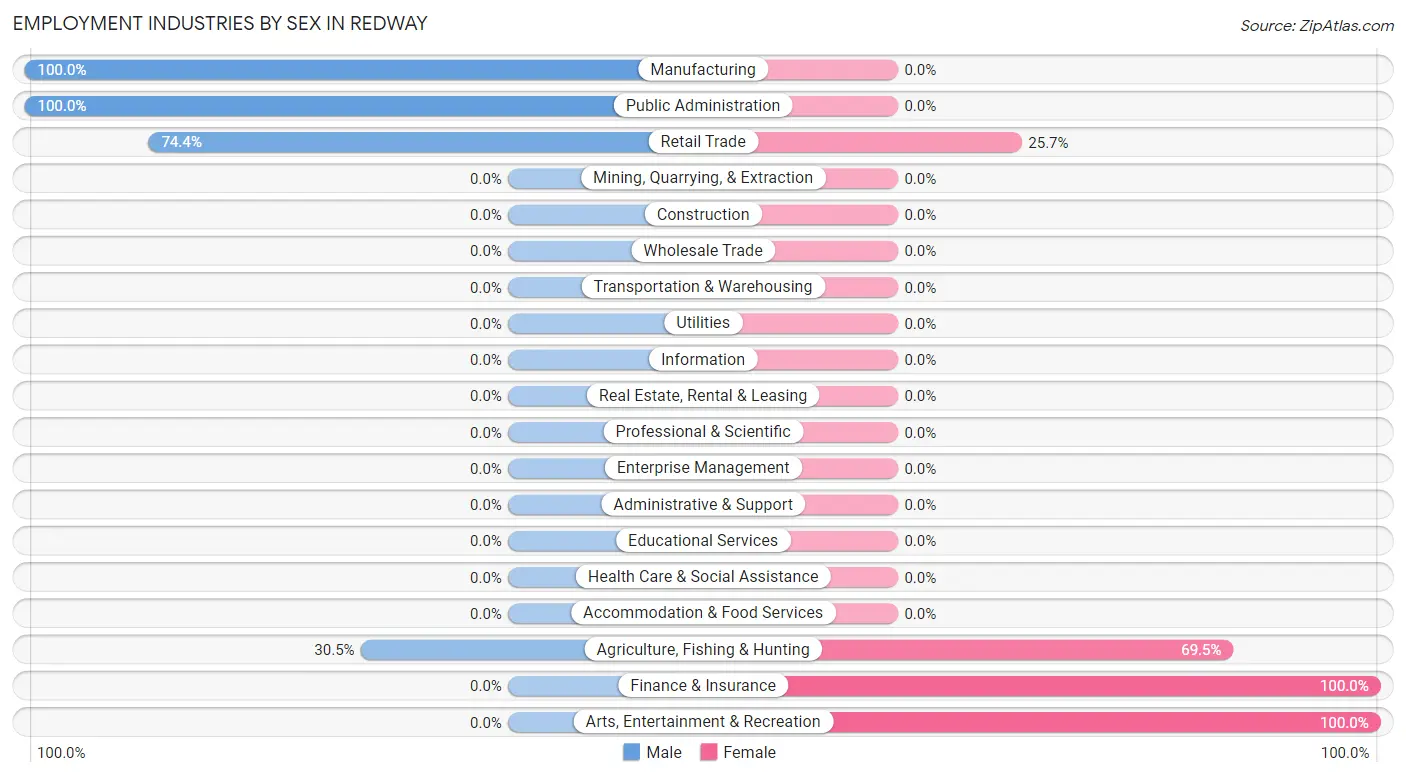
Employment Industries by Sex in Redway
The Redway industries that see more men than women are Manufacturing (100.0%), Public Administration (100.0%), and Retail Trade (74.4%), whereas the industries that tend to have a higher number of women are Finance & Insurance (100.0%), Arts, Entertainment & Recreation (100.0%), and Agriculture, Fishing & Hunting (69.5%).
| Industry | Male | Female |
| Agriculture, Fishing & Hunting | 50 (30.5%) | 114 (69.5%) |
| Mining, Quarrying, & Extraction | 0 (0.0%) | 0 (0.0%) |
| Construction | 0 (0.0%) | 0 (0.0%) |
| Manufacturing | 57 (100.0%) | 0 (0.0%) |
| Wholesale Trade | 0 (0.0%) | 0 (0.0%) |
| Retail Trade | 142 (74.4%) | 49 (25.7%) |
| Transportation & Warehousing | 0 (0.0%) | 0 (0.0%) |
| Utilities | 0 (0.0%) | 0 (0.0%) |
| Information | 0 (0.0%) | 0 (0.0%) |
| Finance & Insurance | 0 (0.0%) | 55 (100.0%) |
| Real Estate, Rental & Leasing | 0 (0.0%) | 0 (0.0%) |
| Professional & Scientific | 0 (0.0%) | 0 (0.0%) |
| Enterprise Management | 0 (0.0%) | 0 (0.0%) |
| Administrative & Support | 0 (0.0%) | 0 (0.0%) |
| Educational Services | 0 (0.0%) | 0 (0.0%) |
| Health Care & Social Assistance | 0 (0.0%) | 0 (0.0%) |
| Arts, Entertainment & Recreation | 0 (0.0%) | 70 (100.0%) |
| Accommodation & Food Services | 0 (0.0%) | 0 (0.0%) |
| Public Administration | 69 (100.0%) | 0 (0.0%) |
| Total | 318 (52.5%) | 288 (47.5%) |
Education in Redway
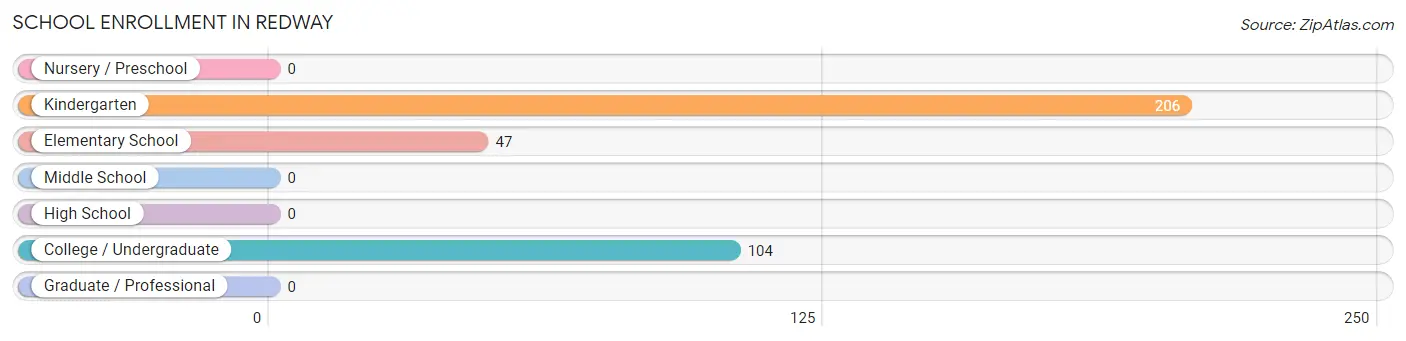
School Enrollment in Redway
The most common levels of schooling among the 357 students in Redway are kindergarten (206 | 57.7%), college / undergraduate (104 | 29.1%), and elementary school (47 | 13.2%).
| School Level | # Students | % Students |
| Nursery / Preschool | 0 | 0.0% |
| Kindergarten | 206 | 57.7% |
| Elementary School | 47 | 13.2% |
| Middle School | 0 | 0.0% |
| High School | 0 | 0.0% |
| College / Undergraduate | 104 | 29.1% |
| Graduate / Professional | 0 | 0.0% |
| Total | 357 | 100.0% |
School Enrollment by Age by Funding Source in Redway
Out of a total of 357 students who are enrolled in schools in Redway, 50 (14.0%) attend a private institution, while the remaining 307 (86.0%) are enrolled in public schools. The age group of 25 to 34 year olds has the highest likelihood of being enrolled in private schools, with 50 (48.1% in the age bracket) enrolled. Conversely, the age group of 5 to 9 year old has the lowest likelihood of being enrolled in a private school, with 253 (100.0% in the age bracket) attending a public institution.
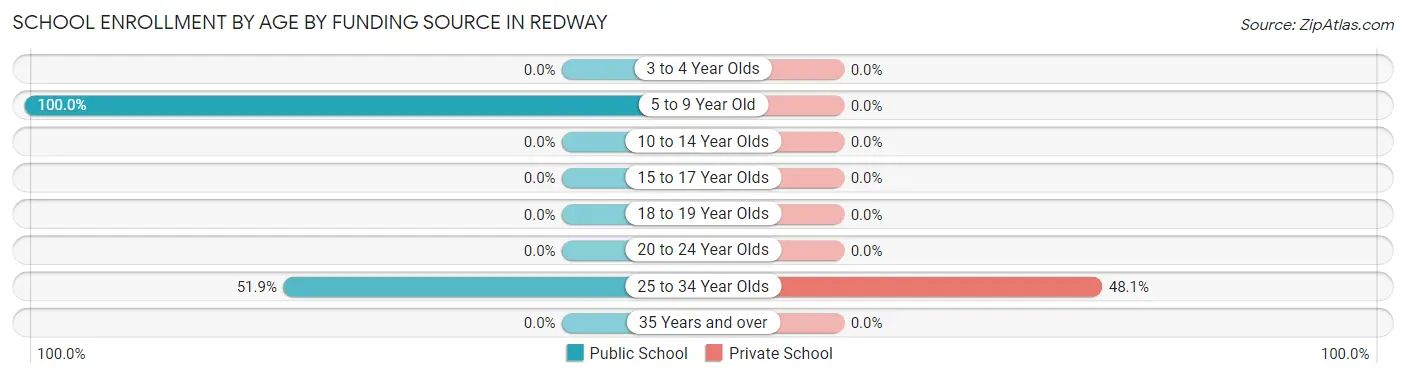
| Age Bracket | Public School | Private School |
| 3 to 4 Year Olds | 0 (0.0%) | 0 (0.0%) |
| 5 to 9 Year Old | 253 (100.0%) | 0 (0.0%) |
| 10 to 14 Year Olds | 0 (0.0%) | 0 (0.0%) |
| 15 to 17 Year Olds | 0 (0.0%) | 0 (0.0%) |
| 18 to 19 Year Olds | 0 (0.0%) | 0 (0.0%) |
| 20 to 24 Year Olds | 0 (0.0%) | 0 (0.0%) |
| 25 to 34 Year Olds | 54 (51.9%) | 50 (48.1%) |
| 35 Years and over | 0 (0.0%) | 0 (0.0%) |
| Total | 307 (86.0%) | 50 (14.0%) |
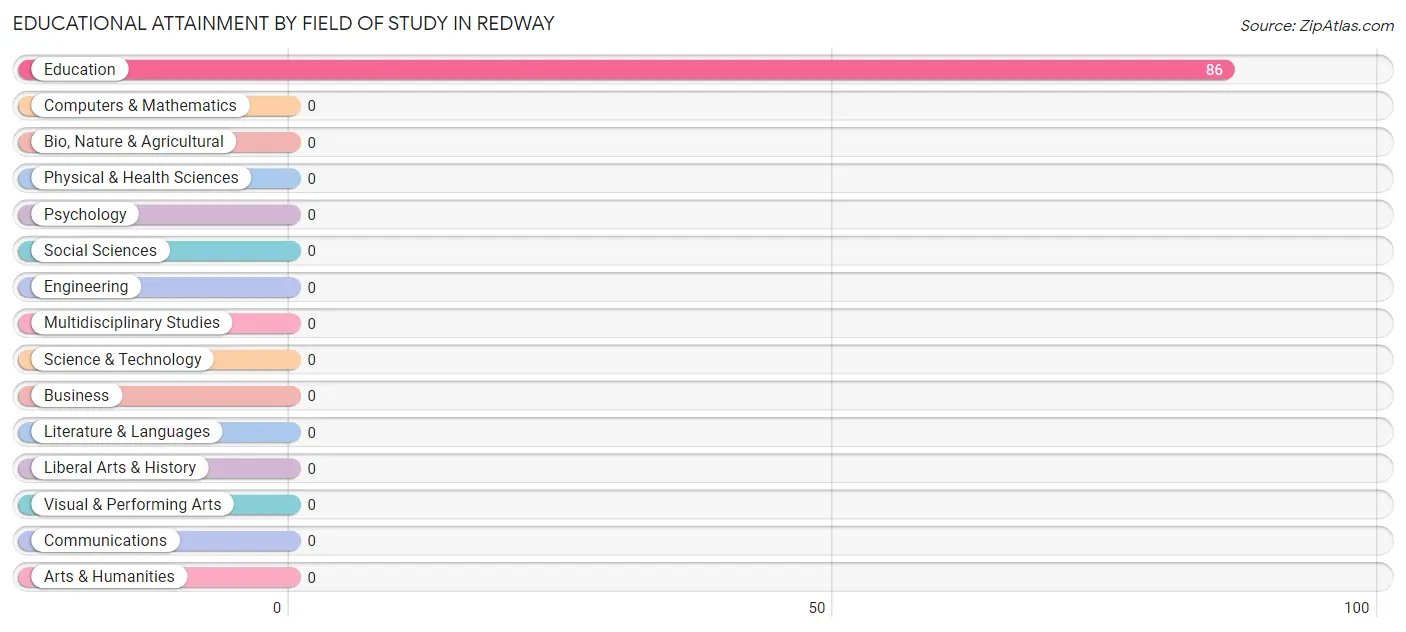
Educational Attainment by Field of Study in Redway
, and education (86 | 100.0%) are the most common fields of study among 86 individuals in Redway who have obtained a bachelor's degree or higher.
| Field of Study | # Graduates | % Graduates |
| Computers & Mathematics | 0 | 0.0% |
| Bio, Nature & Agricultural | 0 | 0.0% |
| Physical & Health Sciences | 0 | 0.0% |
| Psychology | 0 | 0.0% |
| Social Sciences | 0 | 0.0% |
| Engineering | 0 | 0.0% |
| Multidisciplinary Studies | 0 | 0.0% |
| Science & Technology | 0 | 0.0% |
| Business | 0 | 0.0% |
| Education | 86 | 100.0% |
| Literature & Languages | 0 | 0.0% |
| Liberal Arts & History | 0 | 0.0% |
| Visual & Performing Arts | 0 | 0.0% |
| Communications | 0 | 0.0% |
| Arts & Humanities | 0 | 0.0% |
| Total | 86 | 100.0% |
Transportation & Commute in Redway
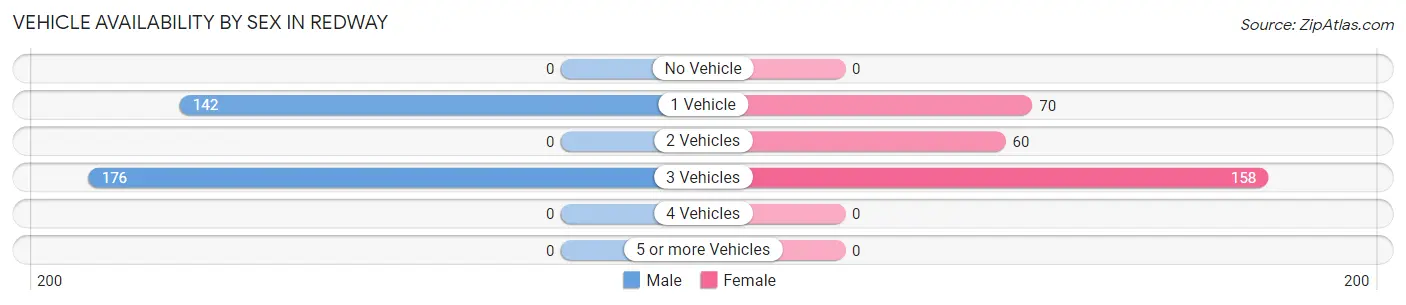
Vehicle Availability by Sex in Redway
The most prevalent vehicle ownership categories in Redway are males with 3 vehicles (176, accounting for 55.3%) and females with 3 vehicles (158, making up 61.1%).
| Vehicles Available | Male | Female |
| No Vehicle | 0 (0.0%) | 0 (0.0%) |
| 1 Vehicle | 142 (44.7%) | 70 (24.3%) |
| 2 Vehicles | 0 (0.0%) | 60 (20.8%) |
| 3 Vehicles | 176 (55.3%) | 158 (54.9%) |
| 4 Vehicles | 0 (0.0%) | 0 (0.0%) |
| 5 or more Vehicles | 0 (0.0%) | 0 (0.0%) |
| Total | 318 (100.0%) | 288 (100.0%) |
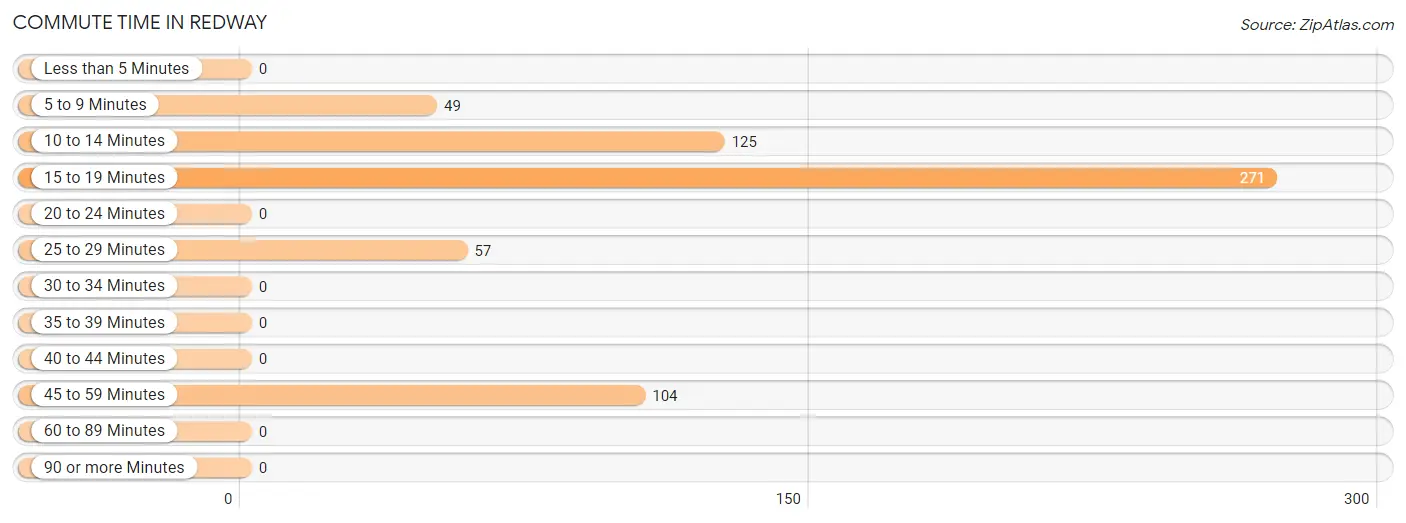
Commute Time in Redway
The most frequently occuring commute durations in Redway are 15 to 19 minutes (271 commuters, 44.7%), 10 to 14 minutes (125 commuters, 20.6%), and 45 to 59 minutes (104 commuters, 17.2%).
| Commute Time | # Commuters | % Commuters |
| Less than 5 Minutes | 0 | 0.0% |
| 5 to 9 Minutes | 49 | 8.1% |
| 10 to 14 Minutes | 125 | 20.6% |
| 15 to 19 Minutes | 271 | 44.7% |
| 20 to 24 Minutes | 0 | 0.0% |
| 25 to 29 Minutes | 57 | 9.4% |
| 30 to 34 Minutes | 0 | 0.0% |
| 35 to 39 Minutes | 0 | 0.0% |
| 40 to 44 Minutes | 0 | 0.0% |
| 45 to 59 Minutes | 104 | 17.2% |
| 60 to 89 Minutes | 0 | 0.0% |
| 90 or more Minutes | 0 | 0.0% |
Commute Time by Sex in Redway
The most common commute times in Redway are 15 to 19 minutes (211 commuters, 66.3%) for males and 10 to 14 minutes (125 commuters, 43.4%) for females.
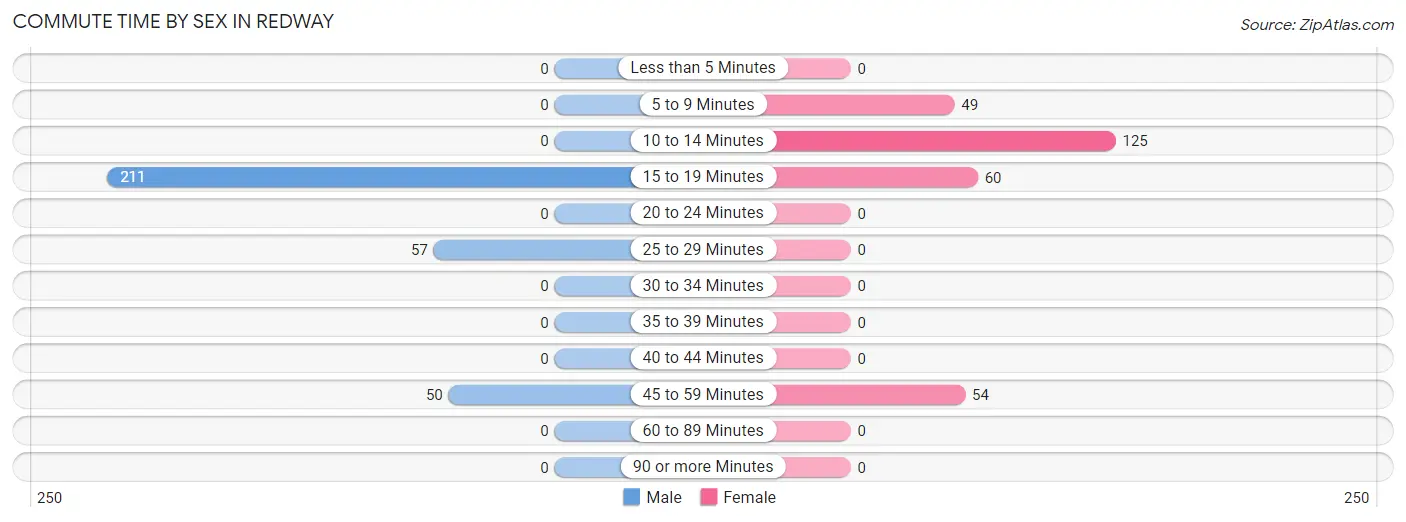
| Commute Time | Male | Female |
| Less than 5 Minutes | 0 (0.0%) | 0 (0.0%) |
| 5 to 9 Minutes | 0 (0.0%) | 49 (17.0%) |
| 10 to 14 Minutes | 0 (0.0%) | 125 (43.4%) |
| 15 to 19 Minutes | 211 (66.3%) | 60 (20.8%) |
| 20 to 24 Minutes | 0 (0.0%) | 0 (0.0%) |
| 25 to 29 Minutes | 57 (17.9%) | 0 (0.0%) |
| 30 to 34 Minutes | 0 (0.0%) | 0 (0.0%) |
| 35 to 39 Minutes | 0 (0.0%) | 0 (0.0%) |
| 40 to 44 Minutes | 0 (0.0%) | 0 (0.0%) |
| 45 to 59 Minutes | 50 (15.7%) | 54 (18.8%) |
| 60 to 89 Minutes | 0 (0.0%) | 0 (0.0%) |
| 90 or more Minutes | 0 (0.0%) | 0 (0.0%) |
Time of Departure to Work by Sex in Redway
The most frequent times of departure to work in Redway are 7:30 AM to 7:59 AM (180, 56.6%) for males and 7:30 AM to 7:59 AM (164, 56.9%) for females.
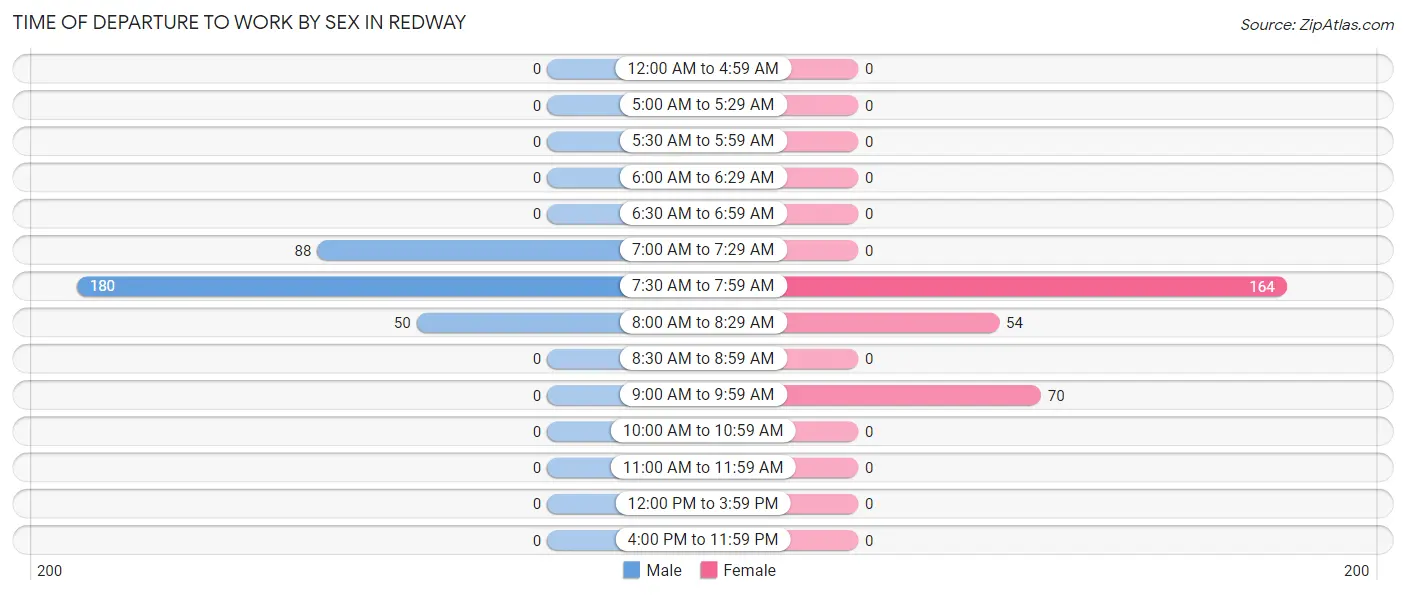
| Time of Departure | Male | Female |
| 12:00 AM to 4:59 AM | 0 (0.0%) | 0 (0.0%) |
| 5:00 AM to 5:29 AM | 0 (0.0%) | 0 (0.0%) |
| 5:30 AM to 5:59 AM | 0 (0.0%) | 0 (0.0%) |
| 6:00 AM to 6:29 AM | 0 (0.0%) | 0 (0.0%) |
| 6:30 AM to 6:59 AM | 0 (0.0%) | 0 (0.0%) |
| 7:00 AM to 7:29 AM | 88 (27.7%) | 0 (0.0%) |
| 7:30 AM to 7:59 AM | 180 (56.6%) | 164 (56.9%) |
| 8:00 AM to 8:29 AM | 50 (15.7%) | 54 (18.8%) |
| 8:30 AM to 8:59 AM | 0 (0.0%) | 0 (0.0%) |
| 9:00 AM to 9:59 AM | 0 (0.0%) | 70 (24.3%) |
| 10:00 AM to 10:59 AM | 0 (0.0%) | 0 (0.0%) |
| 11:00 AM to 11:59 AM | 0 (0.0%) | 0 (0.0%) |
| 12:00 PM to 3:59 PM | 0 (0.0%) | 0 (0.0%) |
| 4:00 PM to 11:59 PM | 0 (0.0%) | 0 (0.0%) |
| Total | 318 (100.0%) | 288 (100.0%) |
Housing Occupancy in Redway
Occupancy by Ownership in Redway
Of the total 600 dwellings in Redway, owner-occupied units account for 415 (69.2%), while renter-occupied units make up 185 (30.8%).
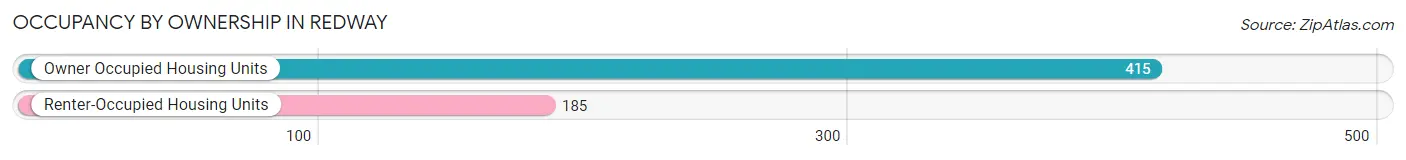
| Occupancy | # Housing Units | % Housing Units |
| Owner Occupied Housing Units | 415 | 69.2% |
| Renter-Occupied Housing Units | 185 | 30.8% |
| Total Occupied Housing Units | 600 | 100.0% |
Occupancy by Household Size in Redway
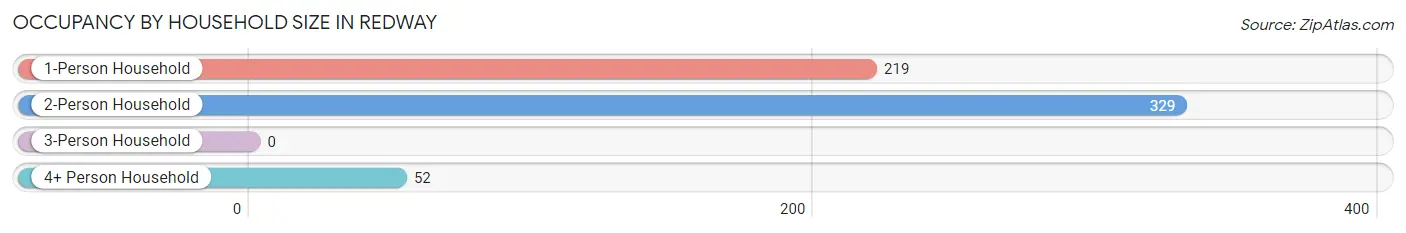
| Household Size | # Housing Units | % Housing Units |
| 1-Person Household | 219 | 36.5% |
| 2-Person Household | 329 | 54.8% |
| 3-Person Household | 0 | 0.0% |
| 4+ Person Household | 52 | 8.7% |
| Total Housing Units | 600 | 100.0% |
Occupancy by Ownership by Household Size in Redway
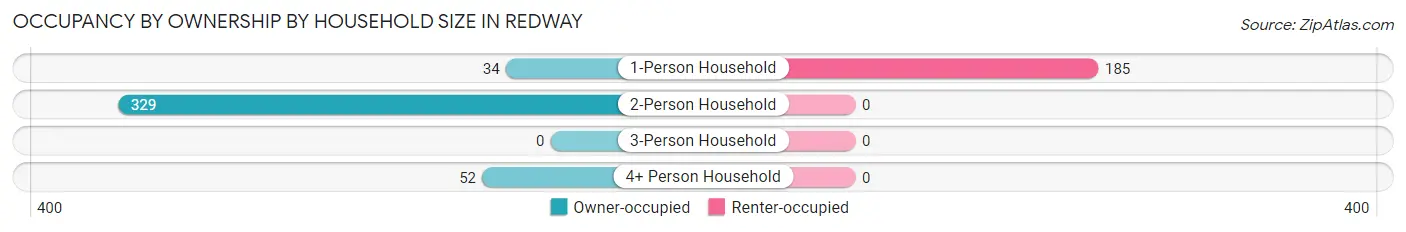
| Household Size | Owner-occupied | Renter-occupied |
| 1-Person Household | 34 (15.5%) | 185 (84.5%) |
| 2-Person Household | 329 (100.0%) | 0 (0.0%) |
| 3-Person Household | 0 (0.0%) | 0 (0.0%) |
| 4+ Person Household | 52 (100.0%) | 0 (0.0%) |
| Total Housing Units | 415 (69.2%) | 185 (30.8%) |
Occupancy by Educational Attainment in Redway
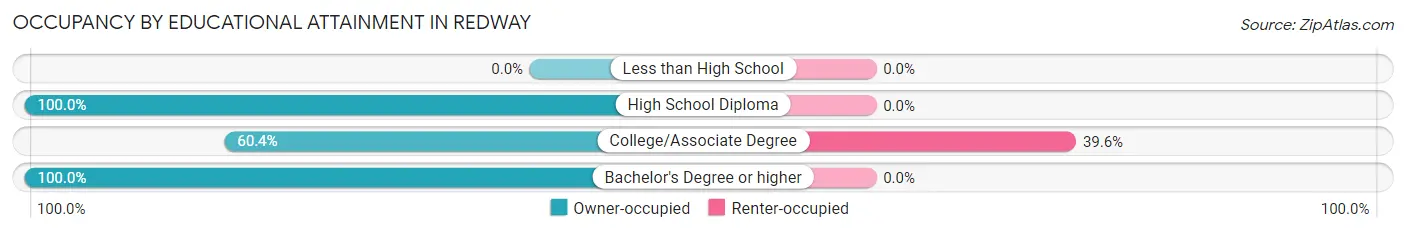
| Household Size | Owner-occupied | Renter-occupied |
| Less than High School | 0 (0.0%) | 0 (0.0%) |
| High School Diploma | 86 (100.0%) | 0 (0.0%) |
| College/Associate Degree | 282 (60.4%) | 185 (39.6%) |
| Bachelor's Degree or higher | 47 (100.0%) | 0 (0.0%) |
Occupancy by Age of Householder in Redway
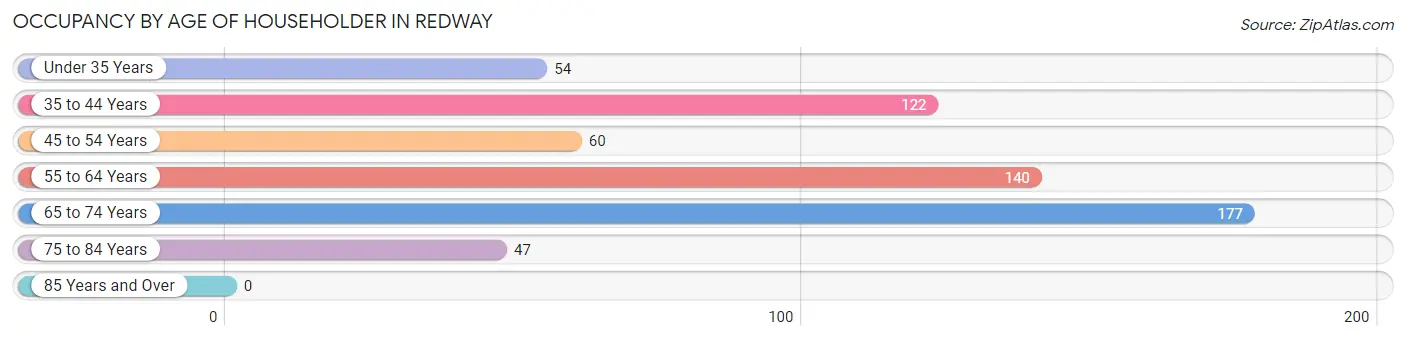
| Age Bracket | # Households | % Households |
| Under 35 Years | 54 | 9.0% |
| 35 to 44 Years | 122 | 20.3% |
| 45 to 54 Years | 60 | 10.0% |
| 55 to 64 Years | 140 | 23.3% |
| 65 to 74 Years | 177 | 29.5% |
| 75 to 84 Years | 47 | 7.8% |
| 85 Years and Over | 0 | 0.0% |
| Total | 600 | 100.0% |
Housing Finances in Redway
Median Income by Occupancy in Redway
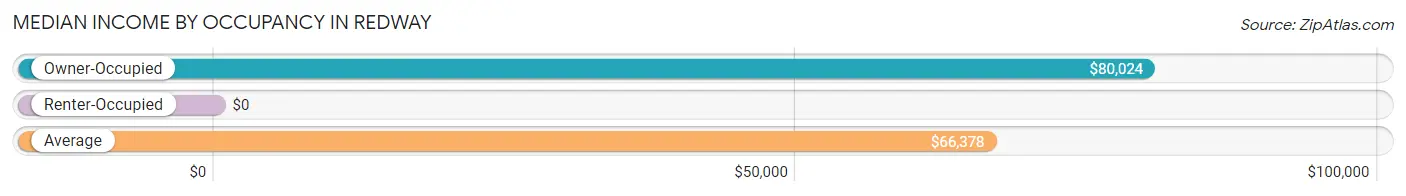
| Occupancy Type | # Households | Median Income |
| Owner-Occupied | 415 (69.2%) | $80,024 |
| Renter-Occupied | 185 (30.8%) | $0 |
| Average | 600 (100.0%) | $66,378 |
Occupancy by Householder Income Bracket in Redway
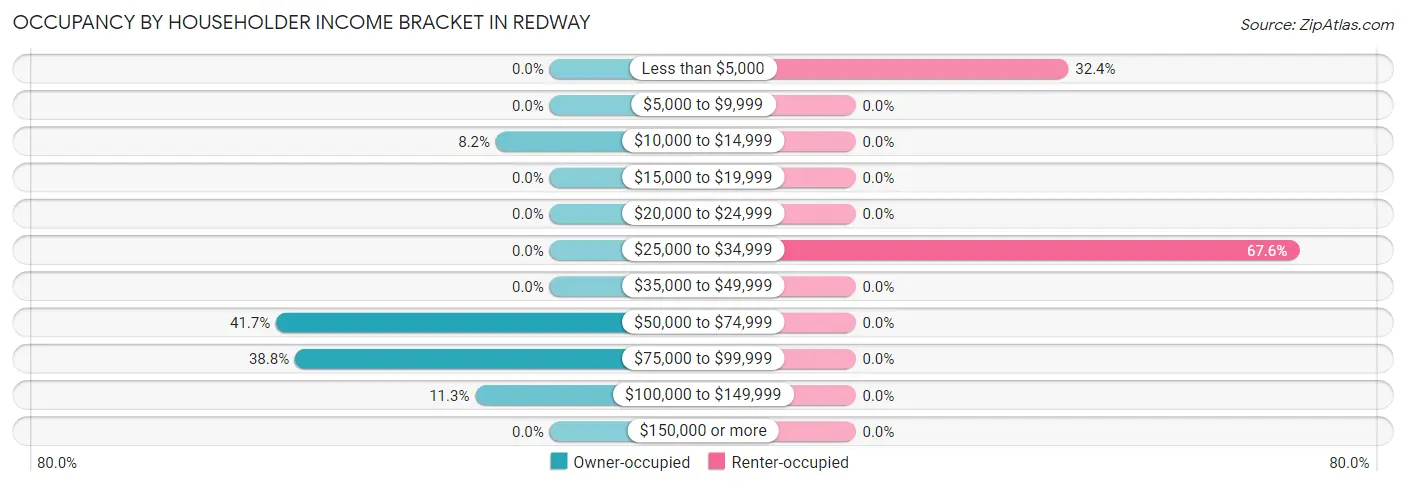
| Income Bracket | Owner-occupied | Renter-occupied |
| Less than $5,000 | 0 (0.0%) | 60 (32.4%) |
| $5,000 to $9,999 | 0 (0.0%) | 0 (0.0%) |
| $10,000 to $14,999 | 34 (8.2%) | 0 (0.0%) |
| $15,000 to $19,999 | 0 (0.0%) | 0 (0.0%) |
| $20,000 to $24,999 | 0 (0.0%) | 0 (0.0%) |
| $25,000 to $34,999 | 0 (0.0%) | 125 (67.6%) |
| $35,000 to $49,999 | 0 (0.0%) | 0 (0.0%) |
| $50,000 to $74,999 | 173 (41.7%) | 0 (0.0%) |
| $75,000 to $99,999 | 161 (38.8%) | 0 (0.0%) |
| $100,000 to $149,999 | 47 (11.3%) | 0 (0.0%) |
| $150,000 or more | 0 (0.0%) | 0 (0.0%) |
| Total | 415 (100.0%) | 185 (100.0%) |
Monthly Housing Cost Tiers in Redway
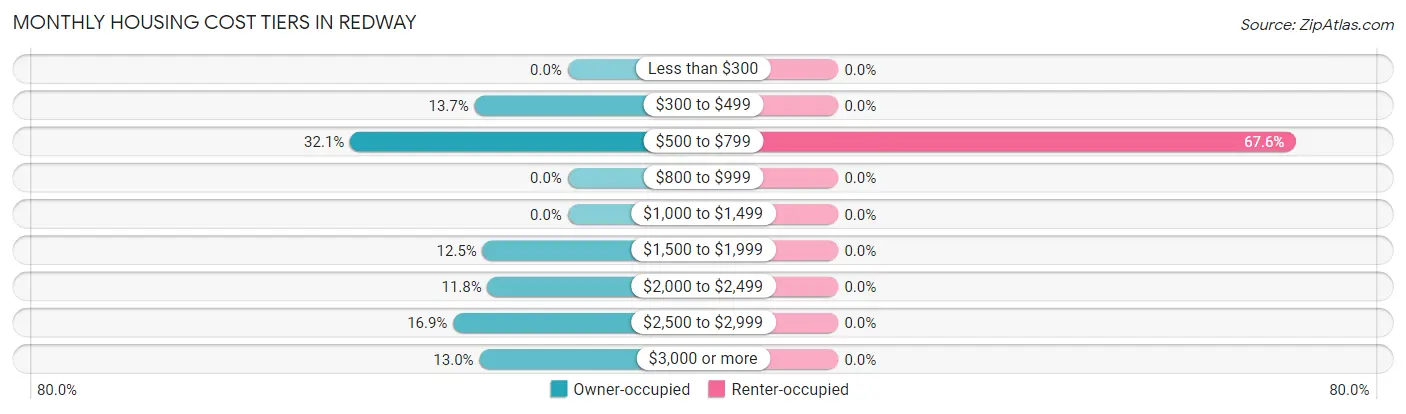
| Monthly Cost | Owner-occupied | Renter-occupied |
| Less than $300 | 0 (0.0%) | 0 (0.0%) |
| $300 to $499 | 57 (13.7%) | 0 (0.0%) |
| $500 to $799 | 133 (32.1%) | 125 (67.6%) |
| $800 to $999 | 0 (0.0%) | 0 (0.0%) |
| $1,000 to $1,499 | 0 (0.0%) | 0 (0.0%) |
| $1,500 to $1,999 | 52 (12.5%) | 0 (0.0%) |
| $2,000 to $2,499 | 49 (11.8%) | 0 (0.0%) |
| $2,500 to $2,999 | 70 (16.9%) | 0 (0.0%) |
| $3,000 or more | 54 (13.0%) | 0 (0.0%) |
| Total | 415 (100.0%) | 185 (100.0%) |
Physical Housing Characteristics in Redway
Housing Structures in Redway
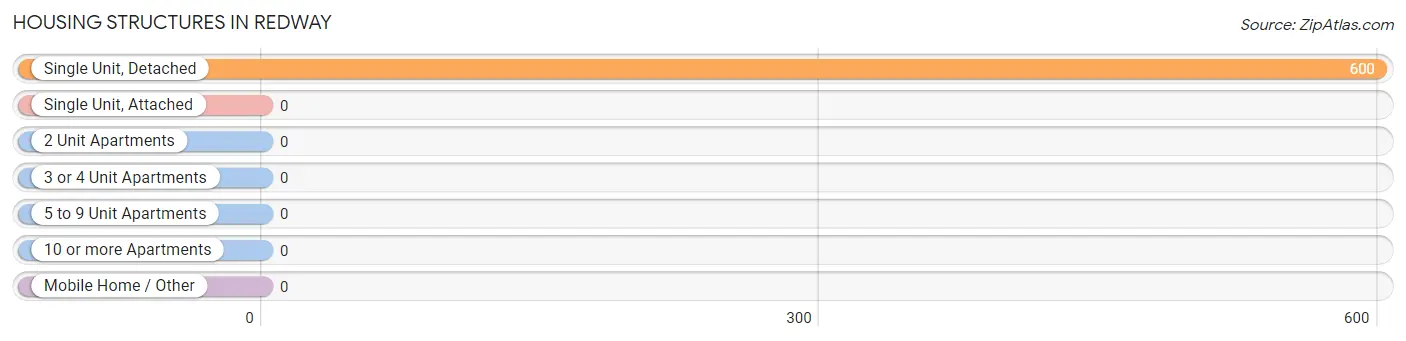
| Structure Type | # Housing Units | % Housing Units |
| Single Unit, Detached | 600 | 100.0% |
| Single Unit, Attached | 0 | 0.0% |
| 2 Unit Apartments | 0 | 0.0% |
| 3 or 4 Unit Apartments | 0 | 0.0% |
| 5 to 9 Unit Apartments | 0 | 0.0% |
| 10 or more Apartments | 0 | 0.0% |
| Mobile Home / Other | 0 | 0.0% |
| Total | 600 | 100.0% |
Housing Structures by Occupancy in Redway
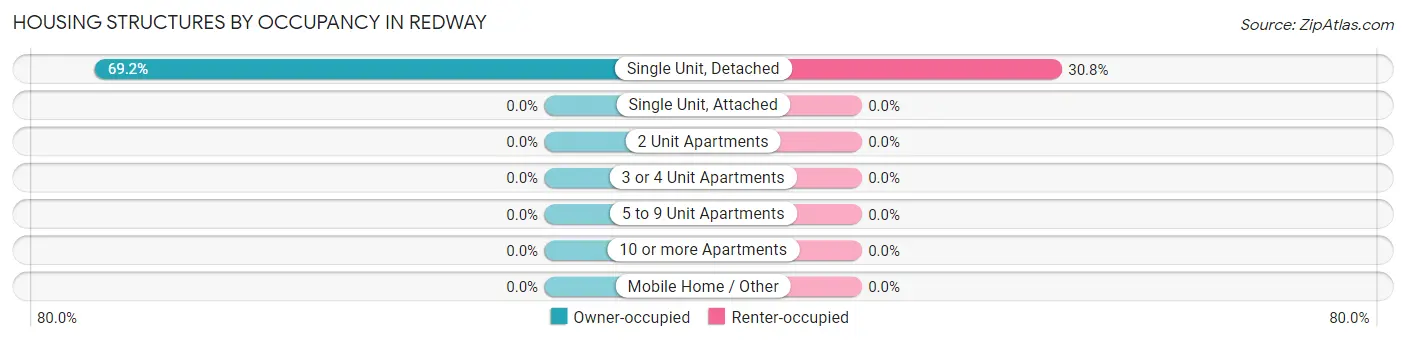
| Structure Type | Owner-occupied | Renter-occupied |
| Single Unit, Detached | 415 (69.2%) | 185 (30.8%) |
| Single Unit, Attached | 0 (0.0%) | 0 (0.0%) |
| 2 Unit Apartments | 0 (0.0%) | 0 (0.0%) |
| 3 or 4 Unit Apartments | 0 (0.0%) | 0 (0.0%) |
| 5 to 9 Unit Apartments | 0 (0.0%) | 0 (0.0%) |
| 10 or more Apartments | 0 (0.0%) | 0 (0.0%) |
| Mobile Home / Other | 0 (0.0%) | 0 (0.0%) |
| Total | 415 (69.2%) | 185 (30.8%) |
Housing Structures by Number of Rooms in Redway
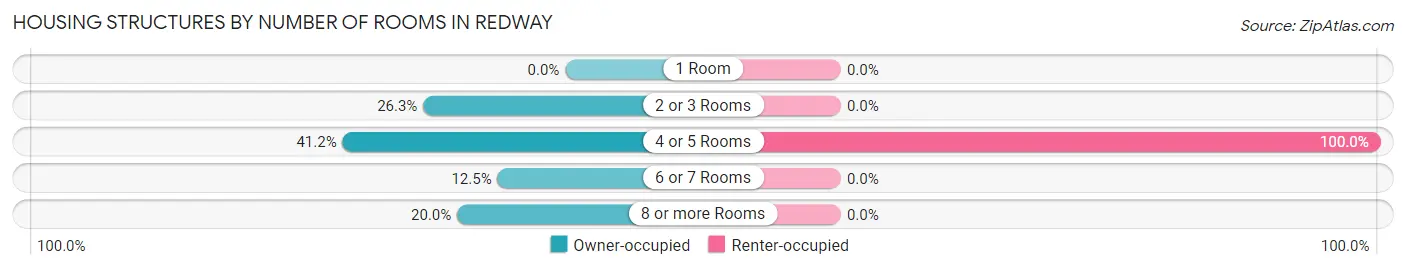
| Number of Rooms | Owner-occupied | Renter-occupied |
| 1 Room | 0 (0.0%) | 0 (0.0%) |
| 2 or 3 Rooms | 109 (26.3%) | 0 (0.0%) |
| 4 or 5 Rooms | 171 (41.2%) | 185 (100.0%) |
| 6 or 7 Rooms | 52 (12.5%) | 0 (0.0%) |
| 8 or more Rooms | 83 (20.0%) | 0 (0.0%) |
| Total | 415 (100.0%) | 185 (100.0%) |
Housing Structure by Heating Type in Redway
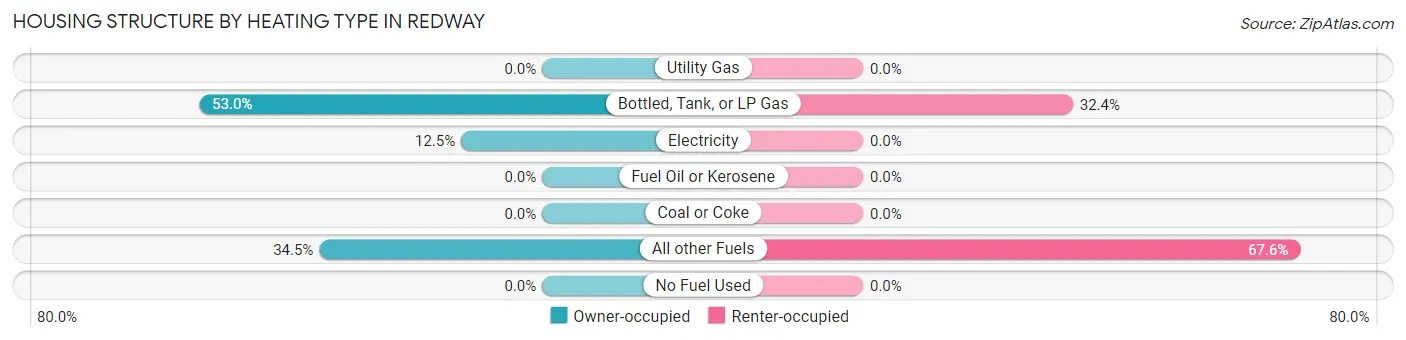
| Heating Type | Owner-occupied | Renter-occupied |
| Utility Gas | 0 (0.0%) | 0 (0.0%) |
| Bottled, Tank, or LP Gas | 220 (53.0%) | 60 (32.4%) |
| Electricity | 52 (12.5%) | 0 (0.0%) |
| Fuel Oil or Kerosene | 0 (0.0%) | 0 (0.0%) |
| Coal or Coke | 0 (0.0%) | 0 (0.0%) |
| All other Fuels | 143 (34.5%) | 125 (67.6%) |
| No Fuel Used | 0 (0.0%) | 0 (0.0%) |
| Total | 415 (100.0%) | 185 (100.0%) |
Household Vehicle Usage in Redway
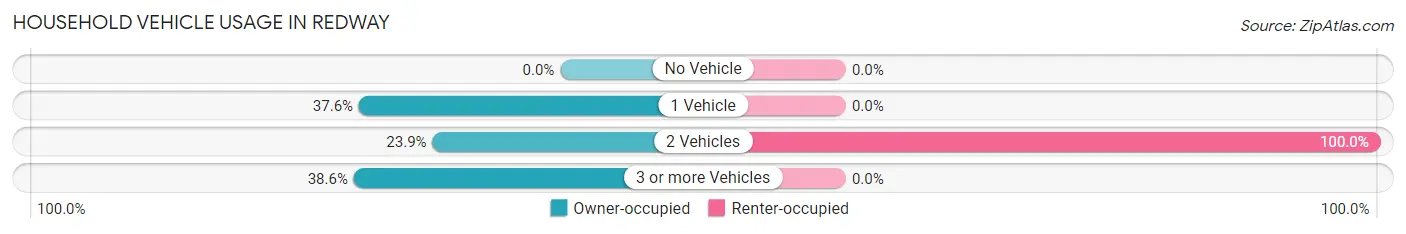
| Vehicles per Household | Owner-occupied | Renter-occupied |
| No Vehicle | 0 (0.0%) | 0 (0.0%) |
| 1 Vehicle | 156 (37.6%) | 0 (0.0%) |
| 2 Vehicles | 99 (23.9%) | 185 (100.0%) |
| 3 or more Vehicles | 160 (38.6%) | 0 (0.0%) |
| Total | 415 (100.0%) | 185 (100.0%) |
Real Estate & Mortgages in Redway
Real Estate and Mortgage Overview in Redway
| Characteristic | Without Mortgage | With Mortgage |
| Housing Units | 133 | 282 |
| Median Property Value | $556,700 | $347,700 |
| Median Household Income | $96,563 | $0 |
| Monthly Housing Costs | $582 | $54 |
| Real Estate Taxes | $2,672 | $0 |
Property Value by Mortgage Status in Redway
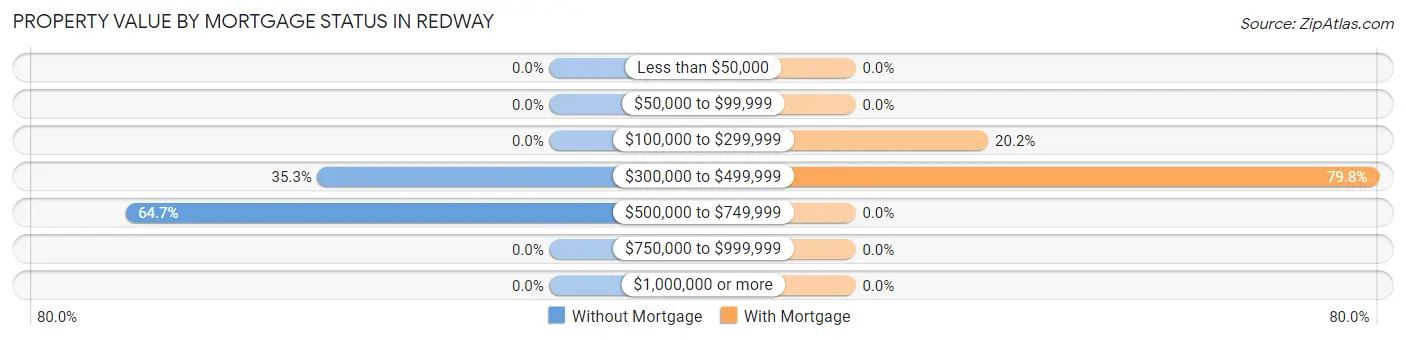
| Property Value | Without Mortgage | With Mortgage |
| Less than $50,000 | 0 (0.0%) | 0 (0.0%) |
| $50,000 to $99,999 | 0 (0.0%) | 0 (0.0%) |
| $100,000 to $299,999 | 0 (0.0%) | 57 (20.2%) |
| $300,000 to $499,999 | 47 (35.3%) | 225 (79.8%) |
| $500,000 to $749,999 | 86 (64.7%) | 0 (0.0%) |
| $750,000 to $999,999 | 0 (0.0%) | 0 (0.0%) |
| $1,000,000 or more | 0 (0.0%) | 0 (0.0%) |
| Total | 133 (100.0%) | 282 (100.0%) |
Household Income by Mortgage Status in Redway
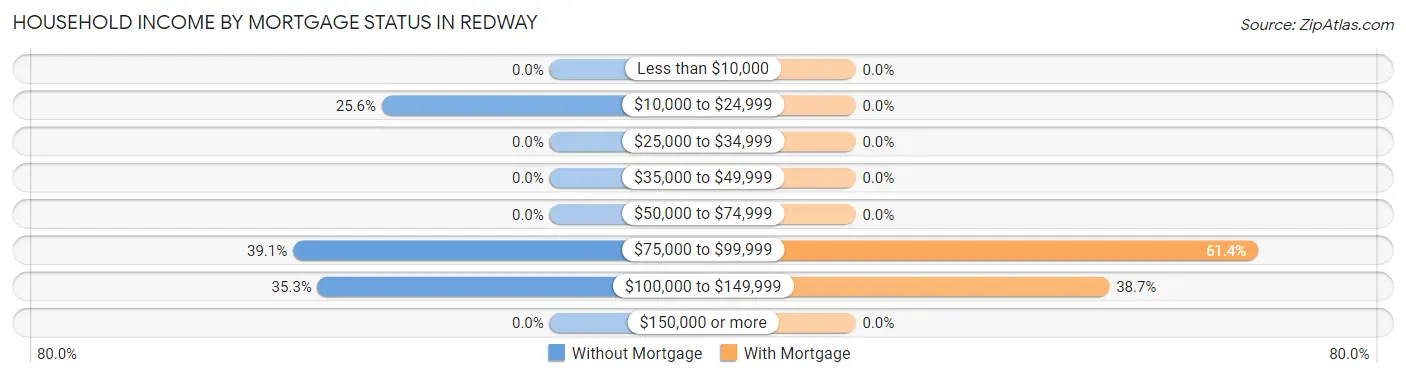
| Household Income | Without Mortgage | With Mortgage |
| Less than $10,000 | 0 (0.0%) | 0 (0.0%) |
| $10,000 to $24,999 | 34 (25.6%) | 0 (0.0%) |
| $25,000 to $34,999 | 0 (0.0%) | 0 (0.0%) |
| $35,000 to $49,999 | 0 (0.0%) | 0 (0.0%) |
| $50,000 to $74,999 | 0 (0.0%) | 0 (0.0%) |
| $75,000 to $99,999 | 52 (39.1%) | 173 (61.4%) |
| $100,000 to $149,999 | 47 (35.3%) | 109 (38.7%) |
| $150,000 or more | 0 (0.0%) | 0 (0.0%) |
| Total | 133 (100.0%) | 282 (100.0%) |
Property Value to Household Income Ratio in Redway
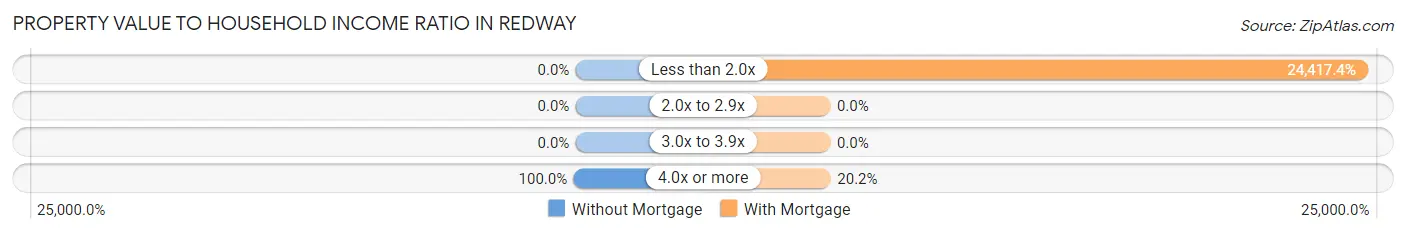
| Value-to-Income Ratio | Without Mortgage | With Mortgage |
| Less than 2.0x | 0 (0.0%) | 68,857 (24,417.4%) |
| 2.0x to 2.9x | 0 (0.0%) | 0 (0.0%) |
| 3.0x to 3.9x | 0 (0.0%) | 0 (0.0%) |
| 4.0x or more | 133 (100.0%) | 57 (20.2%) |
| Total | 133 (100.0%) | 282 (100.0%) |
Real Estate Taxes by Mortgage Status in Redway
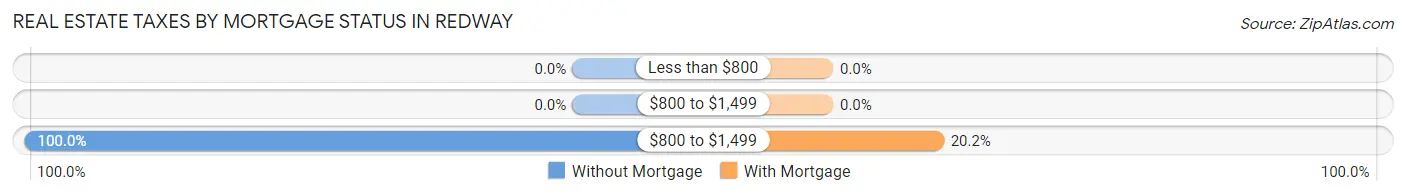
| Property Taxes | Without Mortgage | With Mortgage |
| Less than $800 | 0 (0.0%) | 0 (0.0%) |
| $800 to $1,499 | 0 (0.0%) | 0 (0.0%) |
| $800 to $1,499 | 133 (100.0%) | 57 (20.2%) |
| Total | 133 (100.0%) | 282 (100.0%) |
Health & Disability in Redway
Health Insurance Coverage by Age in Redway
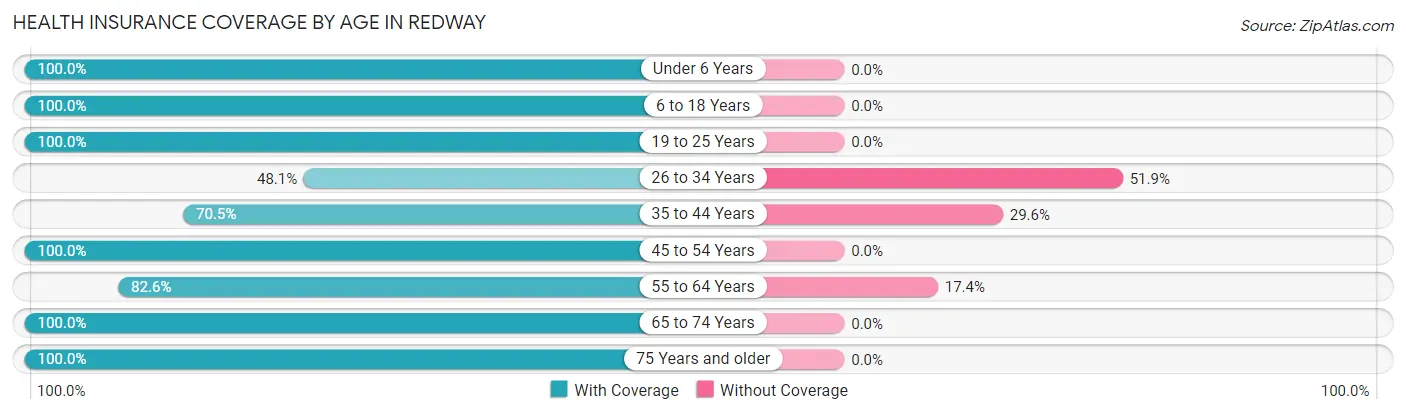
| Age Bracket | With Coverage | Without Coverage |
| Under 6 Years | 206 (100.0%) | 0 (0.0%) |
| 6 to 18 Years | 47 (100.0%) | 0 (0.0%) |
| 19 to 25 Years | 88 (100.0%) | 0 (0.0%) |
| 26 to 34 Years | 50 (48.1%) | 54 (51.9%) |
| 35 to 44 Years | 124 (70.5%) | 52 (29.5%) |
| 45 to 54 Years | 129 (100.0%) | 0 (0.0%) |
| 55 to 64 Years | 161 (82.6%) | 34 (17.4%) |
| 65 to 74 Years | 226 (100.0%) | 0 (0.0%) |
| 75 Years and older | 86 (100.0%) | 0 (0.0%) |
| Total | 1,117 (88.9%) | 140 (11.1%) |
Health Insurance Coverage by Citizenship Status in Redway
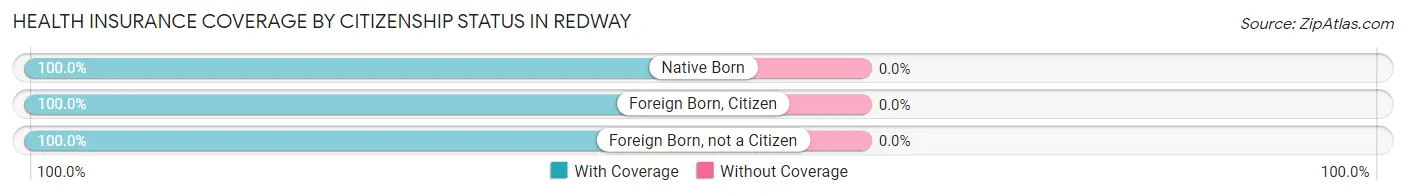
| Citizenship Status | With Coverage | Without Coverage |
| Native Born | 206 (100.0%) | 0 (0.0%) |
| Foreign Born, Citizen | 47 (100.0%) | 0 (0.0%) |
| Foreign Born, not a Citizen | 88 (100.0%) | 0 (0.0%) |
Health Insurance Coverage by Household Income in Redway
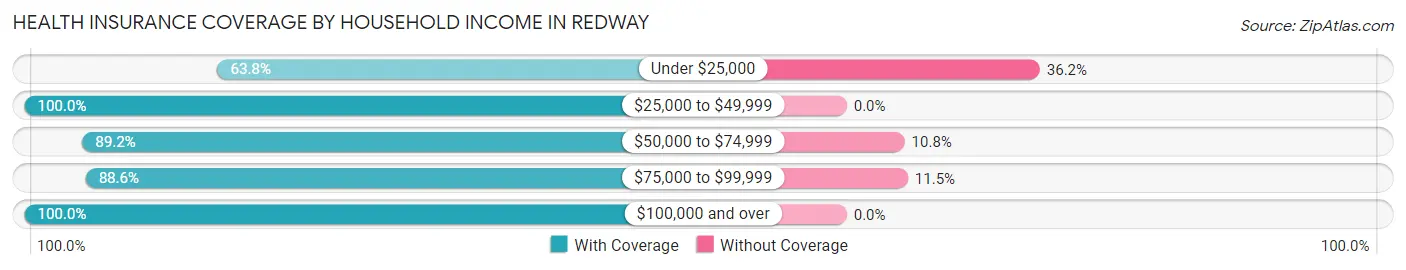
| Household Income | With Coverage | Without Coverage |
| Under $25,000 | 60 (63.8%) | 34 (36.2%) |
| $25,000 to $49,999 | 125 (100.0%) | 0 (0.0%) |
| $50,000 to $74,999 | 444 (89.2%) | 54 (10.8%) |
| $75,000 to $99,999 | 402 (88.5%) | 52 (11.5%) |
| $100,000 and over | 86 (100.0%) | 0 (0.0%) |
Public vs Private Health Insurance Coverage by Age in Redway
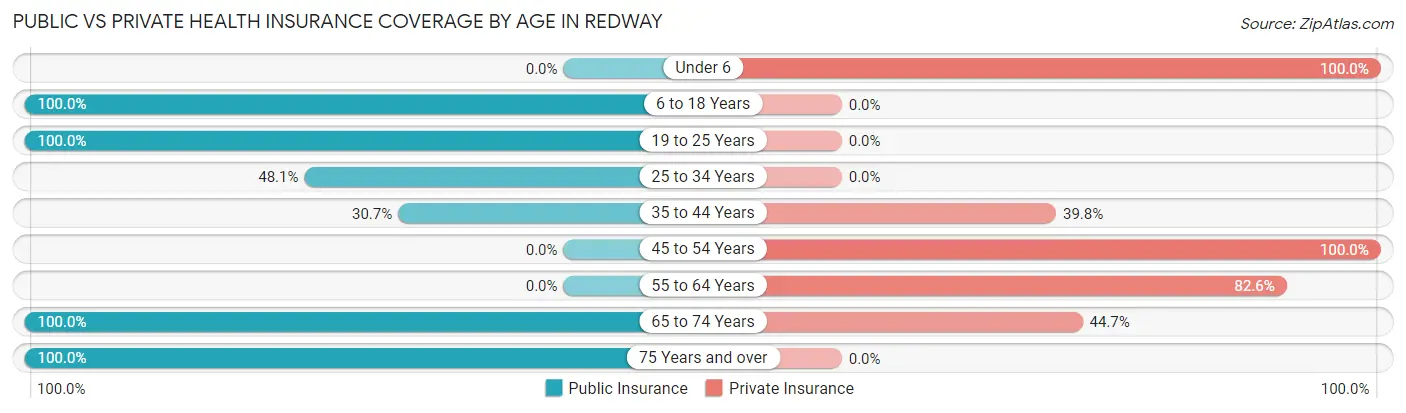
| Age Bracket | Public Insurance | Private Insurance |
| Under 6 | 0 (0.0%) | 206 (100.0%) |
| 6 to 18 Years | 47 (100.0%) | 0 (0.0%) |
| 19 to 25 Years | 88 (100.0%) | 0 (0.0%) |
| 25 to 34 Years | 50 (48.1%) | 0 (0.0%) |
| 35 to 44 Years | 54 (30.7%) | 70 (39.8%) |
| 45 to 54 Years | 0 (0.0%) | 129 (100.0%) |
| 55 to 64 Years | 0 (0.0%) | 161 (82.6%) |
| 65 to 74 Years | 226 (100.0%) | 101 (44.7%) |
| 75 Years and over | 86 (100.0%) | 0 (0.0%) |
| Total | 551 (43.8%) | 667 (53.1%) |
Disability Status by Sex by Age in Redway
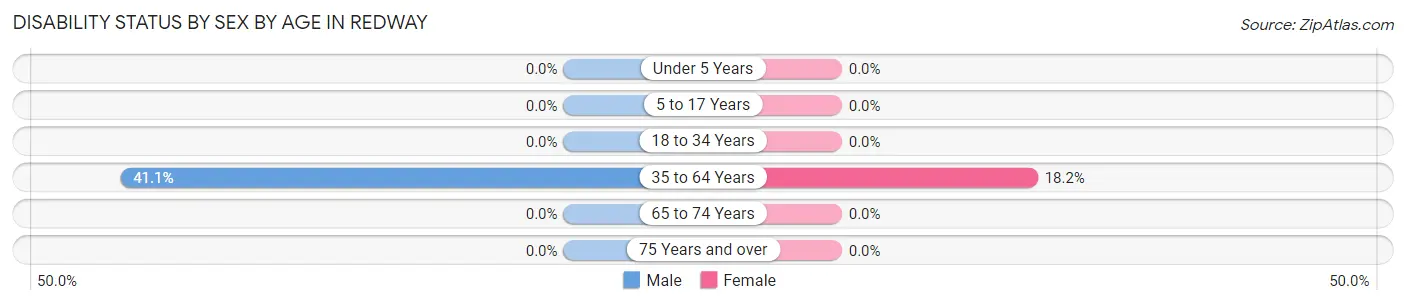
| Age Bracket | Male | Female |
| Under 5 Years | 0 (0.0%) | 0 (0.0%) |
| 5 to 17 Years | 0 (0.0%) | 0 (0.0%) |
| 18 to 34 Years | 0 (0.0%) | 0 (0.0%) |
| 35 to 64 Years | 88 (41.1%) | 52 (18.2%) |
| 65 to 74 Years | 0 (0.0%) | 0 (0.0%) |
| 75 Years and over | 0 (0.0%) | 0 (0.0%) |
Disability Class by Sex by Age in Redway
Disability Class: Hearing Difficulty
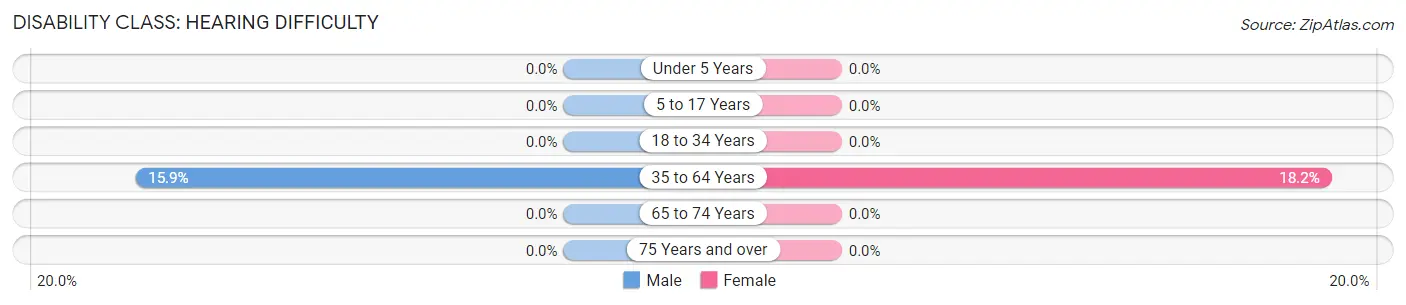
| Age Bracket | Male | Female |
| Under 5 Years | 0 (0.0%) | 0 (0.0%) |
| 5 to 17 Years | 0 (0.0%) | 0 (0.0%) |
| 18 to 34 Years | 0 (0.0%) | 0 (0.0%) |
| 35 to 64 Years | 34 (15.9%) | 52 (18.2%) |
| 65 to 74 Years | 0 (0.0%) | 0 (0.0%) |
| 75 Years and over | 0 (0.0%) | 0 (0.0%) |
Disability Class: Vision Difficulty
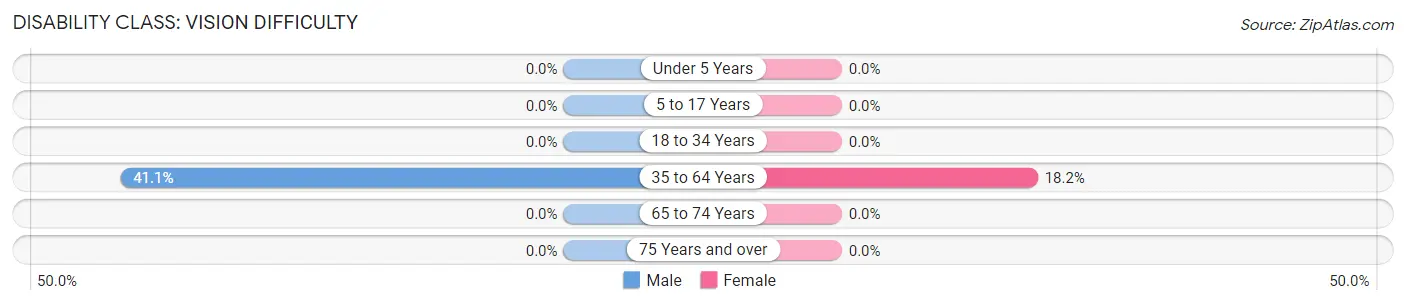
| Age Bracket | Male | Female |
| Under 5 Years | 0 (0.0%) | 0 (0.0%) |
| 5 to 17 Years | 0 (0.0%) | 0 (0.0%) |
| 18 to 34 Years | 0 (0.0%) | 0 (0.0%) |
| 35 to 64 Years | 88 (41.1%) | 52 (18.2%) |
| 65 to 74 Years | 0 (0.0%) | 0 (0.0%) |
| 75 Years and over | 0 (0.0%) | 0 (0.0%) |
Disability Class: Cognitive Difficulty
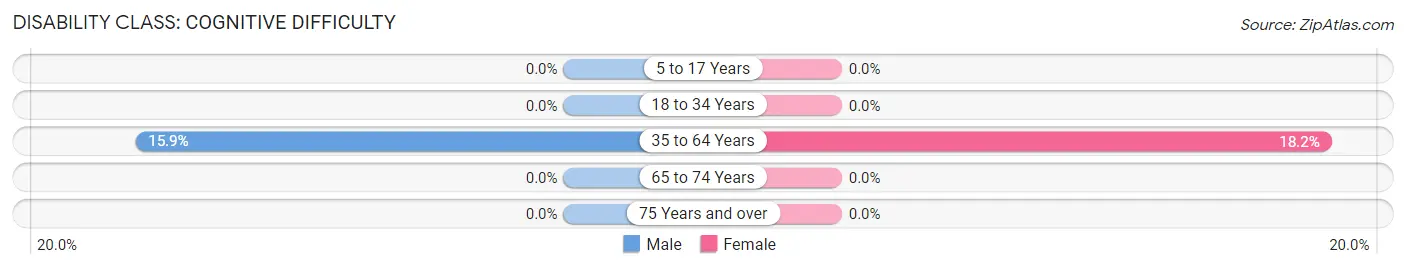
| Age Bracket | Male | Female |
| 5 to 17 Years | 0 (0.0%) | 0 (0.0%) |
| 18 to 34 Years | 0 (0.0%) | 0 (0.0%) |
| 35 to 64 Years | 34 (15.9%) | 52 (18.2%) |
| 65 to 74 Years | 0 (0.0%) | 0 (0.0%) |
| 75 Years and over | 0 (0.0%) | 0 (0.0%) |
Disability Class: Ambulatory Difficulty
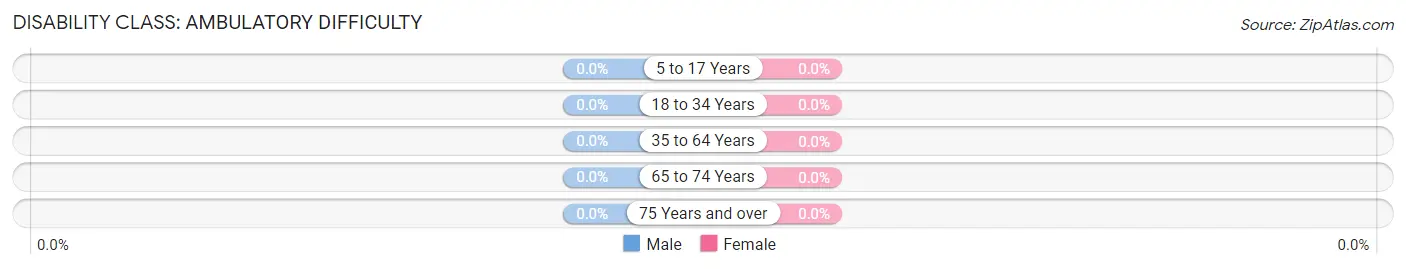
| Age Bracket | Male | Female |
| 5 to 17 Years | 0 (0.0%) | 0 (0.0%) |
| 18 to 34 Years | 0 (0.0%) | 0 (0.0%) |
| 35 to 64 Years | 0 (0.0%) | 0 (0.0%) |
| 65 to 74 Years | 0 (0.0%) | 0 (0.0%) |
| 75 Years and over | 0 (0.0%) | 0 (0.0%) |
Disability Class: Self-Care Difficulty
| Age Bracket | Male | Female |
| 5 to 17 Years | 0 (0.0%) | 0 (0.0%) |
| 18 to 34 Years | 0 (0.0%) | 0 (0.0%) |
| 35 to 64 Years | 0 (0.0%) | 0 (0.0%) |
| 65 to 74 Years | 0 (0.0%) | 0 (0.0%) |
| 75 Years and over | 0 (0.0%) | 0 (0.0%) |
Technology Access in Redway
Computing Device Access in Redway
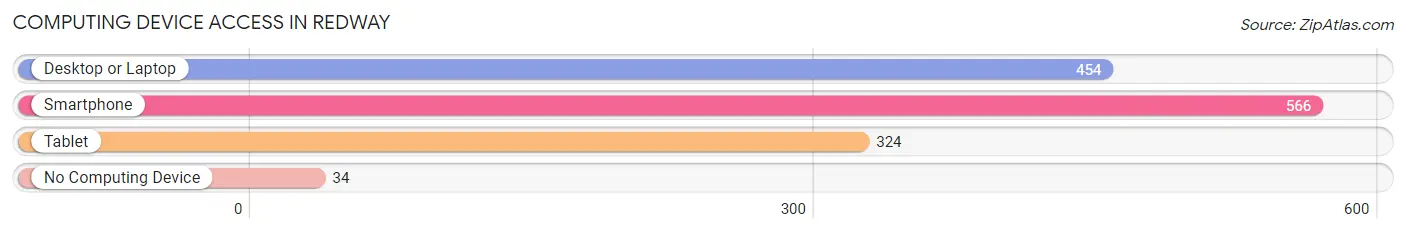
| Device Type | # Households | % Households |
| Desktop or Laptop | 454 | 75.7% |
| Smartphone | 566 | 94.3% |
| Tablet | 324 | 54.0% |
| No Computing Device | 34 | 5.7% |
| Total | 600 | 100.0% |
Internet Access in Redway
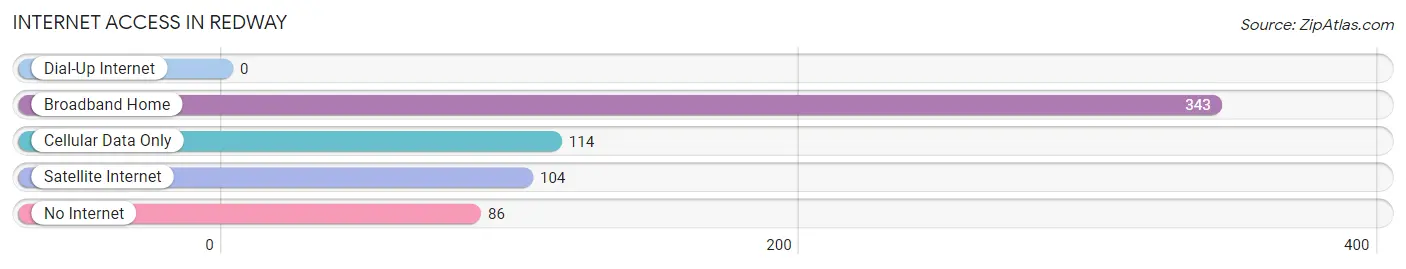
| Internet Type | # Households | % Households |
| Dial-Up Internet | 0 | 0.0% |
| Broadband Home | 343 | 57.2% |
| Cellular Data Only | 114 | 19.0% |
| Satellite Internet | 104 | 17.3% |
| No Internet | 86 | 14.3% |
| Total | 600 | 100.0% |
Redway Summary
Redway is a small unincorporated community located in Humboldt County, California. It is situated in the Eel River Valley, approximately 10 miles south of Garberville and 15 miles north of the town of Miranda. Redway is a rural community with a population of approximately 1,000 people.
History
The area that is now Redway was originally inhabited by the Wiyot people, who lived in the area for thousands of years before the arrival of European settlers. The first European settlers arrived in the area in the 1850s, and the town of Redway was officially established in 1876. The town was named after the redwood trees that grew in the area.
In the early 1900s, Redway was a bustling logging town, with several sawmills and lumber companies operating in the area. The town also had a thriving agricultural industry, with many farmers growing apples, pears, and other fruits and vegetables.
In the 1950s, Redway began to decline as the logging industry moved away from the area. The town was further impacted by the construction of the Eel River Dam in the 1960s, which flooded much of the surrounding area.
Geography
Redway is located in the Eel River Valley, approximately 10 miles south of Garberville and 15 miles north of the town of Miranda. The town is situated at an elevation of approximately 500 feet above sea level.
The climate in Redway is mild and temperate, with average temperatures ranging from the mid-50s in the winter to the mid-70s in the summer. The area receives an average of 40 inches of rain per year.
Economy
Redway’s economy is largely based on agriculture and tourism. The town is home to several farms that grow apples, pears, and other fruits and vegetables. The area also has several wineries and breweries, as well as a number of restaurants and shops.
Tourism is an important part of the local economy, with many visitors coming to the area to enjoy the natural beauty of the Eel River Valley. The town is also home to several outdoor recreation areas, including the Redwood National and State Parks.
Demographics
As of the 2010 census, Redway had a population of 1,000 people. The racial makeup of the town was 87.2% White, 0.7% African American, 0.7% Native American, 0.7% Asian, 0.3% Pacific Islander, and 10.1% from other races. The median household income in Redway was $37,500, and the median age was 44.
Redway is a small, rural community with a strong sense of community and a commitment to preserving its natural beauty. The town is home to a diverse population of people from all walks of life, and it is a great place to live, work, and play.
Common Questions
What is Per Capita Income in Redway?
Per Capita income in Redway is $28,323.
What is the Median Family Income in Redway?
Median Family Income in Redway is $93,246.
What is the Median Household income in Redway?
Median Household Income in Redway is $66,378.
What is Inequality or Gini Index in Redway?
Inequality or Gini Index in Redway is 0.32.
What is the Total Population of Redway?
Total Population of Redway is 1,257.
What is the Total Male Population of Redway?
Total Male Population of Redway is 487.
What is the Total Female Population of Redway?
Total Female Population of Redway is 770.
What is the Ratio of Males per 100 Females in Redway?
There are 63.25 Males per 100 Females in Redway.
What is the Ratio of Females per 100 Males in Redway?
There are 158.11 Females per 100 Males in Redway.
What is the Median Population Age in Redway?
Median Population Age in Redway is 46.1 Years.
What is the Average Family Size in Redway
Average Family Size in Redway is 2.7 People.
What is the Average Household Size in Redway
Average Household Size in Redway is 2.1 People.
How Large is the Labor Force in Redway?
There are 606 People in the Labor Forcein in Redway.
What is the Percentage of People in the Labor Force in Redway?
60.4% of People are in the Labor Force in Redway.