Ramona, CA Map & Demographics
Ramona Map
Ramona Overview
$41,156
PER CAPITA INCOME
$111,849
AVG FAMILY INCOME
$104,649
AVG HOUSEHOLD INCOME
26.9%
WAGE / INCOME GAP [ % ]
73.1¢/ $1
WAGE / INCOME GAP [ $ ]
$6,145
FAMILY INCOME DEFICIT
0.42
INEQUALITY / GINI INDEX
22,118
TOTAL POPULATION
11,393
MALE POPULATION
10,725
FEMALE POPULATION
106.23
MALES / 100 FEMALES
94.14
FEMALES / 100 MALES
38.2
MEDIAN AGE
3.5
AVG FAMILY SIZE
3.1
AVG HOUSEHOLD SIZE
11,936
LABOR FORCE [ PEOPLE ]
67.6%
PERCENT IN LABOR FORCE
3.8%
UNEMPLOYMENT RATE
Ramona Zip Codes
Ramona Area Codes
Income in Ramona
Income Overview in Ramona
Per Capita Income in Ramona is $41,156, while median incomes of families and households are $111,849 and $104,649 respectively.
| Characteristic | Number | Measure |
| Per Capita Income | 22,118 | $41,156 |
| Median Family Income | 5,281 | $111,849 |
| Mean Family Income | 5,281 | $136,529 |
| Median Household Income | 7,162 | $104,649 |
| Mean Household Income | 7,162 | $121,879 |
| Income Deficit | 5,281 | $6,145 |
| Wage / Income Gap (%) | 22,118 | 26.90% |
| Wage / Income Gap ($) | 22,118 | 73.10¢ per $1 |
| Gini / Inequality Index | 22,118 | 0.42 |
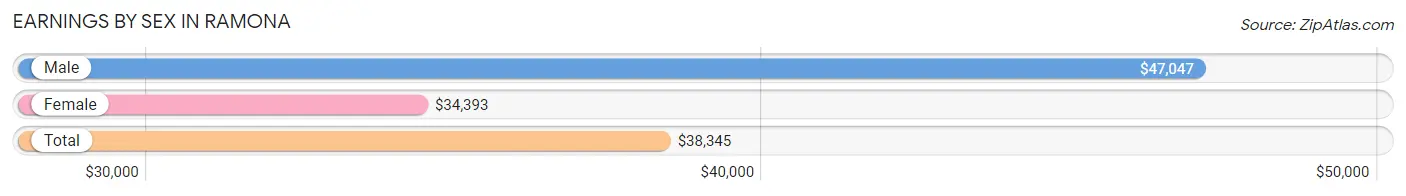
Earnings by Sex in Ramona
Average Earnings in Ramona are $38,345, $47,047 for men and $34,393 for women, a difference of 26.9%.
| Sex | Number | Average Earnings |
| Male | 6,628 (54.3%) | $47,047 |
| Female | 5,573 (45.7%) | $34,393 |
| Total | 12,201 (100.0%) | $38,345 |
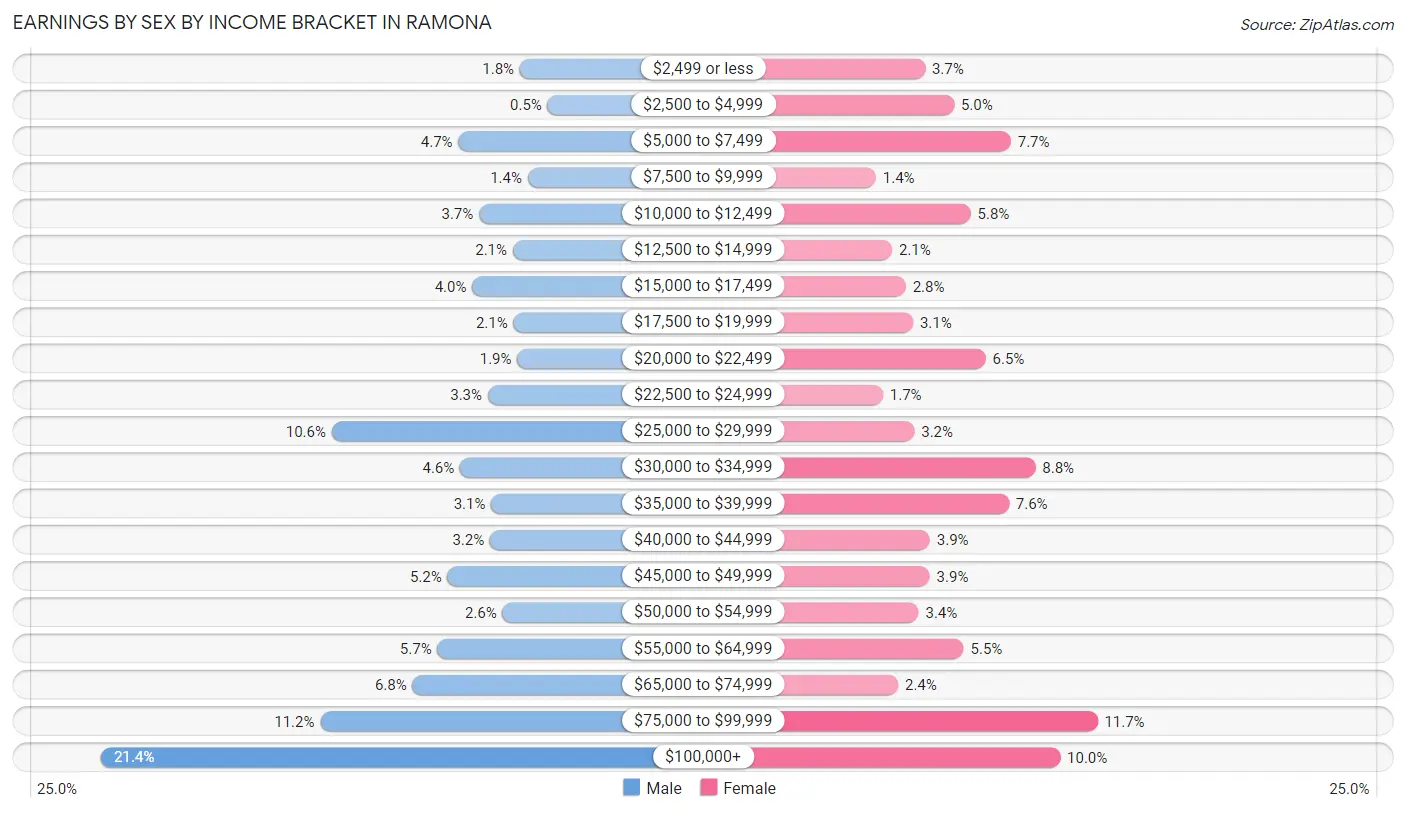
Earnings by Sex by Income Bracket in Ramona
The most common earnings brackets in Ramona are $100,000+ for men (1,420 | 21.4%) and $75,000 to $99,999 for women (654 | 11.7%).
| Income | Male | Female |
| $2,499 or less | 119 (1.8%) | 204 (3.7%) |
| $2,500 to $4,999 | 33 (0.5%) | 280 (5.0%) |
| $5,000 to $7,499 | 310 (4.7%) | 428 (7.7%) |
| $7,500 to $9,999 | 95 (1.4%) | 76 (1.4%) |
| $10,000 to $12,499 | 246 (3.7%) | 323 (5.8%) |
| $12,500 to $14,999 | 141 (2.1%) | 118 (2.1%) |
| $15,000 to $17,499 | 267 (4.0%) | 154 (2.8%) |
| $17,500 to $19,999 | 139 (2.1%) | 173 (3.1%) |
| $20,000 to $22,499 | 127 (1.9%) | 362 (6.5%) |
| $22,500 to $24,999 | 219 (3.3%) | 94 (1.7%) |
| $25,000 to $29,999 | 703 (10.6%) | 176 (3.2%) |
| $30,000 to $34,999 | 305 (4.6%) | 492 (8.8%) |
| $35,000 to $39,999 | 208 (3.1%) | 423 (7.6%) |
| $40,000 to $44,999 | 212 (3.2%) | 217 (3.9%) |
| $45,000 to $49,999 | 344 (5.2%) | 216 (3.9%) |
| $50,000 to $54,999 | 173 (2.6%) | 187 (3.4%) |
| $55,000 to $64,999 | 375 (5.7%) | 305 (5.5%) |
| $65,000 to $74,999 | 453 (6.8%) | 134 (2.4%) |
| $75,000 to $99,999 | 739 (11.2%) | 654 (11.7%) |
| $100,000+ | 1,420 (21.4%) | 557 (10.0%) |
| Total | 6,628 (100.0%) | 5,573 (100.0%) |
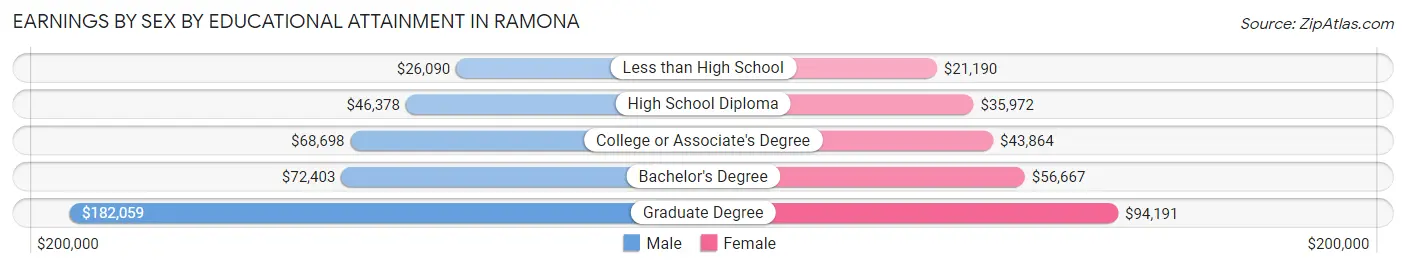
Earnings by Sex by Educational Attainment in Ramona
Average earnings in Ramona are $58,167 for men and $38,964 for women, a difference of 33.0%. Men with an educational attainment of graduate degree enjoy the highest average annual earnings of $182,059, while those with less than high school education earn the least with $26,090. Women with an educational attainment of graduate degree earn the most with the average annual earnings of $94,191, while those with less than high school education have the smallest earnings of $21,190.
| Educational Attainment | Male Income | Female Income |
| Less than High School | $26,090 | $21,190 |
| High School Diploma | $46,378 | $35,972 |
| College or Associate's Degree | $68,698 | $43,864 |
| Bachelor's Degree | $72,403 | $56,667 |
| Graduate Degree | $182,059 | $94,191 |
| Total | $58,167 | $38,964 |
Family Income in Ramona
Family Income Brackets in Ramona
According to the Ramona family income data, there are 1,204 families falling into the $100,000 to $149,999 income range, which is the most common income bracket and makes up 22.8% of all families.
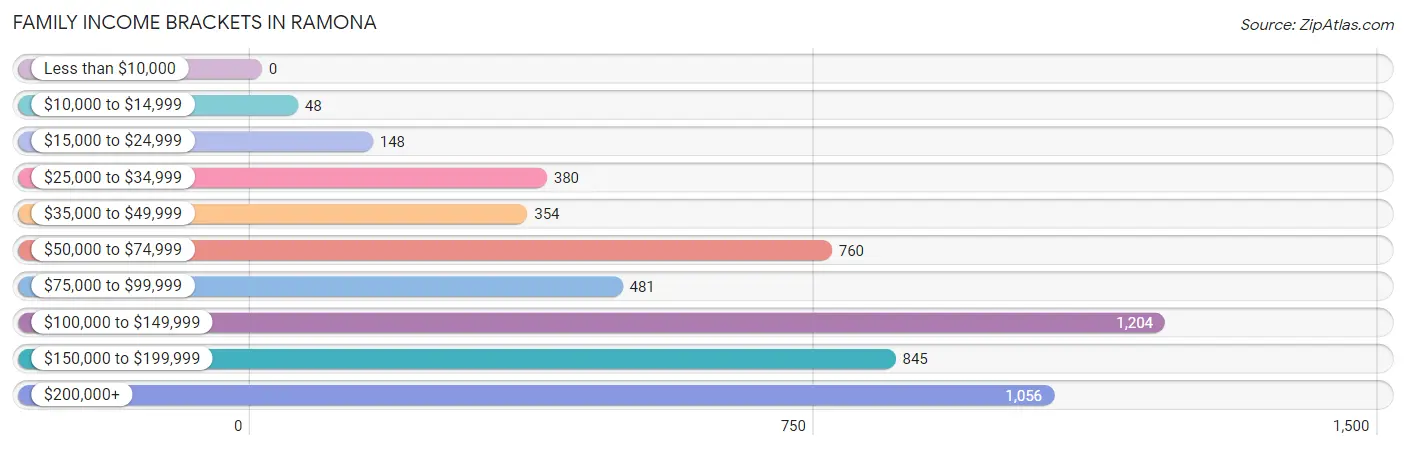
| Income Bracket | # Families | % Families |
| Less than $10,000 | 0 | 0.0% |
| $10,000 to $14,999 | 48 | 0.9% |
| $15,000 to $24,999 | 148 | 2.8% |
| $25,000 to $34,999 | 380 | 7.2% |
| $35,000 to $49,999 | 354 | 6.7% |
| $50,000 to $74,999 | 760 | 14.4% |
| $75,000 to $99,999 | 481 | 9.1% |
| $100,000 to $149,999 | 1,204 | 22.8% |
| $150,000 to $199,999 | 845 | 16.0% |
| $200,000+ | 1,056 | 20.0% |
Family Income by Famaliy Size in Ramona
5-person families (517 | 9.8%) account for the highest median family income in Ramona with $145,125 per family, while 2-person families (2,193 | 41.5%) have the highest median income of $52,644 per family member.
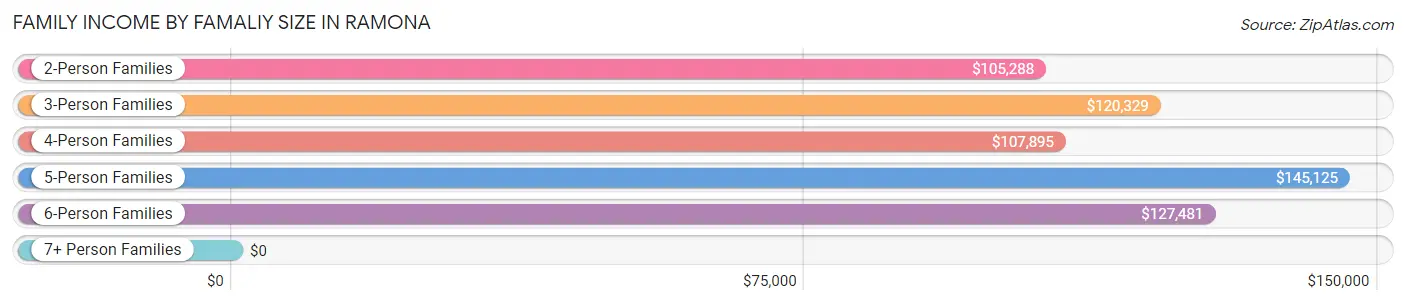
| Income Bracket | # Families | Median Income |
| 2-Person Families | 2,193 (41.5%) | $105,288 |
| 3-Person Families | 1,109 (21.0%) | $120,329 |
| 4-Person Families | 974 (18.4%) | $107,895 |
| 5-Person Families | 517 (9.8%) | $145,125 |
| 6-Person Families | 257 (4.9%) | $127,481 |
| 7+ Person Families | 231 (4.4%) | $0 |
| Total | 5,281 (100.0%) | $111,849 |
Family Income by Number of Earners in Ramona
The median family income in Ramona is $111,849, with families comprising 2 earners (2,392) having the highest median family income of $142,000, while families with no earners (494) have the lowest median family income of $55,242, accounting for 45.3% and 9.3% of families, respectively.
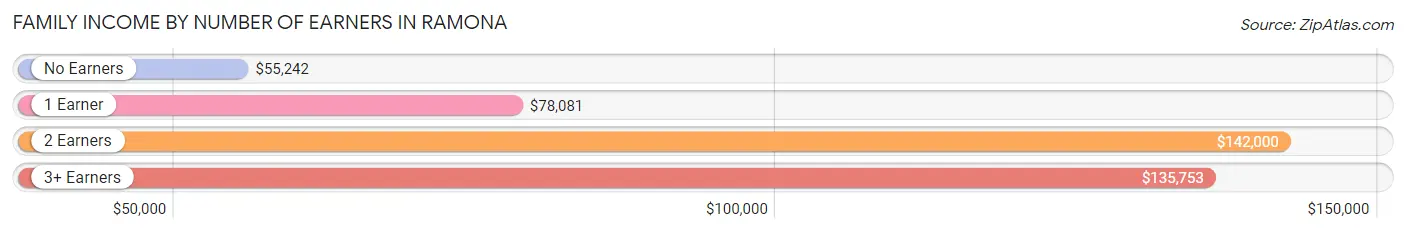
| Number of Earners | # Families | Median Income |
| No Earners | 494 (9.3%) | $55,242 |
| 1 Earner | 1,495 (28.3%) | $78,081 |
| 2 Earners | 2,392 (45.3%) | $142,000 |
| 3+ Earners | 900 (17.0%) | $135,753 |
| Total | 5,281 (100.0%) | $111,849 |
Household Income in Ramona
Household Income Brackets in Ramona
With 1,454 households falling in the category, the $100,000 to $149,999 income range is the most frequent in Ramona, accounting for 20.3% of all households. In contrast, only 64 households (0.9%) fall into the less than $10,000 income bracket, making it the least populous group.
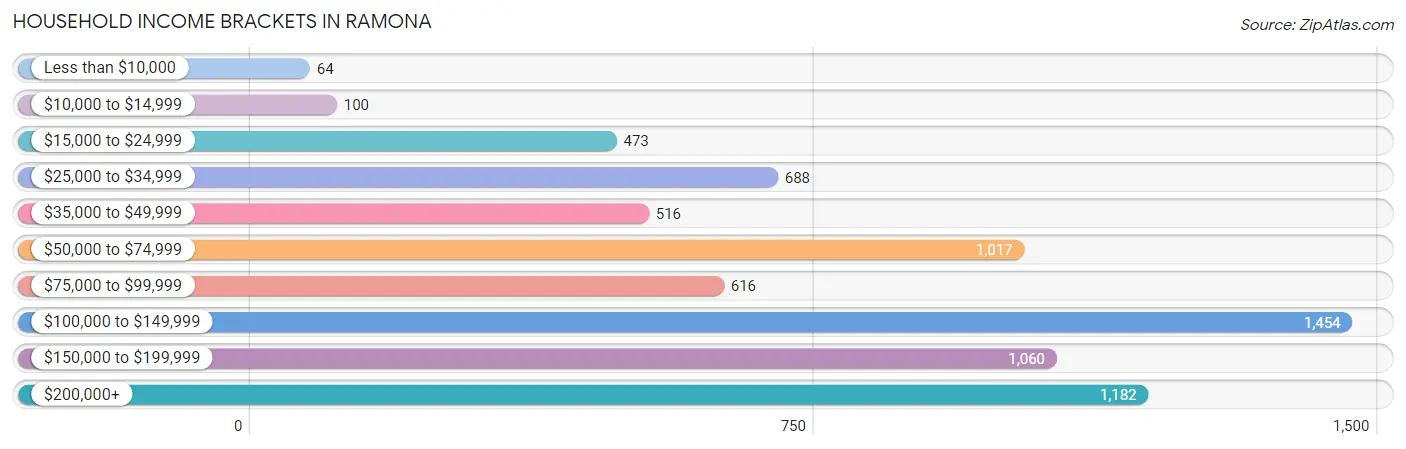
| Income Bracket | # Households | % Households |
| Less than $10,000 | 64 | 0.9% |
| $10,000 to $14,999 | 100 | 1.4% |
| $15,000 to $24,999 | 473 | 6.6% |
| $25,000 to $34,999 | 688 | 9.6% |
| $35,000 to $49,999 | 516 | 7.2% |
| $50,000 to $74,999 | 1,017 | 14.2% |
| $75,000 to $99,999 | 616 | 8.6% |
| $100,000 to $149,999 | 1,454 | 20.3% |
| $150,000 to $199,999 | 1,060 | 14.8% |
| $200,000+ | 1,182 | 16.5% |
Household Income by Householder Age in Ramona
The median household income in Ramona is $104,649, with the highest median household income of $133,611 found in the 45 to 64 years age bracket for the primary householder. A total of 2,926 households (40.8%) fall into this category. Meanwhile, the 15 to 24 years age bracket for the primary householder has the lowest median household income of $52,532, with 251 households (3.5%) in this group.
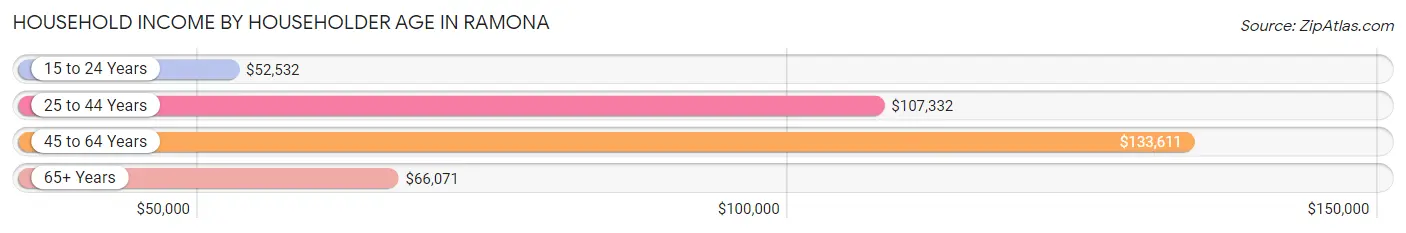
| Income Bracket | # Households | Median Income |
| 15 to 24 Years | 251 (3.5%) | $52,532 |
| 25 to 44 Years | 2,149 (30.0%) | $107,332 |
| 45 to 64 Years | 2,926 (40.8%) | $133,611 |
| 65+ Years | 1,836 (25.6%) | $66,071 |
| Total | 7,162 (100.0%) | $104,649 |
Poverty in Ramona
Income Below Poverty by Sex and Age in Ramona
With 5.2% poverty level for males and 5.8% for females among the residents of Ramona, 5 year old males and 6 to 11 year old females are the most vulnerable to poverty, with 64 males (70.3%) and 57 females (15.5%) in their respective age groups living below the poverty level.
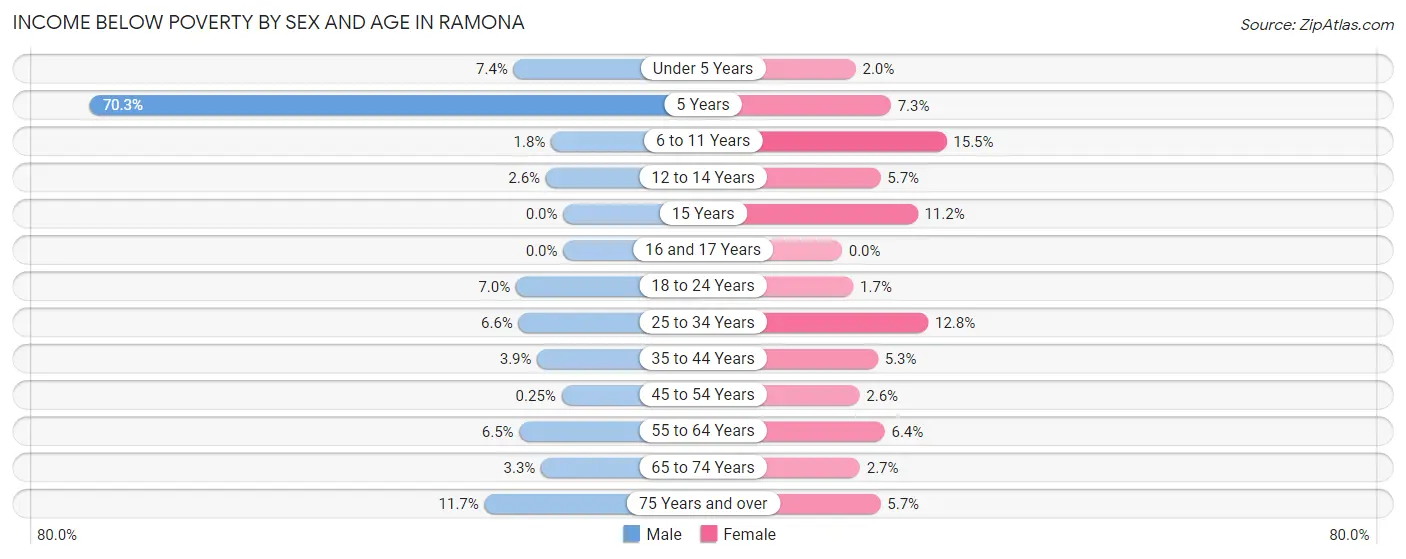
| Age Bracket | Male | Female |
| Under 5 Years | 57 (7.4%) | 10 (2.0%) |
| 5 Years | 64 (70.3%) | 13 (7.3%) |
| 6 to 11 Years | 20 (1.8%) | 57 (15.5%) |
| 12 to 14 Years | 14 (2.6%) | 30 (5.7%) |
| 15 Years | 0 (0.0%) | 28 (11.2%) |
| 16 and 17 Years | 0 (0.0%) | 0 (0.0%) |
| 18 to 24 Years | 79 (7.0%) | 20 (1.7%) |
| 25 to 34 Years | 110 (6.6%) | 185 (12.8%) |
| 35 to 44 Years | 51 (3.9%) | 78 (5.3%) |
| 45 to 54 Years | 4 (0.3%) | 34 (2.6%) |
| 55 to 64 Years | 97 (6.5%) | 94 (6.4%) |
| 65 to 74 Years | 28 (3.3%) | 28 (2.7%) |
| 75 Years and over | 69 (11.7%) | 44 (5.7%) |
| Total | 593 (5.2%) | 621 (5.8%) |
Income Above Poverty by Sex and Age in Ramona
According to the poverty statistics in Ramona, males aged 15 years and females aged 16 and 17 years are the age groups that are most secure financially, with 100.0% of males and 100.0% of females in these age groups living above the poverty line.
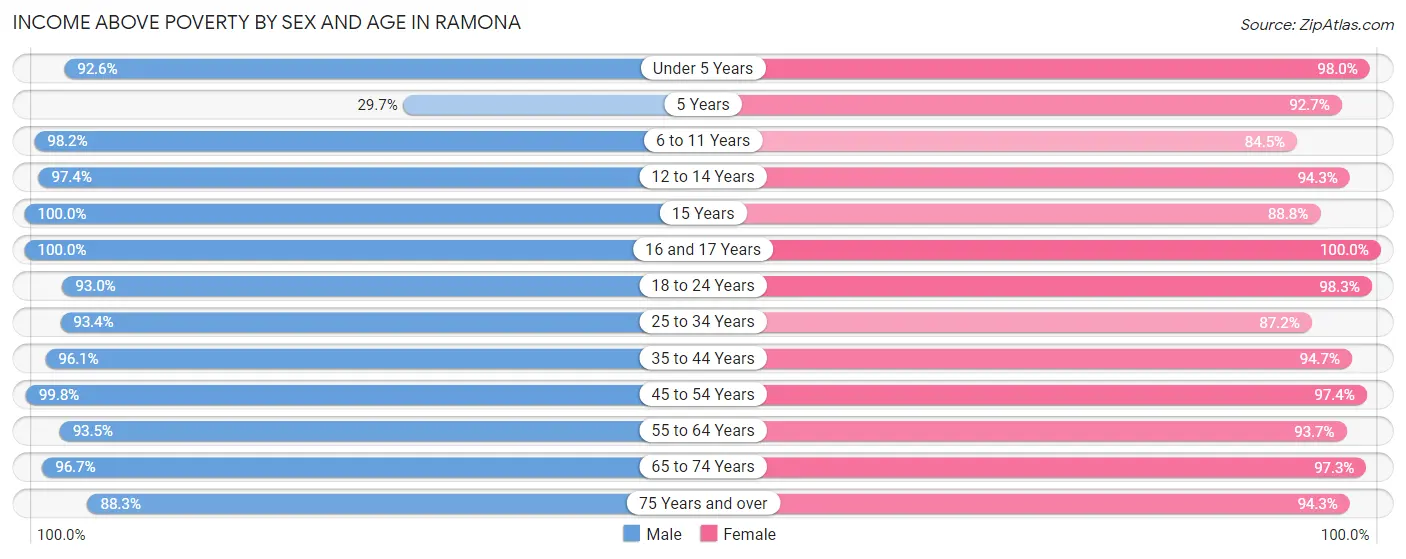
| Age Bracket | Male | Female |
| Under 5 Years | 716 (92.6%) | 479 (98.0%) |
| 5 Years | 27 (29.7%) | 166 (92.7%) |
| 6 to 11 Years | 1,092 (98.2%) | 310 (84.5%) |
| 12 to 14 Years | 527 (97.4%) | 494 (94.3%) |
| 15 Years | 41 (100.0%) | 221 (88.8%) |
| 16 and 17 Years | 143 (100.0%) | 199 (100.0%) |
| 18 to 24 Years | 1,047 (93.0%) | 1,165 (98.3%) |
| 25 to 34 Years | 1,548 (93.4%) | 1,259 (87.2%) |
| 35 to 44 Years | 1,269 (96.1%) | 1,383 (94.7%) |
| 45 to 54 Years | 1,585 (99.8%) | 1,270 (97.4%) |
| 55 to 64 Years | 1,391 (93.5%) | 1,386 (93.6%) |
| 65 to 74 Years | 822 (96.7%) | 1,021 (97.3%) |
| 75 Years and over | 521 (88.3%) | 724 (94.3%) |
| Total | 10,729 (94.8%) | 10,077 (94.2%) |
Income Below Poverty Among Married-Couple Families in Ramona
The poverty statistics for married-couple families in Ramona show that 3.0% or 122 of the total 4,128 families live below the poverty line. Families with 3 or 4 children have the highest poverty rate of 16.9%, comprising of 65 families. On the other hand, families with 5 or more children have the lowest poverty rate of 0.0%, which includes 0 families.
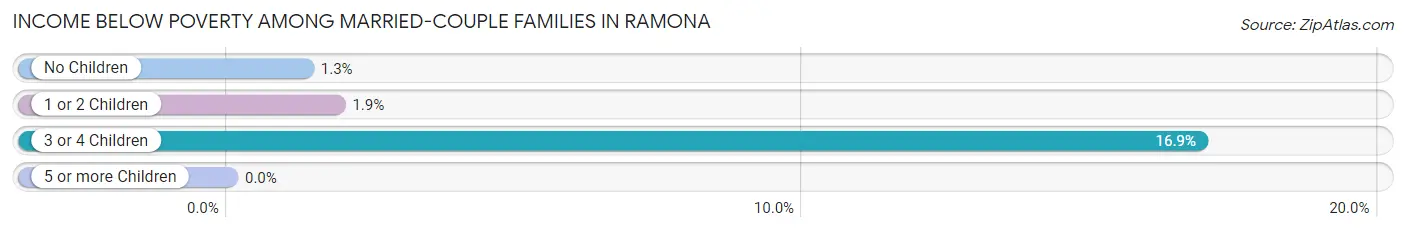
| Children | Above Poverty | Below Poverty |
| No Children | 2,242 (98.7%) | 30 (1.3%) |
| 1 or 2 Children | 1,417 (98.1%) | 27 (1.9%) |
| 3 or 4 Children | 320 (83.1%) | 65 (16.9%) |
| 5 or more Children | 27 (100.0%) | 0 (0.0%) |
| Total | 4,006 (97.0%) | 122 (3.0%) |
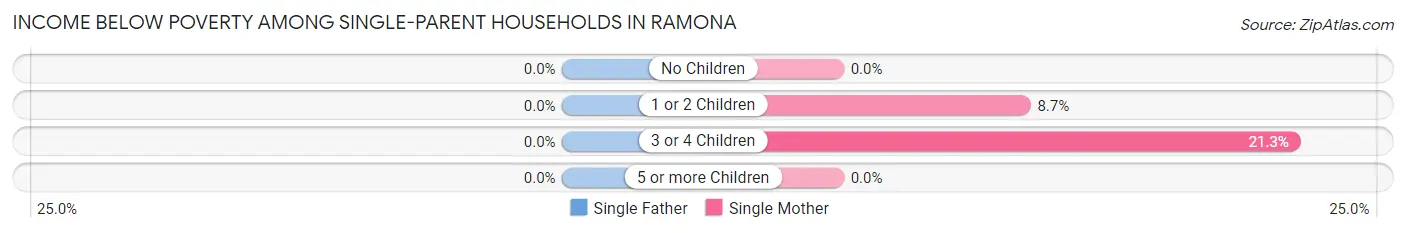
Income Below Poverty Among Single-Parent Households in Ramona
| Children | Single Father | Single Mother |
| No Children | 0 (0.0%) | 0 (0.0%) |
| 1 or 2 Children | 0 (0.0%) | 26 (8.7%) |
| 3 or 4 Children | 0 (0.0%) | 10 (21.3%) |
| 5 or more Children | 0 (0.0%) | 0 (0.0%) |
| Total | 0 (0.0%) | 36 (4.9%) |
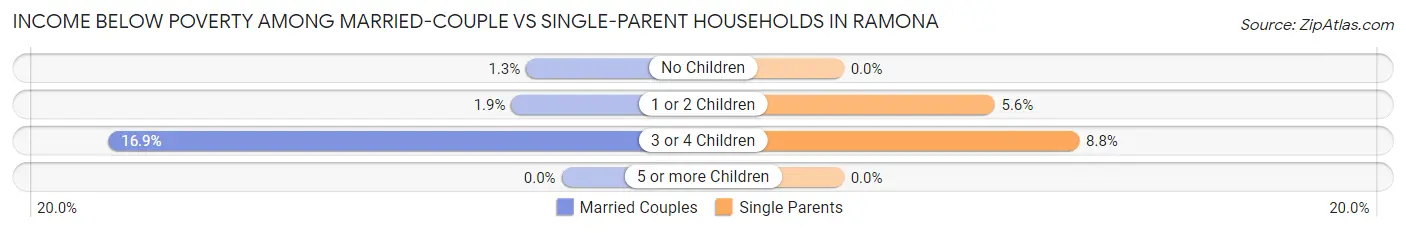
Income Below Poverty Among Married-Couple vs Single-Parent Households in Ramona
The poverty data for Ramona shows that 122 of the married-couple family households (3.0%) and 36 of the single-parent households (3.1%) are living below the poverty level. Within the married-couple family households, those with 3 or 4 children have the highest poverty rate, with 65 households (16.9%) falling below the poverty line. Among the single-parent households, those with 3 or 4 children have the highest poverty rate, with 10 household (8.8%) living below poverty.
| Children | Married-Couple Families | Single-Parent Households |
| No Children | 30 (1.3%) | 0 (0.0%) |
| 1 or 2 Children | 27 (1.9%) | 26 (5.6%) |
| 3 or 4 Children | 65 (16.9%) | 10 (8.8%) |
| 5 or more Children | 0 (0.0%) | 0 (0.0%) |
| Total | 122 (3.0%) | 36 (3.1%) |
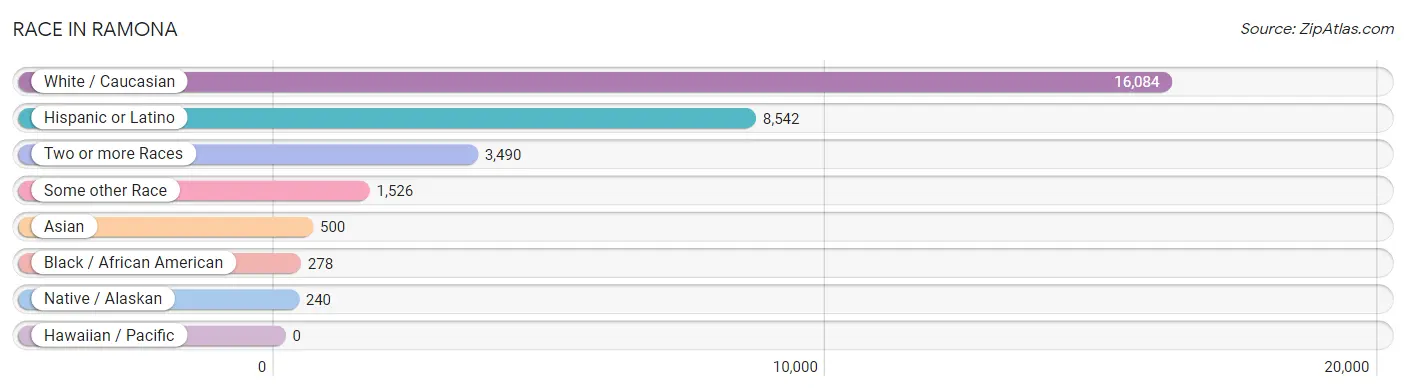
Race in Ramona
The most populous races in Ramona are White / Caucasian (16,084 | 72.7%), Hispanic or Latino (8,542 | 38.6%), and Two or more Races (3,490 | 15.8%).
| Race | # Population | % Population |
| Asian | 500 | 2.3% |
| Black / African American | 278 | 1.3% |
| Hawaiian / Pacific | 0 | 0.0% |
| Hispanic or Latino | 8,542 | 38.6% |
| Native / Alaskan | 240 | 1.1% |
| White / Caucasian | 16,084 | 72.7% |
| Two or more Races | 3,490 | 15.8% |
| Some other Race | 1,526 | 6.9% |
| Total | 22,118 | 100.0% |
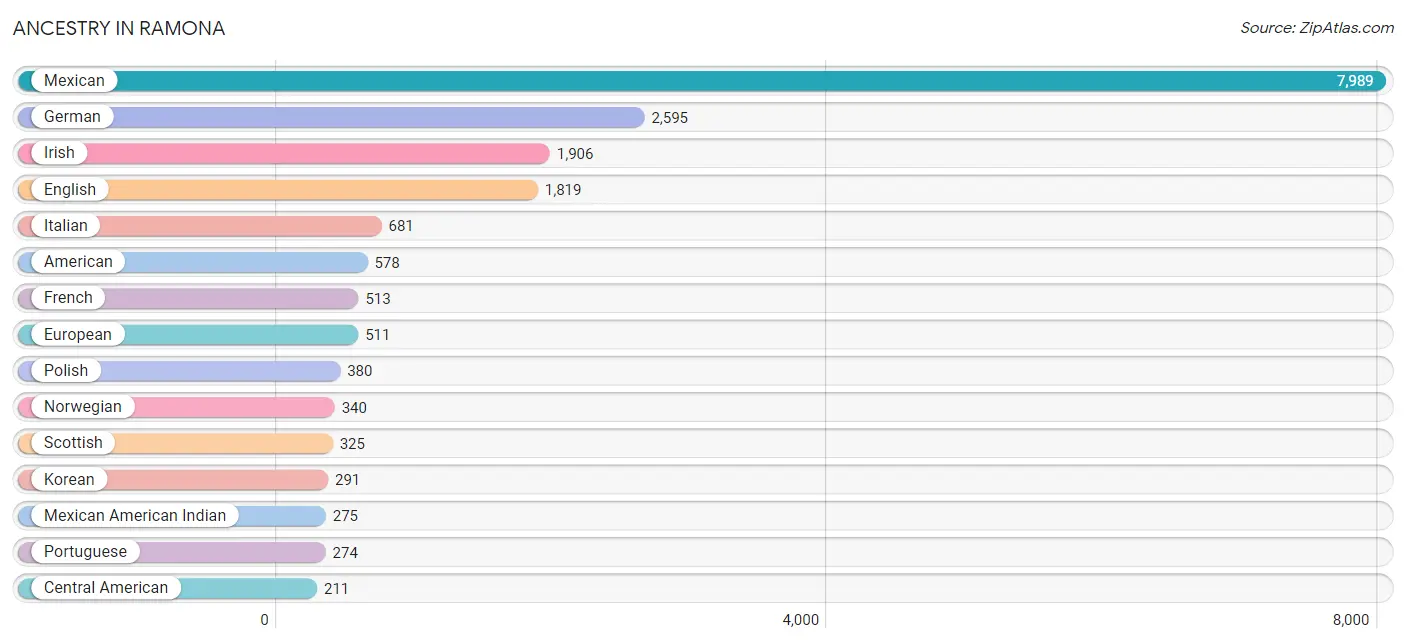
Ancestry in Ramona
The most populous ancestries reported in Ramona are Mexican (7,989 | 36.1%), German (2,595 | 11.7%), Irish (1,906 | 8.6%), English (1,819 | 8.2%), and Italian (681 | 3.1%), together accounting for 67.8% of all Ramona residents.
| Ancestry | # Population | % Population |
| American | 578 | 2.6% |
| Arab | 93 | 0.4% |
| Armenian | 13 | 0.1% |
| Austrian | 90 | 0.4% |
| Belgian | 16 | 0.1% |
| Bhutanese | 143 | 0.6% |
| British | 95 | 0.4% |
| Burmese | 32 | 0.1% |
| Canadian | 50 | 0.2% |
| Central American | 211 | 0.9% |
| Central American Indian | 4 | 0.0% |
| Cherokee | 30 | 0.1% |
| Choctaw | 37 | 0.2% |
| Costa Rican | 42 | 0.2% |
| Creek | 19 | 0.1% |
| Croatian | 167 | 0.8% |
| Czech | 35 | 0.2% |
| Czechoslovakian | 7 | 0.0% |
| Danish | 169 | 0.8% |
| Dominican | 8 | 0.0% |
| Dutch | 210 | 0.9% |
| Eastern European | 35 | 0.2% |
| Ecuadorian | 6 | 0.0% |
| English | 1,819 | 8.2% |
| Estonian | 34 | 0.2% |
| Ethiopian | 8 | 0.0% |
| European | 511 | 2.3% |
| Finnish | 35 | 0.2% |
| French | 513 | 2.3% |
| French Canadian | 154 | 0.7% |
| German | 2,595 | 11.7% |
| Greek | 133 | 0.6% |
| Guamanian / Chamorro | 46 | 0.2% |
| Honduran | 105 | 0.5% |
| Hungarian | 41 | 0.2% |
| Indian (Asian) | 96 | 0.4% |
| Iranian | 44 | 0.2% |
| Iraqi | 50 | 0.2% |
| Irish | 1,906 | 8.6% |
| Iroquois | 8 | 0.0% |
| Italian | 681 | 3.1% |
| Japanese | 33 | 0.2% |
| Korean | 291 | 1.3% |
| Lebanese | 43 | 0.2% |
| Lithuanian | 12 | 0.1% |
| Mexican | 7,989 | 36.1% |
| Mexican American Indian | 275 | 1.2% |
| Native Hawaiian | 104 | 0.5% |
| Northern European | 20 | 0.1% |
| Norwegian | 340 | 1.5% |
| Peruvian | 37 | 0.2% |
| Polish | 380 | 1.7% |
| Portuguese | 274 | 1.2% |
| Puerto Rican | 90 | 0.4% |
| Romanian | 10 | 0.1% |
| Russian | 43 | 0.2% |
| Salvadoran | 64 | 0.3% |
| Scandinavian | 34 | 0.2% |
| Scotch-Irish | 182 | 0.8% |
| Scottish | 325 | 1.5% |
| Serbian | 11 | 0.1% |
| South American | 43 | 0.2% |
| Spaniard | 46 | 0.2% |
| Sri Lankan | 176 | 0.8% |
| Subsaharan African | 8 | 0.0% |
| Swedish | 117 | 0.5% |
| Swiss | 40 | 0.2% |
| Thai | 19 | 0.1% |
| Tlingit-Haida | 64 | 0.3% |
| Ukrainian | 13 | 0.1% |
| Welsh | 58 | 0.3% |
| Yugoslavian | 12 | 0.1% | View All 72 Rows |
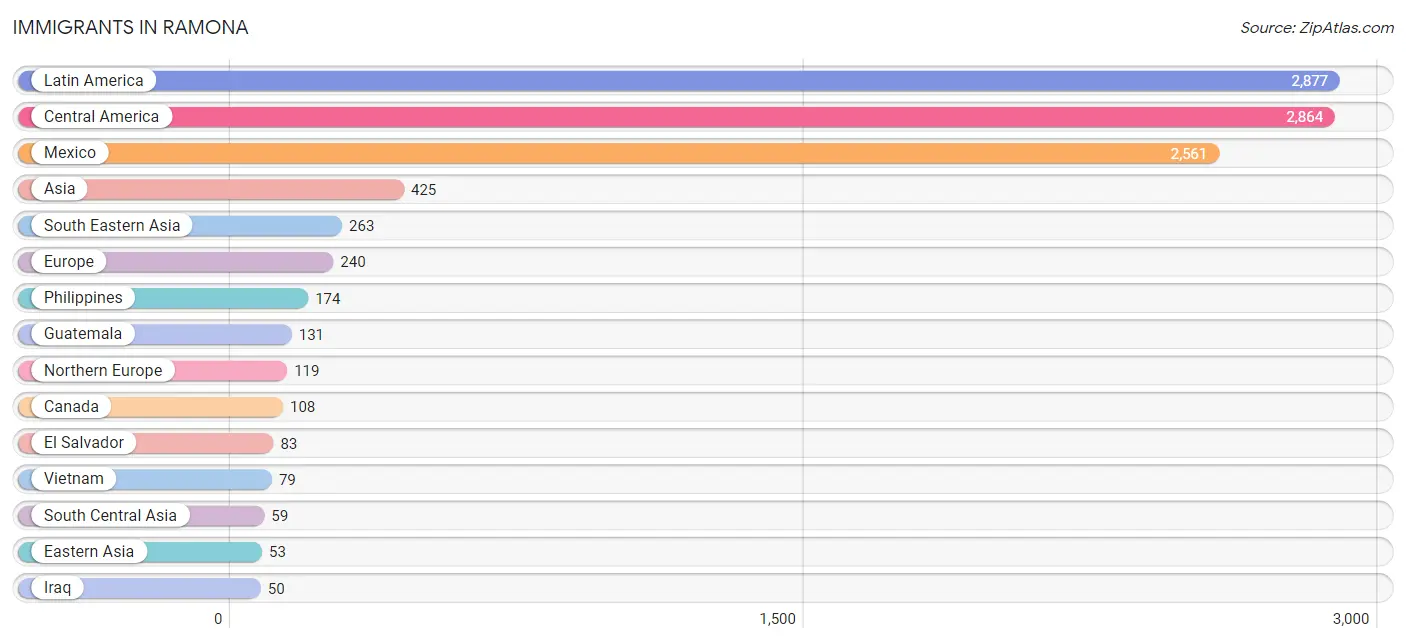
Immigrants in Ramona
The most numerous immigrant groups reported in Ramona came from Latin America (2,877 | 13.0%), Central America (2,864 | 13.0%), Mexico (2,561 | 11.6%), Asia (425 | 1.9%), and South Eastern Asia (263 | 1.2%), together accounting for 40.7% of all Ramona residents.
| Immigration Origin | # Population | % Population |
| Asia | 425 | 1.9% |
| Australia | 11 | 0.1% |
| Canada | 108 | 0.5% |
| Central America | 2,864 | 13.0% |
| China | 25 | 0.1% |
| Costa Rica | 42 | 0.2% |
| Czechoslovakia | 10 | 0.1% |
| Denmark | 24 | 0.1% |
| Eastern Asia | 53 | 0.2% |
| Eastern Europe | 21 | 0.1% |
| El Salvador | 83 | 0.4% |
| England | 30 | 0.1% |
| Europe | 240 | 1.1% |
| France | 10 | 0.1% |
| Germany | 40 | 0.2% |
| Guatemala | 131 | 0.6% |
| Honduras | 47 | 0.2% |
| India | 19 | 0.1% |
| Indonesia | 10 | 0.1% |
| Iran | 40 | 0.2% |
| Iraq | 50 | 0.2% |
| Japan | 12 | 0.1% |
| Korea | 16 | 0.1% |
| Latin America | 2,877 | 13.0% |
| Mexico | 2,561 | 11.6% |
| Northern Europe | 119 | 0.5% |
| Oceania | 11 | 0.1% |
| Peru | 13 | 0.1% |
| Philippines | 174 | 0.8% |
| Serbia | 11 | 0.1% |
| South America | 13 | 0.1% |
| South Central Asia | 59 | 0.3% |
| South Eastern Asia | 263 | 1.2% |
| Southern Europe | 50 | 0.2% |
| Spain | 50 | 0.2% |
| Vietnam | 79 | 0.4% |
| Western Asia | 50 | 0.2% |
| Western Europe | 50 | 0.2% | View All 38 Rows |
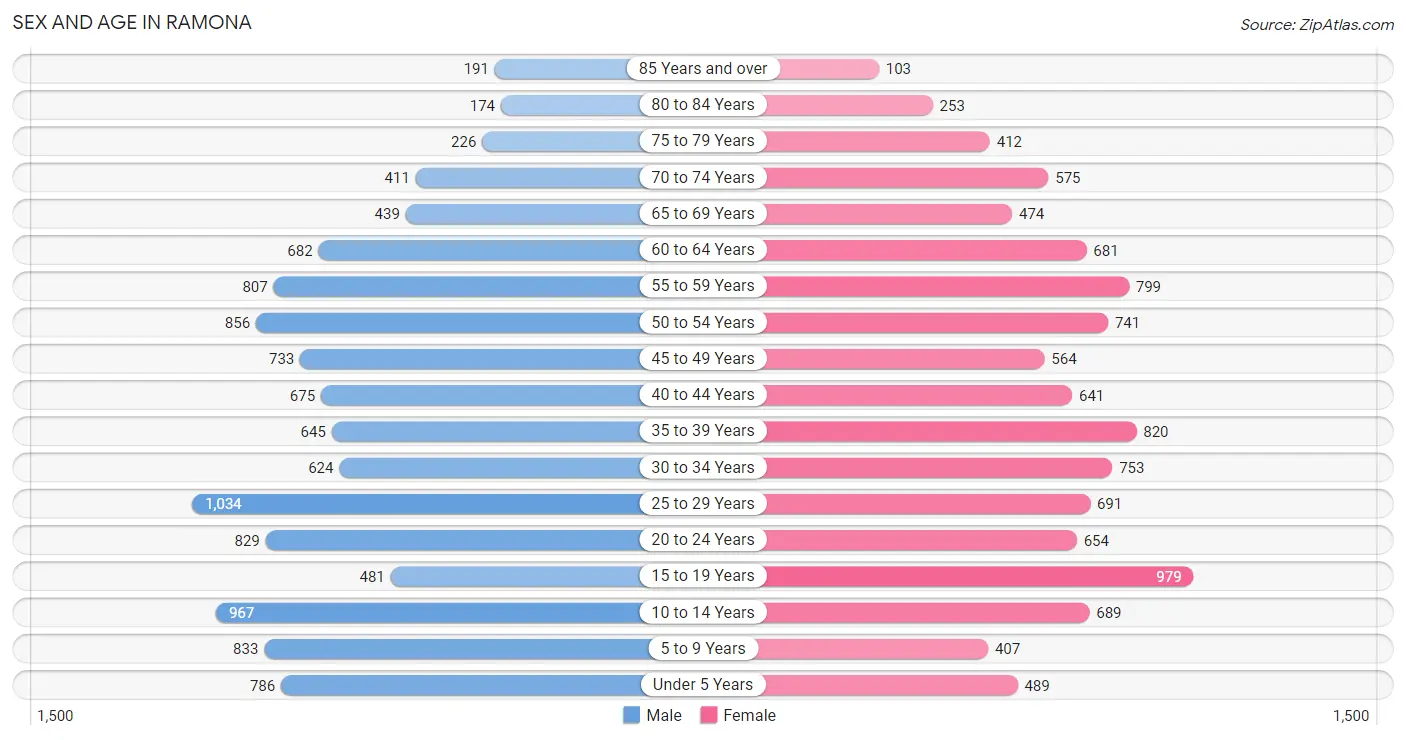
Sex and Age in Ramona
Sex and Age in Ramona
The most populous age groups in Ramona are 25 to 29 Years (1,034 | 9.1%) for men and 15 to 19 Years (979 | 9.1%) for women.
| Age Bracket | Male | Female |
| Under 5 Years | 786 (6.9%) | 489 (4.6%) |
| 5 to 9 Years | 833 (7.3%) | 407 (3.8%) |
| 10 to 14 Years | 967 (8.5%) | 689 (6.4%) |
| 15 to 19 Years | 481 (4.2%) | 979 (9.1%) |
| 20 to 24 Years | 829 (7.3%) | 654 (6.1%) |
| 25 to 29 Years | 1,034 (9.1%) | 691 (6.4%) |
| 30 to 34 Years | 624 (5.5%) | 753 (7.0%) |
| 35 to 39 Years | 645 (5.7%) | 820 (7.6%) |
| 40 to 44 Years | 675 (5.9%) | 641 (6.0%) |
| 45 to 49 Years | 733 (6.4%) | 564 (5.3%) |
| 50 to 54 Years | 856 (7.5%) | 741 (6.9%) |
| 55 to 59 Years | 807 (7.1%) | 799 (7.4%) |
| 60 to 64 Years | 682 (6.0%) | 681 (6.4%) |
| 65 to 69 Years | 439 (3.8%) | 474 (4.4%) |
| 70 to 74 Years | 411 (3.6%) | 575 (5.4%) |
| 75 to 79 Years | 226 (2.0%) | 412 (3.8%) |
| 80 to 84 Years | 174 (1.5%) | 253 (2.4%) |
| 85 Years and over | 191 (1.7%) | 103 (1.0%) |
| Total | 11,393 (100.0%) | 10,725 (100.0%) |
Families and Households in Ramona
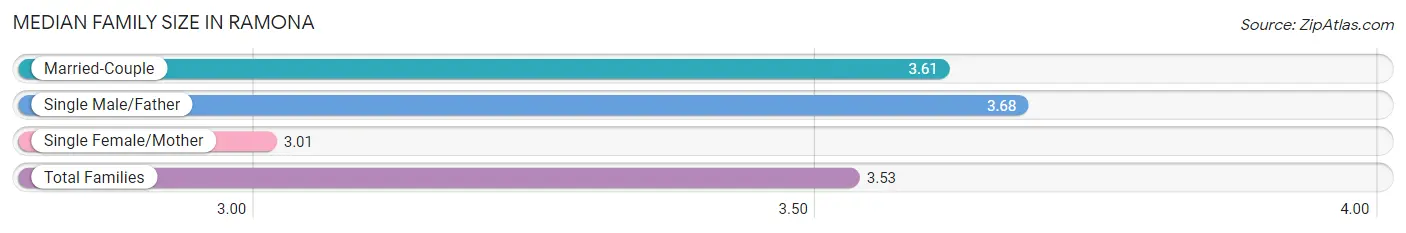
Median Family Size in Ramona
The median family size in Ramona is 3.53 persons per family, with single male/father families (419 | 7.9%) accounting for the largest median family size of 3.68 persons per family. On the other hand, single female/mother families (734 | 13.9%) represent the smallest median family size with 3.01 persons per family.
| Family Type | # Families | Family Size |
| Married-Couple | 4,128 (78.2%) | 3.61 |
| Single Male/Father | 419 (7.9%) | 3.68 |
| Single Female/Mother | 734 (13.9%) | 3.01 |
| Total Families | 5,281 (100.0%) | 3.53 |
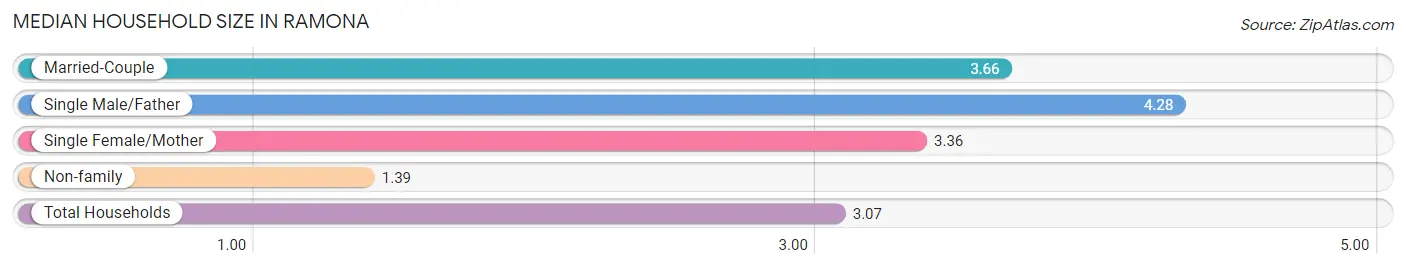
Median Household Size in Ramona
The median household size in Ramona is 3.07 persons per household, with single male/father households (419 | 5.9%) accounting for the largest median household size of 4.28 persons per household. non-family households (1,881 | 26.3%) represent the smallest median household size with 1.39 persons per household.
| Household Type | # Households | Household Size |
| Married-Couple | 4,128 (57.6%) | 3.66 |
| Single Male/Father | 419 (5.9%) | 4.28 |
| Single Female/Mother | 734 (10.2%) | 3.36 |
| Non-family | 1,881 (26.3%) | 1.39 |
| Total Households | 7,162 (100.0%) | 3.07 |
Household Size by Marriage Status in Ramona
Out of a total of 7,162 households in Ramona, 5,281 (73.7%) are family households, while 1,881 (26.3%) are nonfamily households. The most numerous type of family households are 2-person households, comprising 2,057, and the most common type of nonfamily households are 1-person households, comprising 1,475.
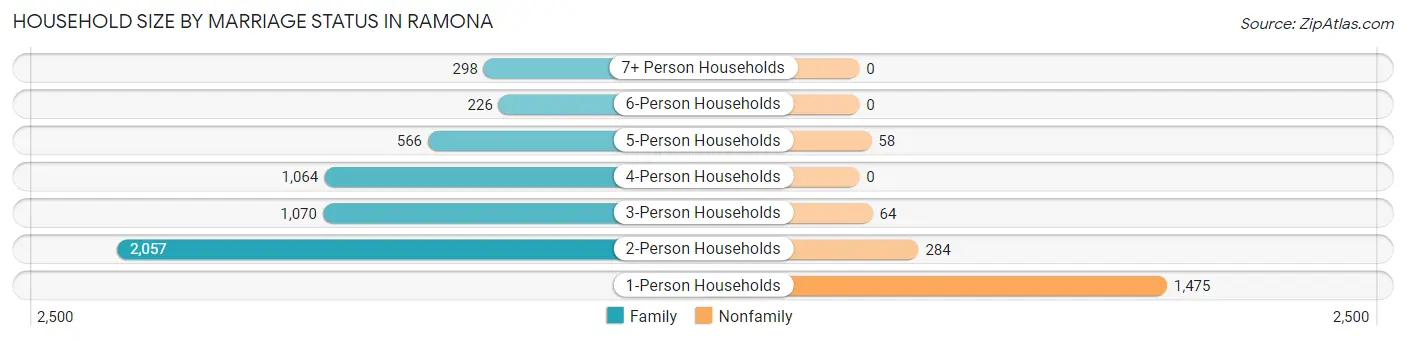
| Household Size | Family Households | Nonfamily Households |
| 1-Person Households | - | 1,475 (20.6%) |
| 2-Person Households | 2,057 (28.7%) | 284 (4.0%) |
| 3-Person Households | 1,070 (14.9%) | 64 (0.9%) |
| 4-Person Households | 1,064 (14.9%) | 0 (0.0%) |
| 5-Person Households | 566 (7.9%) | 58 (0.8%) |
| 6-Person Households | 226 (3.2%) | 0 (0.0%) |
| 7+ Person Households | 298 (4.2%) | 0 (0.0%) |
| Total | 5,281 (73.7%) | 1,881 (26.3%) |
Female Fertility in Ramona
Fertility by Age in Ramona
Average fertility rate in Ramona is 56.0 births per 1,000 women. Women in the age bracket of 20 to 34 years have the highest fertility rate with 112.0 births per 1,000 women. Women in the age bracket of 20 to 34 years acount for 80.5% of all women with births.
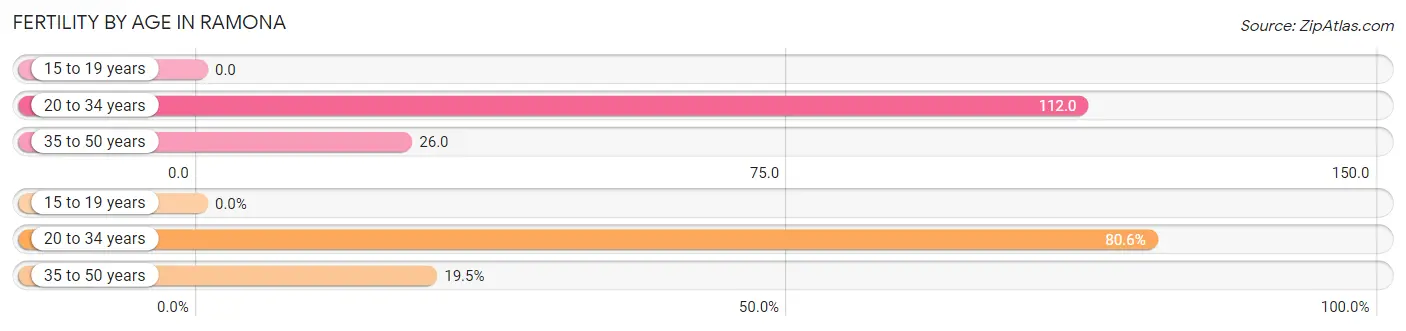
| Age Bracket | Women with Births | Births / 1,000 Women |
| 15 to 19 years | 0 (0.0%) | 0.0 |
| 20 to 34 years | 236 (80.5%) | 112.0 |
| 35 to 50 years | 57 (19.5%) | 26.0 |
| Total | 293 (100.0%) | 56.0 |
Fertility by Age by Marriage Status in Ramona
82.6% of women with births (293) in Ramona are married. The highest percentage of unmarried women with births falls into 35 to 50 years age bracket with 21.0% of them unmarried at the time of birth, while the lowest percentage of unmarried women with births belong to 20 to 34 years age bracket with 16.5% of them unmarried.
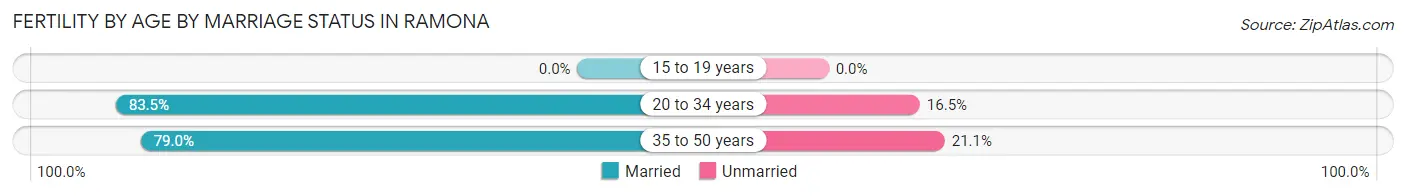
| Age Bracket | Married | Unmarried |
| 15 to 19 years | 0 (0.0%) | 0 (0.0%) |
| 20 to 34 years | 197 (83.5%) | 39 (16.5%) |
| 35 to 50 years | 45 (78.9%) | 12 (21.0%) |
| Total | 242 (82.6%) | 51 (17.4%) |
Fertility by Education in Ramona
Average fertility rate in Ramona is 56.0 births per 1,000 women. Women with the education attainment of graduate degree have the highest fertility rate of 98.0 births per 1,000 women, while women with the education attainment of high school diploma have the lowest fertility at 22.0 births per 1,000 women. Women with the education attainment of bachelor's degree represent 31.7% of all women with births.
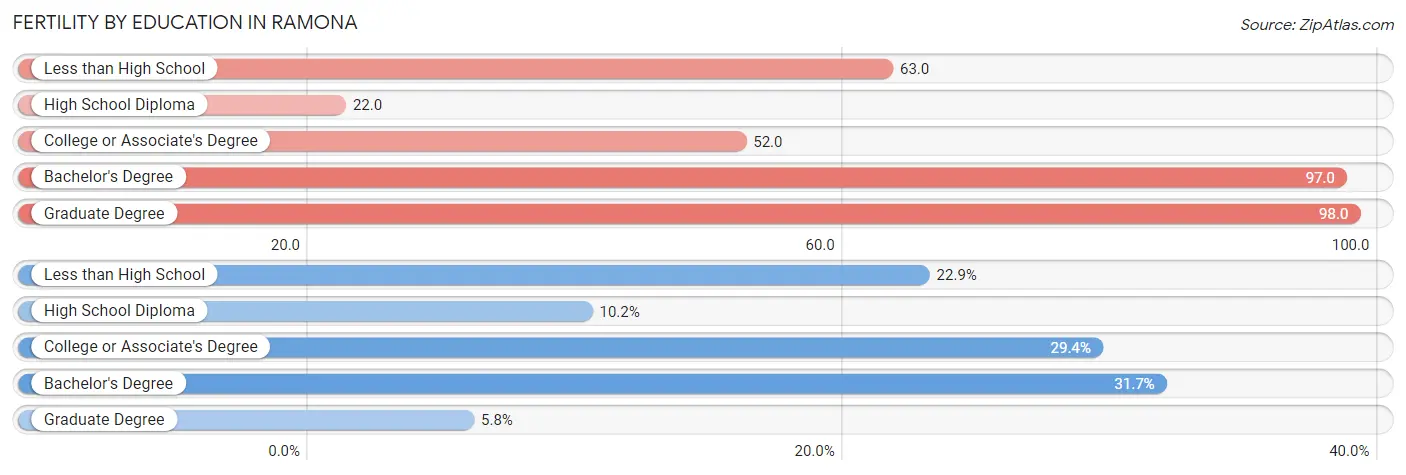
| Educational Attainment | Women with Births | Births / 1,000 Women |
| Less than High School | 67 (22.9%) | 63.0 |
| High School Diploma | 30 (10.2%) | 22.0 |
| College or Associate's Degree | 86 (29.3%) | 52.0 |
| Bachelor's Degree | 93 (31.7%) | 97.0 |
| Graduate Degree | 17 (5.8%) | 98.0 |
| Total | 293 (100.0%) | 56.0 |
Fertility by Education by Marriage Status in Ramona
17.4% of women with births in Ramona are unmarried. Women with the educational attainment of less than high school are most likely to be married with 100.0% of them married at childbirth, while women with the educational attainment of college or associate's degree are least likely to be married with 44.2% of them unmarried at childbirth.
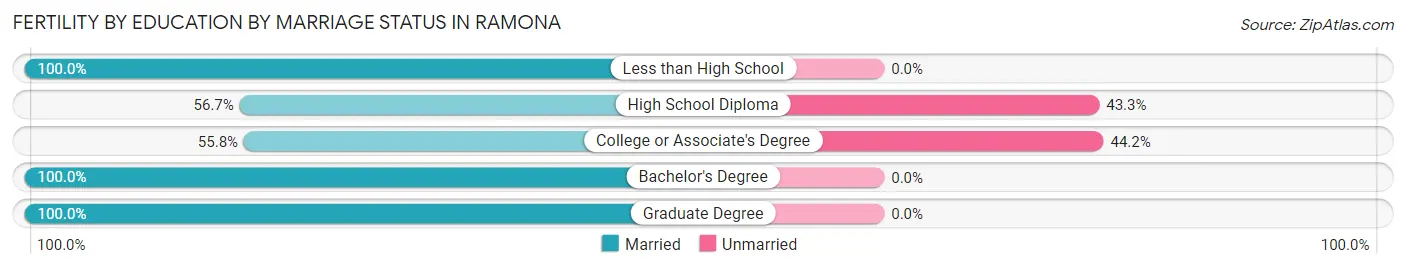
| Educational Attainment | Married | Unmarried |
| Less than High School | 67 (100.0%) | 0 (0.0%) |
| High School Diploma | 17 (56.7%) | 13 (43.3%) |
| College or Associate's Degree | 48 (55.8%) | 38 (44.2%) |
| Bachelor's Degree | 93 (100.0%) | 0 (0.0%) |
| Graduate Degree | 17 (100.0%) | 0 (0.0%) |
| Total | 242 (82.6%) | 51 (17.4%) |
Employment Characteristics in Ramona
Employment by Class of Employer in Ramona
Among the 11,362 employed individuals in Ramona, private company employees (7,807 | 68.7%), self-employed (not incorporated) (990 | 8.7%), and local government employees (867 | 7.6%) make up the most common classes of employment.
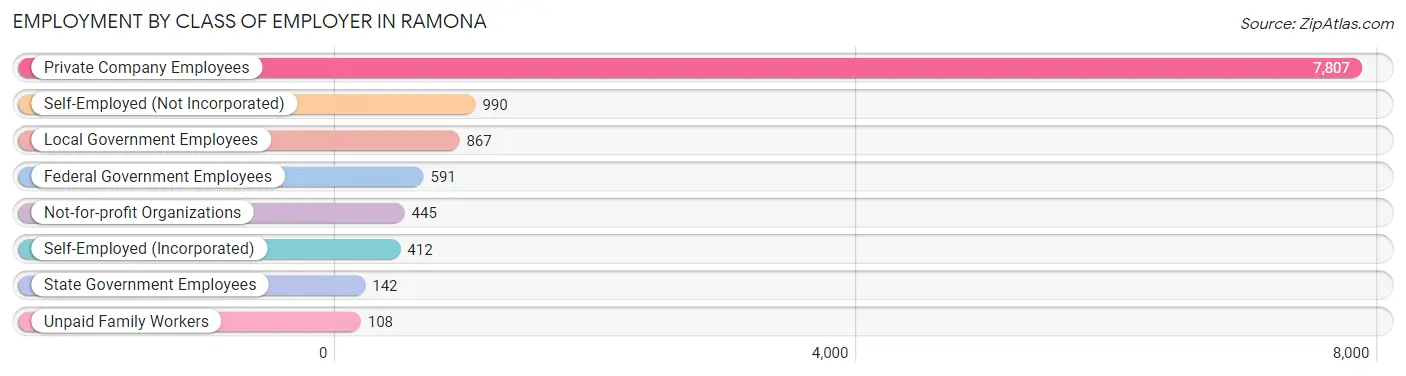
| Employer Class | # Employees | % Employees |
| Private Company Employees | 7,807 | 68.7% |
| Self-Employed (Incorporated) | 412 | 3.6% |
| Self-Employed (Not Incorporated) | 990 | 8.7% |
| Not-for-profit Organizations | 445 | 3.9% |
| Local Government Employees | 867 | 7.6% |
| State Government Employees | 142 | 1.3% |
| Federal Government Employees | 591 | 5.2% |
| Unpaid Family Workers | 108 | 0.9% |
| Total | 11,362 | 100.0% |
Employment Status by Age in Ramona
According to the labor force statistics for Ramona, out of the total population over 16 years of age (17,657), 67.6% or 11,936 individuals are in the labor force, with 3.8% or 454 of them unemployed. The age group with the highest labor force participation rate is 30 to 34 years, with 91.2% or 1,256 individuals in the labor force. Within the labor force, the 75 years and over age range has the highest percentage of unemployed individuals, with 17.6% or 15 of them being unemployed.
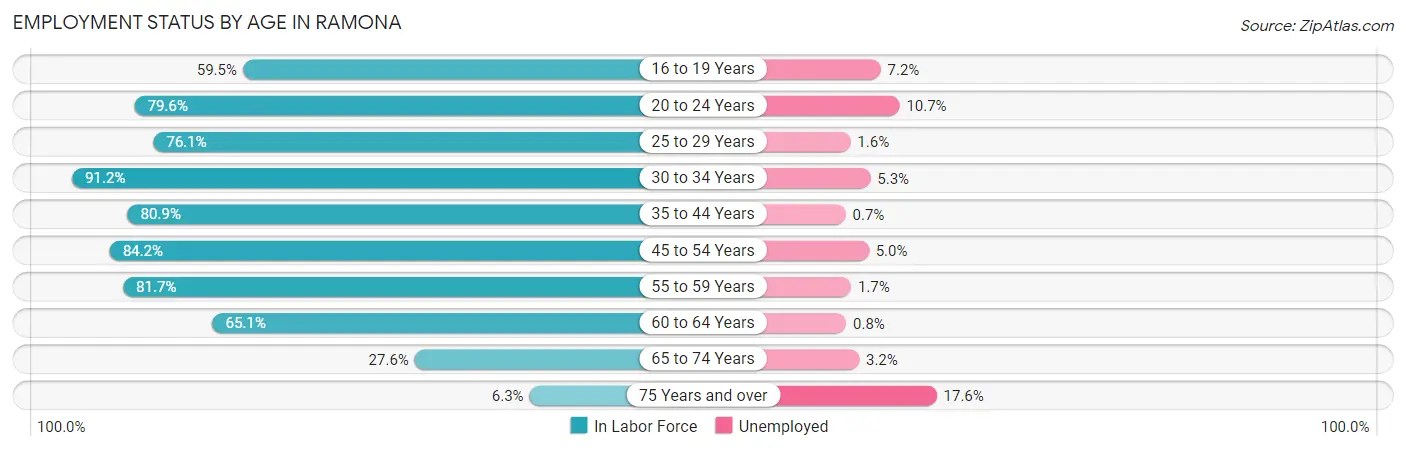
| Age Bracket | In Labor Force | Unemployed |
| 16 to 19 Years | 696 (59.5%) | 50 (7.2%) |
| 20 to 24 Years | 1,180 (79.6%) | 126 (10.7%) |
| 25 to 29 Years | 1,313 (76.1%) | 21 (1.6%) |
| 30 to 34 Years | 1,256 (91.2%) | 67 (5.3%) |
| 35 to 44 Years | 2,250 (80.9%) | 16 (0.7%) |
| 45 to 54 Years | 2,437 (84.2%) | 122 (5.0%) |
| 55 to 59 Years | 1,312 (81.7%) | 22 (1.7%) |
| 60 to 64 Years | 887 (65.1%) | 7 (0.8%) |
| 65 to 74 Years | 524 (27.6%) | 17 (3.2%) |
| 75 Years and over | 86 (6.3%) | 15 (17.6%) |
| Total | 11,936 (67.6%) | 454 (3.8%) |
Employment Status by Educational Attainment in Ramona
According to labor force statistics for Ramona, 80.5% of individuals (9,456) out of the total population between 25 and 64 years of age (11,746) are in the labor force, with 2.7% or 255 of them being unemployed. The group with the highest labor force participation rate are those with the educational attainment of bachelor's degree or higher, with 87.5% or 2,715 individuals in the labor force. Within the labor force, individuals with high school diploma education have the highest percentage of unemployment, with 5.2% or 123 of them being unemployed.
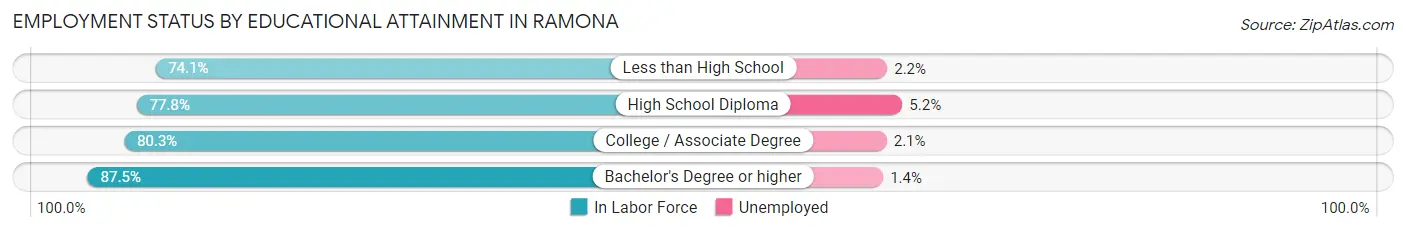
| Educational Attainment | In Labor Force | Unemployed |
| Less than High School | 1,528 (74.1%) | 45 (2.2%) |
| High School Diploma | 2,357 (77.8%) | 158 (5.2%) |
| College / Associate Degree | 2,852 (80.3%) | 75 (2.1%) |
| Bachelor's Degree or higher | 2,715 (87.5%) | 43 (1.4%) |
| Total | 9,456 (80.5%) | 317 (2.7%) |
Employment Occupations by Sex in Ramona
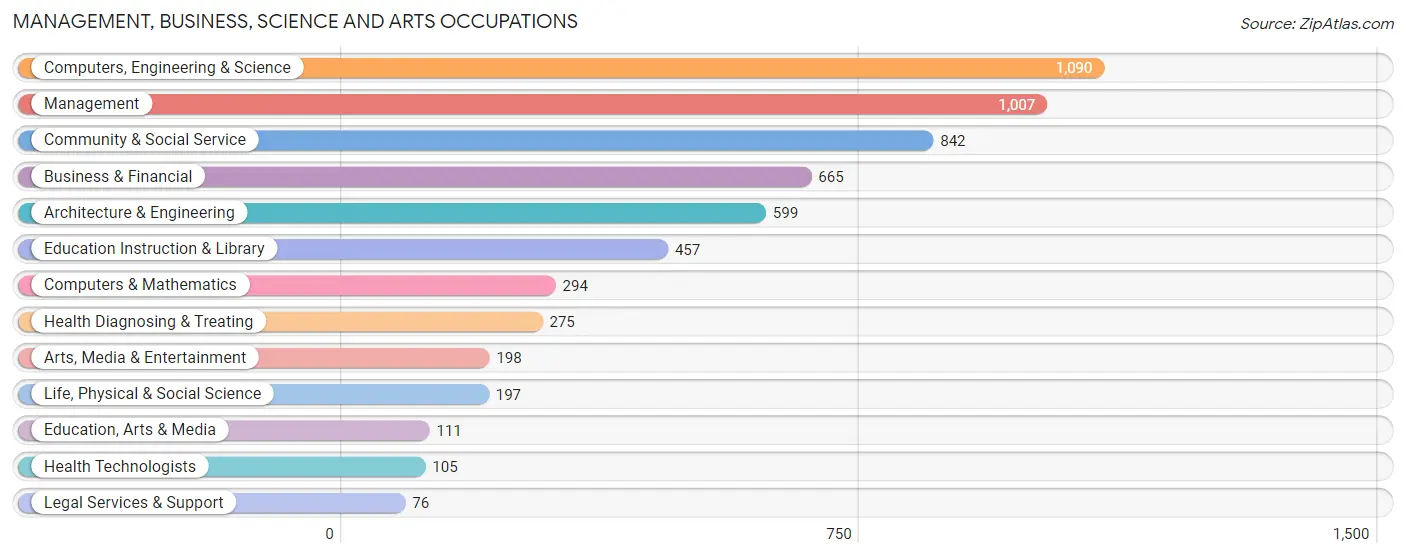
Management, Business, Science and Arts Occupations
The most common Management, Business, Science and Arts occupations in Ramona are Computers, Engineering & Science (1,090 | 9.7%), Management (1,007 | 8.9%), Community & Social Service (842 | 7.5%), Business & Financial (665 | 5.9%), and Architecture & Engineering (599 | 5.3%).
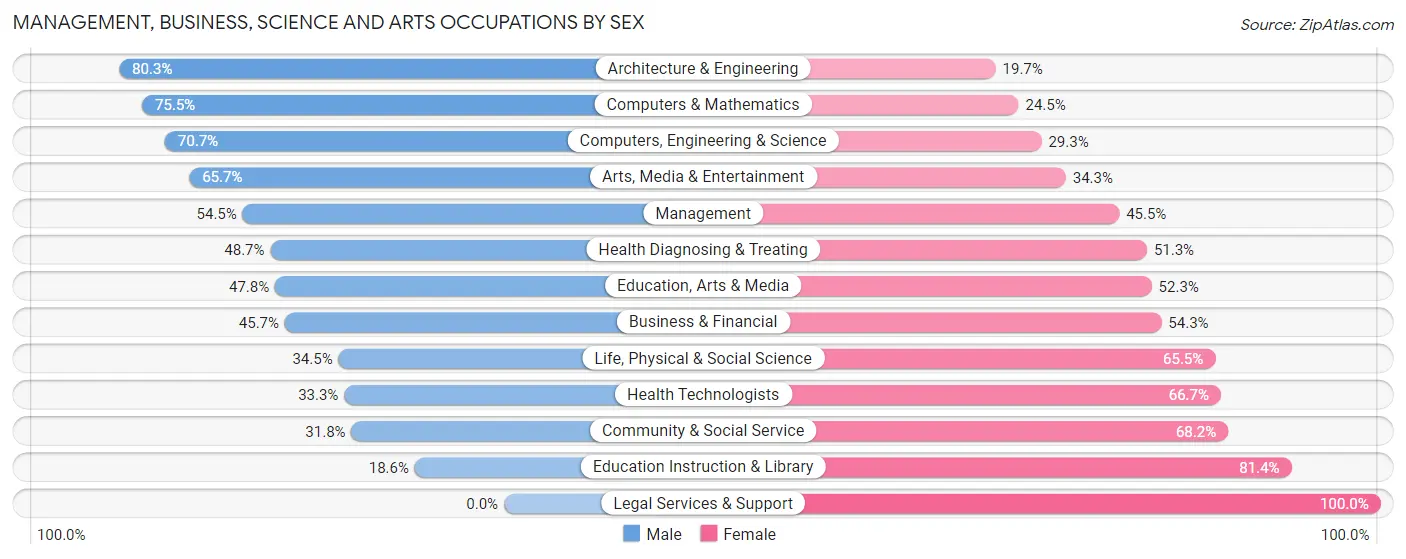
Management, Business, Science and Arts Occupations by Sex
Within the Management, Business, Science and Arts occupations in Ramona, the most male-oriented occupations are Architecture & Engineering (80.3%), Computers & Mathematics (75.5%), and Computers, Engineering & Science (70.7%), while the most female-oriented occupations are Legal Services & Support (100.0%), Education Instruction & Library (81.4%), and Community & Social Service (68.2%).
| Occupation | Male | Female |
| Management | 549 (54.5%) | 458 (45.5%) |
| Business & Financial | 304 (45.7%) | 361 (54.3%) |
| Computers, Engineering & Science | 771 (70.7%) | 319 (29.3%) |
| Computers & Mathematics | 222 (75.5%) | 72 (24.5%) |
| Architecture & Engineering | 481 (80.3%) | 118 (19.7%) |
| Life, Physical & Social Science | 68 (34.5%) | 129 (65.5%) |
| Community & Social Service | 268 (31.8%) | 574 (68.2%) |
| Education, Arts & Media | 53 (47.7%) | 58 (52.2%) |
| Legal Services & Support | 0 (0.0%) | 76 (100.0%) |
| Education Instruction & Library | 85 (18.6%) | 372 (81.4%) |
| Arts, Media & Entertainment | 130 (65.7%) | 68 (34.3%) |
| Health Diagnosing & Treating | 134 (48.7%) | 141 (51.3%) |
| Health Technologists | 35 (33.3%) | 70 (66.7%) |
| Total (Category) | 2,026 (52.2%) | 1,853 (47.8%) |
| Total (Overall) | 6,134 (54.5%) | 5,128 (45.5%) |
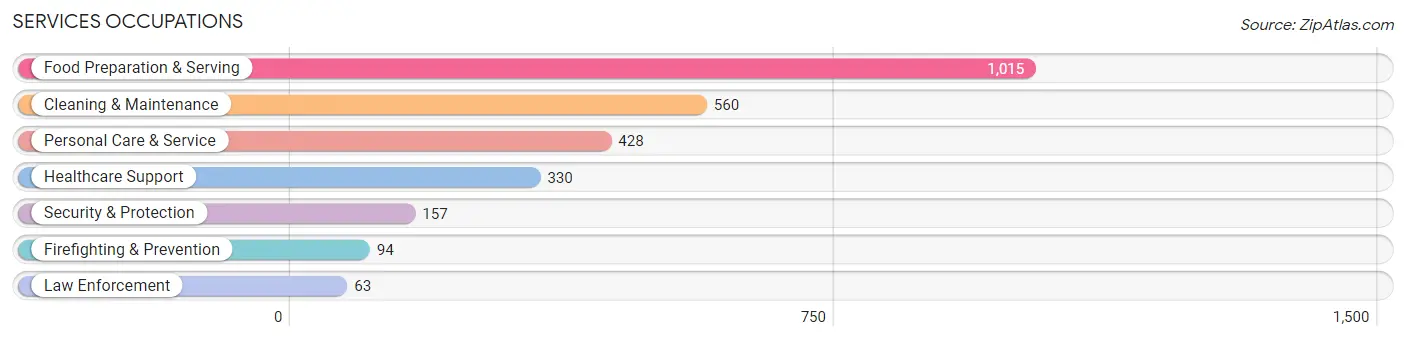
Services Occupations
The most common Services occupations in Ramona are Food Preparation & Serving (1,015 | 9.0%), Cleaning & Maintenance (560 | 5.0%), Personal Care & Service (428 | 3.8%), Healthcare Support (330 | 2.9%), and Security & Protection (157 | 1.4%).
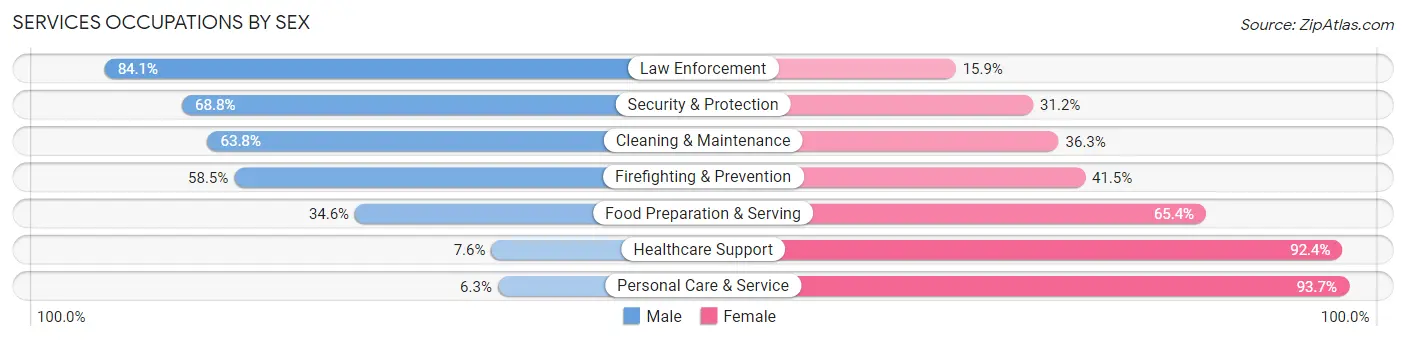
Services Occupations by Sex
Within the Services occupations in Ramona, the most male-oriented occupations are Law Enforcement (84.1%), Security & Protection (68.8%), and Cleaning & Maintenance (63.7%), while the most female-oriented occupations are Personal Care & Service (93.7%), Healthcare Support (92.4%), and Food Preparation & Serving (65.4%).
| Occupation | Male | Female |
| Healthcare Support | 25 (7.6%) | 305 (92.4%) |
| Security & Protection | 108 (68.8%) | 49 (31.2%) |
| Firefighting & Prevention | 55 (58.5%) | 39 (41.5%) |
| Law Enforcement | 53 (84.1%) | 10 (15.9%) |
| Food Preparation & Serving | 351 (34.6%) | 664 (65.4%) |
| Cleaning & Maintenance | 357 (63.7%) | 203 (36.2%) |
| Personal Care & Service | 27 (6.3%) | 401 (93.7%) |
| Total (Category) | 868 (34.9%) | 1,622 (65.1%) |
| Total (Overall) | 6,134 (54.5%) | 5,128 (45.5%) |
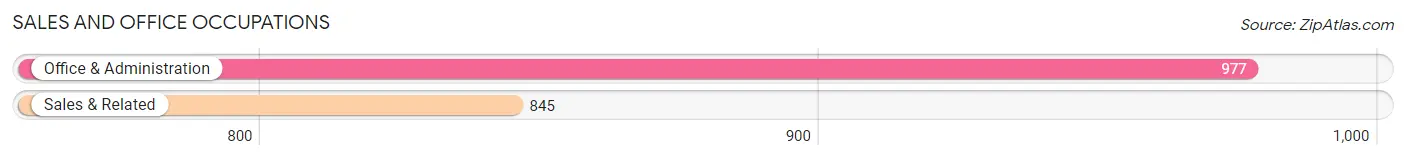
Sales and Office Occupations
The most common Sales and Office occupations in Ramona are Office & Administration (977 | 8.7%), and Sales & Related (845 | 7.5%).
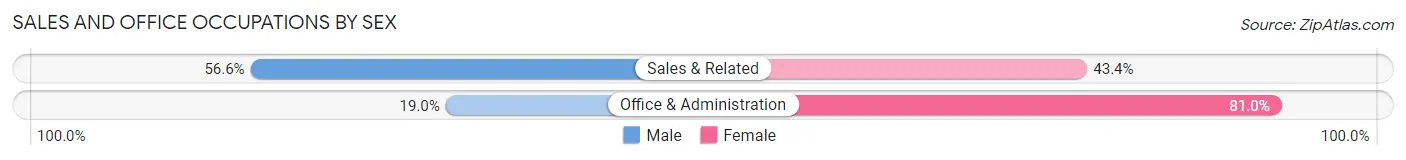
Sales and Office Occupations by Sex
| Occupation | Male | Female |
| Sales & Related | 478 (56.6%) | 367 (43.4%) |
| Office & Administration | 186 (19.0%) | 791 (81.0%) |
| Total (Category) | 664 (36.4%) | 1,158 (63.6%) |
| Total (Overall) | 6,134 (54.5%) | 5,128 (45.5%) |
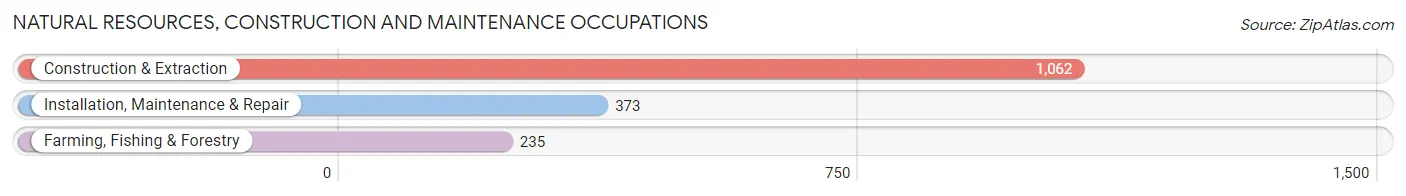
Natural Resources, Construction and Maintenance Occupations
The most common Natural Resources, Construction and Maintenance occupations in Ramona are Construction & Extraction (1,062 | 9.4%), Installation, Maintenance & Repair (373 | 3.3%), and Farming, Fishing & Forestry (235 | 2.1%).
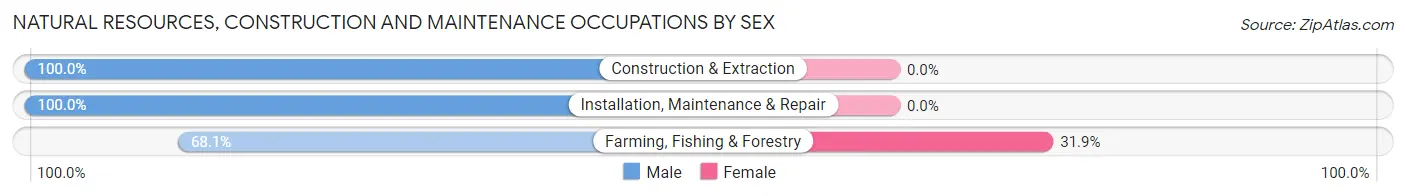
Natural Resources, Construction and Maintenance Occupations by Sex
| Occupation | Male | Female |
| Farming, Fishing & Forestry | 160 (68.1%) | 75 (31.9%) |
| Construction & Extraction | 1,062 (100.0%) | 0 (0.0%) |
| Installation, Maintenance & Repair | 373 (100.0%) | 0 (0.0%) |
| Total (Category) | 1,595 (95.5%) | 75 (4.5%) |
| Total (Overall) | 6,134 (54.5%) | 5,128 (45.5%) |
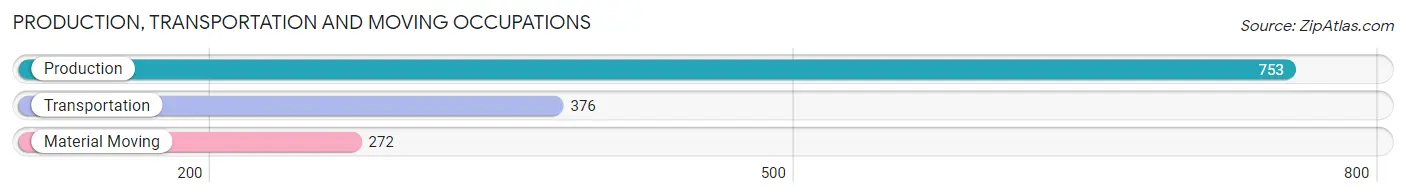
Production, Transportation and Moving Occupations
The most common Production, Transportation and Moving occupations in Ramona are Production (753 | 6.7%), Transportation (376 | 3.3%), and Material Moving (272 | 2.4%).
Production, Transportation and Moving Occupations by Sex
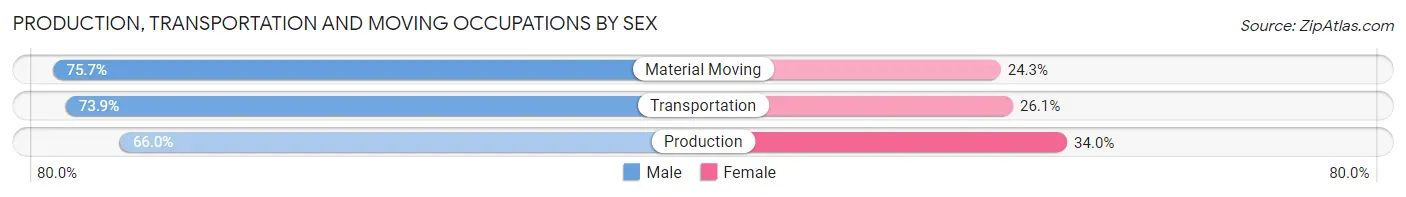
| Occupation | Male | Female |
| Production | 497 (66.0%) | 256 (34.0%) |
| Transportation | 278 (73.9%) | 98 (26.1%) |
| Material Moving | 206 (75.7%) | 66 (24.3%) |
| Total (Category) | 981 (70.0%) | 420 (30.0%) |
| Total (Overall) | 6,134 (54.5%) | 5,128 (45.5%) |
Employment Industries by Sex in Ramona
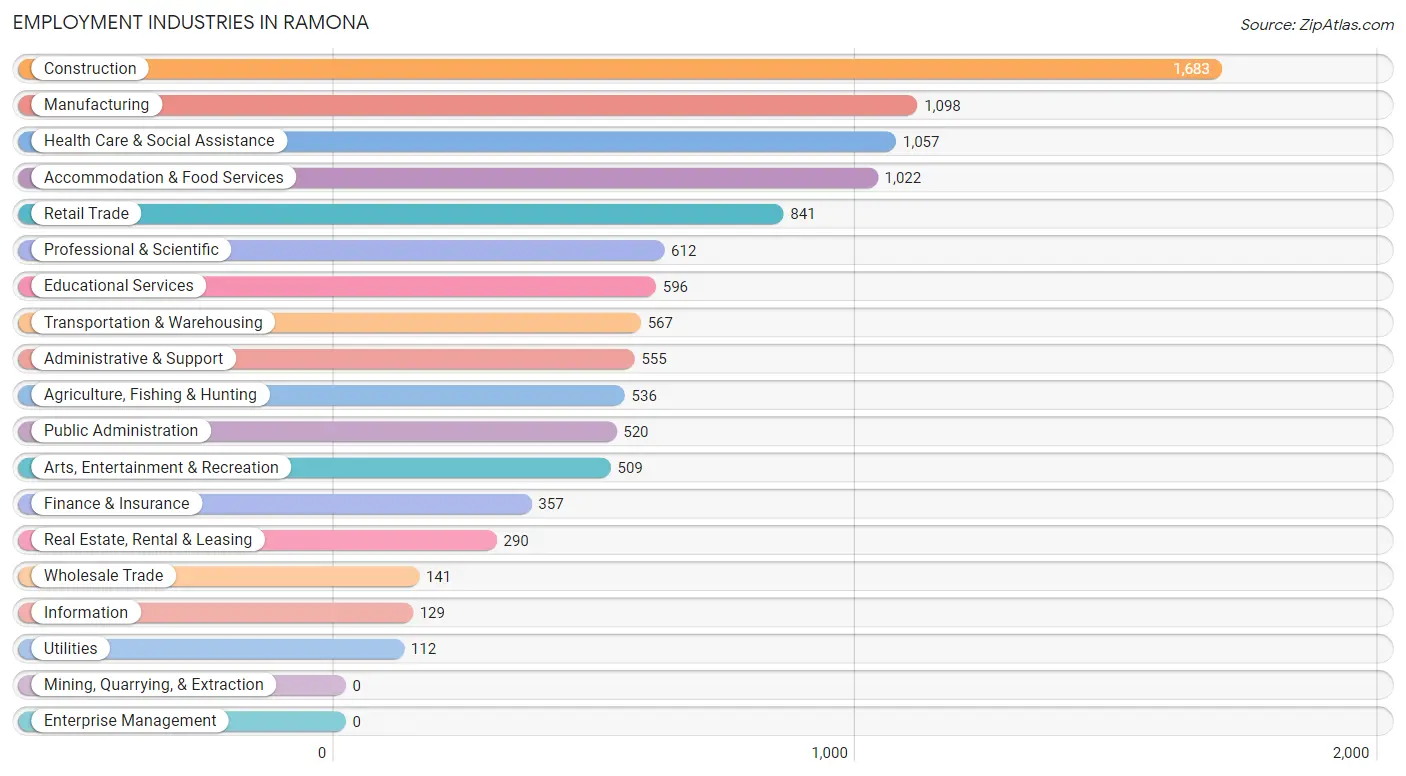
Employment Industries in Ramona
The major employment industries in Ramona include Construction (1,683 | 14.9%), Manufacturing (1,098 | 9.8%), Health Care & Social Assistance (1,057 | 9.4%), Accommodation & Food Services (1,022 | 9.1%), and Retail Trade (841 | 7.5%).
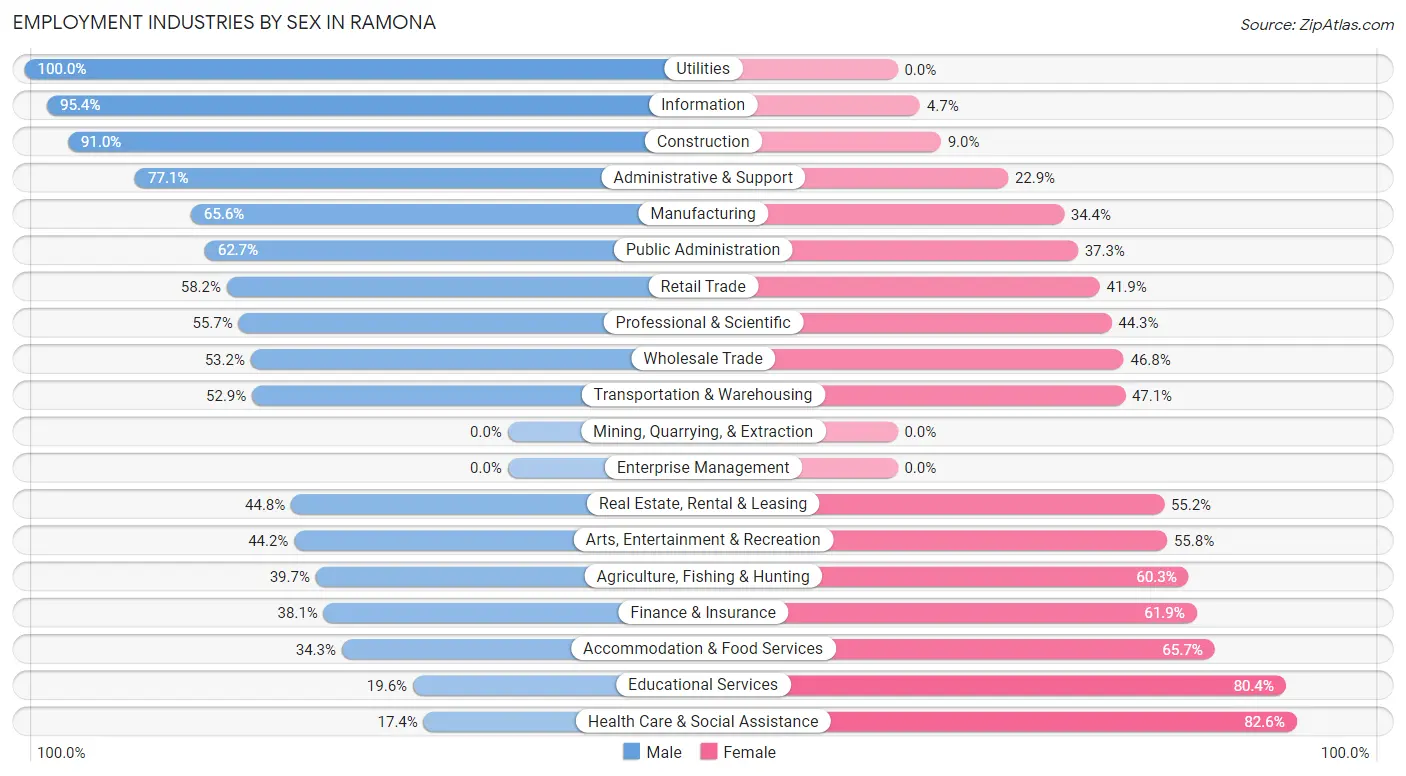
Employment Industries by Sex in Ramona
The Ramona industries that see more men than women are Utilities (100.0%), Information (95.4%), and Construction (91.0%), whereas the industries that tend to have a higher number of women are Health Care & Social Assistance (82.6%), Educational Services (80.4%), and Accommodation & Food Services (65.7%).
| Industry | Male | Female |
| Agriculture, Fishing & Hunting | 213 (39.7%) | 323 (60.3%) |
| Mining, Quarrying, & Extraction | 0 (0.0%) | 0 (0.0%) |
| Construction | 1,532 (91.0%) | 151 (9.0%) |
| Manufacturing | 720 (65.6%) | 378 (34.4%) |
| Wholesale Trade | 75 (53.2%) | 66 (46.8%) |
| Retail Trade | 489 (58.2%) | 352 (41.8%) |
| Transportation & Warehousing | 300 (52.9%) | 267 (47.1%) |
| Utilities | 112 (100.0%) | 0 (0.0%) |
| Information | 123 (95.4%) | 6 (4.6%) |
| Finance & Insurance | 136 (38.1%) | 221 (61.9%) |
| Real Estate, Rental & Leasing | 130 (44.8%) | 160 (55.2%) |
| Professional & Scientific | 341 (55.7%) | 271 (44.3%) |
| Enterprise Management | 0 (0.0%) | 0 (0.0%) |
| Administrative & Support | 428 (77.1%) | 127 (22.9%) |
| Educational Services | 117 (19.6%) | 479 (80.4%) |
| Health Care & Social Assistance | 184 (17.4%) | 873 (82.6%) |
| Arts, Entertainment & Recreation | 225 (44.2%) | 284 (55.8%) |
| Accommodation & Food Services | 351 (34.3%) | 671 (65.7%) |
| Public Administration | 326 (62.7%) | 194 (37.3%) |
| Total | 6,134 (54.5%) | 5,128 (45.5%) |
Education in Ramona
School Enrollment in Ramona
The most common levels of schooling among the 5,225 students in Ramona are middle school (1,284 | 24.6%), college / undergraduate (1,282 | 24.5%), and elementary school (1,070 | 20.5%).
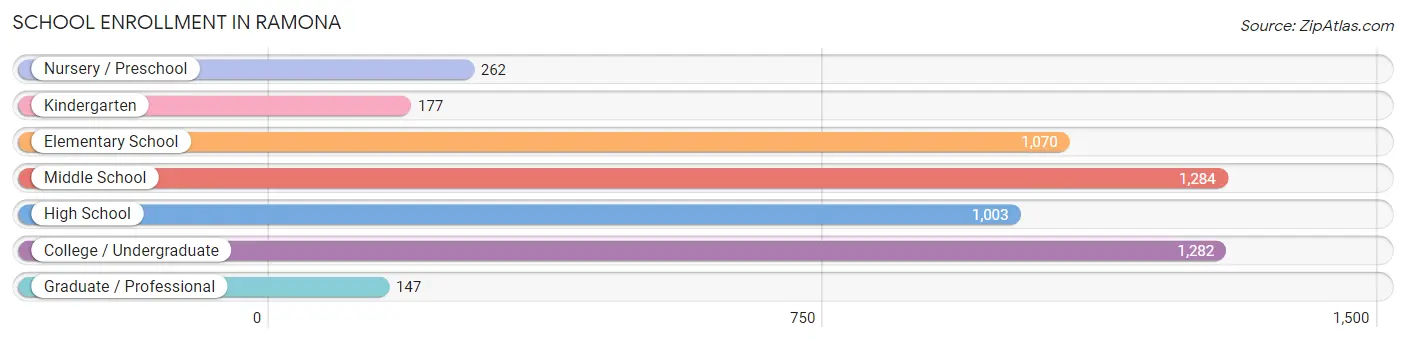
| School Level | # Students | % Students |
| Nursery / Preschool | 262 | 5.0% |
| Kindergarten | 177 | 3.4% |
| Elementary School | 1,070 | 20.5% |
| Middle School | 1,284 | 24.6% |
| High School | 1,003 | 19.2% |
| College / Undergraduate | 1,282 | 24.5% |
| Graduate / Professional | 147 | 2.8% |
| Total | 5,225 | 100.0% |
School Enrollment by Age by Funding Source in Ramona
Out of a total of 5,225 students who are enrolled in schools in Ramona, 460 (8.8%) attend a private institution, while the remaining 4,765 (91.2%) are enrolled in public schools. The age group of 35 years and over has the highest likelihood of being enrolled in private schools, with 121 (35.9% in the age bracket) enrolled. Conversely, the age group of 18 to 19 year olds has the lowest likelihood of being enrolled in a private school, with 726 (100.0% in the age bracket) attending a public institution.
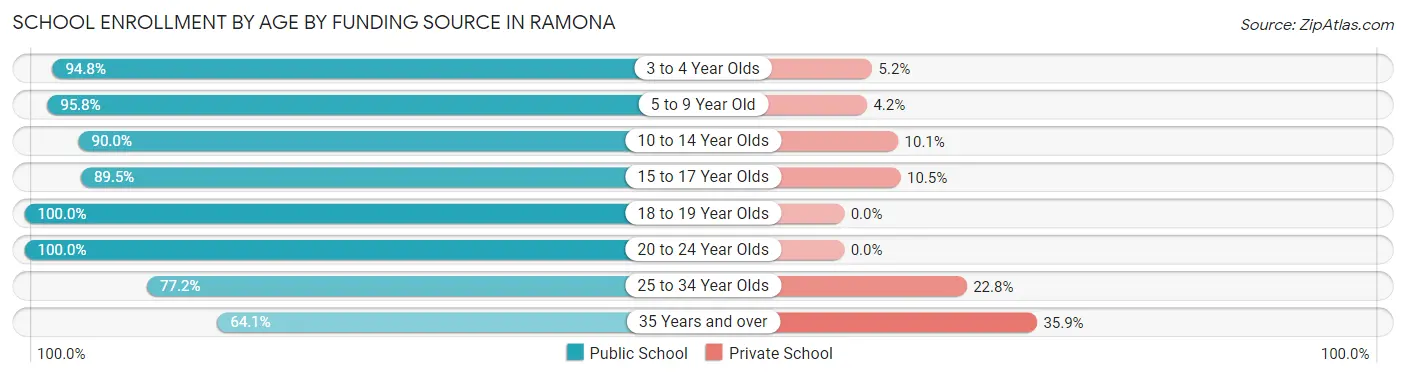
| Age Bracket | Public School | Private School |
| 3 to 4 Year Olds | 164 (94.8%) | 9 (5.2%) |
| 5 to 9 Year Old | 1,153 (95.8%) | 51 (4.2%) |
| 10 to 14 Year Olds | 1,476 (89.9%) | 165 (10.1%) |
| 15 to 17 Year Olds | 554 (89.5%) | 65 (10.5%) |
| 18 to 19 Year Olds | 726 (100.0%) | 0 (0.0%) |
| 20 to 24 Year Olds | 306 (100.0%) | 0 (0.0%) |
| 25 to 34 Year Olds | 169 (77.2%) | 50 (22.8%) |
| 35 Years and over | 216 (64.1%) | 121 (35.9%) |
| Total | 4,765 (91.2%) | 460 (8.8%) |
Educational Attainment by Field of Study in Ramona
Business (870 | 21.9%), education (362 | 9.1%), engineering (358 | 9.0%), science & technology (350 | 8.8%), and communications (346 | 8.7%) are the most common fields of study among 3,974 individuals in Ramona who have obtained a bachelor's degree or higher.
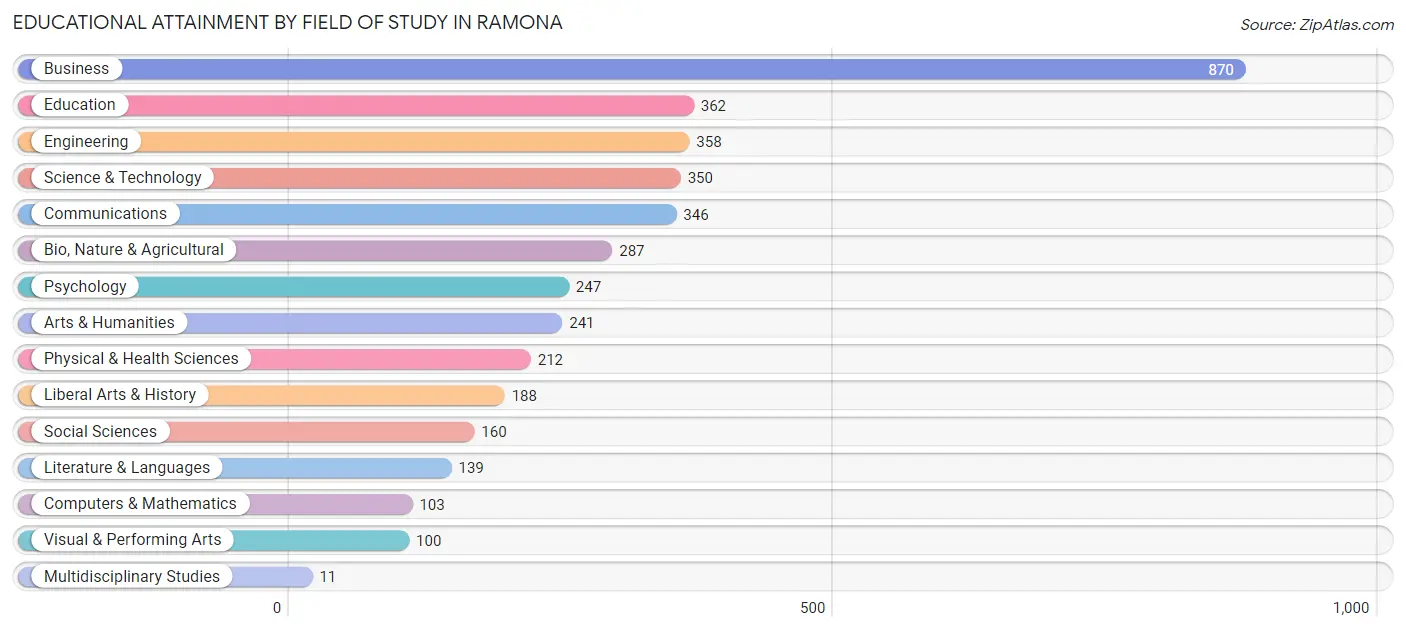
| Field of Study | # Graduates | % Graduates |
| Computers & Mathematics | 103 | 2.6% |
| Bio, Nature & Agricultural | 287 | 7.2% |
| Physical & Health Sciences | 212 | 5.3% |
| Psychology | 247 | 6.2% |
| Social Sciences | 160 | 4.0% |
| Engineering | 358 | 9.0% |
| Multidisciplinary Studies | 11 | 0.3% |
| Science & Technology | 350 | 8.8% |
| Business | 870 | 21.9% |
| Education | 362 | 9.1% |
| Literature & Languages | 139 | 3.5% |
| Liberal Arts & History | 188 | 4.7% |
| Visual & Performing Arts | 100 | 2.5% |
| Communications | 346 | 8.7% |
| Arts & Humanities | 241 | 6.1% |
| Total | 3,974 | 100.0% |
Transportation & Commute in Ramona
Vehicle Availability by Sex in Ramona
The most prevalent vehicle ownership categories in Ramona are males with 2 vehicles (1,981, accounting for 31.5%) and females with 2 vehicles (1,787, making up 39.2%).
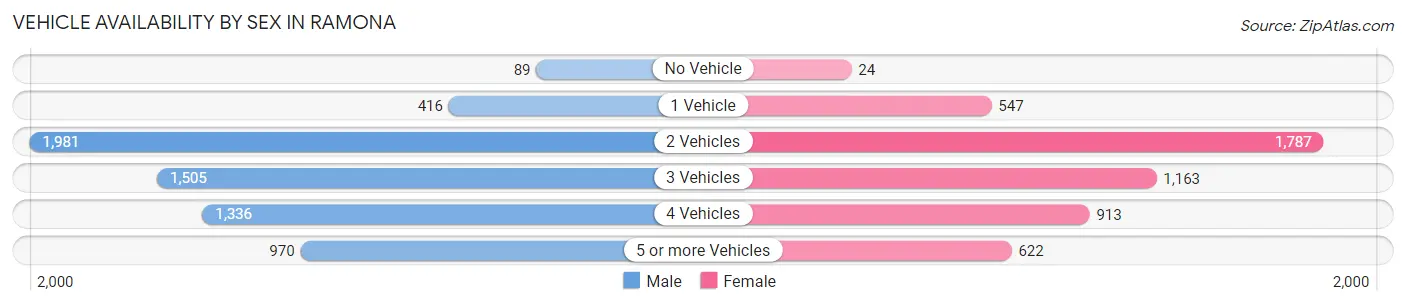
| Vehicles Available | Male | Female |
| No Vehicle | 89 (1.4%) | 24 (0.5%) |
| 1 Vehicle | 416 (6.6%) | 547 (10.8%) |
| 2 Vehicles | 1,981 (31.5%) | 1,787 (35.3%) |
| 3 Vehicles | 1,505 (23.9%) | 1,163 (23.0%) |
| 4 Vehicles | 1,336 (21.2%) | 913 (18.1%) |
| 5 or more Vehicles | 970 (15.4%) | 622 (12.3%) |
| Total | 6,297 (100.0%) | 5,056 (100.0%) |
Commute Time in Ramona
The most frequently occuring commute durations in Ramona are 30 to 34 minutes (2,290 commuters, 22.5%), 60 to 89 minutes (1,464 commuters, 14.4%), and 45 to 59 minutes (1,303 commuters, 12.8%).
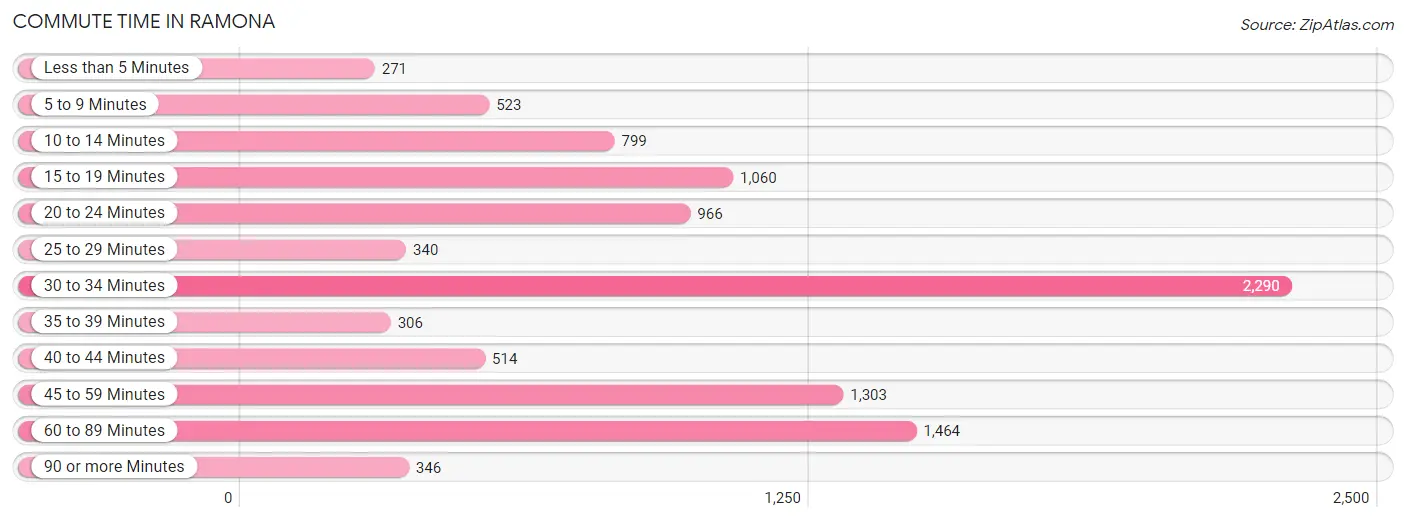
| Commute Time | # Commuters | % Commuters |
| Less than 5 Minutes | 271 | 2.7% |
| 5 to 9 Minutes | 523 | 5.1% |
| 10 to 14 Minutes | 799 | 7.9% |
| 15 to 19 Minutes | 1,060 | 10.4% |
| 20 to 24 Minutes | 966 | 9.5% |
| 25 to 29 Minutes | 340 | 3.3% |
| 30 to 34 Minutes | 2,290 | 22.5% |
| 35 to 39 Minutes | 306 | 3.0% |
| 40 to 44 Minutes | 514 | 5.1% |
| 45 to 59 Minutes | 1,303 | 12.8% |
| 60 to 89 Minutes | 1,464 | 14.4% |
| 90 or more Minutes | 346 | 3.4% |
Commute Time by Sex in Ramona
The most common commute times in Ramona are 30 to 34 minutes (1,578 commuters, 26.9%) for males and 30 to 34 minutes (712 commuters, 16.5%) for females.
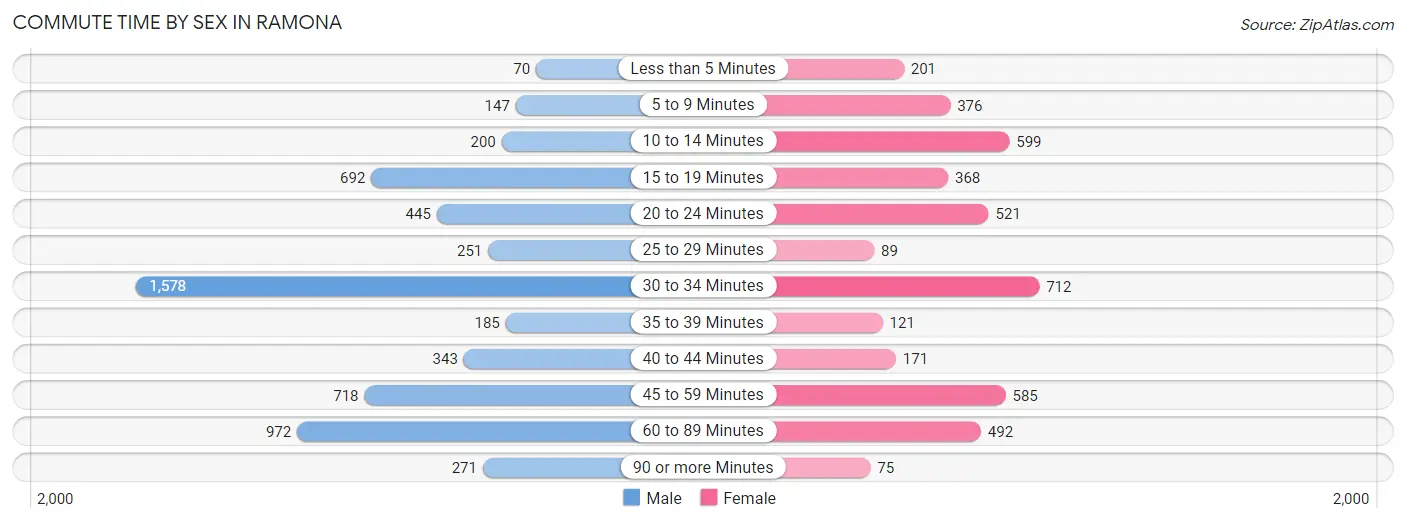
| Commute Time | Male | Female |
| Less than 5 Minutes | 70 (1.2%) | 201 (4.7%) |
| 5 to 9 Minutes | 147 (2.5%) | 376 (8.7%) |
| 10 to 14 Minutes | 200 (3.4%) | 599 (13.9%) |
| 15 to 19 Minutes | 692 (11.8%) | 368 (8.5%) |
| 20 to 24 Minutes | 445 (7.6%) | 521 (12.1%) |
| 25 to 29 Minutes | 251 (4.3%) | 89 (2.1%) |
| 30 to 34 Minutes | 1,578 (26.9%) | 712 (16.5%) |
| 35 to 39 Minutes | 185 (3.2%) | 121 (2.8%) |
| 40 to 44 Minutes | 343 (5.8%) | 171 (4.0%) |
| 45 to 59 Minutes | 718 (12.2%) | 585 (13.6%) |
| 60 to 89 Minutes | 972 (16.6%) | 492 (11.4%) |
| 90 or more Minutes | 271 (4.6%) | 75 (1.7%) |
Time of Departure to Work by Sex in Ramona
The most frequent times of departure to work in Ramona are 6:00 AM to 6:29 AM (799, 13.6%) for males and 7:00 AM to 7:29 AM (816, 18.9%) for females.
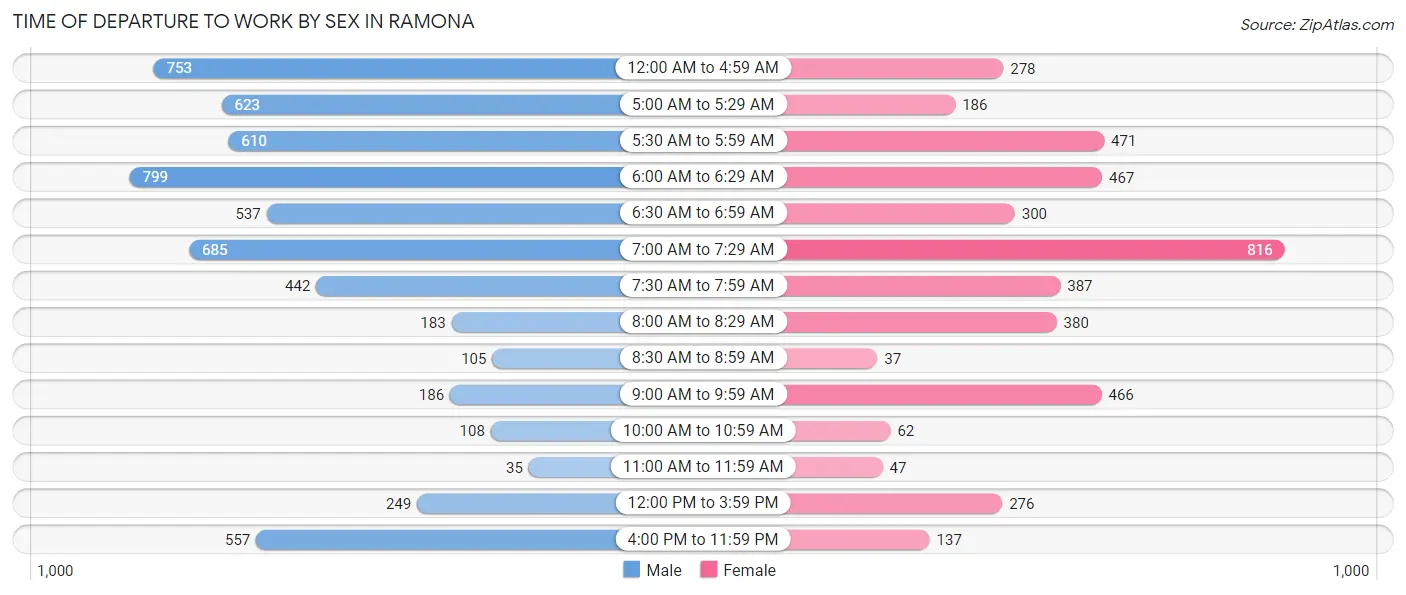
| Time of Departure | Male | Female |
| 12:00 AM to 4:59 AM | 753 (12.8%) | 278 (6.5%) |
| 5:00 AM to 5:29 AM | 623 (10.6%) | 186 (4.3%) |
| 5:30 AM to 5:59 AM | 610 (10.4%) | 471 (10.9%) |
| 6:00 AM to 6:29 AM | 799 (13.6%) | 467 (10.8%) |
| 6:30 AM to 6:59 AM | 537 (9.1%) | 300 (7.0%) |
| 7:00 AM to 7:29 AM | 685 (11.7%) | 816 (18.9%) |
| 7:30 AM to 7:59 AM | 442 (7.5%) | 387 (9.0%) |
| 8:00 AM to 8:29 AM | 183 (3.1%) | 380 (8.8%) |
| 8:30 AM to 8:59 AM | 105 (1.8%) | 37 (0.9%) |
| 9:00 AM to 9:59 AM | 186 (3.2%) | 466 (10.8%) |
| 10:00 AM to 10:59 AM | 108 (1.8%) | 62 (1.4%) |
| 11:00 AM to 11:59 AM | 35 (0.6%) | 47 (1.1%) |
| 12:00 PM to 3:59 PM | 249 (4.2%) | 276 (6.4%) |
| 4:00 PM to 11:59 PM | 557 (9.5%) | 137 (3.2%) |
| Total | 5,872 (100.0%) | 4,310 (100.0%) |
Housing Occupancy in Ramona
Occupancy by Ownership in Ramona
Of the total 7,162 dwellings in Ramona, owner-occupied units account for 4,813 (67.2%), while renter-occupied units make up 2,349 (32.8%).
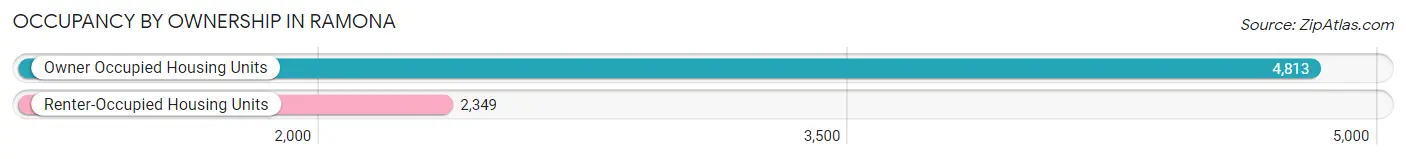
| Occupancy | # Housing Units | % Housing Units |
| Owner Occupied Housing Units | 4,813 | 67.2% |
| Renter-Occupied Housing Units | 2,349 | 32.8% |
| Total Occupied Housing Units | 7,162 | 100.0% |
Occupancy by Household Size in Ramona
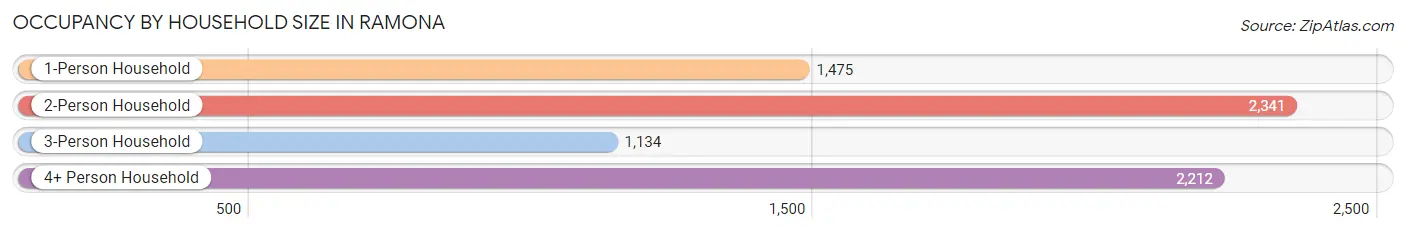
| Household Size | # Housing Units | % Housing Units |
| 1-Person Household | 1,475 | 20.6% |
| 2-Person Household | 2,341 | 32.7% |
| 3-Person Household | 1,134 | 15.8% |
| 4+ Person Household | 2,212 | 30.9% |
| Total Housing Units | 7,162 | 100.0% |
Occupancy by Ownership by Household Size in Ramona
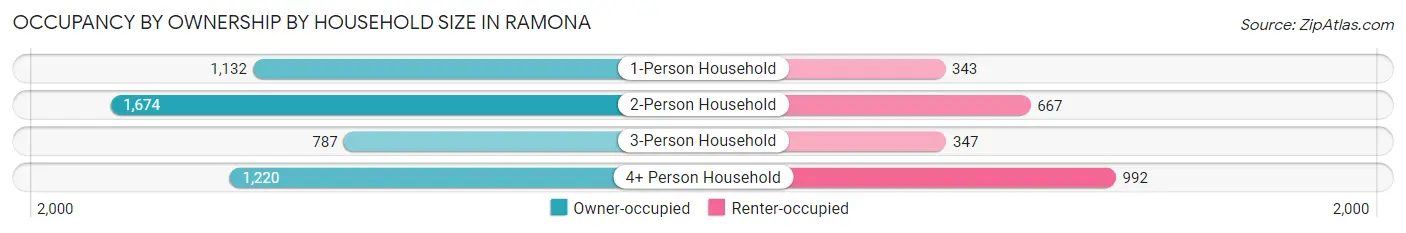
| Household Size | Owner-occupied | Renter-occupied |
| 1-Person Household | 1,132 (76.7%) | 343 (23.3%) |
| 2-Person Household | 1,674 (71.5%) | 667 (28.5%) |
| 3-Person Household | 787 (69.4%) | 347 (30.6%) |
| 4+ Person Household | 1,220 (55.1%) | 992 (44.9%) |
| Total Housing Units | 4,813 (67.2%) | 2,349 (32.8%) |
Occupancy by Educational Attainment in Ramona
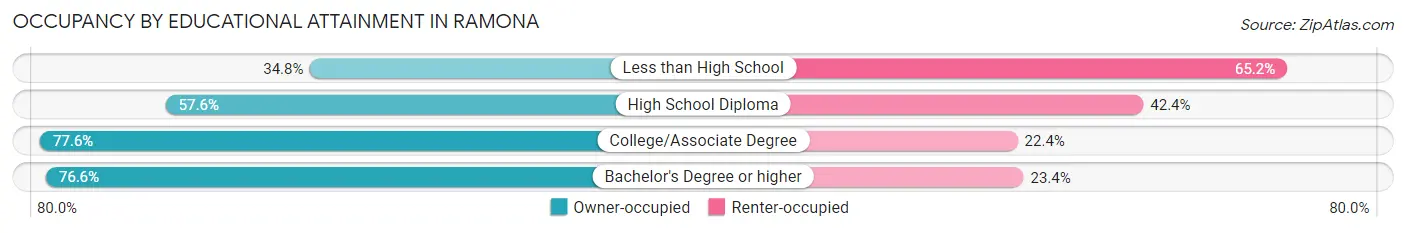
| Household Size | Owner-occupied | Renter-occupied |
| Less than High School | 323 (34.8%) | 604 (65.2%) |
| High School Diploma | 938 (57.6%) | 690 (42.4%) |
| College/Associate Degree | 1,828 (77.6%) | 529 (22.4%) |
| Bachelor's Degree or higher | 1,724 (76.6%) | 526 (23.4%) |
Occupancy by Age of Householder in Ramona
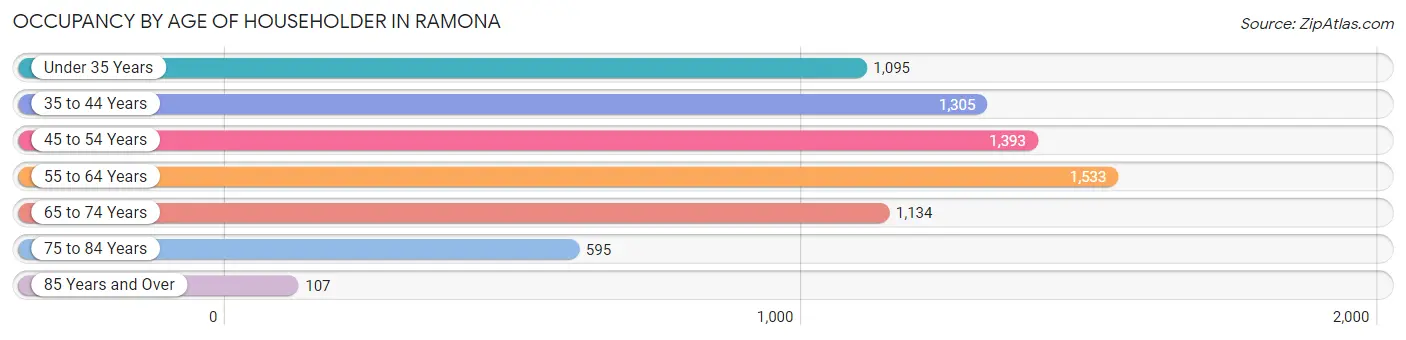
| Age Bracket | # Households | % Households |
| Under 35 Years | 1,095 | 15.3% |
| 35 to 44 Years | 1,305 | 18.2% |
| 45 to 54 Years | 1,393 | 19.5% |
| 55 to 64 Years | 1,533 | 21.4% |
| 65 to 74 Years | 1,134 | 15.8% |
| 75 to 84 Years | 595 | 8.3% |
| 85 Years and Over | 107 | 1.5% |
| Total | 7,162 | 100.0% |
Housing Finances in Ramona
Median Income by Occupancy in Ramona
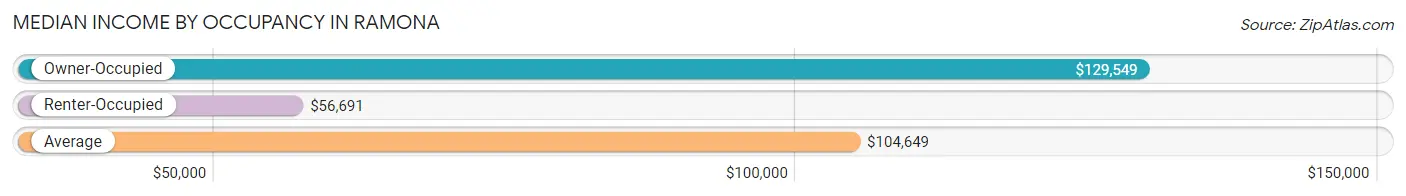
| Occupancy Type | # Households | Median Income |
| Owner-Occupied | 4,813 (67.2%) | $129,549 |
| Renter-Occupied | 2,349 (32.8%) | $56,691 |
| Average | 7,162 (100.0%) | $104,649 |
Occupancy by Householder Income Bracket in Ramona
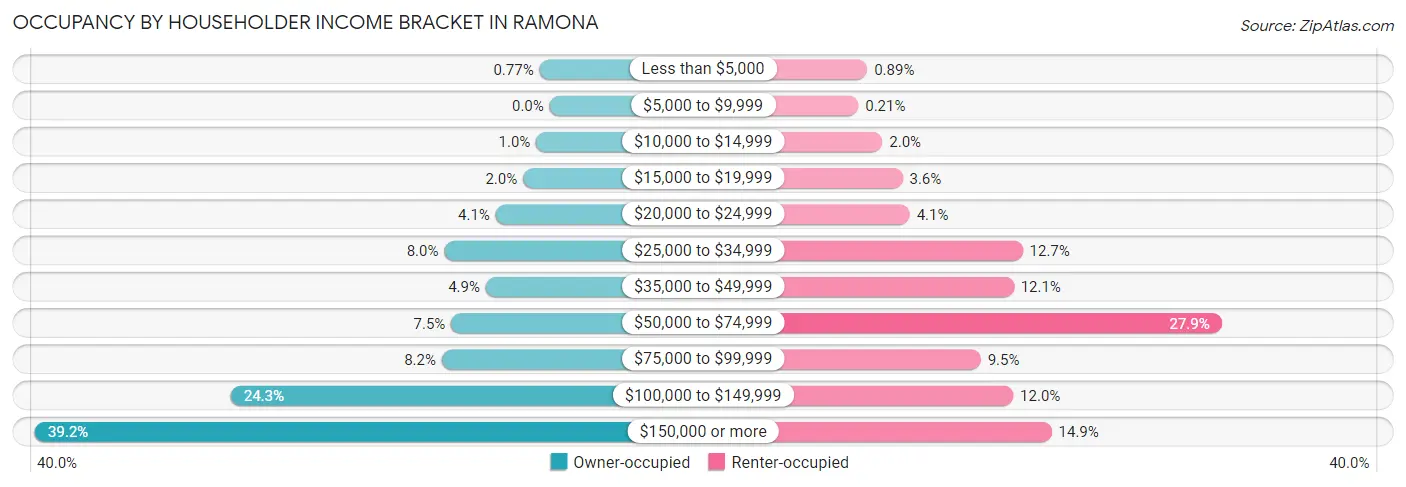
| Income Bracket | Owner-occupied | Renter-occupied |
| Less than $5,000 | 37 (0.8%) | 21 (0.9%) |
| $5,000 to $9,999 | 0 (0.0%) | 5 (0.2%) |
| $10,000 to $14,999 | 49 (1.0%) | 48 (2.0%) |
| $15,000 to $19,999 | 97 (2.0%) | 84 (3.6%) |
| $20,000 to $24,999 | 198 (4.1%) | 97 (4.1%) |
| $25,000 to $34,999 | 386 (8.0%) | 299 (12.7%) |
| $35,000 to $49,999 | 234 (4.9%) | 283 (12.0%) |
| $50,000 to $74,999 | 361 (7.5%) | 655 (27.9%) |
| $75,000 to $99,999 | 395 (8.2%) | 224 (9.5%) |
| $100,000 to $149,999 | 1,169 (24.3%) | 282 (12.0%) |
| $150,000 or more | 1,887 (39.2%) | 351 (14.9%) |
| Total | 4,813 (100.0%) | 2,349 (100.0%) |
Monthly Housing Cost Tiers in Ramona
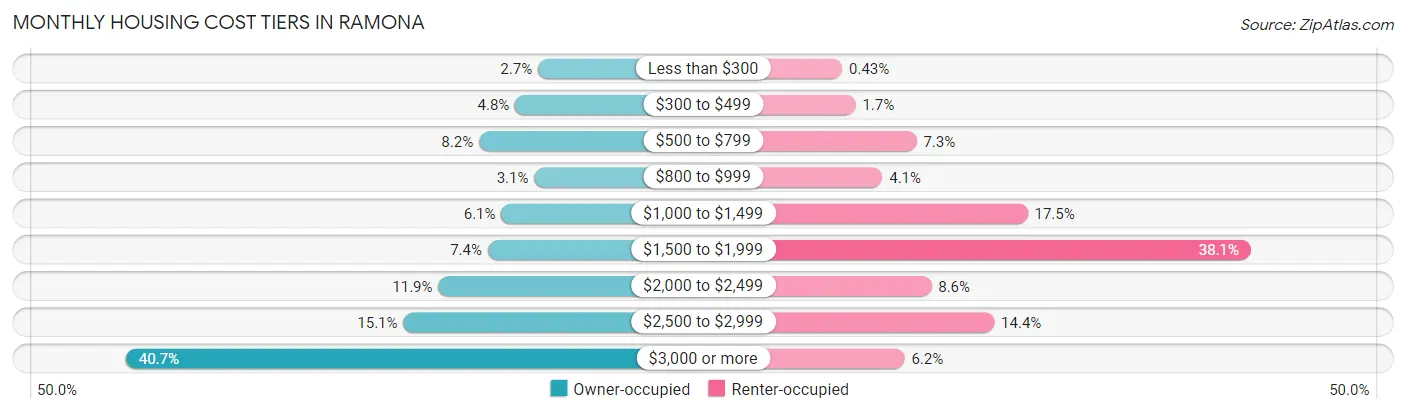
| Monthly Cost | Owner-occupied | Renter-occupied |
| Less than $300 | 132 (2.7%) | 10 (0.4%) |
| $300 to $499 | 233 (4.8%) | 39 (1.7%) |
| $500 to $799 | 393 (8.2%) | 171 (7.3%) |
| $800 to $999 | 148 (3.1%) | 97 (4.1%) |
| $1,000 to $1,499 | 294 (6.1%) | 411 (17.5%) |
| $1,500 to $1,999 | 354 (7.4%) | 894 (38.1%) |
| $2,000 to $2,499 | 573 (11.9%) | 203 (8.6%) |
| $2,500 to $2,999 | 728 (15.1%) | 339 (14.4%) |
| $3,000 or more | 1,958 (40.7%) | 145 (6.2%) |
| Total | 4,813 (100.0%) | 2,349 (100.0%) |
Physical Housing Characteristics in Ramona
Housing Structures in Ramona
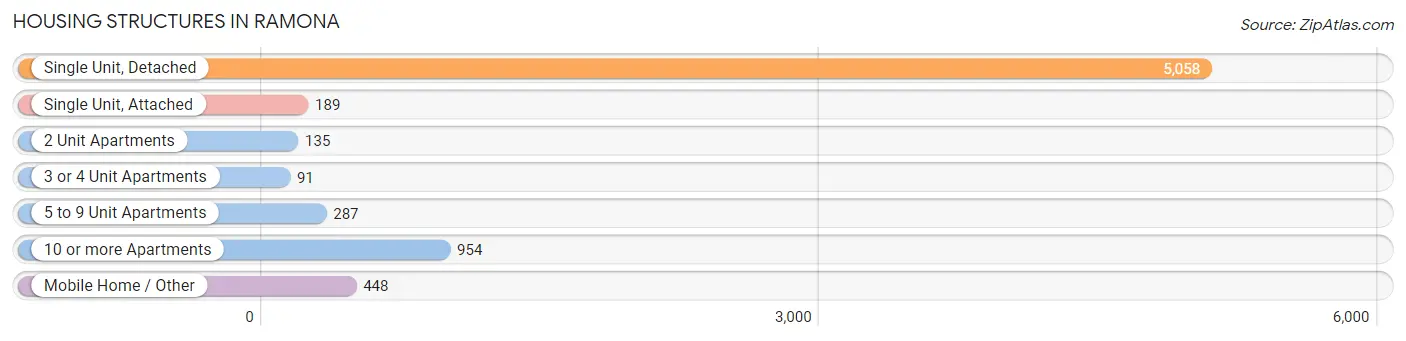
| Structure Type | # Housing Units | % Housing Units |
| Single Unit, Detached | 5,058 | 70.6% |
| Single Unit, Attached | 189 | 2.6% |
| 2 Unit Apartments | 135 | 1.9% |
| 3 or 4 Unit Apartments | 91 | 1.3% |
| 5 to 9 Unit Apartments | 287 | 4.0% |
| 10 or more Apartments | 954 | 13.3% |
| Mobile Home / Other | 448 | 6.3% |
| Total | 7,162 | 100.0% |
Housing Structures by Occupancy in Ramona
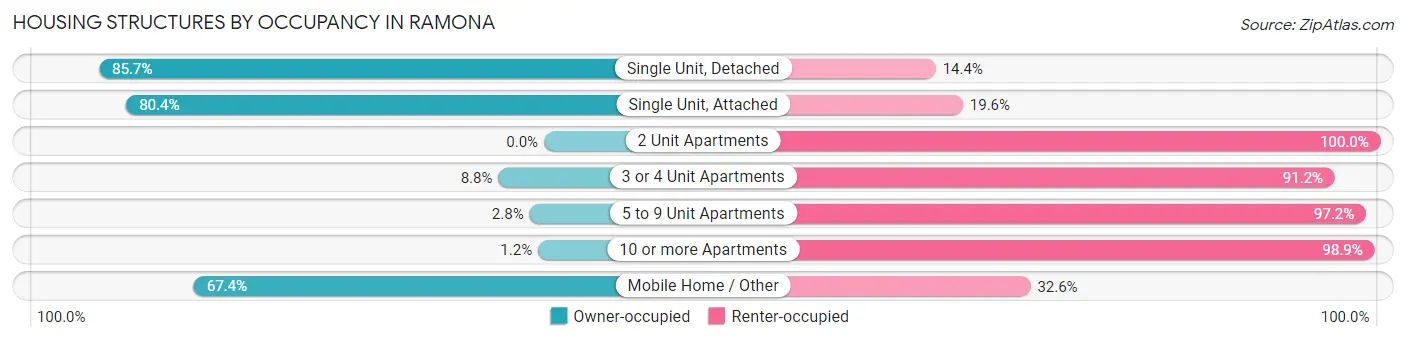
| Structure Type | Owner-occupied | Renter-occupied |
| Single Unit, Detached | 4,332 (85.7%) | 726 (14.3%) |
| Single Unit, Attached | 152 (80.4%) | 37 (19.6%) |
| 2 Unit Apartments | 0 (0.0%) | 135 (100.0%) |
| 3 or 4 Unit Apartments | 8 (8.8%) | 83 (91.2%) |
| 5 to 9 Unit Apartments | 8 (2.8%) | 279 (97.2%) |
| 10 or more Apartments | 11 (1.1%) | 943 (98.9%) |
| Mobile Home / Other | 302 (67.4%) | 146 (32.6%) |
| Total | 4,813 (67.2%) | 2,349 (32.8%) |
Housing Structures by Number of Rooms in Ramona
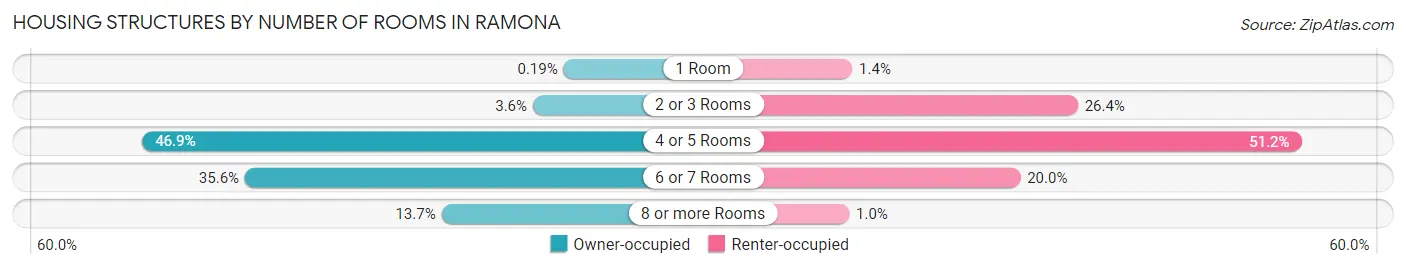
| Number of Rooms | Owner-occupied | Renter-occupied |
| 1 Room | 9 (0.2%) | 32 (1.4%) |
| 2 or 3 Rooms | 173 (3.6%) | 620 (26.4%) |
| 4 or 5 Rooms | 2,259 (46.9%) | 1,203 (51.2%) |
| 6 or 7 Rooms | 1,711 (35.5%) | 470 (20.0%) |
| 8 or more Rooms | 661 (13.7%) | 24 (1.0%) |
| Total | 4,813 (100.0%) | 2,349 (100.0%) |
Housing Structure by Heating Type in Ramona
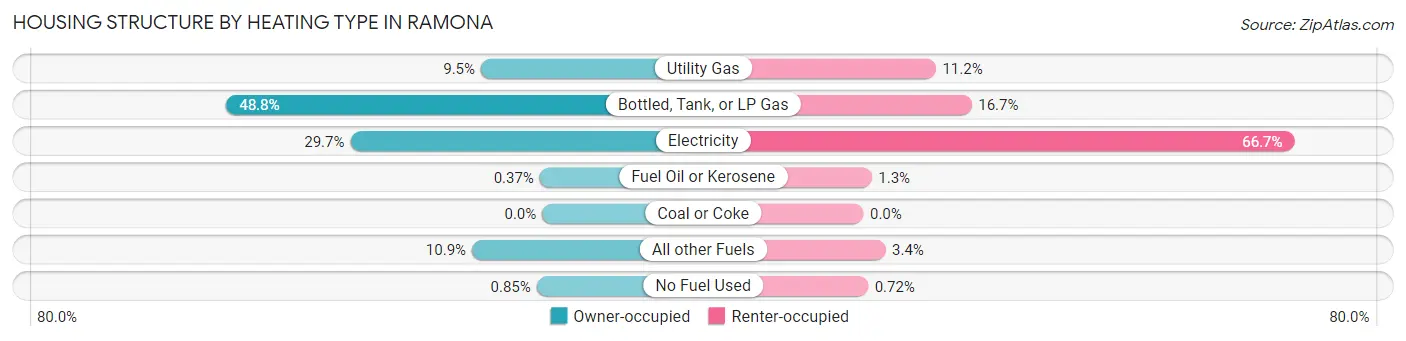
| Heating Type | Owner-occupied | Renter-occupied |
| Utility Gas | 456 (9.5%) | 263 (11.2%) |
| Bottled, Tank, or LP Gas | 2,349 (48.8%) | 393 (16.7%) |
| Electricity | 1,427 (29.6%) | 1,566 (66.7%) |
| Fuel Oil or Kerosene | 18 (0.4%) | 30 (1.3%) |
| Coal or Coke | 0 (0.0%) | 0 (0.0%) |
| All other Fuels | 522 (10.8%) | 80 (3.4%) |
| No Fuel Used | 41 (0.9%) | 17 (0.7%) |
| Total | 4,813 (100.0%) | 2,349 (100.0%) |
Household Vehicle Usage in Ramona
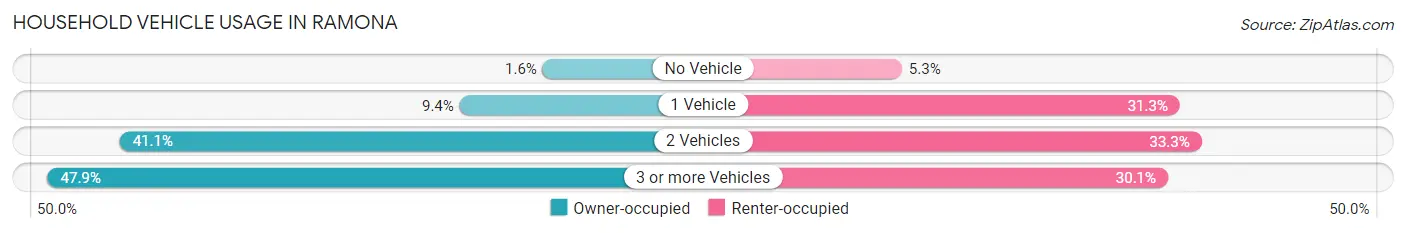
| Vehicles per Household | Owner-occupied | Renter-occupied |
| No Vehicle | 79 (1.6%) | 125 (5.3%) |
| 1 Vehicle | 452 (9.4%) | 734 (31.2%) |
| 2 Vehicles | 1,979 (41.1%) | 782 (33.3%) |
| 3 or more Vehicles | 2,303 (47.8%) | 708 (30.1%) |
| Total | 4,813 (100.0%) | 2,349 (100.0%) |
Real Estate & Mortgages in Ramona
Real Estate and Mortgage Overview in Ramona
| Characteristic | Without Mortgage | With Mortgage |
| Housing Units | 1,188 | 3,625 |
| Median Property Value | $537,500 | $697,900 |
| Median Household Income | $70,682 | $1,744 |
| Monthly Housing Costs | $685 | $1,958 |
| Real Estate Taxes | $2,374 | $118 |
Property Value by Mortgage Status in Ramona
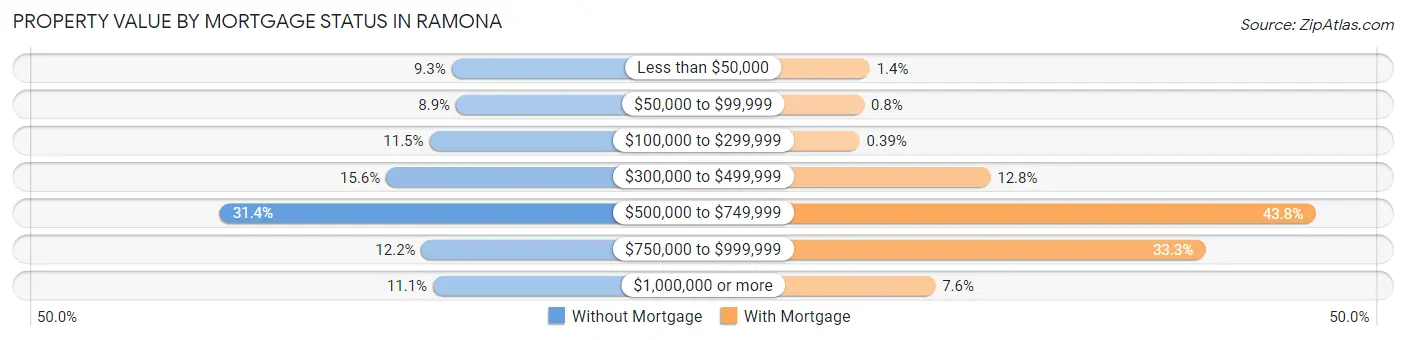
| Property Value | Without Mortgage | With Mortgage |
| Less than $50,000 | 111 (9.3%) | 49 (1.3%) |
| $50,000 to $99,999 | 106 (8.9%) | 29 (0.8%) |
| $100,000 to $299,999 | 136 (11.5%) | 14 (0.4%) |
| $300,000 to $499,999 | 185 (15.6%) | 465 (12.8%) |
| $500,000 to $749,999 | 373 (31.4%) | 1,586 (43.8%) |
| $750,000 to $999,999 | 145 (12.2%) | 1,207 (33.3%) |
| $1,000,000 or more | 132 (11.1%) | 275 (7.6%) |
| Total | 1,188 (100.0%) | 3,625 (100.0%) |
Household Income by Mortgage Status in Ramona
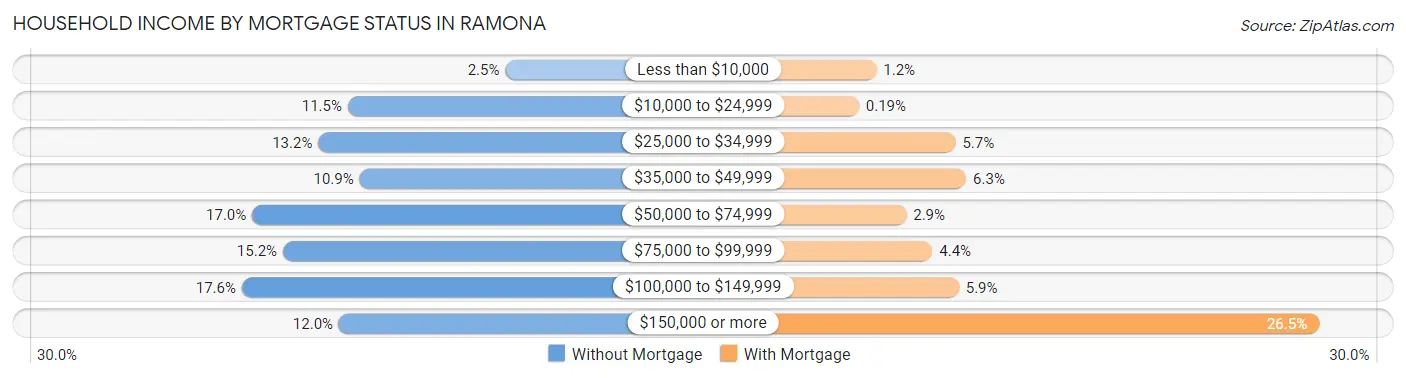
| Household Income | Without Mortgage | With Mortgage |
| Less than $10,000 | 30 (2.5%) | 43 (1.2%) |
| $10,000 to $24,999 | 137 (11.5%) | 7 (0.2%) |
| $25,000 to $34,999 | 157 (13.2%) | 207 (5.7%) |
| $35,000 to $49,999 | 129 (10.9%) | 229 (6.3%) |
| $50,000 to $74,999 | 202 (17.0%) | 105 (2.9%) |
| $75,000 to $99,999 | 181 (15.2%) | 159 (4.4%) |
| $100,000 to $149,999 | 209 (17.6%) | 214 (5.9%) |
| $150,000 or more | 143 (12.0%) | 960 (26.5%) |
| Total | 1,188 (100.0%) | 3,625 (100.0%) |
Property Value to Household Income Ratio in Ramona
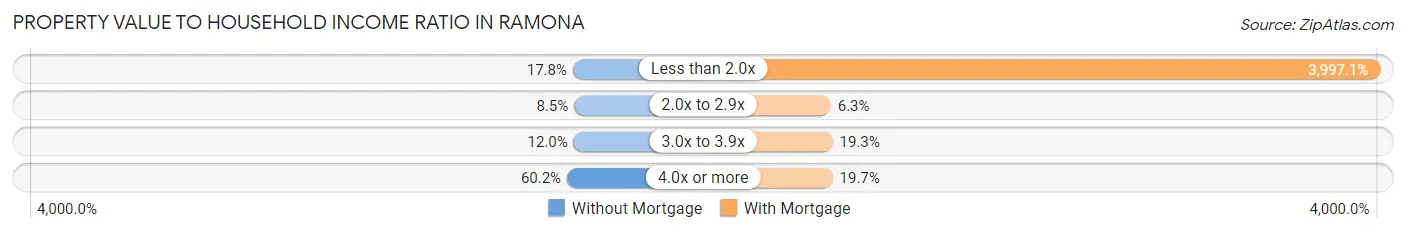
| Value-to-Income Ratio | Without Mortgage | With Mortgage |
| Less than 2.0x | 211 (17.8%) | 144,896 (3,997.1%) |
| 2.0x to 2.9x | 101 (8.5%) | 230 (6.3%) |
| 3.0x to 3.9x | 143 (12.0%) | 699 (19.3%) |
| 4.0x or more | 715 (60.2%) | 715 (19.7%) |
| Total | 1,188 (100.0%) | 3,625 (100.0%) |
Real Estate Taxes by Mortgage Status in Ramona
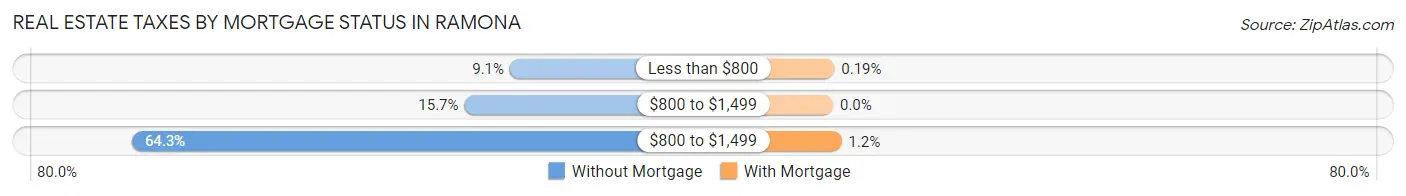
| Property Taxes | Without Mortgage | With Mortgage |
| Less than $800 | 108 (9.1%) | 7 (0.2%) |
| $800 to $1,499 | 187 (15.7%) | 0 (0.0%) |
| $800 to $1,499 | 764 (64.3%) | 45 (1.2%) |
| Total | 1,188 (100.0%) | 3,625 (100.0%) |
Health & Disability in Ramona
Health Insurance Coverage by Age in Ramona
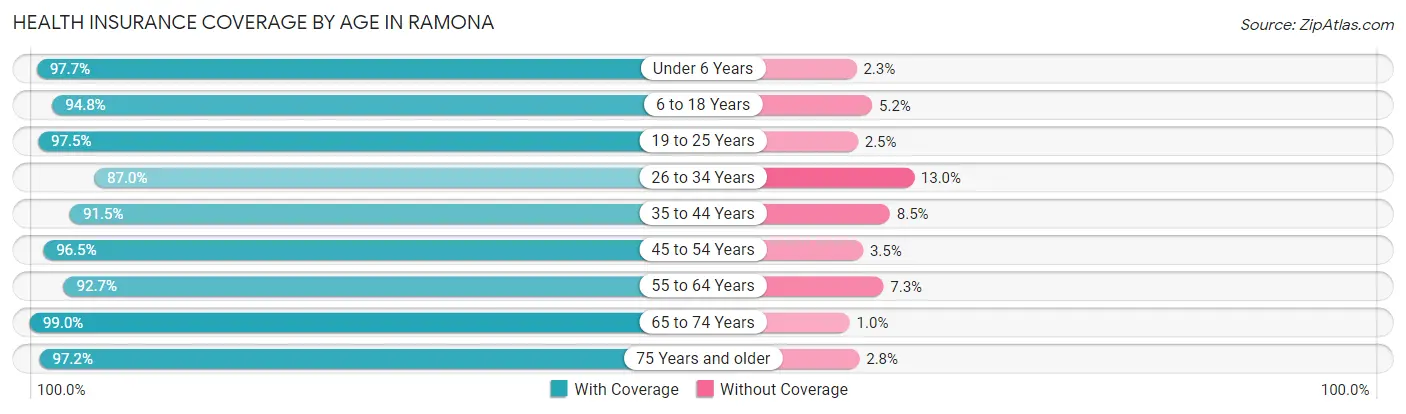
| Age Bracket | With Coverage | Without Coverage |
| Under 6 Years | 1,510 (97.7%) | 35 (2.3%) |
| 6 to 18 Years | 3,598 (94.8%) | 197 (5.2%) |
| 19 to 25 Years | 1,980 (97.5%) | 51 (2.5%) |
| 26 to 34 Years | 2,314 (87.0%) | 345 (13.0%) |
| 35 to 44 Years | 2,545 (91.5%) | 236 (8.5%) |
| 45 to 54 Years | 2,749 (96.5%) | 99 (3.5%) |
| 55 to 64 Years | 2,752 (92.7%) | 216 (7.3%) |
| 65 to 74 Years | 1,880 (99.0%) | 19 (1.0%) |
| 75 Years and older | 1,320 (97.2%) | 38 (2.8%) |
| Total | 20,648 (94.4%) | 1,236 (5.7%) |
Health Insurance Coverage by Citizenship Status in Ramona
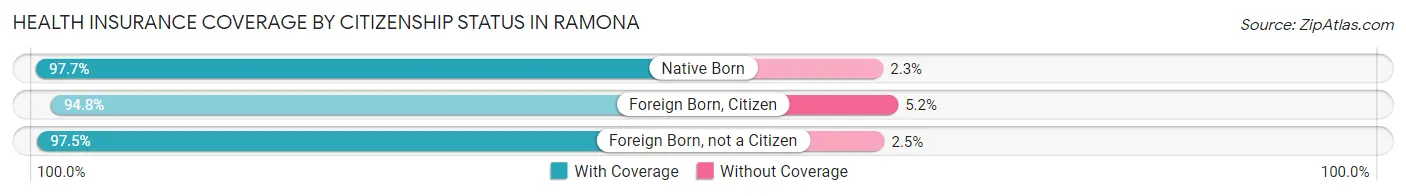
| Citizenship Status | With Coverage | Without Coverage |
| Native Born | 1,510 (97.7%) | 35 (2.3%) |
| Foreign Born, Citizen | 3,598 (94.8%) | 197 (5.2%) |
| Foreign Born, not a Citizen | 1,980 (97.5%) | 51 (2.5%) |
Health Insurance Coverage by Household Income in Ramona
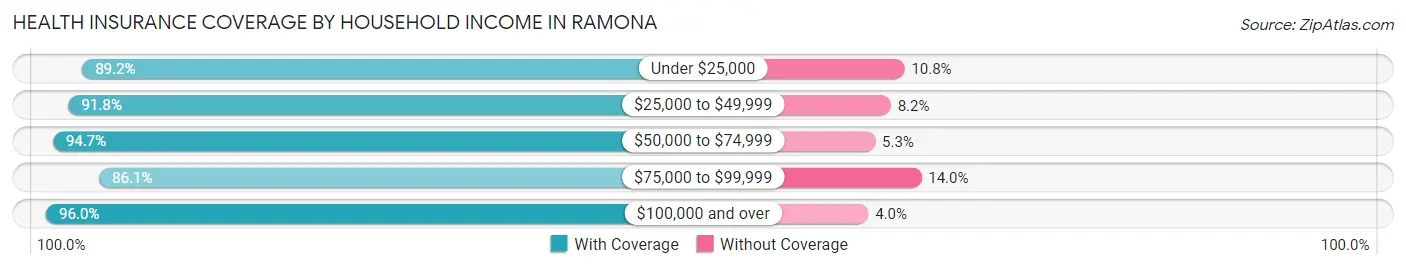
| Household Income | With Coverage | Without Coverage |
| Under $25,000 | 809 (89.2%) | 98 (10.8%) |
| $25,000 to $49,999 | 2,486 (91.8%) | 223 (8.2%) |
| $50,000 to $74,999 | 3,484 (94.7%) | 195 (5.3%) |
| $75,000 to $99,999 | 1,166 (86.1%) | 189 (14.0%) |
| $100,000 and over | 12,554 (96.0%) | 526 (4.0%) |
Public vs Private Health Insurance Coverage by Age in Ramona
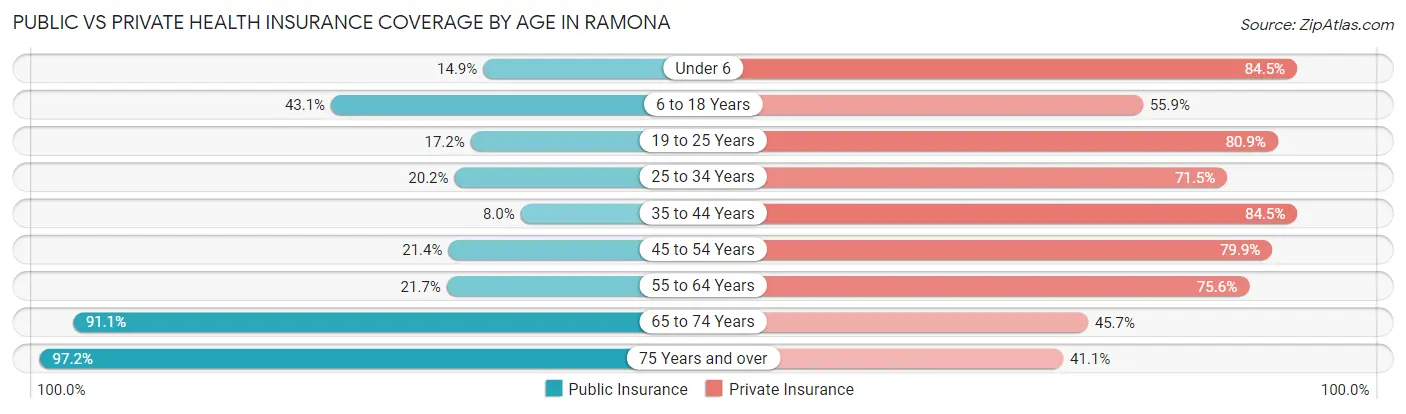
| Age Bracket | Public Insurance | Private Insurance |
| Under 6 | 230 (14.9%) | 1,305 (84.5%) |
| 6 to 18 Years | 1,637 (43.1%) | 2,120 (55.9%) |
| 19 to 25 Years | 350 (17.2%) | 1,643 (80.9%) |
| 25 to 34 Years | 538 (20.2%) | 1,902 (71.5%) |
| 35 to 44 Years | 221 (8.0%) | 2,351 (84.5%) |
| 45 to 54 Years | 608 (21.3%) | 2,275 (79.9%) |
| 55 to 64 Years | 643 (21.7%) | 2,243 (75.6%) |
| 65 to 74 Years | 1,729 (91.0%) | 867 (45.7%) |
| 75 Years and over | 1,320 (97.2%) | 558 (41.1%) |
| Total | 7,276 (33.3%) | 15,264 (69.8%) |
Disability Status by Sex by Age in Ramona
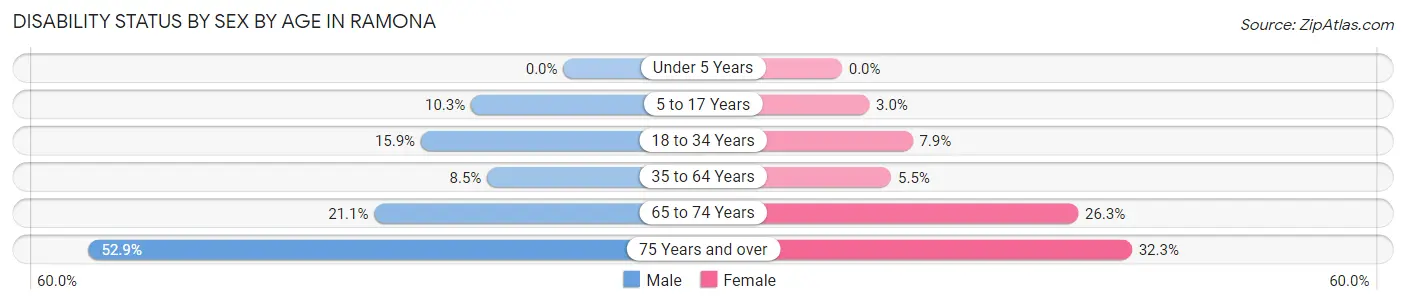
| Age Bracket | Male | Female |
| Under 5 Years | 0 (0.0%) | 0 (0.0%) |
| 5 to 17 Years | 204 (10.3%) | 47 (3.0%) |
| 18 to 34 Years | 412 (15.9%) | 207 (7.9%) |
| 35 to 64 Years | 371 (8.5%) | 232 (5.5%) |
| 65 to 74 Years | 179 (21.1%) | 276 (26.3%) |
| 75 Years and over | 312 (52.9%) | 248 (32.3%) |
Disability Class by Sex by Age in Ramona
Disability Class: Hearing Difficulty
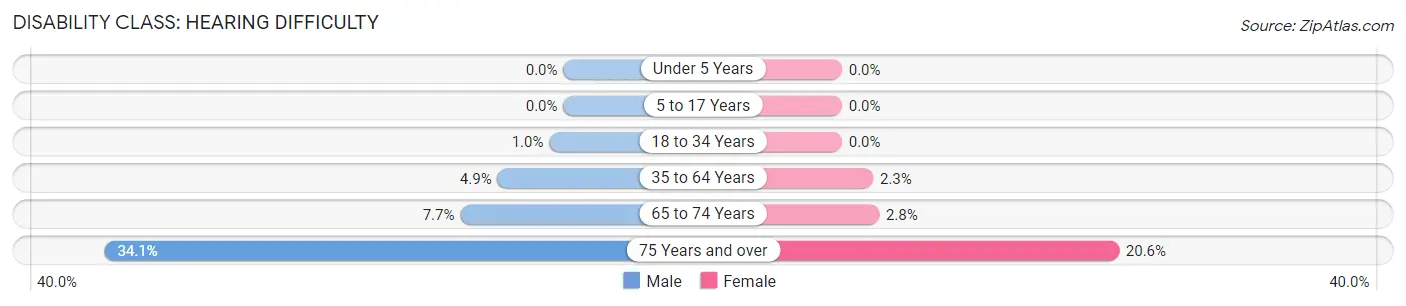
| Age Bracket | Male | Female |
| Under 5 Years | 0 (0.0%) | 0 (0.0%) |
| 5 to 17 Years | 0 (0.0%) | 0 (0.0%) |
| 18 to 34 Years | 27 (1.0%) | 0 (0.0%) |
| 35 to 64 Years | 214 (4.9%) | 98 (2.3%) |
| 65 to 74 Years | 65 (7.6%) | 29 (2.8%) |
| 75 Years and over | 201 (34.1%) | 158 (20.6%) |
Disability Class: Vision Difficulty
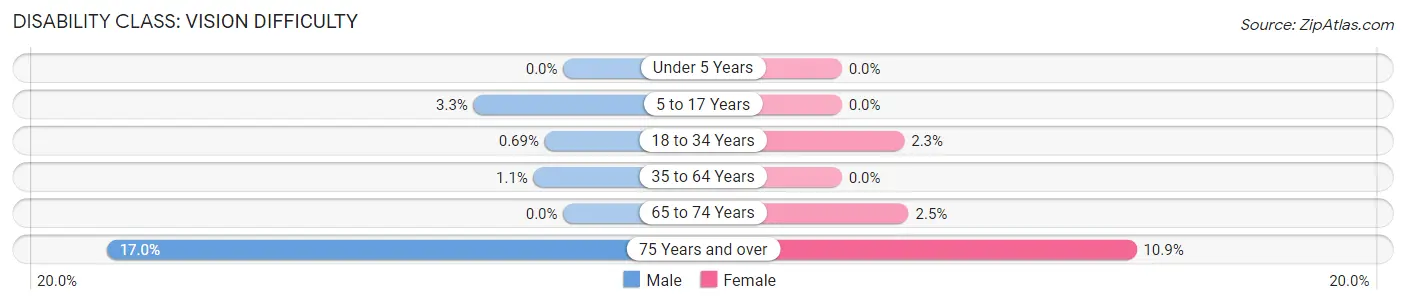
| Age Bracket | Male | Female |
| Under 5 Years | 0 (0.0%) | 0 (0.0%) |
| 5 to 17 Years | 66 (3.3%) | 0 (0.0%) |
| 18 to 34 Years | 18 (0.7%) | 61 (2.3%) |
| 35 to 64 Years | 48 (1.1%) | 0 (0.0%) |
| 65 to 74 Years | 0 (0.0%) | 26 (2.5%) |
| 75 Years and over | 100 (17.0%) | 84 (10.9%) |
Disability Class: Cognitive Difficulty
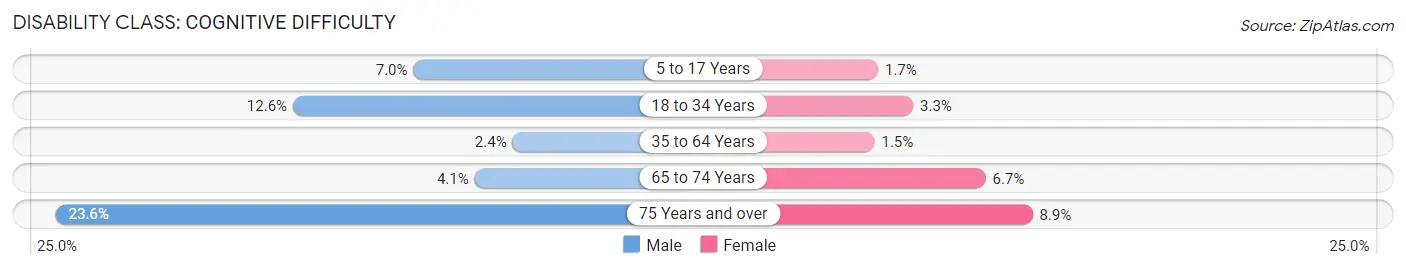
| Age Bracket | Male | Female |
| 5 to 17 Years | 138 (7.0%) | 26 (1.7%) |
| 18 to 34 Years | 326 (12.6%) | 87 (3.3%) |
| 35 to 64 Years | 103 (2.4%) | 64 (1.5%) |
| 65 to 74 Years | 35 (4.1%) | 70 (6.7%) |
| 75 Years and over | 139 (23.6%) | 68 (8.8%) |
Disability Class: Ambulatory Difficulty
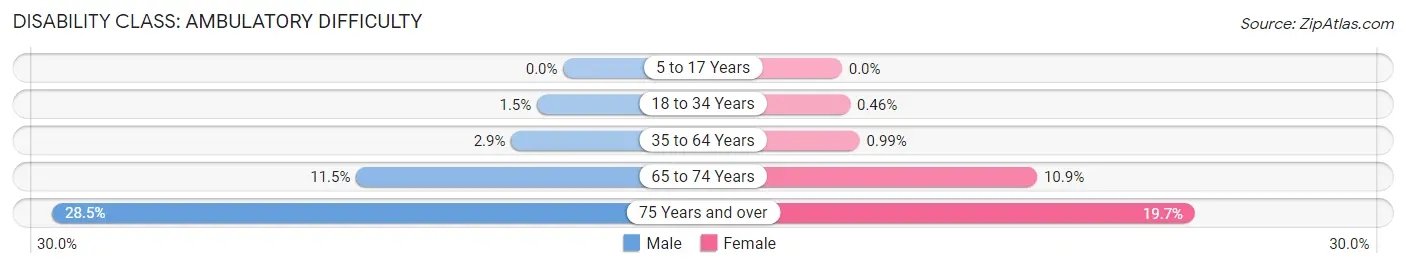
| Age Bracket | Male | Female |
| 5 to 17 Years | 0 (0.0%) | 0 (0.0%) |
| 18 to 34 Years | 38 (1.5%) | 12 (0.5%) |
| 35 to 64 Years | 127 (2.9%) | 42 (1.0%) |
| 65 to 74 Years | 98 (11.5%) | 114 (10.9%) |
| 75 Years and over | 168 (28.5%) | 151 (19.7%) |
Disability Class: Self-Care Difficulty
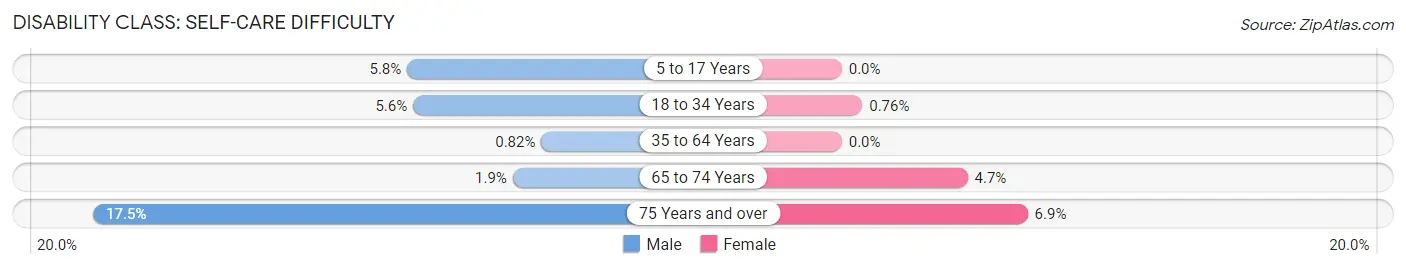
| Age Bracket | Male | Female |
| 5 to 17 Years | 115 (5.8%) | 0 (0.0%) |
| 18 to 34 Years | 145 (5.6%) | 20 (0.8%) |
| 35 to 64 Years | 36 (0.8%) | 0 (0.0%) |
| 65 to 74 Years | 16 (1.9%) | 49 (4.7%) |
| 75 Years and over | 103 (17.5%) | 53 (6.9%) |
Technology Access in Ramona
Computing Device Access in Ramona
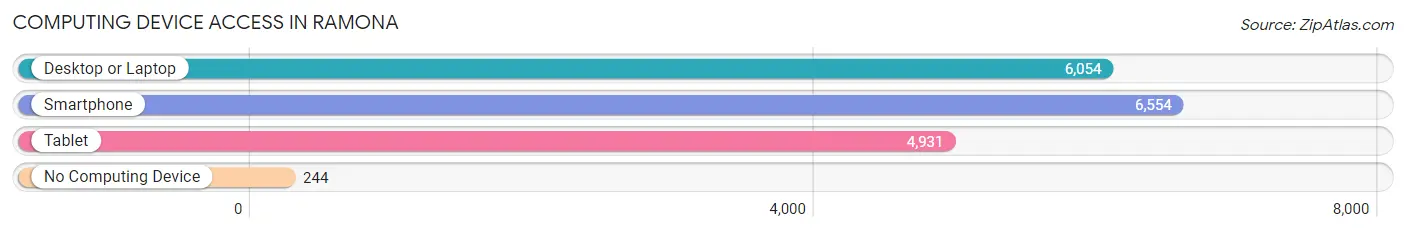
| Device Type | # Households | % Households |
| Desktop or Laptop | 6,054 | 84.5% |
| Smartphone | 6,554 | 91.5% |
| Tablet | 4,931 | 68.9% |
| No Computing Device | 244 | 3.4% |
| Total | 7,162 | 100.0% |
Internet Access in Ramona
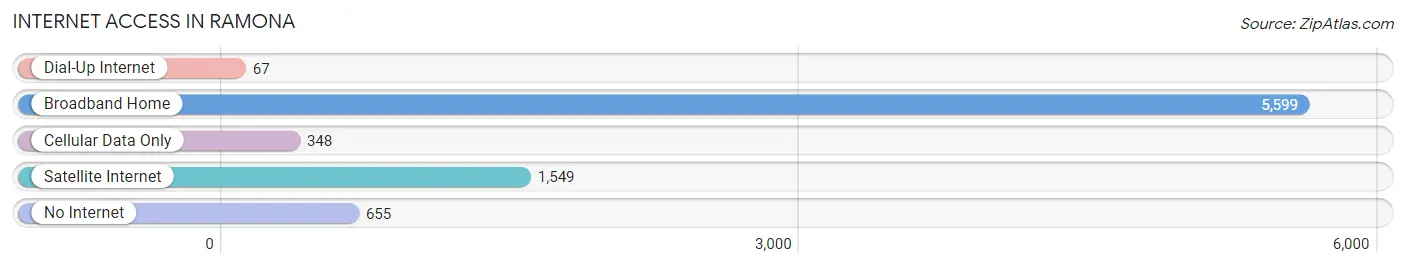
| Internet Type | # Households | % Households |
| Dial-Up Internet | 67 | 0.9% |
| Broadband Home | 5,599 | 78.2% |
| Cellular Data Only | 348 | 4.9% |
| Satellite Internet | 1,549 | 21.6% |
| No Internet | 655 | 9.1% |
| Total | 7,162 | 100.0% |
Ramona Summary
Ramona, California is a small unincorporated community located in San Diego County, California. It is situated in the foothills of the Cuyamaca Mountains, approximately 40 miles northeast of downtown San Diego. The population of Ramona was estimated to be 20,292 in 2019.
History
Ramona was founded in 1886 by the founder of the San Diego Union, John A. Fry. Fry named the town after the title character in the novel Ramona by Helen Hunt Jackson. The novel was set in Southern California and was popular at the time. The town was officially incorporated in 1886 and was the first incorporated town in San Diego County.
The town was originally a farming community, with the main crops being grapes, olives, and citrus. The town was also home to a number of small businesses, including a blacksmith, a general store, and a hotel.
In the early 1900s, the town began to grow and develop. The first school was built in 1906 and the first post office was established in 1907. The town also had a number of churches, including the First Methodist Church, which was built in 1910.
In the 1920s, the town began to experience a population boom. This was due to the construction of the San Diego and Arizona Eastern Railway, which connected Ramona to San Diego. This allowed for the easy transportation of goods and people, which helped to spur the growth of the town.
Geography
Ramona is located in the foothills of the Cuyamaca Mountains, approximately 40 miles northeast of downtown San Diego. The town is situated at an elevation of 1,400 feet above sea level. The town is surrounded by rolling hills and is home to a number of creeks and streams.
The climate in Ramona is semi-arid, with hot summers and mild winters. The average annual temperature is 68 degrees Fahrenheit. The average annual precipitation is 11.5 inches.
Economy
The economy of Ramona is largely based on agriculture. The main crops grown in the area are grapes, olives, and citrus. The town is also home to a number of small businesses, including restaurants, retail stores, and auto repair shops.
The town is also home to a number of wineries, including the Ramona Valley Vineyard and the Ramona Ranch Winery. The town is also home to a number of tourist attractions, including the Ramona Country Fair and the Ramona Outdoor Museum.
Demographics
As of 2019, the population of Ramona was estimated to be 20,292. The racial makeup of the town was 79.2% White, 1.3% African American, 0.7% Native American, 0.7% Asian, 0.2% Pacific Islander, and 16.1% from other races. The median household income was $63,945 and the median age was 38.7 years.
Conclusion
Ramona, California is a small unincorporated community located in San Diego County, California. It is situated in the foothills of the Cuyamaca Mountains, approximately 40 miles northeast of downtown San Diego. The population of Ramona was estimated to be 20,292 in 2019. The town was founded in 1886 and was the first incorporated town in San Diego County. The economy of Ramona is largely based on agriculture, with the main crops being grapes, olives, and citrus. The town is also home to a number of small businesses, wineries, and tourist attractions. The racial makeup of the town was 79.2% White, 1.3% African American, 0.7% Native American, 0.7% Asian, 0.2% Pacific Islander, and 16.1% from other races. The median household income was $63,945 and the median age was 38.7 years.
Common Questions
What is Per Capita Income in Ramona?
Per Capita income in Ramona is $41,156.
What is the Median Family Income in Ramona?
Median Family Income in Ramona is $111,849.
What is the Median Household income in Ramona?
Median Household Income in Ramona is $104,649.
What is Income or Wage Gap in Ramona?
Income or Wage Gap in Ramona is 26.9%.
Women in Ramona earn 73.1 cents for every dollar earned by a man.
What is Family Income Deficit in Ramona?
Family Income Deficit in Ramona is $6,145.
Families that are below poverty line in Ramona earn $6,145 less on average than the poverty threshold level.
What is Inequality or Gini Index in Ramona?
Inequality or Gini Index in Ramona is 0.42.
What is the Total Population of Ramona?
Total Population of Ramona is 22,118.
What is the Total Male Population of Ramona?
Total Male Population of Ramona is 11,393.
What is the Total Female Population of Ramona?
Total Female Population of Ramona is 10,725.
What is the Ratio of Males per 100 Females in Ramona?
There are 106.23 Males per 100 Females in Ramona.
What is the Ratio of Females per 100 Males in Ramona?
There are 94.14 Females per 100 Males in Ramona.
What is the Median Population Age in Ramona?
Median Population Age in Ramona is 38.2 Years.
What is the Average Family Size in Ramona
Average Family Size in Ramona is 3.5 People.
What is the Average Household Size in Ramona
Average Household Size in Ramona is 3.1 People.
How Large is the Labor Force in Ramona?
There are 11,936 People in the Labor Forcein in Ramona.
What is the Percentage of People in the Labor Force in Ramona?
67.6% of People are in the Labor Force in Ramona.
What is the Unemployment Rate in Ramona?
Unemployment Rate in Ramona is 3.8%.