Potter Valley, CA Map & Demographics
Potter Valley Map
Potter Valley Overview
$41,985
PER CAPITA INCOME
$128,839
AVG FAMILY INCOME
$76,250
AVG HOUSEHOLD INCOME
28.9%
WAGE / INCOME GAP [ % ]
71.1¢/ $1
WAGE / INCOME GAP [ $ ]
0.37
INEQUALITY / GINI INDEX
537
TOTAL POPULATION
238
MALE POPULATION
299
FEMALE POPULATION
79.60
MALES / 100 FEMALES
125.63
FEMALES / 100 MALES
37.8
MEDIAN AGE
3.2
AVG FAMILY SIZE
2.3
AVG HOUSEHOLD SIZE
254
LABOR FORCE [ PEOPLE ]
58.0%
PERCENT IN LABOR FORCE
7.9%
UNEMPLOYMENT RATE
Potter Valley Zip Codes
Potter Valley Area Codes
Income in Potter Valley
Income Overview in Potter Valley
Per Capita Income in Potter Valley is $41,985, while median incomes of families and households are $128,839 and $76,250 respectively.
| Characteristic | Number | Measure |
| Per Capita Income | 537 | $41,985 |
| Median Family Income | 129 | $128,839 |
| Mean Family Income | 129 | $119,619 |
| Median Household Income | 219 | $76,250 |
| Mean Household Income | 219 | $93,894 |
| Income Deficit | 129 | $0 |
| Wage / Income Gap (%) | 537 | 28.89% |
| Wage / Income Gap ($) | 537 | 71.11¢ per $1 |
| Gini / Inequality Index | 537 | 0.37 |
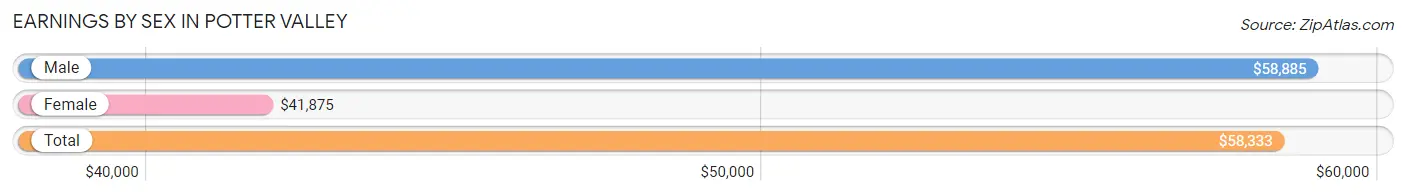
Earnings by Sex in Potter Valley
Average Earnings in Potter Valley are $58,333, $58,885 for men and $41,875 for women, a difference of 28.9%.
| Sex | Number | Average Earnings |
| Male | 151 (59.5%) | $58,885 |
| Female | 103 (40.6%) | $41,875 |
| Total | 254 (100.0%) | $58,333 |
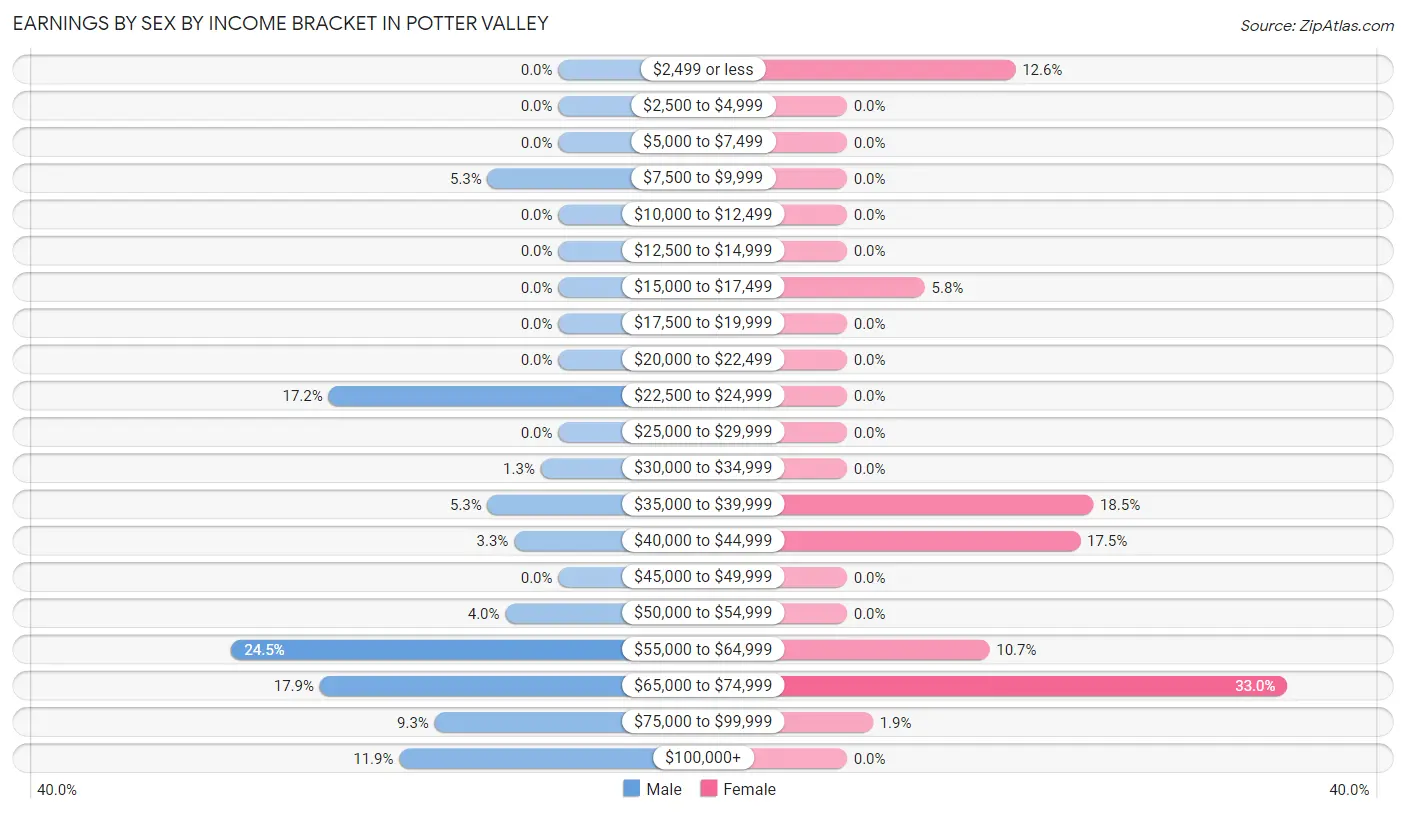
Earnings by Sex by Income Bracket in Potter Valley
The most common earnings brackets in Potter Valley are $55,000 to $64,999 for men (37 | 24.5%) and $65,000 to $74,999 for women (34 | 33.0%).
| Income | Male | Female |
| $2,499 or less | 0 (0.0%) | 13 (12.6%) |
| $2,500 to $4,999 | 0 (0.0%) | 0 (0.0%) |
| $5,000 to $7,499 | 0 (0.0%) | 0 (0.0%) |
| $7,500 to $9,999 | 8 (5.3%) | 0 (0.0%) |
| $10,000 to $12,499 | 0 (0.0%) | 0 (0.0%) |
| $12,500 to $14,999 | 0 (0.0%) | 0 (0.0%) |
| $15,000 to $17,499 | 0 (0.0%) | 6 (5.8%) |
| $17,500 to $19,999 | 0 (0.0%) | 0 (0.0%) |
| $20,000 to $22,499 | 0 (0.0%) | 0 (0.0%) |
| $22,500 to $24,999 | 26 (17.2%) | 0 (0.0%) |
| $25,000 to $29,999 | 0 (0.0%) | 0 (0.0%) |
| $30,000 to $34,999 | 2 (1.3%) | 0 (0.0%) |
| $35,000 to $39,999 | 8 (5.3%) | 19 (18.4%) |
| $40,000 to $44,999 | 5 (3.3%) | 18 (17.5%) |
| $45,000 to $49,999 | 0 (0.0%) | 0 (0.0%) |
| $50,000 to $54,999 | 6 (4.0%) | 0 (0.0%) |
| $55,000 to $64,999 | 37 (24.5%) | 11 (10.7%) |
| $65,000 to $74,999 | 27 (17.9%) | 34 (33.0%) |
| $75,000 to $99,999 | 14 (9.3%) | 2 (1.9%) |
| $100,000+ | 18 (11.9%) | 0 (0.0%) |
| Total | 151 (100.0%) | 103 (100.0%) |
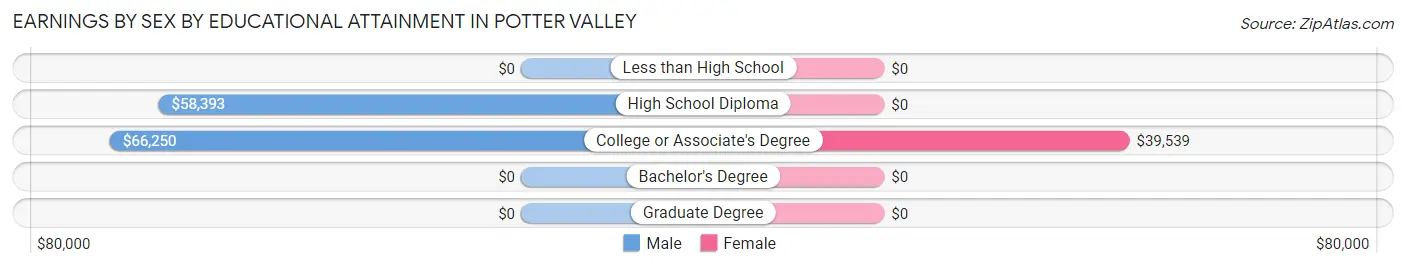
Earnings by Sex by Educational Attainment in Potter Valley
Average earnings in Potter Valley are $59,155 for men and $41,875 for women, a difference of 29.2%. Men with an educational attainment of college or associate's degree enjoy the highest average annual earnings of $66,250, while those with high school diploma education earn the least with $58,393. Women with an educational attainment of college or associate's degree earn the most with the average annual earnings of $39,539, while those with college or associate's degree education have the smallest earnings of $39,539.
| Educational Attainment | Male Income | Female Income |
| Less than High School | - | - |
| High School Diploma | $58,393 | $0 |
| College or Associate's Degree | $66,250 | $39,539 |
| Bachelor's Degree | - | - |
| Graduate Degree | - | - |
| Total | $59,155 | $41,875 |
Family Income in Potter Valley
Family Income Brackets in Potter Valley
According to the Potter Valley family income data, there are 50 families falling into the $100,000 to $149,999 income range, which is the most common income bracket and makes up 38.8% of all families.
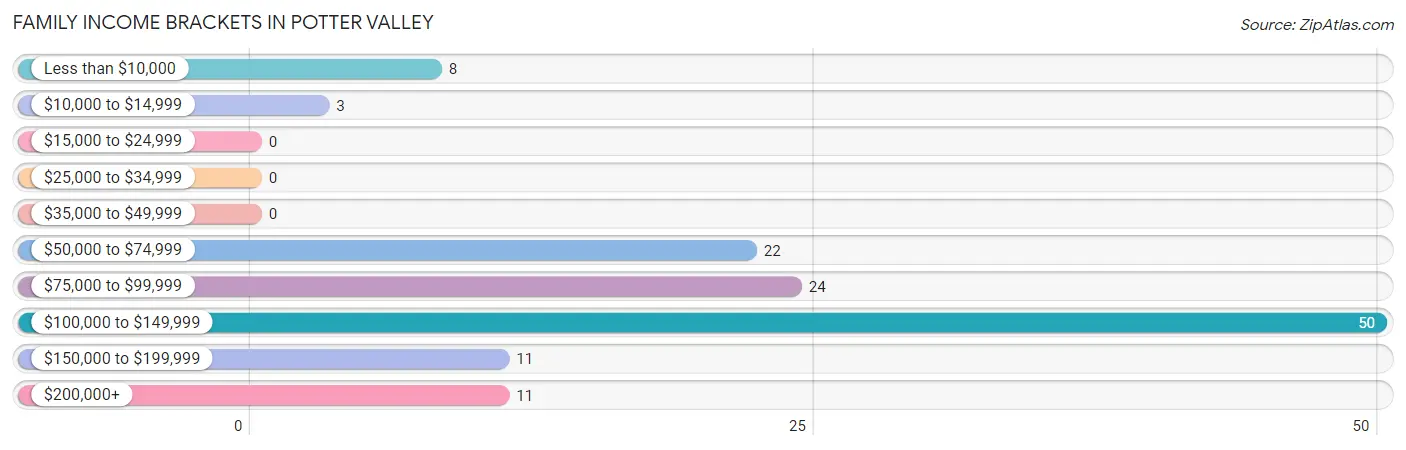
| Income Bracket | # Families | % Families |
| Less than $10,000 | 8 | 6.2% |
| $10,000 to $14,999 | 3 | 2.3% |
| $15,000 to $24,999 | 0 | 0.0% |
| $25,000 to $34,999 | 0 | 0.0% |
| $35,000 to $49,999 | 0 | 0.0% |
| $50,000 to $74,999 | 22 | 17.1% |
| $75,000 to $99,999 | 24 | 18.6% |
| $100,000 to $149,999 | 50 | 38.8% |
| $150,000 to $199,999 | 11 | 8.5% |
| $200,000+ | 11 | 8.5% |
Family Income by Famaliy Size in Potter Valley
2-person families (91 | 70.5%) account for the highest median family income in Potter Valley with $129,732 per family, while 2-person families (91 | 70.5%) have the highest median income of $64,866 per family member.
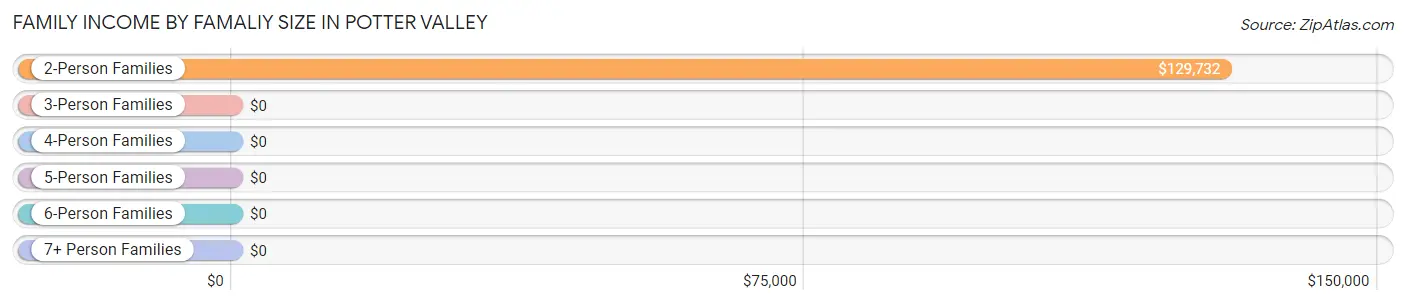
| Income Bracket | # Families | Median Income |
| 2-Person Families | 91 (70.5%) | $129,732 |
| 3-Person Families | 15 (11.6%) | $0 |
| 4-Person Families | 0 (0.0%) | $0 |
| 5-Person Families | 14 (10.8%) | $0 |
| 6-Person Families | 2 (1.5%) | $0 |
| 7+ Person Families | 7 (5.4%) | $0 |
| Total | 129 (100.0%) | $128,839 |
Family Income by Number of Earners in Potter Valley
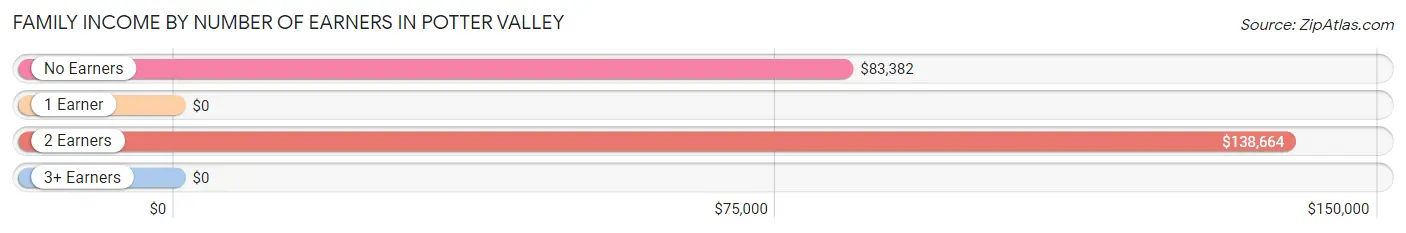
| Number of Earners | # Families | Median Income |
| No Earners | 34 (26.4%) | $83,382 |
| 1 Earner | 36 (27.9%) | $0 |
| 2 Earners | 59 (45.7%) | $138,664 |
| 3+ Earners | 0 (0.0%) | $0 |
| Total | 129 (100.0%) | $128,839 |
Household Income in Potter Valley
Household Income Brackets in Potter Valley
With 61 households falling in the category, the $100,000 to $149,999 income range is the most frequent in Potter Valley, accounting for 27.9% of all households.
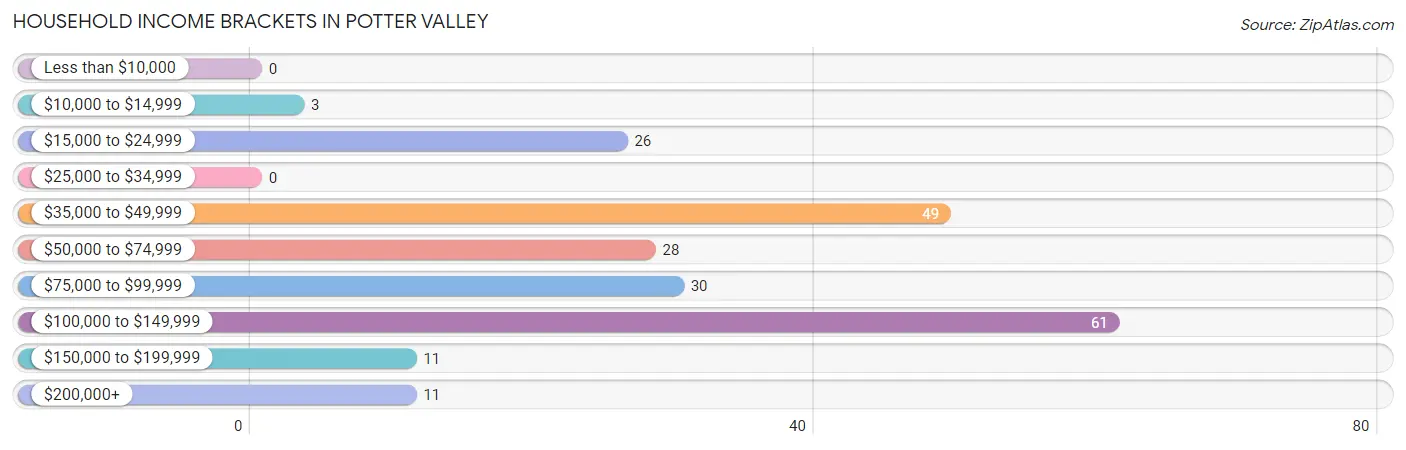
| Income Bracket | # Households | % Households |
| Less than $10,000 | 0 | 0.0% |
| $10,000 to $14,999 | 3 | 1.4% |
| $15,000 to $24,999 | 26 | 11.9% |
| $25,000 to $34,999 | 0 | 0.0% |
| $35,000 to $49,999 | 49 | 22.4% |
| $50,000 to $74,999 | 28 | 12.8% |
| $75,000 to $99,999 | 30 | 13.7% |
| $100,000 to $149,999 | 61 | 27.9% |
| $150,000 to $199,999 | 11 | 5.0% |
| $200,000+ | 11 | 5.0% |
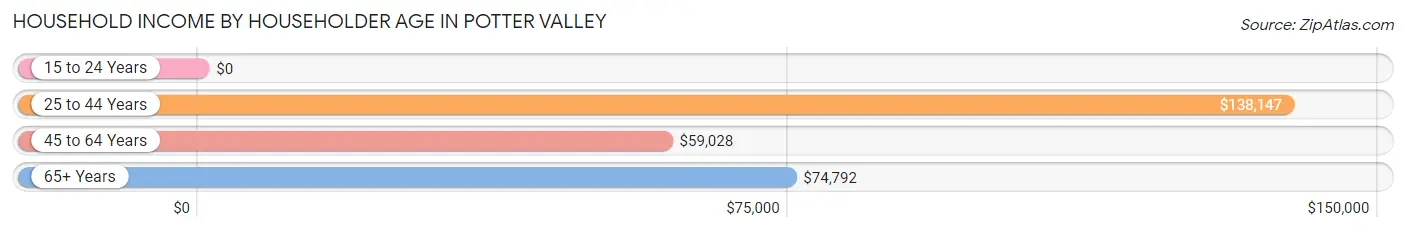
Household Income by Householder Age in Potter Valley
The median household income in Potter Valley is $76,250, with the highest median household income of $138,147 found in the 25 to 44 years age bracket for the primary householder. A total of 57 households (26.0%) fall into this category.
| Income Bracket | # Households | Median Income |
| 15 to 24 Years | 0 (0.0%) | $0 |
| 25 to 44 Years | 57 (26.0%) | $138,147 |
| 45 to 64 Years | 89 (40.6%) | $59,028 |
| 65+ Years | 73 (33.3%) | $74,792 |
| Total | 219 (100.0%) | $76,250 |
Poverty in Potter Valley
Income Below Poverty by Sex and Age in Potter Valley
With 5.5% poverty level for males and 6.0% for females among the residents of Potter Valley, under 5 year old males and 5 year old females are the most vulnerable to poverty, with 10 males (43.5%) and 8 females (100.0%) in their respective age groups living below the poverty level.
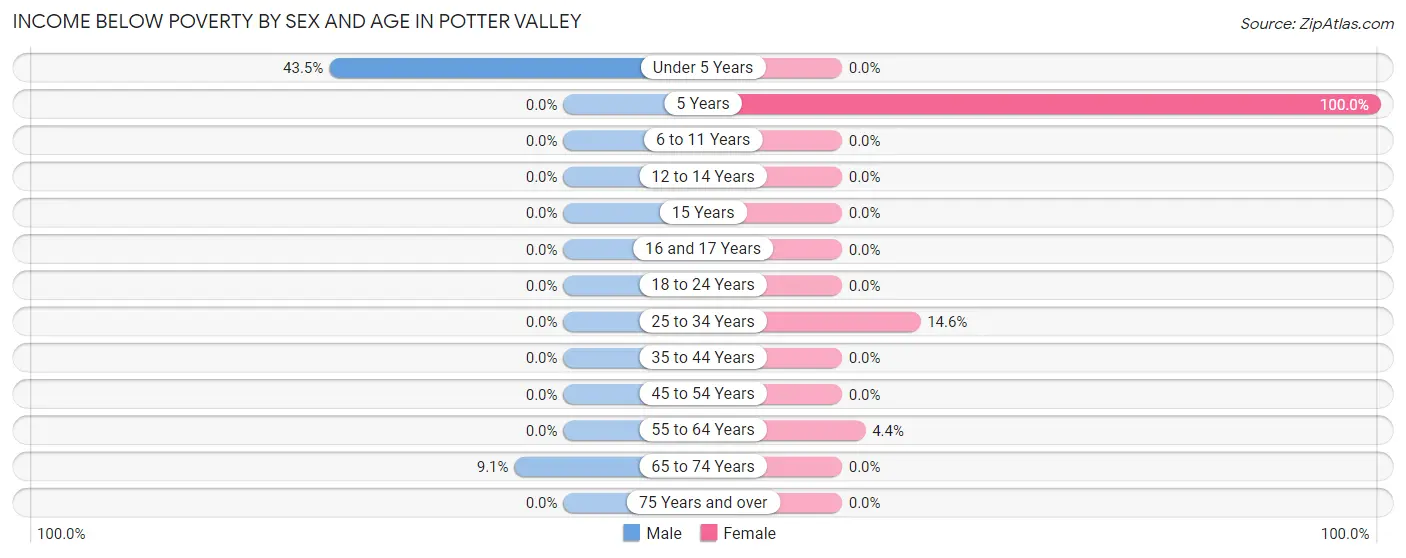
| Age Bracket | Male | Female |
| Under 5 Years | 10 (43.5%) | 0 (0.0%) |
| 5 Years | 0 (0.0%) | 8 (100.0%) |
| 6 to 11 Years | 0 (0.0%) | 0 (0.0%) |
| 12 to 14 Years | 0 (0.0%) | 0 (0.0%) |
| 15 Years | 0 (0.0%) | 0 (0.0%) |
| 16 and 17 Years | 0 (0.0%) | 0 (0.0%) |
| 18 to 24 Years | 0 (0.0%) | 0 (0.0%) |
| 25 to 34 Years | 0 (0.0%) | 8 (14.5%) |
| 35 to 44 Years | 0 (0.0%) | 0 (0.0%) |
| 45 to 54 Years | 0 (0.0%) | 0 (0.0%) |
| 55 to 64 Years | 0 (0.0%) | 2 (4.3%) |
| 65 to 74 Years | 3 (9.1%) | 0 (0.0%) |
| 75 Years and over | 0 (0.0%) | 0 (0.0%) |
| Total | 13 (5.5%) | 18 (6.0%) |
Income Above Poverty by Sex and Age in Potter Valley
According to the poverty statistics in Potter Valley, males aged 5 years and females aged 6 to 11 years are the age groups that are most secure financially, with 100.0% of males and 100.0% of females in these age groups living above the poverty line.
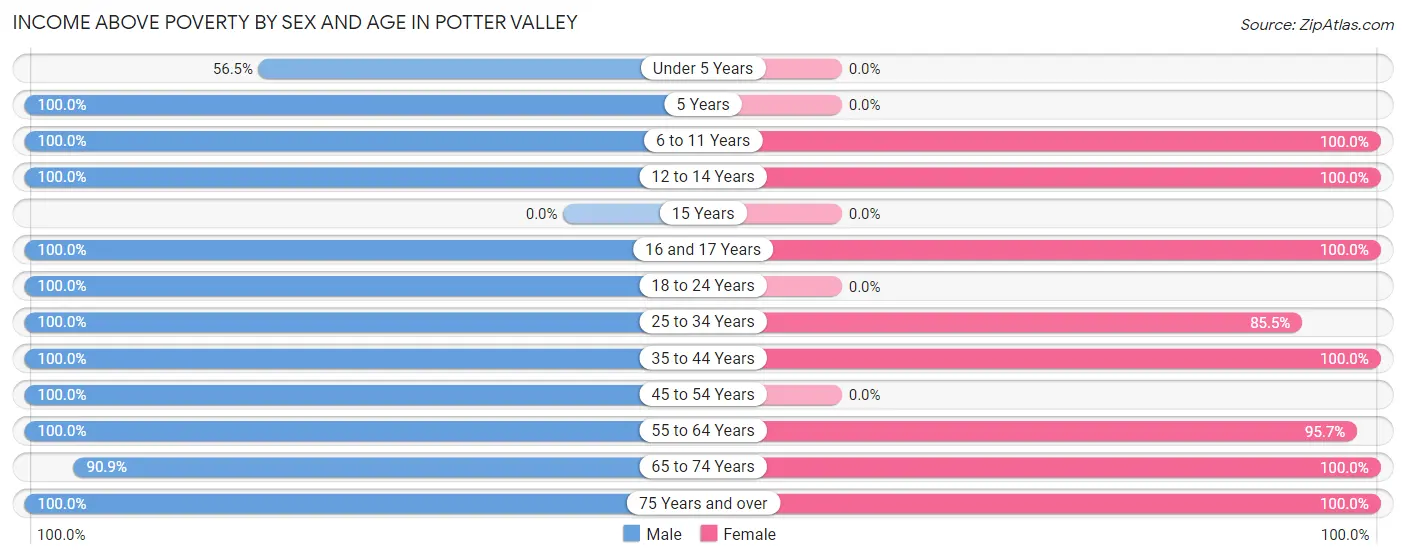
| Age Bracket | Male | Female |
| Under 5 Years | 13 (56.5%) | 0 (0.0%) |
| 5 Years | 2 (100.0%) | 0 (0.0%) |
| 6 to 11 Years | 2 (100.0%) | 36 (100.0%) |
| 12 to 14 Years | 7 (100.0%) | 21 (100.0%) |
| 15 Years | 0 (0.0%) | 0 (0.0%) |
| 16 and 17 Years | 6 (100.0%) | 42 (100.0%) |
| 18 to 24 Years | 8 (100.0%) | 0 (0.0%) |
| 25 to 34 Years | 53 (100.0%) | 47 (85.5%) |
| 35 to 44 Years | 16 (100.0%) | 33 (100.0%) |
| 45 to 54 Years | 35 (100.0%) | 0 (0.0%) |
| 55 to 64 Years | 47 (100.0%) | 44 (95.7%) |
| 65 to 74 Years | 30 (90.9%) | 37 (100.0%) |
| 75 Years and over | 6 (100.0%) | 21 (100.0%) |
| Total | 225 (94.5%) | 281 (94.0%) |
Income Below Poverty Among Married-Couple Families in Potter Valley
The poverty statistics for married-couple families in Potter Valley show that 2.8% or 3 of the total 108 families live below the poverty line. Families with no children have the highest poverty rate of 3.5%, comprising of 3 families. On the other hand, families with 3 or 4 children have the lowest poverty rate of 0.0%, which includes 0 families.
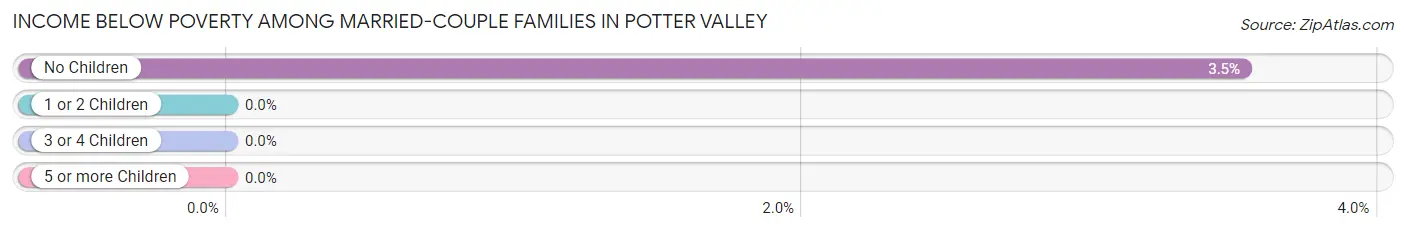
| Children | Above Poverty | Below Poverty |
| No Children | 82 (96.5%) | 3 (3.5%) |
| 1 or 2 Children | 0 (0.0%) | 0 (0.0%) |
| 3 or 4 Children | 16 (100.0%) | 0 (0.0%) |
| 5 or more Children | 7 (100.0%) | 0 (0.0%) |
| Total | 105 (97.2%) | 3 (2.8%) |
Income Below Poverty Among Single-Parent Households in Potter Valley
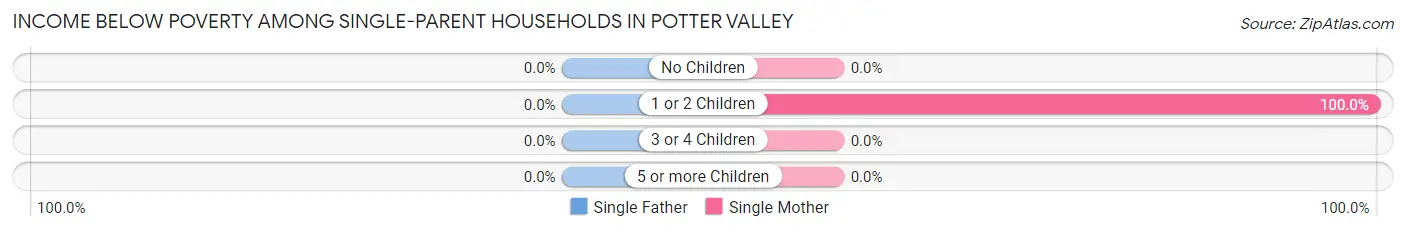
| Children | Single Father | Single Mother |
| No Children | 0 (0.0%) | 0 (0.0%) |
| 1 or 2 Children | 0 (0.0%) | 8 (100.0%) |
| 3 or 4 Children | 0 (0.0%) | 0 (0.0%) |
| 5 or more Children | 0 (0.0%) | 0 (0.0%) |
| Total | 0 (0.0%) | 8 (100.0%) |
Income Below Poverty Among Married-Couple vs Single-Parent Households in Potter Valley
The poverty data for Potter Valley shows that 3 of the married-couple family households (2.8%) and 8 of the single-parent households (38.1%) are living below the poverty level. Within the married-couple family households, those with no children have the highest poverty rate, with 3 households (3.5%) falling below the poverty line. Among the single-parent households, those with 1 or 2 children have the highest poverty rate, with 8 household (57.1%) living below poverty.
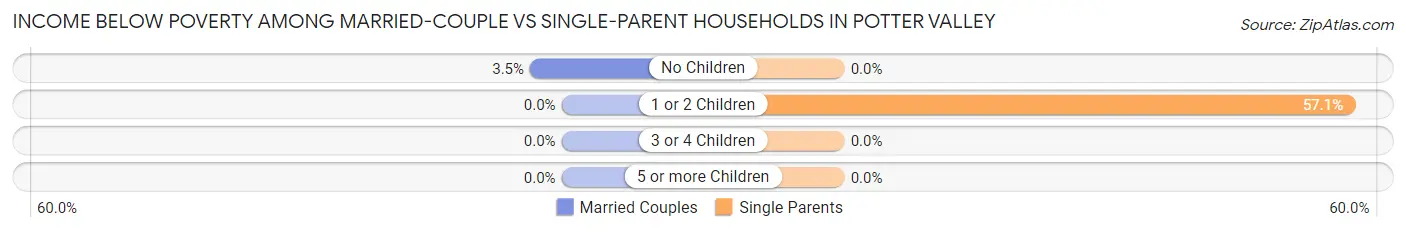
| Children | Married-Couple Families | Single-Parent Households |
| No Children | 3 (3.5%) | 0 (0.0%) |
| 1 or 2 Children | 0 (0.0%) | 8 (57.1%) |
| 3 or 4 Children | 0 (0.0%) | 0 (0.0%) |
| 5 or more Children | 0 (0.0%) | 0 (0.0%) |
| Total | 3 (2.8%) | 8 (38.1%) |
Race in Potter Valley
The most populous races in Potter Valley are White / Caucasian (395 | 73.6%), Two or more Races (135 | 25.1%), and Hispanic or Latino (106 | 19.7%).
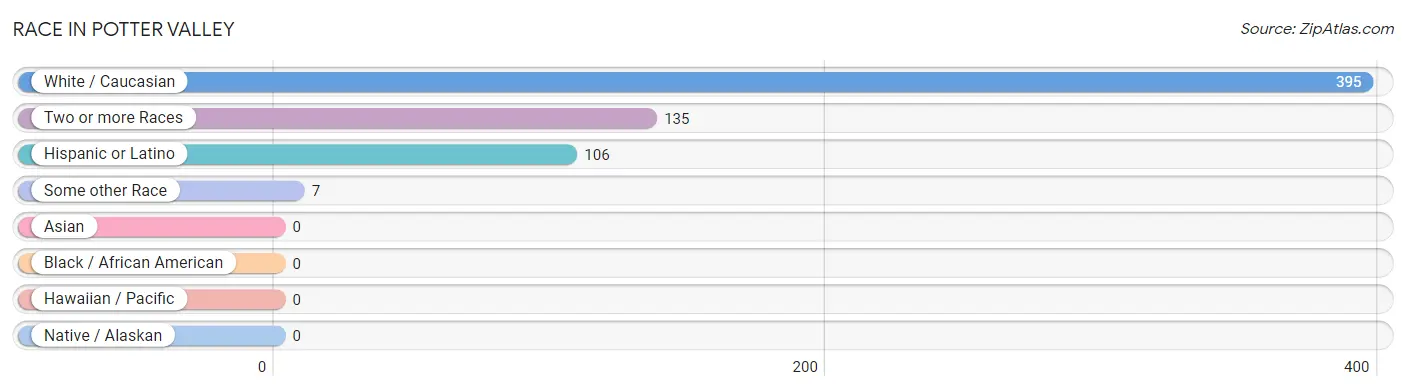
| Race | # Population | % Population |
| Asian | 0 | 0.0% |
| Black / African American | 0 | 0.0% |
| Hawaiian / Pacific | 0 | 0.0% |
| Hispanic or Latino | 106 | 19.7% |
| Native / Alaskan | 0 | 0.0% |
| White / Caucasian | 395 | 73.6% |
| Two or more Races | 135 | 25.1% |
| Some other Race | 7 | 1.3% |
| Total | 537 | 100.0% |
Ancestry in Potter Valley
The most populous ancestries reported in Potter Valley are Mexican (106 | 19.7%), German (103 | 19.2%), Irish (80 | 14.9%), Italian (67 | 12.5%), and English (53 | 9.9%), together accounting for 76.2% of all Potter Valley residents.
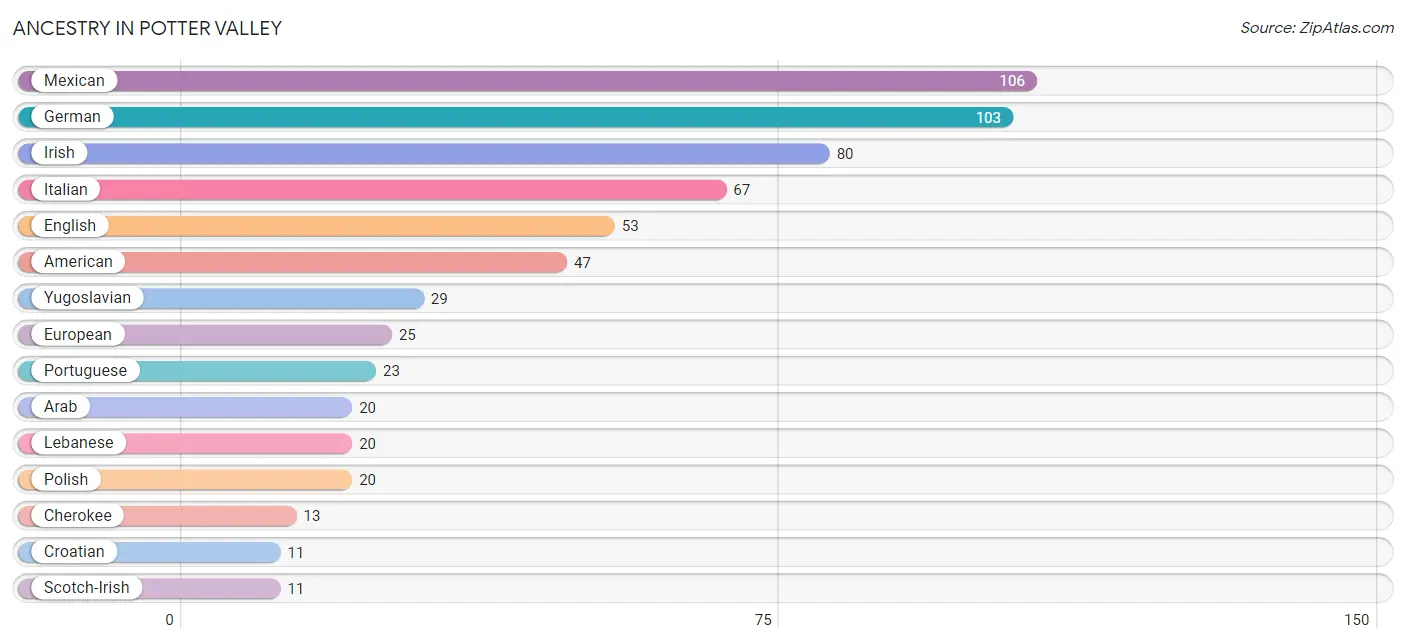
| Ancestry | # Population | % Population |
| American | 47 | 8.7% |
| Arab | 20 | 3.7% |
| Canadian | 2 | 0.4% |
| Cherokee | 13 | 2.4% |
| Croatian | 11 | 2.1% |
| Danish | 6 | 1.1% |
| Dutch | 7 | 1.3% |
| English | 53 | 9.9% |
| European | 25 | 4.7% |
| French | 9 | 1.7% |
| German | 103 | 19.2% |
| Irish | 80 | 14.9% |
| Italian | 67 | 12.5% |
| Lebanese | 20 | 3.7% |
| Mexican | 106 | 19.7% |
| Northern European | 5 | 0.9% |
| Polish | 20 | 3.7% |
| Portuguese | 23 | 4.3% |
| Russian | 5 | 0.9% |
| Scotch-Irish | 11 | 2.1% |
| Scottish | 2 | 0.4% |
| Swedish | 6 | 1.1% |
| Yugoslavian | 29 | 5.4% | View All 23 Rows |
Immigrants in Potter Valley
The most numerous immigrant groups reported in Potter Valley came from Central America (28 | 5.2%), Latin America (28 | 5.2%), and Mexico (28 | 5.2%), together accounting for 15.6% of all Potter Valley residents.
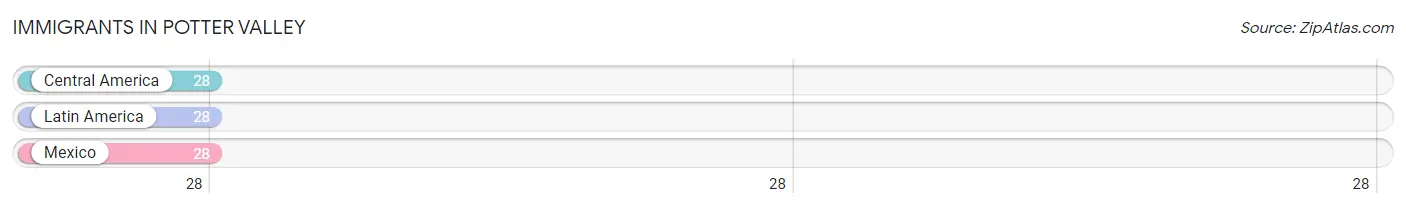
| Immigration Origin | # Population | % Population |
| Central America | 28 | 5.2% |
| Latin America | 28 | 5.2% |
| Mexico | 28 | 5.2% | View All 3 Rows |
Sex and Age in Potter Valley
Sex and Age in Potter Valley
The most populous age groups in Potter Valley are 30 to 34 Years (33 | 13.9%) for men and 10 to 14 Years (45 | 15.0%) for women.
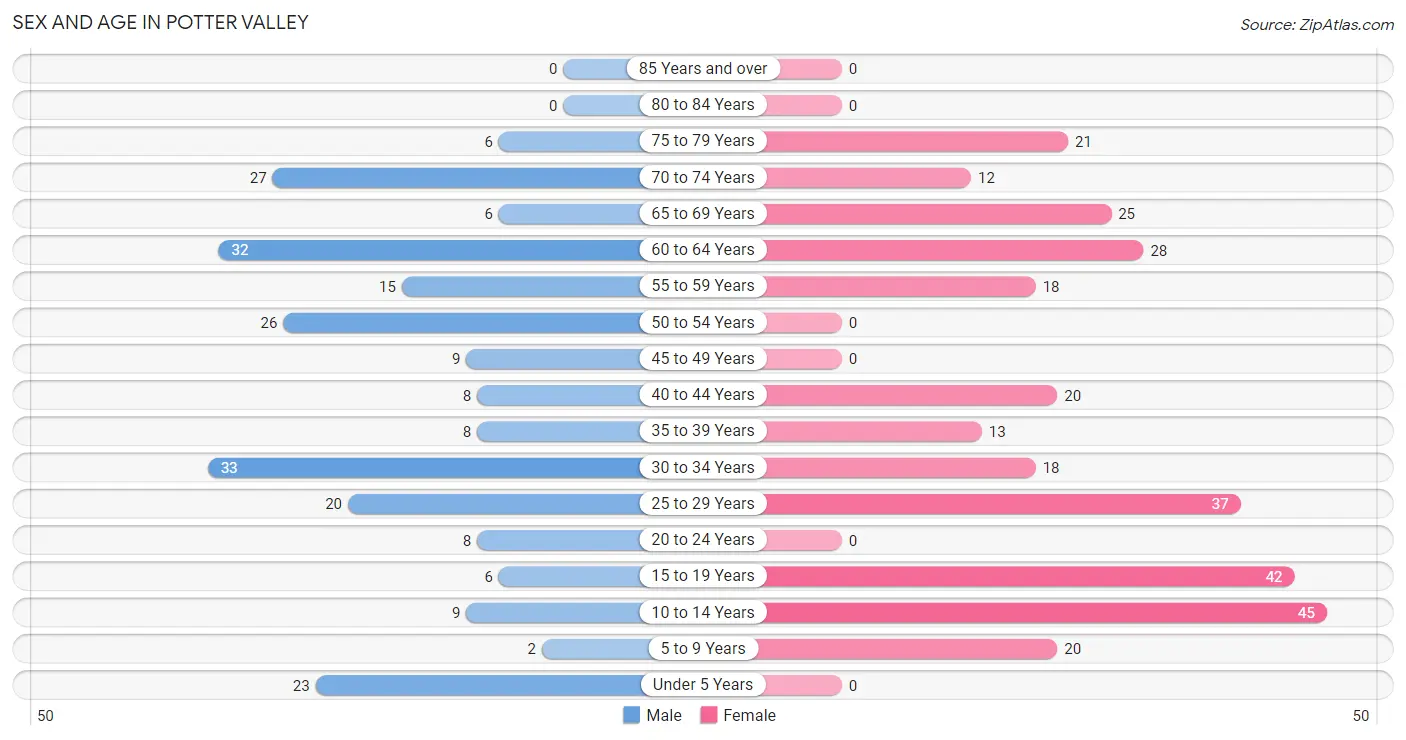
| Age Bracket | Male | Female |
| Under 5 Years | 23 (9.7%) | 0 (0.0%) |
| 5 to 9 Years | 2 (0.8%) | 20 (6.7%) |
| 10 to 14 Years | 9 (3.8%) | 45 (15.0%) |
| 15 to 19 Years | 6 (2.5%) | 42 (14.1%) |
| 20 to 24 Years | 8 (3.4%) | 0 (0.0%) |
| 25 to 29 Years | 20 (8.4%) | 37 (12.4%) |
| 30 to 34 Years | 33 (13.9%) | 18 (6.0%) |
| 35 to 39 Years | 8 (3.4%) | 13 (4.3%) |
| 40 to 44 Years | 8 (3.4%) | 20 (6.7%) |
| 45 to 49 Years | 9 (3.8%) | 0 (0.0%) |
| 50 to 54 Years | 26 (10.9%) | 0 (0.0%) |
| 55 to 59 Years | 15 (6.3%) | 18 (6.0%) |
| 60 to 64 Years | 32 (13.5%) | 28 (9.4%) |
| 65 to 69 Years | 6 (2.5%) | 25 (8.4%) |
| 70 to 74 Years | 27 (11.3%) | 12 (4.0%) |
| 75 to 79 Years | 6 (2.5%) | 21 (7.0%) |
| 80 to 84 Years | 0 (0.0%) | 0 (0.0%) |
| 85 Years and over | 0 (0.0%) | 0 (0.0%) |
| Total | 238 (100.0%) | 299 (100.0%) |
Families and Households in Potter Valley
Median Family Size in Potter Valley
The median family size in Potter Valley is 3.16 persons per family, with married-couple families (108 | 83.7%) accounting for the largest median family size of 3.27 persons per family. On the other hand, single male/father families (13 | 10.1%) represent the smallest median family size with 2.23 persons per family.
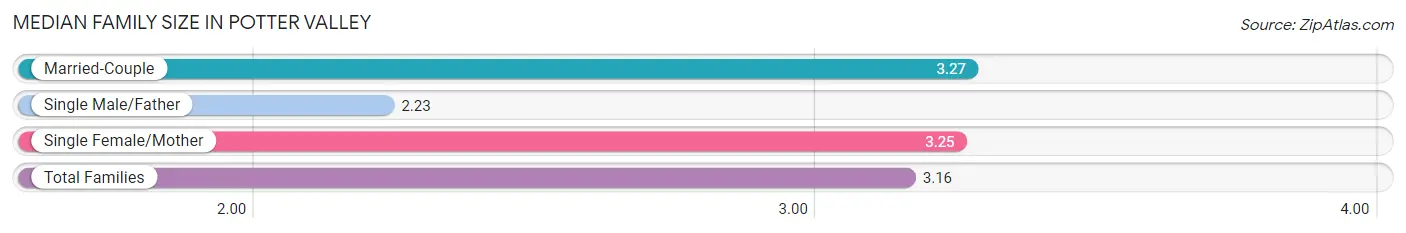
| Family Type | # Families | Family Size |
| Married-Couple | 108 (83.7%) | 3.27 |
| Single Male/Father | 13 (10.1%) | 2.23 |
| Single Female/Mother | 8 (6.2%) | 3.25 |
| Total Families | 129 (100.0%) | 3.16 |
Median Household Size in Potter Valley
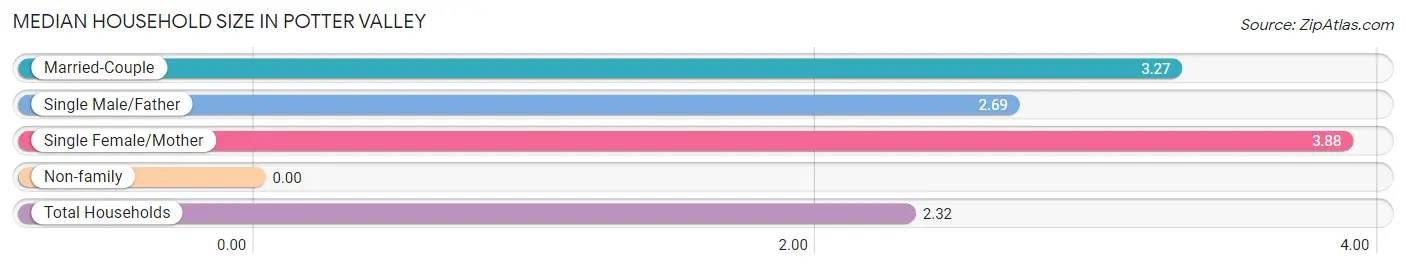
| Household Type | # Households | Household Size |
| Married-Couple | 108 (49.3%) | 3.27 |
| Single Male/Father | 13 (5.9%) | 2.69 |
| Single Female/Mother | 8 (3.6%) | 3.88 |
| Non-family | 90 (41.1%) | - |
| Total Households | 219 (100.0%) | 2.32 |
Household Size by Marriage Status in Potter Valley
Out of a total of 219 households in Potter Valley, 129 (58.9%) are family households, while 90 (41.1%) are nonfamily households. The most numerous type of family households are 2-person households, comprising 85, and the most common type of nonfamily households are 1-person households, comprising 90.
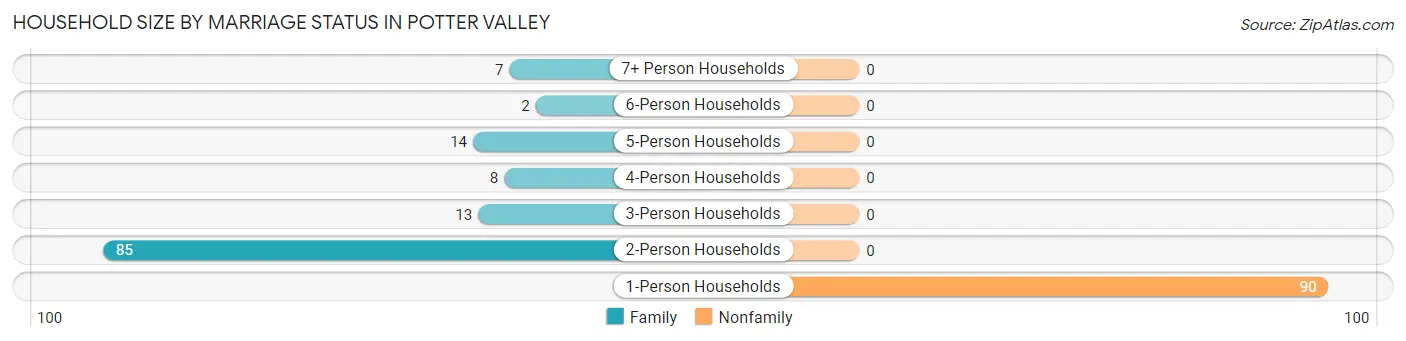
| Household Size | Family Households | Nonfamily Households |
| 1-Person Households | - | 90 (41.1%) |
| 2-Person Households | 85 (38.8%) | 0 (0.0%) |
| 3-Person Households | 13 (5.9%) | 0 (0.0%) |
| 4-Person Households | 8 (3.6%) | 0 (0.0%) |
| 5-Person Households | 14 (6.4%) | 0 (0.0%) |
| 6-Person Households | 2 (0.9%) | 0 (0.0%) |
| 7+ Person Households | 7 (3.2%) | 0 (0.0%) |
| Total | 129 (58.9%) | 90 (41.1%) |
Female Fertility in Potter Valley
Fertility by Age in Potter Valley
| Age Bracket | Women with Births | Births / 1,000 Women |
| 15 to 19 years | 0 (0.0%) | 0.0 |
| 20 to 34 years | 0 (0.0%) | 0.0 |
| 35 to 50 years | 0 (0.0%) | 0.0 |
| Total | 0 (0.0%) | 0.0 |
Fertility by Age by Marriage Status in Potter Valley
| Age Bracket | Married | Unmarried |
| 15 to 19 years | 0 (0.0%) | 0 (0.0%) |
| 20 to 34 years | 0 (0.0%) | 0 (0.0%) |
| 35 to 50 years | 0 (0.0%) | 0 (0.0%) |
| Total | 0 (0.0%) | 0 (0.0%) |
Fertility by Education in Potter Valley
| Educational Attainment | Women with Births | Births / 1,000 Women |
| Less than High School | 0 (0.0%) | 0.0 |
| High School Diploma | 0 (0.0%) | 0.0 |
| College or Associate's Degree | 0 (0.0%) | 0.0 |
| Bachelor's Degree | 0 (0.0%) | 0.0 |
| Graduate Degree | 0 (0.0%) | 0.0 |
| Total | 0 (0.0%) | 0.0 |
Fertility by Education by Marriage Status in Potter Valley
| Educational Attainment | Married | Unmarried |
| Less than High School | 0 (0.0%) | 0 (0.0%) |
| High School Diploma | 0 (0.0%) | 0 (0.0%) |
| College or Associate's Degree | 0 (0.0%) | 0 (0.0%) |
| Bachelor's Degree | 0 (0.0%) | 0 (0.0%) |
| Graduate Degree | 0 (0.0%) | 0 (0.0%) |
| Total | 0 (0.0%) | 0 (0.0%) |
Employment Characteristics in Potter Valley
Employment by Class of Employer in Potter Valley
Among the 234 employed individuals in Potter Valley, private company employees (124 | 53.0%), local government employees (56 | 23.9%), and self-employed (not incorporated) (31 | 13.3%) make up the most common classes of employment.
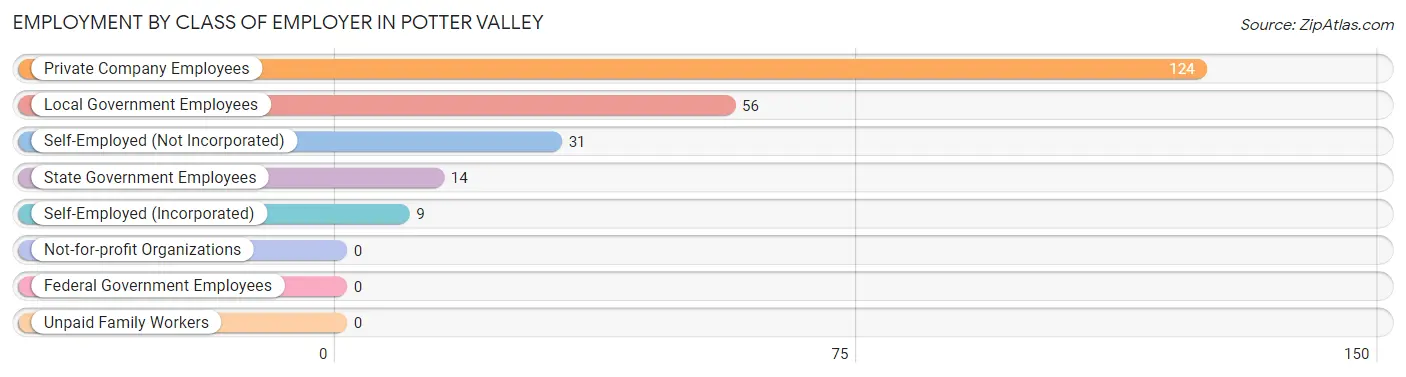
| Employer Class | # Employees | % Employees |
| Private Company Employees | 124 | 53.0% |
| Self-Employed (Incorporated) | 9 | 3.8% |
| Self-Employed (Not Incorporated) | 31 | 13.3% |
| Not-for-profit Organizations | 0 | 0.0% |
| Local Government Employees | 56 | 23.9% |
| State Government Employees | 14 | 6.0% |
| Federal Government Employees | 0 | 0.0% |
| Unpaid Family Workers | 0 | 0.0% |
| Total | 234 | 100.0% |
Employment Status by Age in Potter Valley
According to the labor force statistics for Potter Valley, out of the total population over 16 years of age (438), 58.0% or 254 individuals are in the labor force, with 7.9% or 20 of them unemployed. The age group with the highest labor force participation rate is 20 to 24 years, with 100.0% or 8 individuals in the labor force. Within the labor force, the 25 to 29 years age range has the highest percentage of unemployed individuals, with 40.8% or 20 of them being unemployed.
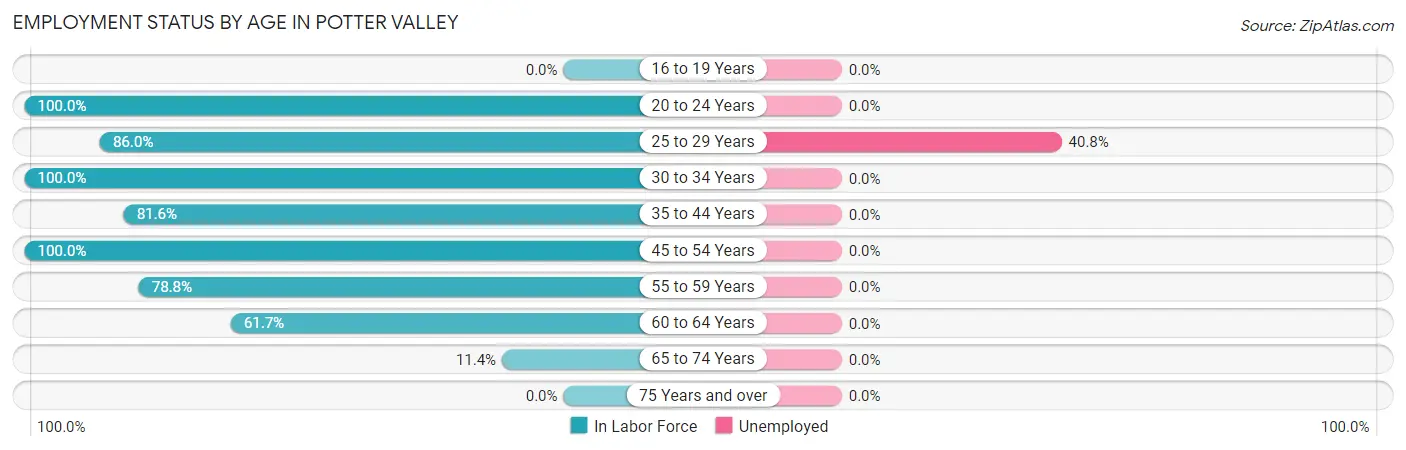
| Age Bracket | In Labor Force | Unemployed |
| 16 to 19 Years | 0 (0.0%) | 0 (0.0%) |
| 20 to 24 Years | 8 (100.0%) | 0 (0.0%) |
| 25 to 29 Years | 49 (86.0%) | 20 (40.8%) |
| 30 to 34 Years | 51 (100.0%) | 0 (0.0%) |
| 35 to 44 Years | 40 (81.6%) | 0 (0.0%) |
| 45 to 54 Years | 35 (100.0%) | 0 (0.0%) |
| 55 to 59 Years | 26 (78.8%) | 0 (0.0%) |
| 60 to 64 Years | 37 (61.7%) | 0 (0.0%) |
| 65 to 74 Years | 8 (11.4%) | 0 (0.0%) |
| 75 Years and over | 0 (0.0%) | 0 (0.0%) |
| Total | 254 (58.0%) | 20 (7.9%) |
Employment Status by Educational Attainment in Potter Valley
According to labor force statistics for Potter Valley, 83.5% of individuals (238) out of the total population between 25 and 64 years of age (285) are in the labor force, with 8.4% or 20 of them being unemployed. The group with the highest labor force participation rate are those with the educational attainment of bachelor's degree or higher, with 95.5% or 42 individuals in the labor force. Within the labor force, individuals with college / associate degree education have the highest percentage of unemployment, with 15.9% or 20 of them being unemployed.
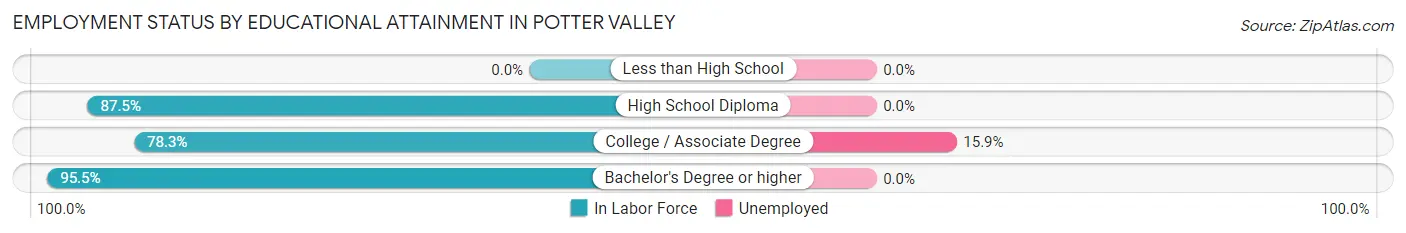
| Educational Attainment | In Labor Force | Unemployed |
| Less than High School | 0 (0.0%) | 0 (0.0%) |
| High School Diploma | 70 (87.5%) | 0 (0.0%) |
| College / Associate Degree | 126 (78.3%) | 26 (15.9%) |
| Bachelor's Degree or higher | 42 (95.5%) | 0 (0.0%) |
| Total | 238 (83.5%) | 24 (8.4%) |
Employment Occupations by Sex in Potter Valley
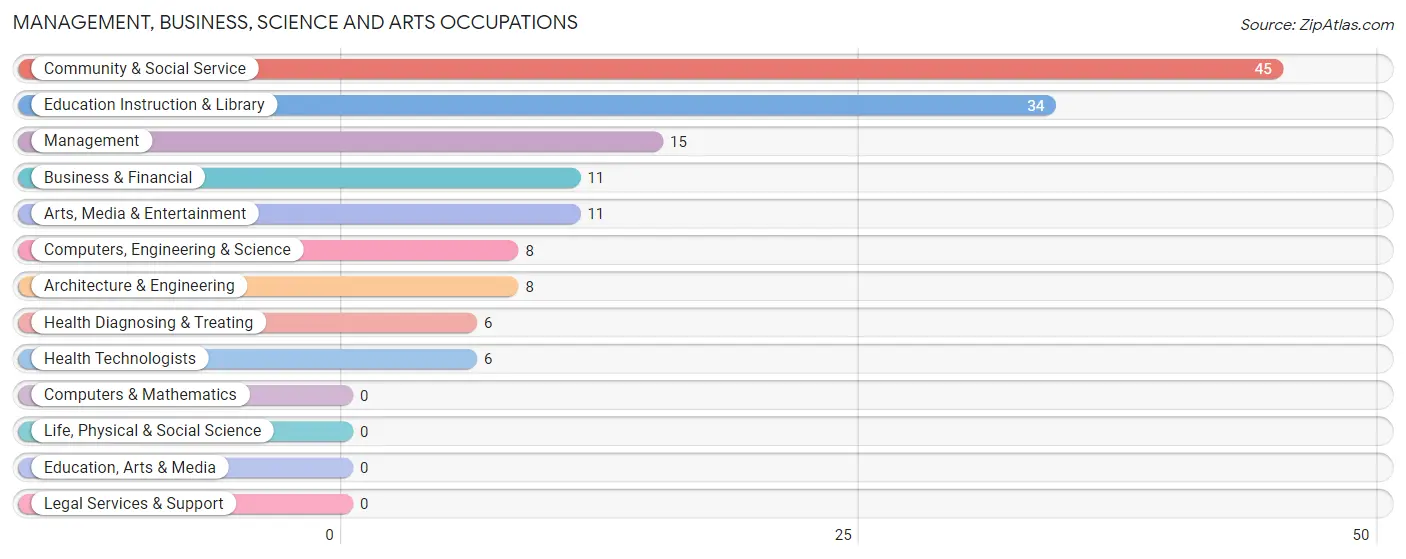
Management, Business, Science and Arts Occupations
The most common Management, Business, Science and Arts occupations in Potter Valley are Community & Social Service (45 | 19.2%), Education Instruction & Library (34 | 14.5%), Management (15 | 6.4%), Business & Financial (11 | 4.7%), and Arts, Media & Entertainment (11 | 4.7%).
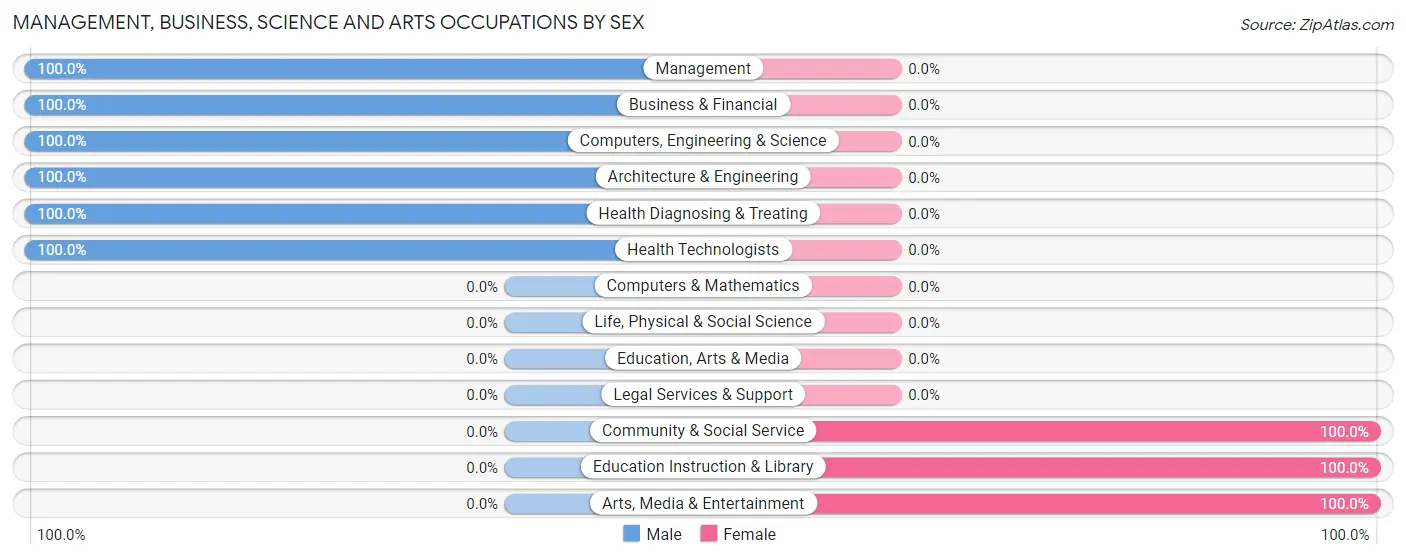
Management, Business, Science and Arts Occupations by Sex
Within the Management, Business, Science and Arts occupations in Potter Valley, the most male-oriented occupations are Management (100.0%), Business & Financial (100.0%), and Computers, Engineering & Science (100.0%), while the most female-oriented occupations are Community & Social Service (100.0%), Education Instruction & Library (100.0%), and Arts, Media & Entertainment (100.0%).
| Occupation | Male | Female |
| Management | 15 (100.0%) | 0 (0.0%) |
| Business & Financial | 11 (100.0%) | 0 (0.0%) |
| Computers, Engineering & Science | 8 (100.0%) | 0 (0.0%) |
| Computers & Mathematics | 0 (0.0%) | 0 (0.0%) |
| Architecture & Engineering | 8 (100.0%) | 0 (0.0%) |
| Life, Physical & Social Science | 0 (0.0%) | 0 (0.0%) |
| Community & Social Service | 0 (0.0%) | 45 (100.0%) |
| Education, Arts & Media | 0 (0.0%) | 0 (0.0%) |
| Legal Services & Support | 0 (0.0%) | 0 (0.0%) |
| Education Instruction & Library | 0 (0.0%) | 34 (100.0%) |
| Arts, Media & Entertainment | 0 (0.0%) | 11 (100.0%) |
| Health Diagnosing & Treating | 6 (100.0%) | 0 (0.0%) |
| Health Technologists | 6 (100.0%) | 0 (0.0%) |
| Total (Category) | 40 (47.1%) | 45 (52.9%) |
| Total (Overall) | 131 (56.0%) | 103 (44.0%) |
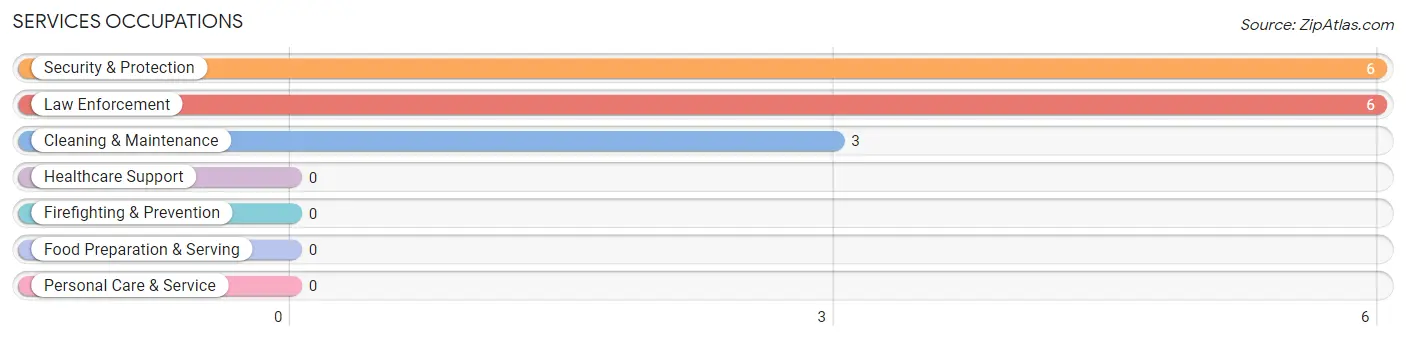
Services Occupations
The most common Services occupations in Potter Valley are Security & Protection (6 | 2.6%), Law Enforcement (6 | 2.6%), and Cleaning & Maintenance (3 | 1.3%).
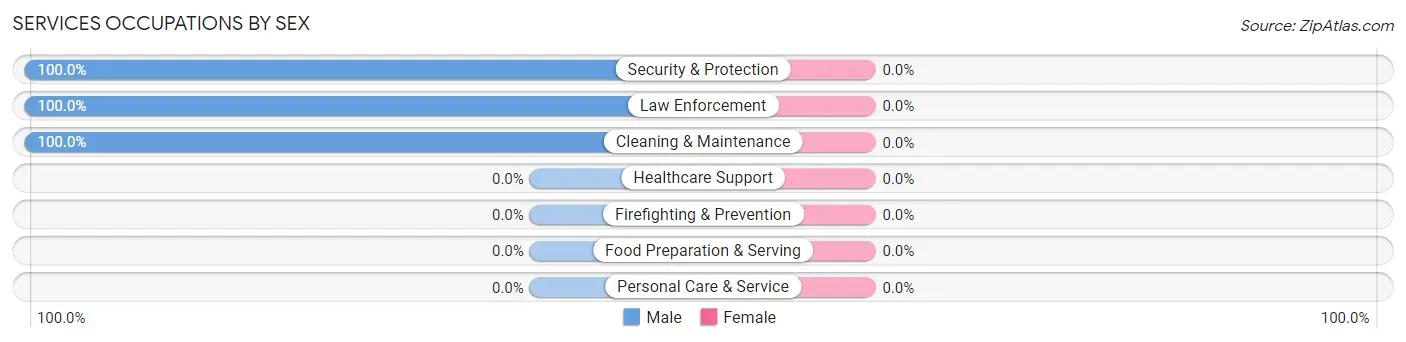
Services Occupations by Sex
| Occupation | Male | Female |
| Healthcare Support | 0 (0.0%) | 0 (0.0%) |
| Security & Protection | 6 (100.0%) | 0 (0.0%) |
| Firefighting & Prevention | 0 (0.0%) | 0 (0.0%) |
| Law Enforcement | 6 (100.0%) | 0 (0.0%) |
| Food Preparation & Serving | 0 (0.0%) | 0 (0.0%) |
| Cleaning & Maintenance | 3 (100.0%) | 0 (0.0%) |
| Personal Care & Service | 0 (0.0%) | 0 (0.0%) |
| Total (Category) | 9 (100.0%) | 0 (0.0%) |
| Total (Overall) | 131 (56.0%) | 103 (44.0%) |
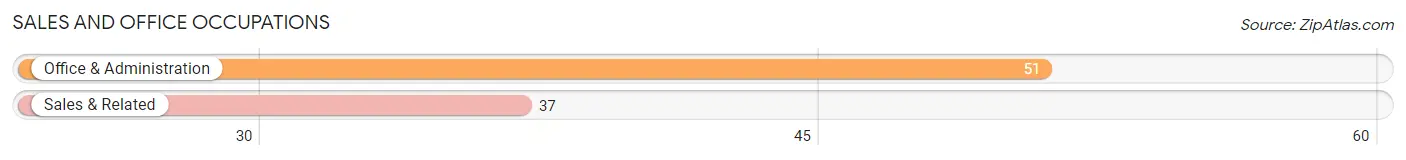
Sales and Office Occupations
The most common Sales and Office occupations in Potter Valley are Office & Administration (51 | 21.8%), and Sales & Related (37 | 15.8%).
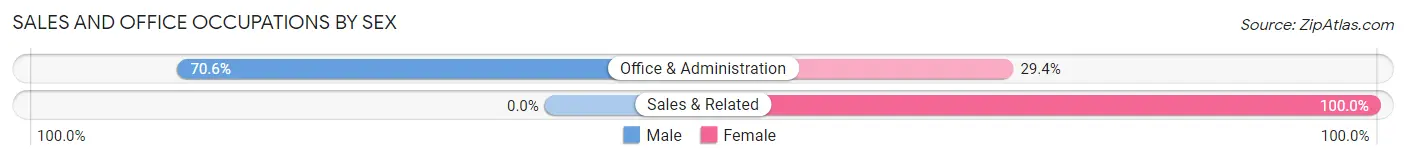
Sales and Office Occupations by Sex
| Occupation | Male | Female |
| Sales & Related | 0 (0.0%) | 37 (100.0%) |
| Office & Administration | 36 (70.6%) | 15 (29.4%) |
| Total (Category) | 36 (40.9%) | 52 (59.1%) |
| Total (Overall) | 131 (56.0%) | 103 (44.0%) |
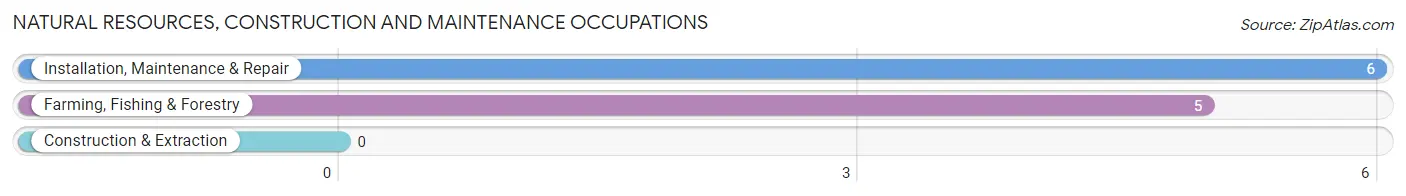
Natural Resources, Construction and Maintenance Occupations
The most common Natural Resources, Construction and Maintenance occupations in Potter Valley are Installation, Maintenance & Repair (6 | 2.6%), and Farming, Fishing & Forestry (5 | 2.1%).
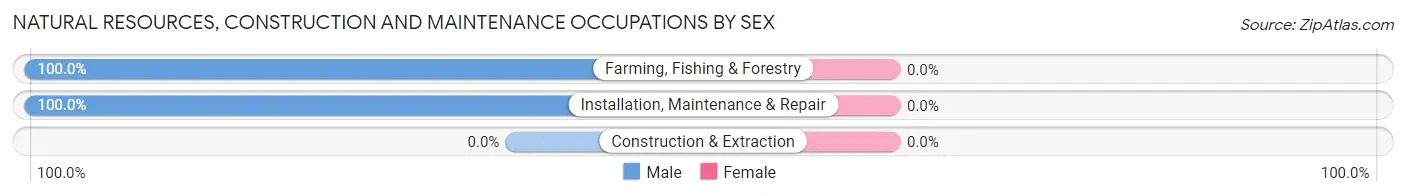
Natural Resources, Construction and Maintenance Occupations by Sex
| Occupation | Male | Female |
| Farming, Fishing & Forestry | 5 (100.0%) | 0 (0.0%) |
| Construction & Extraction | 0 (0.0%) | 0 (0.0%) |
| Installation, Maintenance & Repair | 6 (100.0%) | 0 (0.0%) |
| Total (Category) | 11 (100.0%) | 0 (0.0%) |
| Total (Overall) | 131 (56.0%) | 103 (44.0%) |
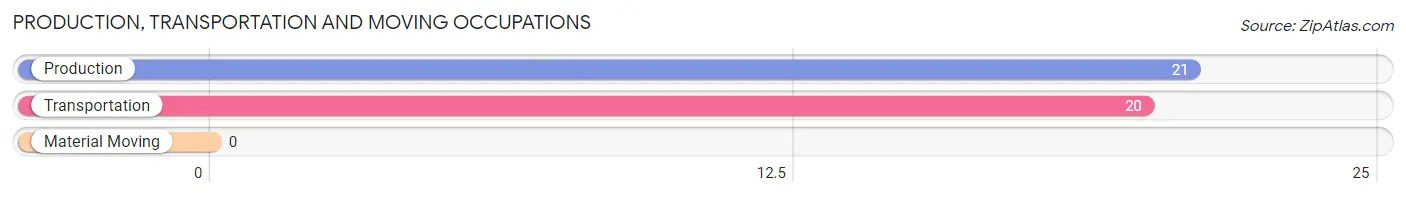
Production, Transportation and Moving Occupations
The most common Production, Transportation and Moving occupations in Potter Valley are Production (21 | 9.0%), and Transportation (20 | 8.6%).
Production, Transportation and Moving Occupations by Sex
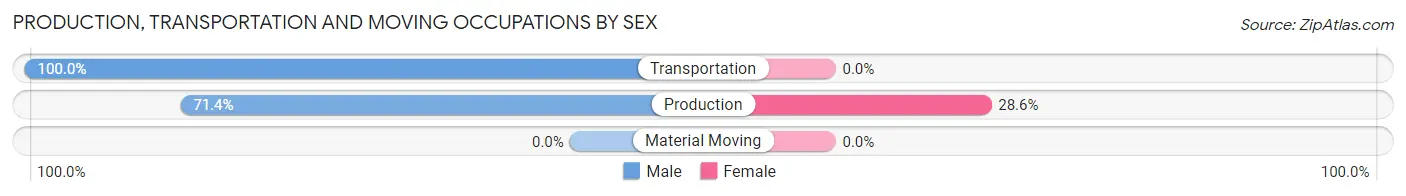
| Occupation | Male | Female |
| Production | 15 (71.4%) | 6 (28.6%) |
| Transportation | 20 (100.0%) | 0 (0.0%) |
| Material Moving | 0 (0.0%) | 0 (0.0%) |
| Total (Category) | 35 (85.4%) | 6 (14.6%) |
| Total (Overall) | 131 (56.0%) | 103 (44.0%) |
Employment Industries by Sex in Potter Valley
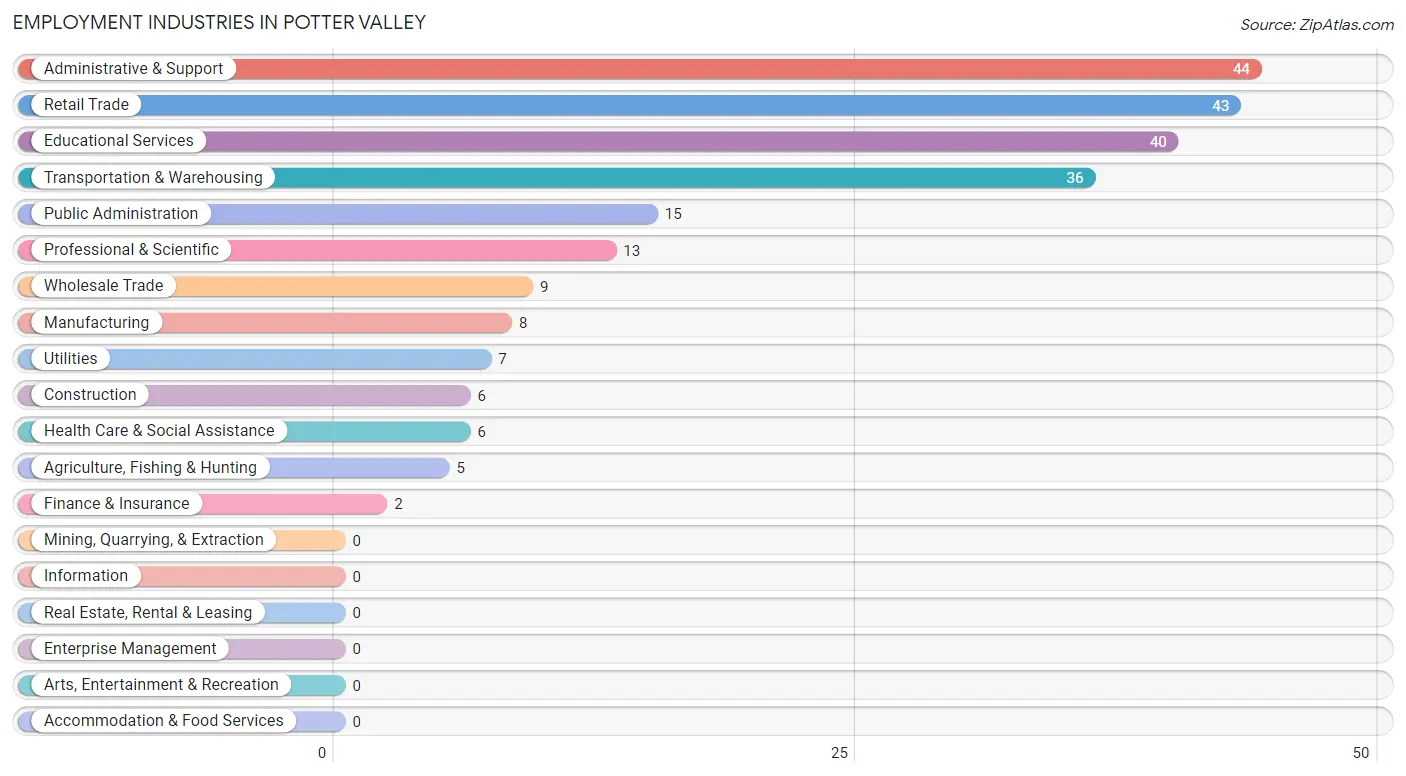
Employment Industries in Potter Valley
The major employment industries in Potter Valley include Administrative & Support (44 | 18.8%), Retail Trade (43 | 18.4%), Educational Services (40 | 17.1%), Transportation & Warehousing (36 | 15.4%), and Public Administration (15 | 6.4%).
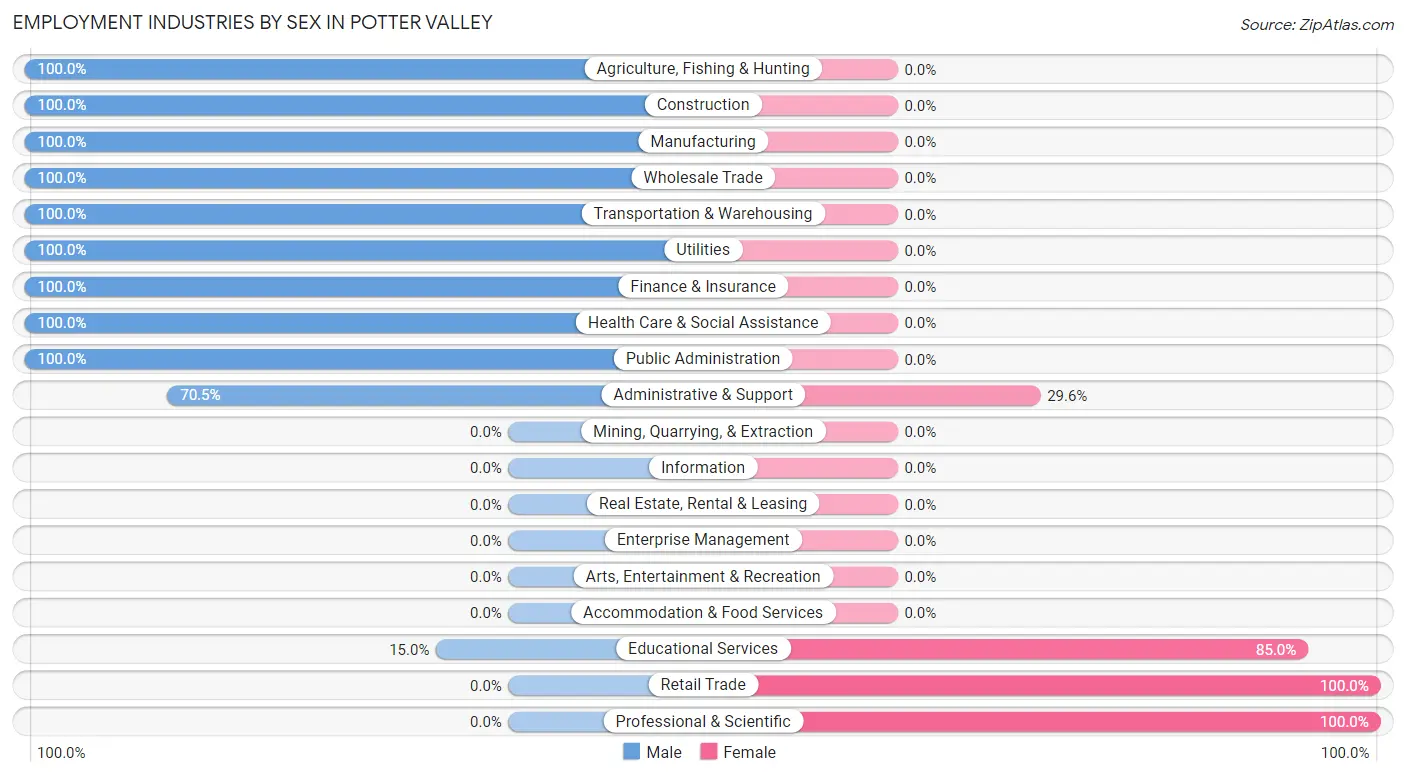
Employment Industries by Sex in Potter Valley
The Potter Valley industries that see more men than women are Agriculture, Fishing & Hunting (100.0%), Construction (100.0%), and Manufacturing (100.0%), whereas the industries that tend to have a higher number of women are Retail Trade (100.0%), Professional & Scientific (100.0%), and Educational Services (85.0%).
| Industry | Male | Female |
| Agriculture, Fishing & Hunting | 5 (100.0%) | 0 (0.0%) |
| Mining, Quarrying, & Extraction | 0 (0.0%) | 0 (0.0%) |
| Construction | 6 (100.0%) | 0 (0.0%) |
| Manufacturing | 8 (100.0%) | 0 (0.0%) |
| Wholesale Trade | 9 (100.0%) | 0 (0.0%) |
| Retail Trade | 0 (0.0%) | 43 (100.0%) |
| Transportation & Warehousing | 36 (100.0%) | 0 (0.0%) |
| Utilities | 7 (100.0%) | 0 (0.0%) |
| Information | 0 (0.0%) | 0 (0.0%) |
| Finance & Insurance | 2 (100.0%) | 0 (0.0%) |
| Real Estate, Rental & Leasing | 0 (0.0%) | 0 (0.0%) |
| Professional & Scientific | 0 (0.0%) | 13 (100.0%) |
| Enterprise Management | 0 (0.0%) | 0 (0.0%) |
| Administrative & Support | 31 (70.5%) | 13 (29.5%) |
| Educational Services | 6 (15.0%) | 34 (85.0%) |
| Health Care & Social Assistance | 6 (100.0%) | 0 (0.0%) |
| Arts, Entertainment & Recreation | 0 (0.0%) | 0 (0.0%) |
| Accommodation & Food Services | 0 (0.0%) | 0 (0.0%) |
| Public Administration | 15 (100.0%) | 0 (0.0%) |
| Total | 131 (56.0%) | 103 (44.0%) |
Education in Potter Valley
School Enrollment in Potter Valley
The most common levels of schooling among the 166 students in Potter Valley are middle school (54 | 32.5%), high school (48 | 28.9%), and graduate / professional (29 | 17.5%).
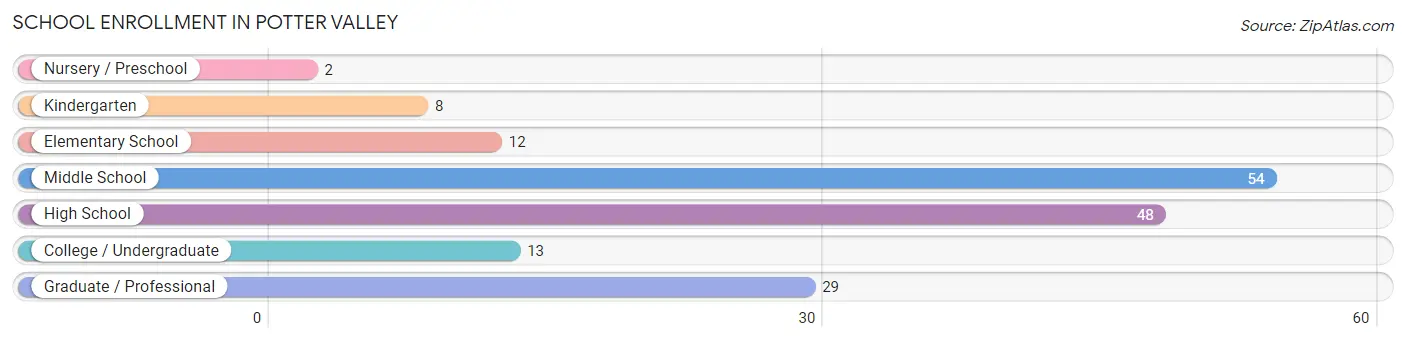
| School Level | # Students | % Students |
| Nursery / Preschool | 2 | 1.2% |
| Kindergarten | 8 | 4.8% |
| Elementary School | 12 | 7.2% |
| Middle School | 54 | 32.5% |
| High School | 48 | 28.9% |
| College / Undergraduate | 13 | 7.8% |
| Graduate / Professional | 29 | 17.5% |
| Total | 166 | 100.0% |
School Enrollment by Age by Funding Source in Potter Valley
Out of a total of 166 students who are enrolled in schools in Potter Valley, 9 (5.4%) attend a private institution, while the remaining 157 (94.6%) are enrolled in public schools. The age group of 5 to 9 year old has the highest likelihood of being enrolled in private schools, with 5 (22.7% in the age bracket) enrolled. Conversely, the age group of 15 to 17 year olds has the lowest likelihood of being enrolled in a private school, with 48 (100.0% in the age bracket) attending a public institution.
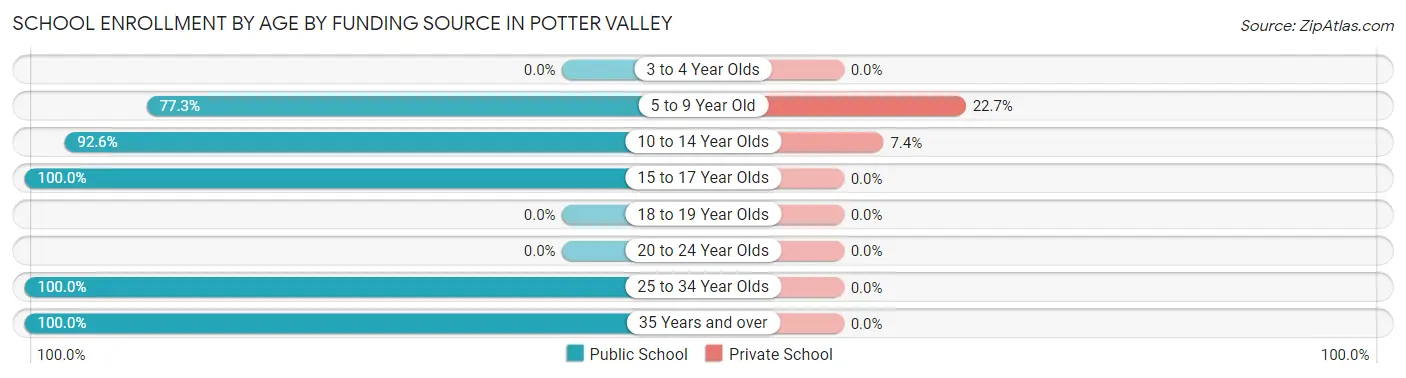
| Age Bracket | Public School | Private School |
| 3 to 4 Year Olds | 0 (0.0%) | 0 (0.0%) |
| 5 to 9 Year Old | 17 (77.3%) | 5 (22.7%) |
| 10 to 14 Year Olds | 50 (92.6%) | 4 (7.4%) |
| 15 to 17 Year Olds | 48 (100.0%) | 0 (0.0%) |
| 18 to 19 Year Olds | 0 (0.0%) | 0 (0.0%) |
| 20 to 24 Year Olds | 0 (0.0%) | 0 (0.0%) |
| 25 to 34 Year Olds | 29 (100.0%) | 0 (0.0%) |
| 35 Years and over | 13 (100.0%) | 0 (0.0%) |
| Total | 157 (94.6%) | 9 (5.4%) |
Educational Attainment by Field of Study in Potter Valley
Liberal arts & history (29 | 48.3%), business (9 | 15.0%), social sciences (6 | 10.0%), science & technology (6 | 10.0%), and psychology (5 | 8.3%) are the most common fields of study among 60 individuals in Potter Valley who have obtained a bachelor's degree or higher.
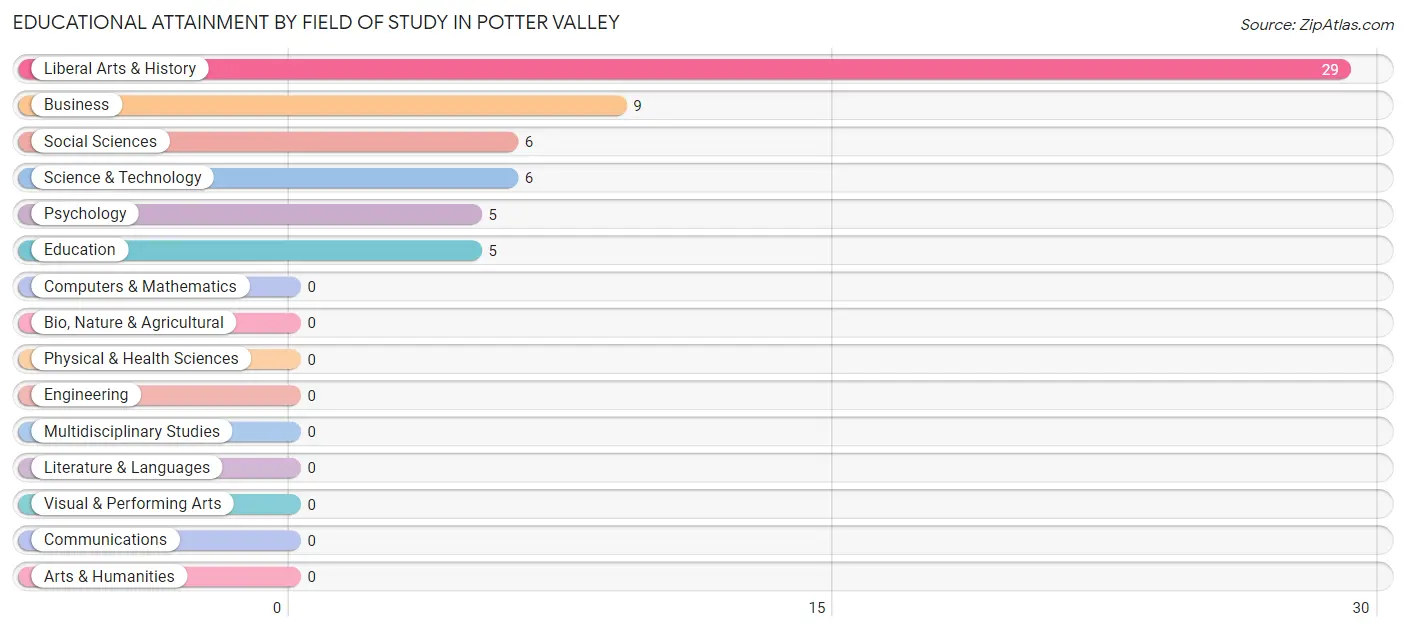
| Field of Study | # Graduates | % Graduates |
| Computers & Mathematics | 0 | 0.0% |
| Bio, Nature & Agricultural | 0 | 0.0% |
| Physical & Health Sciences | 0 | 0.0% |
| Psychology | 5 | 8.3% |
| Social Sciences | 6 | 10.0% |
| Engineering | 0 | 0.0% |
| Multidisciplinary Studies | 0 | 0.0% |
| Science & Technology | 6 | 10.0% |
| Business | 9 | 15.0% |
| Education | 5 | 8.3% |
| Literature & Languages | 0 | 0.0% |
| Liberal Arts & History | 29 | 48.3% |
| Visual & Performing Arts | 0 | 0.0% |
| Communications | 0 | 0.0% |
| Arts & Humanities | 0 | 0.0% |
| Total | 60 | 100.0% |
Transportation & Commute in Potter Valley
Vehicle Availability by Sex in Potter Valley
The most prevalent vehicle ownership categories in Potter Valley are males with 2 vehicles (31, accounting for 30.1%) and females with 2 vehicles (60, making up 30.1%).
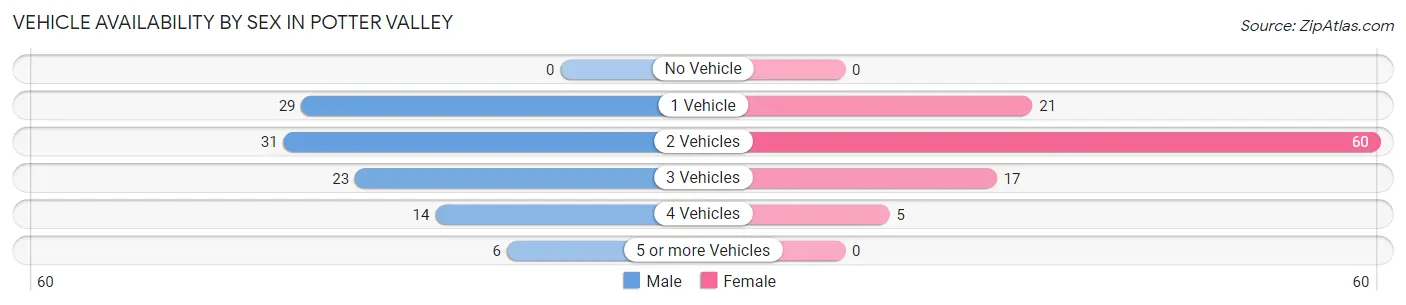
| Vehicles Available | Male | Female |
| No Vehicle | 0 (0.0%) | 0 (0.0%) |
| 1 Vehicle | 29 (28.2%) | 21 (20.4%) |
| 2 Vehicles | 31 (30.1%) | 60 (58.3%) |
| 3 Vehicles | 23 (22.3%) | 17 (16.5%) |
| 4 Vehicles | 14 (13.6%) | 5 (4.9%) |
| 5 or more Vehicles | 6 (5.8%) | 0 (0.0%) |
| Total | 103 (100.0%) | 103 (100.0%) |
Commute Time in Potter Valley
The most frequently occuring commute durations in Potter Valley are 30 to 34 minutes (93 commuters, 39.7%), 20 to 24 minutes (61 commuters, 26.1%), and 5 to 9 minutes (42 commuters, 17.9%).
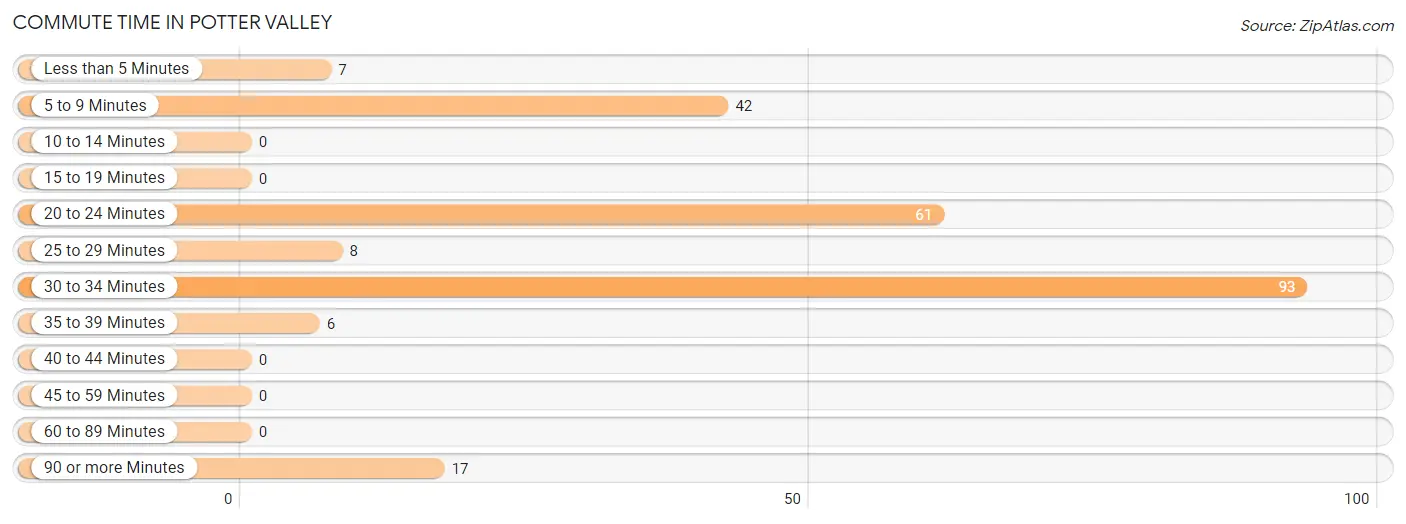
| Commute Time | # Commuters | % Commuters |
| Less than 5 Minutes | 7 | 3.0% |
| 5 to 9 Minutes | 42 | 17.9% |
| 10 to 14 Minutes | 0 | 0.0% |
| 15 to 19 Minutes | 0 | 0.0% |
| 20 to 24 Minutes | 61 | 26.1% |
| 25 to 29 Minutes | 8 | 3.4% |
| 30 to 34 Minutes | 93 | 39.7% |
| 35 to 39 Minutes | 6 | 2.6% |
| 40 to 44 Minutes | 0 | 0.0% |
| 45 to 59 Minutes | 0 | 0.0% |
| 60 to 89 Minutes | 0 | 0.0% |
| 90 or more Minutes | 17 | 7.3% |
Commute Time by Sex in Potter Valley
The most common commute times in Potter Valley are 30 to 34 minutes (58 commuters, 44.3%) for males and 5 to 9 minutes (42 commuters, 40.8%) for females.
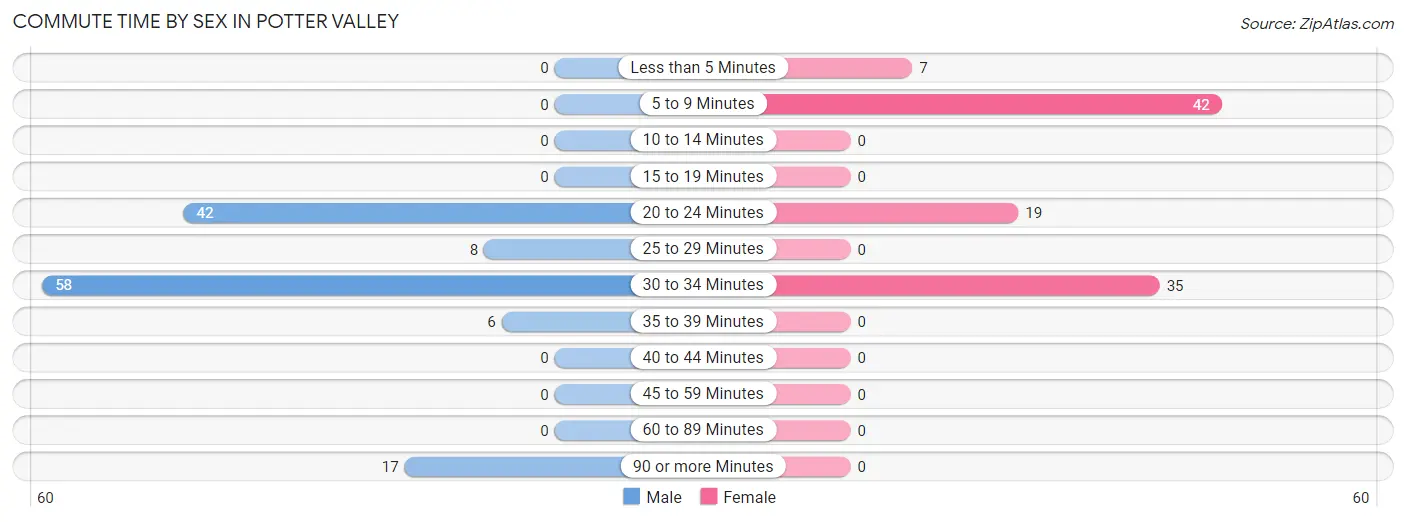
| Commute Time | Male | Female |
| Less than 5 Minutes | 0 (0.0%) | 7 (6.8%) |
| 5 to 9 Minutes | 0 (0.0%) | 42 (40.8%) |
| 10 to 14 Minutes | 0 (0.0%) | 0 (0.0%) |
| 15 to 19 Minutes | 0 (0.0%) | 0 (0.0%) |
| 20 to 24 Minutes | 42 (32.1%) | 19 (18.4%) |
| 25 to 29 Minutes | 8 (6.1%) | 0 (0.0%) |
| 30 to 34 Minutes | 58 (44.3%) | 35 (34.0%) |
| 35 to 39 Minutes | 6 (4.6%) | 0 (0.0%) |
| 40 to 44 Minutes | 0 (0.0%) | 0 (0.0%) |
| 45 to 59 Minutes | 0 (0.0%) | 0 (0.0%) |
| 60 to 89 Minutes | 0 (0.0%) | 0 (0.0%) |
| 90 or more Minutes | 17 (13.0%) | 0 (0.0%) |
Time of Departure to Work by Sex in Potter Valley
The most frequent times of departure to work in Potter Valley are 12:00 PM to 3:59 PM (28, 21.4%) for males and 7:00 AM to 7:29 AM (34, 33.0%) for females.
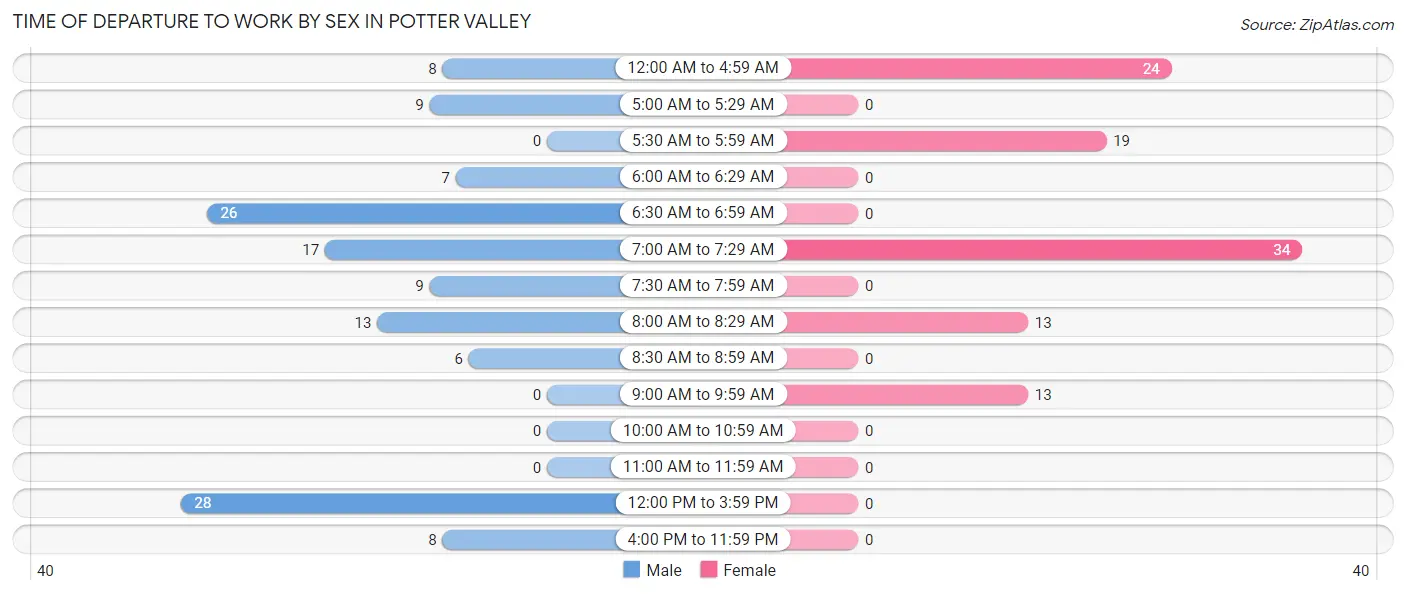
| Time of Departure | Male | Female |
| 12:00 AM to 4:59 AM | 8 (6.1%) | 24 (23.3%) |
| 5:00 AM to 5:29 AM | 9 (6.9%) | 0 (0.0%) |
| 5:30 AM to 5:59 AM | 0 (0.0%) | 19 (18.4%) |
| 6:00 AM to 6:29 AM | 7 (5.3%) | 0 (0.0%) |
| 6:30 AM to 6:59 AM | 26 (19.9%) | 0 (0.0%) |
| 7:00 AM to 7:29 AM | 17 (13.0%) | 34 (33.0%) |
| 7:30 AM to 7:59 AM | 9 (6.9%) | 0 (0.0%) |
| 8:00 AM to 8:29 AM | 13 (9.9%) | 13 (12.6%) |
| 8:30 AM to 8:59 AM | 6 (4.6%) | 0 (0.0%) |
| 9:00 AM to 9:59 AM | 0 (0.0%) | 13 (12.6%) |
| 10:00 AM to 10:59 AM | 0 (0.0%) | 0 (0.0%) |
| 11:00 AM to 11:59 AM | 0 (0.0%) | 0 (0.0%) |
| 12:00 PM to 3:59 PM | 28 (21.4%) | 0 (0.0%) |
| 4:00 PM to 11:59 PM | 8 (6.1%) | 0 (0.0%) |
| Total | 131 (100.0%) | 103 (100.0%) |
Housing Occupancy in Potter Valley
Occupancy by Ownership in Potter Valley
Of the total 219 dwellings in Potter Valley, owner-occupied units account for 131 (59.8%), while renter-occupied units make up 88 (40.2%).
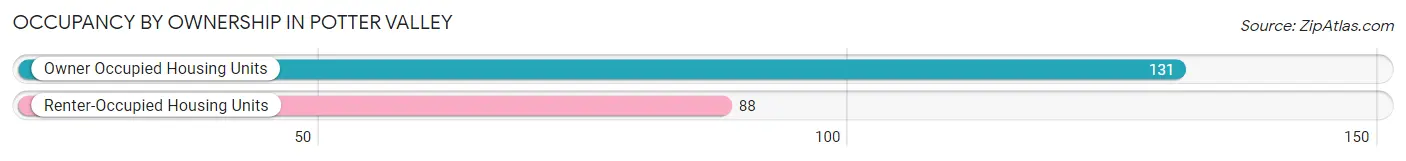
| Occupancy | # Housing Units | % Housing Units |
| Owner Occupied Housing Units | 131 | 59.8% |
| Renter-Occupied Housing Units | 88 | 40.2% |
| Total Occupied Housing Units | 219 | 100.0% |
Occupancy by Household Size in Potter Valley
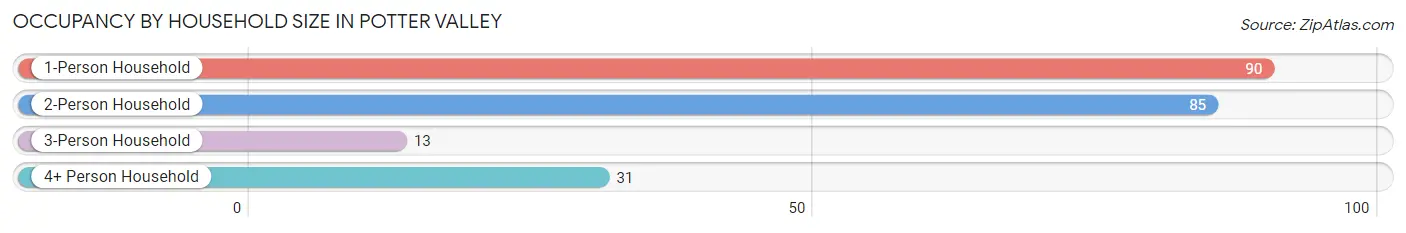
| Household Size | # Housing Units | % Housing Units |
| 1-Person Household | 90 | 41.1% |
| 2-Person Household | 85 | 38.8% |
| 3-Person Household | 13 | 5.9% |
| 4+ Person Household | 31 | 14.2% |
| Total Housing Units | 219 | 100.0% |
Occupancy by Ownership by Household Size in Potter Valley
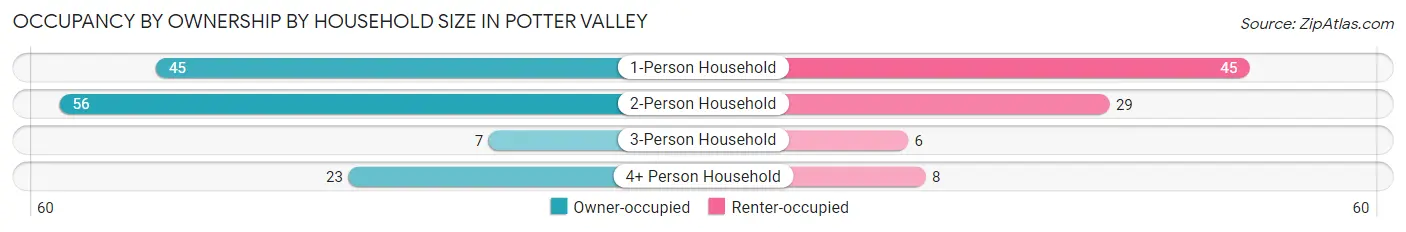
| Household Size | Owner-occupied | Renter-occupied |
| 1-Person Household | 45 (50.0%) | 45 (50.0%) |
| 2-Person Household | 56 (65.9%) | 29 (34.1%) |
| 3-Person Household | 7 (53.8%) | 6 (46.2%) |
| 4+ Person Household | 23 (74.2%) | 8 (25.8%) |
| Total Housing Units | 131 (59.8%) | 88 (40.2%) |
Occupancy by Educational Attainment in Potter Valley
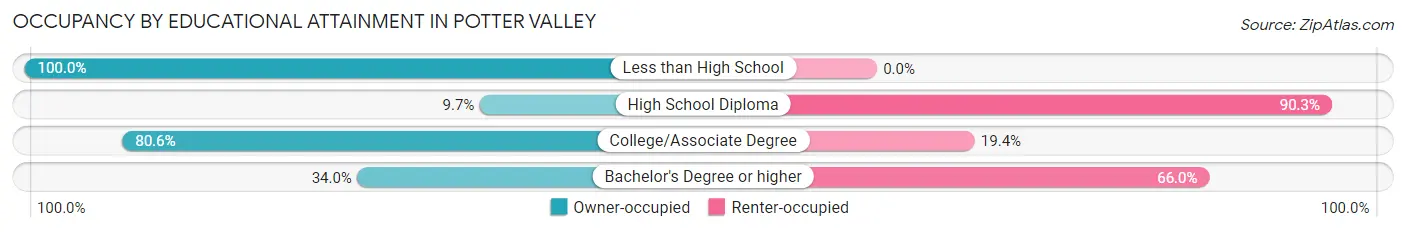
| Household Size | Owner-occupied | Renter-occupied |
| Less than High School | 6 (100.0%) | 0 (0.0%) |
| High School Diploma | 3 (9.7%) | 28 (90.3%) |
| College/Associate Degree | 104 (80.6%) | 25 (19.4%) |
| Bachelor's Degree or higher | 18 (34.0%) | 35 (66.0%) |
Occupancy by Age of Householder in Potter Valley
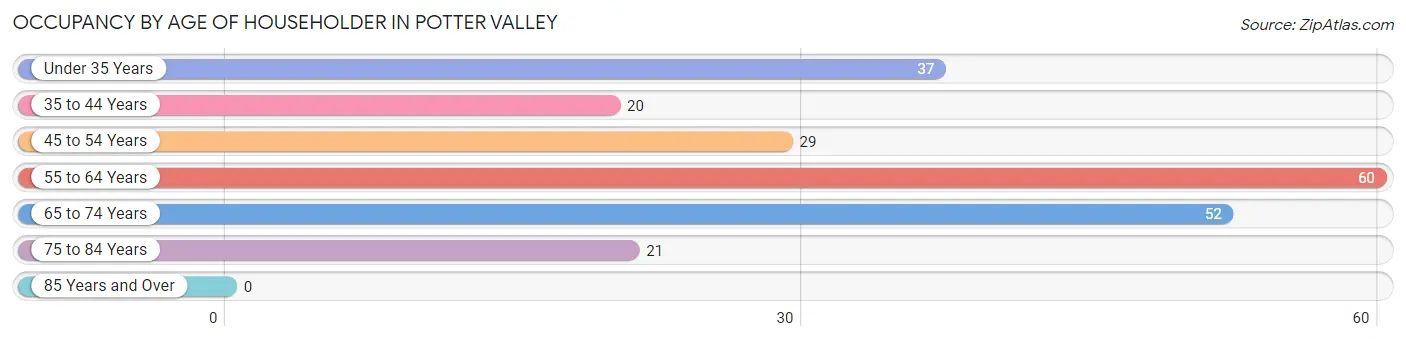
| Age Bracket | # Households | % Households |
| Under 35 Years | 37 | 16.9% |
| 35 to 44 Years | 20 | 9.1% |
| 45 to 54 Years | 29 | 13.2% |
| 55 to 64 Years | 60 | 27.4% |
| 65 to 74 Years | 52 | 23.7% |
| 75 to 84 Years | 21 | 9.6% |
| 85 Years and Over | 0 | 0.0% |
| Total | 219 | 100.0% |
Housing Finances in Potter Valley
Median Income by Occupancy in Potter Valley
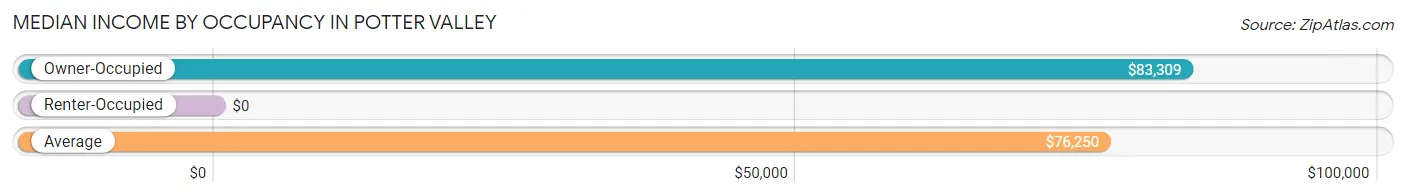
| Occupancy Type | # Households | Median Income |
| Owner-Occupied | 131 (59.8%) | $83,309 |
| Renter-Occupied | 88 (40.2%) | $0 |
| Average | 219 (100.0%) | $76,250 |
Occupancy by Householder Income Bracket in Potter Valley
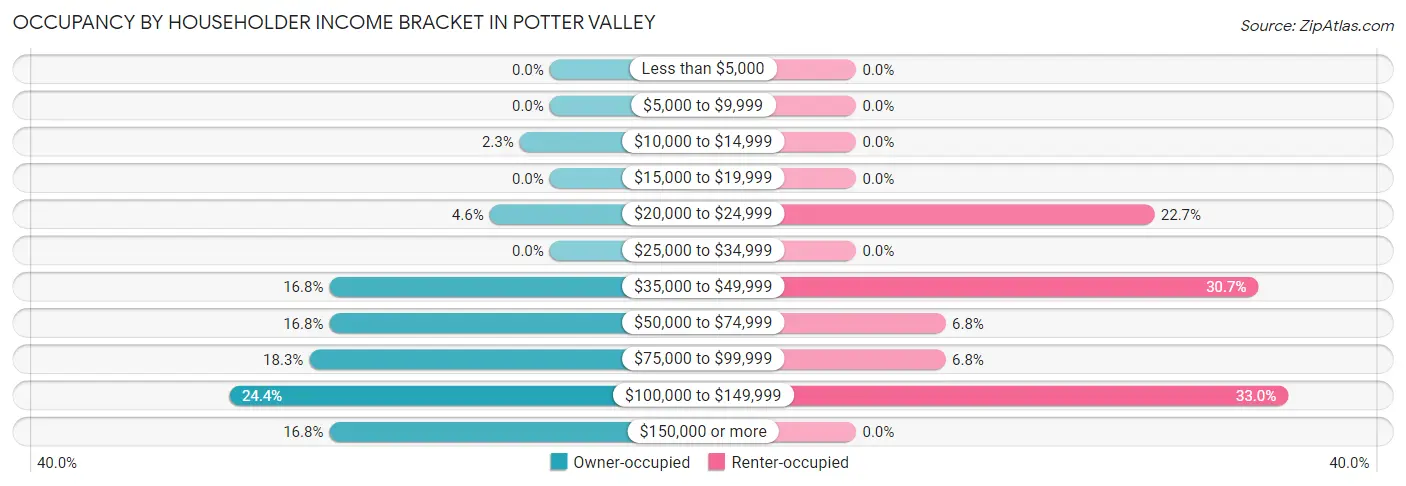
| Income Bracket | Owner-occupied | Renter-occupied |
| Less than $5,000 | 0 (0.0%) | 0 (0.0%) |
| $5,000 to $9,999 | 0 (0.0%) | 0 (0.0%) |
| $10,000 to $14,999 | 3 (2.3%) | 0 (0.0%) |
| $15,000 to $19,999 | 0 (0.0%) | 0 (0.0%) |
| $20,000 to $24,999 | 6 (4.6%) | 20 (22.7%) |
| $25,000 to $34,999 | 0 (0.0%) | 0 (0.0%) |
| $35,000 to $49,999 | 22 (16.8%) | 27 (30.7%) |
| $50,000 to $74,999 | 22 (16.8%) | 6 (6.8%) |
| $75,000 to $99,999 | 24 (18.3%) | 6 (6.8%) |
| $100,000 to $149,999 | 32 (24.4%) | 29 (33.0%) |
| $150,000 or more | 22 (16.8%) | 0 (0.0%) |
| Total | 131 (100.0%) | 88 (100.0%) |
Monthly Housing Cost Tiers in Potter Valley
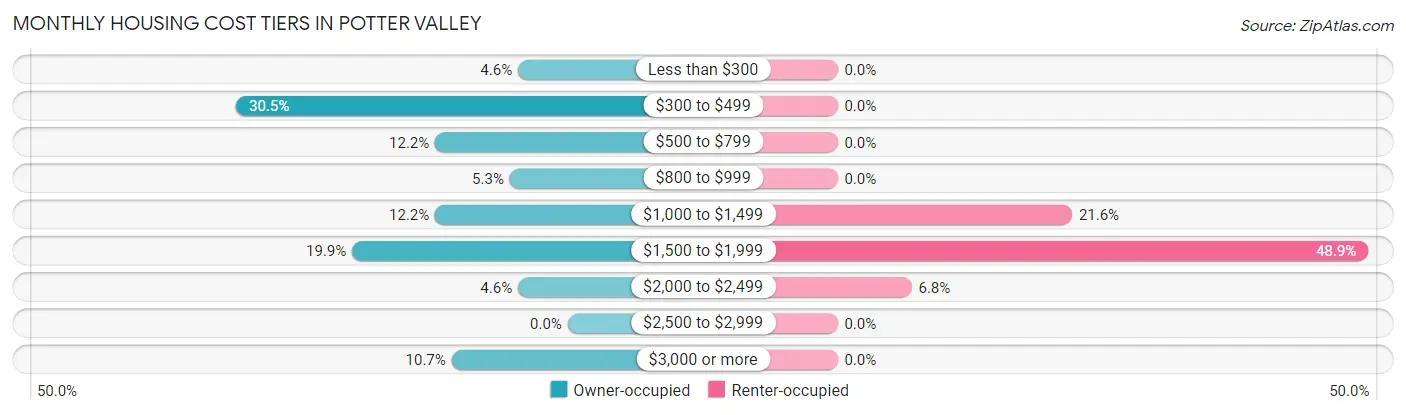
| Monthly Cost | Owner-occupied | Renter-occupied |
| Less than $300 | 6 (4.6%) | 0 (0.0%) |
| $300 to $499 | 40 (30.5%) | 0 (0.0%) |
| $500 to $799 | 16 (12.2%) | 0 (0.0%) |
| $800 to $999 | 7 (5.3%) | 0 (0.0%) |
| $1,000 to $1,499 | 16 (12.2%) | 19 (21.6%) |
| $1,500 to $1,999 | 26 (19.9%) | 43 (48.9%) |
| $2,000 to $2,499 | 6 (4.6%) | 6 (6.8%) |
| $2,500 to $2,999 | 0 (0.0%) | 0 (0.0%) |
| $3,000 or more | 14 (10.7%) | 0 (0.0%) |
| Total | 131 (100.0%) | 88 (100.0%) |
Physical Housing Characteristics in Potter Valley
Housing Structures in Potter Valley
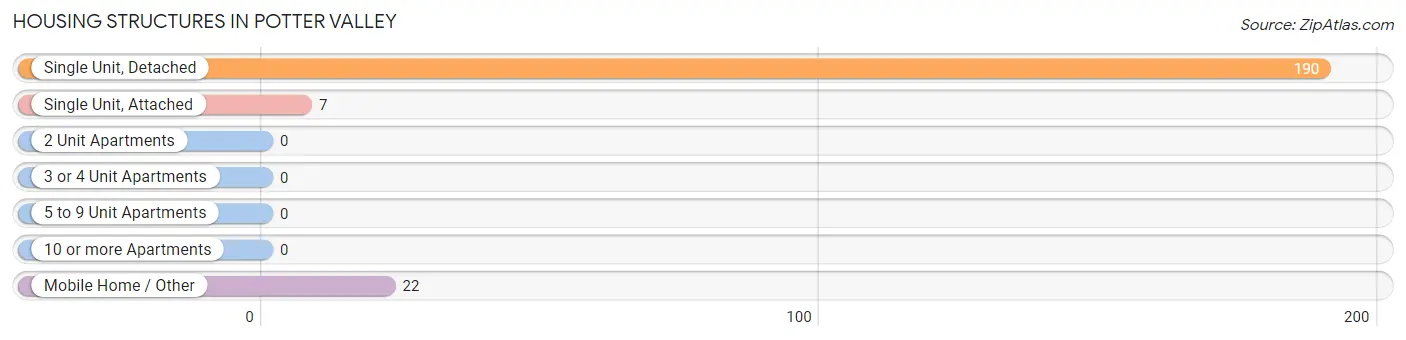
| Structure Type | # Housing Units | % Housing Units |
| Single Unit, Detached | 190 | 86.8% |
| Single Unit, Attached | 7 | 3.2% |
| 2 Unit Apartments | 0 | 0.0% |
| 3 or 4 Unit Apartments | 0 | 0.0% |
| 5 to 9 Unit Apartments | 0 | 0.0% |
| 10 or more Apartments | 0 | 0.0% |
| Mobile Home / Other | 22 | 10.1% |
| Total | 219 | 100.0% |
Housing Structures by Occupancy in Potter Valley
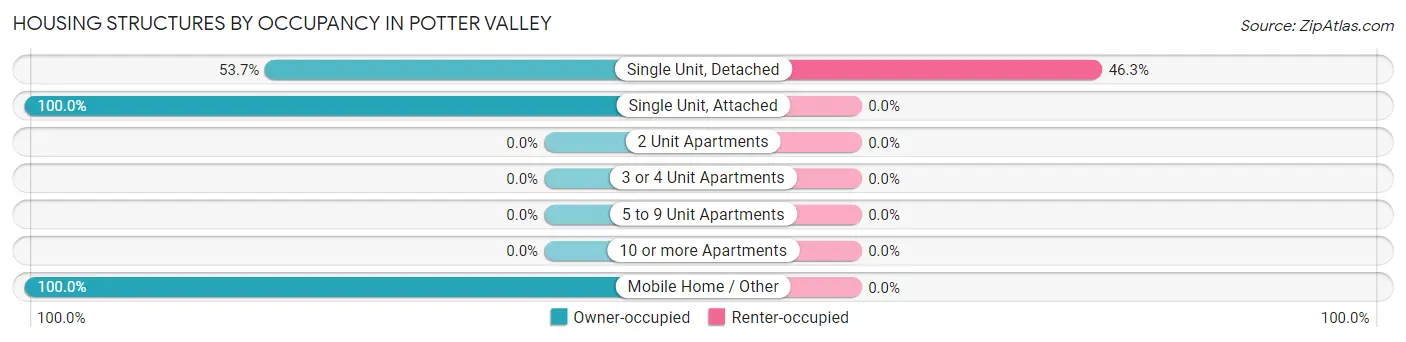
| Structure Type | Owner-occupied | Renter-occupied |
| Single Unit, Detached | 102 (53.7%) | 88 (46.3%) |
| Single Unit, Attached | 7 (100.0%) | 0 (0.0%) |
| 2 Unit Apartments | 0 (0.0%) | 0 (0.0%) |
| 3 or 4 Unit Apartments | 0 (0.0%) | 0 (0.0%) |
| 5 to 9 Unit Apartments | 0 (0.0%) | 0 (0.0%) |
| 10 or more Apartments | 0 (0.0%) | 0 (0.0%) |
| Mobile Home / Other | 22 (100.0%) | 0 (0.0%) |
| Total | 131 (59.8%) | 88 (40.2%) |
Housing Structures by Number of Rooms in Potter Valley
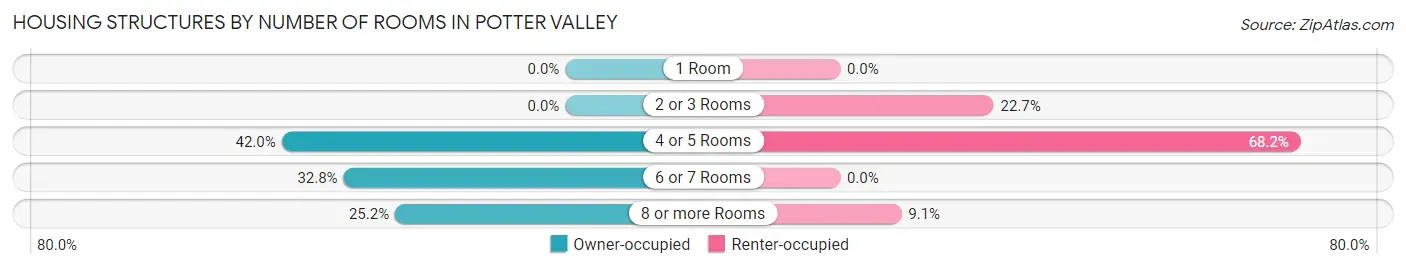
| Number of Rooms | Owner-occupied | Renter-occupied |
| 1 Room | 0 (0.0%) | 0 (0.0%) |
| 2 or 3 Rooms | 0 (0.0%) | 20 (22.7%) |
| 4 or 5 Rooms | 55 (42.0%) | 60 (68.2%) |
| 6 or 7 Rooms | 43 (32.8%) | 0 (0.0%) |
| 8 or more Rooms | 33 (25.2%) | 8 (9.1%) |
| Total | 131 (100.0%) | 88 (100.0%) |
Housing Structure by Heating Type in Potter Valley
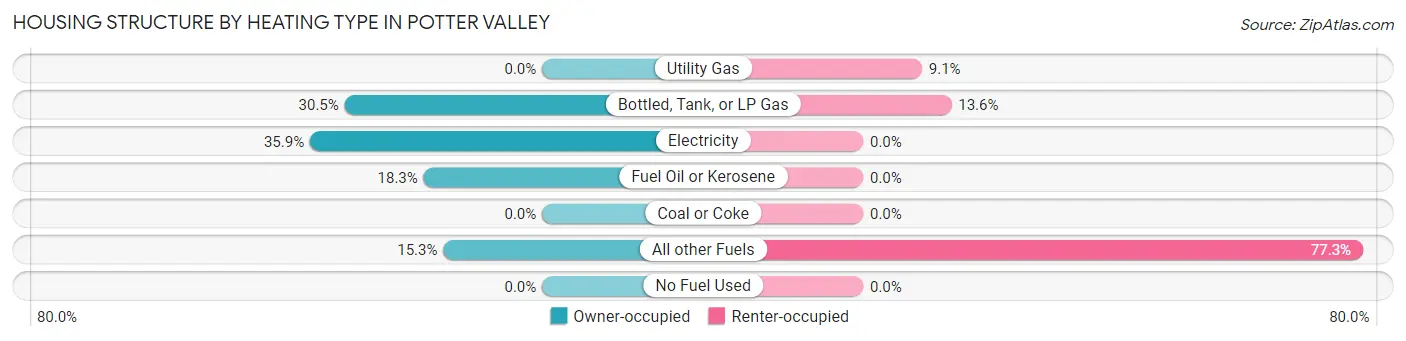
| Heating Type | Owner-occupied | Renter-occupied |
| Utility Gas | 0 (0.0%) | 8 (9.1%) |
| Bottled, Tank, or LP Gas | 40 (30.5%) | 12 (13.6%) |
| Electricity | 47 (35.9%) | 0 (0.0%) |
| Fuel Oil or Kerosene | 24 (18.3%) | 0 (0.0%) |
| Coal or Coke | 0 (0.0%) | 0 (0.0%) |
| All other Fuels | 20 (15.3%) | 68 (77.3%) |
| No Fuel Used | 0 (0.0%) | 0 (0.0%) |
| Total | 131 (100.0%) | 88 (100.0%) |
Household Vehicle Usage in Potter Valley
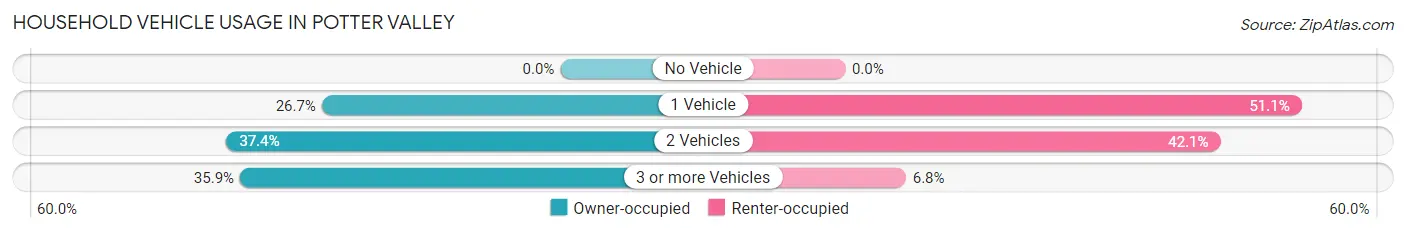
| Vehicles per Household | Owner-occupied | Renter-occupied |
| No Vehicle | 0 (0.0%) | 0 (0.0%) |
| 1 Vehicle | 35 (26.7%) | 45 (51.1%) |
| 2 Vehicles | 49 (37.4%) | 37 (42.0%) |
| 3 or more Vehicles | 47 (35.9%) | 6 (6.8%) |
| Total | 131 (100.0%) | 88 (100.0%) |
Real Estate & Mortgages in Potter Valley
Real Estate and Mortgage Overview in Potter Valley
| Characteristic | Without Mortgage | With Mortgage |
| Housing Units | 81 | 50 |
| Median Property Value | $452,100 | $795,500 |
| Median Household Income | $82,868 | $22 |
| Monthly Housing Costs | $476 | $14 |
| Real Estate Taxes | $1,830 | $0 |
Property Value by Mortgage Status in Potter Valley
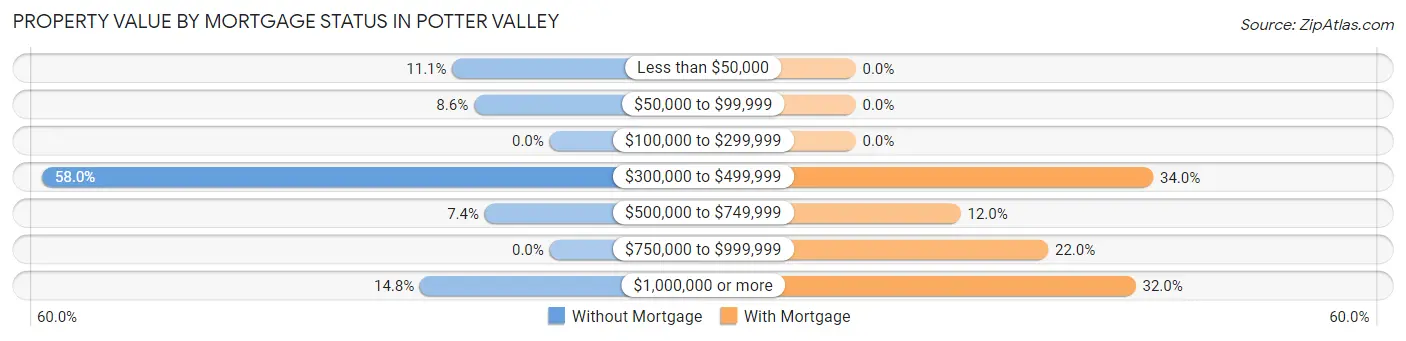
| Property Value | Without Mortgage | With Mortgage |
| Less than $50,000 | 9 (11.1%) | 0 (0.0%) |
| $50,000 to $99,999 | 7 (8.6%) | 0 (0.0%) |
| $100,000 to $299,999 | 0 (0.0%) | 0 (0.0%) |
| $300,000 to $499,999 | 47 (58.0%) | 17 (34.0%) |
| $500,000 to $749,999 | 6 (7.4%) | 6 (12.0%) |
| $750,000 to $999,999 | 0 (0.0%) | 11 (22.0%) |
| $1,000,000 or more | 12 (14.8%) | 16 (32.0%) |
| Total | 81 (100.0%) | 50 (100.0%) |
Household Income by Mortgage Status in Potter Valley
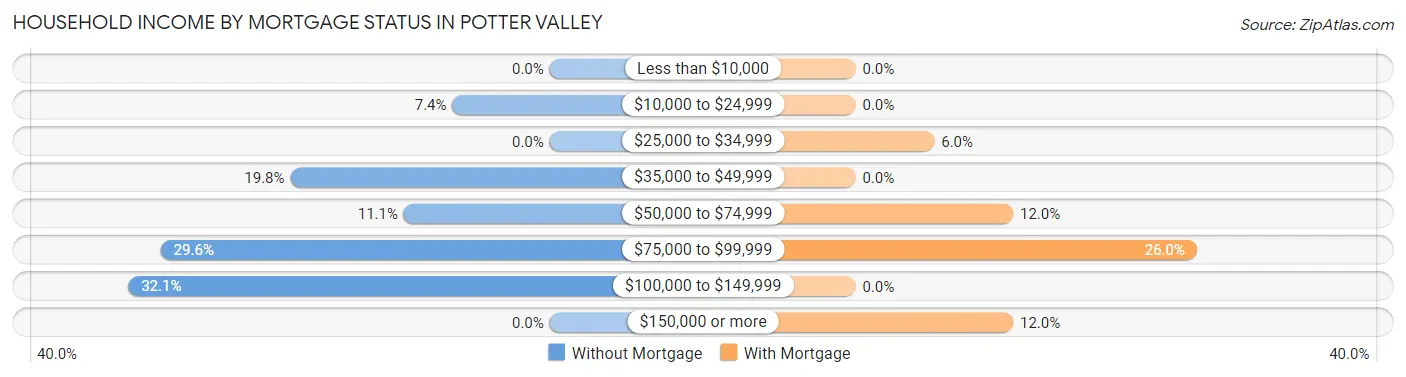
| Household Income | Without Mortgage | With Mortgage |
| Less than $10,000 | 0 (0.0%) | 0 (0.0%) |
| $10,000 to $24,999 | 6 (7.4%) | 0 (0.0%) |
| $25,000 to $34,999 | 0 (0.0%) | 3 (6.0%) |
| $35,000 to $49,999 | 16 (19.8%) | 0 (0.0%) |
| $50,000 to $74,999 | 9 (11.1%) | 6 (12.0%) |
| $75,000 to $99,999 | 24 (29.6%) | 13 (26.0%) |
| $100,000 to $149,999 | 26 (32.1%) | 0 (0.0%) |
| $150,000 or more | 0 (0.0%) | 6 (12.0%) |
| Total | 81 (100.0%) | 50 (100.0%) |
Property Value to Household Income Ratio in Potter Valley
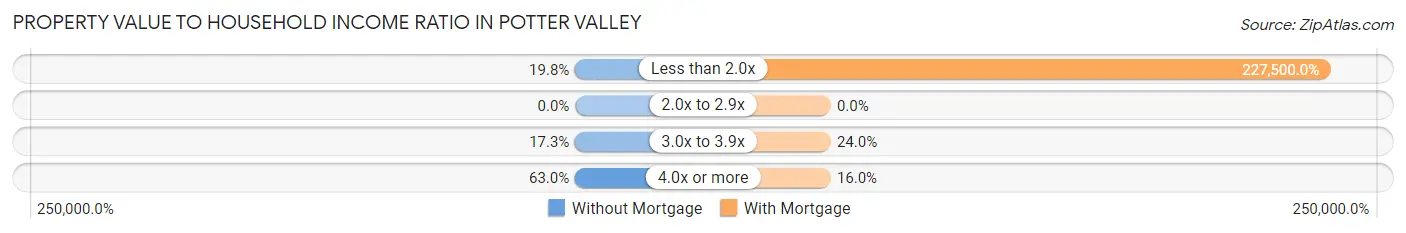
| Value-to-Income Ratio | Without Mortgage | With Mortgage |
| Less than 2.0x | 16 (19.8%) | 113,750 (227,500.0%) |
| 2.0x to 2.9x | 0 (0.0%) | 0 (0.0%) |
| 3.0x to 3.9x | 14 (17.3%) | 12 (24.0%) |
| 4.0x or more | 51 (63.0%) | 8 (16.0%) |
| Total | 81 (100.0%) | 50 (100.0%) |
Real Estate Taxes by Mortgage Status in Potter Valley
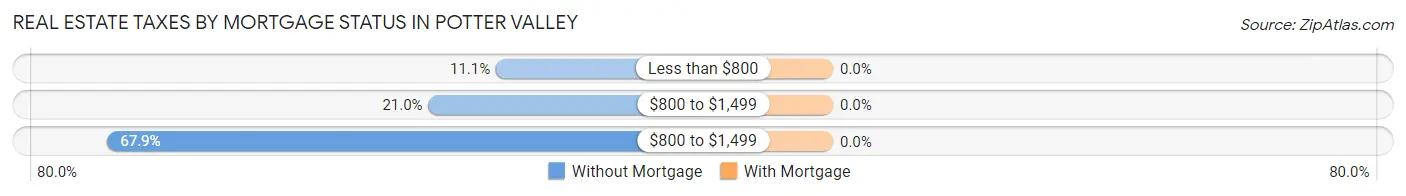
| Property Taxes | Without Mortgage | With Mortgage |
| Less than $800 | 9 (11.1%) | 0 (0.0%) |
| $800 to $1,499 | 17 (21.0%) | 0 (0.0%) |
| $800 to $1,499 | 55 (67.9%) | 0 (0.0%) |
| Total | 81 (100.0%) | 50 (100.0%) |
Health & Disability in Potter Valley
Health Insurance Coverage by Age in Potter Valley
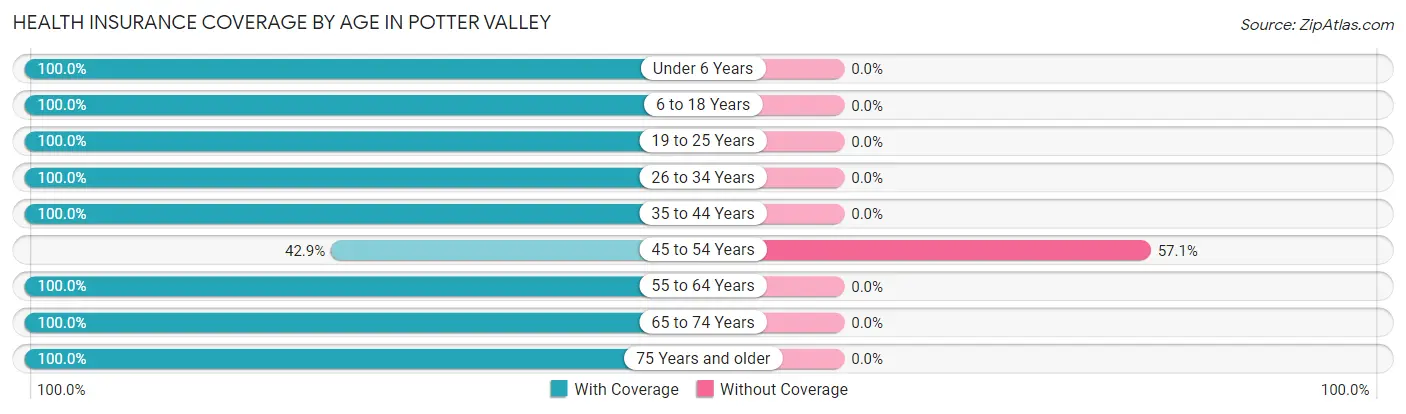
| Age Bracket | With Coverage | Without Coverage |
| Under 6 Years | 33 (100.0%) | 0 (0.0%) |
| 6 to 18 Years | 114 (100.0%) | 0 (0.0%) |
| 19 to 25 Years | 8 (100.0%) | 0 (0.0%) |
| 26 to 34 Years | 108 (100.0%) | 0 (0.0%) |
| 35 to 44 Years | 49 (100.0%) | 0 (0.0%) |
| 45 to 54 Years | 15 (42.9%) | 20 (57.1%) |
| 55 to 64 Years | 93 (100.0%) | 0 (0.0%) |
| 65 to 74 Years | 70 (100.0%) | 0 (0.0%) |
| 75 Years and older | 27 (100.0%) | 0 (0.0%) |
| Total | 517 (96.3%) | 20 (3.7%) |
Health Insurance Coverage by Citizenship Status in Potter Valley
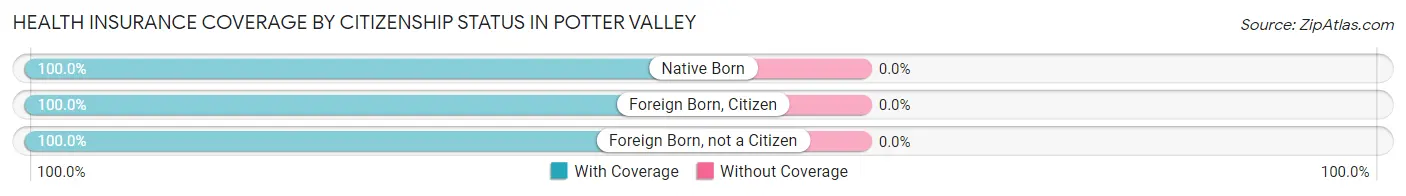
| Citizenship Status | With Coverage | Without Coverage |
| Native Born | 33 (100.0%) | 0 (0.0%) |
| Foreign Born, Citizen | 114 (100.0%) | 0 (0.0%) |
| Foreign Born, not a Citizen | 8 (100.0%) | 0 (0.0%) |
Health Insurance Coverage by Household Income in Potter Valley
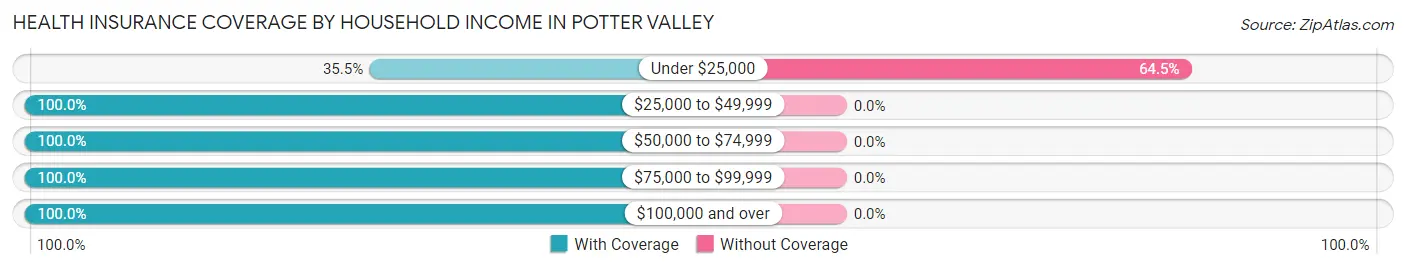
| Household Income | With Coverage | Without Coverage |
| Under $25,000 | 11 (35.5%) | 20 (64.5%) |
| $25,000 to $49,999 | 72 (100.0%) | 0 (0.0%) |
| $50,000 to $74,999 | 110 (100.0%) | 0 (0.0%) |
| $75,000 to $99,999 | 103 (100.0%) | 0 (0.0%) |
| $100,000 and over | 193 (100.0%) | 0 (0.0%) |
Public vs Private Health Insurance Coverage by Age in Potter Valley
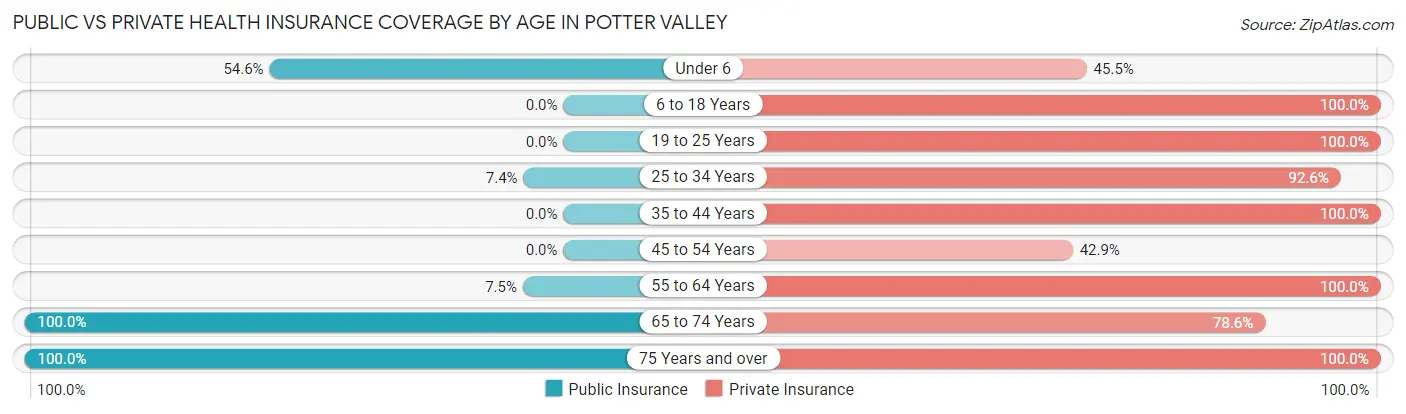
| Age Bracket | Public Insurance | Private Insurance |
| Under 6 | 18 (54.5%) | 15 (45.5%) |
| 6 to 18 Years | 0 (0.0%) | 114 (100.0%) |
| 19 to 25 Years | 0 (0.0%) | 8 (100.0%) |
| 25 to 34 Years | 8 (7.4%) | 100 (92.6%) |
| 35 to 44 Years | 0 (0.0%) | 49 (100.0%) |
| 45 to 54 Years | 0 (0.0%) | 15 (42.9%) |
| 55 to 64 Years | 7 (7.5%) | 93 (100.0%) |
| 65 to 74 Years | 70 (100.0%) | 55 (78.6%) |
| 75 Years and over | 27 (100.0%) | 27 (100.0%) |
| Total | 130 (24.2%) | 476 (88.6%) |
Disability Status by Sex by Age in Potter Valley
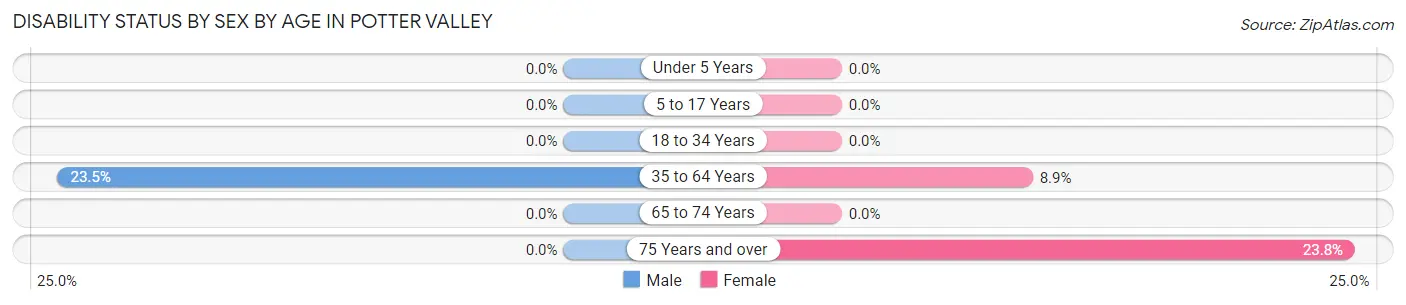
| Age Bracket | Male | Female |
| Under 5 Years | 0 (0.0%) | 0 (0.0%) |
| 5 to 17 Years | 0 (0.0%) | 0 (0.0%) |
| 18 to 34 Years | 0 (0.0%) | 0 (0.0%) |
| 35 to 64 Years | 23 (23.5%) | 7 (8.9%) |
| 65 to 74 Years | 0 (0.0%) | 0 (0.0%) |
| 75 Years and over | 0 (0.0%) | 5 (23.8%) |
Disability Class by Sex by Age in Potter Valley
Disability Class: Hearing Difficulty
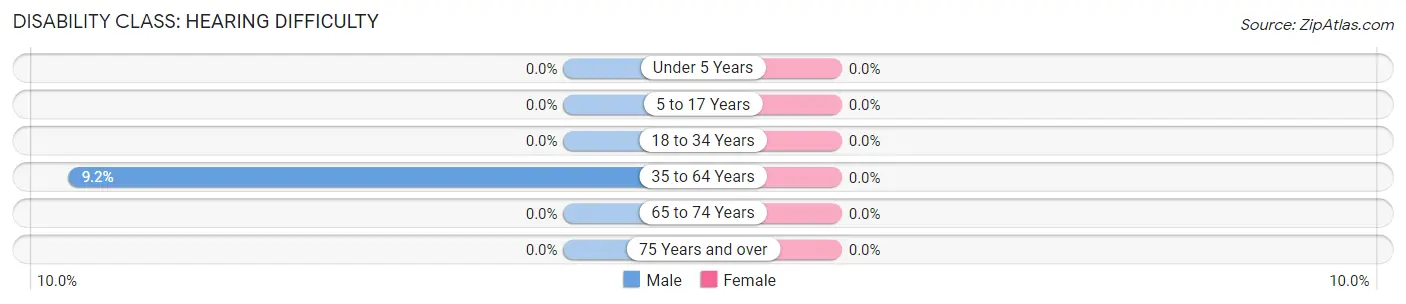
| Age Bracket | Male | Female |
| Under 5 Years | 0 (0.0%) | 0 (0.0%) |
| 5 to 17 Years | 0 (0.0%) | 0 (0.0%) |
| 18 to 34 Years | 0 (0.0%) | 0 (0.0%) |
| 35 to 64 Years | 9 (9.2%) | 0 (0.0%) |
| 65 to 74 Years | 0 (0.0%) | 0 (0.0%) |
| 75 Years and over | 0 (0.0%) | 0 (0.0%) |
Disability Class: Vision Difficulty
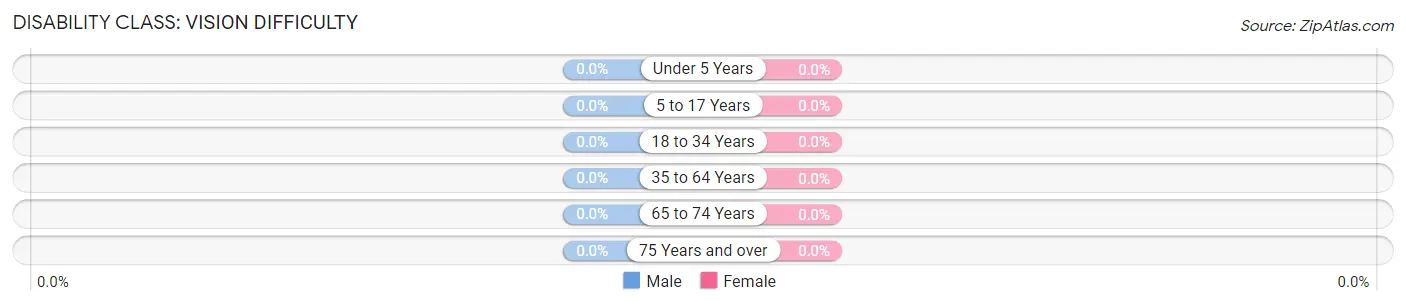
| Age Bracket | Male | Female |
| Under 5 Years | 0 (0.0%) | 0 (0.0%) |
| 5 to 17 Years | 0 (0.0%) | 0 (0.0%) |
| 18 to 34 Years | 0 (0.0%) | 0 (0.0%) |
| 35 to 64 Years | 0 (0.0%) | 0 (0.0%) |
| 65 to 74 Years | 0 (0.0%) | 0 (0.0%) |
| 75 Years and over | 0 (0.0%) | 0 (0.0%) |
Disability Class: Cognitive Difficulty
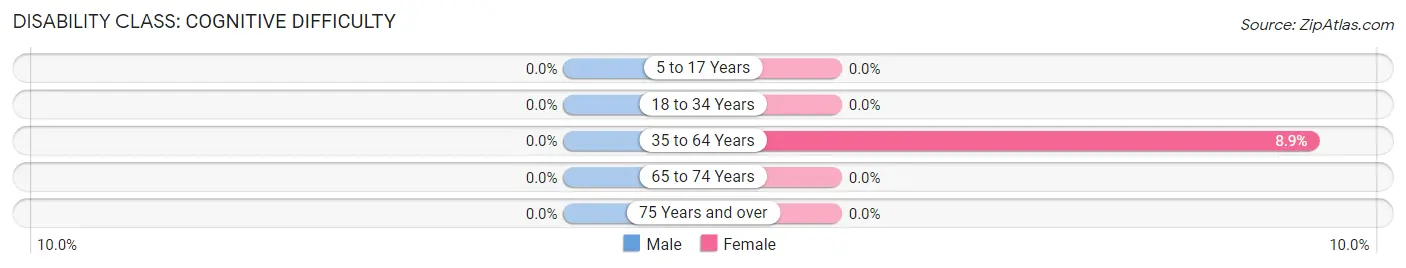
| Age Bracket | Male | Female |
| 5 to 17 Years | 0 (0.0%) | 0 (0.0%) |
| 18 to 34 Years | 0 (0.0%) | 0 (0.0%) |
| 35 to 64 Years | 0 (0.0%) | 7 (8.9%) |
| 65 to 74 Years | 0 (0.0%) | 0 (0.0%) |
| 75 Years and over | 0 (0.0%) | 0 (0.0%) |
Disability Class: Ambulatory Difficulty
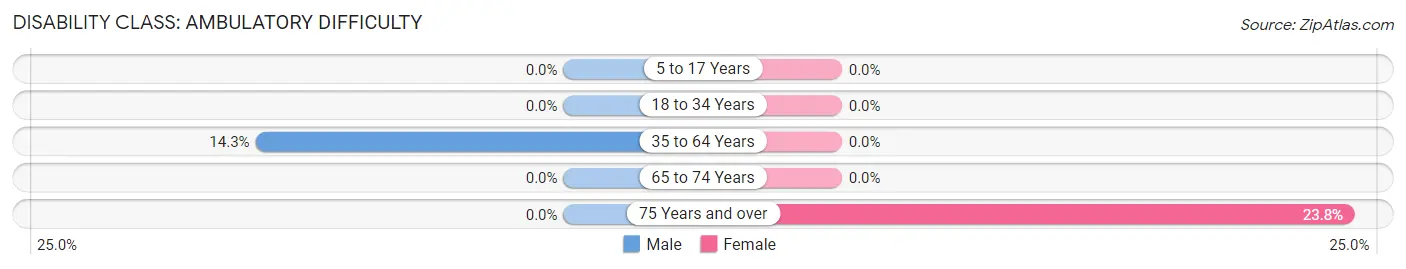
| Age Bracket | Male | Female |
| 5 to 17 Years | 0 (0.0%) | 0 (0.0%) |
| 18 to 34 Years | 0 (0.0%) | 0 (0.0%) |
| 35 to 64 Years | 14 (14.3%) | 0 (0.0%) |
| 65 to 74 Years | 0 (0.0%) | 0 (0.0%) |
| 75 Years and over | 0 (0.0%) | 5 (23.8%) |
Disability Class: Self-Care Difficulty
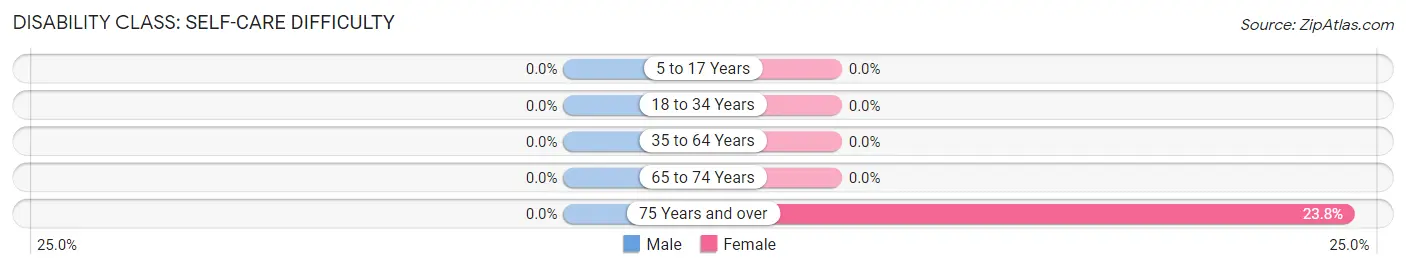
| Age Bracket | Male | Female |
| 5 to 17 Years | 0 (0.0%) | 0 (0.0%) |
| 18 to 34 Years | 0 (0.0%) | 0 (0.0%) |
| 35 to 64 Years | 0 (0.0%) | 0 (0.0%) |
| 65 to 74 Years | 0 (0.0%) | 0 (0.0%) |
| 75 Years and over | 0 (0.0%) | 5 (23.8%) |
Technology Access in Potter Valley
Computing Device Access in Potter Valley
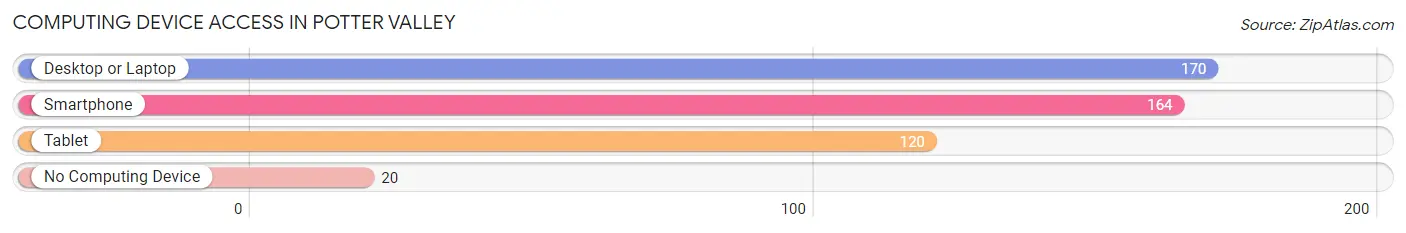
| Device Type | # Households | % Households |
| Desktop or Laptop | 170 | 77.6% |
| Smartphone | 164 | 74.9% |
| Tablet | 120 | 54.8% |
| No Computing Device | 20 | 9.1% |
| Total | 219 | 100.0% |
Internet Access in Potter Valley
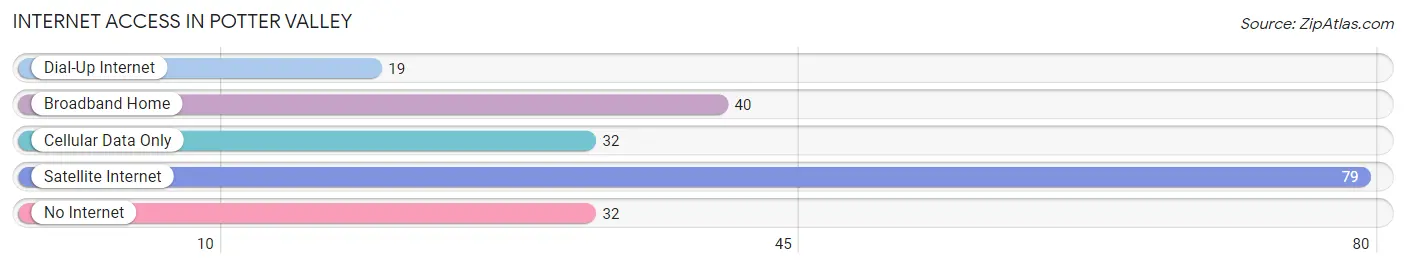
| Internet Type | # Households | % Households |
| Dial-Up Internet | 19 | 8.7% |
| Broadband Home | 40 | 18.3% |
| Cellular Data Only | 32 | 14.6% |
| Satellite Internet | 79 | 36.1% |
| No Internet | 32 | 14.6% |
| Total | 219 | 100.0% |
Potter Valley Summary
Potter Valley is a small unincorporated community located in Mendocino County, California. It is situated in the upper reaches of the Russian River Valley, about 10 miles east of Ukiah and about 20 miles west of Willits. The population of Potter Valley was 1,072 at the 2010 census.
History
Potter Valley was first settled in the 1850s by settlers from the Midwest. The town was named after the Potter family, who were among the first settlers. The Potter family built a sawmill and a gristmill, which were the first industries in the area. The Potter family also established a post office in 1878.
In the late 19th century, Potter Valley became a popular destination for tourists, who came to enjoy the area's natural beauty and recreational activities. The town was also known for its apple orchards, which were planted by the Potter family.
In the early 20th century, Potter Valley was a popular destination for hunters and fishermen. The town was also home to a number of resorts, which attracted visitors from all over the country.
Geography
Potter Valley is located in the upper reaches of the Russian River Valley, about 10 miles east of Ukiah and about 20 miles west of Willits. The town is situated at an elevation of 1,400 feet above sea level. The area is characterized by rolling hills, oak woodlands, and grassy meadows.
The climate in Potter Valley is mild and temperate, with warm summers and cool winters. The average annual temperature is around 60 degrees Fahrenheit. The average annual precipitation is around 25 inches.
Economy
The economy of Potter Valley is largely based on agriculture. The area is known for its apple orchards, which produce a variety of apples, including Granny Smith, Golden Delicious, and Red Delicious. Other crops grown in the area include walnuts, pears, and grapes.
The town is also home to a number of small businesses, including restaurants, shops, and lodging. The Potter Valley Community Center is a popular destination for local events, such as concerts, festivals, and farmers markets.
Demographics
As of the 2010 census, the population of Potter Valley was 1,072. The racial makeup of the town was 87.3% White, 0.7% African American, 0.7% Native American, 0.7% Asian, 0.2% Pacific Islander, 8.2% from other races, and 2.1% from two or more races. Hispanic or Latino of any race were 16.2% of the population.
The median household income in Potter Valley was $41,250, and the median family income was $48,750. The per capita income was $20,945. About 11.2% of families and 14.2% of the population were below the poverty line, including 18.2% of those under age 18 and 8.3% of those age 65 or over.
Common Questions
What is Per Capita Income in Potter Valley?
Per Capita income in Potter Valley is $41,985.
What is the Median Family Income in Potter Valley?
Median Family Income in Potter Valley is $128,839.
What is the Median Household income in Potter Valley?
Median Household Income in Potter Valley is $76,250.
What is Income or Wage Gap in Potter Valley?
Income or Wage Gap in Potter Valley is 28.9%.
Women in Potter Valley earn 71.1 cents for every dollar earned by a man.
What is Inequality or Gini Index in Potter Valley?
Inequality or Gini Index in Potter Valley is 0.37.
What is the Total Population of Potter Valley?
Total Population of Potter Valley is 537.
What is the Total Male Population of Potter Valley?
Total Male Population of Potter Valley is 238.
What is the Total Female Population of Potter Valley?
Total Female Population of Potter Valley is 299.
What is the Ratio of Males per 100 Females in Potter Valley?
There are 79.60 Males per 100 Females in Potter Valley.
What is the Ratio of Females per 100 Males in Potter Valley?
There are 125.63 Females per 100 Males in Potter Valley.
What is the Median Population Age in Potter Valley?
Median Population Age in Potter Valley is 37.8 Years.
What is the Average Family Size in Potter Valley
Average Family Size in Potter Valley is 3.2 People.
What is the Average Household Size in Potter Valley
Average Household Size in Potter Valley is 2.3 People.
How Large is the Labor Force in Potter Valley?
There are 254 People in the Labor Forcein in Potter Valley.
What is the Percentage of People in the Labor Force in Potter Valley?
58.0% of People are in the Labor Force in Potter Valley.
What is the Unemployment Rate in Potter Valley?
Unemployment Rate in Potter Valley is 7.9%.