Phelan, CA Map & Demographics
Phelan Map
Phelan Overview
$24,700
PER CAPITA INCOME
$74,313
AVG FAMILY INCOME
$74,853
AVG HOUSEHOLD INCOME
28.0%
WAGE / INCOME GAP [ % ]
72.0¢/ $1
WAGE / INCOME GAP [ $ ]
$12,313
FAMILY INCOME DEFICIT
0.40
INEQUALITY / GINI INDEX
18,272
TOTAL POPULATION
8,989
MALE POPULATION
9,283
FEMALE POPULATION
96.83
MALES / 100 FEMALES
103.27
FEMALES / 100 MALES
30.9
MEDIAN AGE
3.9
AVG FAMILY SIZE
3.7
AVG HOUSEHOLD SIZE
7,672
LABOR FORCE [ PEOPLE ]
57.5%
PERCENT IN LABOR FORCE
12.1%
UNEMPLOYMENT RATE
Phelan Zip Codes
Phelan Area Codes
Income in Phelan
Income Overview in Phelan
Per Capita Income in Phelan is $24,700, while median incomes of families and households are $74,313 and $74,853 respectively.
| Characteristic | Number | Measure |
| Per Capita Income | 18,272 | $24,700 |
| Median Family Income | 4,085 | $74,313 |
| Mean Family Income | 4,085 | $89,172 |
| Median Household Income | 4,927 | $74,853 |
| Mean Household Income | 4,927 | $89,264 |
| Income Deficit | 4,085 | $12,313 |
| Wage / Income Gap (%) | 18,272 | 27.96% |
| Wage / Income Gap ($) | 18,272 | 72.04¢ per $1 |
| Gini / Inequality Index | 18,272 | 0.40 |
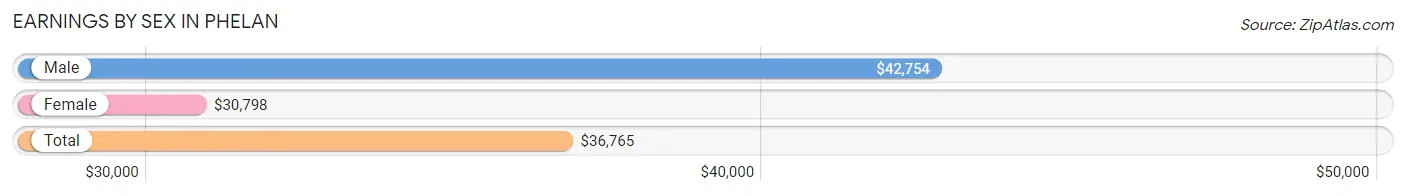
Earnings by Sex in Phelan
Average Earnings in Phelan are $36,765, $42,754 for men and $30,798 for women, a difference of 28.0%.
| Sex | Number | Average Earnings |
| Male | 4,633 (58.8%) | $42,754 |
| Female | 3,248 (41.2%) | $30,798 |
| Total | 7,881 (100.0%) | $36,765 |
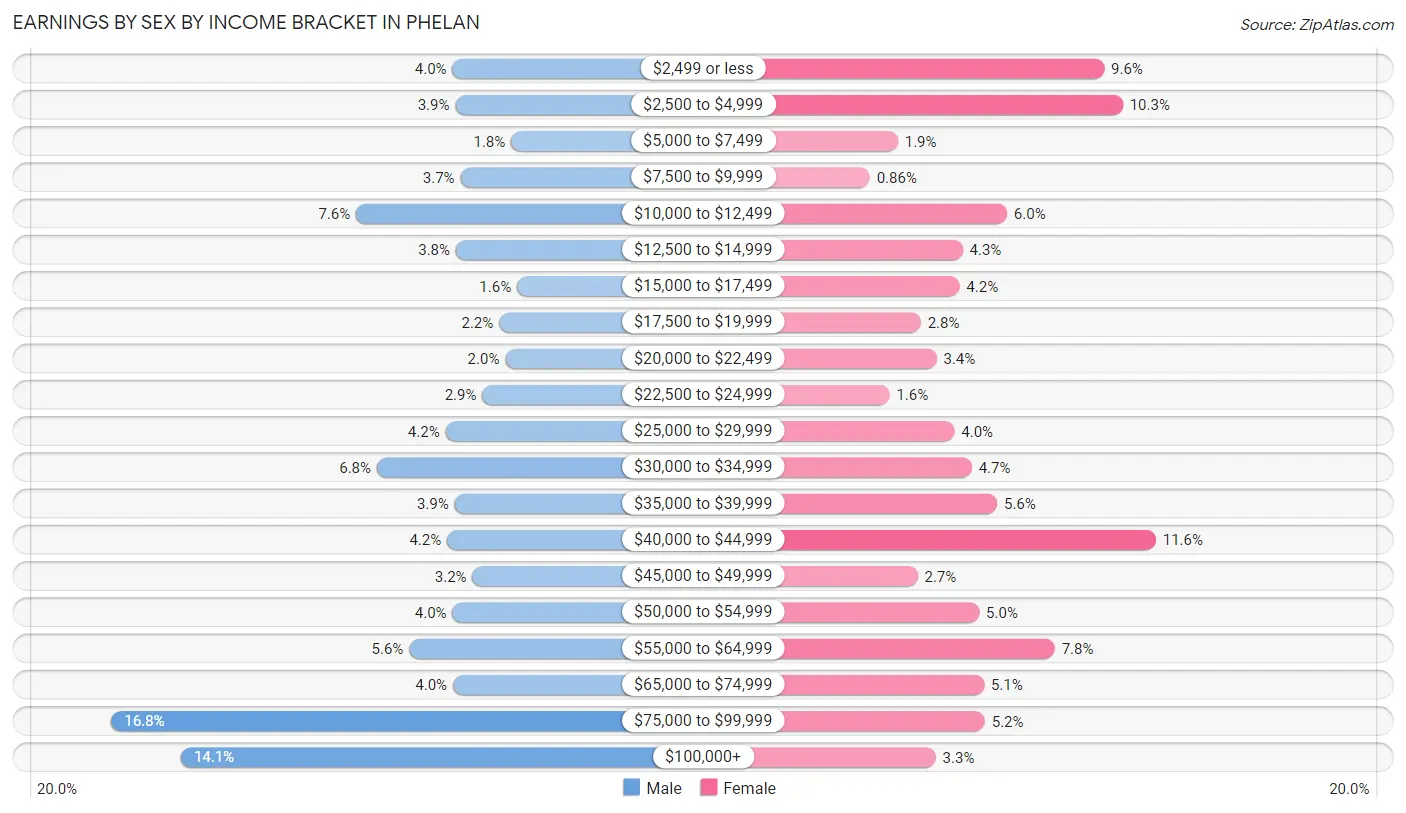
Earnings by Sex by Income Bracket in Phelan
The most common earnings brackets in Phelan are $75,000 to $99,999 for men (776 | 16.8%) and $40,000 to $44,999 for women (376 | 11.6%).
| Income | Male | Female |
| $2,499 or less | 184 (4.0%) | 313 (9.6%) |
| $2,500 to $4,999 | 179 (3.9%) | 336 (10.3%) |
| $5,000 to $7,499 | 82 (1.8%) | 62 (1.9%) |
| $7,500 to $9,999 | 170 (3.7%) | 28 (0.9%) |
| $10,000 to $12,499 | 351 (7.6%) | 195 (6.0%) |
| $12,500 to $14,999 | 178 (3.8%) | 141 (4.3%) |
| $15,000 to $17,499 | 72 (1.5%) | 137 (4.2%) |
| $17,500 to $19,999 | 103 (2.2%) | 90 (2.8%) |
| $20,000 to $22,499 | 92 (2.0%) | 109 (3.4%) |
| $22,500 to $24,999 | 132 (2.9%) | 52 (1.6%) |
| $25,000 to $29,999 | 196 (4.2%) | 131 (4.0%) |
| $30,000 to $34,999 | 315 (6.8%) | 152 (4.7%) |
| $35,000 to $39,999 | 180 (3.9%) | 183 (5.6%) |
| $40,000 to $44,999 | 193 (4.2%) | 376 (11.6%) |
| $45,000 to $49,999 | 149 (3.2%) | 86 (2.6%) |
| $50,000 to $54,999 | 184 (4.0%) | 161 (5.0%) |
| $55,000 to $64,999 | 259 (5.6%) | 253 (7.8%) |
| $65,000 to $74,999 | 183 (4.0%) | 167 (5.1%) |
| $75,000 to $99,999 | 776 (16.8%) | 168 (5.2%) |
| $100,000+ | 655 (14.1%) | 108 (3.3%) |
| Total | 4,633 (100.0%) | 3,248 (100.0%) |
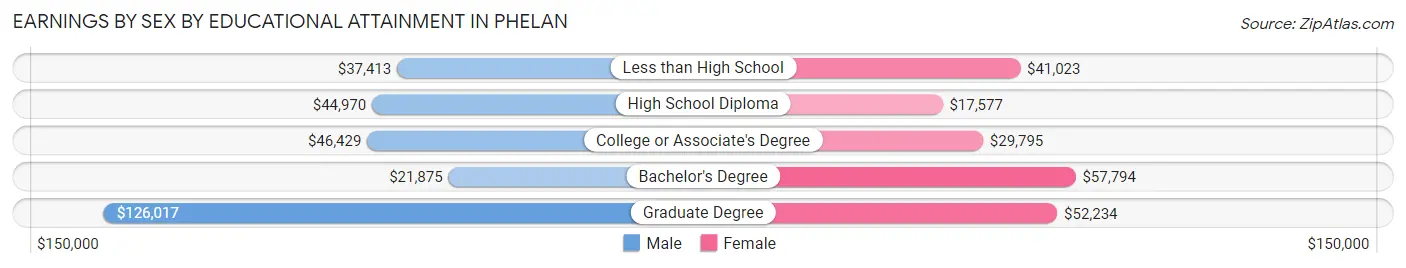
Earnings by Sex by Educational Attainment in Phelan
Average earnings in Phelan are $47,160 for men and $38,675 for women, a difference of 18.0%. Men with an educational attainment of graduate degree enjoy the highest average annual earnings of $126,017, while those with bachelor's degree education earn the least with $21,875. Women with an educational attainment of bachelor's degree earn the most with the average annual earnings of $57,794, while those with high school diploma education have the smallest earnings of $17,577.
| Educational Attainment | Male Income | Female Income |
| Less than High School | $37,413 | $41,023 |
| High School Diploma | $44,970 | $17,577 |
| College or Associate's Degree | $46,429 | $29,795 |
| Bachelor's Degree | $21,875 | $57,794 |
| Graduate Degree | $126,017 | $52,234 |
| Total | $47,160 | $38,675 |
Family Income in Phelan
Family Income Brackets in Phelan
According to the Phelan family income data, there are 899 families falling into the $100,000 to $149,999 income range, which is the most common income bracket and makes up 22.0% of all families. Conversely, the less than $10,000 income bracket is the least frequent group with only 106 families (2.6%) belonging to this category.
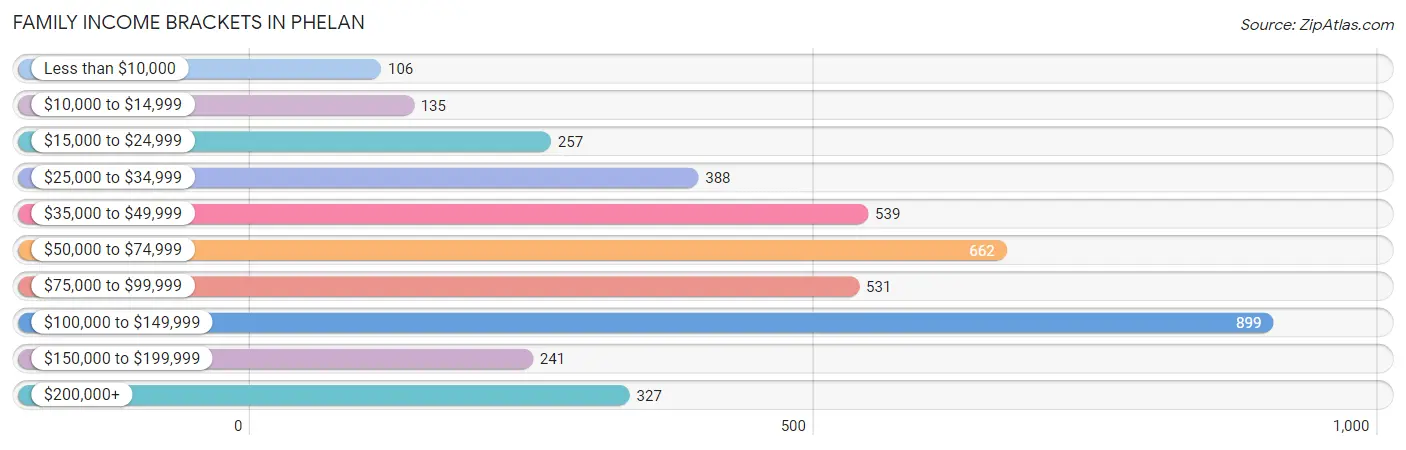
| Income Bracket | # Families | % Families |
| Less than $10,000 | 106 | 2.6% |
| $10,000 to $14,999 | 135 | 3.3% |
| $15,000 to $24,999 | 257 | 6.3% |
| $25,000 to $34,999 | 388 | 9.5% |
| $35,000 to $49,999 | 539 | 13.2% |
| $50,000 to $74,999 | 662 | 16.2% |
| $75,000 to $99,999 | 531 | 13.0% |
| $100,000 to $149,999 | 899 | 22.0% |
| $150,000 to $199,999 | 241 | 5.9% |
| $200,000+ | 327 | 8.0% |
Family Income by Famaliy Size in Phelan
2-person families (1,401 | 34.3%) account for the highest median family income in Phelan with $87,015 per family, while 2-person families (1,401 | 34.3%) have the highest median income of $43,508 per family member.
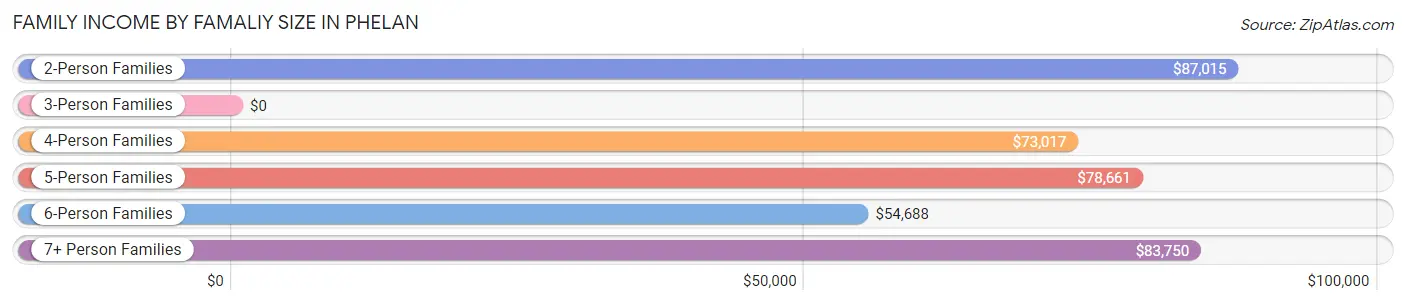
| Income Bracket | # Families | Median Income |
| 2-Person Families | 1,401 (34.3%) | $87,015 |
| 3-Person Families | 485 (11.9%) | $0 |
| 4-Person Families | 1,035 (25.3%) | $73,017 |
| 5-Person Families | 620 (15.2%) | $78,661 |
| 6-Person Families | 324 (7.9%) | $54,688 |
| 7+ Person Families | 220 (5.4%) | $83,750 |
| Total | 4,085 (100.0%) | $74,313 |
Family Income by Number of Earners in Phelan
The median family income in Phelan is $74,313, with families comprising 3+ earners (524) having the highest median family income of $110,357, while families with no earners (520) have the lowest median family income of $26,952, accounting for 12.8% and 12.7% of families, respectively.
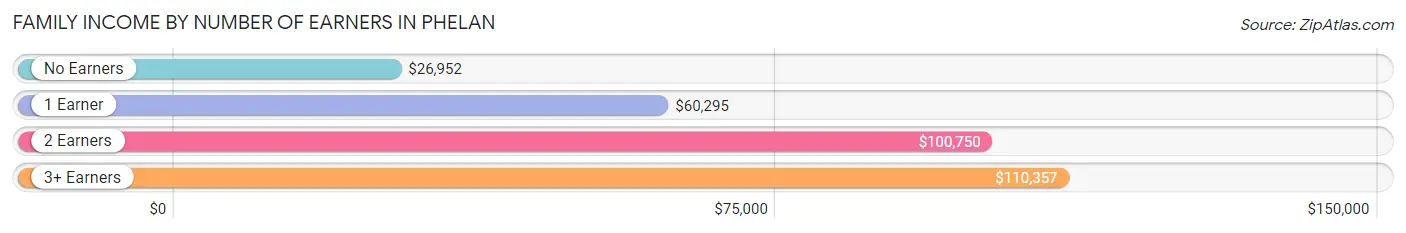
| Number of Earners | # Families | Median Income |
| No Earners | 520 (12.7%) | $26,952 |
| 1 Earner | 1,683 (41.2%) | $60,295 |
| 2 Earners | 1,358 (33.2%) | $100,750 |
| 3+ Earners | 524 (12.8%) | $110,357 |
| Total | 4,085 (100.0%) | $74,313 |
Household Income in Phelan
Household Income Brackets in Phelan
With 990 households falling in the category, the $100,000 to $149,999 income range is the most frequent in Phelan, accounting for 20.1% of all households. In contrast, only 99 households (2.0%) fall into the $10,000 to $14,999 income bracket, making it the least populous group.
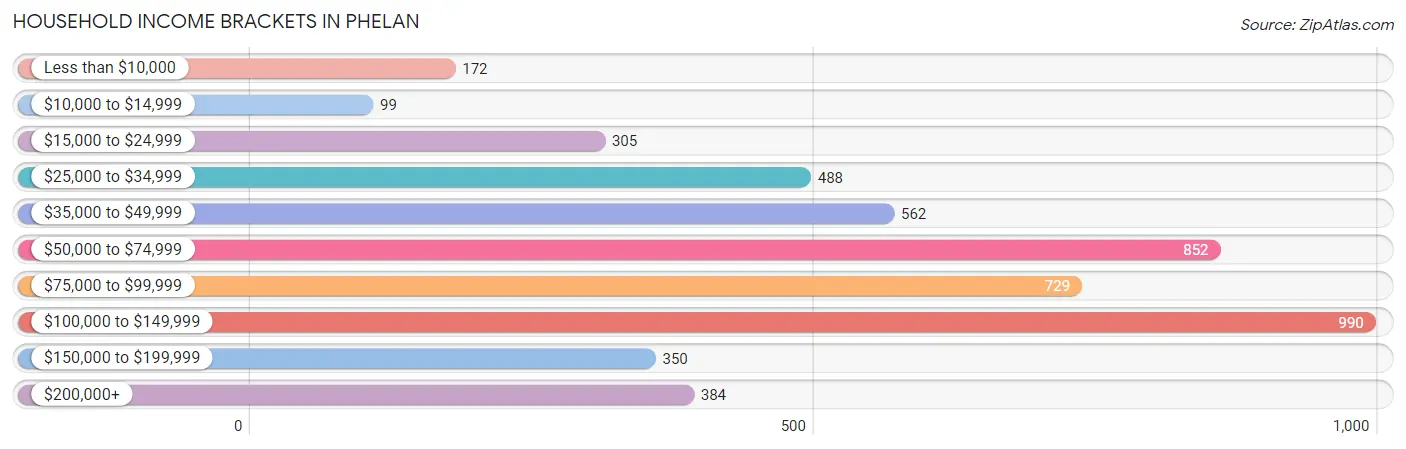
| Income Bracket | # Households | % Households |
| Less than $10,000 | 172 | 3.5% |
| $10,000 to $14,999 | 99 | 2.0% |
| $15,000 to $24,999 | 305 | 6.2% |
| $25,000 to $34,999 | 488 | 9.9% |
| $35,000 to $49,999 | 562 | 11.4% |
| $50,000 to $74,999 | 852 | 17.3% |
| $75,000 to $99,999 | 729 | 14.8% |
| $100,000 to $149,999 | 990 | 20.1% |
| $150,000 to $199,999 | 350 | 7.1% |
| $200,000+ | 384 | 7.8% |
Household Income by Householder Age in Phelan
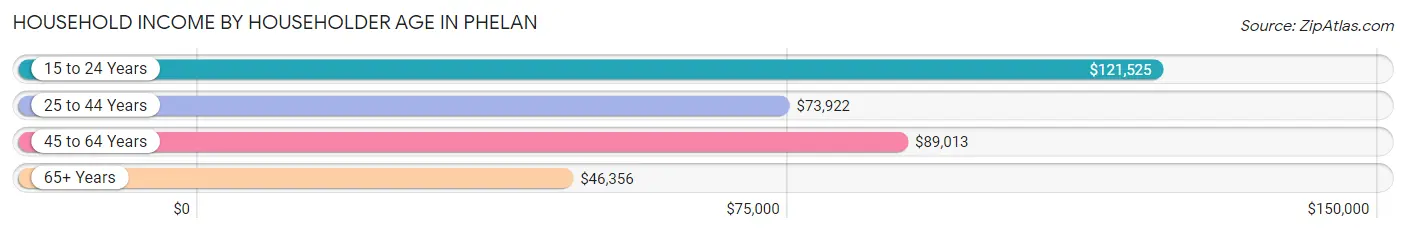
The median household income in Phelan is $74,853, with the highest median household income of $121,525 found in the 15 to 24 years age bracket for the primary householder. A total of 187 households (3.8%) fall into this category. Meanwhile, the 65+ years age bracket for the primary householder has the lowest median household income of $46,356, with 875 households (17.8%) in this group.
| Income Bracket | # Households | Median Income |
| 15 to 24 Years | 187 (3.8%) | $121,525 |
| 25 to 44 Years | 1,641 (33.3%) | $73,922 |
| 45 to 64 Years | 2,224 (45.1%) | $89,013 |
| 65+ Years | 875 (17.8%) | $46,356 |
| Total | 4,927 (100.0%) | $74,853 |
Poverty in Phelan
Income Below Poverty by Sex and Age in Phelan
With 17.4% poverty level for males and 15.9% for females among the residents of Phelan, 12 to 14 year old males and 55 to 64 year old females are the most vulnerable to poverty, with 120 males (54.0%) and 338 females (31.4%) in their respective age groups living below the poverty level.
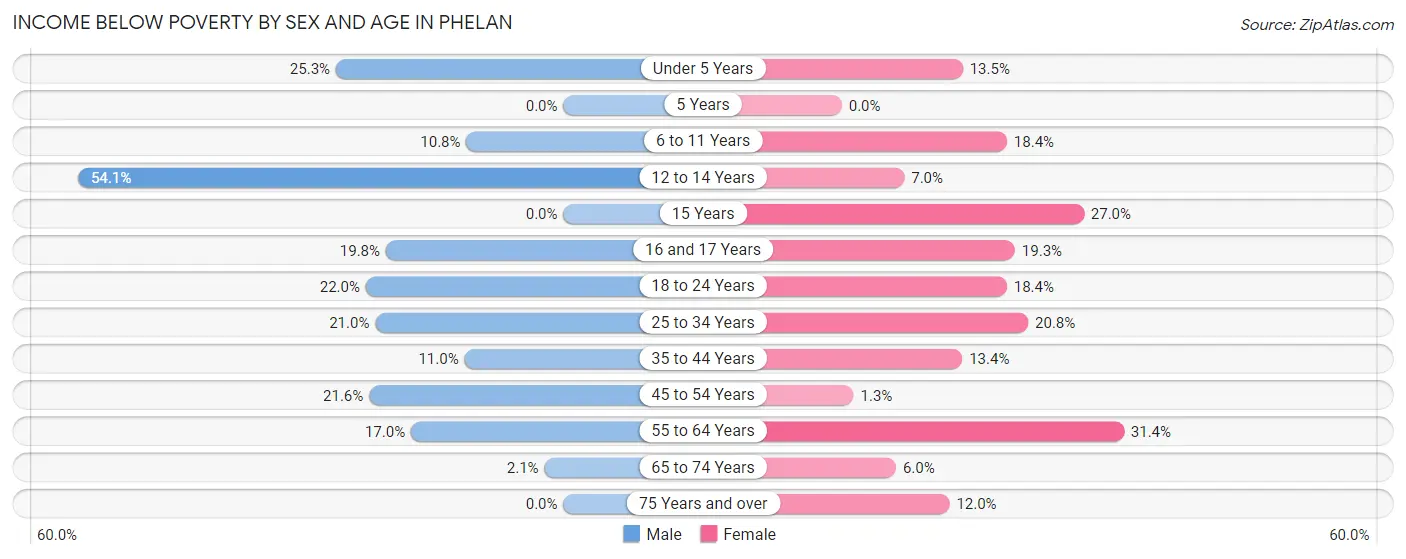
| Age Bracket | Male | Female |
| Under 5 Years | 209 (25.3%) | 106 (13.5%) |
| 5 Years | 0 (0.0%) | 0 (0.0%) |
| 6 to 11 Years | 113 (10.8%) | 235 (18.4%) |
| 12 to 14 Years | 120 (54.0%) | 16 (7.0%) |
| 15 Years | 0 (0.0%) | 62 (27.0%) |
| 16 and 17 Years | 70 (19.8%) | 48 (19.3%) |
| 18 to 24 Years | 176 (22.0%) | 154 (18.4%) |
| 25 to 34 Years | 312 (20.9%) | 277 (20.7%) |
| 35 to 44 Years | 113 (11.0%) | 146 (13.4%) |
| 45 to 54 Years | 247 (21.6%) | 15 (1.3%) |
| 55 to 64 Years | 198 (17.0%) | 338 (31.4%) |
| 65 to 74 Years | 11 (2.1%) | 31 (6.0%) |
| 75 Years and over | 0 (0.0%) | 44 (12.0%) |
| Total | 1,569 (17.4%) | 1,472 (15.9%) |
Income Above Poverty by Sex and Age in Phelan
According to the poverty statistics in Phelan, males aged 5 years and females aged 5 years are the age groups that are most secure financially, with 100.0% of males and 100.0% of females in these age groups living above the poverty line.
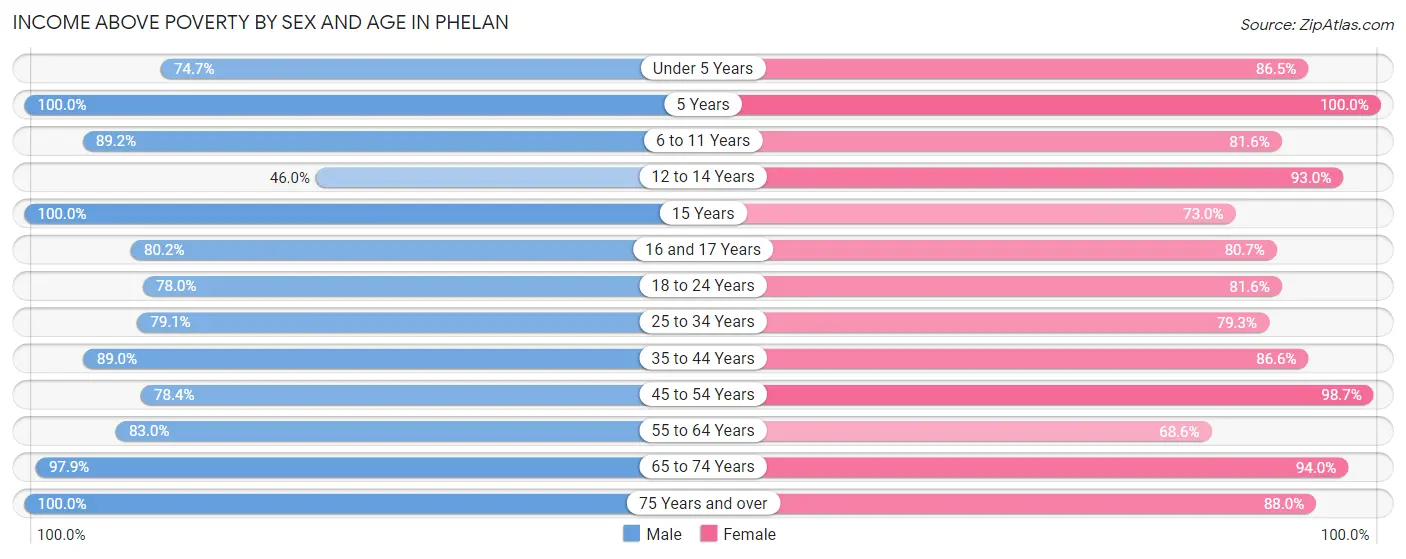
| Age Bracket | Male | Female |
| Under 5 Years | 616 (74.7%) | 681 (86.5%) |
| 5 Years | 69 (100.0%) | 121 (100.0%) |
| 6 to 11 Years | 933 (89.2%) | 1,043 (81.6%) |
| 12 to 14 Years | 102 (46.0%) | 214 (93.0%) |
| 15 Years | 101 (100.0%) | 168 (73.0%) |
| 16 and 17 Years | 284 (80.2%) | 201 (80.7%) |
| 18 to 24 Years | 624 (78.0%) | 684 (81.6%) |
| 25 to 34 Years | 1,177 (79.0%) | 1,058 (79.2%) |
| 35 to 44 Years | 913 (89.0%) | 943 (86.6%) |
| 45 to 54 Years | 895 (78.4%) | 1,134 (98.7%) |
| 55 to 64 Years | 969 (83.0%) | 738 (68.6%) |
| 65 to 74 Years | 510 (97.9%) | 483 (94.0%) |
| 75 Years and over | 227 (100.0%) | 323 (88.0%) |
| Total | 7,420 (82.6%) | 7,791 (84.1%) |
Income Below Poverty Among Married-Couple Families in Phelan
The poverty statistics for married-couple families in Phelan show that 11.5% or 321 of the total 2,792 families live below the poverty line. Families with 3 or 4 children have the highest poverty rate of 30.3%, comprising of 47 families. On the other hand, families with no children have the lowest poverty rate of 2.2%, which includes 33 families.
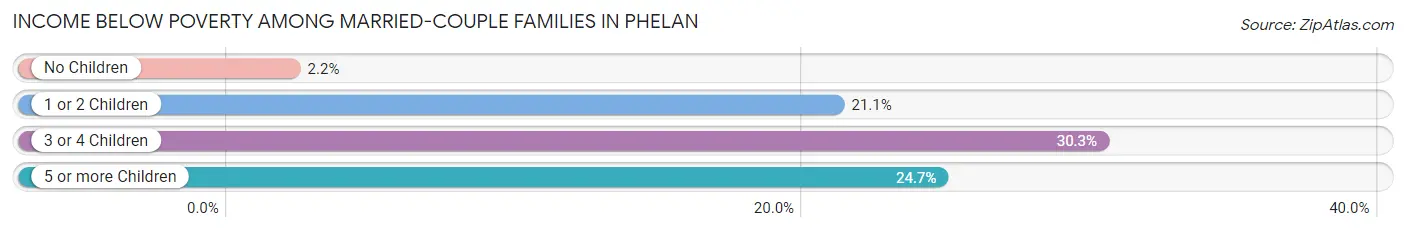
| Children | Above Poverty | Below Poverty |
| No Children | 1,478 (97.8%) | 33 (2.2%) |
| 1 or 2 Children | 818 (78.9%) | 219 (21.1%) |
| 3 or 4 Children | 108 (69.7%) | 47 (30.3%) |
| 5 or more Children | 67 (75.3%) | 22 (24.7%) |
| Total | 2,471 (88.5%) | 321 (11.5%) |
Income Below Poverty Among Single-Parent Households in Phelan
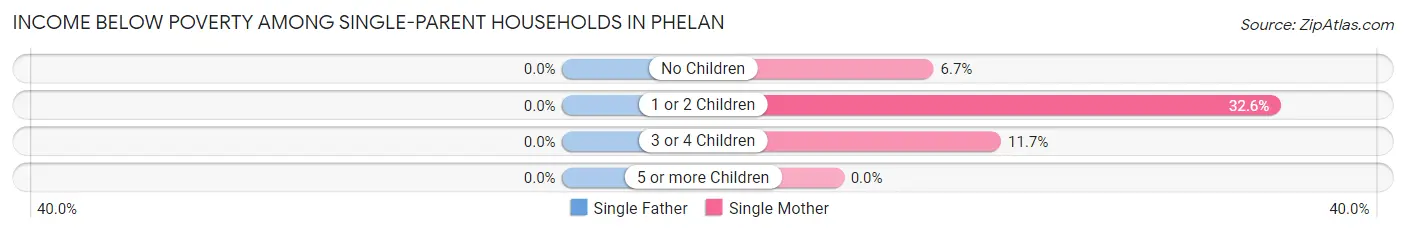
| Children | Single Father | Single Mother |
| No Children | 0 (0.0%) | 12 (6.7%) |
| 1 or 2 Children | 0 (0.0%) | 117 (32.6%) |
| 3 or 4 Children | 0 (0.0%) | 44 (11.7%) |
| 5 or more Children | 0 (0.0%) | 0 (0.0%) |
| Total | 0 (0.0%) | 173 (19.0%) |
Income Below Poverty Among Married-Couple vs Single-Parent Households in Phelan
The poverty data for Phelan shows that 321 of the married-couple family households (11.5%) and 173 of the single-parent households (13.4%) are living below the poverty level. Within the married-couple family households, those with 3 or 4 children have the highest poverty rate, with 47 households (30.3%) falling below the poverty line. Among the single-parent households, those with 1 or 2 children have the highest poverty rate, with 117 household (22.9%) living below poverty.
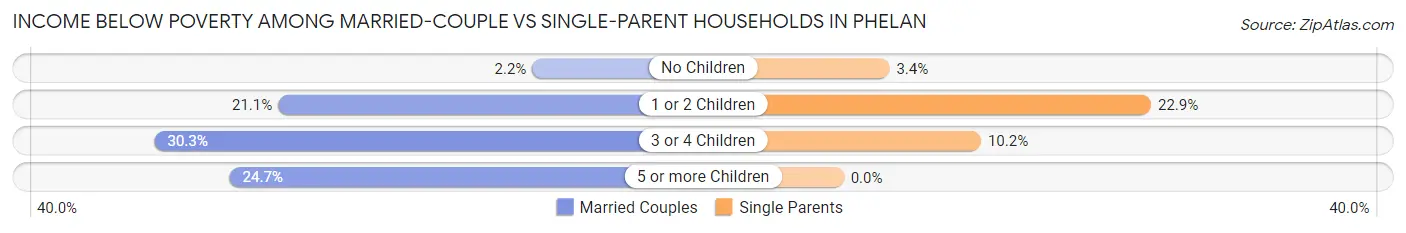
| Children | Married-Couple Families | Single-Parent Households |
| No Children | 33 (2.2%) | 12 (3.4%) |
| 1 or 2 Children | 219 (21.1%) | 117 (22.9%) |
| 3 or 4 Children | 47 (30.3%) | 44 (10.2%) |
| 5 or more Children | 22 (24.7%) | 0 (0.0%) |
| Total | 321 (11.5%) | 173 (13.4%) |
Race in Phelan
The most populous races in Phelan are White / Caucasian (12,806 | 70.1%), Hispanic or Latino (8,114 | 44.4%), and Two or more Races (3,619 | 19.8%).
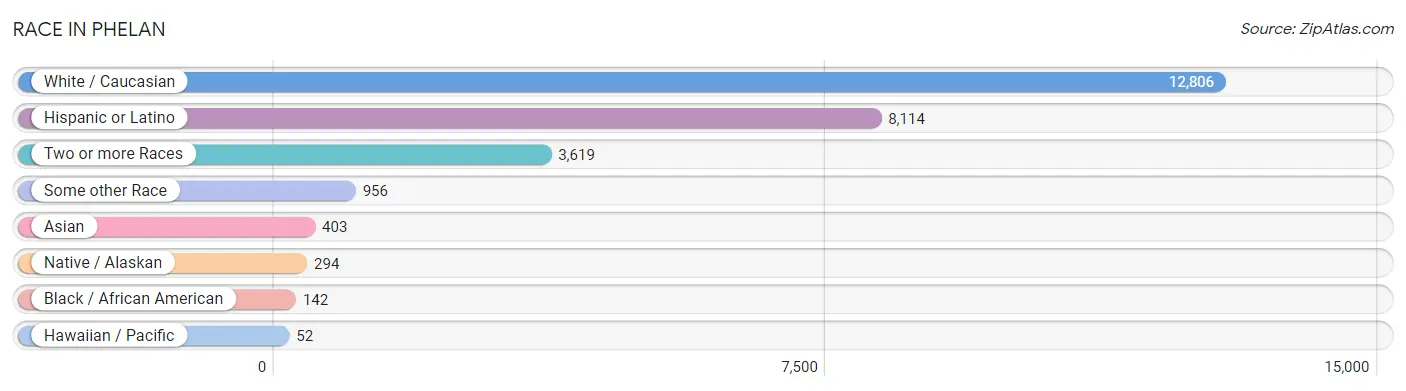
| Race | # Population | % Population |
| Asian | 403 | 2.2% |
| Black / African American | 142 | 0.8% |
| Hawaiian / Pacific | 52 | 0.3% |
| Hispanic or Latino | 8,114 | 44.4% |
| Native / Alaskan | 294 | 1.6% |
| White / Caucasian | 12,806 | 70.1% |
| Two or more Races | 3,619 | 19.8% |
| Some other Race | 956 | 5.2% |
| Total | 18,272 | 100.0% |
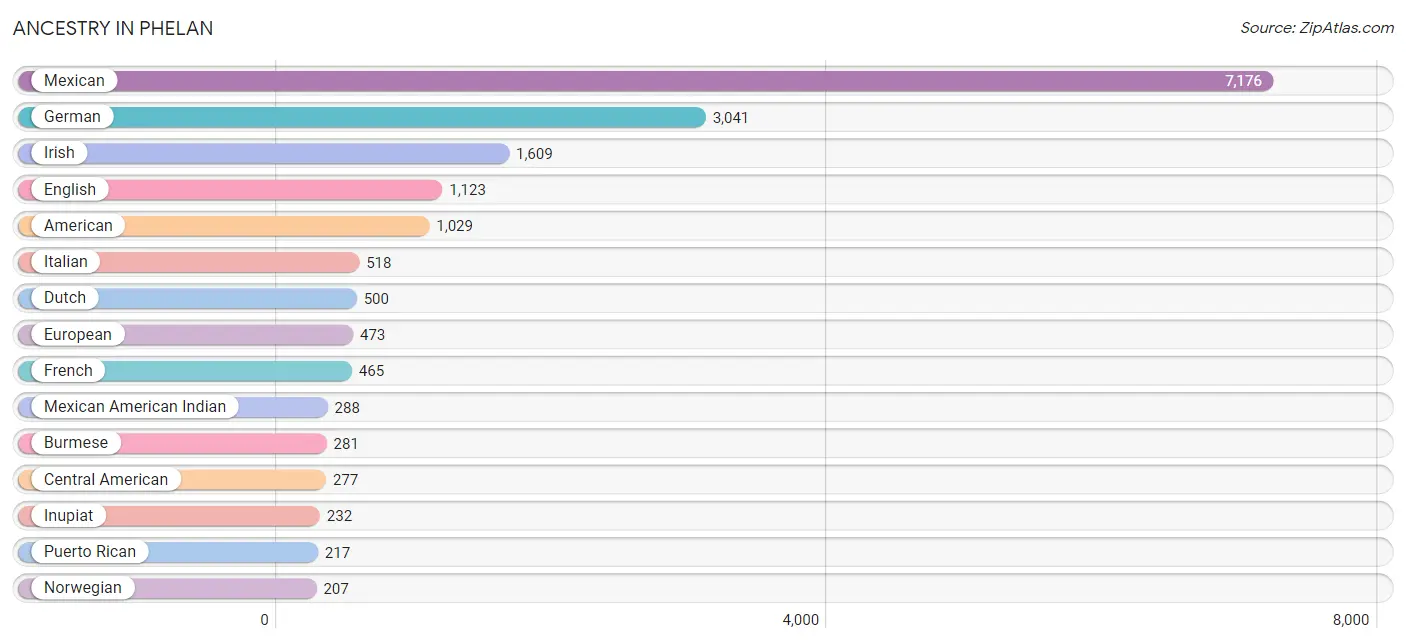
Ancestry in Phelan
The most populous ancestries reported in Phelan are Mexican (7,176 | 39.3%), German (3,041 | 16.6%), Irish (1,609 | 8.8%), English (1,123 | 6.1%), and American (1,029 | 5.6%), together accounting for 76.5% of all Phelan residents.
| Ancestry | # Population | % Population |
| American | 1,029 | 5.6% |
| Arab | 146 | 0.8% |
| Argentinean | 17 | 0.1% |
| Armenian | 28 | 0.2% |
| Blackfeet | 6 | 0.0% |
| British | 77 | 0.4% |
| Burmese | 281 | 1.5% |
| Central American | 277 | 1.5% |
| Cherokee | 48 | 0.3% |
| Chickasaw | 7 | 0.0% |
| Croatian | 14 | 0.1% |
| Cuban | 27 | 0.2% |
| Czech | 74 | 0.4% |
| Danish | 31 | 0.2% |
| Dutch | 500 | 2.7% |
| English | 1,123 | 6.1% |
| European | 473 | 2.6% |
| Finnish | 15 | 0.1% |
| French | 465 | 2.5% |
| French Canadian | 15 | 0.1% |
| German | 3,041 | 16.6% |
| Guamanian / Chamorro | 73 | 0.4% |
| Indian (Asian) | 71 | 0.4% |
| Inupiat | 232 | 1.3% |
| Irish | 1,609 | 8.8% |
| Italian | 518 | 2.8% |
| Korean | 36 | 0.2% |
| Mexican | 7,176 | 39.3% |
| Mexican American Indian | 288 | 1.6% |
| Native Hawaiian | 8 | 0.0% |
| Nicaraguan | 94 | 0.5% |
| Norwegian | 207 | 1.1% |
| Peruvian | 89 | 0.5% |
| Pima | 11 | 0.1% |
| Polish | 99 | 0.5% |
| Portuguese | 21 | 0.1% |
| Puerto Rican | 217 | 1.2% |
| Romanian | 39 | 0.2% |
| Salvadoran | 183 | 1.0% |
| Scotch-Irish | 42 | 0.2% |
| Scottish | 191 | 1.1% |
| Slovak | 12 | 0.1% |
| South American | 106 | 0.6% |
| South American Indian | 185 | 1.0% |
| Spaniard | 58 | 0.3% |
| Spanish | 39 | 0.2% |
| Spanish American Indian | 195 | 1.1% |
| Sri Lankan | 23 | 0.1% |
| Swedish | 45 | 0.3% |
| Ukrainian | 32 | 0.2% |
| Welsh | 12 | 0.1% |
| Yaqui | 22 | 0.1% | View All 52 Rows |
Immigrants in Phelan
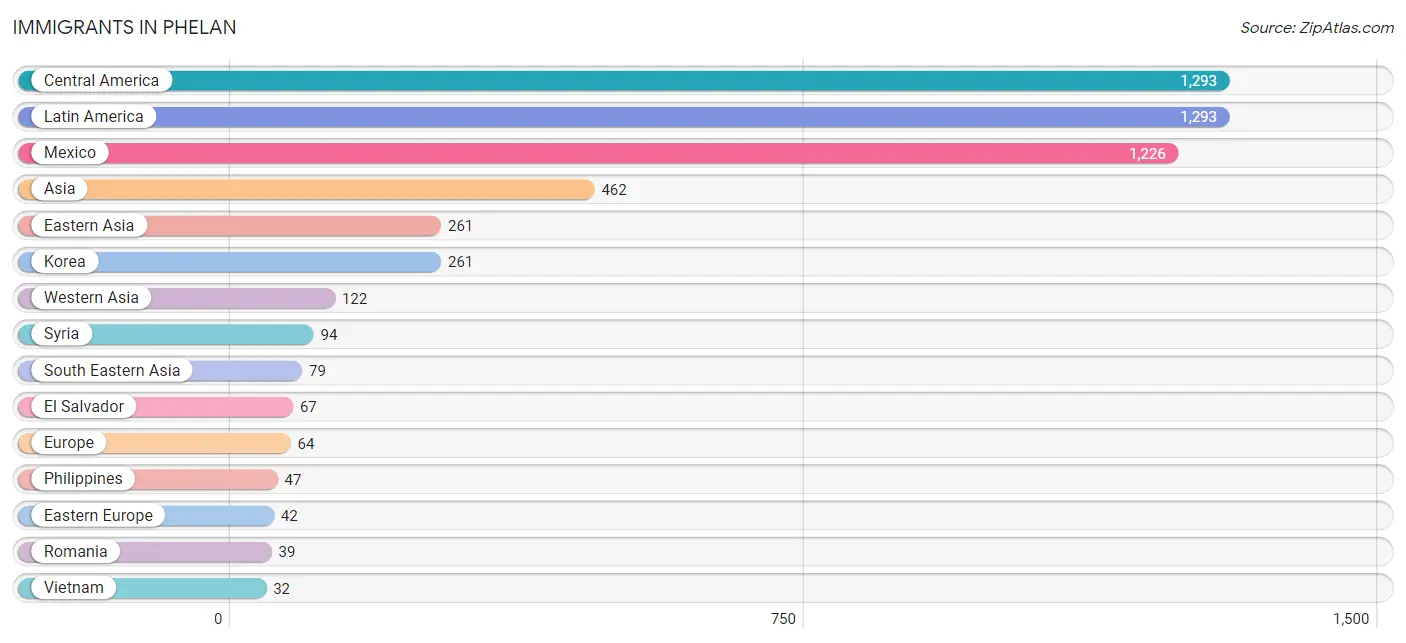
The most numerous immigrant groups reported in Phelan came from Central America (1,293 | 7.1%), Latin America (1,293 | 7.1%), Mexico (1,226 | 6.7%), Asia (462 | 2.5%), and Eastern Asia (261 | 1.4%), together accounting for 24.8% of all Phelan residents.
| Immigration Origin | # Population | % Population |
| Armenia | 28 | 0.2% |
| Asia | 462 | 2.5% |
| Canada | 13 | 0.1% |
| Central America | 1,293 | 7.1% |
| Eastern Asia | 261 | 1.4% |
| Eastern Europe | 42 | 0.2% |
| El Salvador | 67 | 0.4% |
| Europe | 64 | 0.4% |
| Germany | 22 | 0.1% |
| Korea | 261 | 1.4% |
| Latin America | 1,293 | 7.1% |
| Lithuania | 3 | 0.0% |
| Mexico | 1,226 | 6.7% |
| Philippines | 47 | 0.3% |
| Romania | 39 | 0.2% |
| South Eastern Asia | 79 | 0.4% |
| Syria | 94 | 0.5% |
| Vietnam | 32 | 0.2% |
| Western Asia | 122 | 0.7% |
| Western Europe | 22 | 0.1% | View All 20 Rows |
Sex and Age in Phelan
Sex and Age in Phelan
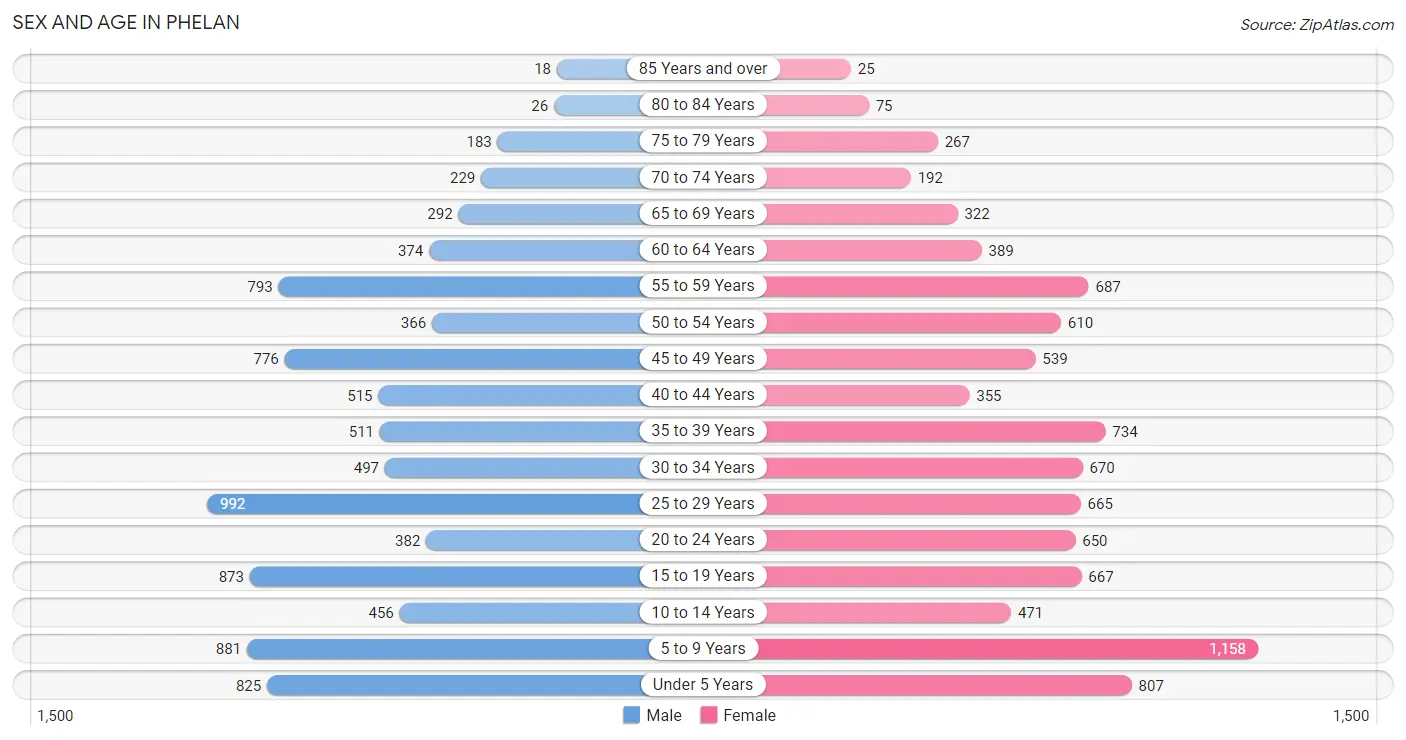
The most populous age groups in Phelan are 25 to 29 Years (992 | 11.0%) for men and 5 to 9 Years (1,158 | 12.5%) for women.
| Age Bracket | Male | Female |
| Under 5 Years | 825 (9.2%) | 807 (8.7%) |
| 5 to 9 Years | 881 (9.8%) | 1,158 (12.5%) |
| 10 to 14 Years | 456 (5.1%) | 471 (5.1%) |
| 15 to 19 Years | 873 (9.7%) | 667 (7.2%) |
| 20 to 24 Years | 382 (4.3%) | 650 (7.0%) |
| 25 to 29 Years | 992 (11.0%) | 665 (7.2%) |
| 30 to 34 Years | 497 (5.5%) | 670 (7.2%) |
| 35 to 39 Years | 511 (5.7%) | 734 (7.9%) |
| 40 to 44 Years | 515 (5.7%) | 355 (3.8%) |
| 45 to 49 Years | 776 (8.6%) | 539 (5.8%) |
| 50 to 54 Years | 366 (4.1%) | 610 (6.6%) |
| 55 to 59 Years | 793 (8.8%) | 687 (7.4%) |
| 60 to 64 Years | 374 (4.2%) | 389 (4.2%) |
| 65 to 69 Years | 292 (3.3%) | 322 (3.5%) |
| 70 to 74 Years | 229 (2.5%) | 192 (2.1%) |
| 75 to 79 Years | 183 (2.0%) | 267 (2.9%) |
| 80 to 84 Years | 26 (0.3%) | 75 (0.8%) |
| 85 Years and over | 18 (0.2%) | 25 (0.3%) |
| Total | 8,989 (100.0%) | 9,283 (100.0%) |
Families and Households in Phelan
Median Family Size in Phelan
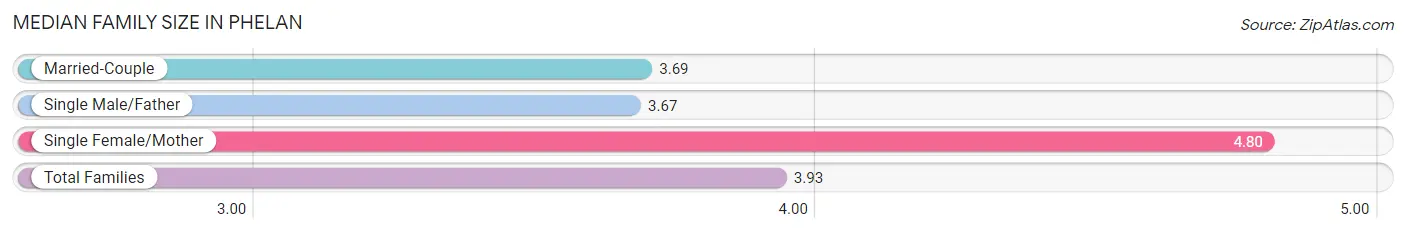
The median family size in Phelan is 3.93 persons per family, with single female/mother families (913 | 22.4%) accounting for the largest median family size of 4.8 persons per family. On the other hand, single male/father families (380 | 9.3%) represent the smallest median family size with 3.67 persons per family.
| Family Type | # Families | Family Size |
| Married-Couple | 2,792 (68.3%) | 3.69 |
| Single Male/Father | 380 (9.3%) | 3.67 |
| Single Female/Mother | 913 (22.4%) | 4.80 |
| Total Families | 4,085 (100.0%) | 3.93 |
Median Household Size in Phelan
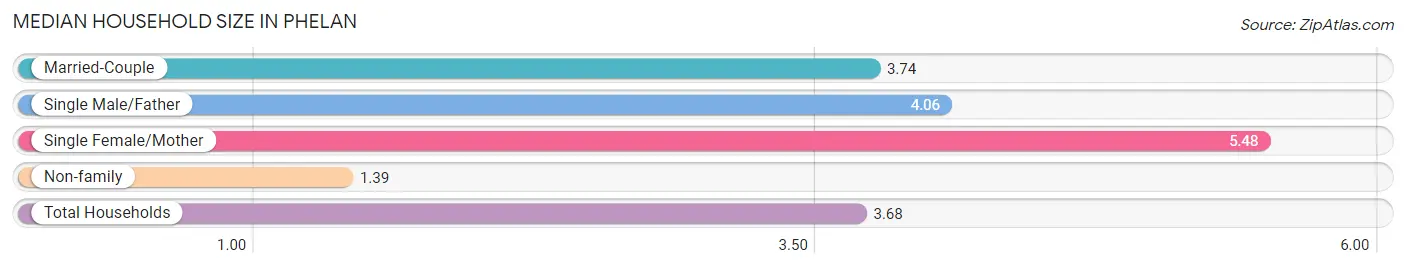
The median household size in Phelan is 3.68 persons per household, with single female/mother households (913 | 18.5%) accounting for the largest median household size of 5.48 persons per household. non-family households (842 | 17.1%) represent the smallest median household size with 1.39 persons per household.
| Household Type | # Households | Household Size |
| Married-Couple | 2,792 (56.7%) | 3.74 |
| Single Male/Father | 380 (7.7%) | 4.06 |
| Single Female/Mother | 913 (18.5%) | 5.48 |
| Non-family | 842 (17.1%) | 1.39 |
| Total Households | 4,927 (100.0%) | 3.68 |
Household Size by Marriage Status in Phelan
Out of a total of 4,927 households in Phelan, 4,085 (82.9%) are family households, while 842 (17.1%) are nonfamily households. The most numerous type of family households are 2-person households, comprising 1,299, and the most common type of nonfamily households are 1-person households, comprising 579.
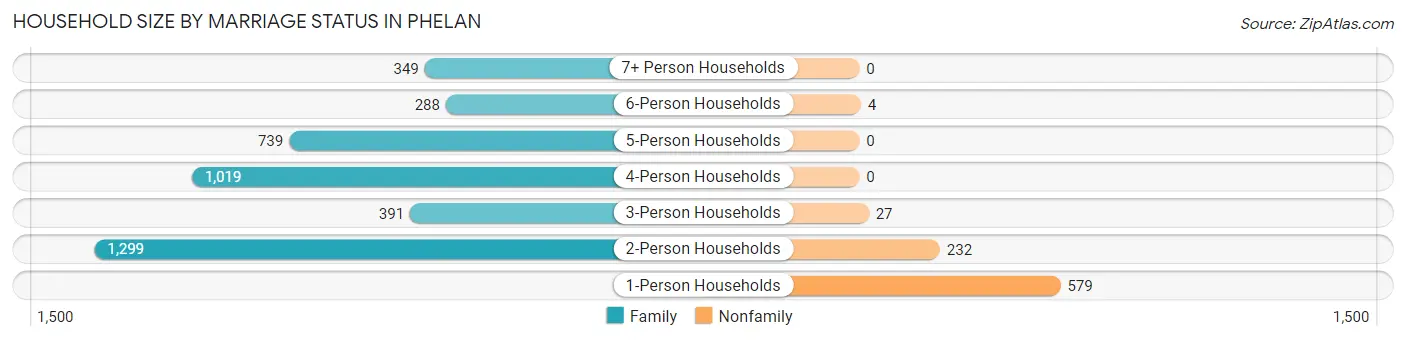
| Household Size | Family Households | Nonfamily Households |
| 1-Person Households | - | 579 (11.7%) |
| 2-Person Households | 1,299 (26.4%) | 232 (4.7%) |
| 3-Person Households | 391 (7.9%) | 27 (0.5%) |
| 4-Person Households | 1,019 (20.7%) | 0 (0.0%) |
| 5-Person Households | 739 (15.0%) | 0 (0.0%) |
| 6-Person Households | 288 (5.9%) | 4 (0.1%) |
| 7+ Person Households | 349 (7.1%) | 0 (0.0%) |
| Total | 4,085 (82.9%) | 842 (17.1%) |
Female Fertility in Phelan
Fertility by Age in Phelan
Average fertility rate in Phelan is 90.0 births per 1,000 women. Women in the age bracket of 20 to 34 years have the highest fertility rate with 174.0 births per 1,000 women. Women in the age bracket of 20 to 34 years acount for 85.8% of all women with births.
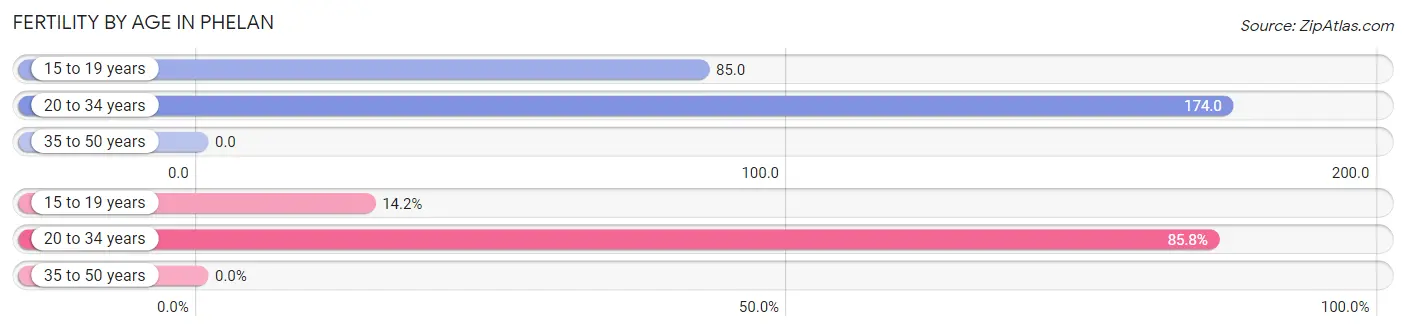
| Age Bracket | Women with Births | Births / 1,000 Women |
| 15 to 19 years | 57 (14.2%) | 85.0 |
| 20 to 34 years | 345 (85.8%) | 174.0 |
| 35 to 50 years | 0 (0.0%) | 0.0 |
| Total | 402 (100.0%) | 90.0 |
Fertility by Age by Marriage Status in Phelan
72.6% of women with births (402) in Phelan are married. The highest percentage of unmarried women with births falls into 20 to 34 years age bracket with 31.9% of them unmarried at the time of birth, while the lowest percentage of unmarried women with births belong to 15 to 19 years age bracket with 0.0% of them unmarried.
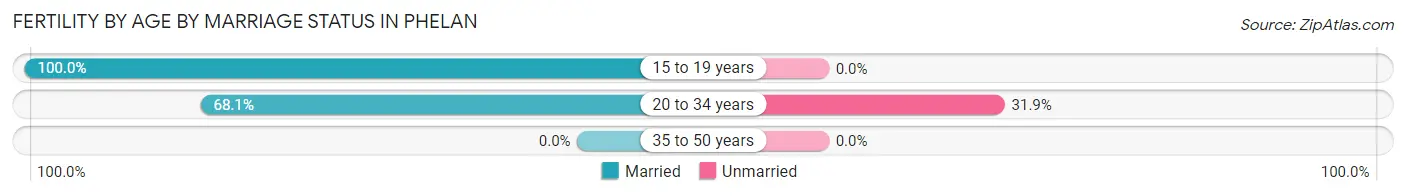
| Age Bracket | Married | Unmarried |
| 15 to 19 years | 57 (100.0%) | 0 (0.0%) |
| 20 to 34 years | 235 (68.1%) | 110 (31.9%) |
| 35 to 50 years | 0 (0.0%) | 0 (0.0%) |
| Total | 292 (72.6%) | 110 (27.4%) |
Fertility by Education in Phelan
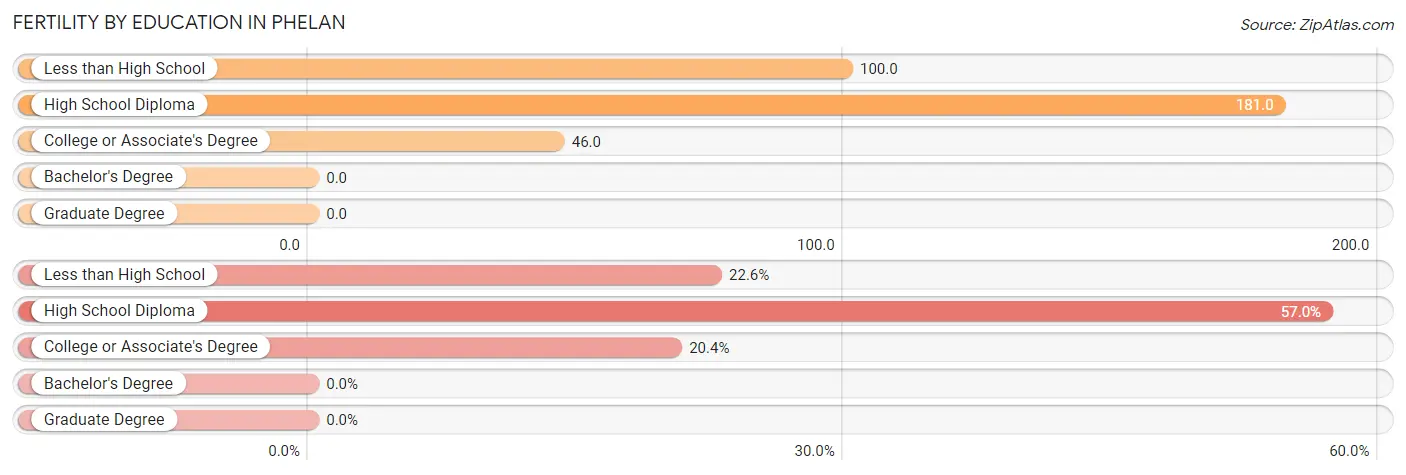
| Educational Attainment | Women with Births | Births / 1,000 Women |
| Less than High School | 91 (22.6%) | 100.0 |
| High School Diploma | 229 (57.0%) | 181.0 |
| College or Associate's Degree | 82 (20.4%) | 46.0 |
| Bachelor's Degree | 0 (0.0%) | 0.0 |
| Graduate Degree | 0 (0.0%) | 0.0 |
| Total | 402 (100.0%) | 90.0 |
Fertility by Education by Marriage Status in Phelan
27.4% of women with births in Phelan are unmarried. Women with the educational attainment of less than high school are most likely to be married with 100.0% of them married at childbirth, while women with the educational attainment of college or associate's degree are least likely to be married with 37.8% of them unmarried at childbirth.
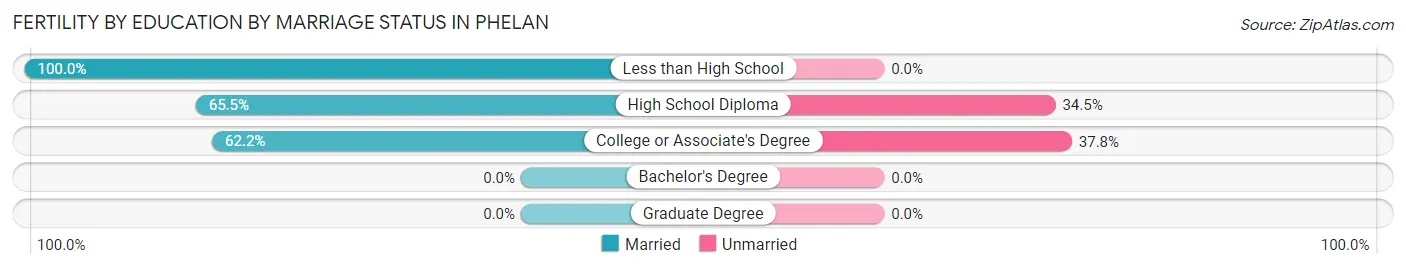
| Educational Attainment | Married | Unmarried |
| Less than High School | 91 (100.0%) | 0 (0.0%) |
| High School Diploma | 150 (65.5%) | 79 (34.5%) |
| College or Associate's Degree | 51 (62.2%) | 31 (37.8%) |
| Bachelor's Degree | 0 (0.0%) | 0 (0.0%) |
| Graduate Degree | 0 (0.0%) | 0 (0.0%) |
| Total | 292 (72.6%) | 110 (27.4%) |
Employment Characteristics in Phelan
Employment by Class of Employer in Phelan
Among the 6,639 employed individuals in Phelan, private company employees (4,085 | 61.5%), self-employed (not incorporated) (724 | 10.9%), and local government employees (662 | 10.0%) make up the most common classes of employment.
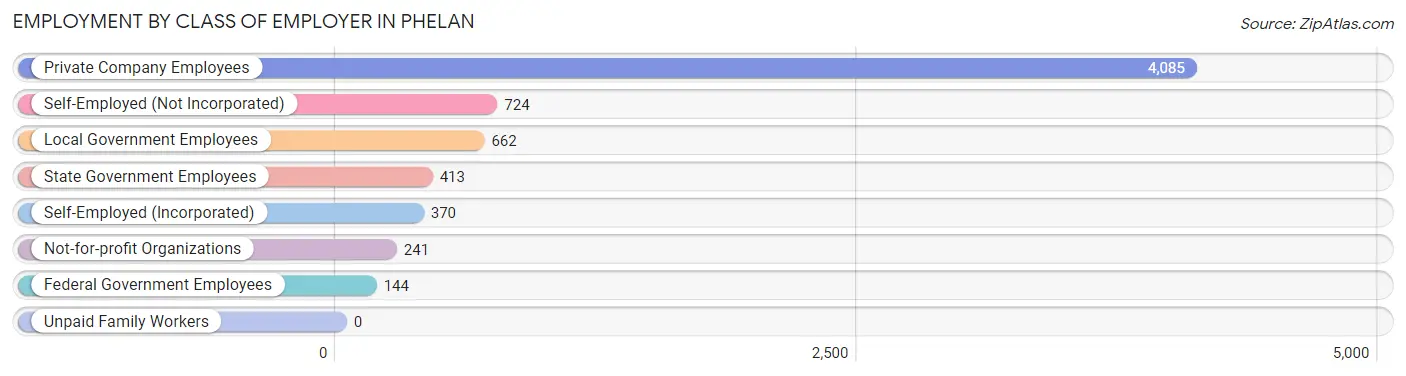
| Employer Class | # Employees | % Employees |
| Private Company Employees | 4,085 | 61.5% |
| Self-Employed (Incorporated) | 370 | 5.6% |
| Self-Employed (Not Incorporated) | 724 | 10.9% |
| Not-for-profit Organizations | 241 | 3.6% |
| Local Government Employees | 662 | 10.0% |
| State Government Employees | 413 | 6.2% |
| Federal Government Employees | 144 | 2.2% |
| Unpaid Family Workers | 0 | 0.0% |
| Total | 6,639 | 100.0% |
Employment Status by Age in Phelan
According to the labor force statistics for Phelan, out of the total population over 16 years of age (13,343), 57.5% or 7,672 individuals are in the labor force, with 12.1% or 928 of them unemployed. The age group with the highest labor force participation rate is 20 to 24 years, with 90.8% or 937 individuals in the labor force. Within the labor force, the 20 to 24 years age range has the highest percentage of unemployed individuals, with 49.1% or 460 of them being unemployed.
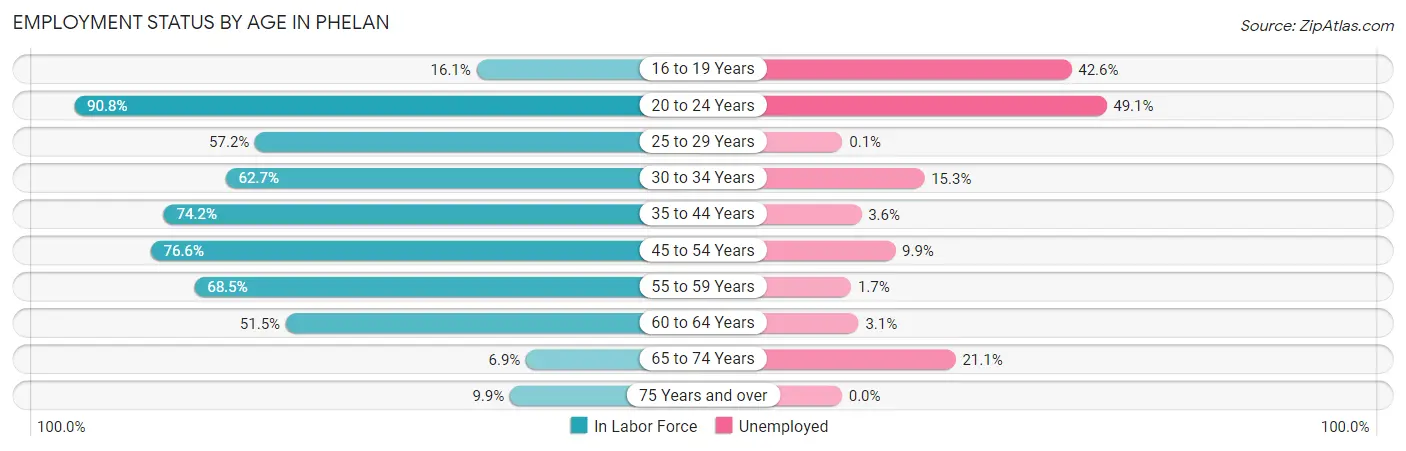
| Age Bracket | In Labor Force | Unemployed |
| 16 to 19 Years | 195 (16.1%) | 83 (42.6%) |
| 20 to 24 Years | 937 (90.8%) | 460 (49.1%) |
| 25 to 29 Years | 948 (57.2%) | 1 (0.1%) |
| 30 to 34 Years | 732 (62.7%) | 112 (15.3%) |
| 35 to 44 Years | 1,569 (74.2%) | 56 (3.6%) |
| 45 to 54 Years | 1,755 (76.6%) | 174 (9.9%) |
| 55 to 59 Years | 1,014 (68.5%) | 17 (1.7%) |
| 60 to 64 Years | 393 (51.5%) | 12 (3.1%) |
| 65 to 74 Years | 71 (6.9%) | 15 (21.1%) |
| 75 Years and over | 59 (9.9%) | 0 (0.0%) |
| Total | 7,672 (57.5%) | 928 (12.1%) |
Employment Status by Educational Attainment in Phelan
According to labor force statistics for Phelan, 67.7% of individuals (6,413) out of the total population between 25 and 64 years of age (9,473) are in the labor force, with 5.8% or 372 of them being unemployed. The group with the highest labor force participation rate are those with the educational attainment of bachelor's degree or higher, with 86.6% or 973 individuals in the labor force. Within the labor force, individuals with less than high school education have the highest percentage of unemployment, with 9.6% or 60 of them being unemployed.
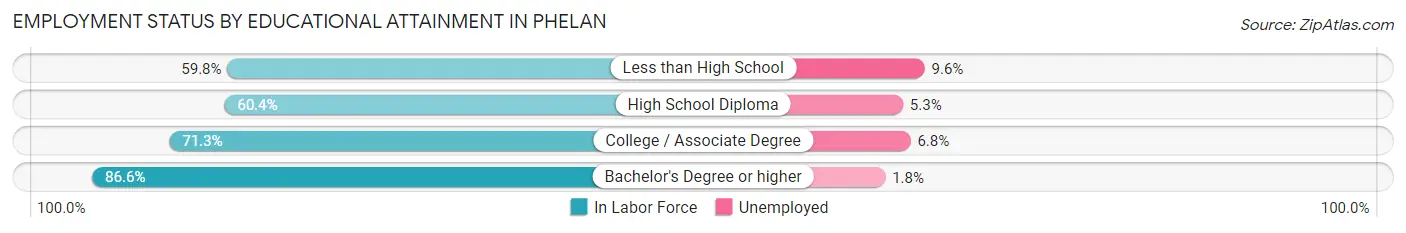
| Educational Attainment | In Labor Force | Unemployed |
| Less than High School | 624 (59.8%) | 100 (9.6%) |
| High School Diploma | 2,196 (60.4%) | 193 (5.3%) |
| College / Associate Degree | 2,616 (71.3%) | 249 (6.8%) |
| Bachelor's Degree or higher | 973 (86.6%) | 20 (1.8%) |
| Total | 6,413 (67.7%) | 549 (5.8%) |
Employment Occupations by Sex in Phelan
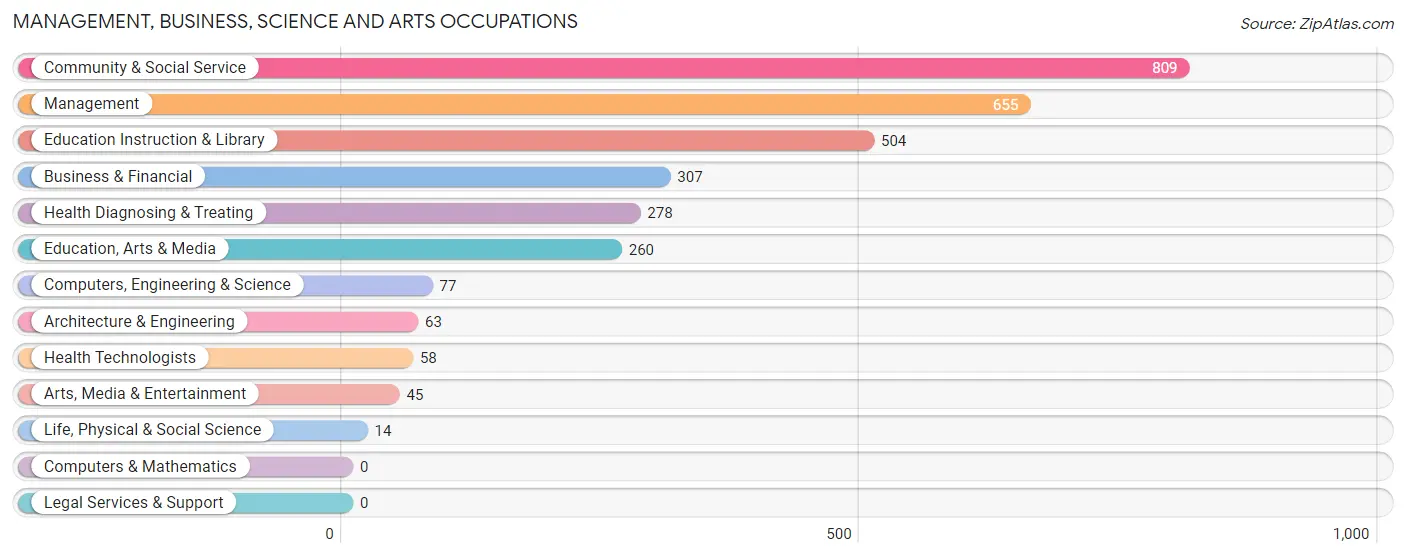
Management, Business, Science and Arts Occupations
The most common Management, Business, Science and Arts occupations in Phelan are Community & Social Service (809 | 12.0%), Management (655 | 9.7%), Education Instruction & Library (504 | 7.5%), Business & Financial (307 | 4.5%), and Health Diagnosing & Treating (278 | 4.1%).
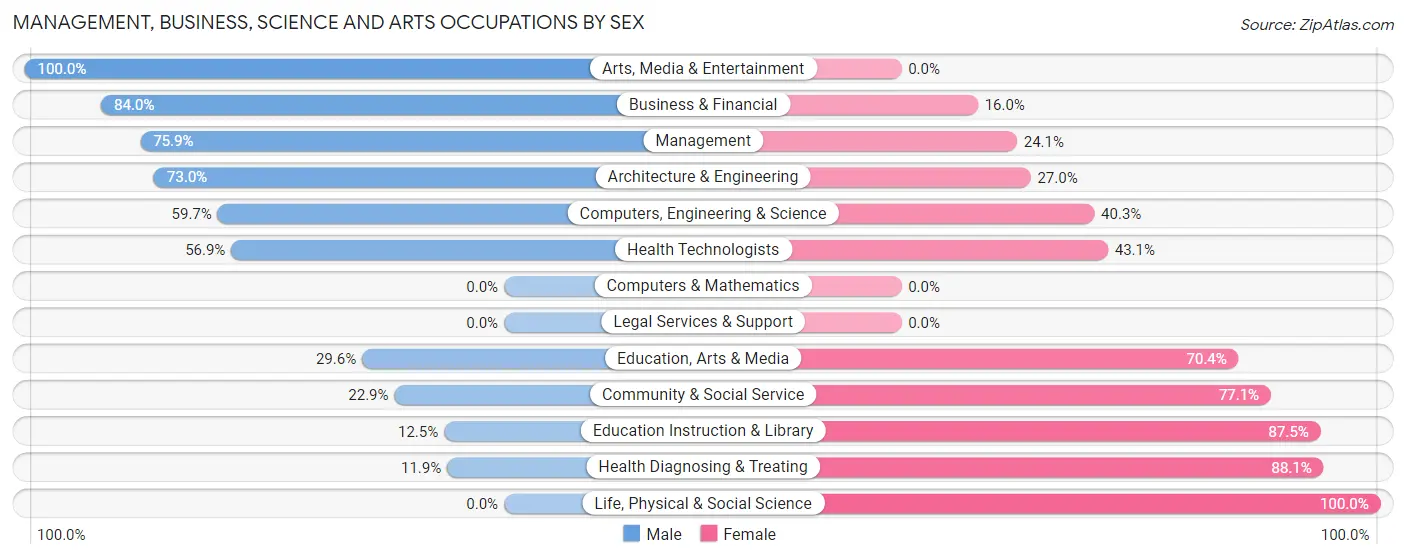
Management, Business, Science and Arts Occupations by Sex
Within the Management, Business, Science and Arts occupations in Phelan, the most male-oriented occupations are Arts, Media & Entertainment (100.0%), Business & Financial (84.0%), and Management (75.9%), while the most female-oriented occupations are Life, Physical & Social Science (100.0%), Health Diagnosing & Treating (88.1%), and Education Instruction & Library (87.5%).
| Occupation | Male | Female |
| Management | 497 (75.9%) | 158 (24.1%) |
| Business & Financial | 258 (84.0%) | 49 (16.0%) |
| Computers, Engineering & Science | 46 (59.7%) | 31 (40.3%) |
| Computers & Mathematics | 0 (0.0%) | 0 (0.0%) |
| Architecture & Engineering | 46 (73.0%) | 17 (27.0%) |
| Life, Physical & Social Science | 0 (0.0%) | 14 (100.0%) |
| Community & Social Service | 185 (22.9%) | 624 (77.1%) |
| Education, Arts & Media | 77 (29.6%) | 183 (70.4%) |
| Legal Services & Support | 0 (0.0%) | 0 (0.0%) |
| Education Instruction & Library | 63 (12.5%) | 441 (87.5%) |
| Arts, Media & Entertainment | 45 (100.0%) | 0 (0.0%) |
| Health Diagnosing & Treating | 33 (11.9%) | 245 (88.1%) |
| Health Technologists | 33 (56.9%) | 25 (43.1%) |
| Total (Category) | 1,019 (47.9%) | 1,107 (52.1%) |
| Total (Overall) | 4,010 (59.5%) | 2,731 (40.5%) |
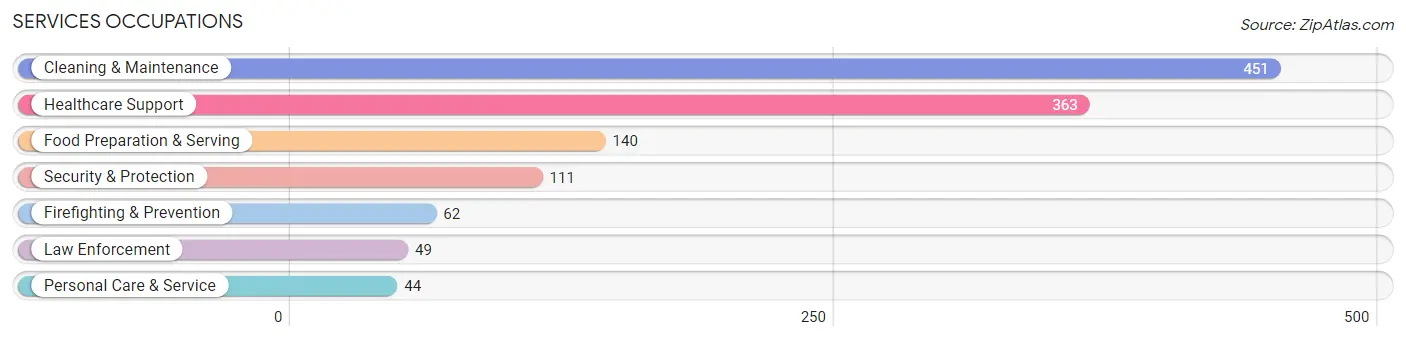
Services Occupations
The most common Services occupations in Phelan are Cleaning & Maintenance (451 | 6.7%), Healthcare Support (363 | 5.4%), Food Preparation & Serving (140 | 2.1%), Security & Protection (111 | 1.7%), and Firefighting & Prevention (62 | 0.9%).
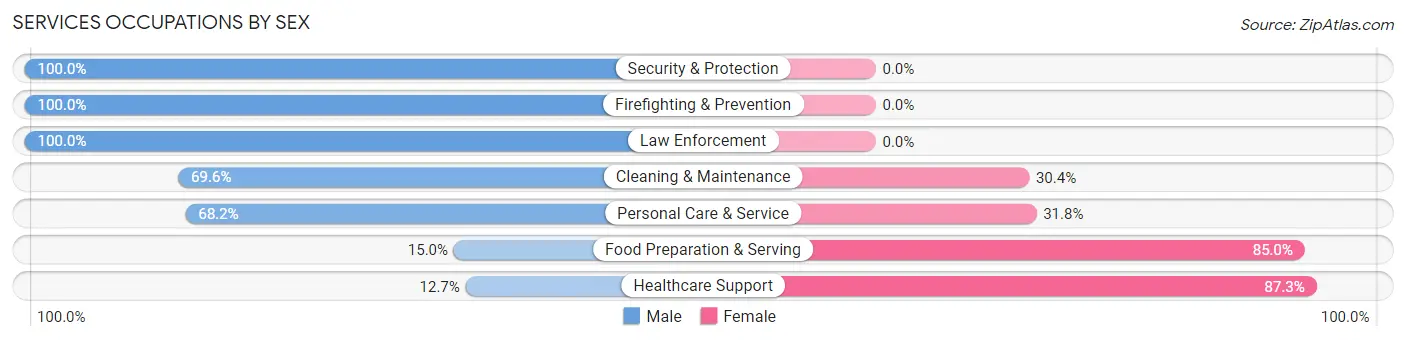
Services Occupations by Sex
Within the Services occupations in Phelan, the most male-oriented occupations are Security & Protection (100.0%), Firefighting & Prevention (100.0%), and Law Enforcement (100.0%), while the most female-oriented occupations are Healthcare Support (87.3%), Food Preparation & Serving (85.0%), and Personal Care & Service (31.8%).
| Occupation | Male | Female |
| Healthcare Support | 46 (12.7%) | 317 (87.3%) |
| Security & Protection | 111 (100.0%) | 0 (0.0%) |
| Firefighting & Prevention | 62 (100.0%) | 0 (0.0%) |
| Law Enforcement | 49 (100.0%) | 0 (0.0%) |
| Food Preparation & Serving | 21 (15.0%) | 119 (85.0%) |
| Cleaning & Maintenance | 314 (69.6%) | 137 (30.4%) |
| Personal Care & Service | 30 (68.2%) | 14 (31.8%) |
| Total (Category) | 522 (47.1%) | 587 (52.9%) |
| Total (Overall) | 4,010 (59.5%) | 2,731 (40.5%) |
Sales and Office Occupations
The most common Sales and Office occupations in Phelan are Sales & Related (576 | 8.5%), and Office & Administration (541 | 8.0%).
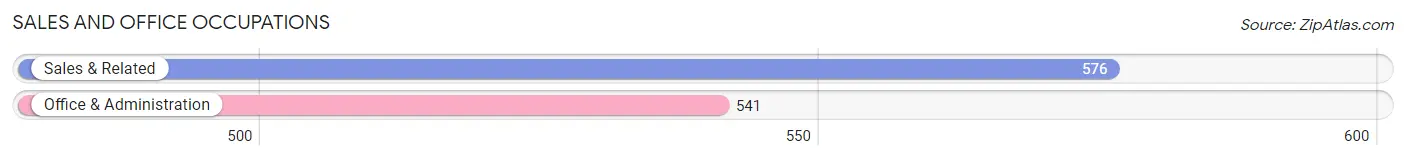
Sales and Office Occupations by Sex
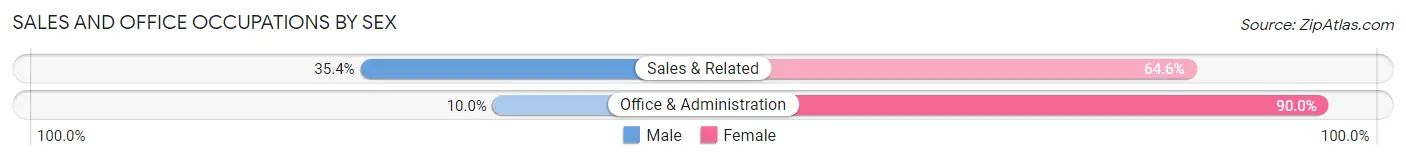
| Occupation | Male | Female |
| Sales & Related | 204 (35.4%) | 372 (64.6%) |
| Office & Administration | 54 (10.0%) | 487 (90.0%) |
| Total (Category) | 258 (23.1%) | 859 (76.9%) |
| Total (Overall) | 4,010 (59.5%) | 2,731 (40.5%) |
Natural Resources, Construction and Maintenance Occupations
The most common Natural Resources, Construction and Maintenance occupations in Phelan are Construction & Extraction (1,058 | 15.7%), Installation, Maintenance & Repair (278 | 4.1%), and Farming, Fishing & Forestry (55 | 0.8%).
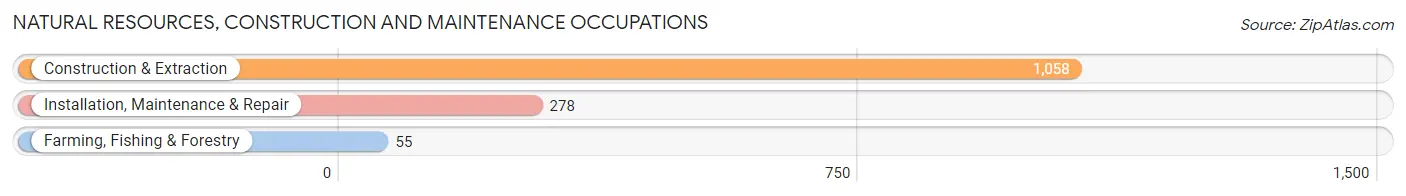
Natural Resources, Construction and Maintenance Occupations by Sex
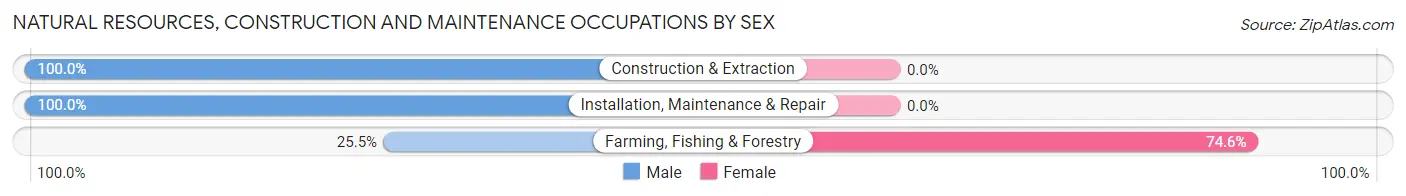
| Occupation | Male | Female |
| Farming, Fishing & Forestry | 14 (25.5%) | 41 (74.6%) |
| Construction & Extraction | 1,058 (100.0%) | 0 (0.0%) |
| Installation, Maintenance & Repair | 278 (100.0%) | 0 (0.0%) |
| Total (Category) | 1,350 (97.1%) | 41 (2.9%) |
| Total (Overall) | 4,010 (59.5%) | 2,731 (40.5%) |
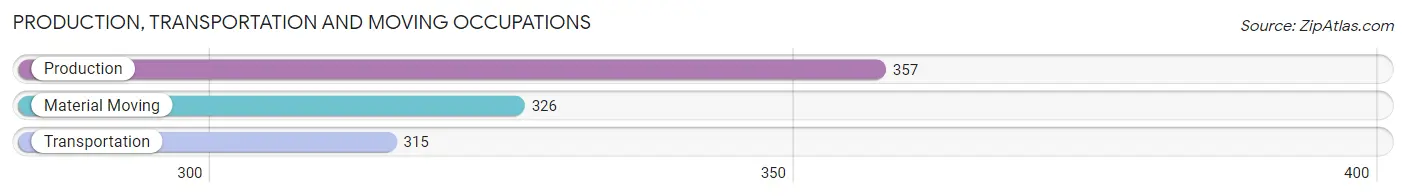
Production, Transportation and Moving Occupations
The most common Production, Transportation and Moving occupations in Phelan are Production (357 | 5.3%), Material Moving (326 | 4.8%), and Transportation (315 | 4.7%).
Production, Transportation and Moving Occupations by Sex
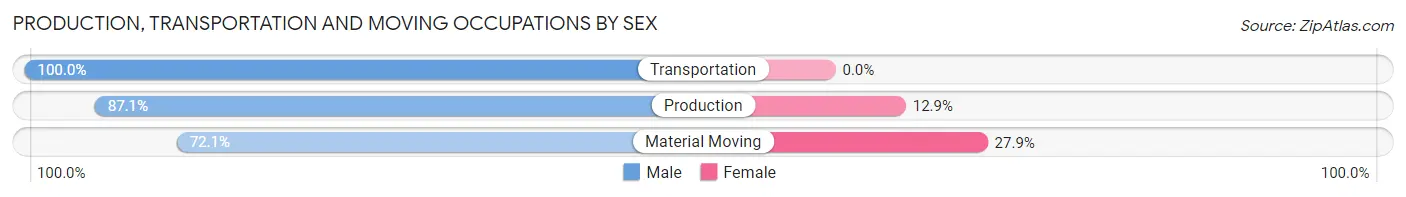
| Occupation | Male | Female |
| Production | 311 (87.1%) | 46 (12.9%) |
| Transportation | 315 (100.0%) | 0 (0.0%) |
| Material Moving | 235 (72.1%) | 91 (27.9%) |
| Total (Category) | 861 (86.3%) | 137 (13.7%) |
| Total (Overall) | 4,010 (59.5%) | 2,731 (40.5%) |
Employment Industries by Sex in Phelan
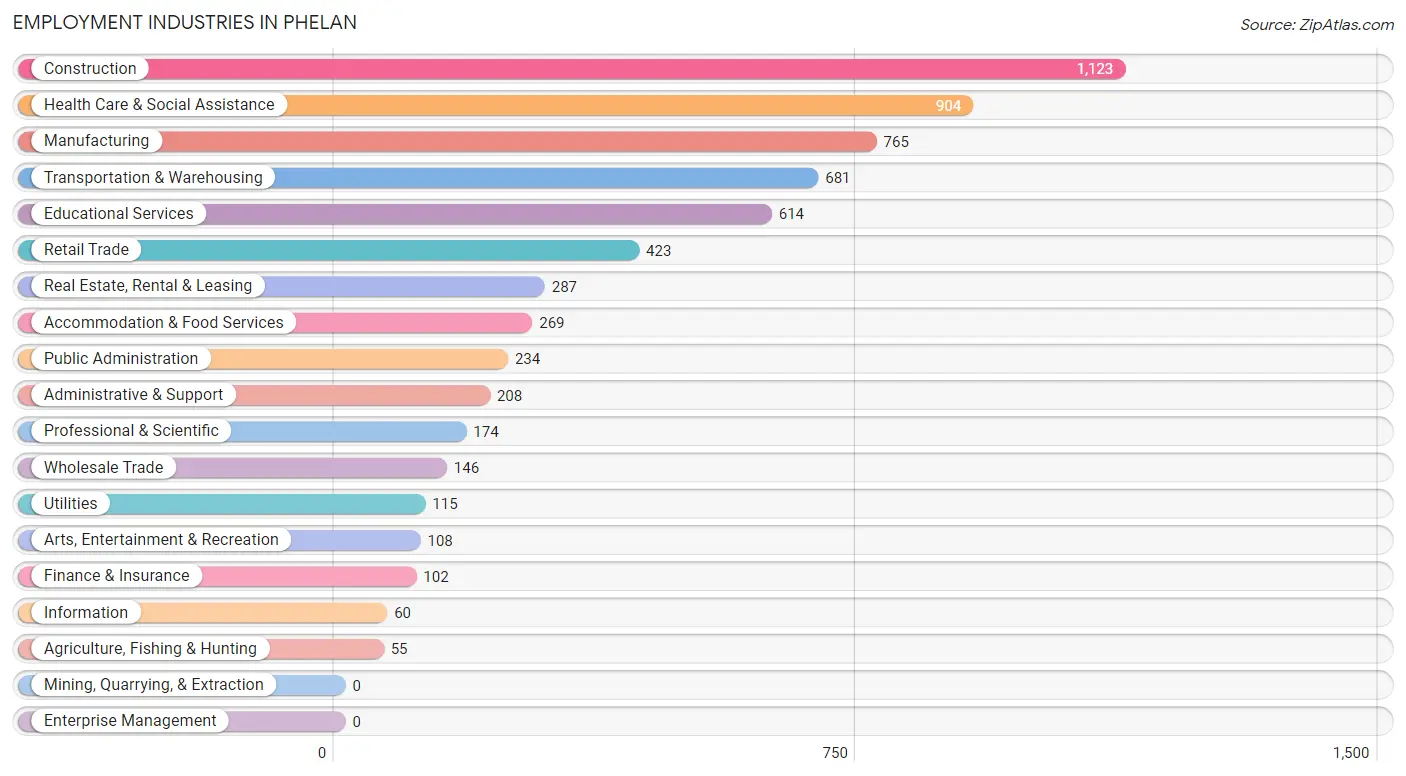
Employment Industries in Phelan
The major employment industries in Phelan include Construction (1,123 | 16.7%), Health Care & Social Assistance (904 | 13.4%), Manufacturing (765 | 11.4%), Transportation & Warehousing (681 | 10.1%), and Educational Services (614 | 9.1%).
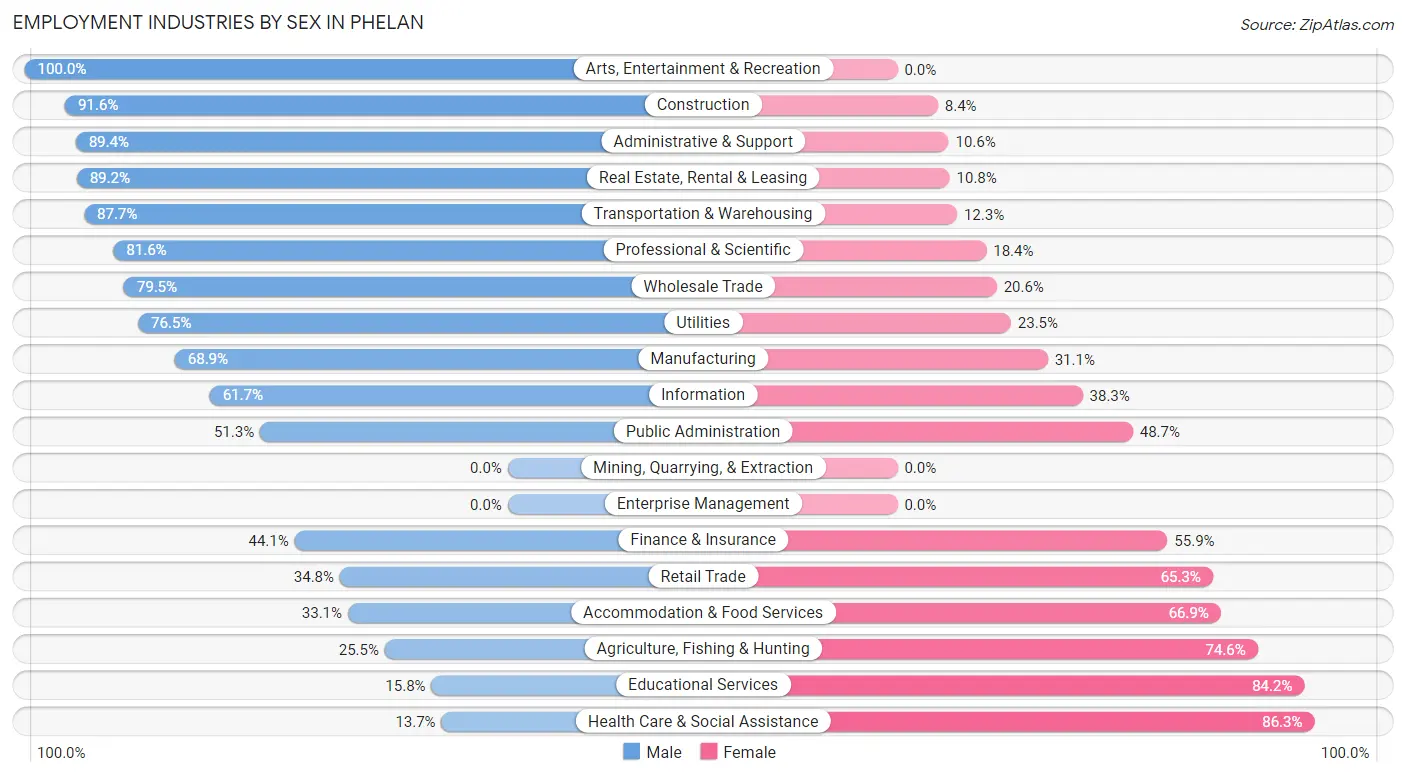
Employment Industries by Sex in Phelan
The Phelan industries that see more men than women are Arts, Entertainment & Recreation (100.0%), Construction (91.6%), and Administrative & Support (89.4%), whereas the industries that tend to have a higher number of women are Health Care & Social Assistance (86.3%), Educational Services (84.2%), and Agriculture, Fishing & Hunting (74.6%).
| Industry | Male | Female |
| Agriculture, Fishing & Hunting | 14 (25.5%) | 41 (74.6%) |
| Mining, Quarrying, & Extraction | 0 (0.0%) | 0 (0.0%) |
| Construction | 1,029 (91.6%) | 94 (8.4%) |
| Manufacturing | 527 (68.9%) | 238 (31.1%) |
| Wholesale Trade | 116 (79.4%) | 30 (20.5%) |
| Retail Trade | 147 (34.7%) | 276 (65.2%) |
| Transportation & Warehousing | 597 (87.7%) | 84 (12.3%) |
| Utilities | 88 (76.5%) | 27 (23.5%) |
| Information | 37 (61.7%) | 23 (38.3%) |
| Finance & Insurance | 45 (44.1%) | 57 (55.9%) |
| Real Estate, Rental & Leasing | 256 (89.2%) | 31 (10.8%) |
| Professional & Scientific | 142 (81.6%) | 32 (18.4%) |
| Enterprise Management | 0 (0.0%) | 0 (0.0%) |
| Administrative & Support | 186 (89.4%) | 22 (10.6%) |
| Educational Services | 97 (15.8%) | 517 (84.2%) |
| Health Care & Social Assistance | 124 (13.7%) | 780 (86.3%) |
| Arts, Entertainment & Recreation | 108 (100.0%) | 0 (0.0%) |
| Accommodation & Food Services | 89 (33.1%) | 180 (66.9%) |
| Public Administration | 120 (51.3%) | 114 (48.7%) |
| Total | 4,010 (59.5%) | 2,731 (40.5%) |
Education in Phelan
School Enrollment in Phelan
The most common levels of schooling among the 4,897 students in Phelan are elementary school (1,482 | 30.3%), high school (1,164 | 23.8%), and college / undergraduate (1,045 | 21.3%).
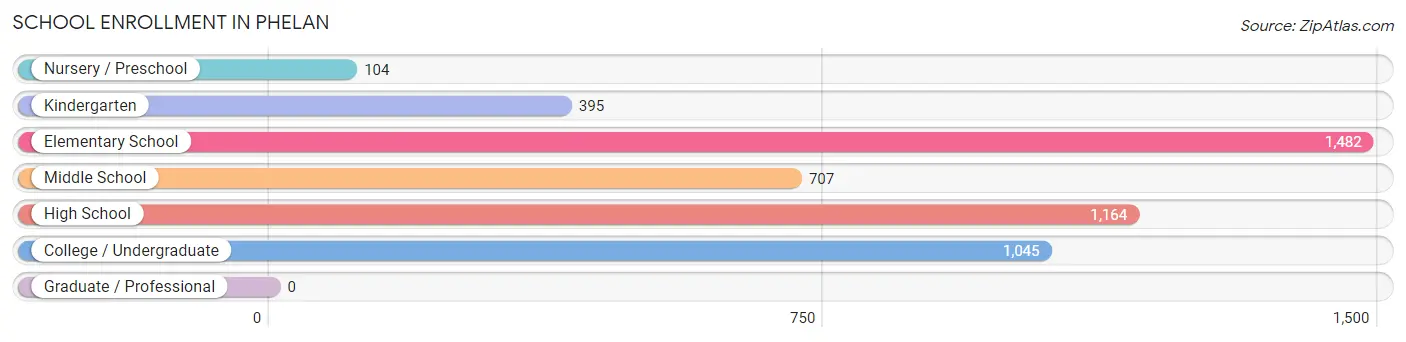
| School Level | # Students | % Students |
| Nursery / Preschool | 104 | 2.1% |
| Kindergarten | 395 | 8.1% |
| Elementary School | 1,482 | 30.3% |
| Middle School | 707 | 14.4% |
| High School | 1,164 | 23.8% |
| College / Undergraduate | 1,045 | 21.3% |
| Graduate / Professional | 0 | 0.0% |
| Total | 4,897 | 100.0% |
School Enrollment by Age by Funding Source in Phelan
Out of a total of 4,897 students who are enrolled in schools in Phelan, 788 (16.1%) attend a private institution, while the remaining 4,109 (83.9%) are enrolled in public schools. The age group of 3 to 4 year olds has the highest likelihood of being enrolled in private schools, with 22 (100.0% in the age bracket) enrolled. Conversely, the age group of 10 to 14 year olds has the lowest likelihood of being enrolled in a private school, with 831 (95.5% in the age bracket) attending a public institution.
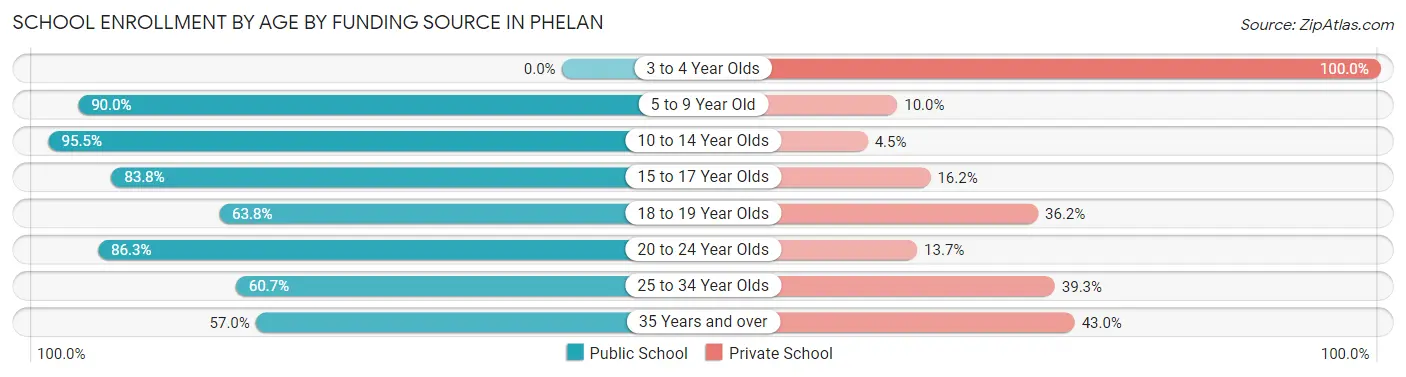
| Age Bracket | Public School | Private School |
| 3 to 4 Year Olds | 0 (0.0%) | 22 (100.0%) |
| 5 to 9 Year Old | 1,711 (90.0%) | 190 (10.0%) |
| 10 to 14 Year Olds | 831 (95.5%) | 39 (4.5%) |
| 15 to 17 Year Olds | 783 (83.8%) | 151 (16.2%) |
| 18 to 19 Year Olds | 243 (63.8%) | 138 (36.2%) |
| 20 to 24 Year Olds | 227 (86.3%) | 36 (13.7%) |
| 25 to 34 Year Olds | 219 (60.7%) | 142 (39.3%) |
| 35 Years and over | 94 (57.0%) | 71 (43.0%) |
| Total | 4,109 (83.9%) | 788 (16.1%) |
Educational Attainment by Field of Study in Phelan
Business (317 | 24.4%), social sciences (194 | 14.9%), arts & humanities (149 | 11.5%), communications (88 | 6.8%), and psychology (84 | 6.5%) are the most common fields of study among 1,300 individuals in Phelan who have obtained a bachelor's degree or higher.
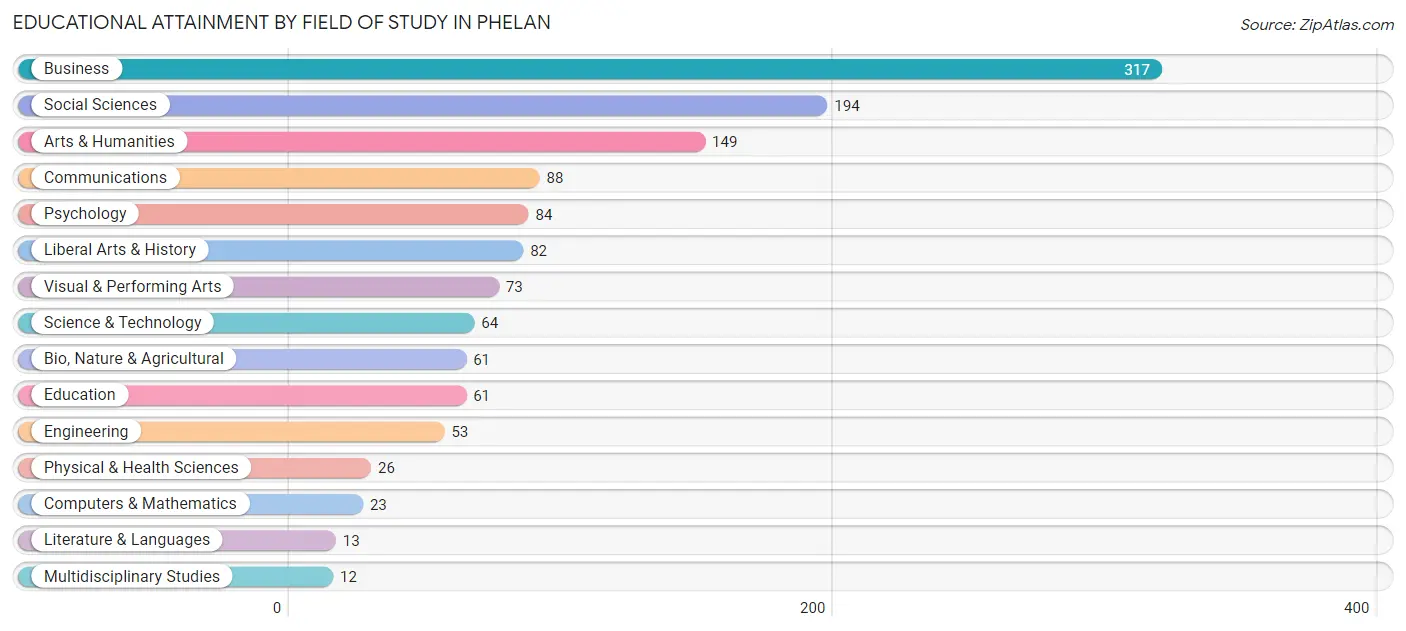
| Field of Study | # Graduates | % Graduates |
| Computers & Mathematics | 23 | 1.8% |
| Bio, Nature & Agricultural | 61 | 4.7% |
| Physical & Health Sciences | 26 | 2.0% |
| Psychology | 84 | 6.5% |
| Social Sciences | 194 | 14.9% |
| Engineering | 53 | 4.1% |
| Multidisciplinary Studies | 12 | 0.9% |
| Science & Technology | 64 | 4.9% |
| Business | 317 | 24.4% |
| Education | 61 | 4.7% |
| Literature & Languages | 13 | 1.0% |
| Liberal Arts & History | 82 | 6.3% |
| Visual & Performing Arts | 73 | 5.6% |
| Communications | 88 | 6.8% |
| Arts & Humanities | 149 | 11.5% |
| Total | 1,300 | 100.0% |
Transportation & Commute in Phelan
Vehicle Availability by Sex in Phelan
The most prevalent vehicle ownership categories in Phelan are males with 3 vehicles (1,034, accounting for 26.4%) and females with 3 vehicles (1,178, making up 38.0%).
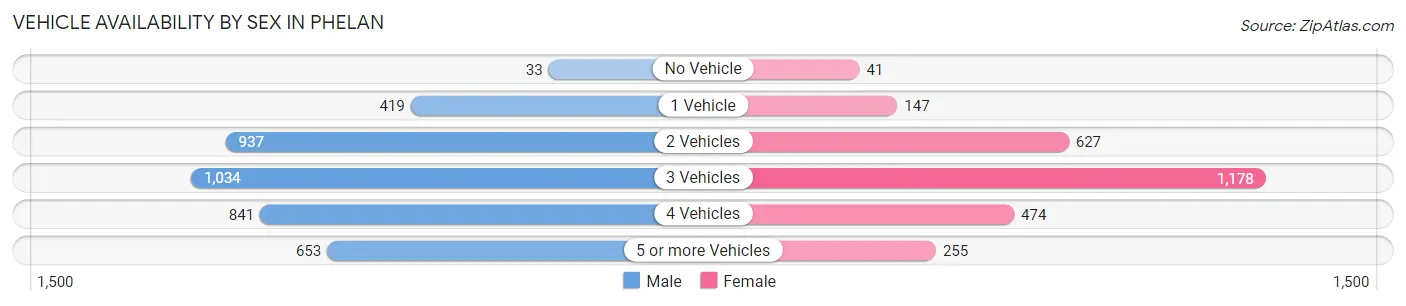
| Vehicles Available | Male | Female |
| No Vehicle | 33 (0.8%) | 41 (1.5%) |
| 1 Vehicle | 419 (10.7%) | 147 (5.4%) |
| 2 Vehicles | 937 (23.9%) | 627 (23.0%) |
| 3 Vehicles | 1,034 (26.4%) | 1,178 (43.3%) |
| 4 Vehicles | 841 (21.5%) | 474 (17.4%) |
| 5 or more Vehicles | 653 (16.7%) | 255 (9.4%) |
| Total | 3,917 (100.0%) | 2,722 (100.0%) |
Commute Time in Phelan
The most frequently occuring commute durations in Phelan are 30 to 34 minutes (1,018 commuters, 17.1%), 45 to 59 minutes (1,013 commuters, 17.0%), and 60 to 89 minutes (982 commuters, 16.5%).
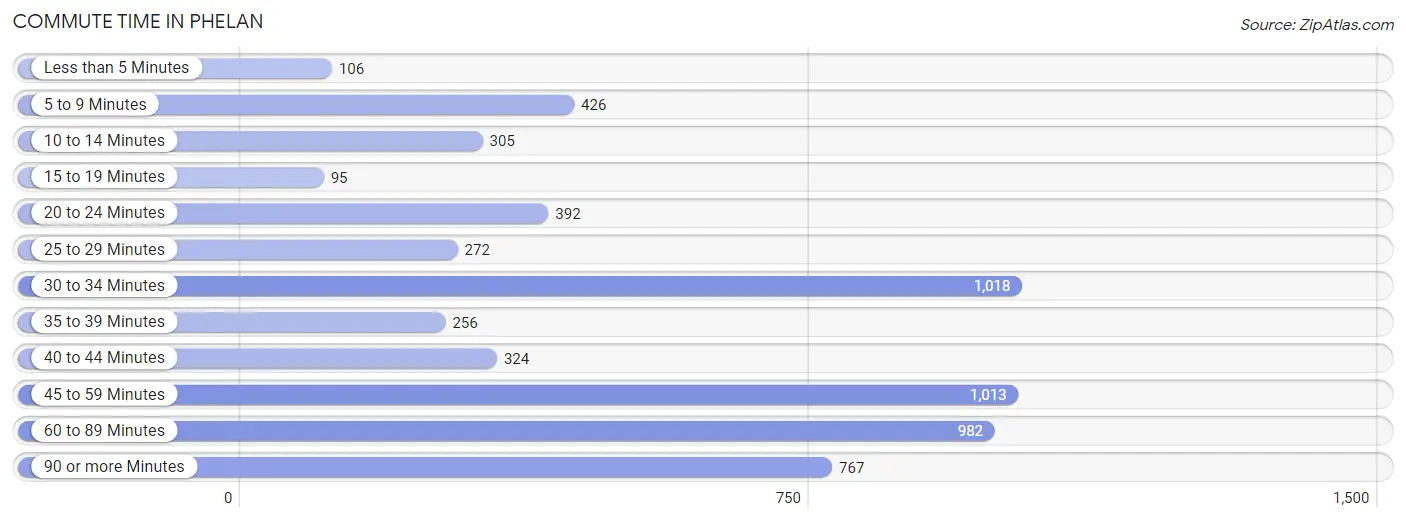
| Commute Time | # Commuters | % Commuters |
| Less than 5 Minutes | 106 | 1.8% |
| 5 to 9 Minutes | 426 | 7.1% |
| 10 to 14 Minutes | 305 | 5.1% |
| 15 to 19 Minutes | 95 | 1.6% |
| 20 to 24 Minutes | 392 | 6.6% |
| 25 to 29 Minutes | 272 | 4.6% |
| 30 to 34 Minutes | 1,018 | 17.1% |
| 35 to 39 Minutes | 256 | 4.3% |
| 40 to 44 Minutes | 324 | 5.4% |
| 45 to 59 Minutes | 1,013 | 17.0% |
| 60 to 89 Minutes | 982 | 16.5% |
| 90 or more Minutes | 767 | 12.9% |
Commute Time by Sex in Phelan
The most common commute times in Phelan are 45 to 59 minutes (736 commuters, 20.8%) for males and 30 to 34 minutes (633 commuters, 26.2%) for females.
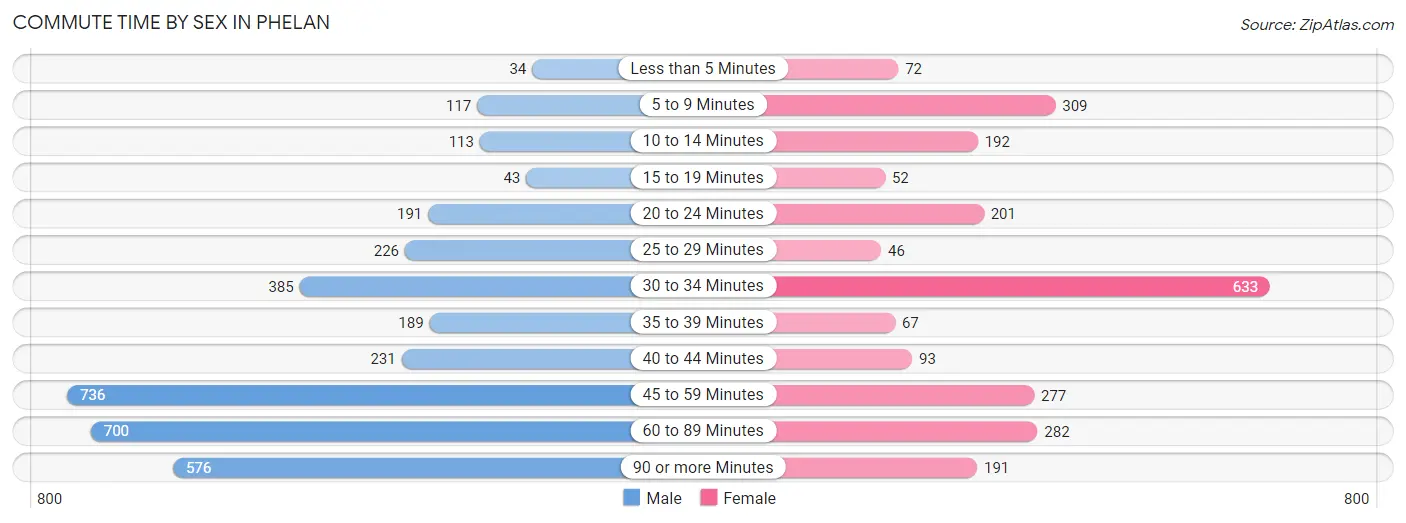
| Commute Time | Male | Female |
| Less than 5 Minutes | 34 (1.0%) | 72 (3.0%) |
| 5 to 9 Minutes | 117 (3.3%) | 309 (12.8%) |
| 10 to 14 Minutes | 113 (3.2%) | 192 (8.0%) |
| 15 to 19 Minutes | 43 (1.2%) | 52 (2.1%) |
| 20 to 24 Minutes | 191 (5.4%) | 201 (8.3%) |
| 25 to 29 Minutes | 226 (6.4%) | 46 (1.9%) |
| 30 to 34 Minutes | 385 (10.9%) | 633 (26.2%) |
| 35 to 39 Minutes | 189 (5.3%) | 67 (2.8%) |
| 40 to 44 Minutes | 231 (6.5%) | 93 (3.8%) |
| 45 to 59 Minutes | 736 (20.8%) | 277 (11.5%) |
| 60 to 89 Minutes | 700 (19.8%) | 282 (11.7%) |
| 90 or more Minutes | 576 (16.3%) | 191 (7.9%) |
Time of Departure to Work by Sex in Phelan
The most frequent times of departure to work in Phelan are 12:00 AM to 4:59 AM (880, 24.8%) for males and 8:00 AM to 8:29 AM (535, 22.2%) for females.
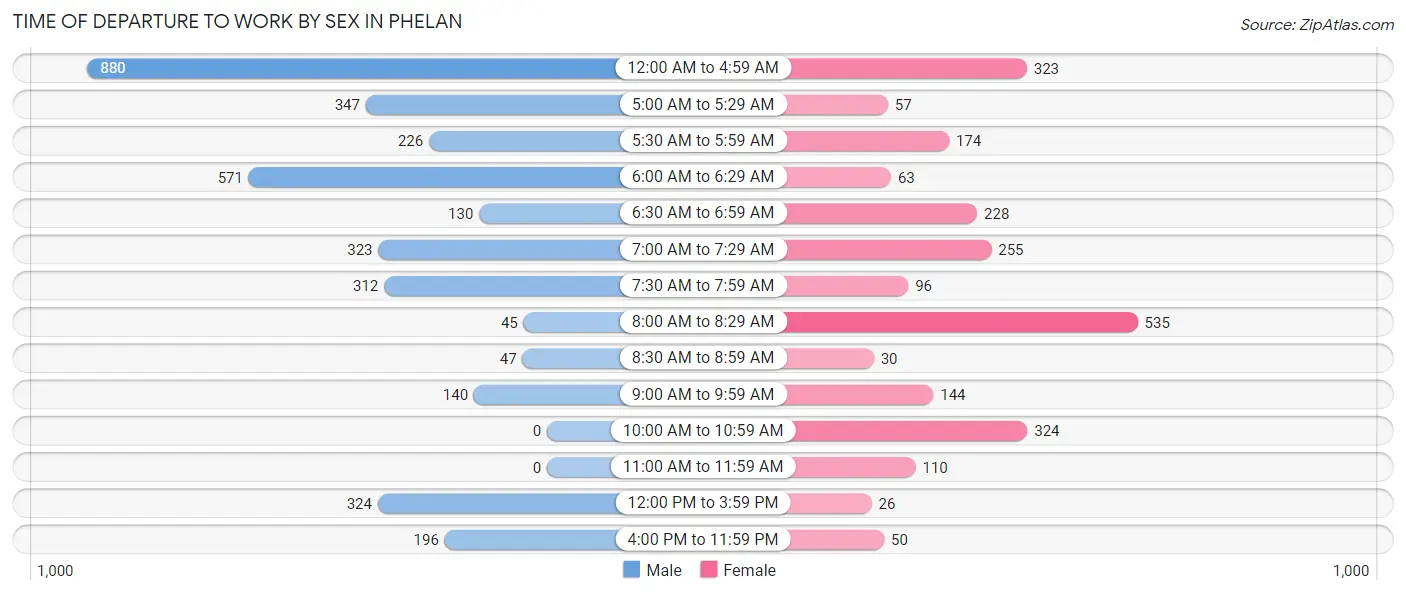
| Time of Departure | Male | Female |
| 12:00 AM to 4:59 AM | 880 (24.8%) | 323 (13.4%) |
| 5:00 AM to 5:29 AM | 347 (9.8%) | 57 (2.4%) |
| 5:30 AM to 5:59 AM | 226 (6.4%) | 174 (7.2%) |
| 6:00 AM to 6:29 AM | 571 (16.1%) | 63 (2.6%) |
| 6:30 AM to 6:59 AM | 130 (3.7%) | 228 (9.4%) |
| 7:00 AM to 7:29 AM | 323 (9.1%) | 255 (10.6%) |
| 7:30 AM to 7:59 AM | 312 (8.8%) | 96 (4.0%) |
| 8:00 AM to 8:29 AM | 45 (1.3%) | 535 (22.2%) |
| 8:30 AM to 8:59 AM | 47 (1.3%) | 30 (1.2%) |
| 9:00 AM to 9:59 AM | 140 (4.0%) | 144 (6.0%) |
| 10:00 AM to 10:59 AM | 0 (0.0%) | 324 (13.4%) |
| 11:00 AM to 11:59 AM | 0 (0.0%) | 110 (4.5%) |
| 12:00 PM to 3:59 PM | 324 (9.1%) | 26 (1.1%) |
| 4:00 PM to 11:59 PM | 196 (5.5%) | 50 (2.1%) |
| Total | 3,541 (100.0%) | 2,415 (100.0%) |
Housing Occupancy in Phelan
Occupancy by Ownership in Phelan
Of the total 4,927 dwellings in Phelan, owner-occupied units account for 3,749 (76.1%), while renter-occupied units make up 1,178 (23.9%).
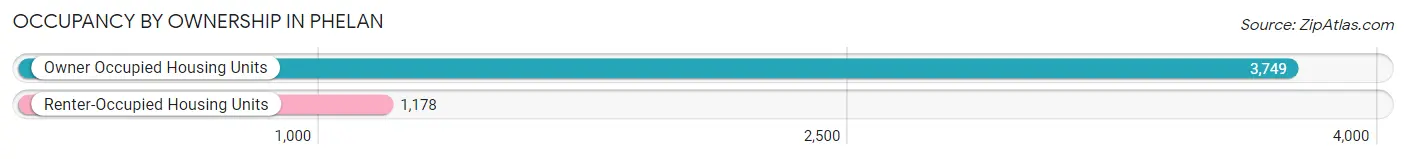
| Occupancy | # Housing Units | % Housing Units |
| Owner Occupied Housing Units | 3,749 | 76.1% |
| Renter-Occupied Housing Units | 1,178 | 23.9% |
| Total Occupied Housing Units | 4,927 | 100.0% |
Occupancy by Household Size in Phelan
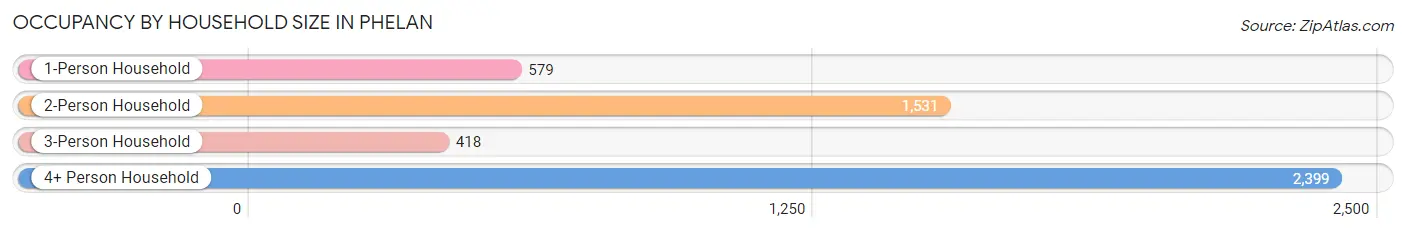
| Household Size | # Housing Units | % Housing Units |
| 1-Person Household | 579 | 11.7% |
| 2-Person Household | 1,531 | 31.1% |
| 3-Person Household | 418 | 8.5% |
| 4+ Person Household | 2,399 | 48.7% |
| Total Housing Units | 4,927 | 100.0% |
Occupancy by Ownership by Household Size in Phelan
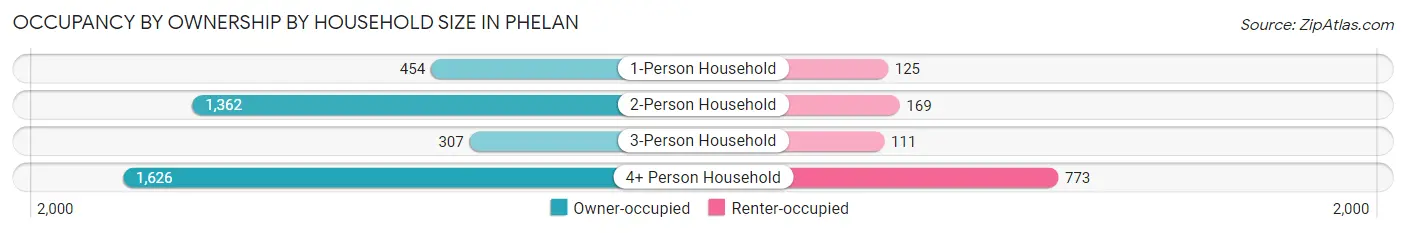
| Household Size | Owner-occupied | Renter-occupied |
| 1-Person Household | 454 (78.4%) | 125 (21.6%) |
| 2-Person Household | 1,362 (89.0%) | 169 (11.0%) |
| 3-Person Household | 307 (73.4%) | 111 (26.6%) |
| 4+ Person Household | 1,626 (67.8%) | 773 (32.2%) |
| Total Housing Units | 3,749 (76.1%) | 1,178 (23.9%) |
Occupancy by Educational Attainment in Phelan
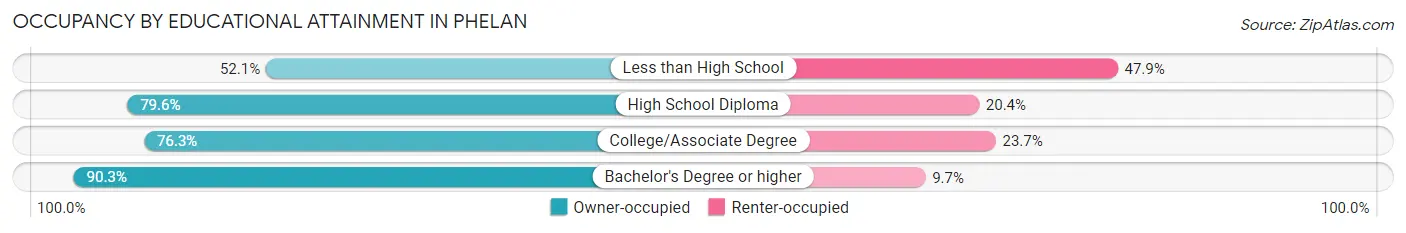
| Household Size | Owner-occupied | Renter-occupied |
| Less than High School | 304 (52.1%) | 279 (47.9%) |
| High School Diploma | 1,416 (79.6%) | 362 (20.4%) |
| College/Associate Degree | 1,574 (76.3%) | 488 (23.7%) |
| Bachelor's Degree or higher | 455 (90.3%) | 49 (9.7%) |
Occupancy by Age of Householder in Phelan
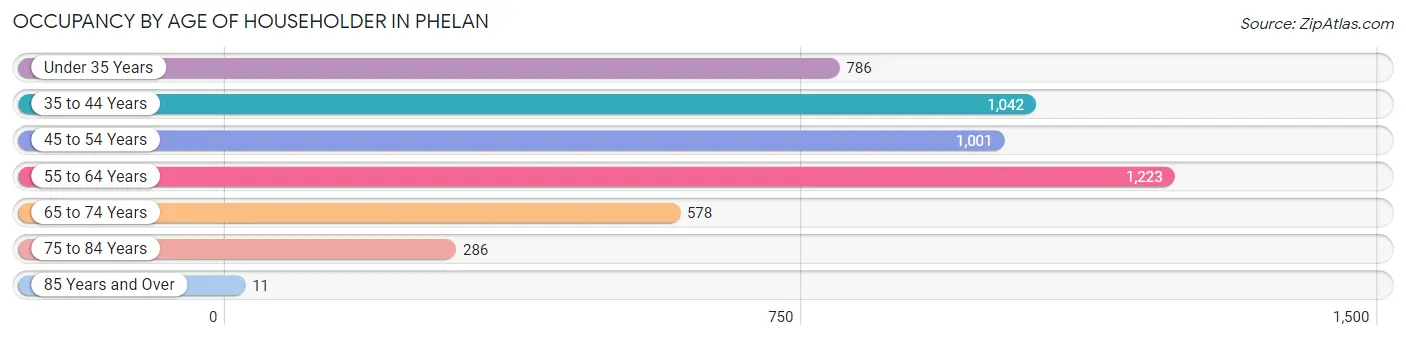
| Age Bracket | # Households | % Households |
| Under 35 Years | 786 | 16.0% |
| 35 to 44 Years | 1,042 | 21.1% |
| 45 to 54 Years | 1,001 | 20.3% |
| 55 to 64 Years | 1,223 | 24.8% |
| 65 to 74 Years | 578 | 11.7% |
| 75 to 84 Years | 286 | 5.8% |
| 85 Years and Over | 11 | 0.2% |
| Total | 4,927 | 100.0% |
Housing Finances in Phelan
Median Income by Occupancy in Phelan
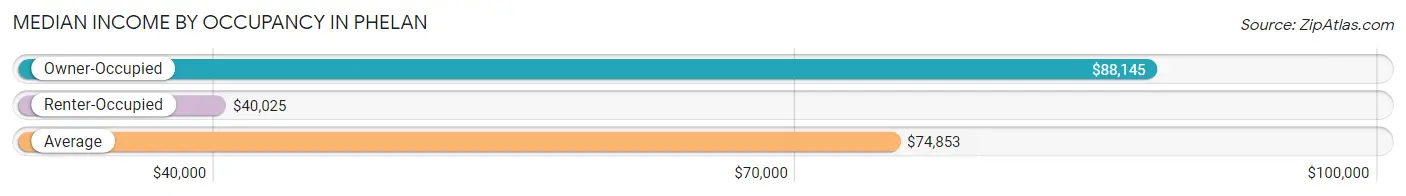
| Occupancy Type | # Households | Median Income |
| Owner-Occupied | 3,749 (76.1%) | $88,145 |
| Renter-Occupied | 1,178 (23.9%) | $40,025 |
| Average | 4,927 (100.0%) | $74,853 |
Occupancy by Householder Income Bracket in Phelan
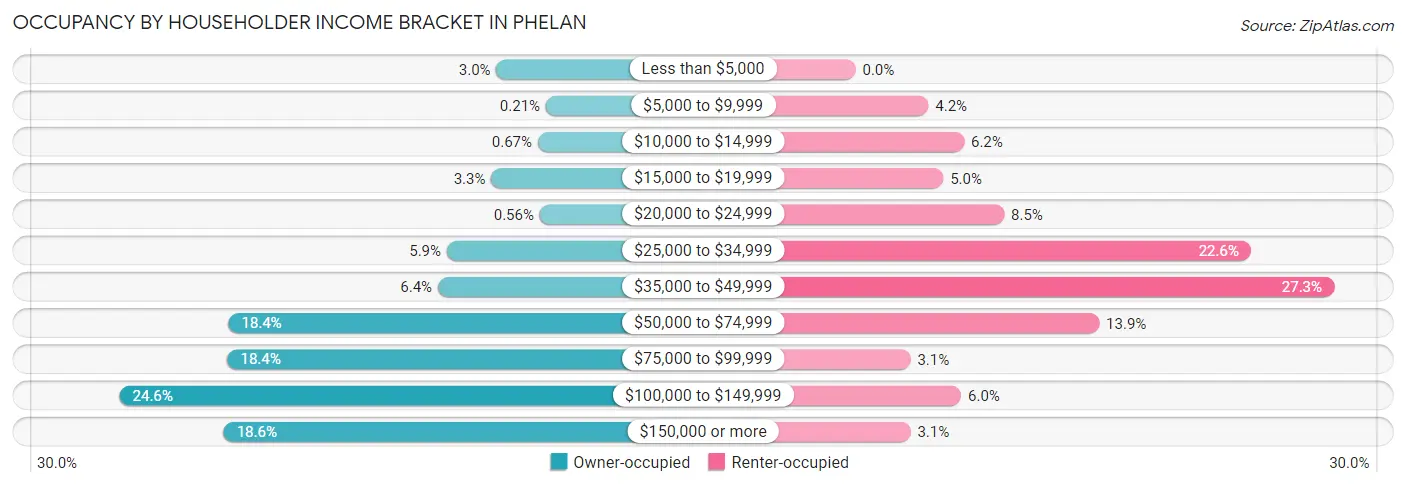
| Income Bracket | Owner-occupied | Renter-occupied |
| Less than $5,000 | 114 (3.0%) | 0 (0.0%) |
| $5,000 to $9,999 | 8 (0.2%) | 49 (4.2%) |
| $10,000 to $14,999 | 25 (0.7%) | 73 (6.2%) |
| $15,000 to $19,999 | 125 (3.3%) | 59 (5.0%) |
| $20,000 to $24,999 | 21 (0.6%) | 100 (8.5%) |
| $25,000 to $34,999 | 220 (5.9%) | 266 (22.6%) |
| $35,000 to $49,999 | 239 (6.4%) | 322 (27.3%) |
| $50,000 to $74,999 | 688 (18.3%) | 164 (13.9%) |
| $75,000 to $99,999 | 690 (18.4%) | 37 (3.1%) |
| $100,000 to $149,999 | 921 (24.6%) | 71 (6.0%) |
| $150,000 or more | 698 (18.6%) | 37 (3.1%) |
| Total | 3,749 (100.0%) | 1,178 (100.0%) |
Monthly Housing Cost Tiers in Phelan
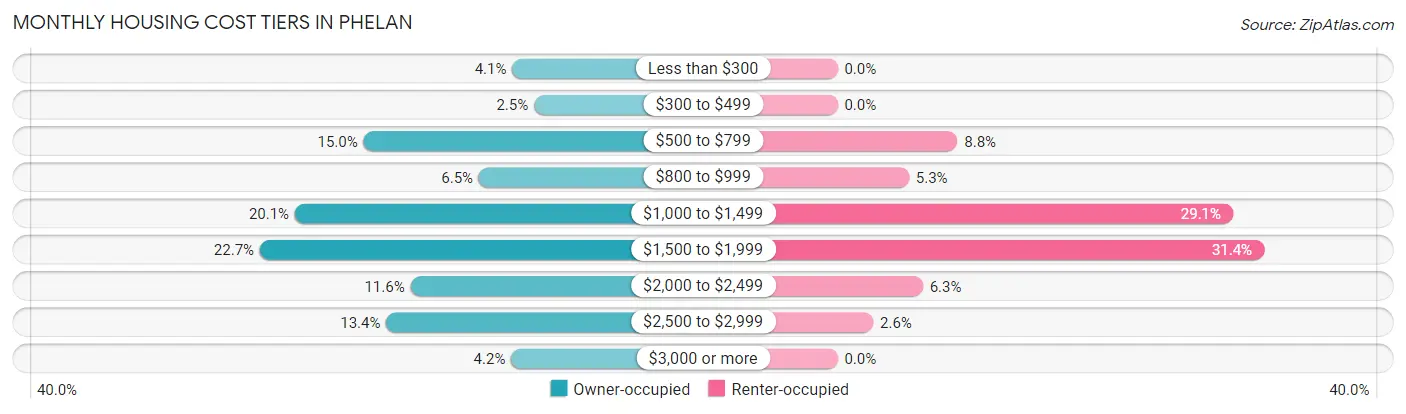
| Monthly Cost | Owner-occupied | Renter-occupied |
| Less than $300 | 153 (4.1%) | 0 (0.0%) |
| $300 to $499 | 93 (2.5%) | 0 (0.0%) |
| $500 to $799 | 564 (15.0%) | 104 (8.8%) |
| $800 to $999 | 245 (6.5%) | 62 (5.3%) |
| $1,000 to $1,499 | 753 (20.1%) | 343 (29.1%) |
| $1,500 to $1,999 | 850 (22.7%) | 370 (31.4%) |
| $2,000 to $2,499 | 434 (11.6%) | 74 (6.3%) |
| $2,500 to $2,999 | 501 (13.4%) | 31 (2.6%) |
| $3,000 or more | 156 (4.2%) | 0 (0.0%) |
| Total | 3,749 (100.0%) | 1,178 (100.0%) |
Physical Housing Characteristics in Phelan
Housing Structures in Phelan
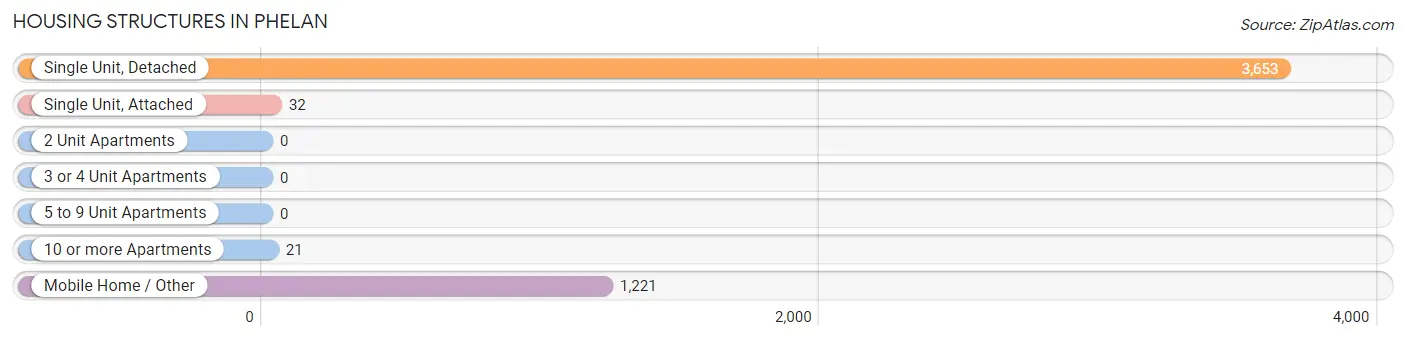
| Structure Type | # Housing Units | % Housing Units |
| Single Unit, Detached | 3,653 | 74.1% |
| Single Unit, Attached | 32 | 0.6% |
| 2 Unit Apartments | 0 | 0.0% |
| 3 or 4 Unit Apartments | 0 | 0.0% |
| 5 to 9 Unit Apartments | 0 | 0.0% |
| 10 or more Apartments | 21 | 0.4% |
| Mobile Home / Other | 1,221 | 24.8% |
| Total | 4,927 | 100.0% |
Housing Structures by Occupancy in Phelan
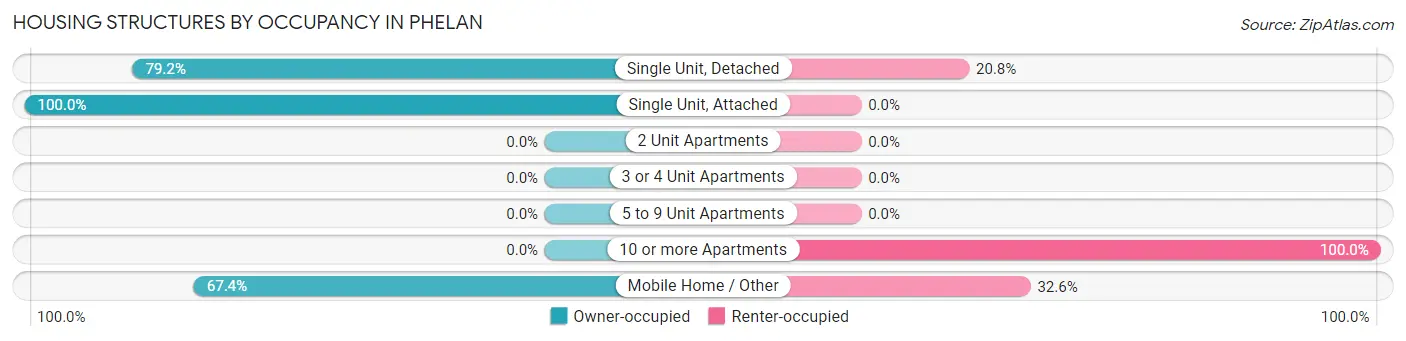
| Structure Type | Owner-occupied | Renter-occupied |
| Single Unit, Detached | 2,894 (79.2%) | 759 (20.8%) |
| Single Unit, Attached | 32 (100.0%) | 0 (0.0%) |
| 2 Unit Apartments | 0 (0.0%) | 0 (0.0%) |
| 3 or 4 Unit Apartments | 0 (0.0%) | 0 (0.0%) |
| 5 to 9 Unit Apartments | 0 (0.0%) | 0 (0.0%) |
| 10 or more Apartments | 0 (0.0%) | 21 (100.0%) |
| Mobile Home / Other | 823 (67.4%) | 398 (32.6%) |
| Total | 3,749 (76.1%) | 1,178 (23.9%) |
Housing Structures by Number of Rooms in Phelan
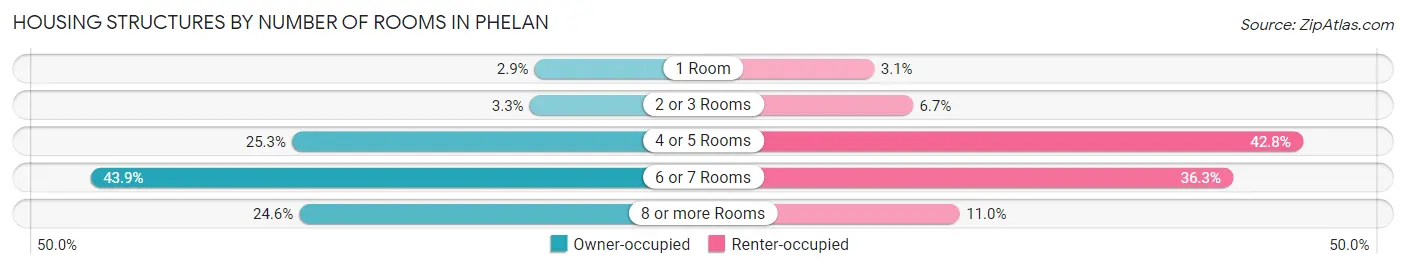
| Number of Rooms | Owner-occupied | Renter-occupied |
| 1 Room | 107 (2.9%) | 37 (3.1%) |
| 2 or 3 Rooms | 124 (3.3%) | 79 (6.7%) |
| 4 or 5 Rooms | 948 (25.3%) | 504 (42.8%) |
| 6 or 7 Rooms | 1,647 (43.9%) | 428 (36.3%) |
| 8 or more Rooms | 923 (24.6%) | 130 (11.0%) |
| Total | 3,749 (100.0%) | 1,178 (100.0%) |
Housing Structure by Heating Type in Phelan
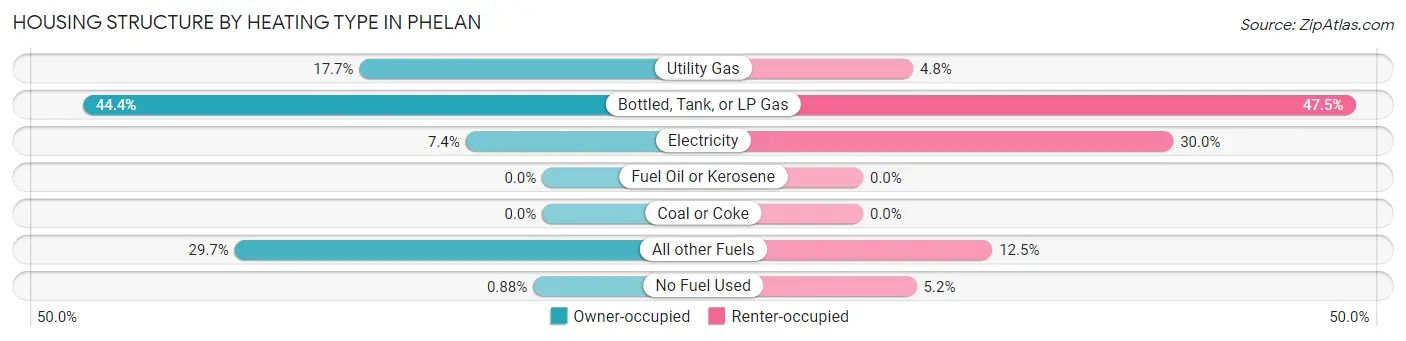
| Heating Type | Owner-occupied | Renter-occupied |
| Utility Gas | 662 (17.7%) | 57 (4.8%) |
| Bottled, Tank, or LP Gas | 1,663 (44.4%) | 560 (47.5%) |
| Electricity | 277 (7.4%) | 353 (30.0%) |
| Fuel Oil or Kerosene | 0 (0.0%) | 0 (0.0%) |
| Coal or Coke | 0 (0.0%) | 0 (0.0%) |
| All other Fuels | 1,114 (29.7%) | 147 (12.5%) |
| No Fuel Used | 33 (0.9%) | 61 (5.2%) |
| Total | 3,749 (100.0%) | 1,178 (100.0%) |
Household Vehicle Usage in Phelan
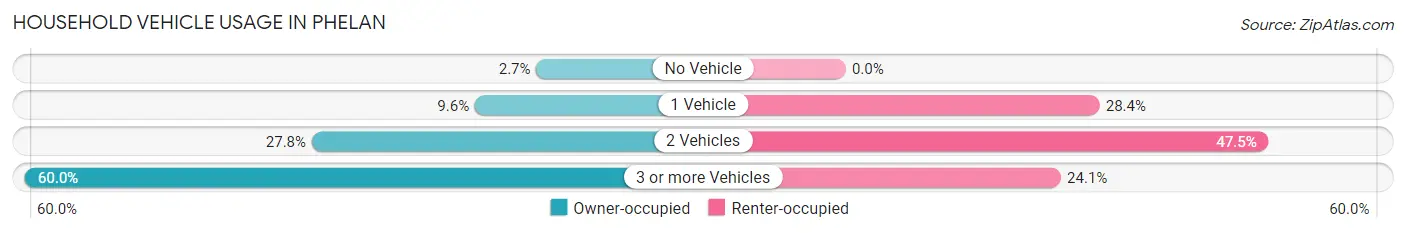
| Vehicles per Household | Owner-occupied | Renter-occupied |
| No Vehicle | 100 (2.7%) | 0 (0.0%) |
| 1 Vehicle | 358 (9.6%) | 335 (28.4%) |
| 2 Vehicles | 1,043 (27.8%) | 559 (47.4%) |
| 3 or more Vehicles | 2,248 (60.0%) | 284 (24.1%) |
| Total | 3,749 (100.0%) | 1,178 (100.0%) |
Real Estate & Mortgages in Phelan
Real Estate and Mortgage Overview in Phelan
| Characteristic | Without Mortgage | With Mortgage |
| Housing Units | 970 | 2,779 |
| Median Property Value | $232,400 | $356,900 |
| Median Household Income | $74,299 | $536 |
| Monthly Housing Costs | $569 | $156 |
| Real Estate Taxes | $1,811 | $21 |
Property Value by Mortgage Status in Phelan
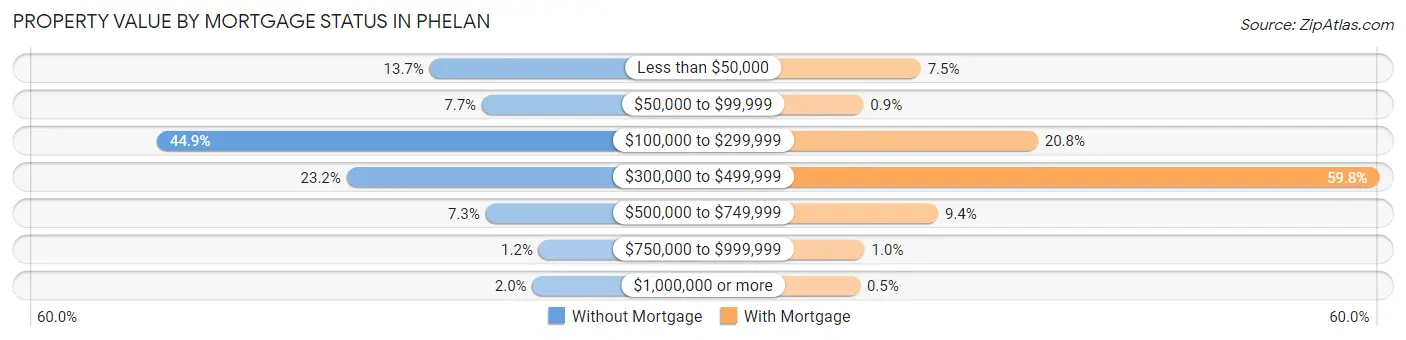
| Property Value | Without Mortgage | With Mortgage |
| Less than $50,000 | 133 (13.7%) | 207 (7.4%) |
| $50,000 to $99,999 | 75 (7.7%) | 25 (0.9%) |
| $100,000 to $299,999 | 435 (44.9%) | 579 (20.8%) |
| $300,000 to $499,999 | 225 (23.2%) | 1,663 (59.8%) |
| $500,000 to $749,999 | 71 (7.3%) | 262 (9.4%) |
| $750,000 to $999,999 | 12 (1.2%) | 29 (1.0%) |
| $1,000,000 or more | 19 (2.0%) | 14 (0.5%) |
| Total | 970 (100.0%) | 2,779 (100.0%) |
Household Income by Mortgage Status in Phelan
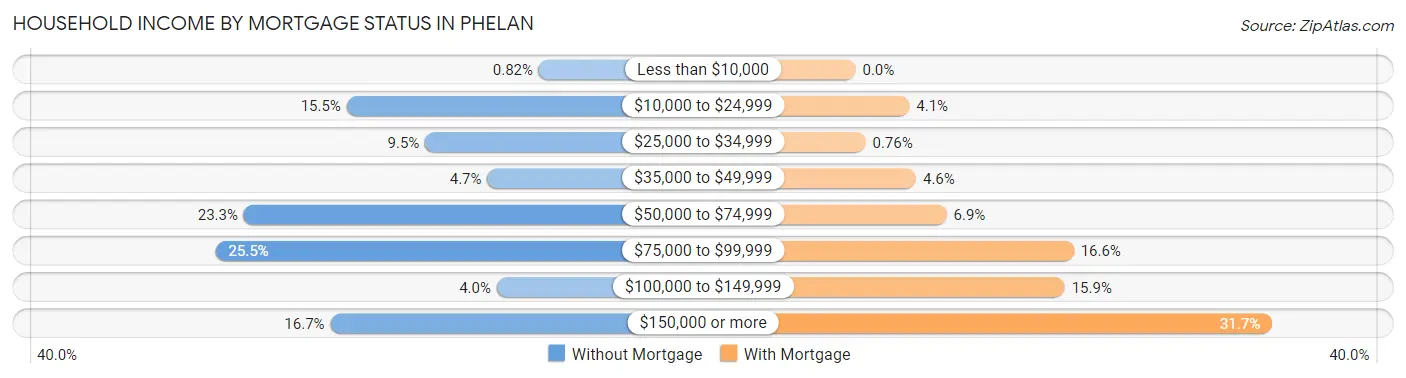
| Household Income | Without Mortgage | With Mortgage |
| Less than $10,000 | 8 (0.8%) | 0 (0.0%) |
| $10,000 to $24,999 | 150 (15.5%) | 114 (4.1%) |
| $25,000 to $34,999 | 92 (9.5%) | 21 (0.8%) |
| $35,000 to $49,999 | 46 (4.7%) | 128 (4.6%) |
| $50,000 to $74,999 | 226 (23.3%) | 193 (6.9%) |
| $75,000 to $99,999 | 247 (25.5%) | 462 (16.6%) |
| $100,000 to $149,999 | 39 (4.0%) | 443 (15.9%) |
| $150,000 or more | 162 (16.7%) | 882 (31.7%) |
| Total | 970 (100.0%) | 2,779 (100.0%) |
Property Value to Household Income Ratio in Phelan
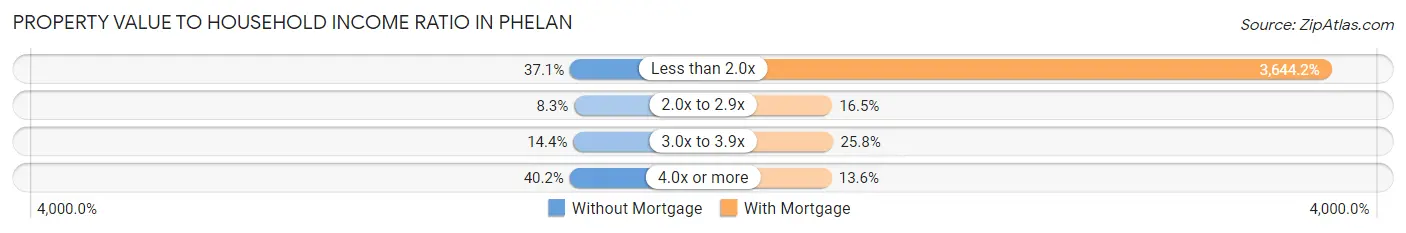
| Value-to-Income Ratio | Without Mortgage | With Mortgage |
| Less than 2.0x | 360 (37.1%) | 101,272 (3,644.2%) |
| 2.0x to 2.9x | 80 (8.3%) | 459 (16.5%) |
| 3.0x to 3.9x | 140 (14.4%) | 716 (25.8%) |
| 4.0x or more | 390 (40.2%) | 378 (13.6%) |
| Total | 970 (100.0%) | 2,779 (100.0%) |
Real Estate Taxes by Mortgage Status in Phelan
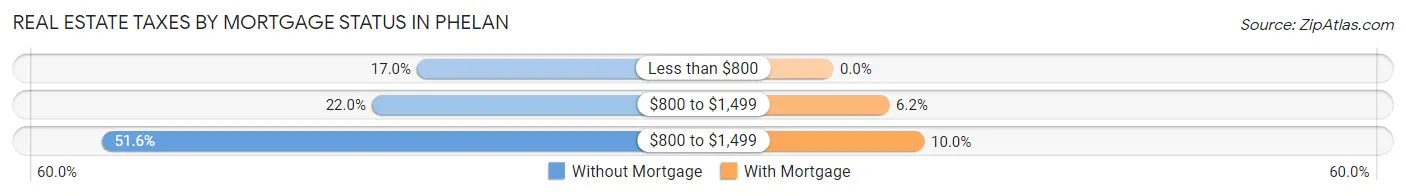
| Property Taxes | Without Mortgage | With Mortgage |
| Less than $800 | 165 (17.0%) | 0 (0.0%) |
| $800 to $1,499 | 213 (22.0%) | 171 (6.1%) |
| $800 to $1,499 | 500 (51.5%) | 277 (10.0%) |
| Total | 970 (100.0%) | 2,779 (100.0%) |
Health & Disability in Phelan
Health Insurance Coverage by Age in Phelan
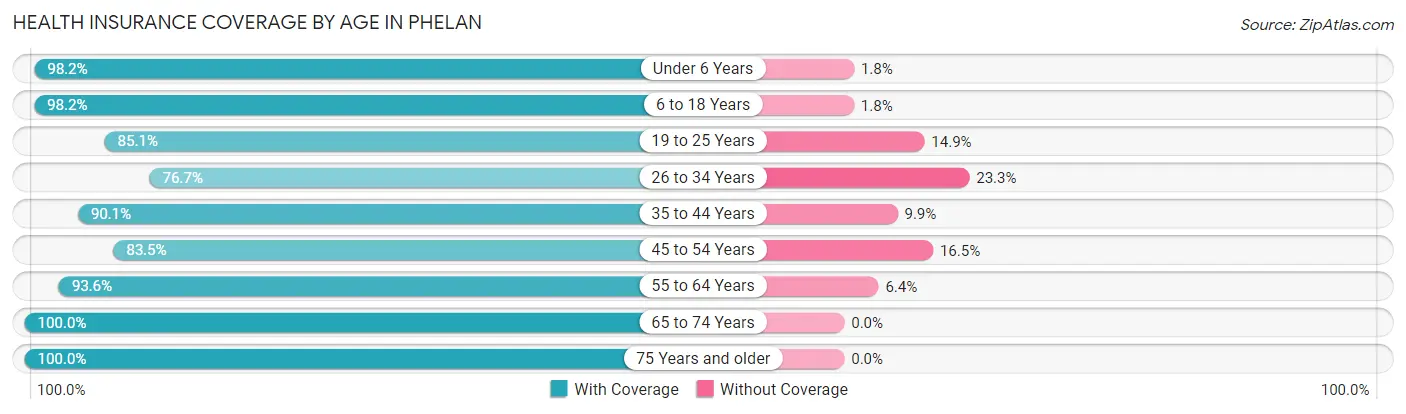
| Age Bracket | With Coverage | Without Coverage |
| Under 6 Years | 1,789 (98.2%) | 33 (1.8%) |
| 6 to 18 Years | 3,887 (98.2%) | 71 (1.8%) |
| 19 to 25 Years | 1,537 (85.1%) | 270 (14.9%) |
| 26 to 34 Years | 1,846 (76.7%) | 561 (23.3%) |
| 35 to 44 Years | 1,905 (90.1%) | 210 (9.9%) |
| 45 to 54 Years | 1,912 (83.5%) | 379 (16.5%) |
| 55 to 64 Years | 2,100 (93.6%) | 143 (6.4%) |
| 65 to 74 Years | 1,035 (100.0%) | 0 (0.0%) |
| 75 Years and older | 594 (100.0%) | 0 (0.0%) |
| Total | 16,605 (90.9%) | 1,667 (9.1%) |
Health Insurance Coverage by Citizenship Status in Phelan
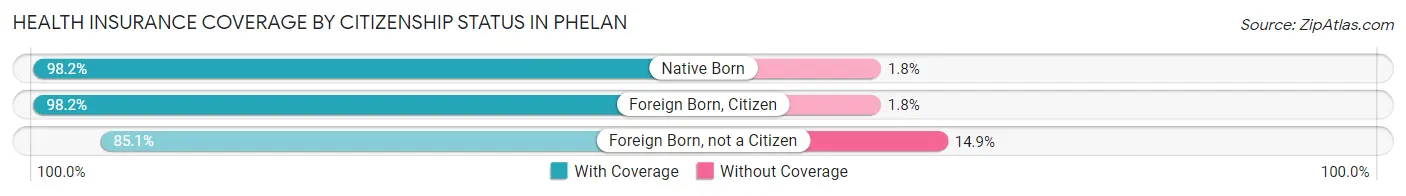
| Citizenship Status | With Coverage | Without Coverage |
| Native Born | 1,789 (98.2%) | 33 (1.8%) |
| Foreign Born, Citizen | 3,887 (98.2%) | 71 (1.8%) |
| Foreign Born, not a Citizen | 1,537 (85.1%) | 270 (14.9%) |
Health Insurance Coverage by Household Income in Phelan
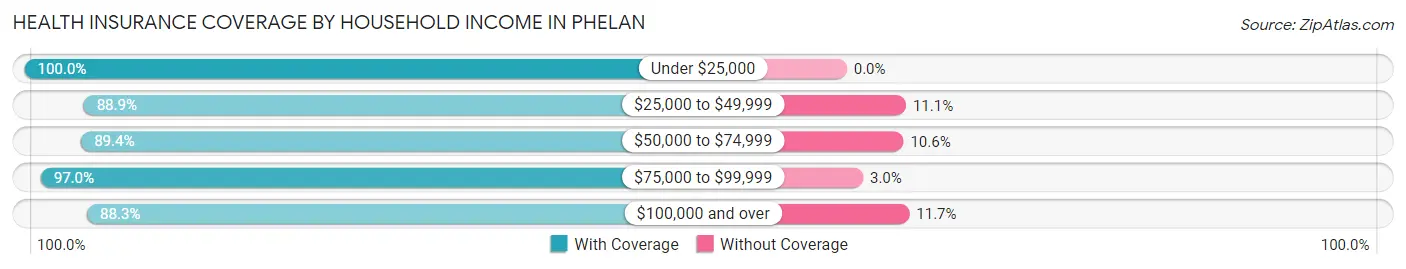
| Household Income | With Coverage | Without Coverage |
| Under $25,000 | 1,173 (100.0%) | 0 (0.0%) |
| $25,000 to $49,999 | 3,591 (88.9%) | 448 (11.1%) |
| $50,000 to $74,999 | 2,871 (89.4%) | 341 (10.6%) |
| $75,000 to $99,999 | 3,123 (97.0%) | 98 (3.0%) |
| $100,000 and over | 5,747 (88.3%) | 763 (11.7%) |
Public vs Private Health Insurance Coverage by Age in Phelan
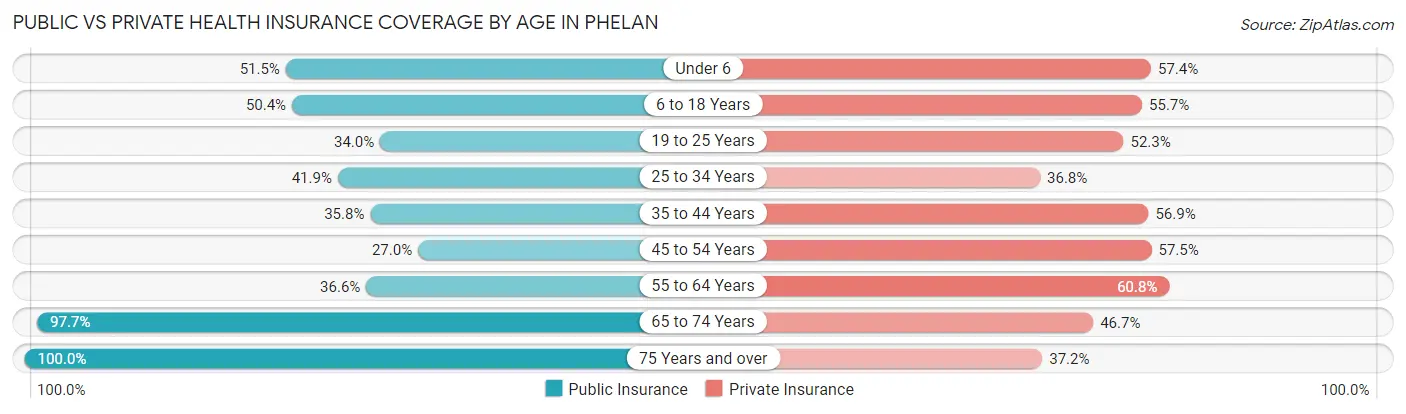
| Age Bracket | Public Insurance | Private Insurance |
| Under 6 | 939 (51.5%) | 1,046 (57.4%) |
| 6 to 18 Years | 1,994 (50.4%) | 2,206 (55.7%) |
| 19 to 25 Years | 615 (34.0%) | 945 (52.3%) |
| 25 to 34 Years | 1,008 (41.9%) | 886 (36.8%) |
| 35 to 44 Years | 758 (35.8%) | 1,204 (56.9%) |
| 45 to 54 Years | 618 (27.0%) | 1,317 (57.5%) |
| 55 to 64 Years | 821 (36.6%) | 1,363 (60.8%) |
| 65 to 74 Years | 1,011 (97.7%) | 483 (46.7%) |
| 75 Years and over | 594 (100.0%) | 221 (37.2%) |
| Total | 8,358 (45.7%) | 9,671 (52.9%) |
Disability Status by Sex by Age in Phelan
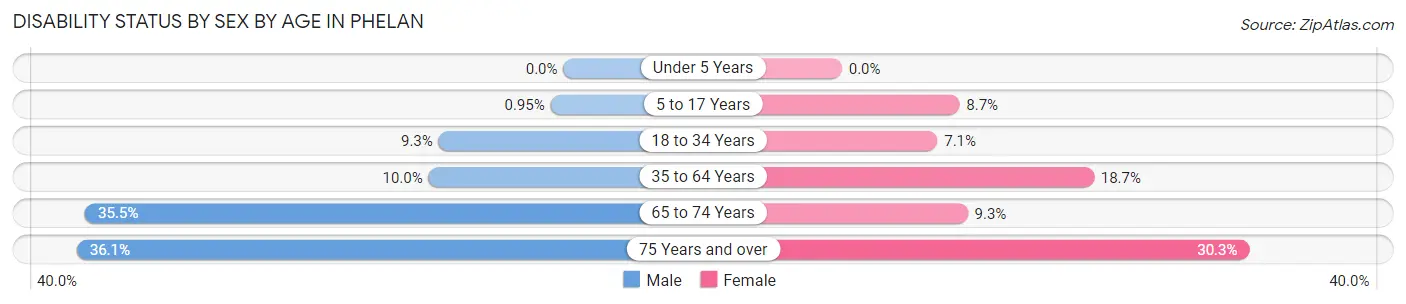
| Age Bracket | Male | Female |
| Under 5 Years | 0 (0.0%) | 0 (0.0%) |
| 5 to 17 Years | 17 (0.9%) | 184 (8.7%) |
| 18 to 34 Years | 212 (9.3%) | 154 (7.1%) |
| 35 to 64 Years | 334 (10.0%) | 620 (18.7%) |
| 65 to 74 Years | 185 (35.5%) | 48 (9.3%) |
| 75 Years and over | 82 (36.1%) | 111 (30.2%) |
Disability Class by Sex by Age in Phelan
Disability Class: Hearing Difficulty
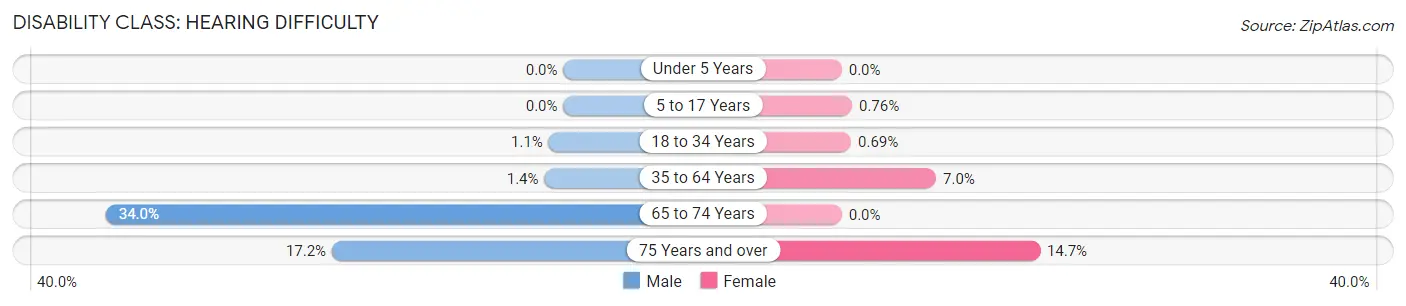
| Age Bracket | Male | Female |
| Under 5 Years | 0 (0.0%) | 0 (0.0%) |
| 5 to 17 Years | 0 (0.0%) | 16 (0.8%) |
| 18 to 34 Years | 25 (1.1%) | 15 (0.7%) |
| 35 to 64 Years | 47 (1.4%) | 232 (7.0%) |
| 65 to 74 Years | 177 (34.0%) | 0 (0.0%) |
| 75 Years and over | 39 (17.2%) | 54 (14.7%) |
Disability Class: Vision Difficulty
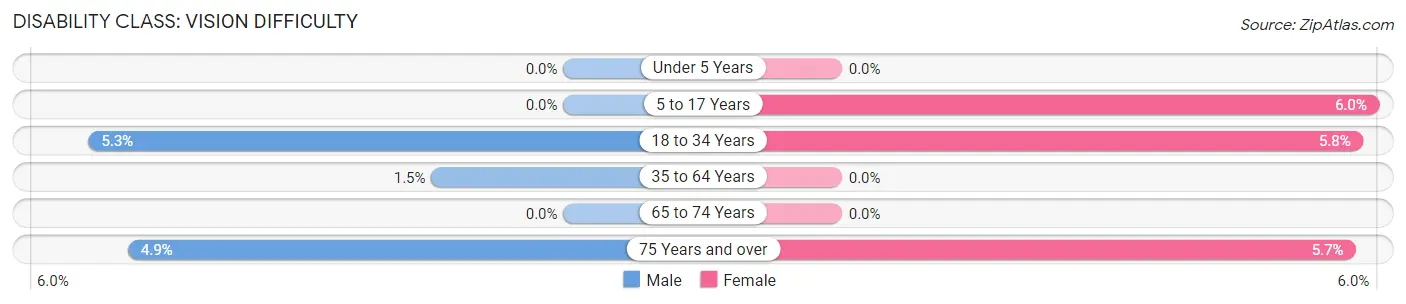
| Age Bracket | Male | Female |
| Under 5 Years | 0 (0.0%) | 0 (0.0%) |
| 5 to 17 Years | 0 (0.0%) | 126 (6.0%) |
| 18 to 34 Years | 121 (5.3%) | 126 (5.8%) |
| 35 to 64 Years | 49 (1.5%) | 0 (0.0%) |
| 65 to 74 Years | 0 (0.0%) | 0 (0.0%) |
| 75 Years and over | 11 (4.9%) | 21 (5.7%) |
Disability Class: Cognitive Difficulty
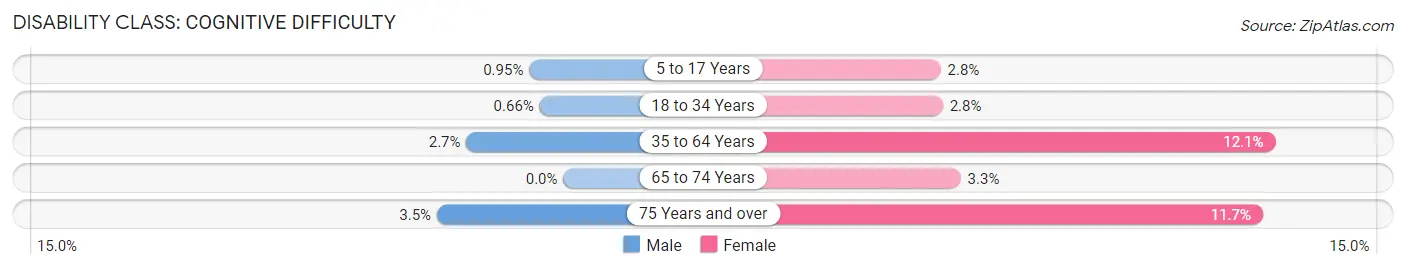
| Age Bracket | Male | Female |
| 5 to 17 Years | 17 (0.9%) | 58 (2.8%) |
| 18 to 34 Years | 15 (0.7%) | 61 (2.8%) |
| 35 to 64 Years | 90 (2.7%) | 400 (12.1%) |
| 65 to 74 Years | 0 (0.0%) | 17 (3.3%) |
| 75 Years and over | 8 (3.5%) | 43 (11.7%) |
Disability Class: Ambulatory Difficulty
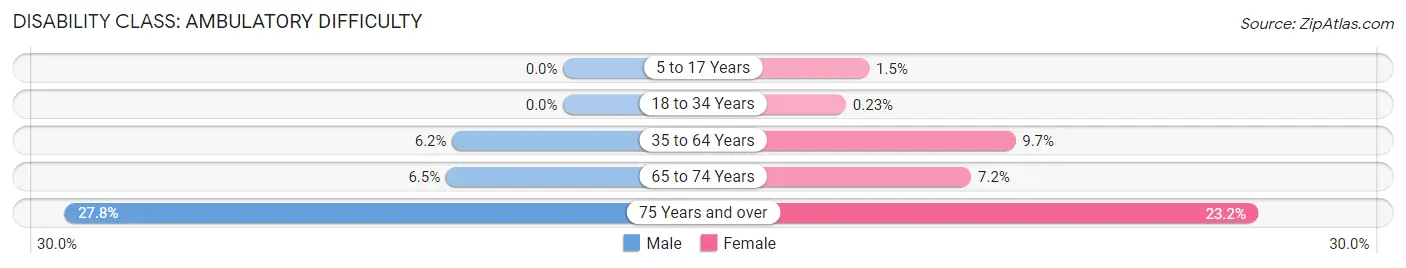
| Age Bracket | Male | Female |
| 5 to 17 Years | 0 (0.0%) | 32 (1.5%) |
| 18 to 34 Years | 0 (0.0%) | 5 (0.2%) |
| 35 to 64 Years | 206 (6.2%) | 320 (9.7%) |
| 65 to 74 Years | 34 (6.5%) | 37 (7.2%) |
| 75 Years and over | 63 (27.8%) | 85 (23.2%) |
Disability Class: Self-Care Difficulty
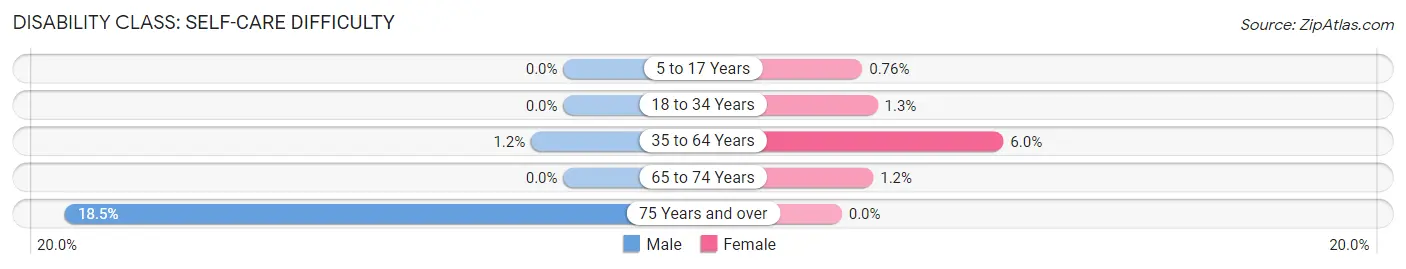
| Age Bracket | Male | Female |
| 5 to 17 Years | 0 (0.0%) | 16 (0.8%) |
| 18 to 34 Years | 0 (0.0%) | 29 (1.3%) |
| 35 to 64 Years | 40 (1.2%) | 199 (6.0%) |
| 65 to 74 Years | 0 (0.0%) | 6 (1.2%) |
| 75 Years and over | 42 (18.5%) | 0 (0.0%) |
Technology Access in Phelan
Computing Device Access in Phelan
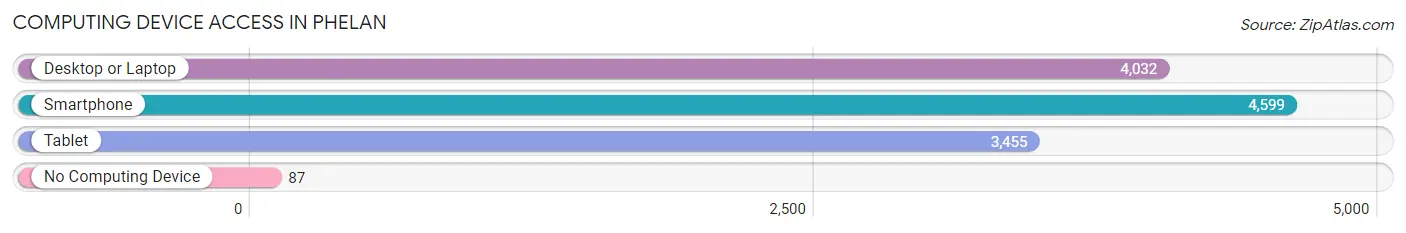
| Device Type | # Households | % Households |
| Desktop or Laptop | 4,032 | 81.8% |
| Smartphone | 4,599 | 93.3% |
| Tablet | 3,455 | 70.1% |
| No Computing Device | 87 | 1.8% |
| Total | 4,927 | 100.0% |
Internet Access in Phelan
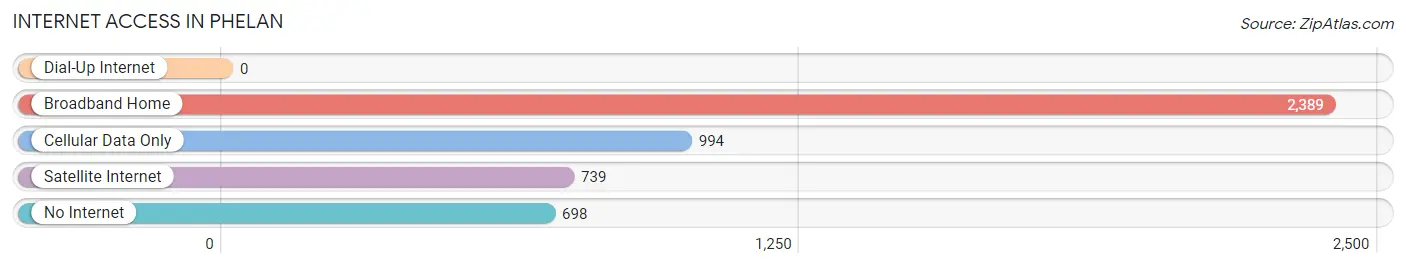
| Internet Type | # Households | % Households |
| Dial-Up Internet | 0 | 0.0% |
| Broadband Home | 2,389 | 48.5% |
| Cellular Data Only | 994 | 20.2% |
| Satellite Internet | 739 | 15.0% |
| No Internet | 698 | 14.2% |
| Total | 4,927 | 100.0% |
Phelan Summary
Phelan is a small unincorporated community located in the Mojave Desert of San Bernardino County, California. It is situated in the foothills of the San Gabriel Mountains, approximately 40 miles northeast of Los Angeles. The population of Phelan was estimated to be 8,722 in 2019.
History
Phelan was founded in 1910 by James Phelan, a former mayor of San Francisco. He purchased the land from the Southern Pacific Railroad and named it after himself. The town was initially a farming community, but it soon became a popular destination for people looking to escape the hustle and bustle of the city.
In the 1920s, Phelan began to attract people from the Los Angeles area who were looking for a place to get away from the city. The town was known for its clean air, wide open spaces, and beautiful views of the San Gabriel Mountains.
In the 1950s, Phelan began to experience a population boom as people moved to the area to escape the smog and congestion of Los Angeles. The town was incorporated in 1959 and has since become a popular destination for people looking for a rural lifestyle.
Geography
Phelan is located in the Mojave Desert of San Bernardino County, California. It is situated in the foothills of the San Gabriel Mountains, approximately 40 miles northeast of Los Angeles. The town is bordered by the cities of Pinon Hills to the north, Wrightwood to the east, and Victorville to the south.
The terrain of Phelan is mostly flat, with some rolling hills. The area is known for its wide open spaces and beautiful views of the San Gabriel Mountains. The climate is arid and semi-arid, with hot summers and mild winters.
Economy
Phelan’s economy is largely based on agriculture and tourism. The town is home to several farms and ranches, which produce a variety of crops, including alfalfa, hay, and vegetables. The area is also known for its horse ranches, which attract visitors from all over the world.
In addition to agriculture, Phelan is home to several businesses, including restaurants, gas stations, and convenience stores. The town is also home to a number of small manufacturing companies, which produce a variety of products, including furniture, clothing, and electronics.
Demographics
As of 2019, the population of Phelan was estimated to be 8,722. The racial makeup of the town was 79.3% White, 5.2% African American, 0.7% Native American, 0.7% Asian, 0.2% Pacific Islander, 11.2% from other races, and 2.7% from two or more races. Hispanic or Latino of any race were 22.2% of the population.
The median household income in Phelan was $50,945 in 2019. The per capita income was $21,945. The median age of the population was 36.7 years. The town had a poverty rate of 14.3%.
Conclusion
Phelan is a small unincorporated community located in the Mojave Desert of San Bernardino County, California. It is situated in the foothills of the San Gabriel Mountains, approximately 40 miles northeast of Los Angeles. The population of Phelan was estimated to be 8,722 in 2019. The town is known for its wide open spaces, beautiful views of the San Gabriel Mountains, and its rural lifestyle. The economy of Phelan is largely based on agriculture and tourism. The racial makeup of the town was 79.3% White, 5.2% African American, 0.7% Native American, 0.7% Asian, 0.2% Pacific Islander, 11.2% from other races, and 2.7% from two or more races. The median household income in Phelan was $50,945 in 2019.
Common Questions
What is Per Capita Income in Phelan?
Per Capita income in Phelan is $24,700.
What is the Median Family Income in Phelan?
Median Family Income in Phelan is $74,313.
What is the Median Household income in Phelan?
Median Household Income in Phelan is $74,853.
What is Income or Wage Gap in Phelan?
Income or Wage Gap in Phelan is 28.0%.
Women in Phelan earn 72.0 cents for every dollar earned by a man.
What is Family Income Deficit in Phelan?
Family Income Deficit in Phelan is $12,313.
Families that are below poverty line in Phelan earn $12,313 less on average than the poverty threshold level.
What is Inequality or Gini Index in Phelan?
Inequality or Gini Index in Phelan is 0.40.
What is the Total Population of Phelan?
Total Population of Phelan is 18,272.
What is the Total Male Population of Phelan?
Total Male Population of Phelan is 8,989.
What is the Total Female Population of Phelan?
Total Female Population of Phelan is 9,283.
What is the Ratio of Males per 100 Females in Phelan?
There are 96.83 Males per 100 Females in Phelan.
What is the Ratio of Females per 100 Males in Phelan?
There are 103.27 Females per 100 Males in Phelan.
What is the Median Population Age in Phelan?
Median Population Age in Phelan is 30.9 Years.
What is the Average Family Size in Phelan
Average Family Size in Phelan is 3.9 People.
What is the Average Household Size in Phelan
Average Household Size in Phelan is 3.7 People.
How Large is the Labor Force in Phelan?
There are 7,672 People in the Labor Forcein in Phelan.
What is the Percentage of People in the Labor Force in Phelan?
57.5% of People are in the Labor Force in Phelan.
What is the Unemployment Rate in Phelan?
Unemployment Rate in Phelan is 12.1%.