Zip Codes with the Highest Percentage of Population Employed in Arts, Entertainment & Recreation in Perris, CA
RELATED REPORTS & OPTIONS
Arts, Entertainment & Recreation
Perris
Compare Zip Codes
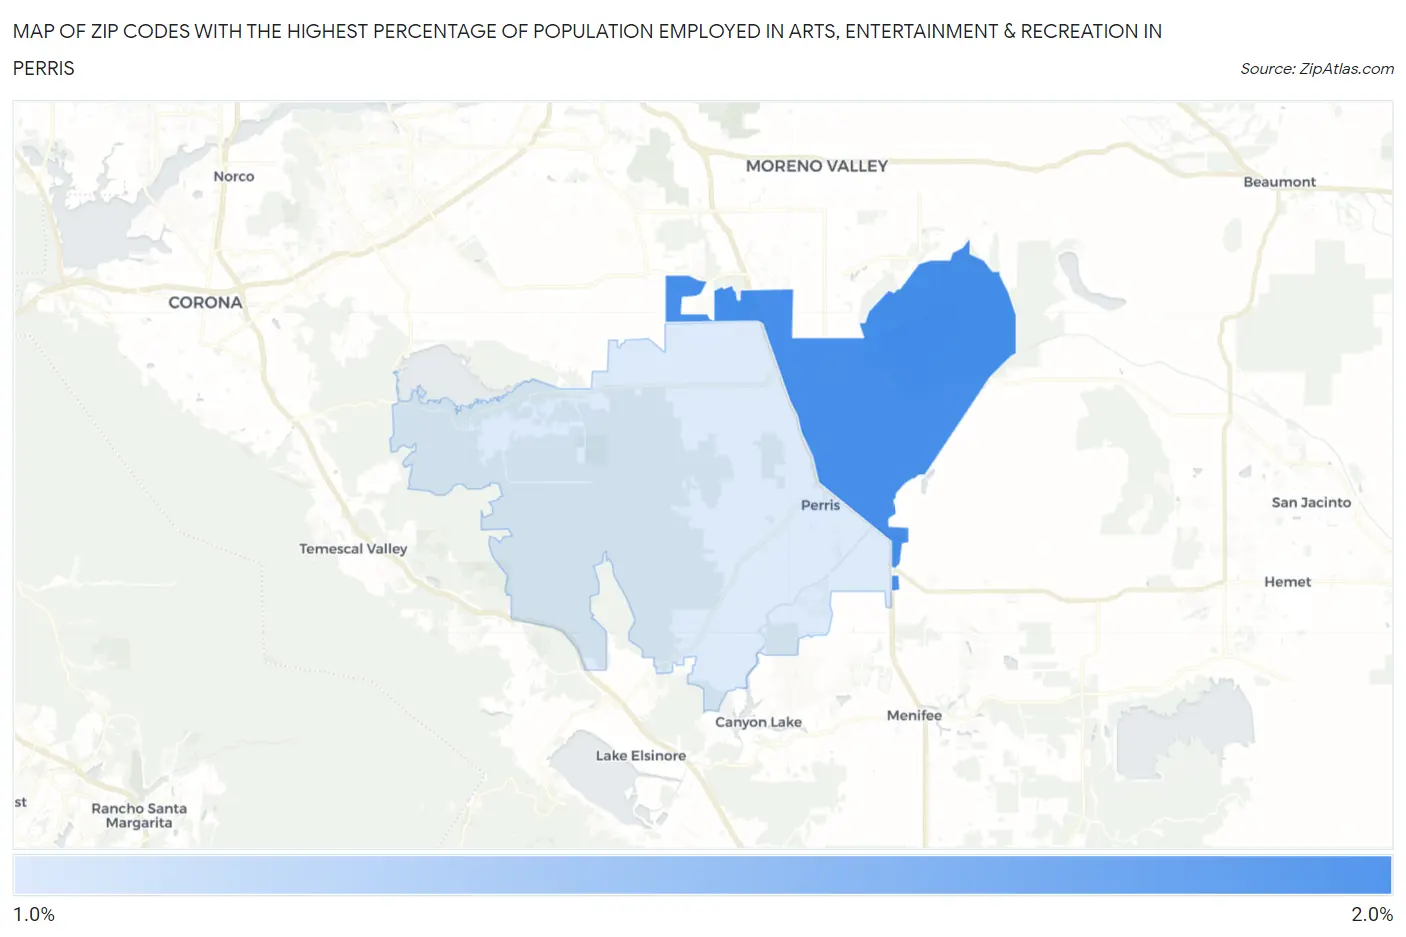
Map of Zip Codes with the Highest Percentage of Population Employed in Arts, Entertainment & Recreation in Perris
0.0%
2.0%
Zip Codes with the Highest Percentage of Population Employed in Arts, Entertainment & Recreation in Perris, CA
| Zip Code | % Employed | vs State | vs National | |
| 1. | 92571 | 1.9% | 2.6%(-0.621)#939 | 2.1%(-0.150)#10,171 |
| 2. | 92570 | 1.3% | 2.6%(-1.21)#1,182 | 2.1%(-0.738)#14,412 |
1
Common Questions
What are the Top Zip Codes with the Highest Percentage of Population Employed in Arts, Entertainment & Recreation in Perris, CA?
Top Zip Codes with the Highest Percentage of Population Employed in Arts, Entertainment & Recreation in Perris, CA are:
What zip code has the Highest Percentage of Population Employed in Arts, Entertainment & Recreation in Perris, CA?
92571 has the Highest Percentage of Population Employed in Arts, Entertainment & Recreation in Perris, CA with 1.9%.
What is the Percentage of Population Employed in Arts, Entertainment & Recreation in Perris, CA?
Percentage of Population Employed in Arts, Entertainment & Recreation in Perris is 2.0%.
What is the Percentage of Population Employed in Arts, Entertainment & Recreation in California?
Percentage of Population Employed in Arts, Entertainment & Recreation in California is 2.6%.
What is the Percentage of Population Employed in Arts, Entertainment & Recreation in the United States?
Percentage of Population Employed in Arts, Entertainment & Recreation in the United States is 2.1%.