Pala, CA Map & Demographics
Pala Map
Pala Overview
$37,680
PER CAPITA INCOME
$101,667
AVG FAMILY INCOME
$91,875
AVG HOUSEHOLD INCOME
12.0%
WAGE / INCOME GAP [ % ]
88.0¢/ $1
WAGE / INCOME GAP [ $ ]
$9,140
FAMILY INCOME DEFICIT
0.43
INEQUALITY / GINI INDEX
988
TOTAL POPULATION
427
MALE POPULATION
561
FEMALE POPULATION
76.11
MALES / 100 FEMALES
131.38
FEMALES / 100 MALES
31.7
MEDIAN AGE
3.9
AVG FAMILY SIZE
3.3
AVG HOUSEHOLD SIZE
332
LABOR FORCE [ PEOPLE ]
46.6%
PERCENT IN LABOR FORCE
7.5%
UNEMPLOYMENT RATE
Pala Zip Codes
Pala Area Codes
Income in Pala
Income Overview in Pala
Per Capita Income in Pala is $37,680, while median incomes of families and households are $101,667 and $91,875 respectively.
| Characteristic | Number | Measure |
| Per Capita Income | 988 | $37,680 |
| Median Family Income | 220 | $101,667 |
| Mean Family Income | 220 | $131,571 |
| Median Household Income | 296 | $91,875 |
| Mean Household Income | 296 | $120,364 |
| Income Deficit | 220 | $9,140 |
| Wage / Income Gap (%) | 988 | 12.01% |
| Wage / Income Gap ($) | 988 | 87.99¢ per $1 |
| Gini / Inequality Index | 988 | 0.43 |
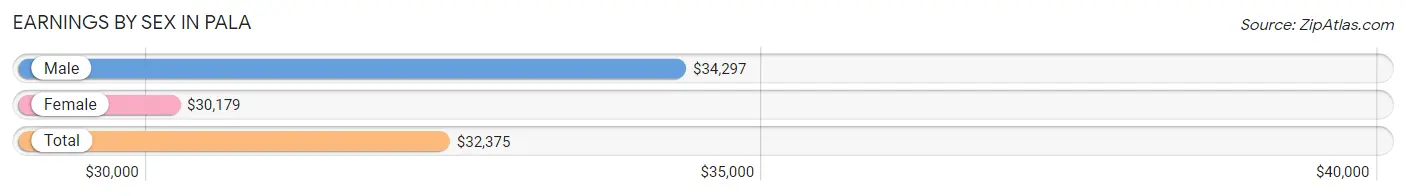
Earnings by Sex in Pala
Average Earnings in Pala are $32,375, $34,297 for men and $30,179 for women, a difference of 12.0%.
| Sex | Number | Average Earnings |
| Male | 173 (54.9%) | $34,297 |
| Female | 142 (45.1%) | $30,179 |
| Total | 315 (100.0%) | $32,375 |
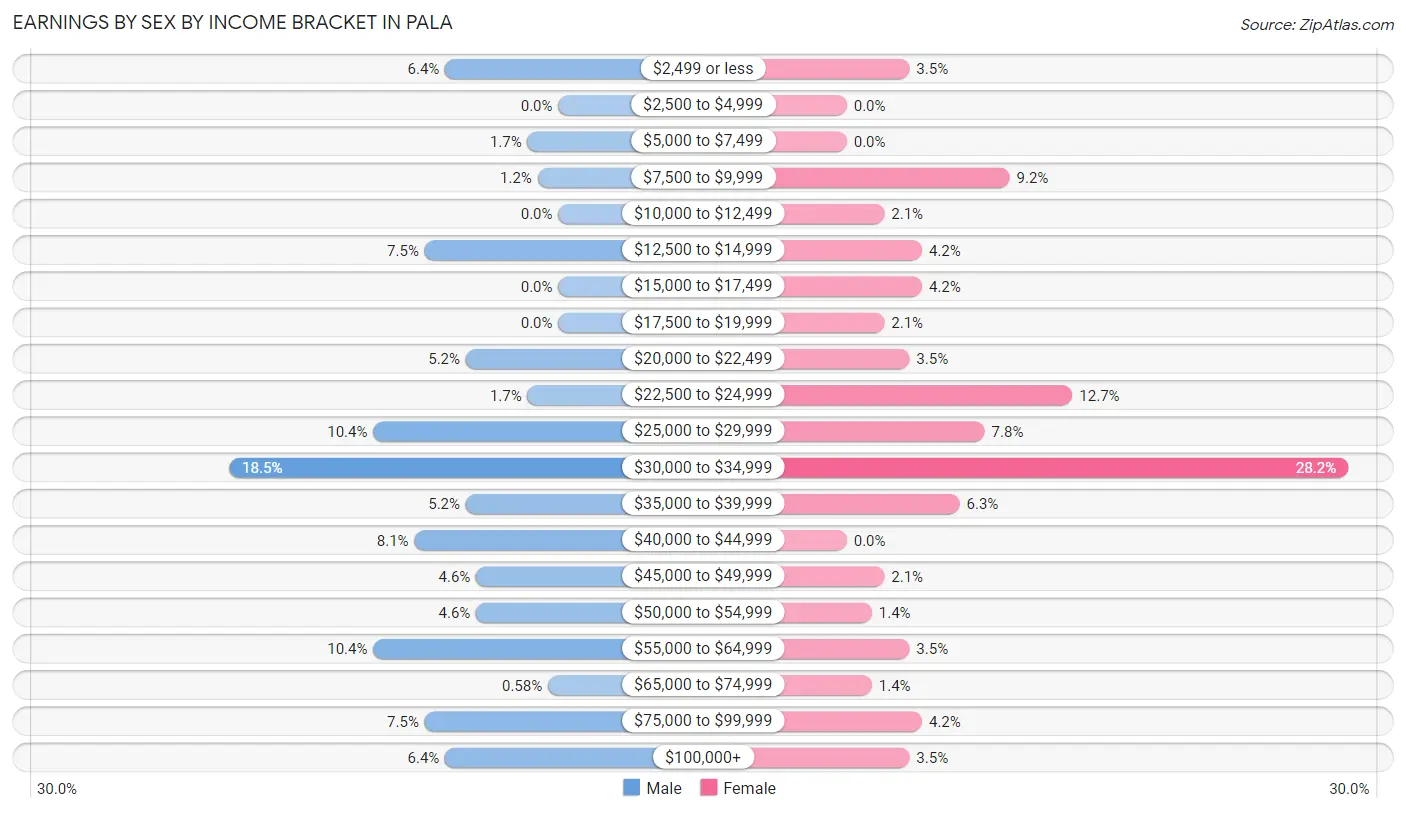
Earnings by Sex by Income Bracket in Pala
The most common earnings brackets in Pala are $30,000 to $34,999 for men (32 | 18.5%) and $30,000 to $34,999 for women (40 | 28.2%).
| Income | Male | Female |
| $2,499 or less | 11 (6.4%) | 5 (3.5%) |
| $2,500 to $4,999 | 0 (0.0%) | 0 (0.0%) |
| $5,000 to $7,499 | 3 (1.7%) | 0 (0.0%) |
| $7,500 to $9,999 | 2 (1.2%) | 13 (9.1%) |
| $10,000 to $12,499 | 0 (0.0%) | 3 (2.1%) |
| $12,500 to $14,999 | 13 (7.5%) | 6 (4.2%) |
| $15,000 to $17,499 | 0 (0.0%) | 6 (4.2%) |
| $17,500 to $19,999 | 0 (0.0%) | 3 (2.1%) |
| $20,000 to $22,499 | 9 (5.2%) | 5 (3.5%) |
| $22,500 to $24,999 | 3 (1.7%) | 18 (12.7%) |
| $25,000 to $29,999 | 18 (10.4%) | 11 (7.7%) |
| $30,000 to $34,999 | 32 (18.5%) | 40 (28.2%) |
| $35,000 to $39,999 | 9 (5.2%) | 9 (6.3%) |
| $40,000 to $44,999 | 14 (8.1%) | 0 (0.0%) |
| $45,000 to $49,999 | 8 (4.6%) | 3 (2.1%) |
| $50,000 to $54,999 | 8 (4.6%) | 2 (1.4%) |
| $55,000 to $64,999 | 18 (10.4%) | 5 (3.5%) |
| $65,000 to $74,999 | 1 (0.6%) | 2 (1.4%) |
| $75,000 to $99,999 | 13 (7.5%) | 6 (4.2%) |
| $100,000+ | 11 (6.4%) | 5 (3.5%) |
| Total | 173 (100.0%) | 142 (100.0%) |
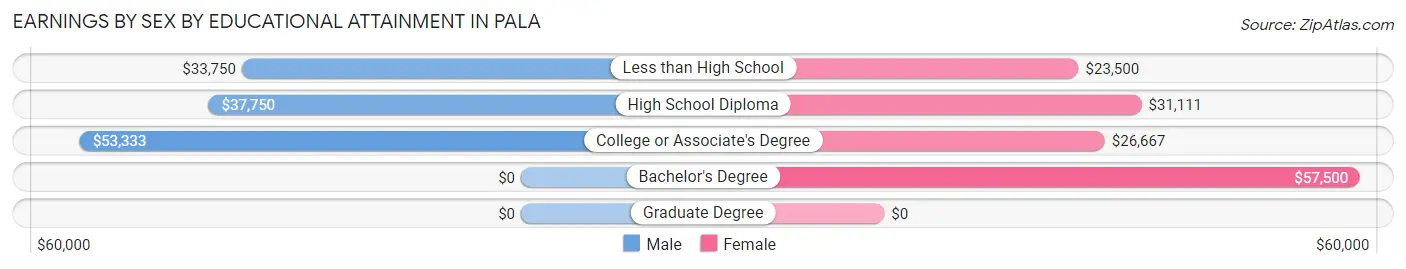
Earnings by Sex by Educational Attainment in Pala
Average earnings in Pala are $38,281 for men and $30,268 for women, a difference of 20.9%. Men with an educational attainment of college or associate's degree enjoy the highest average annual earnings of $53,333, while those with less than high school education earn the least with $33,750. Women with an educational attainment of bachelor's degree earn the most with the average annual earnings of $57,500, while those with less than high school education have the smallest earnings of $23,500.
| Educational Attainment | Male Income | Female Income |
| Less than High School | $33,750 | $23,500 |
| High School Diploma | $37,750 | $31,111 |
| College or Associate's Degree | $53,333 | $26,667 |
| Bachelor's Degree | - | - |
| Graduate Degree | - | - |
| Total | $38,281 | $30,268 |
Family Income in Pala
Family Income Brackets in Pala
According to the Pala family income data, there are 40 families falling into the $100,000 to $149,999 income range, which is the most common income bracket and makes up 18.2% of all families.
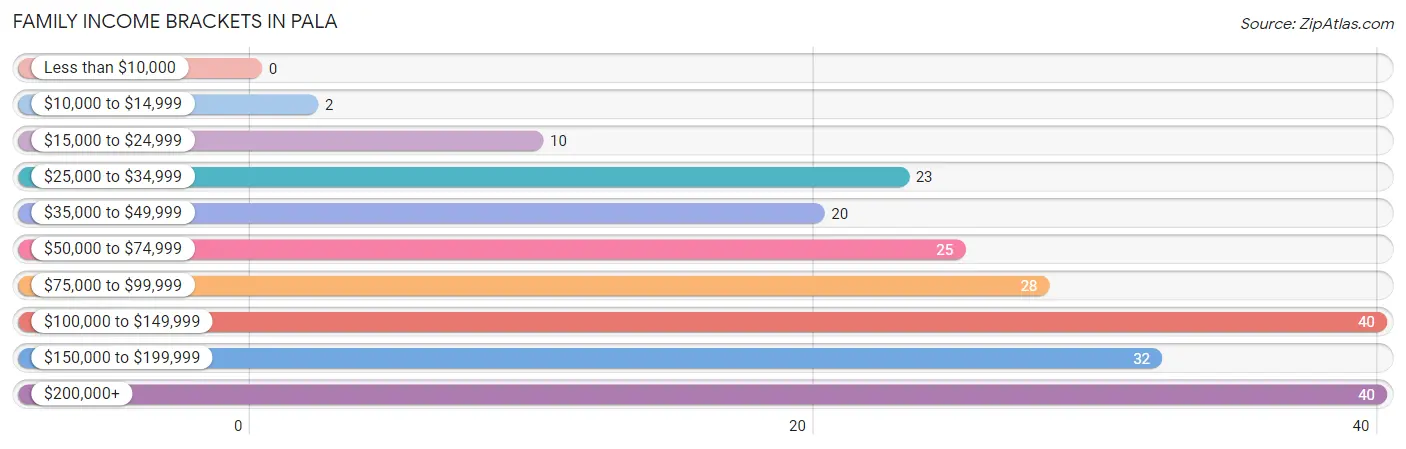
| Income Bracket | # Families | % Families |
| Less than $10,000 | 0 | 0.0% |
| $10,000 to $14,999 | 2 | 0.9% |
| $15,000 to $24,999 | 10 | 4.5% |
| $25,000 to $34,999 | 23 | 10.5% |
| $35,000 to $49,999 | 20 | 9.1% |
| $50,000 to $74,999 | 25 | 11.4% |
| $75,000 to $99,999 | 28 | 12.7% |
| $100,000 to $149,999 | 40 | 18.2% |
| $150,000 to $199,999 | 32 | 14.5% |
| $200,000+ | 40 | 18.2% |
Family Income by Famaliy Size in Pala
7+ person families (28 | 12.7%) account for the highest median family income in Pala with $250,001 per family, while 2-person families (49 | 22.3%) have the highest median income of $36,562 per family member.
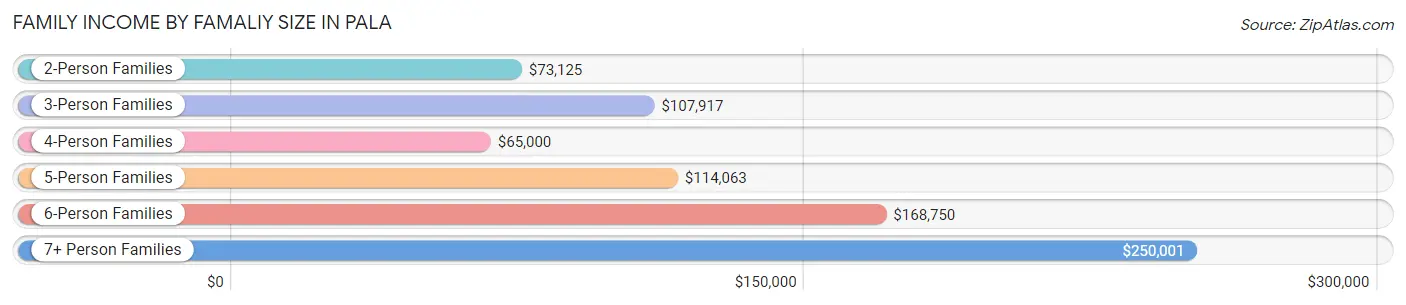
| Income Bracket | # Families | Median Income |
| 2-Person Families | 49 (22.3%) | $73,125 |
| 3-Person Families | 47 (21.4%) | $107,917 |
| 4-Person Families | 56 (25.5%) | $65,000 |
| 5-Person Families | 25 (11.4%) | $114,063 |
| 6-Person Families | 15 (6.8%) | $168,750 |
| 7+ Person Families | 28 (12.7%) | $250,001 |
| Total | 220 (100.0%) | $101,667 |
Family Income by Number of Earners in Pala
The median family income in Pala is $101,667, with families comprising 3+ earners (26) having the highest median family income of $133,000, while families with 1 earner (48) have the lowest median family income of $56,667, accounting for 11.8% and 21.8% of families, respectively.
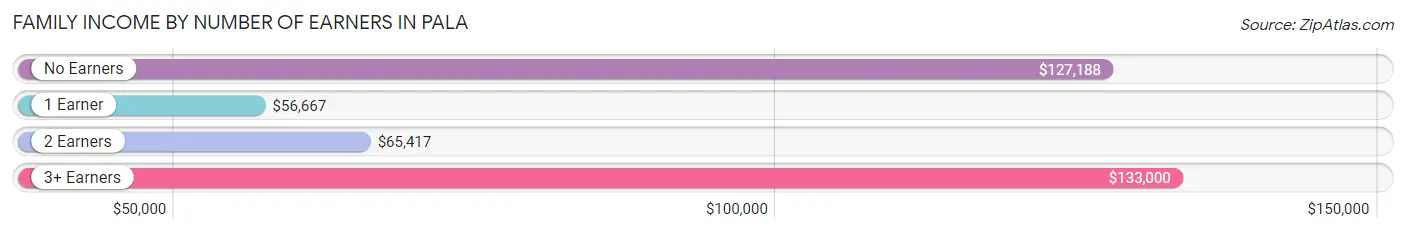
| Number of Earners | # Families | Median Income |
| No Earners | 93 (42.3%) | $127,188 |
| 1 Earner | 48 (21.8%) | $56,667 |
| 2 Earners | 53 (24.1%) | $65,417 |
| 3+ Earners | 26 (11.8%) | $133,000 |
| Total | 220 (100.0%) | $101,667 |
Household Income in Pala
Household Income Brackets in Pala
With 54 households falling in the category, the $100,000 to $149,999 income range is the most frequent in Pala, accounting for 18.2% of all households. In contrast, only 3 households (1.0%) fall into the less than $10,000 income bracket, making it the least populous group.
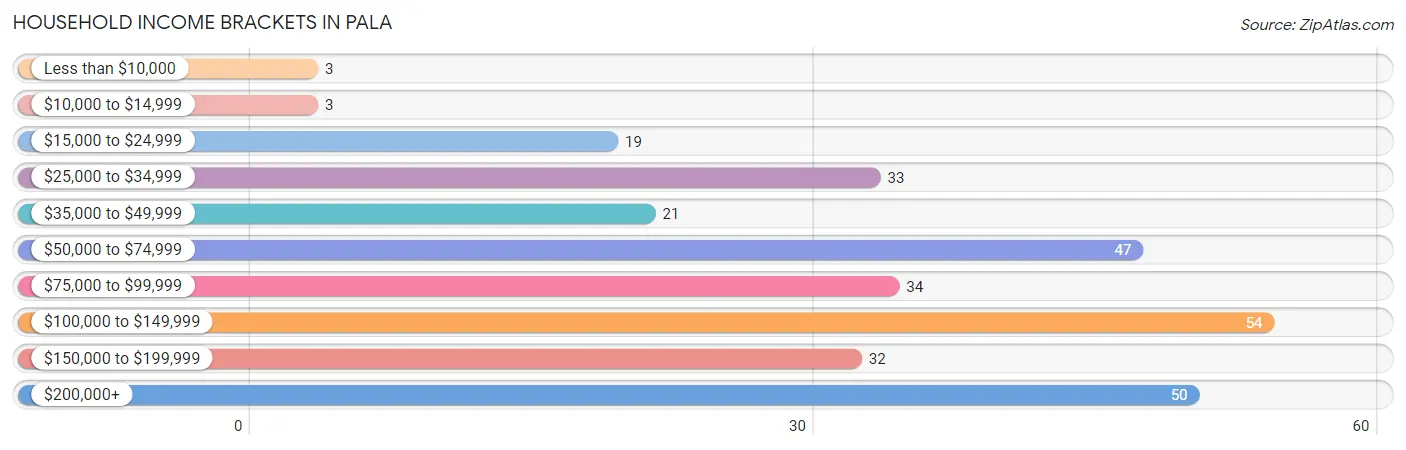
| Income Bracket | # Households | % Households |
| Less than $10,000 | 3 | 1.0% |
| $10,000 to $14,999 | 3 | 1.0% |
| $15,000 to $24,999 | 19 | 6.4% |
| $25,000 to $34,999 | 33 | 11.1% |
| $35,000 to $49,999 | 21 | 7.1% |
| $50,000 to $74,999 | 47 | 15.9% |
| $75,000 to $99,999 | 34 | 11.5% |
| $100,000 to $149,999 | 54 | 18.2% |
| $150,000 to $199,999 | 32 | 10.8% |
| $200,000+ | 50 | 16.9% |
Household Income by Householder Age in Pala
The median household income in Pala is $91,875, with the highest median household income of $100,714 found in the 65+ years age bracket for the primary householder. A total of 80 households (27.0%) fall into this category. Meanwhile, the 15 to 24 years age bracket for the primary householder has the lowest median household income of $0, with 5 households (1.7%) in this group.
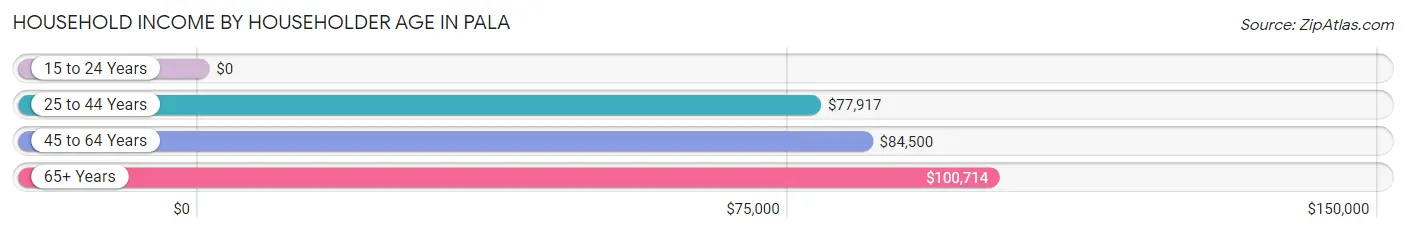
| Income Bracket | # Households | Median Income |
| 15 to 24 Years | 5 (1.7%) | $0 |
| 25 to 44 Years | 89 (30.1%) | $77,917 |
| 45 to 64 Years | 122 (41.2%) | $84,500 |
| 65+ Years | 80 (27.0%) | $100,714 |
| Total | 296 (100.0%) | $91,875 |
Poverty in Pala
Income Below Poverty by Sex and Age in Pala
With 11.8% poverty level for males and 14.3% for females among the residents of Pala, 35 to 44 year old males and 12 to 14 year old females are the most vulnerable to poverty, with 15 males (30.6%) and 14 females (37.8%) in their respective age groups living below the poverty level.
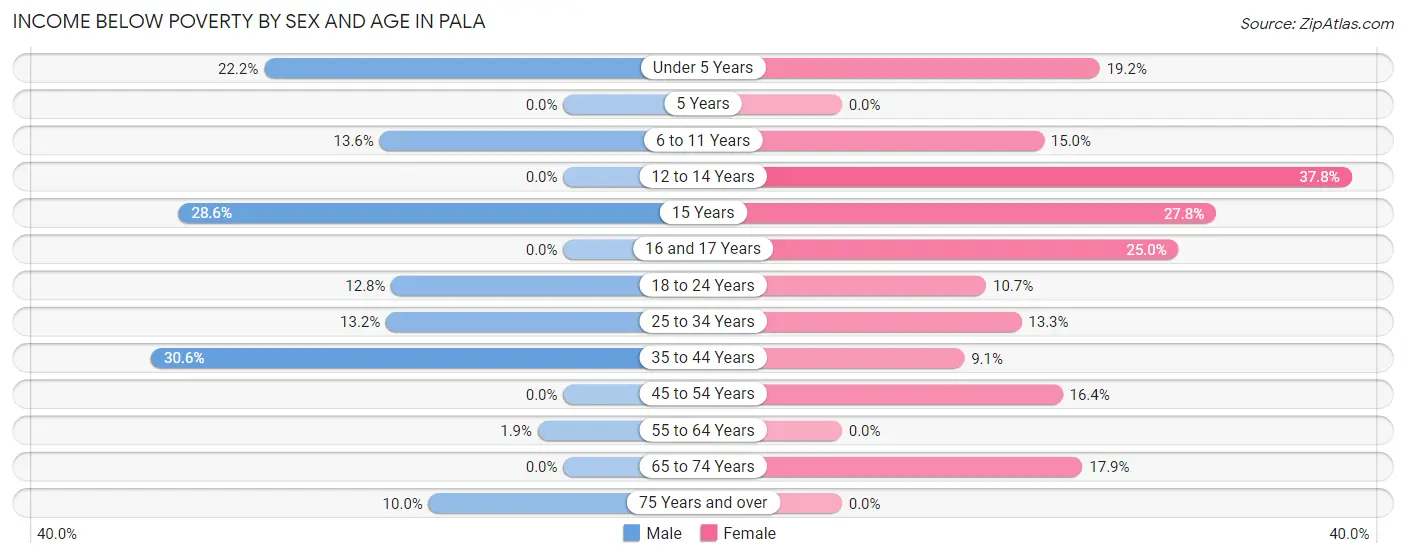
| Age Bracket | Male | Female |
| Under 5 Years | 10 (22.2%) | 9 (19.2%) |
| 5 Years | 0 (0.0%) | 0 (0.0%) |
| 6 to 11 Years | 6 (13.6%) | 6 (15.0%) |
| 12 to 14 Years | 0 (0.0%) | 14 (37.8%) |
| 15 Years | 4 (28.6%) | 5 (27.8%) |
| 16 and 17 Years | 0 (0.0%) | 7 (25.0%) |
| 18 to 24 Years | 6 (12.8%) | 9 (10.7%) |
| 25 to 34 Years | 5 (13.2%) | 10 (13.3%) |
| 35 to 44 Years | 15 (30.6%) | 5 (9.1%) |
| 45 to 54 Years | 0 (0.0%) | 10 (16.4%) |
| 55 to 64 Years | 1 (1.9%) | 0 (0.0%) |
| 65 to 74 Years | 0 (0.0%) | 5 (17.9%) |
| 75 Years and over | 3 (10.0%) | 0 (0.0%) |
| Total | 50 (11.8%) | 80 (14.3%) |
Income Above Poverty by Sex and Age in Pala
According to the poverty statistics in Pala, males aged 5 years and females aged 55 to 64 years are the age groups that are most secure financially, with 100.0% of males and 100.0% of females in these age groups living above the poverty line.
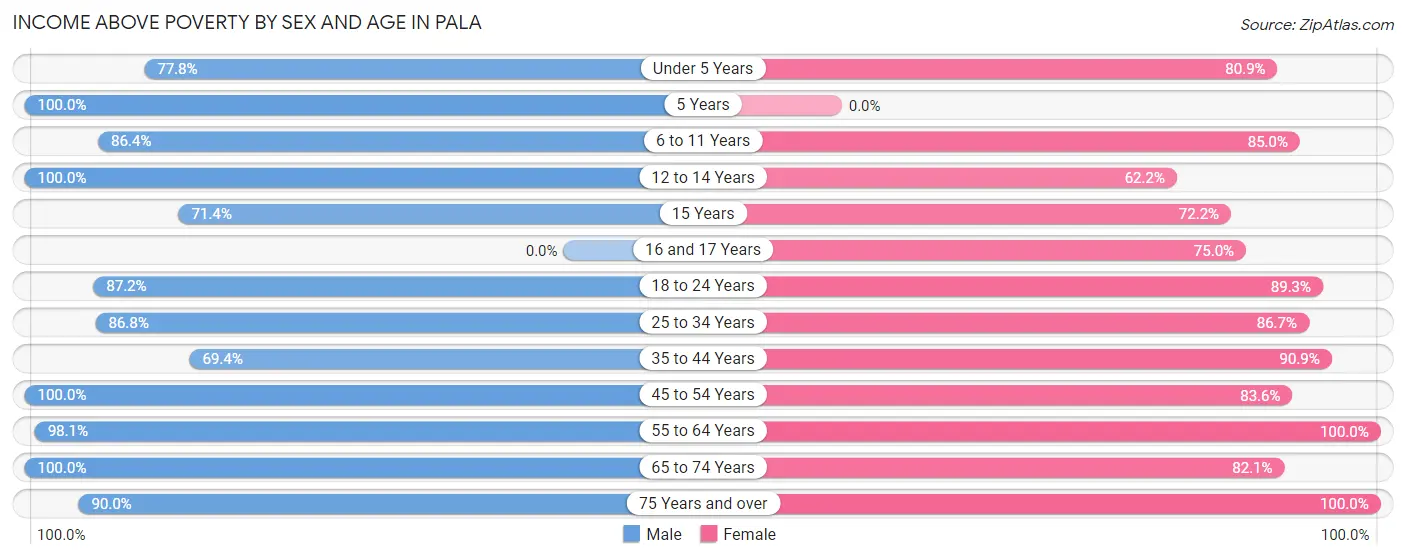
| Age Bracket | Male | Female |
| Under 5 Years | 35 (77.8%) | 38 (80.8%) |
| 5 Years | 8 (100.0%) | 0 (0.0%) |
| 6 to 11 Years | 38 (86.4%) | 34 (85.0%) |
| 12 to 14 Years | 16 (100.0%) | 23 (62.2%) |
| 15 Years | 10 (71.4%) | 13 (72.2%) |
| 16 and 17 Years | 0 (0.0%) | 21 (75.0%) |
| 18 to 24 Years | 41 (87.2%) | 75 (89.3%) |
| 25 to 34 Years | 33 (86.8%) | 65 (86.7%) |
| 35 to 44 Years | 34 (69.4%) | 50 (90.9%) |
| 45 to 54 Years | 59 (100.0%) | 51 (83.6%) |
| 55 to 64 Years | 52 (98.1%) | 60 (100.0%) |
| 65 to 74 Years | 21 (100.0%) | 23 (82.1%) |
| 75 Years and over | 27 (90.0%) | 25 (100.0%) |
| Total | 374 (88.2%) | 478 (85.7%) |
Income Below Poverty Among Married-Couple Families in Pala
The poverty statistics for married-couple families in Pala show that 8.9% or 11 of the total 124 families live below the poverty line. Families with 5 or more children have the highest poverty rate of 66.7%, comprising of 4 families. On the other hand, families with no children have the lowest poverty rate of 0.0%, which includes 0 families.
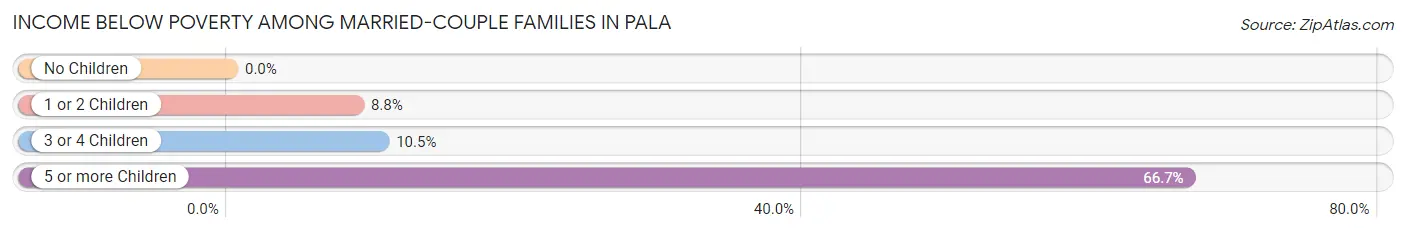
| Children | Above Poverty | Below Poverty |
| No Children | 42 (100.0%) | 0 (0.0%) |
| 1 or 2 Children | 52 (91.2%) | 5 (8.8%) |
| 3 or 4 Children | 17 (89.5%) | 2 (10.5%) |
| 5 or more Children | 2 (33.3%) | 4 (66.7%) |
| Total | 113 (91.1%) | 11 (8.9%) |
Income Below Poverty Among Single-Parent Households in Pala
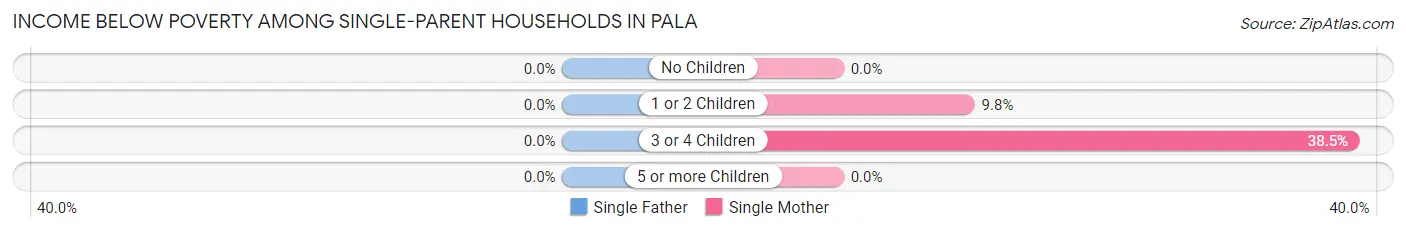
| Children | Single Father | Single Mother |
| No Children | 0 (0.0%) | 0 (0.0%) |
| 1 or 2 Children | 0 (0.0%) | 4 (9.8%) |
| 3 or 4 Children | 0 (0.0%) | 5 (38.5%) |
| 5 or more Children | 0 (0.0%) | 0 (0.0%) |
| Total | 0 (0.0%) | 9 (12.7%) |
Income Below Poverty Among Married-Couple vs Single-Parent Households in Pala
The poverty data for Pala shows that 11 of the married-couple family households (8.9%) and 9 of the single-parent households (9.4%) are living below the poverty level. Within the married-couple family households, those with 5 or more children have the highest poverty rate, with 4 households (66.7%) falling below the poverty line. Among the single-parent households, those with 3 or 4 children have the highest poverty rate, with 5 household (27.8%) living below poverty.
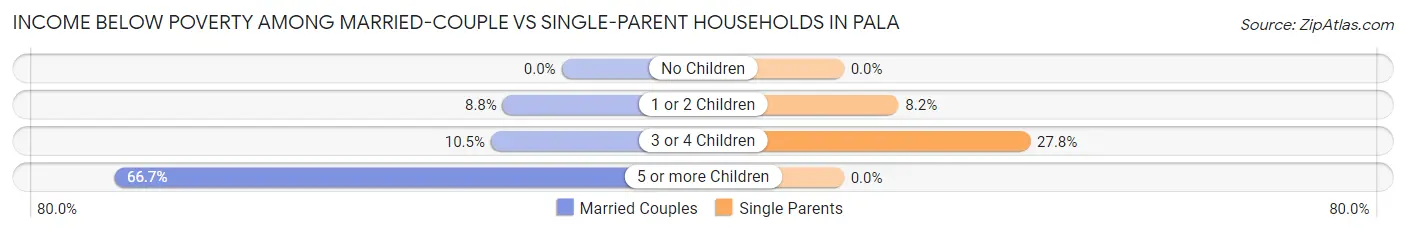
| Children | Married-Couple Families | Single-Parent Households |
| No Children | 0 (0.0%) | 0 (0.0%) |
| 1 or 2 Children | 5 (8.8%) | 4 (8.2%) |
| 3 or 4 Children | 2 (10.5%) | 5 (27.8%) |
| 5 or more Children | 4 (66.7%) | 0 (0.0%) |
| Total | 11 (8.9%) | 9 (9.4%) |
Race in Pala
The most populous races in Pala are Hispanic or Latino (473 | 47.9%), Native / Alaskan (440 | 44.5%), and Two or more Races (333 | 33.7%).
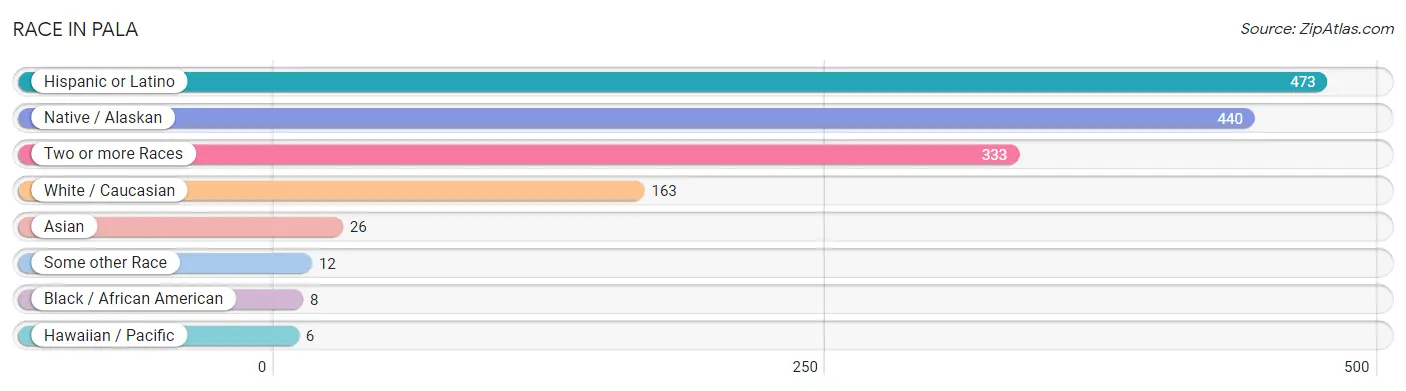
| Race | # Population | % Population |
| Asian | 26 | 2.6% |
| Black / African American | 8 | 0.8% |
| Hawaiian / Pacific | 6 | 0.6% |
| Hispanic or Latino | 473 | 47.9% |
| Native / Alaskan | 440 | 44.5% |
| White / Caucasian | 163 | 16.5% |
| Two or more Races | 333 | 33.7% |
| Some other Race | 12 | 1.2% |
| Total | 988 | 100.0% |
Ancestry in Pala
The most populous ancestries reported in Pala are Mexican (456 | 46.2%), Korean (23 | 2.3%), Welsh (9 | 0.9%), English (7 | 0.7%), and Irish (6 | 0.6%), together accounting for 50.7% of all Pala residents.
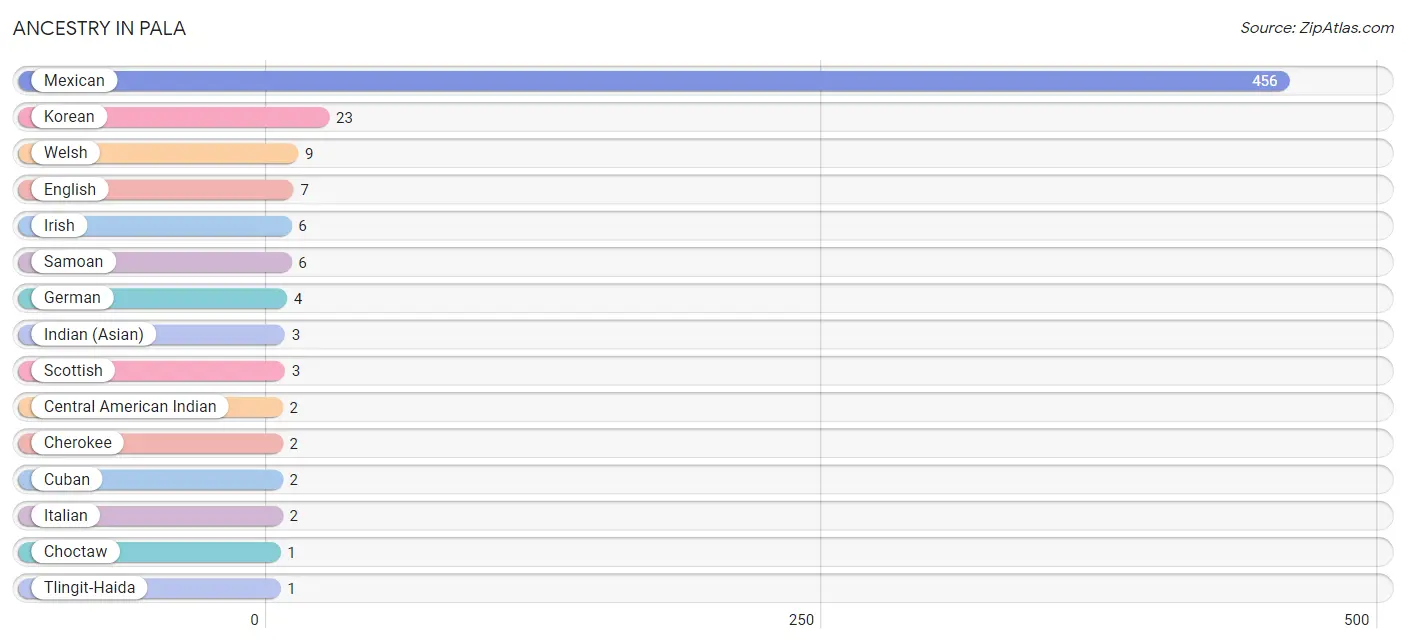
| Ancestry | # Population | % Population |
| Central American Indian | 2 | 0.2% |
| Cherokee | 2 | 0.2% |
| Choctaw | 1 | 0.1% |
| Cuban | 2 | 0.2% |
| English | 7 | 0.7% |
| German | 4 | 0.4% |
| Indian (Asian) | 3 | 0.3% |
| Irish | 6 | 0.6% |
| Italian | 2 | 0.2% |
| Korean | 23 | 2.3% |
| Mexican | 456 | 46.2% |
| Samoan | 6 | 0.6% |
| Scottish | 3 | 0.3% |
| Tlingit-Haida | 1 | 0.1% |
| Welsh | 9 | 0.9% | View All 15 Rows |
Immigrants in Pala
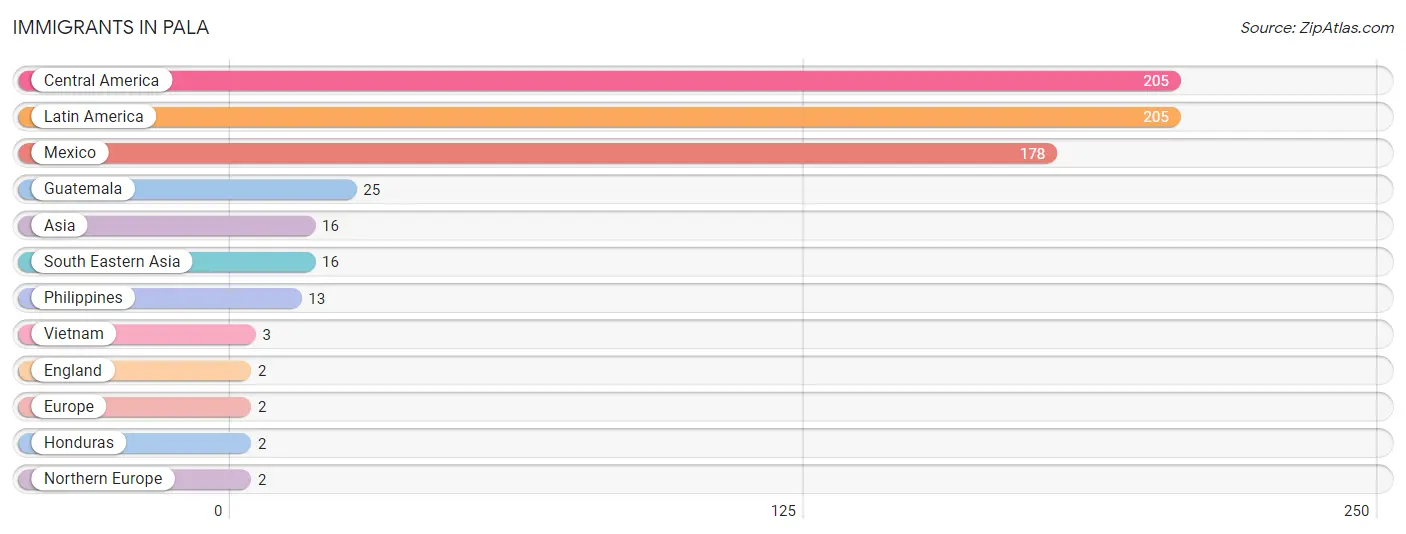
The most numerous immigrant groups reported in Pala came from Central America (205 | 20.7%), Latin America (205 | 20.7%), Mexico (178 | 18.0%), Guatemala (25 | 2.5%), and Asia (16 | 1.6%), together accounting for 63.7% of all Pala residents.
| Immigration Origin | # Population | % Population |
| Asia | 16 | 1.6% |
| Central America | 205 | 20.7% |
| England | 2 | 0.2% |
| Europe | 2 | 0.2% |
| Guatemala | 25 | 2.5% |
| Honduras | 2 | 0.2% |
| Latin America | 205 | 20.7% |
| Mexico | 178 | 18.0% |
| Northern Europe | 2 | 0.2% |
| Philippines | 13 | 1.3% |
| South Eastern Asia | 16 | 1.6% |
| Vietnam | 3 | 0.3% | View All 12 Rows |
Sex and Age in Pala
Sex and Age in Pala
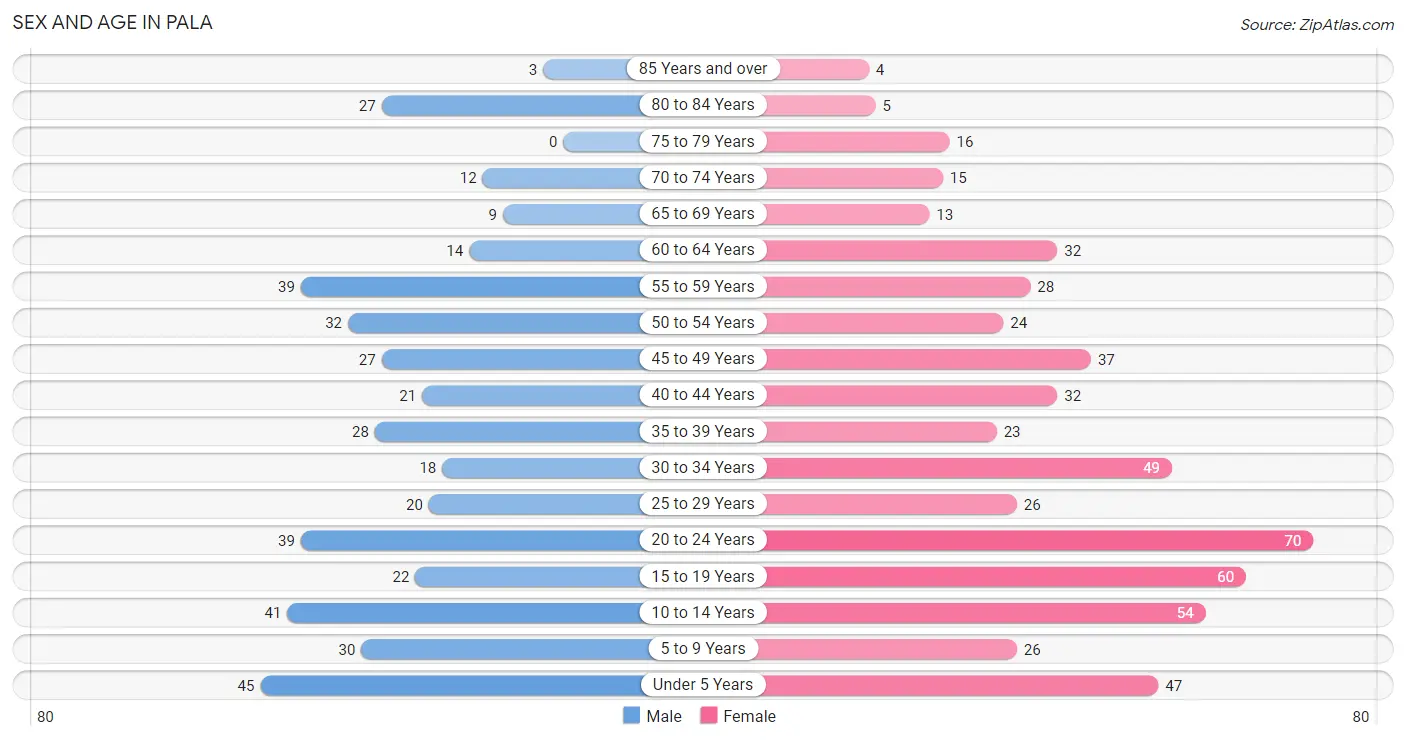
The most populous age groups in Pala are Under 5 Years (45 | 10.5%) for men and 20 to 24 Years (70 | 12.5%) for women.
| Age Bracket | Male | Female |
| Under 5 Years | 45 (10.5%) | 47 (8.4%) |
| 5 to 9 Years | 30 (7.0%) | 26 (4.6%) |
| 10 to 14 Years | 41 (9.6%) | 54 (9.6%) |
| 15 to 19 Years | 22 (5.1%) | 60 (10.7%) |
| 20 to 24 Years | 39 (9.1%) | 70 (12.5%) |
| 25 to 29 Years | 20 (4.7%) | 26 (4.6%) |
| 30 to 34 Years | 18 (4.2%) | 49 (8.7%) |
| 35 to 39 Years | 28 (6.6%) | 23 (4.1%) |
| 40 to 44 Years | 21 (4.9%) | 32 (5.7%) |
| 45 to 49 Years | 27 (6.3%) | 37 (6.6%) |
| 50 to 54 Years | 32 (7.5%) | 24 (4.3%) |
| 55 to 59 Years | 39 (9.1%) | 28 (5.0%) |
| 60 to 64 Years | 14 (3.3%) | 32 (5.7%) |
| 65 to 69 Years | 9 (2.1%) | 13 (2.3%) |
| 70 to 74 Years | 12 (2.8%) | 15 (2.7%) |
| 75 to 79 Years | 0 (0.0%) | 16 (2.9%) |
| 80 to 84 Years | 27 (6.3%) | 5 (0.9%) |
| 85 Years and over | 3 (0.7%) | 4 (0.7%) |
| Total | 427 (100.0%) | 561 (100.0%) |
Families and Households in Pala
Median Family Size in Pala
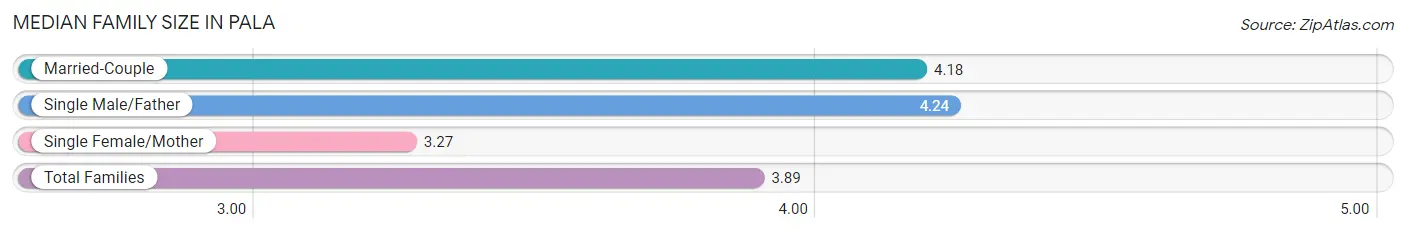
The median family size in Pala is 3.89 persons per family, with single male/father families (25 | 11.4%) accounting for the largest median family size of 4.24 persons per family. On the other hand, single female/mother families (71 | 32.3%) represent the smallest median family size with 3.27 persons per family.
| Family Type | # Families | Family Size |
| Married-Couple | 124 (56.4%) | 4.18 |
| Single Male/Father | 25 (11.4%) | 4.24 |
| Single Female/Mother | 71 (32.3%) | 3.27 |
| Total Families | 220 (100.0%) | 3.89 |
Median Household Size in Pala
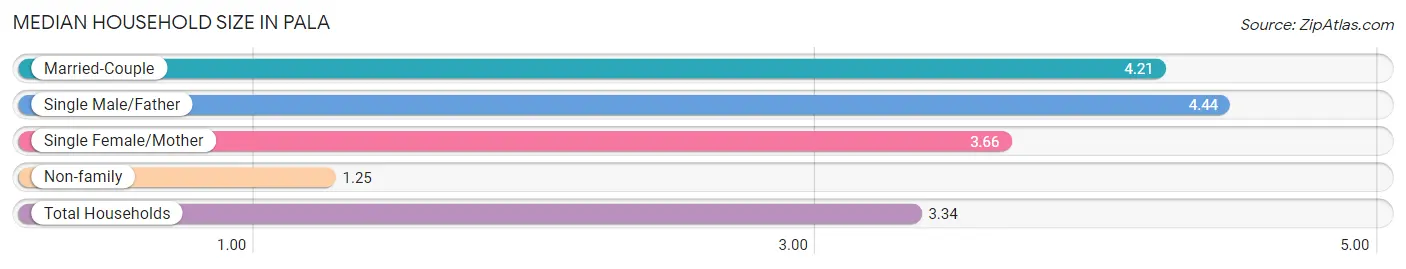
The median household size in Pala is 3.34 persons per household, with single male/father households (25 | 8.5%) accounting for the largest median household size of 4.44 persons per household. non-family households (76 | 25.7%) represent the smallest median household size with 1.25 persons per household.
| Household Type | # Households | Household Size |
| Married-Couple | 124 (41.9%) | 4.21 |
| Single Male/Father | 25 (8.5%) | 4.44 |
| Single Female/Mother | 71 (24.0%) | 3.66 |
| Non-family | 76 (25.7%) | 1.25 |
| Total Households | 296 (100.0%) | 3.34 |
Household Size by Marriage Status in Pala
Out of a total of 296 households in Pala, 220 (74.3%) are family households, while 76 (25.7%) are nonfamily households. The most numerous type of family households are 3-person households, comprising 55, and the most common type of nonfamily households are 1-person households, comprising 66.
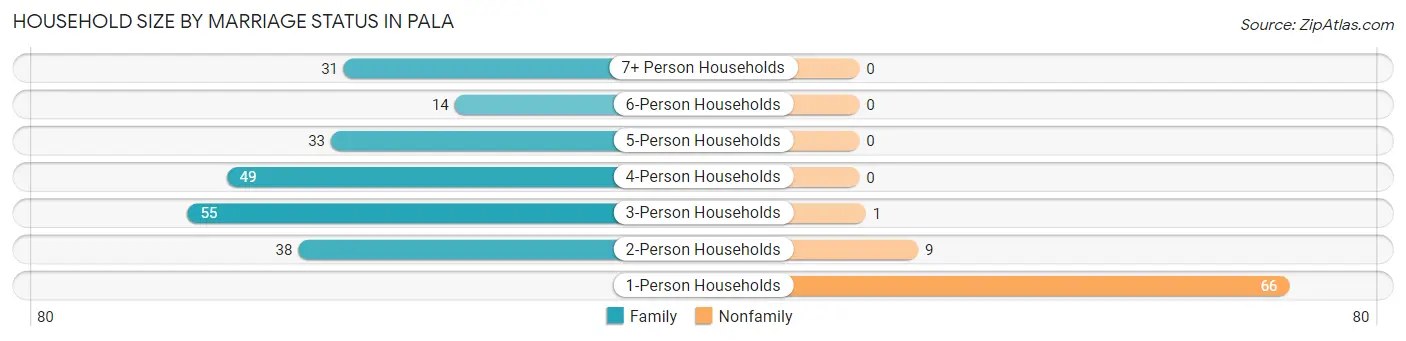
| Household Size | Family Households | Nonfamily Households |
| 1-Person Households | - | 66 (22.3%) |
| 2-Person Households | 38 (12.8%) | 9 (3.0%) |
| 3-Person Households | 55 (18.6%) | 1 (0.3%) |
| 4-Person Households | 49 (16.6%) | 0 (0.0%) |
| 5-Person Households | 33 (11.2%) | 0 (0.0%) |
| 6-Person Households | 14 (4.7%) | 0 (0.0%) |
| 7+ Person Households | 31 (10.5%) | 0 (0.0%) |
| Total | 220 (74.3%) | 76 (25.7%) |
Female Fertility in Pala
Fertility by Age in Pala
Average fertility rate in Pala is 73.0 births per 1,000 women. Women in the age bracket of 20 to 34 years have the highest fertility rate with 138.0 births per 1,000 women. Women in the age bracket of 20 to 34 years acount for 90.9% of all women with births.
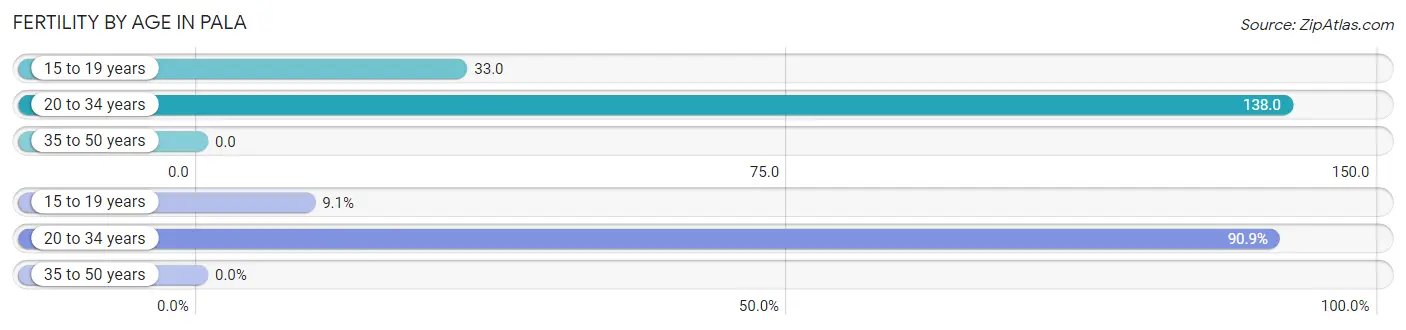
| Age Bracket | Women with Births | Births / 1,000 Women |
| 15 to 19 years | 2 (9.1%) | 33.0 |
| 20 to 34 years | 20 (90.9%) | 138.0 |
| 35 to 50 years | 0 (0.0%) | 0.0 |
| Total | 22 (100.0%) | 73.0 |
Fertility by Age by Marriage Status in Pala
9.1% of women with births (22) in Pala are married. The highest percentage of unmarried women with births falls into 15 to 19 years age bracket with 100.0% of them unmarried at the time of birth, while the lowest percentage of unmarried women with births belong to 20 to 34 years age bracket with 90.0% of them unmarried.
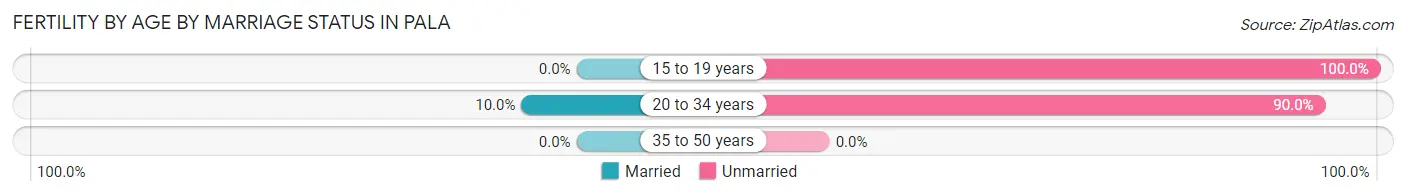
| Age Bracket | Married | Unmarried |
| 15 to 19 years | 0 (0.0%) | 2 (100.0%) |
| 20 to 34 years | 2 (10.0%) | 18 (90.0%) |
| 35 to 50 years | 0 (0.0%) | 0 (0.0%) |
| Total | 2 (9.1%) | 20 (90.9%) |
Fertility by Education in Pala
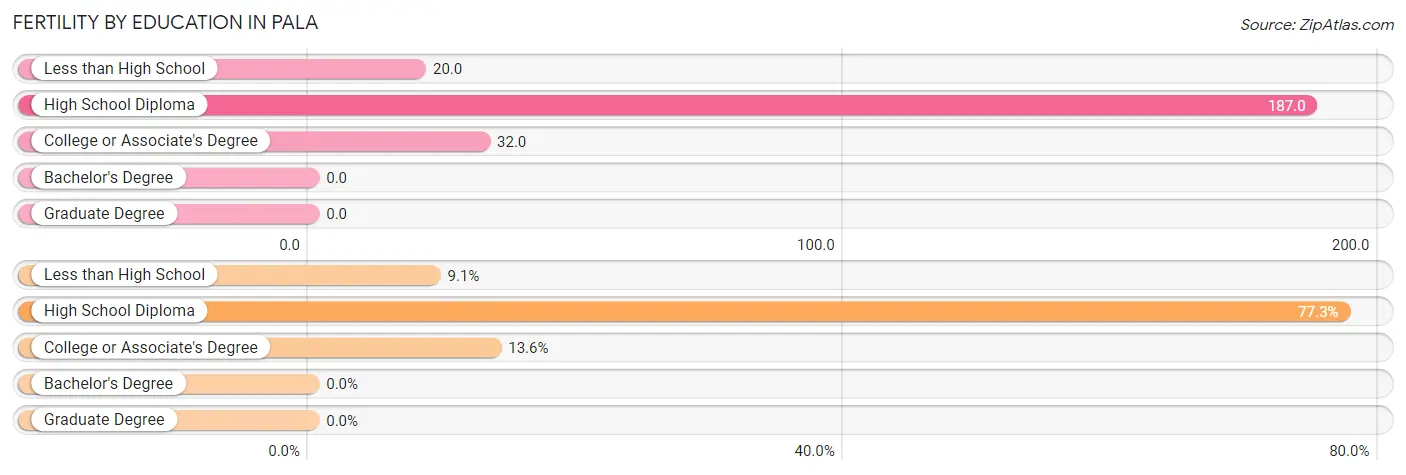
| Educational Attainment | Women with Births | Births / 1,000 Women |
| Less than High School | 2 (9.1%) | 20.0 |
| High School Diploma | 17 (77.3%) | 187.0 |
| College or Associate's Degree | 3 (13.6%) | 32.0 |
| Bachelor's Degree | 0 (0.0%) | 0.0 |
| Graduate Degree | 0 (0.0%) | 0.0 |
| Total | 22 (100.0%) | 73.0 |
Fertility by Education by Marriage Status in Pala
90.9% of women with births in Pala are unmarried. Women with the educational attainment of high school diploma are most likely to be married with 11.8% of them married at childbirth, while women with the educational attainment of less than high school are least likely to be married with 100.0% of them unmarried at childbirth.
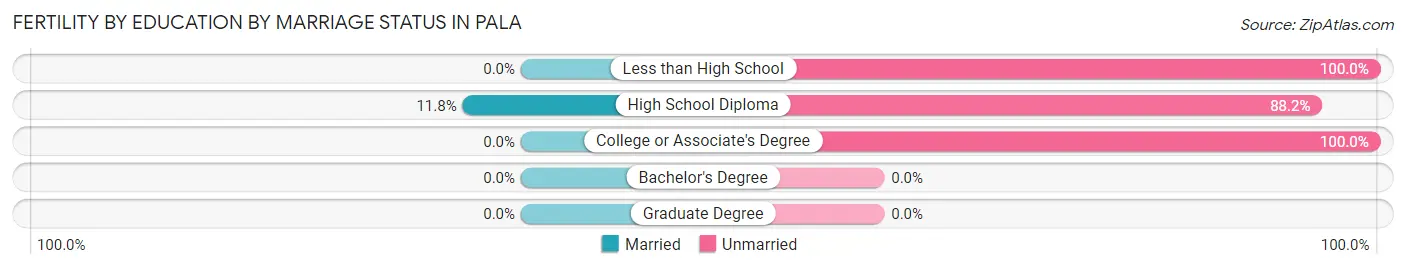
| Educational Attainment | Married | Unmarried |
| Less than High School | 0 (0.0%) | 2 (100.0%) |
| High School Diploma | 2 (11.8%) | 15 (88.2%) |
| College or Associate's Degree | 0 (0.0%) | 3 (100.0%) |
| Bachelor's Degree | 0 (0.0%) | 0 (0.0%) |
| Graduate Degree | 0 (0.0%) | 0 (0.0%) |
| Total | 2 (9.1%) | 20 (90.9%) |
Employment Characteristics in Pala
Employment by Class of Employer in Pala
Among the 301 employed individuals in Pala, private company employees (234 | 77.7%), self-employed (not incorporated) (30 | 10.0%), and state government employees (13 | 4.3%) make up the most common classes of employment.
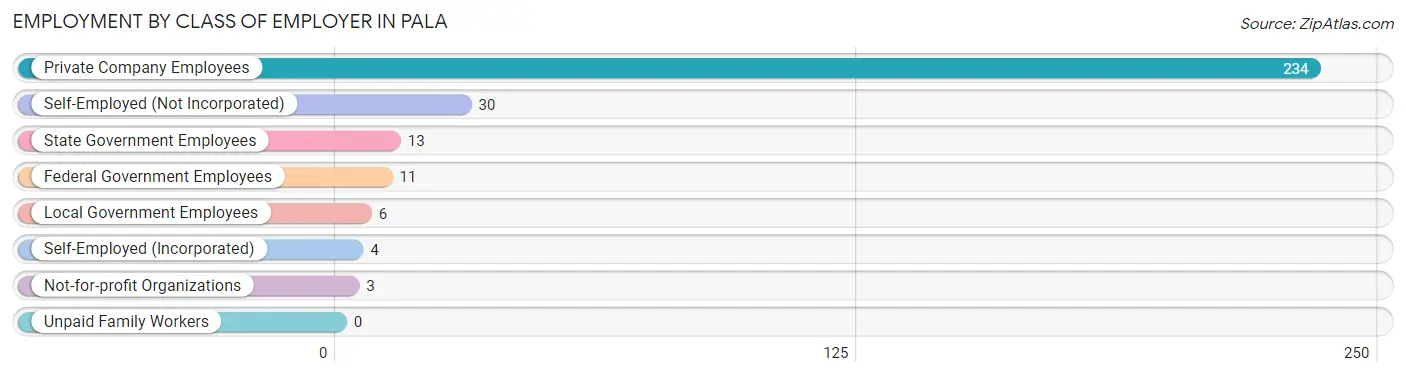
| Employer Class | # Employees | % Employees |
| Private Company Employees | 234 | 77.7% |
| Self-Employed (Incorporated) | 4 | 1.3% |
| Self-Employed (Not Incorporated) | 30 | 10.0% |
| Not-for-profit Organizations | 3 | 1.0% |
| Local Government Employees | 6 | 2.0% |
| State Government Employees | 13 | 4.3% |
| Federal Government Employees | 11 | 3.6% |
| Unpaid Family Workers | 0 | 0.0% |
| Total | 301 | 100.0% |
Employment Status by Age in Pala
According to the labor force statistics for Pala, out of the total population over 16 years of age (713), 46.6% or 332 individuals are in the labor force, with 7.5% or 25 of them unemployed. The age group with the highest labor force participation rate is 25 to 29 years, with 80.4% or 37 individuals in the labor force. Within the labor force, the 16 to 19 years age range has the highest percentage of unemployed individuals, with 33.3% or 2 of them being unemployed.
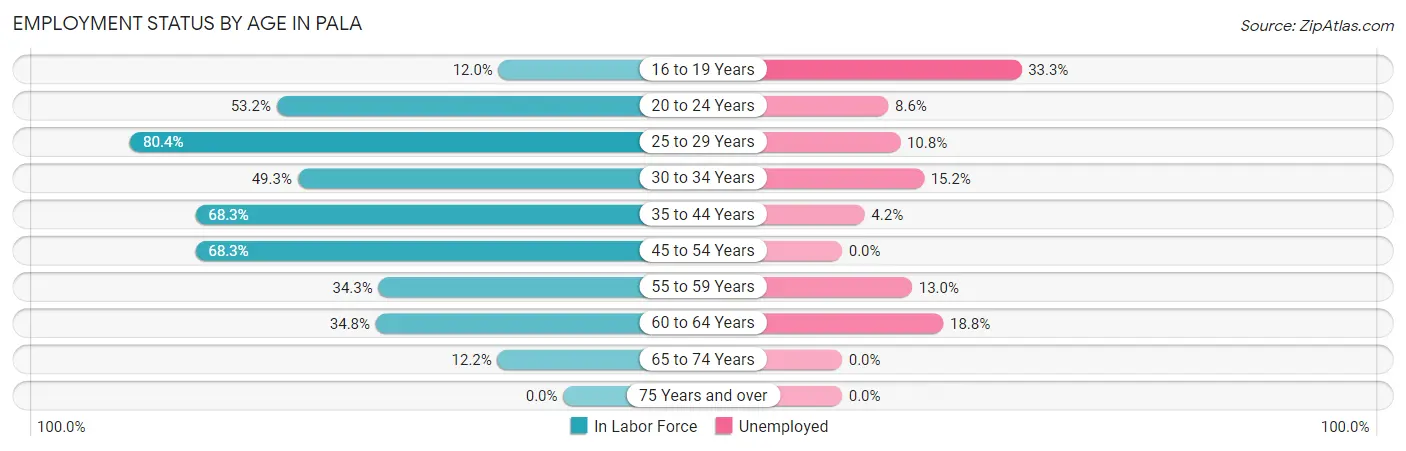
| Age Bracket | In Labor Force | Unemployed |
| 16 to 19 Years | 6 (12.0%) | 2 (33.3%) |
| 20 to 24 Years | 58 (53.2%) | 5 (8.6%) |
| 25 to 29 Years | 37 (80.4%) | 4 (10.8%) |
| 30 to 34 Years | 33 (49.3%) | 5 (15.2%) |
| 35 to 44 Years | 71 (68.3%) | 3 (4.2%) |
| 45 to 54 Years | 82 (68.3%) | 0 (0.0%) |
| 55 to 59 Years | 23 (34.3%) | 3 (13.0%) |
| 60 to 64 Years | 16 (34.8%) | 3 (18.8%) |
| 65 to 74 Years | 6 (12.2%) | 0 (0.0%) |
| 75 Years and over | 0 (0.0%) | 0 (0.0%) |
| Total | 332 (46.6%) | 25 (7.5%) |
Employment Status by Educational Attainment in Pala
According to labor force statistics for Pala, 58.2% of individuals (262) out of the total population between 25 and 64 years of age (450) are in the labor force, with 6.9% or 18 of them being unemployed. The group with the highest labor force participation rate are those with the educational attainment of bachelor's degree or higher, with 95.8% or 23 individuals in the labor force. Within the labor force, individuals with college / associate degree education have the highest percentage of unemployment, with 11.0% or 9 of them being unemployed.
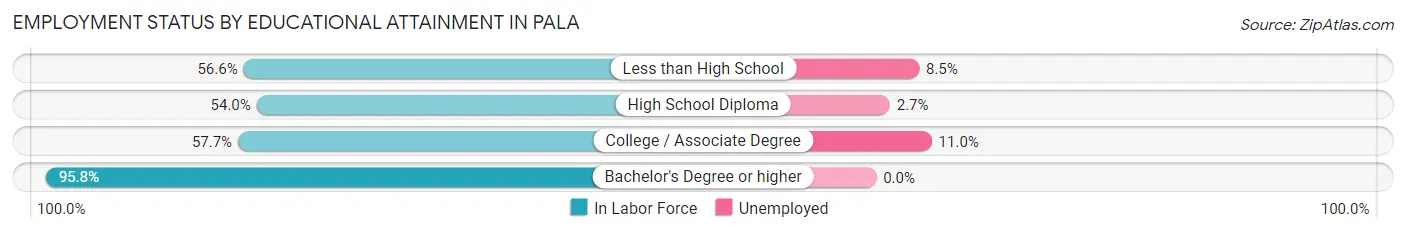
| Educational Attainment | In Labor Force | Unemployed |
| Less than High School | 82 (56.6%) | 12 (8.5%) |
| High School Diploma | 75 (54.0%) | 4 (2.7%) |
| College / Associate Degree | 82 (57.7%) | 16 (11.0%) |
| Bachelor's Degree or higher | 23 (95.8%) | 0 (0.0%) |
| Total | 262 (58.2%) | 31 (6.9%) |
Employment Occupations by Sex in Pala
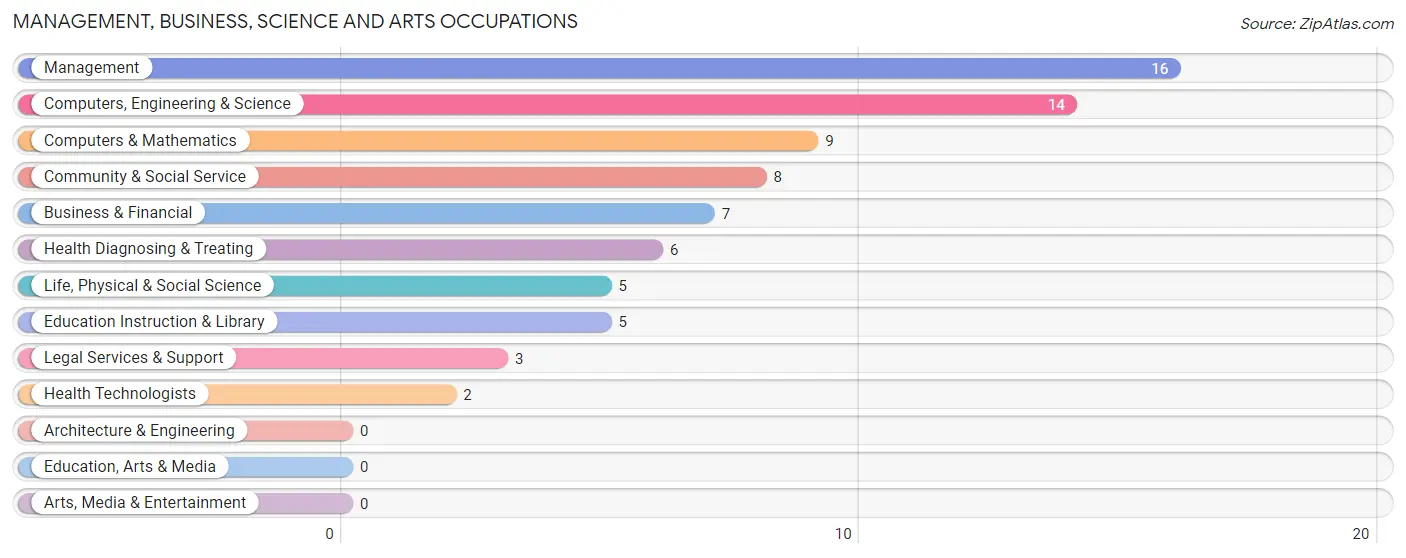
Management, Business, Science and Arts Occupations
The most common Management, Business, Science and Arts occupations in Pala are Management (16 | 5.2%), Computers, Engineering & Science (14 | 4.6%), Computers & Mathematics (9 | 2.9%), Community & Social Service (8 | 2.6%), and Business & Financial (7 | 2.3%).
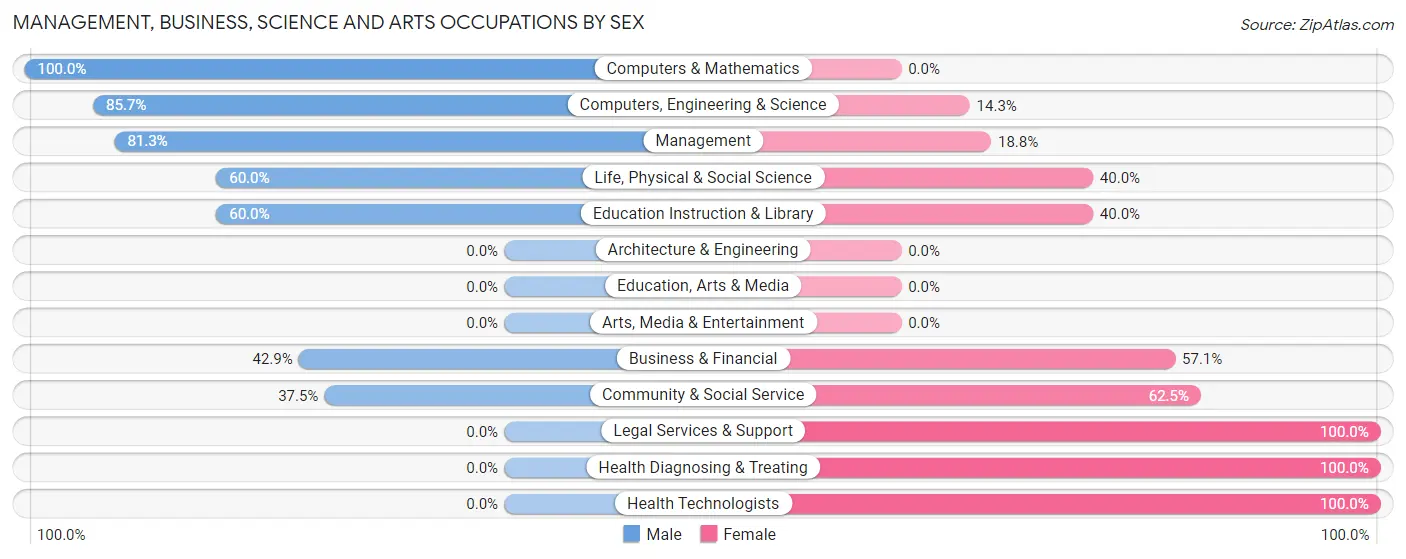
Management, Business, Science and Arts Occupations by Sex
Within the Management, Business, Science and Arts occupations in Pala, the most male-oriented occupations are Computers & Mathematics (100.0%), Computers, Engineering & Science (85.7%), and Management (81.2%), while the most female-oriented occupations are Legal Services & Support (100.0%), Health Diagnosing & Treating (100.0%), and Health Technologists (100.0%).
| Occupation | Male | Female |
| Management | 13 (81.2%) | 3 (18.8%) |
| Business & Financial | 3 (42.9%) | 4 (57.1%) |
| Computers, Engineering & Science | 12 (85.7%) | 2 (14.3%) |
| Computers & Mathematics | 9 (100.0%) | 0 (0.0%) |
| Architecture & Engineering | 0 (0.0%) | 0 (0.0%) |
| Life, Physical & Social Science | 3 (60.0%) | 2 (40.0%) |
| Community & Social Service | 3 (37.5%) | 5 (62.5%) |
| Education, Arts & Media | 0 (0.0%) | 0 (0.0%) |
| Legal Services & Support | 0 (0.0%) | 3 (100.0%) |
| Education Instruction & Library | 3 (60.0%) | 2 (40.0%) |
| Arts, Media & Entertainment | 0 (0.0%) | 0 (0.0%) |
| Health Diagnosing & Treating | 0 (0.0%) | 6 (100.0%) |
| Health Technologists | 0 (0.0%) | 2 (100.0%) |
| Total (Category) | 31 (60.8%) | 20 (39.2%) |
| Total (Overall) | 170 (55.4%) | 137 (44.6%) |
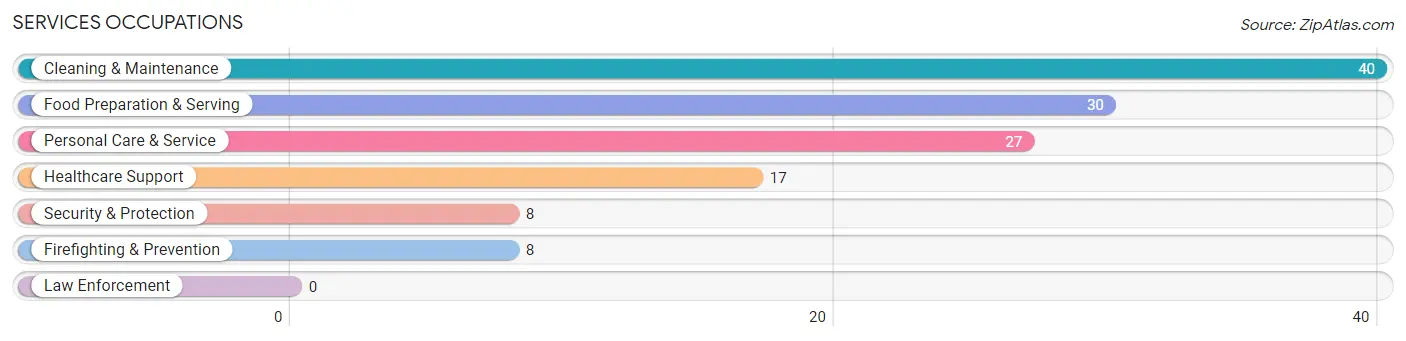
Services Occupations
The most common Services occupations in Pala are Cleaning & Maintenance (40 | 13.0%), Food Preparation & Serving (30 | 9.8%), Personal Care & Service (27 | 8.8%), Healthcare Support (17 | 5.5%), and Security & Protection (8 | 2.6%).
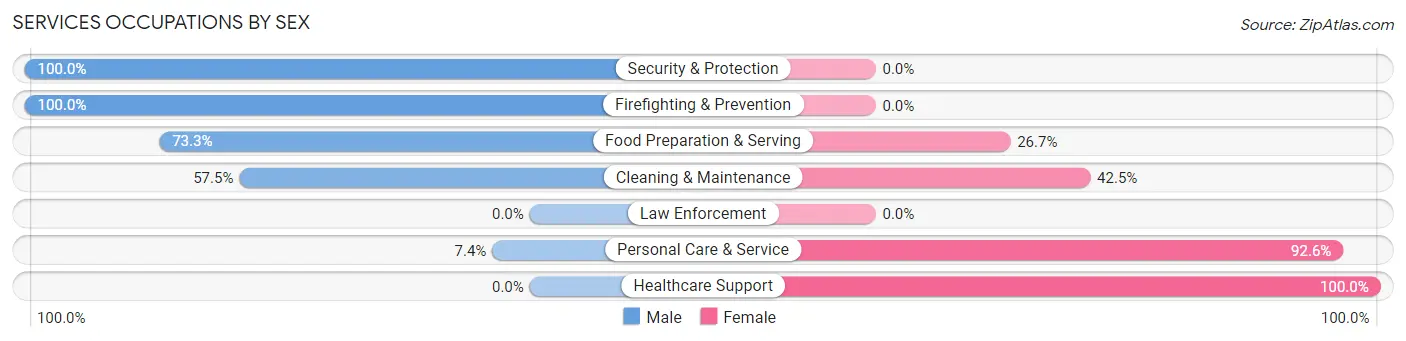
Services Occupations by Sex
Within the Services occupations in Pala, the most male-oriented occupations are Security & Protection (100.0%), Firefighting & Prevention (100.0%), and Food Preparation & Serving (73.3%), while the most female-oriented occupations are Healthcare Support (100.0%), Personal Care & Service (92.6%), and Cleaning & Maintenance (42.5%).
| Occupation | Male | Female |
| Healthcare Support | 0 (0.0%) | 17 (100.0%) |
| Security & Protection | 8 (100.0%) | 0 (0.0%) |
| Firefighting & Prevention | 8 (100.0%) | 0 (0.0%) |
| Law Enforcement | 0 (0.0%) | 0 (0.0%) |
| Food Preparation & Serving | 22 (73.3%) | 8 (26.7%) |
| Cleaning & Maintenance | 23 (57.5%) | 17 (42.5%) |
| Personal Care & Service | 2 (7.4%) | 25 (92.6%) |
| Total (Category) | 55 (45.1%) | 67 (54.9%) |
| Total (Overall) | 170 (55.4%) | 137 (44.6%) |
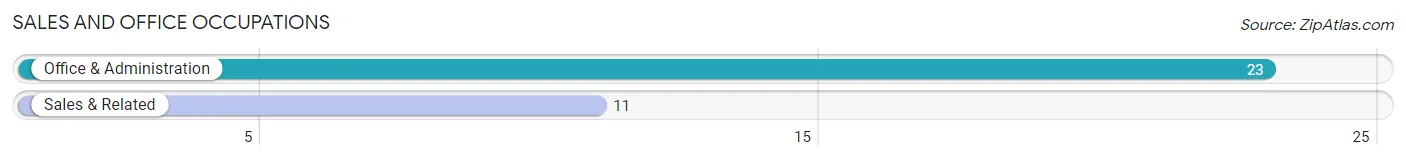
Sales and Office Occupations
The most common Sales and Office occupations in Pala are Office & Administration (23 | 7.5%), and Sales & Related (11 | 3.6%).
Sales and Office Occupations by Sex
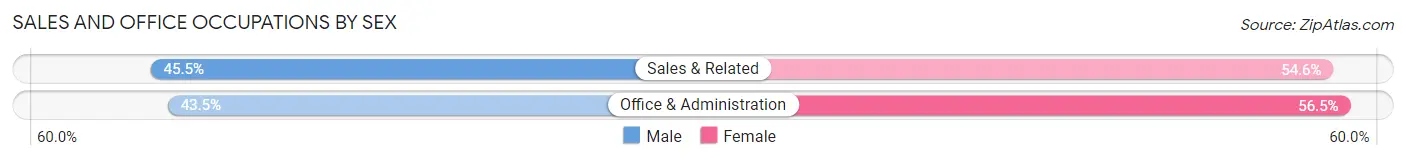
| Occupation | Male | Female |
| Sales & Related | 5 (45.5%) | 6 (54.5%) |
| Office & Administration | 10 (43.5%) | 13 (56.5%) |
| Total (Category) | 15 (44.1%) | 19 (55.9%) |
| Total (Overall) | 170 (55.4%) | 137 (44.6%) |
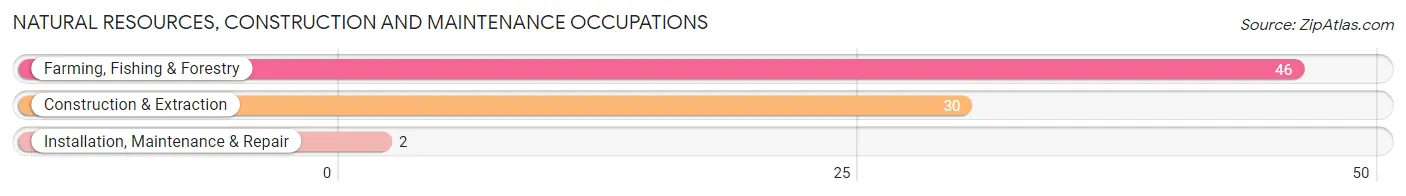
Natural Resources, Construction and Maintenance Occupations
The most common Natural Resources, Construction and Maintenance occupations in Pala are Farming, Fishing & Forestry (46 | 15.0%), Construction & Extraction (30 | 9.8%), and Installation, Maintenance & Repair (2 | 0.6%).
Natural Resources, Construction and Maintenance Occupations by Sex
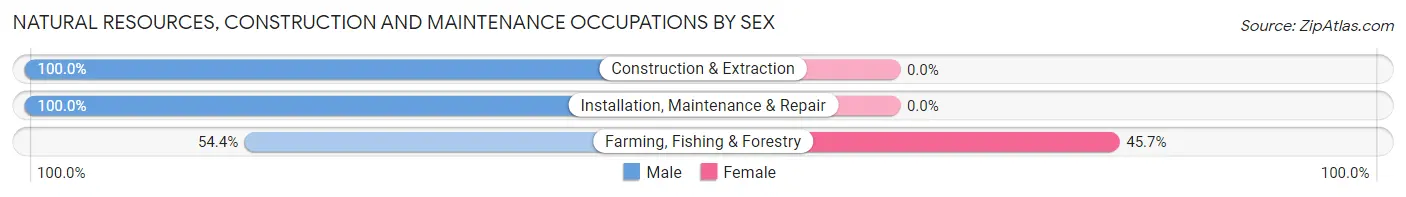
| Occupation | Male | Female |
| Farming, Fishing & Forestry | 25 (54.3%) | 21 (45.7%) |
| Construction & Extraction | 30 (100.0%) | 0 (0.0%) |
| Installation, Maintenance & Repair | 2 (100.0%) | 0 (0.0%) |
| Total (Category) | 57 (73.1%) | 21 (26.9%) |
| Total (Overall) | 170 (55.4%) | 137 (44.6%) |
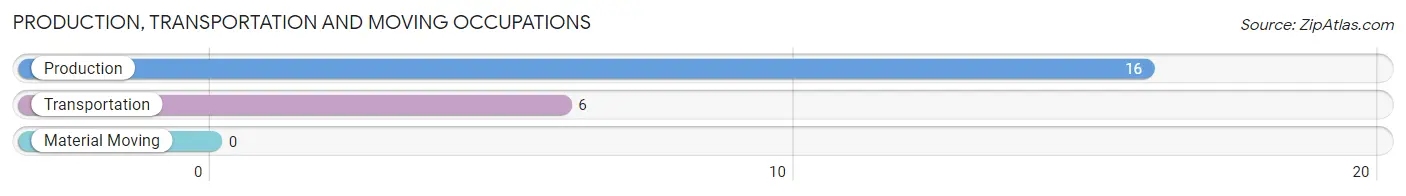
Production, Transportation and Moving Occupations
The most common Production, Transportation and Moving occupations in Pala are Production (16 | 5.2%), and Transportation (6 | 1.9%).
Production, Transportation and Moving Occupations by Sex
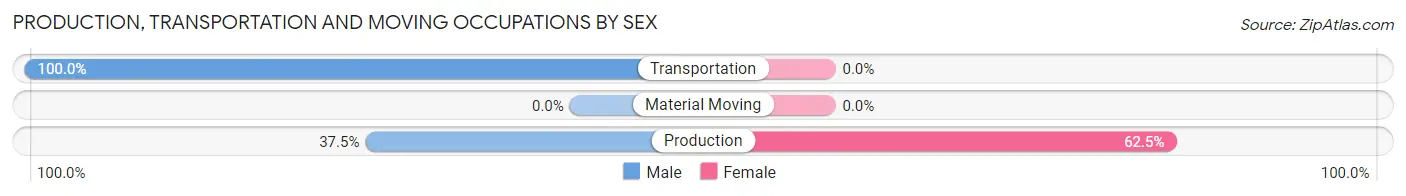
| Occupation | Male | Female |
| Production | 6 (37.5%) | 10 (62.5%) |
| Transportation | 6 (100.0%) | 0 (0.0%) |
| Material Moving | 0 (0.0%) | 0 (0.0%) |
| Total (Category) | 12 (54.5%) | 10 (45.5%) |
| Total (Overall) | 170 (55.4%) | 137 (44.6%) |
Employment Industries by Sex in Pala
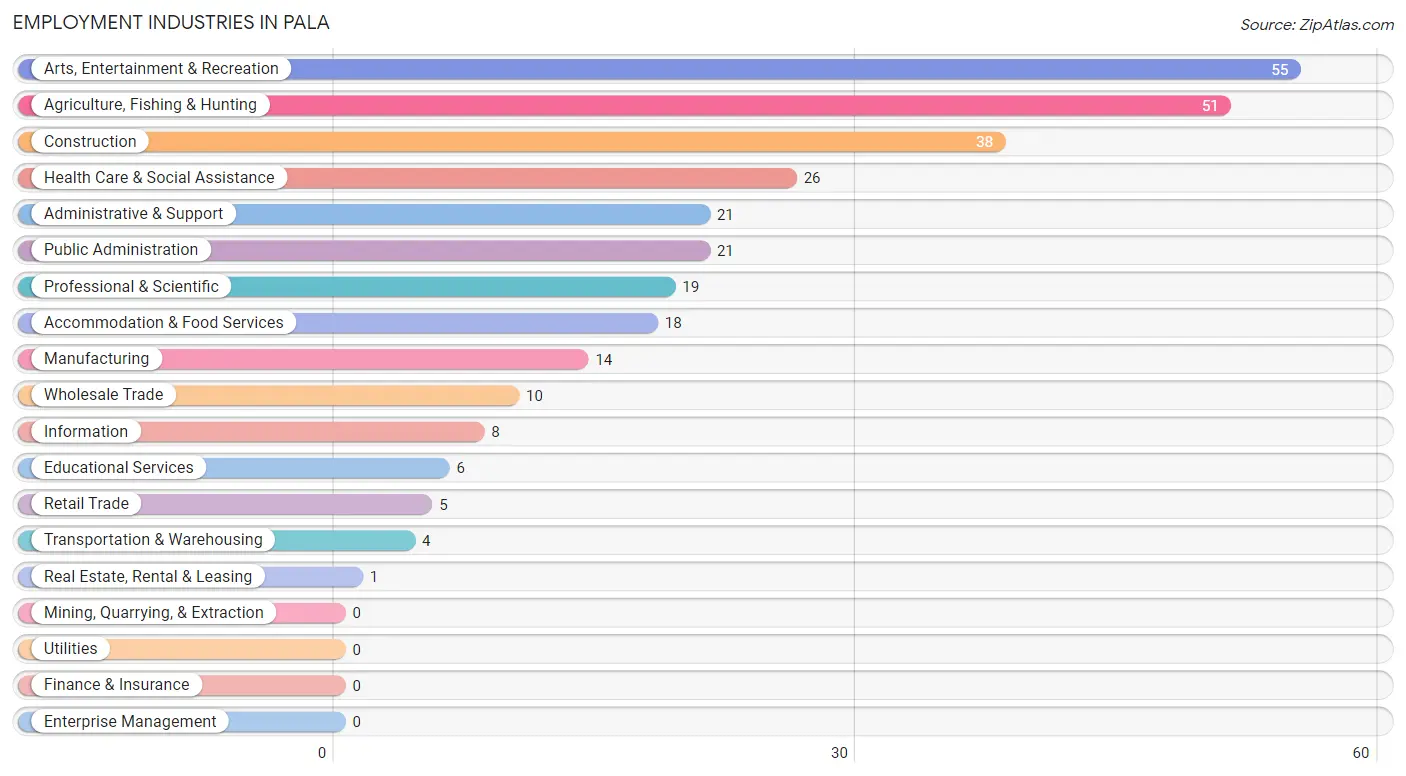
Employment Industries in Pala
The major employment industries in Pala include Arts, Entertainment & Recreation (55 | 17.9%), Agriculture, Fishing & Hunting (51 | 16.6%), Construction (38 | 12.4%), Health Care & Social Assistance (26 | 8.5%), and Administrative & Support (21 | 6.8%).
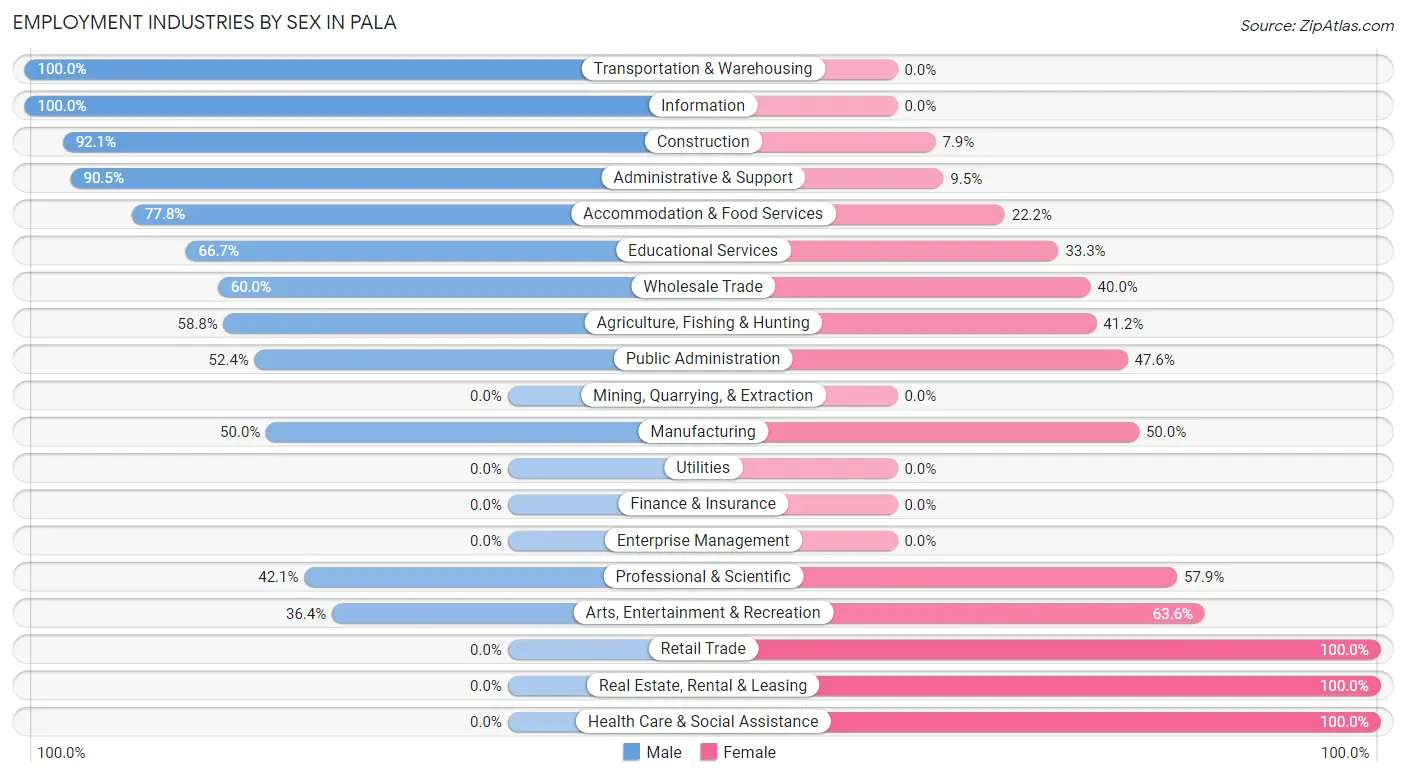
Employment Industries by Sex in Pala
The Pala industries that see more men than women are Transportation & Warehousing (100.0%), Information (100.0%), and Construction (92.1%), whereas the industries that tend to have a higher number of women are Retail Trade (100.0%), Real Estate, Rental & Leasing (100.0%), and Health Care & Social Assistance (100.0%).
| Industry | Male | Female |
| Agriculture, Fishing & Hunting | 30 (58.8%) | 21 (41.2%) |
| Mining, Quarrying, & Extraction | 0 (0.0%) | 0 (0.0%) |
| Construction | 35 (92.1%) | 3 (7.9%) |
| Manufacturing | 7 (50.0%) | 7 (50.0%) |
| Wholesale Trade | 6 (60.0%) | 4 (40.0%) |
| Retail Trade | 0 (0.0%) | 5 (100.0%) |
| Transportation & Warehousing | 4 (100.0%) | 0 (0.0%) |
| Utilities | 0 (0.0%) | 0 (0.0%) |
| Information | 8 (100.0%) | 0 (0.0%) |
| Finance & Insurance | 0 (0.0%) | 0 (0.0%) |
| Real Estate, Rental & Leasing | 0 (0.0%) | 1 (100.0%) |
| Professional & Scientific | 8 (42.1%) | 11 (57.9%) |
| Enterprise Management | 0 (0.0%) | 0 (0.0%) |
| Administrative & Support | 19 (90.5%) | 2 (9.5%) |
| Educational Services | 4 (66.7%) | 2 (33.3%) |
| Health Care & Social Assistance | 0 (0.0%) | 26 (100.0%) |
| Arts, Entertainment & Recreation | 20 (36.4%) | 35 (63.6%) |
| Accommodation & Food Services | 14 (77.8%) | 4 (22.2%) |
| Public Administration | 11 (52.4%) | 10 (47.6%) |
| Total | 170 (55.4%) | 137 (44.6%) |
Education in Pala
School Enrollment in Pala
The most common levels of schooling among the 294 students in Pala are high school (85 | 28.9%), middle school (71 | 24.1%), and elementary school (52 | 17.7%).
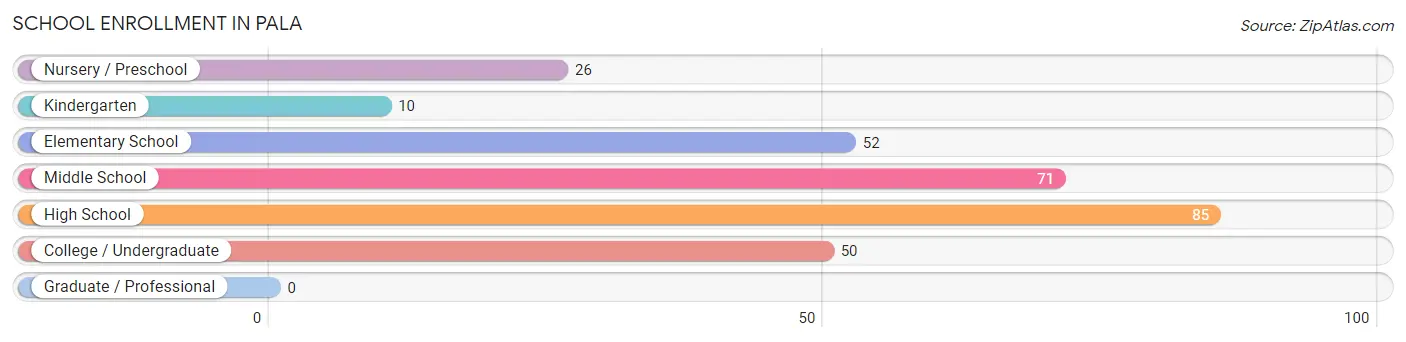
| School Level | # Students | % Students |
| Nursery / Preschool | 26 | 8.8% |
| Kindergarten | 10 | 3.4% |
| Elementary School | 52 | 17.7% |
| Middle School | 71 | 24.1% |
| High School | 85 | 28.9% |
| College / Undergraduate | 50 | 17.0% |
| Graduate / Professional | 0 | 0.0% |
| Total | 294 | 100.0% |
School Enrollment by Age by Funding Source in Pala
Out of a total of 294 students who are enrolled in schools in Pala, 27 (9.2%) attend a private institution, while the remaining 267 (90.8%) are enrolled in public schools. The age group of 3 to 4 year olds has the highest likelihood of being enrolled in private schools, with 14 (63.6% in the age bracket) enrolled. Conversely, the age group of 18 to 19 year olds has the lowest likelihood of being enrolled in a private school, with 11 (100.0% in the age bracket) attending a public institution.
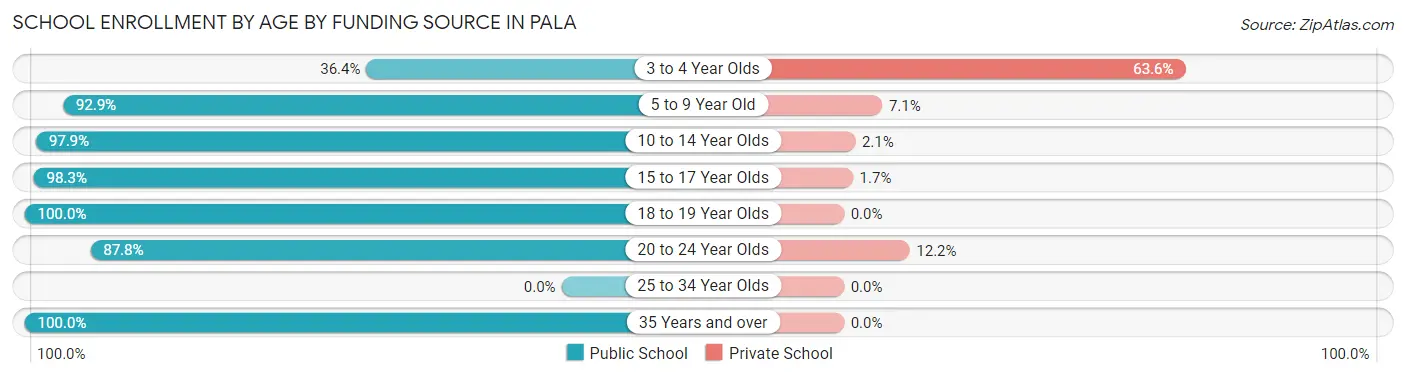
| Age Bracket | Public School | Private School |
| 3 to 4 Year Olds | 8 (36.4%) | 14 (63.6%) |
| 5 to 9 Year Old | 52 (92.9%) | 4 (7.1%) |
| 10 to 14 Year Olds | 93 (97.9%) | 2 (2.1%) |
| 15 to 17 Year Olds | 59 (98.3%) | 1 (1.7%) |
| 18 to 19 Year Olds | 11 (100.0%) | 0 (0.0%) |
| 20 to 24 Year Olds | 43 (87.8%) | 6 (12.2%) |
| 25 to 34 Year Olds | 0 (0.0%) | 0 (0.0%) |
| 35 Years and over | 1 (100.0%) | 0 (0.0%) |
| Total | 267 (90.8%) | 27 (9.2%) |
Educational Attainment by Field of Study in Pala
Bio, nature & agricultural (4 | 14.3%), engineering (4 | 14.3%), computers & mathematics (3 | 10.7%), physical & health sciences (3 | 10.7%), and multidisciplinary studies (3 | 10.7%) are the most common fields of study among 28 individuals in Pala who have obtained a bachelor's degree or higher.
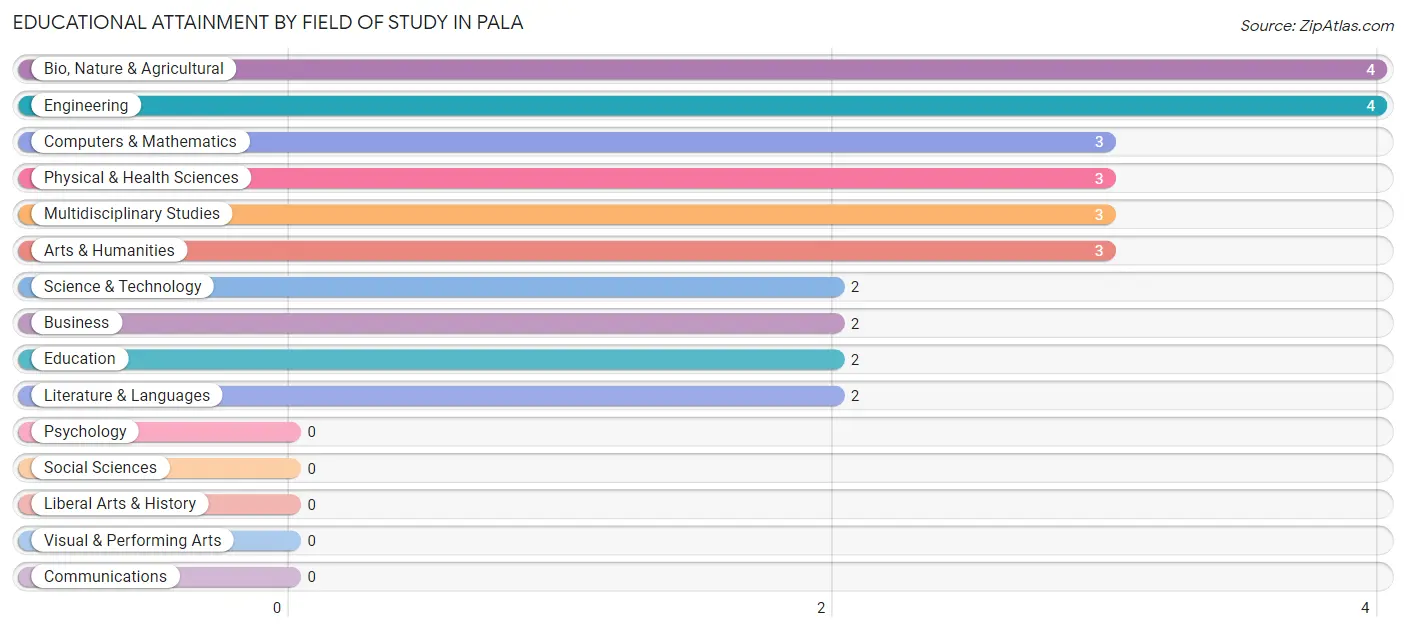
| Field of Study | # Graduates | % Graduates |
| Computers & Mathematics | 3 | 10.7% |
| Bio, Nature & Agricultural | 4 | 14.3% |
| Physical & Health Sciences | 3 | 10.7% |
| Psychology | 0 | 0.0% |
| Social Sciences | 0 | 0.0% |
| Engineering | 4 | 14.3% |
| Multidisciplinary Studies | 3 | 10.7% |
| Science & Technology | 2 | 7.1% |
| Business | 2 | 7.1% |
| Education | 2 | 7.1% |
| Literature & Languages | 2 | 7.1% |
| Liberal Arts & History | 0 | 0.0% |
| Visual & Performing Arts | 0 | 0.0% |
| Communications | 0 | 0.0% |
| Arts & Humanities | 3 | 10.7% |
| Total | 28 | 100.0% |
Transportation & Commute in Pala
Vehicle Availability by Sex in Pala
The most prevalent vehicle ownership categories in Pala are males with 3 vehicles (73, accounting for 43.2%) and females with 3 vehicles (47, making up 55.3%).
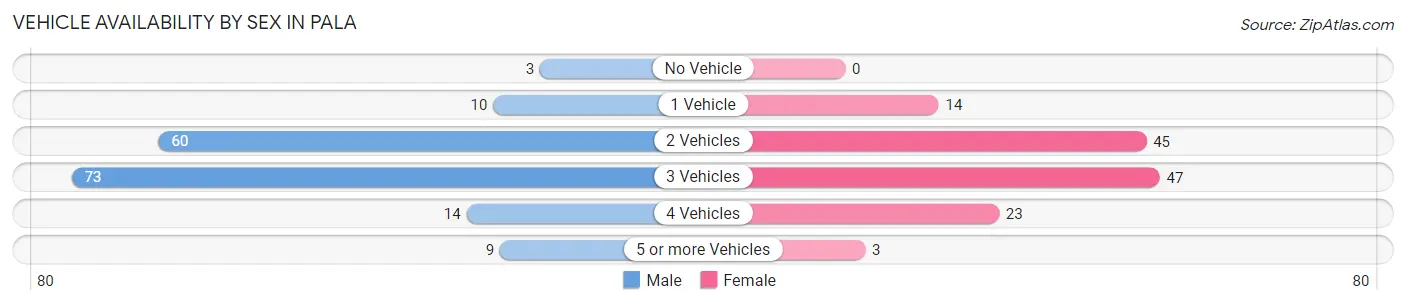
| Vehicles Available | Male | Female |
| No Vehicle | 3 (1.8%) | 0 (0.0%) |
| 1 Vehicle | 10 (5.9%) | 14 (10.6%) |
| 2 Vehicles | 60 (35.5%) | 45 (34.1%) |
| 3 Vehicles | 73 (43.2%) | 47 (35.6%) |
| 4 Vehicles | 14 (8.3%) | 23 (17.4%) |
| 5 or more Vehicles | 9 (5.3%) | 3 (2.3%) |
| Total | 169 (100.0%) | 132 (100.0%) |
Commute Time in Pala
The most frequently occuring commute durations in Pala are 30 to 34 minutes (72 commuters, 24.9%), 15 to 19 minutes (70 commuters, 24.2%), and 20 to 24 minutes (47 commuters, 16.3%).
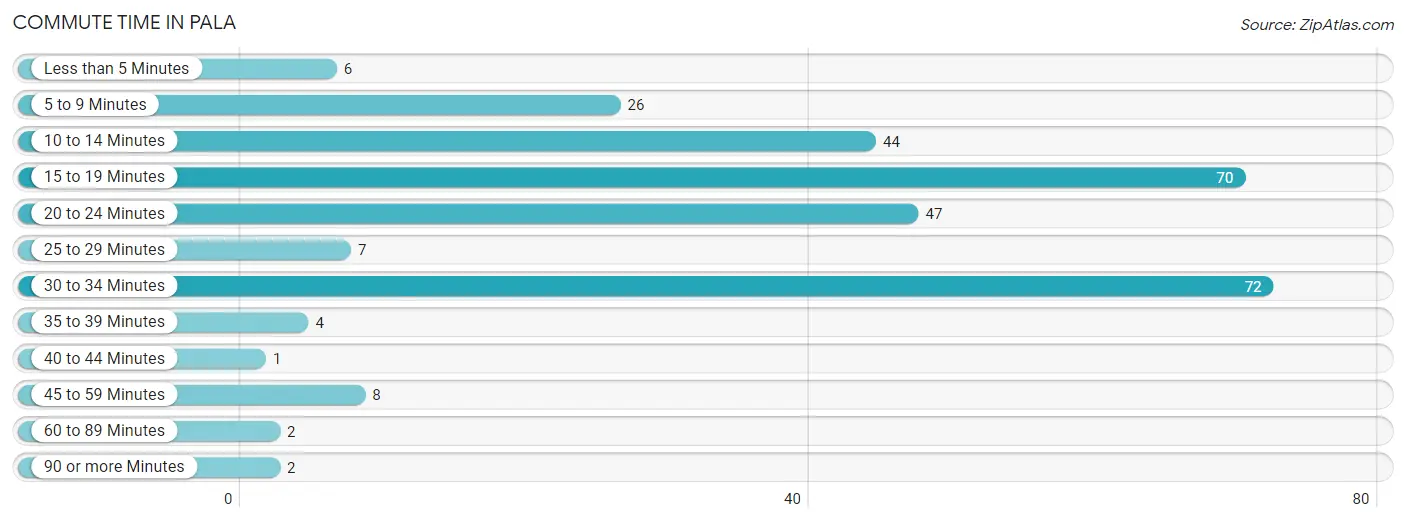
| Commute Time | # Commuters | % Commuters |
| Less than 5 Minutes | 6 | 2.1% |
| 5 to 9 Minutes | 26 | 9.0% |
| 10 to 14 Minutes | 44 | 15.2% |
| 15 to 19 Minutes | 70 | 24.2% |
| 20 to 24 Minutes | 47 | 16.3% |
| 25 to 29 Minutes | 7 | 2.4% |
| 30 to 34 Minutes | 72 | 24.9% |
| 35 to 39 Minutes | 4 | 1.4% |
| 40 to 44 Minutes | 1 | 0.4% |
| 45 to 59 Minutes | 8 | 2.8% |
| 60 to 89 Minutes | 2 | 0.7% |
| 90 or more Minutes | 2 | 0.7% |
Commute Time by Sex in Pala
The most common commute times in Pala are 30 to 34 minutes (45 commuters, 27.1%) for males and 10 to 14 minutes (27 commuters, 22.0%) for females.
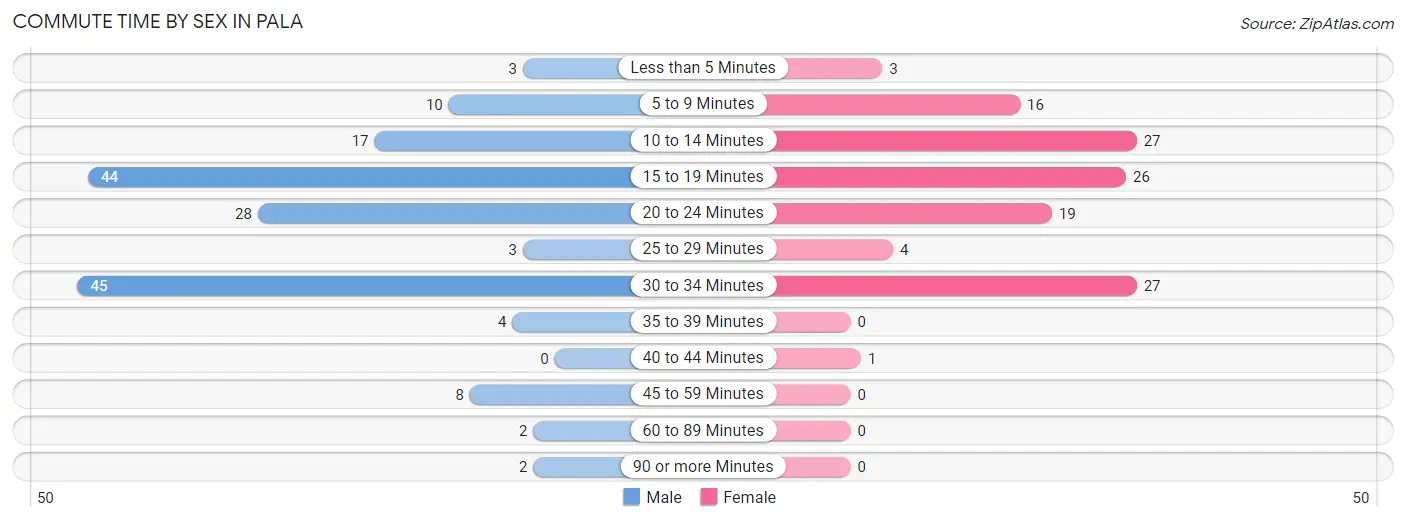
| Commute Time | Male | Female |
| Less than 5 Minutes | 3 (1.8%) | 3 (2.4%) |
| 5 to 9 Minutes | 10 (6.0%) | 16 (13.0%) |
| 10 to 14 Minutes | 17 (10.2%) | 27 (22.0%) |
| 15 to 19 Minutes | 44 (26.5%) | 26 (21.1%) |
| 20 to 24 Minutes | 28 (16.9%) | 19 (15.4%) |
| 25 to 29 Minutes | 3 (1.8%) | 4 (3.3%) |
| 30 to 34 Minutes | 45 (27.1%) | 27 (22.0%) |
| 35 to 39 Minutes | 4 (2.4%) | 0 (0.0%) |
| 40 to 44 Minutes | 0 (0.0%) | 1 (0.8%) |
| 45 to 59 Minutes | 8 (4.8%) | 0 (0.0%) |
| 60 to 89 Minutes | 2 (1.2%) | 0 (0.0%) |
| 90 or more Minutes | 2 (1.2%) | 0 (0.0%) |
Time of Departure to Work by Sex in Pala
The most frequent times of departure to work in Pala are 6:00 AM to 6:29 AM (47, 28.3%) for males and 6:00 AM to 6:29 AM (26, 21.1%) for females.
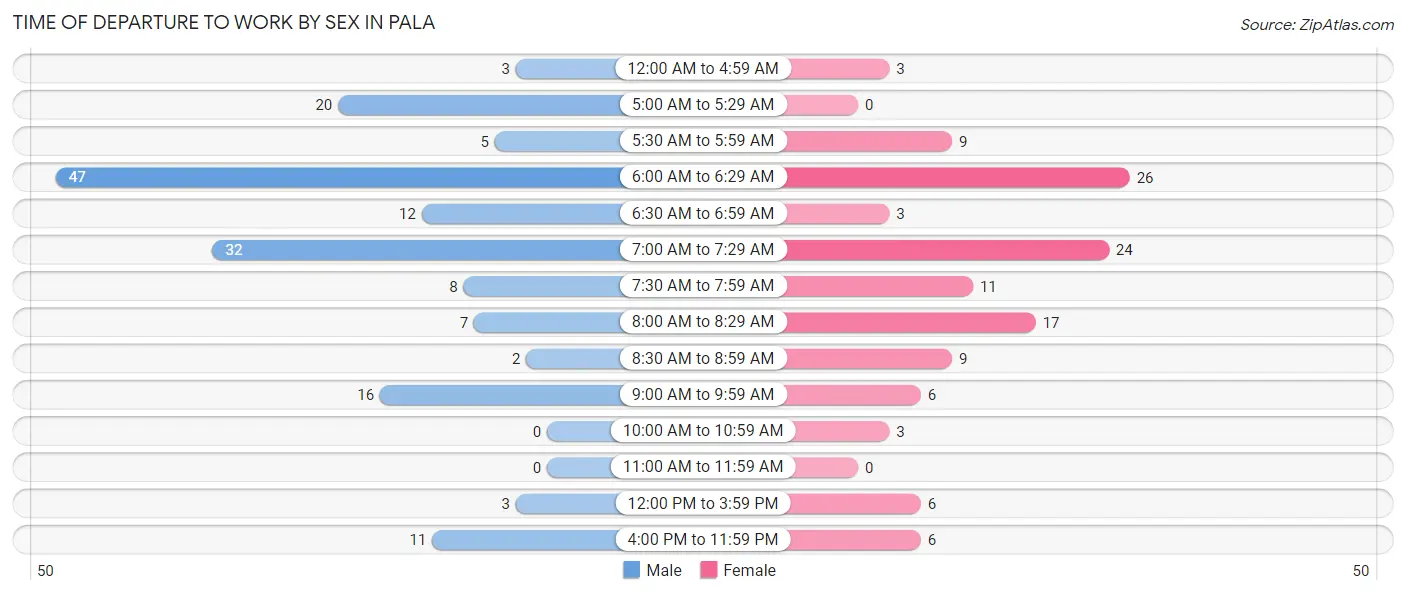
| Time of Departure | Male | Female |
| 12:00 AM to 4:59 AM | 3 (1.8%) | 3 (2.4%) |
| 5:00 AM to 5:29 AM | 20 (12.0%) | 0 (0.0%) |
| 5:30 AM to 5:59 AM | 5 (3.0%) | 9 (7.3%) |
| 6:00 AM to 6:29 AM | 47 (28.3%) | 26 (21.1%) |
| 6:30 AM to 6:59 AM | 12 (7.2%) | 3 (2.4%) |
| 7:00 AM to 7:29 AM | 32 (19.3%) | 24 (19.5%) |
| 7:30 AM to 7:59 AM | 8 (4.8%) | 11 (8.9%) |
| 8:00 AM to 8:29 AM | 7 (4.2%) | 17 (13.8%) |
| 8:30 AM to 8:59 AM | 2 (1.2%) | 9 (7.3%) |
| 9:00 AM to 9:59 AM | 16 (9.6%) | 6 (4.9%) |
| 10:00 AM to 10:59 AM | 0 (0.0%) | 3 (2.4%) |
| 11:00 AM to 11:59 AM | 0 (0.0%) | 0 (0.0%) |
| 12:00 PM to 3:59 PM | 3 (1.8%) | 6 (4.9%) |
| 4:00 PM to 11:59 PM | 11 (6.6%) | 6 (4.9%) |
| Total | 166 (100.0%) | 123 (100.0%) |
Housing Occupancy in Pala
Occupancy by Ownership in Pala
Of the total 296 dwellings in Pala, owner-occupied units account for 184 (62.2%), while renter-occupied units make up 112 (37.8%).
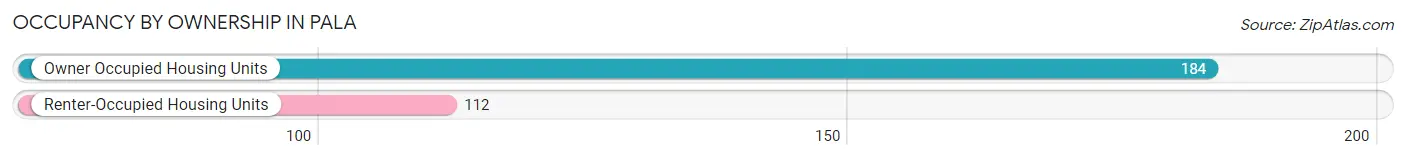
| Occupancy | # Housing Units | % Housing Units |
| Owner Occupied Housing Units | 184 | 62.2% |
| Renter-Occupied Housing Units | 112 | 37.8% |
| Total Occupied Housing Units | 296 | 100.0% |
Occupancy by Household Size in Pala
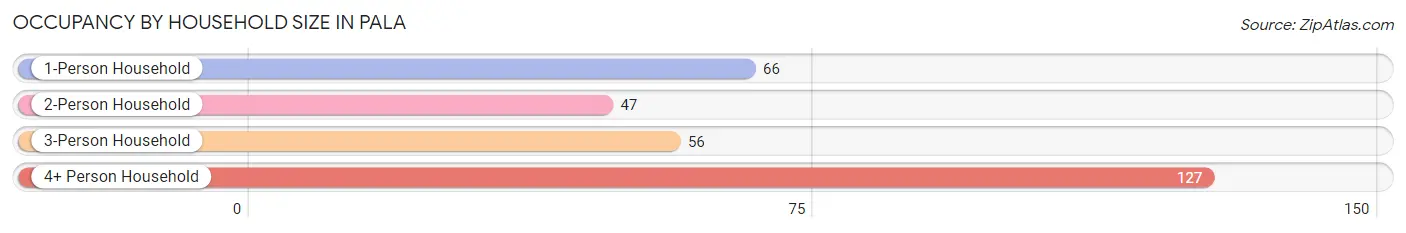
| Household Size | # Housing Units | % Housing Units |
| 1-Person Household | 66 | 22.3% |
| 2-Person Household | 47 | 15.9% |
| 3-Person Household | 56 | 18.9% |
| 4+ Person Household | 127 | 42.9% |
| Total Housing Units | 296 | 100.0% |
Occupancy by Ownership by Household Size in Pala
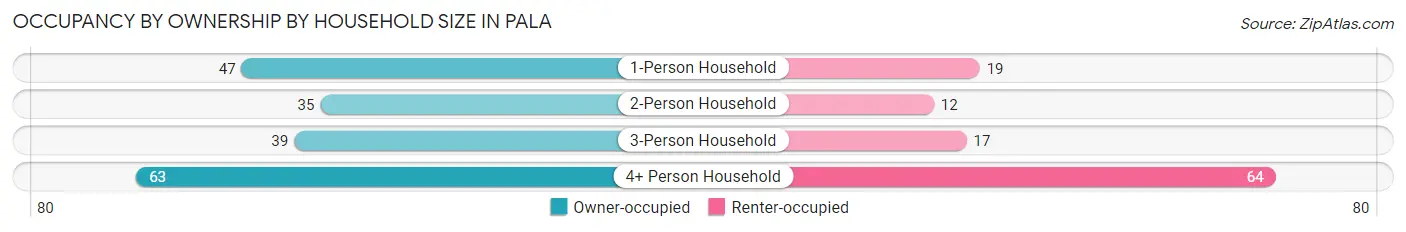
| Household Size | Owner-occupied | Renter-occupied |
| 1-Person Household | 47 (71.2%) | 19 (28.8%) |
| 2-Person Household | 35 (74.5%) | 12 (25.5%) |
| 3-Person Household | 39 (69.6%) | 17 (30.4%) |
| 4+ Person Household | 63 (49.6%) | 64 (50.4%) |
| Total Housing Units | 184 (62.2%) | 112 (37.8%) |
Occupancy by Educational Attainment in Pala
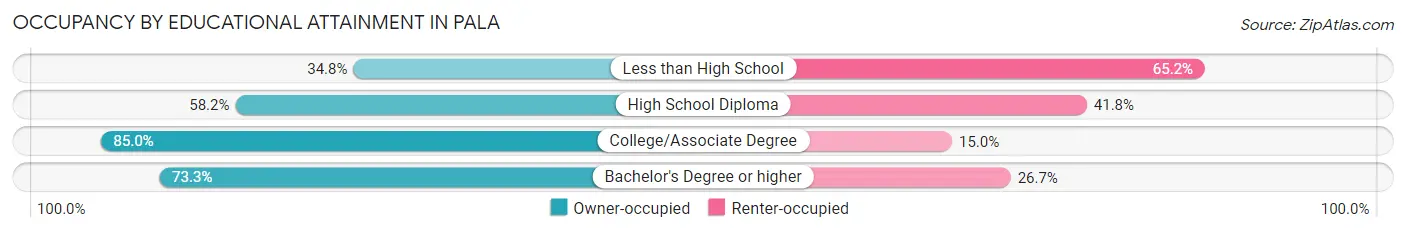
| Household Size | Owner-occupied | Renter-occupied |
| Less than High School | 31 (34.8%) | 58 (65.2%) |
| High School Diploma | 46 (58.2%) | 33 (41.8%) |
| College/Associate Degree | 96 (85.0%) | 17 (15.0%) |
| Bachelor's Degree or higher | 11 (73.3%) | 4 (26.7%) |
Occupancy by Age of Householder in Pala
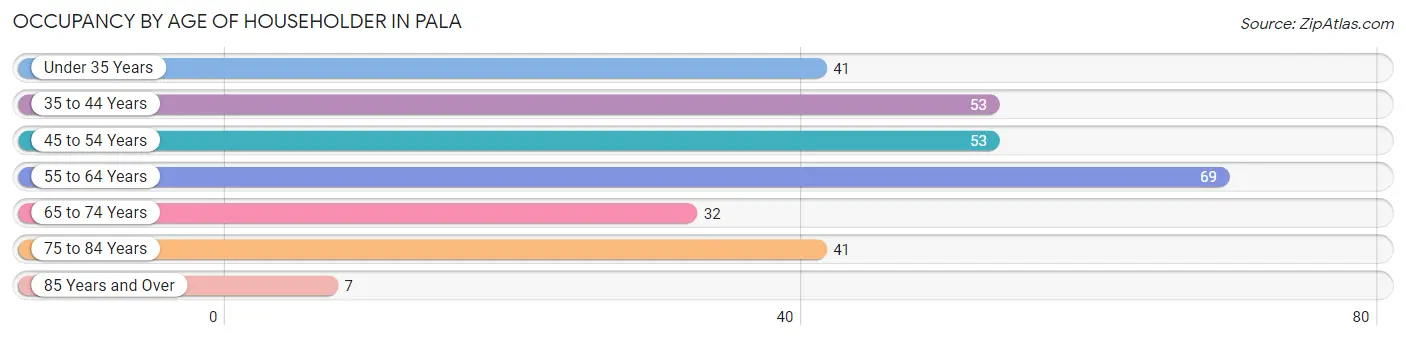
| Age Bracket | # Households | % Households |
| Under 35 Years | 41 | 13.9% |
| 35 to 44 Years | 53 | 17.9% |
| 45 to 54 Years | 53 | 17.9% |
| 55 to 64 Years | 69 | 23.3% |
| 65 to 74 Years | 32 | 10.8% |
| 75 to 84 Years | 41 | 13.9% |
| 85 Years and Over | 7 | 2.4% |
| Total | 296 | 100.0% |
Housing Finances in Pala
Median Income by Occupancy in Pala
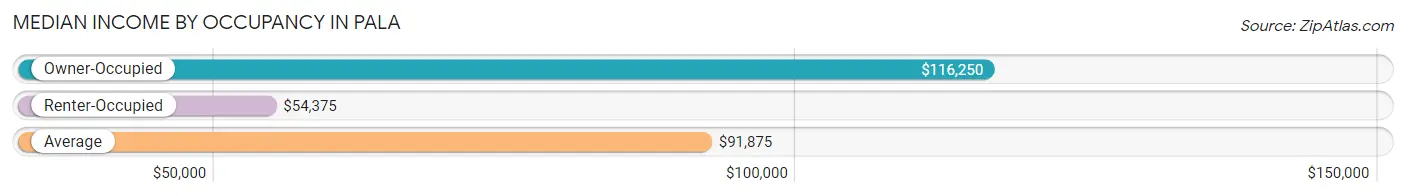
| Occupancy Type | # Households | Median Income |
| Owner-Occupied | 184 (62.2%) | $116,250 |
| Renter-Occupied | 112 (37.8%) | $54,375 |
| Average | 296 (100.0%) | $91,875 |
Occupancy by Householder Income Bracket in Pala
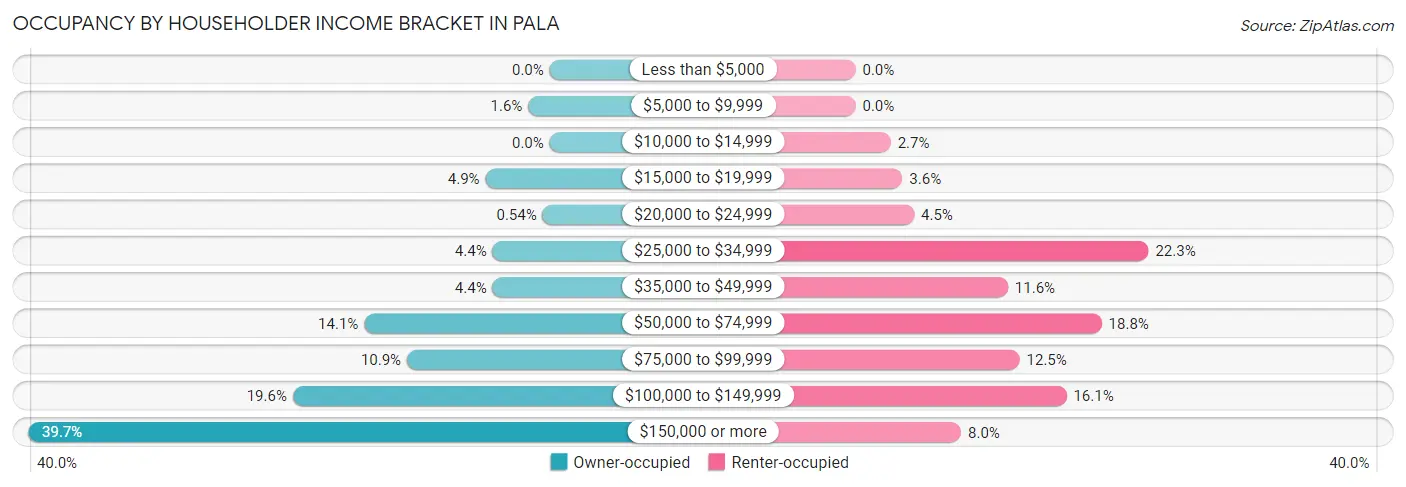
| Income Bracket | Owner-occupied | Renter-occupied |
| Less than $5,000 | 0 (0.0%) | 0 (0.0%) |
| $5,000 to $9,999 | 3 (1.6%) | 0 (0.0%) |
| $10,000 to $14,999 | 0 (0.0%) | 3 (2.7%) |
| $15,000 to $19,999 | 9 (4.9%) | 4 (3.6%) |
| $20,000 to $24,999 | 1 (0.5%) | 5 (4.5%) |
| $25,000 to $34,999 | 8 (4.3%) | 25 (22.3%) |
| $35,000 to $49,999 | 8 (4.3%) | 13 (11.6%) |
| $50,000 to $74,999 | 26 (14.1%) | 21 (18.8%) |
| $75,000 to $99,999 | 20 (10.9%) | 14 (12.5%) |
| $100,000 to $149,999 | 36 (19.6%) | 18 (16.1%) |
| $150,000 or more | 73 (39.7%) | 9 (8.0%) |
| Total | 184 (100.0%) | 112 (100.0%) |
Monthly Housing Cost Tiers in Pala
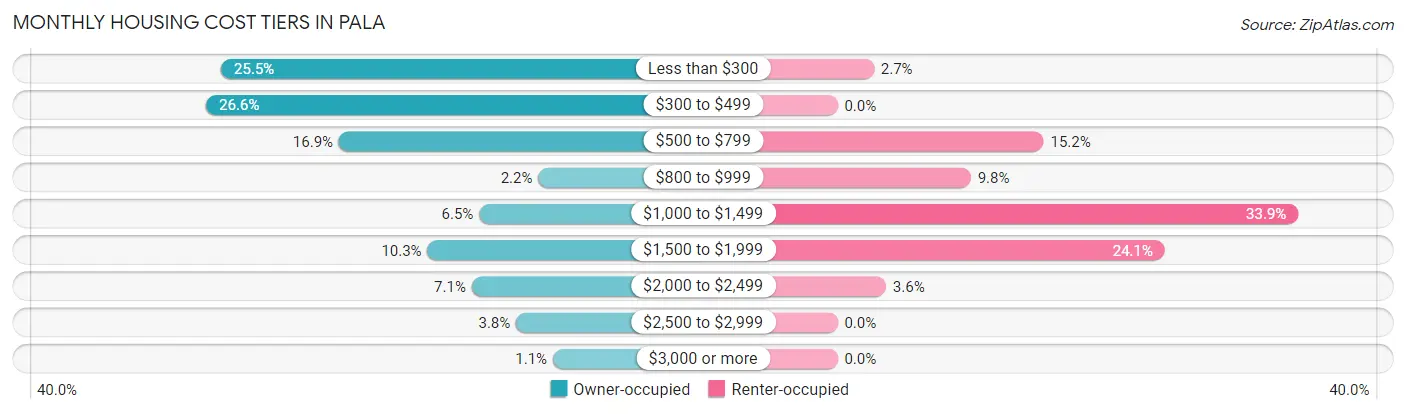
| Monthly Cost | Owner-occupied | Renter-occupied |
| Less than $300 | 47 (25.5%) | 3 (2.7%) |
| $300 to $499 | 49 (26.6%) | 0 (0.0%) |
| $500 to $799 | 31 (16.9%) | 17 (15.2%) |
| $800 to $999 | 4 (2.2%) | 11 (9.8%) |
| $1,000 to $1,499 | 12 (6.5%) | 38 (33.9%) |
| $1,500 to $1,999 | 19 (10.3%) | 27 (24.1%) |
| $2,000 to $2,499 | 13 (7.1%) | 4 (3.6%) |
| $2,500 to $2,999 | 7 (3.8%) | 0 (0.0%) |
| $3,000 or more | 2 (1.1%) | 0 (0.0%) |
| Total | 184 (100.0%) | 112 (100.0%) |
Physical Housing Characteristics in Pala
Housing Structures in Pala
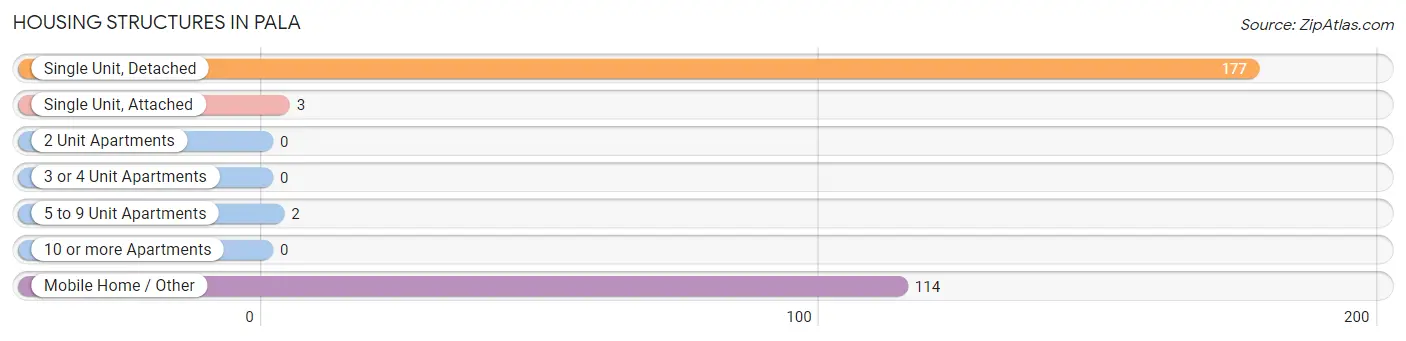
| Structure Type | # Housing Units | % Housing Units |
| Single Unit, Detached | 177 | 59.8% |
| Single Unit, Attached | 3 | 1.0% |
| 2 Unit Apartments | 0 | 0.0% |
| 3 or 4 Unit Apartments | 0 | 0.0% |
| 5 to 9 Unit Apartments | 2 | 0.7% |
| 10 or more Apartments | 0 | 0.0% |
| Mobile Home / Other | 114 | 38.5% |
| Total | 296 | 100.0% |
Housing Structures by Occupancy in Pala
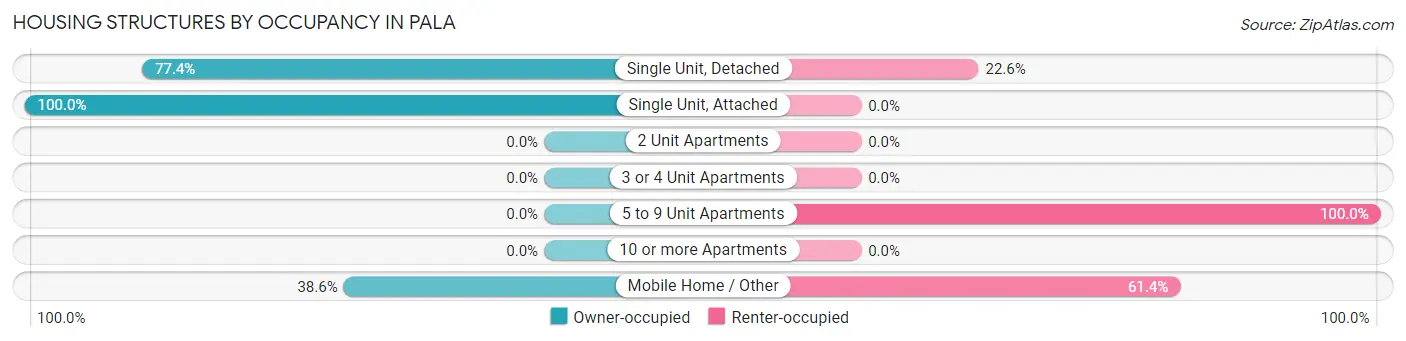
| Structure Type | Owner-occupied | Renter-occupied |
| Single Unit, Detached | 137 (77.4%) | 40 (22.6%) |
| Single Unit, Attached | 3 (100.0%) | 0 (0.0%) |
| 2 Unit Apartments | 0 (0.0%) | 0 (0.0%) |
| 3 or 4 Unit Apartments | 0 (0.0%) | 0 (0.0%) |
| 5 to 9 Unit Apartments | 0 (0.0%) | 2 (100.0%) |
| 10 or more Apartments | 0 (0.0%) | 0 (0.0%) |
| Mobile Home / Other | 44 (38.6%) | 70 (61.4%) |
| Total | 184 (62.2%) | 112 (37.8%) |
Housing Structures by Number of Rooms in Pala
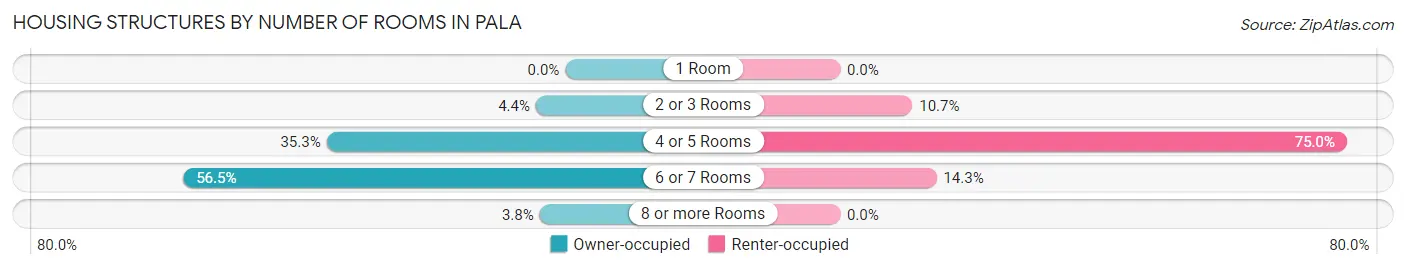
| Number of Rooms | Owner-occupied | Renter-occupied |
| 1 Room | 0 (0.0%) | 0 (0.0%) |
| 2 or 3 Rooms | 8 (4.3%) | 12 (10.7%) |
| 4 or 5 Rooms | 65 (35.3%) | 84 (75.0%) |
| 6 or 7 Rooms | 104 (56.5%) | 16 (14.3%) |
| 8 or more Rooms | 7 (3.8%) | 0 (0.0%) |
| Total | 184 (100.0%) | 112 (100.0%) |
Housing Structure by Heating Type in Pala
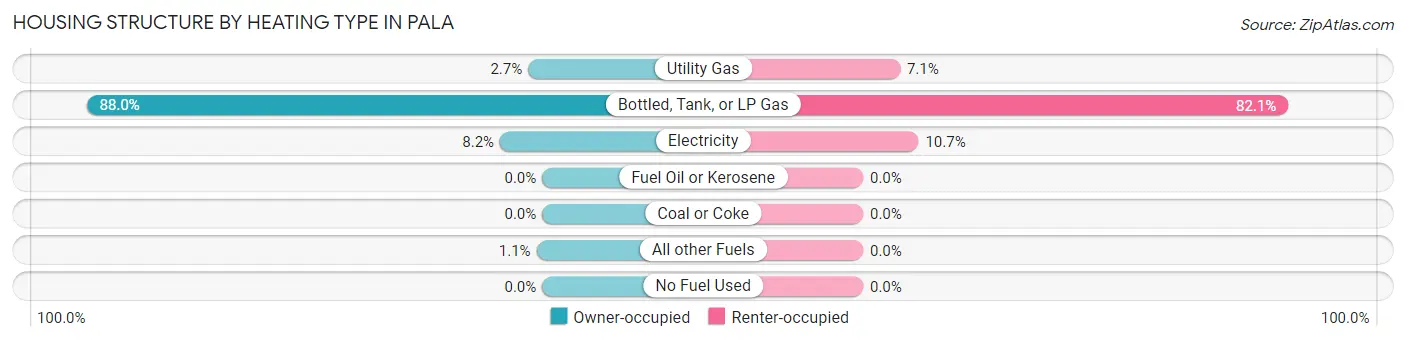
| Heating Type | Owner-occupied | Renter-occupied |
| Utility Gas | 5 (2.7%) | 8 (7.1%) |
| Bottled, Tank, or LP Gas | 162 (88.0%) | 92 (82.1%) |
| Electricity | 15 (8.2%) | 12 (10.7%) |
| Fuel Oil or Kerosene | 0 (0.0%) | 0 (0.0%) |
| Coal or Coke | 0 (0.0%) | 0 (0.0%) |
| All other Fuels | 2 (1.1%) | 0 (0.0%) |
| No Fuel Used | 0 (0.0%) | 0 (0.0%) |
| Total | 184 (100.0%) | 112 (100.0%) |
Household Vehicle Usage in Pala
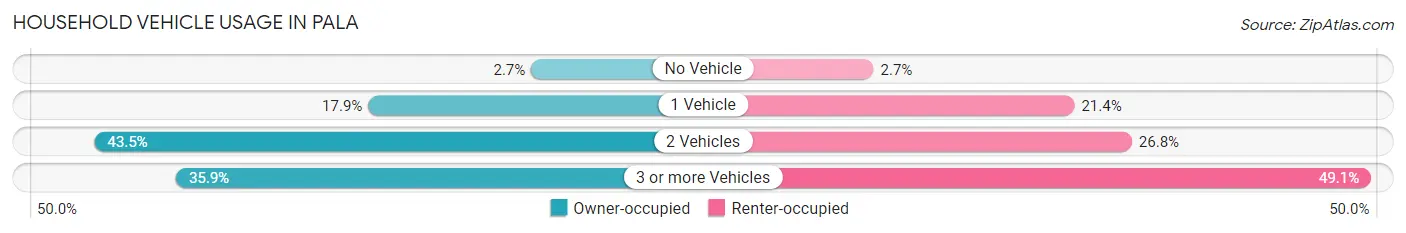
| Vehicles per Household | Owner-occupied | Renter-occupied |
| No Vehicle | 5 (2.7%) | 3 (2.7%) |
| 1 Vehicle | 33 (17.9%) | 24 (21.4%) |
| 2 Vehicles | 80 (43.5%) | 30 (26.8%) |
| 3 or more Vehicles | 66 (35.9%) | 55 (49.1%) |
| Total | 184 (100.0%) | 112 (100.0%) |
Real Estate & Mortgages in Pala
Real Estate and Mortgage Overview in Pala
| Characteristic | Without Mortgage | With Mortgage |
| Housing Units | 110 | 74 |
| Median Property Value | $182,900 | $355,000 |
| Median Household Income | $109,167 | $36 |
| Monthly Housing Costs | $344 | $2 |
| Real Estate Taxes | - | - |
Property Value by Mortgage Status in Pala
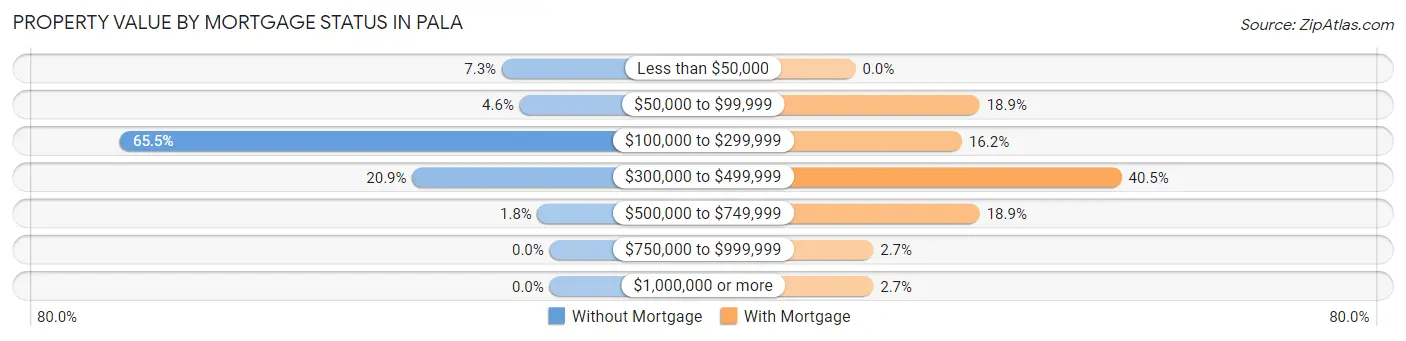
| Property Value | Without Mortgage | With Mortgage |
| Less than $50,000 | 8 (7.3%) | 0 (0.0%) |
| $50,000 to $99,999 | 5 (4.5%) | 14 (18.9%) |
| $100,000 to $299,999 | 72 (65.4%) | 12 (16.2%) |
| $300,000 to $499,999 | 23 (20.9%) | 30 (40.5%) |
| $500,000 to $749,999 | 2 (1.8%) | 14 (18.9%) |
| $750,000 to $999,999 | 0 (0.0%) | 2 (2.7%) |
| $1,000,000 or more | 0 (0.0%) | 2 (2.7%) |
| Total | 110 (100.0%) | 74 (100.0%) |
Household Income by Mortgage Status in Pala
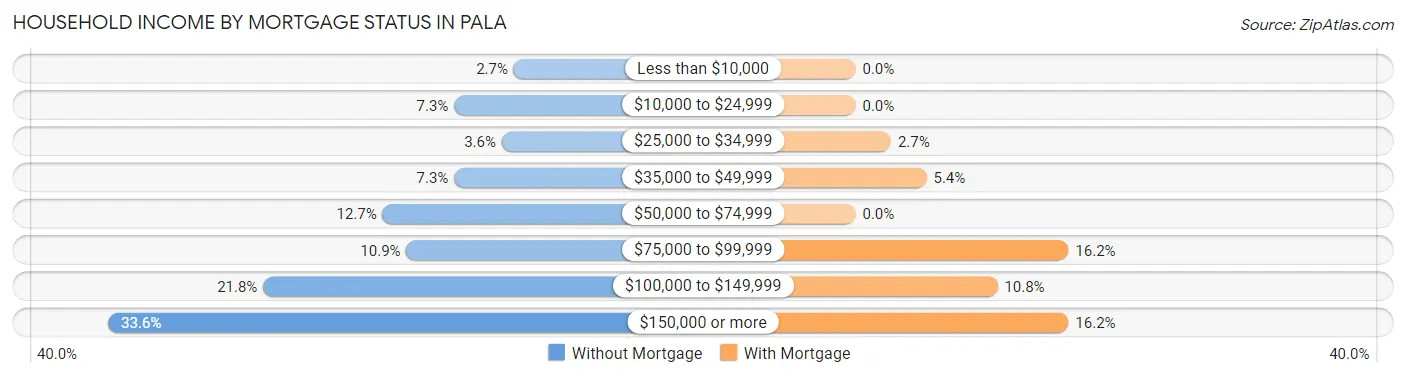
| Household Income | Without Mortgage | With Mortgage |
| Less than $10,000 | 3 (2.7%) | 0 (0.0%) |
| $10,000 to $24,999 | 8 (7.3%) | 0 (0.0%) |
| $25,000 to $34,999 | 4 (3.6%) | 2 (2.7%) |
| $35,000 to $49,999 | 8 (7.3%) | 4 (5.4%) |
| $50,000 to $74,999 | 14 (12.7%) | 0 (0.0%) |
| $75,000 to $99,999 | 12 (10.9%) | 12 (16.2%) |
| $100,000 to $149,999 | 24 (21.8%) | 8 (10.8%) |
| $150,000 or more | 37 (33.6%) | 12 (16.2%) |
| Total | 110 (100.0%) | 74 (100.0%) |
Property Value to Household Income Ratio in Pala
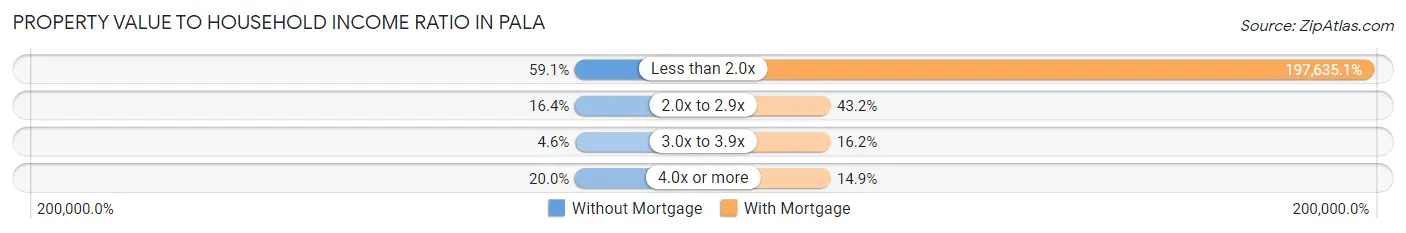
| Value-to-Income Ratio | Without Mortgage | With Mortgage |
| Less than 2.0x | 65 (59.1%) | 146,250 (197,635.1%) |
| 2.0x to 2.9x | 18 (16.4%) | 32 (43.2%) |
| 3.0x to 3.9x | 5 (4.5%) | 12 (16.2%) |
| 4.0x or more | 22 (20.0%) | 11 (14.9%) |
| Total | 110 (100.0%) | 74 (100.0%) |
Real Estate Taxes by Mortgage Status in Pala
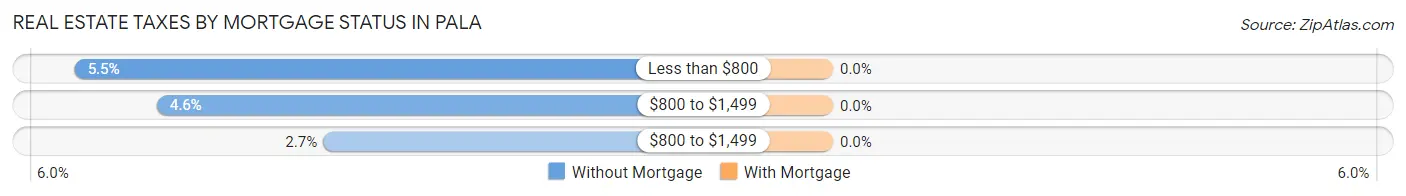
| Property Taxes | Without Mortgage | With Mortgage |
| Less than $800 | 6 (5.4%) | 0 (0.0%) |
| $800 to $1,499 | 5 (4.5%) | 0 (0.0%) |
| $800 to $1,499 | 3 (2.7%) | 0 (0.0%) |
| Total | 110 (100.0%) | 74 (100.0%) |
Health & Disability in Pala
Health Insurance Coverage by Age in Pala
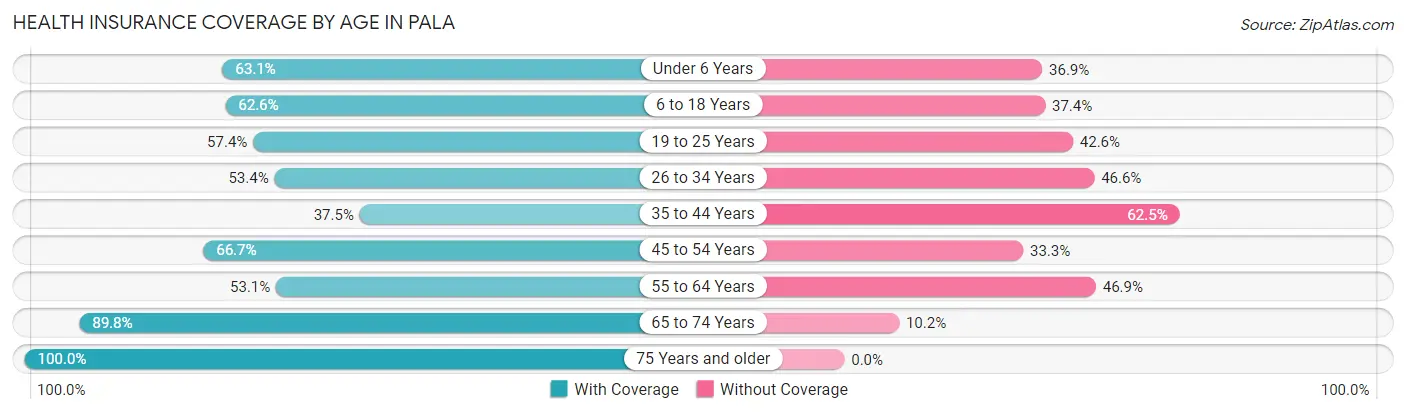
| Age Bracket | With Coverage | Without Coverage |
| Under 6 Years | 65 (63.1%) | 38 (36.9%) |
| 6 to 18 Years | 137 (62.6%) | 82 (37.4%) |
| 19 to 25 Years | 70 (57.4%) | 52 (42.6%) |
| 26 to 34 Years | 55 (53.4%) | 48 (46.6%) |
| 35 to 44 Years | 39 (37.5%) | 65 (62.5%) |
| 45 to 54 Years | 80 (66.7%) | 40 (33.3%) |
| 55 to 64 Years | 60 (53.1%) | 53 (46.9%) |
| 65 to 74 Years | 44 (89.8%) | 5 (10.2%) |
| 75 Years and older | 55 (100.0%) | 0 (0.0%) |
| Total | 605 (61.2%) | 383 (38.8%) |
Health Insurance Coverage by Citizenship Status in Pala
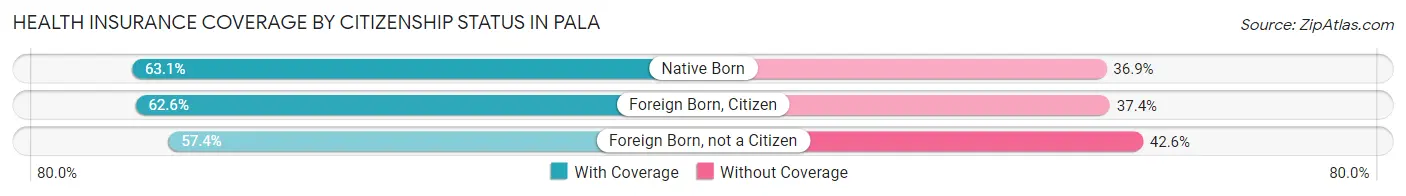
| Citizenship Status | With Coverage | Without Coverage |
| Native Born | 65 (63.1%) | 38 (36.9%) |
| Foreign Born, Citizen | 137 (62.6%) | 82 (37.4%) |
| Foreign Born, not a Citizen | 70 (57.4%) | 52 (42.6%) |
Health Insurance Coverage by Household Income in Pala
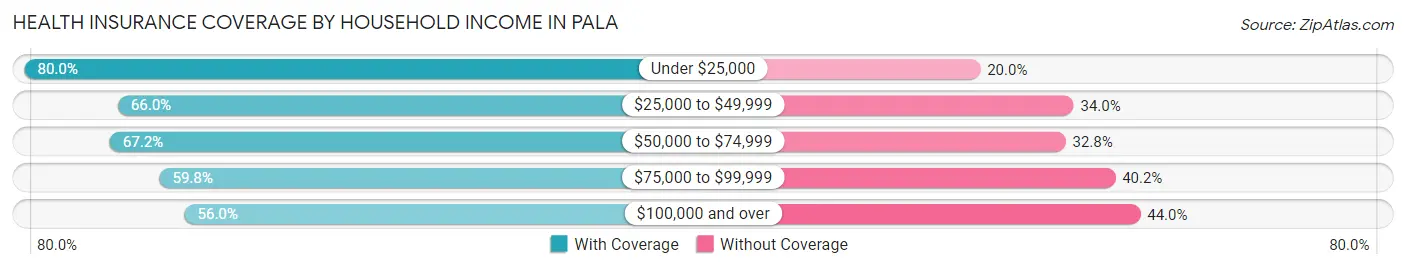
| Household Income | With Coverage | Without Coverage |
| Under $25,000 | 48 (80.0%) | 12 (20.0%) |
| $25,000 to $49,999 | 134 (66.0%) | 69 (34.0%) |
| $50,000 to $74,999 | 82 (67.2%) | 40 (32.8%) |
| $75,000 to $99,999 | 52 (59.8%) | 35 (40.2%) |
| $100,000 and over | 289 (56.0%) | 227 (44.0%) |
Public vs Private Health Insurance Coverage by Age in Pala
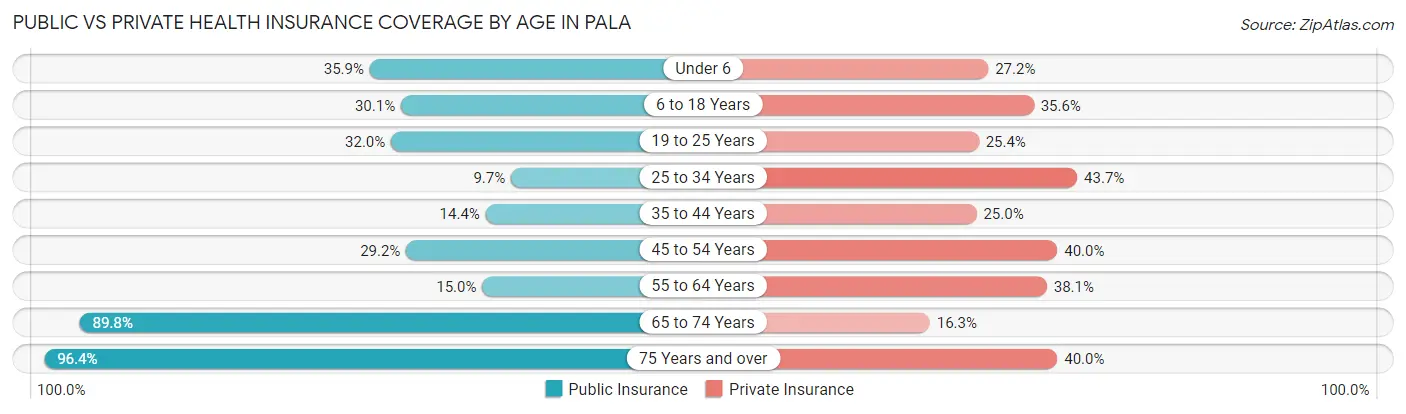
| Age Bracket | Public Insurance | Private Insurance |
| Under 6 | 37 (35.9%) | 28 (27.2%) |
| 6 to 18 Years | 66 (30.1%) | 78 (35.6%) |
| 19 to 25 Years | 39 (32.0%) | 31 (25.4%) |
| 25 to 34 Years | 10 (9.7%) | 45 (43.7%) |
| 35 to 44 Years | 15 (14.4%) | 26 (25.0%) |
| 45 to 54 Years | 35 (29.2%) | 48 (40.0%) |
| 55 to 64 Years | 17 (15.0%) | 43 (38.1%) |
| 65 to 74 Years | 44 (89.8%) | 8 (16.3%) |
| 75 Years and over | 53 (96.4%) | 22 (40.0%) |
| Total | 316 (32.0%) | 329 (33.3%) |
Disability Status by Sex by Age in Pala
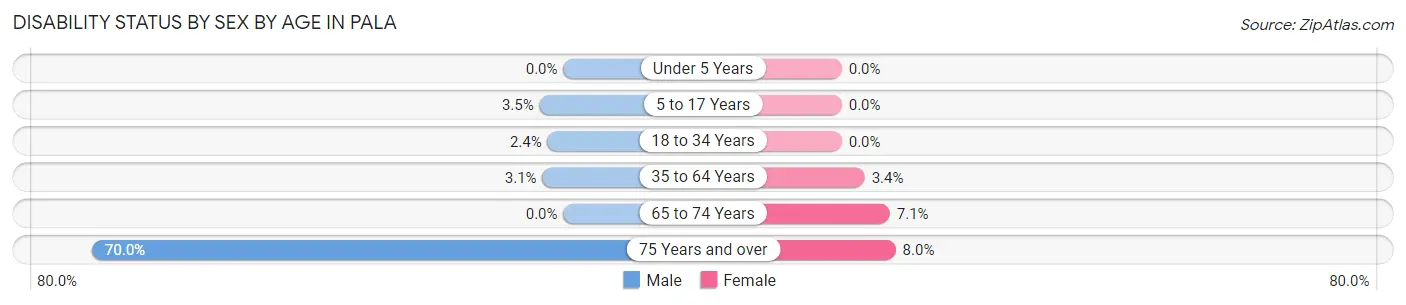
| Age Bracket | Male | Female |
| Under 5 Years | 0 (0.0%) | 0 (0.0%) |
| 5 to 17 Years | 3 (3.5%) | 0 (0.0%) |
| 18 to 34 Years | 2 (2.4%) | 0 (0.0%) |
| 35 to 64 Years | 5 (3.1%) | 6 (3.4%) |
| 65 to 74 Years | 0 (0.0%) | 2 (7.1%) |
| 75 Years and over | 21 (70.0%) | 2 (8.0%) |
Disability Class by Sex by Age in Pala
Disability Class: Hearing Difficulty
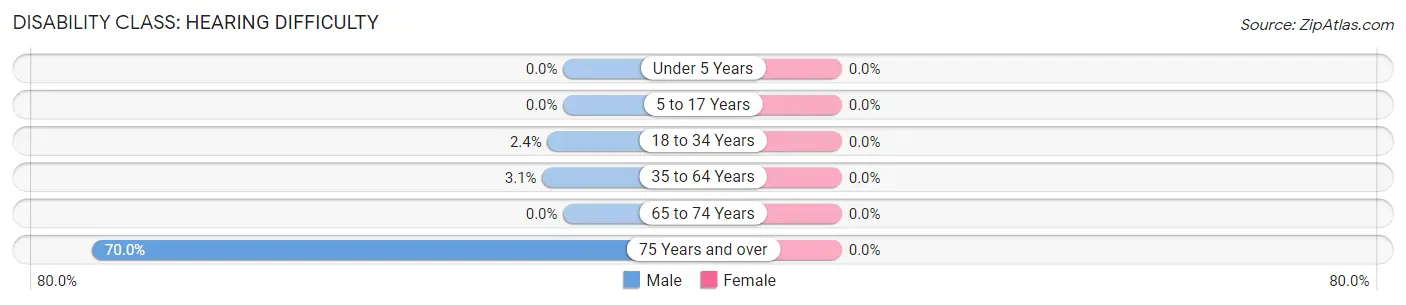
| Age Bracket | Male | Female |
| Under 5 Years | 0 (0.0%) | 0 (0.0%) |
| 5 to 17 Years | 0 (0.0%) | 0 (0.0%) |
| 18 to 34 Years | 2 (2.4%) | 0 (0.0%) |
| 35 to 64 Years | 5 (3.1%) | 0 (0.0%) |
| 65 to 74 Years | 0 (0.0%) | 0 (0.0%) |
| 75 Years and over | 21 (70.0%) | 0 (0.0%) |
Disability Class: Vision Difficulty
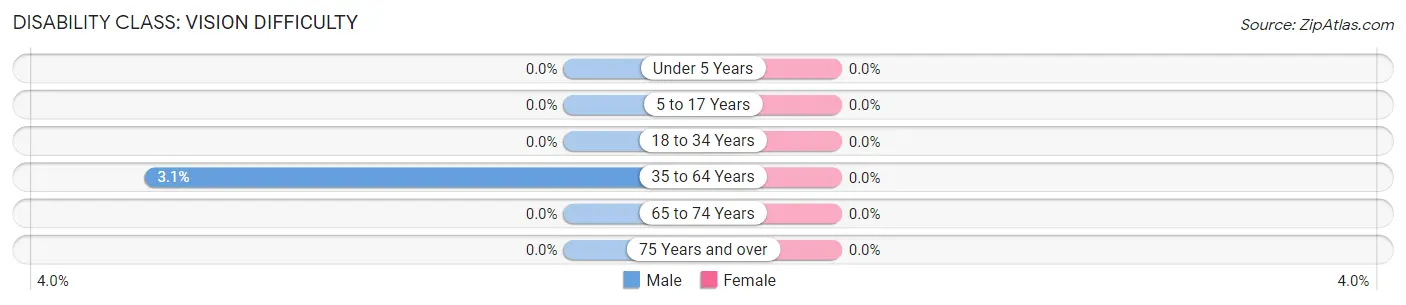
| Age Bracket | Male | Female |
| Under 5 Years | 0 (0.0%) | 0 (0.0%) |
| 5 to 17 Years | 0 (0.0%) | 0 (0.0%) |
| 18 to 34 Years | 0 (0.0%) | 0 (0.0%) |
| 35 to 64 Years | 5 (3.1%) | 0 (0.0%) |
| 65 to 74 Years | 0 (0.0%) | 0 (0.0%) |
| 75 Years and over | 0 (0.0%) | 0 (0.0%) |
Disability Class: Cognitive Difficulty
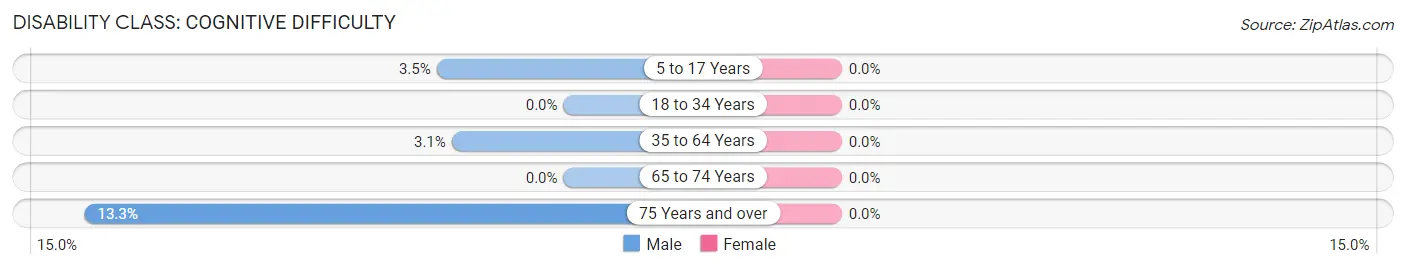
| Age Bracket | Male | Female |
| 5 to 17 Years | 3 (3.5%) | 0 (0.0%) |
| 18 to 34 Years | 0 (0.0%) | 0 (0.0%) |
| 35 to 64 Years | 5 (3.1%) | 0 (0.0%) |
| 65 to 74 Years | 0 (0.0%) | 0 (0.0%) |
| 75 Years and over | 4 (13.3%) | 0 (0.0%) |
Disability Class: Ambulatory Difficulty
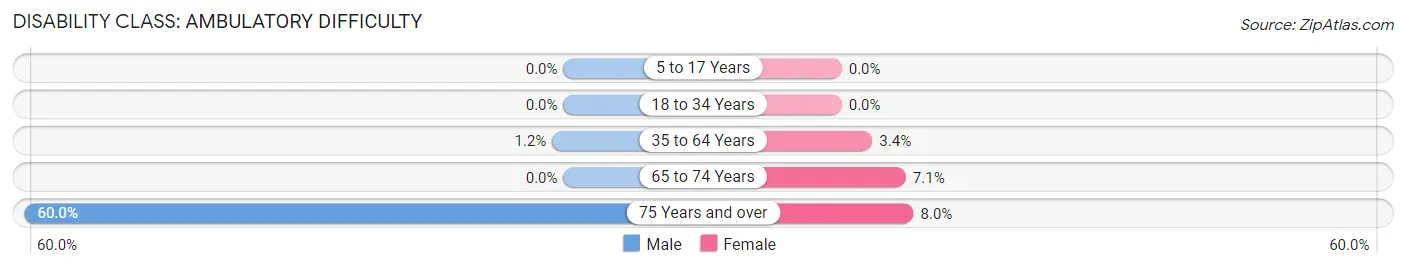
| Age Bracket | Male | Female |
| 5 to 17 Years | 0 (0.0%) | 0 (0.0%) |
| 18 to 34 Years | 0 (0.0%) | 0 (0.0%) |
| 35 to 64 Years | 2 (1.2%) | 6 (3.4%) |
| 65 to 74 Years | 0 (0.0%) | 2 (7.1%) |
| 75 Years and over | 18 (60.0%) | 2 (8.0%) |
Disability Class: Self-Care Difficulty
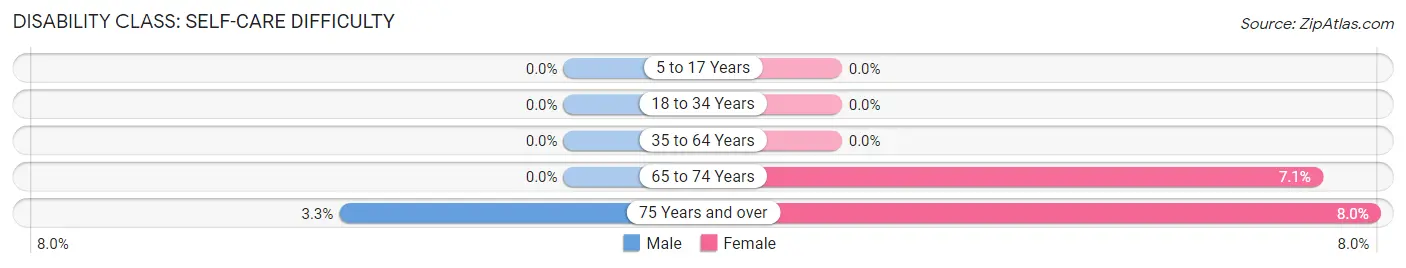
| Age Bracket | Male | Female |
| 5 to 17 Years | 0 (0.0%) | 0 (0.0%) |
| 18 to 34 Years | 0 (0.0%) | 0 (0.0%) |
| 35 to 64 Years | 0 (0.0%) | 0 (0.0%) |
| 65 to 74 Years | 0 (0.0%) | 2 (7.1%) |
| 75 Years and over | 1 (3.3%) | 2 (8.0%) |
Technology Access in Pala
Computing Device Access in Pala
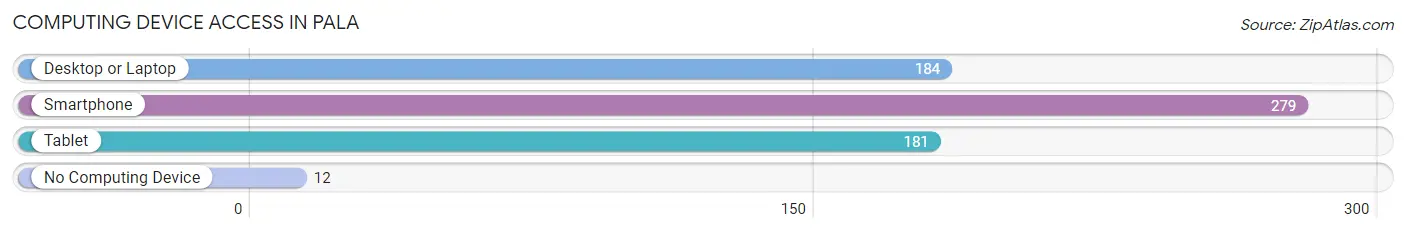
| Device Type | # Households | % Households |
| Desktop or Laptop | 184 | 62.2% |
| Smartphone | 279 | 94.3% |
| Tablet | 181 | 61.2% |
| No Computing Device | 12 | 4.1% |
| Total | 296 | 100.0% |
Internet Access in Pala
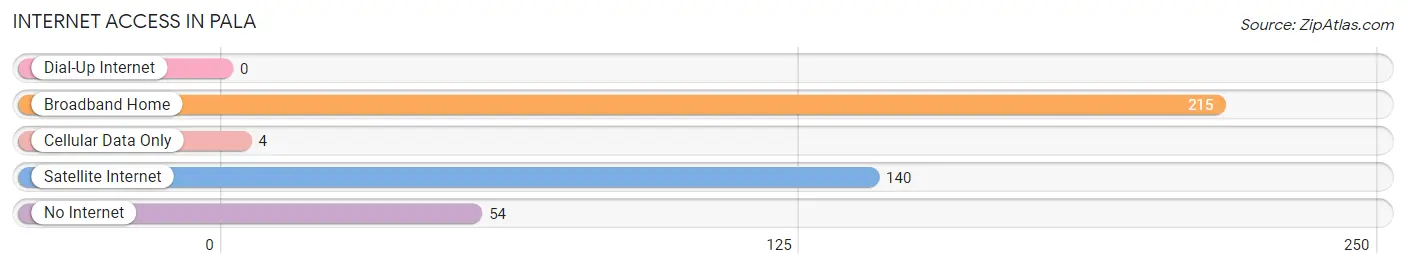
| Internet Type | # Households | % Households |
| Dial-Up Internet | 0 | 0.0% |
| Broadband Home | 215 | 72.6% |
| Cellular Data Only | 4 | 1.3% |
| Satellite Internet | 140 | 47.3% |
| No Internet | 54 | 18.2% |
| Total | 296 | 100.0% |
Pala Summary
Pala is a small unincorporated community located in the San Diego County of California. It is situated in the foothills of the Palomar Mountains, approximately 25 miles northeast of San Diego. The community is home to the Pala Indian Reservation, which is home to the Pala Band of Mission Indians. The population of Pala was estimated to be 1,521 in the 2010 census.
History
The Pala Band of Mission Indians is a federally recognized tribe of Luiseño Indians. The tribe is descended from the original inhabitants of the area, who were part of the Luiseño people. The Pala Band of Mission Indians was officially recognized by the United States government in 1875. The Pala Indian Reservation was established in 1875 and is located on approximately 13,000 acres of land.
The Pala Indian Reservation is home to the Pala Casino, which opened in 2001. The casino is owned and operated by the Pala Band of Mission Indians and is one of the largest employers in the area. The casino has become a major source of revenue for the tribe and has helped to improve the quality of life for the members of the tribe.
Geography
Pala is located in the foothills of the Palomar Mountains in San Diego County. The community is situated at an elevation of 1,845 feet above sea level. The climate in Pala is classified as Mediterranean, with hot, dry summers and mild, wet winters. The average annual temperature is 68°F and the average annual precipitation is 17 inches.
The Pala Indian Reservation is located within the Pala Valley and is surrounded by the Palomar Mountains. The reservation is home to a variety of wildlife, including deer, coyotes, bobcats, and mountain lions. The Pala Valley is also home to a variety of plant life, including oaks, sycamores, and manzanitas.
Economy
The economy of Pala is largely based on the Pala Indian Reservation and the Pala Casino. The casino is the largest employer in the area and provides jobs for many of the residents of Pala. The casino also generates revenue for the tribe, which is used to fund tribal programs and services.
In addition to the casino, the Pala Indian Reservation is home to a variety of businesses, including a gas station, a grocery store, and a restaurant. The reservation also has a museum and cultural center, which is open to the public.
Demographics
The population of Pala was estimated to be 1,521 in the 2010 census. The population is primarily Native American, with the majority of the population being members of the Pala Band of Mission Indians. The median age of the population is 37.7 years, and the median household income is $45,000.
The Pala Indian Reservation is home to a variety of cultural and recreational activities. The reservation is home to a museum and cultural center, which is open to the public. The reservation also has a variety of outdoor activities, including hiking, camping, and fishing.
Conclusion
Pala is a small unincorporated community located in the San Diego County of California. It is situated in the foothills of the Palomar Mountains, approximately 25 miles northeast of San Diego. The community is home to the Pala Indian Reservation, which is home to the Pala Band of Mission Indians. The population of Pala was estimated to be 1,521 in the 2010 census. The economy of Pala is largely based on the Pala Indian Reservation and the Pala Casino. The casino is the largest employer in the area and provides jobs for many of the residents of Pala. The median age of the population is 37.7 years, and the median household income is $45,000. The Pala Indian Reservation is home to a variety of cultural and recreational activities, including a museum and cultural center, hiking, camping, and fishing.
Common Questions
What is Per Capita Income in Pala?
Per Capita income in Pala is $37,680.
What is the Median Family Income in Pala?
Median Family Income in Pala is $101,667.
What is the Median Household income in Pala?
Median Household Income in Pala is $91,875.
What is Income or Wage Gap in Pala?
Income or Wage Gap in Pala is 12.0%.
Women in Pala earn 88.0 cents for every dollar earned by a man.
What is Family Income Deficit in Pala?
Family Income Deficit in Pala is $9,140.
Families that are below poverty line in Pala earn $9,140 less on average than the poverty threshold level.
What is Inequality or Gini Index in Pala?
Inequality or Gini Index in Pala is 0.43.
What is the Total Population of Pala?
Total Population of Pala is 988.
What is the Total Male Population of Pala?
Total Male Population of Pala is 427.
What is the Total Female Population of Pala?
Total Female Population of Pala is 561.
What is the Ratio of Males per 100 Females in Pala?
There are 76.11 Males per 100 Females in Pala.
What is the Ratio of Females per 100 Males in Pala?
There are 131.38 Females per 100 Males in Pala.
What is the Median Population Age in Pala?
Median Population Age in Pala is 31.7 Years.
What is the Average Family Size in Pala
Average Family Size in Pala is 3.9 People.
What is the Average Household Size in Pala
Average Household Size in Pala is 3.3 People.
How Large is the Labor Force in Pala?
There are 332 People in the Labor Forcein in Pala.
What is the Percentage of People in the Labor Force in Pala?
46.6% of People are in the Labor Force in Pala.
What is the Unemployment Rate in Pala?
Unemployment Rate in Pala is 7.5%.