Zip Codes with the Highest Percentage of Population Employed in Health Care & Social Assistance in Oroville, CA
RELATED REPORTS & OPTIONS
Health Care & Social Assistance
Oroville
Compare Zip Codes
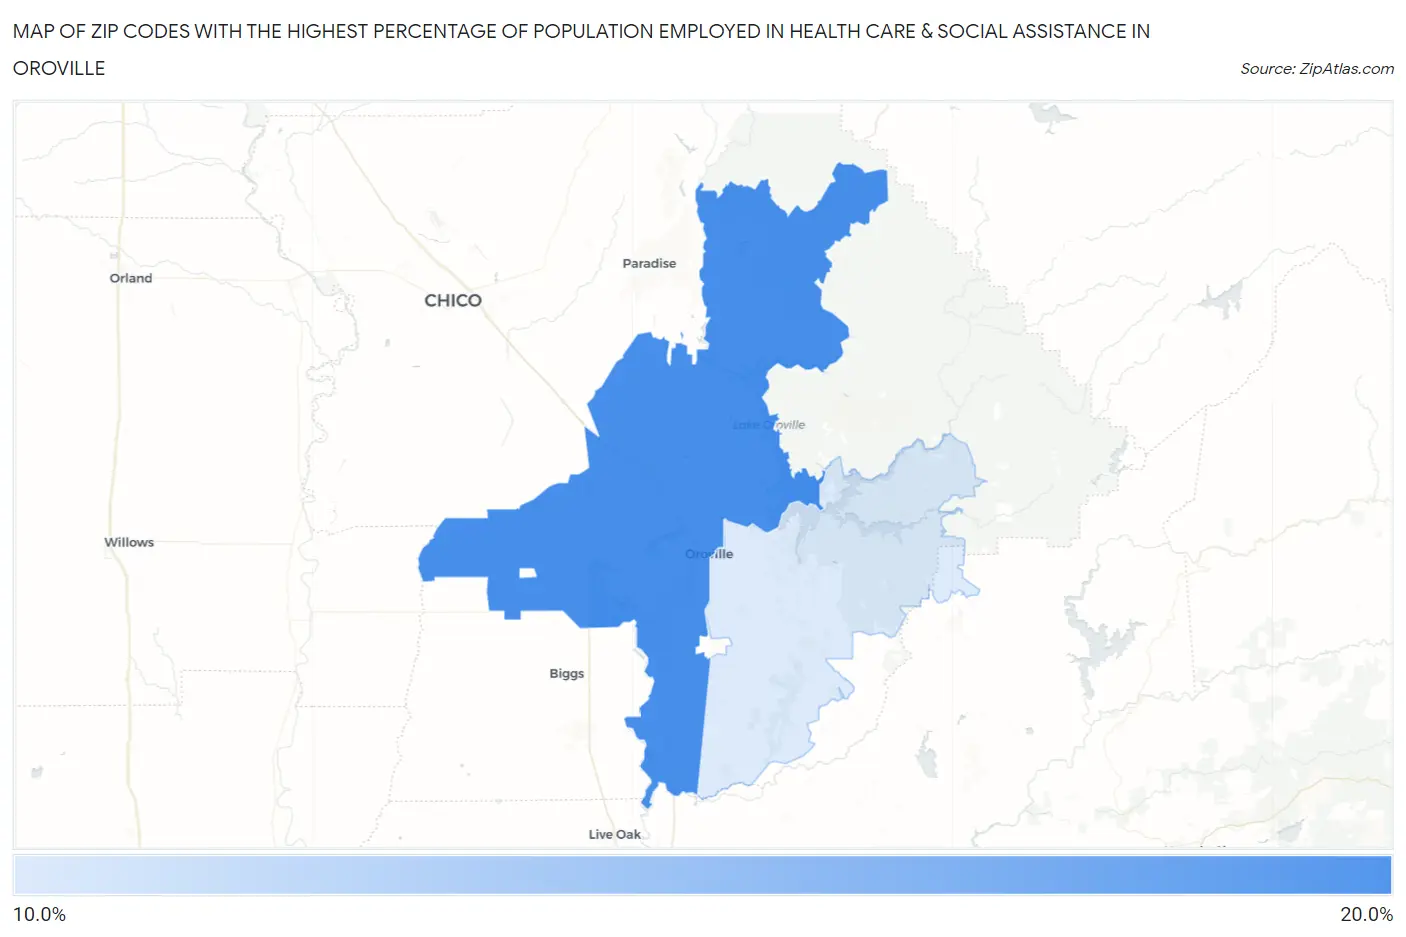
Map of Zip Codes with the Highest Percentage of Population Employed in Health Care & Social Assistance in Oroville
0.0%
20.0%
Zip Codes with the Highest Percentage of Population Employed in Health Care & Social Assistance in Oroville, CA
| Zip Code | % Employed | vs State | vs National | |
| 1. | 95965 | 19.1% | 12.7%(+6.33)#116 | 13.9%(+5.14)#4,913 |
| 2. | 95966 | 16.1% | 12.7%(+3.36)#267 | 13.9%(+2.17)#9,311 |
1
Common Questions
What are the Top Zip Codes with the Highest Percentage of Population Employed in Health Care & Social Assistance in Oroville, CA?
Top Zip Codes with the Highest Percentage of Population Employed in Health Care & Social Assistance in Oroville, CA are:
What zip code has the Highest Percentage of Population Employed in Health Care & Social Assistance in Oroville, CA?
95965 has the Highest Percentage of Population Employed in Health Care & Social Assistance in Oroville, CA with 19.1%.
What is the Percentage of Population Employed in Health Care & Social Assistance in Oroville, CA?
Percentage of Population Employed in Health Care & Social Assistance in Oroville is 19.5%.
What is the Percentage of Population Employed in Health Care & Social Assistance in California?
Percentage of Population Employed in Health Care & Social Assistance in California is 12.7%.
What is the Percentage of Population Employed in Health Care & Social Assistance in the United States?
Percentage of Population Employed in Health Care & Social Assistance in the United States is 13.9%.