Zip Codes with the Highest Percentage of Households Heated by Bottled Gas / Liquid Propane in Oroville, CA
RELATED REPORTS & OPTIONS
Bottled Gas / LP Heating
Oroville
Compare Zip Codes
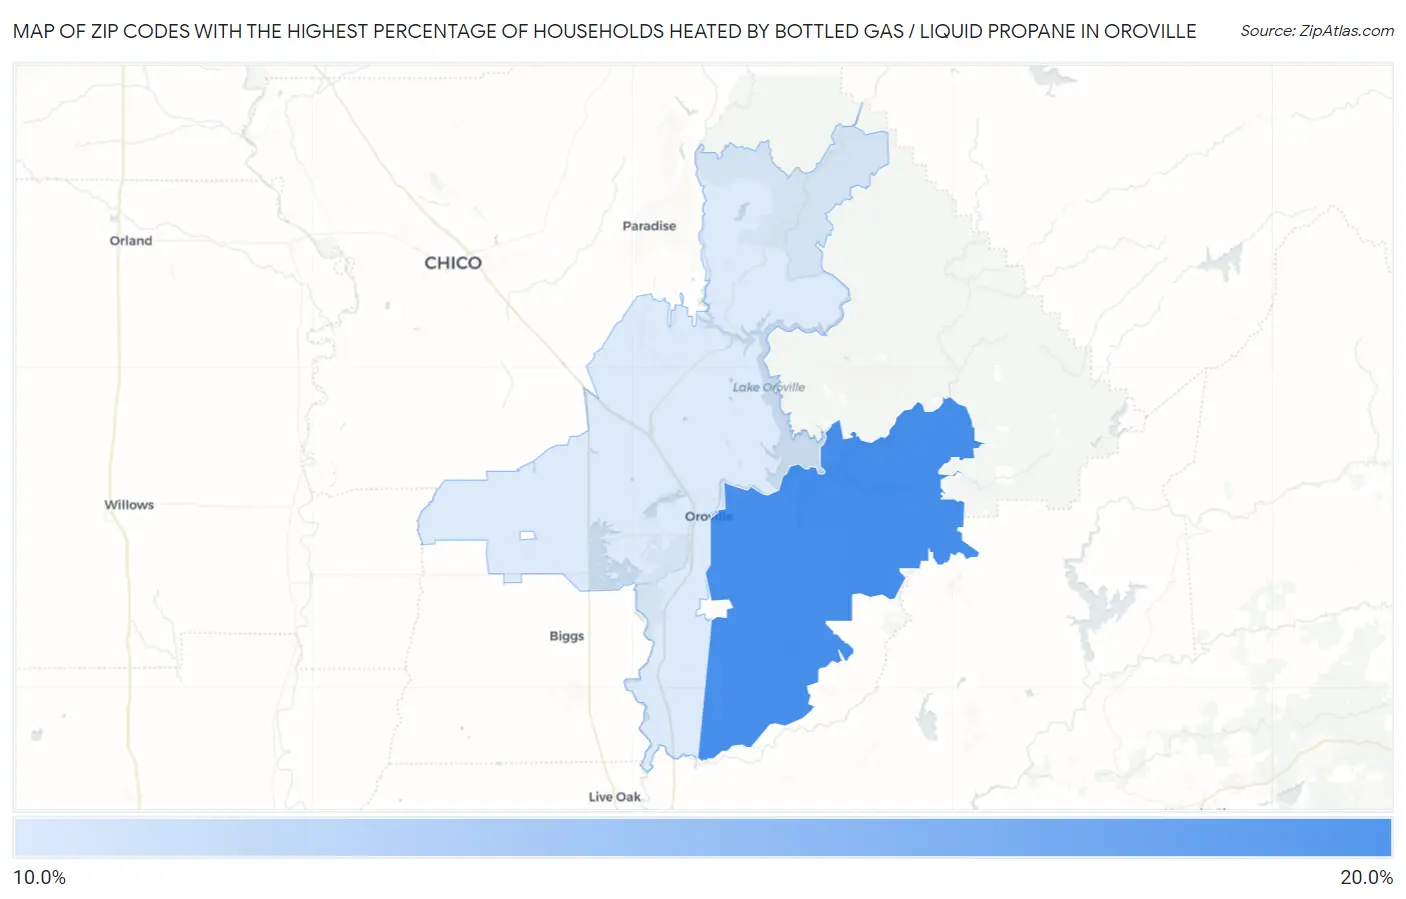
Map of Zip Codes with the Highest Percentage of Households Heated by Bottled Gas / Liquid Propane in Oroville
11.1%
18.9%
Zip Codes with the Highest Percentage of Households Heated by Bottled Gas / Liquid Propane in Oroville, CA
| Zip Code | Bottled Gas / LP Heating | vs State | vs National | |
| 1. | 95966 | 18.9% | 3.5%(+15.4)#341 | 4.9%(+14.0)#9,365 |
| 2. | 95965 | 11.1% | 3.5%(+7.60)#470 | 4.9%(+6.20)#13,680 |
1
Common Questions
What are the Top Zip Codes with the Highest Percentage of Households Heated by Bottled Gas / Liquid Propane in Oroville, CA?
Top Zip Codes with the Highest Percentage of Households Heated by Bottled Gas / Liquid Propane in Oroville, CA are:
What zip code has the Highest Percentage of Households Heated by Bottled Gas / Liquid Propane in Oroville, CA?
95966 has the Highest Percentage of Households Heated by Bottled Gas / Liquid Propane in Oroville, CA with 18.9%.
What is the Percentage of Households Heated by Bottled Gas / Liquid Propane in Oroville, CA?
Percentage of Households Heated by Bottled Gas / Liquid Propane in Oroville is 3.6%.
What is the Percentage of Households Heated by Bottled Gas / Liquid Propane in California?
Percentage of Households Heated by Bottled Gas / Liquid Propane in California is 3.5%.
What is the Percentage of Households Heated by Bottled Gas / Liquid Propane in the United States?
Percentage of Households Heated by Bottled Gas / Liquid Propane in the United States is 4.9%.