Nuevo, CA Map & Demographics
Nuevo Map
Nuevo Overview
$30,515
PER CAPITA INCOME
$110,074
AVG FAMILY INCOME
$103,603
AVG HOUSEHOLD INCOME
33.0%
WAGE / INCOME GAP [ % ]
67.0¢/ $1
WAGE / INCOME GAP [ $ ]
$8,521
FAMILY INCOME DEFICIT
0.38
INEQUALITY / GINI INDEX
7,305
TOTAL POPULATION
3,366
MALE POPULATION
3,939
FEMALE POPULATION
85.45
MALES / 100 FEMALES
117.02
FEMALES / 100 MALES
31.4
MEDIAN AGE
4.3
AVG FAMILY SIZE
4.0
AVG HOUSEHOLD SIZE
3,408
LABOR FORCE [ PEOPLE ]
62.4%
PERCENT IN LABOR FORCE
6.9%
UNEMPLOYMENT RATE
Nuevo Zip Codes
Nuevo Area Codes
Income in Nuevo
Income Overview in Nuevo
Per Capita Income in Nuevo is $30,515, while median incomes of families and households are $110,074 and $103,603 respectively.
| Characteristic | Number | Measure |
| Per Capita Income | 7,305 | $30,515 |
| Median Family Income | 1,561 | $110,074 |
| Mean Family Income | 1,561 | $127,673 |
| Median Household Income | 1,811 | $103,603 |
| Mean Household Income | 1,811 | $121,150 |
| Income Deficit | 1,561 | $8,521 |
| Wage / Income Gap (%) | 7,305 | 33.04% |
| Wage / Income Gap ($) | 7,305 | 66.96¢ per $1 |
| Gini / Inequality Index | 7,305 | 0.38 |
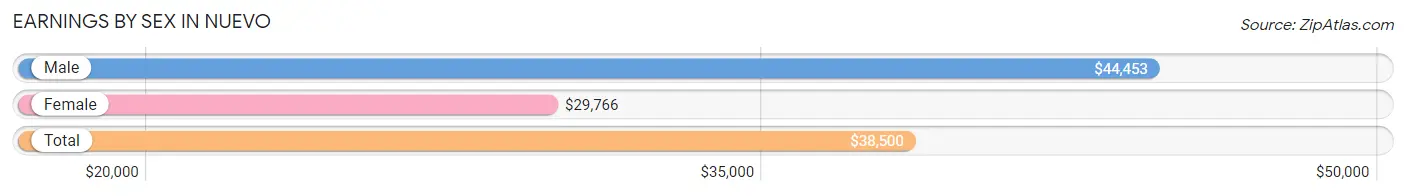
Earnings by Sex in Nuevo
Average Earnings in Nuevo are $38,500, $44,453 for men and $29,766 for women, a difference of 33.0%.
| Sex | Number | Average Earnings |
| Male | 1,746 (52.1%) | $44,453 |
| Female | 1,604 (47.9%) | $29,766 |
| Total | 3,350 (100.0%) | $38,500 |
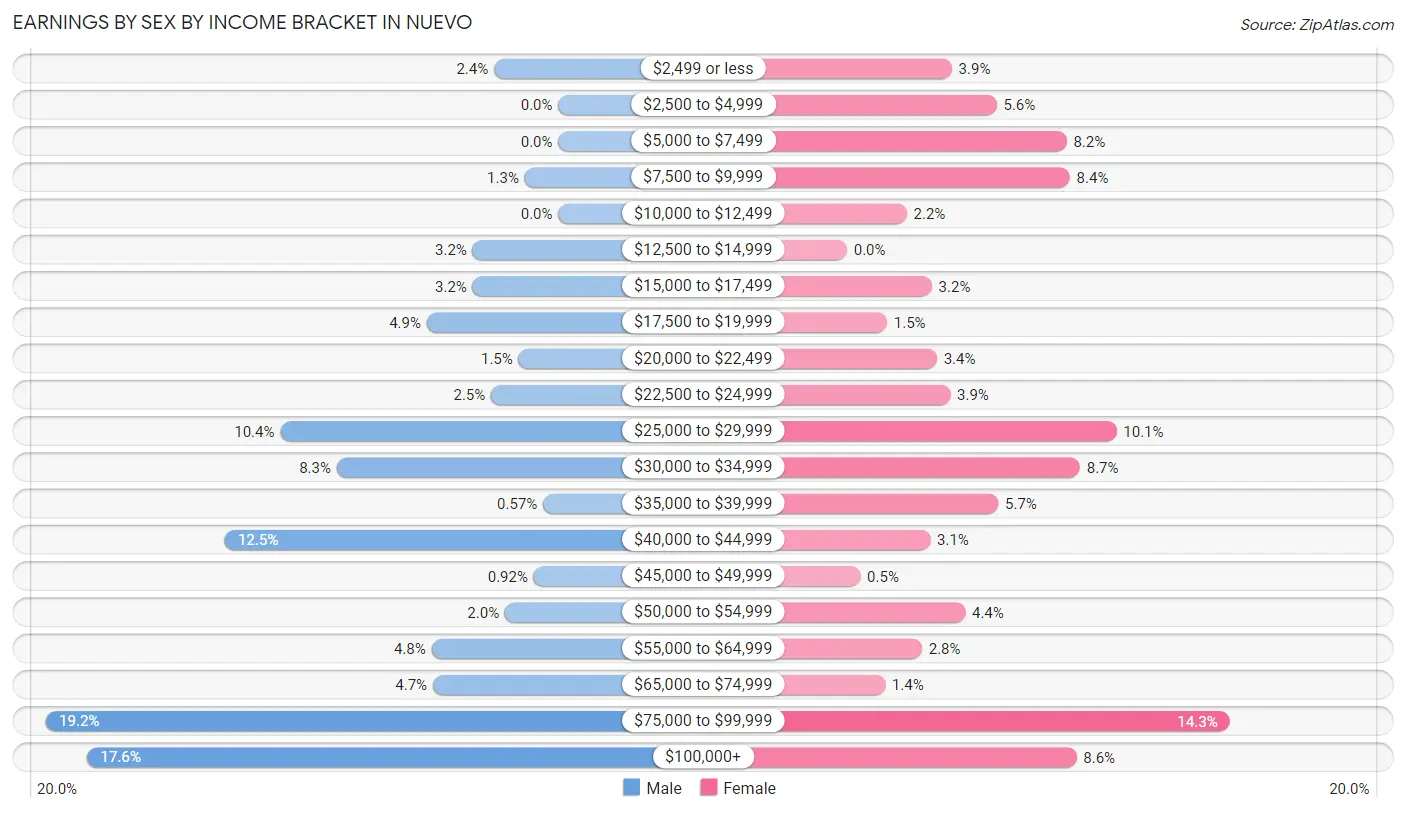
Earnings by Sex by Income Bracket in Nuevo
The most common earnings brackets in Nuevo are $75,000 to $99,999 for men (335 | 19.2%) and $75,000 to $99,999 for women (230 | 14.3%).
| Income | Male | Female |
| $2,499 or less | 42 (2.4%) | 63 (3.9%) |
| $2,500 to $4,999 | 0 (0.0%) | 90 (5.6%) |
| $5,000 to $7,499 | 0 (0.0%) | 132 (8.2%) |
| $7,500 to $9,999 | 22 (1.3%) | 134 (8.4%) |
| $10,000 to $12,499 | 0 (0.0%) | 36 (2.2%) |
| $12,500 to $14,999 | 56 (3.2%) | 0 (0.0%) |
| $15,000 to $17,499 | 56 (3.2%) | 51 (3.2%) |
| $17,500 to $19,999 | 86 (4.9%) | 24 (1.5%) |
| $20,000 to $22,499 | 26 (1.5%) | 54 (3.4%) |
| $22,500 to $24,999 | 44 (2.5%) | 62 (3.9%) |
| $25,000 to $29,999 | 182 (10.4%) | 162 (10.1%) |
| $30,000 to $34,999 | 145 (8.3%) | 140 (8.7%) |
| $35,000 to $39,999 | 10 (0.6%) | 91 (5.7%) |
| $40,000 to $44,999 | 218 (12.5%) | 50 (3.1%) |
| $45,000 to $49,999 | 16 (0.9%) | 8 (0.5%) |
| $50,000 to $54,999 | 35 (2.0%) | 71 (4.4%) |
| $55,000 to $64,999 | 83 (4.8%) | 45 (2.8%) |
| $65,000 to $74,999 | 82 (4.7%) | 23 (1.4%) |
| $75,000 to $99,999 | 335 (19.2%) | 230 (14.3%) |
| $100,000+ | 308 (17.6%) | 138 (8.6%) |
| Total | 1,746 (100.0%) | 1,604 (100.0%) |
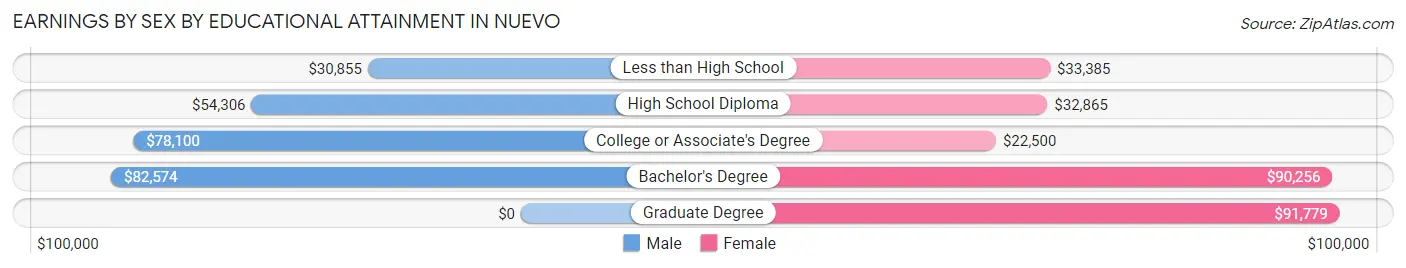
Earnings by Sex by Educational Attainment in Nuevo
Average earnings in Nuevo are $62,993 for men and $33,455 for women, a difference of 46.9%. Men with an educational attainment of bachelor's degree enjoy the highest average annual earnings of $82,574, while those with less than high school education earn the least with $30,855. Women with an educational attainment of graduate degree earn the most with the average annual earnings of $91,779, while those with college or associate's degree education have the smallest earnings of $22,500.
| Educational Attainment | Male Income | Female Income |
| Less than High School | $30,855 | $33,385 |
| High School Diploma | $54,306 | $32,865 |
| College or Associate's Degree | $78,100 | $22,500 |
| Bachelor's Degree | $82,574 | $90,256 |
| Graduate Degree | - | - |
| Total | $62,993 | $33,455 |
Family Income in Nuevo
Family Income Brackets in Nuevo
According to the Nuevo family income data, there are 342 families falling into the $150,000 to $199,999 income range, which is the most common income bracket and makes up 21.9% of all families.
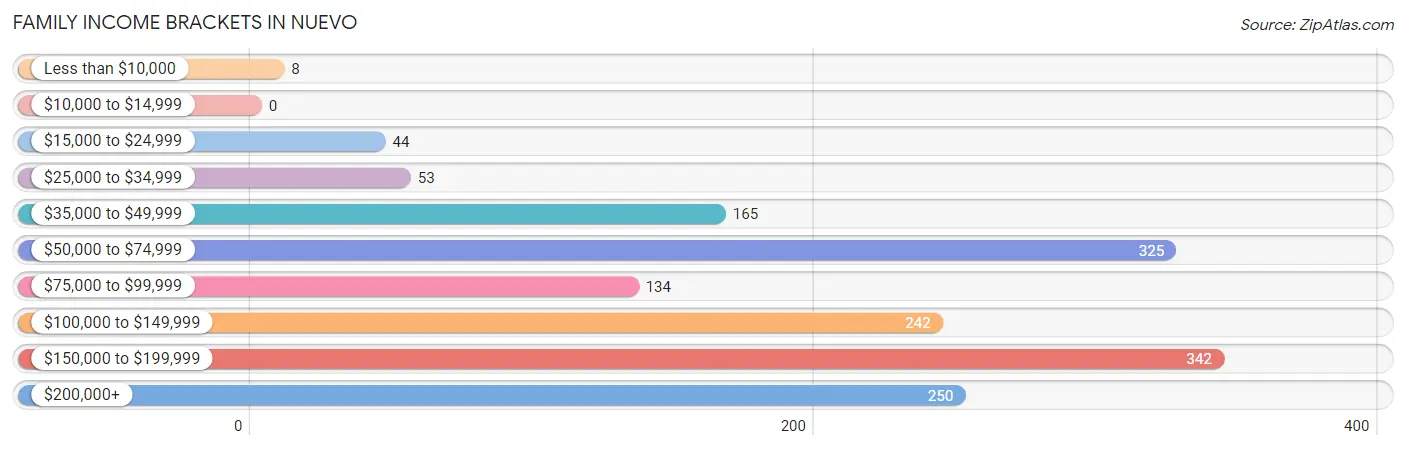
| Income Bracket | # Families | % Families |
| Less than $10,000 | 8 | 0.5% |
| $10,000 to $14,999 | 0 | 0.0% |
| $15,000 to $24,999 | 44 | 2.8% |
| $25,000 to $34,999 | 53 | 3.4% |
| $35,000 to $49,999 | 165 | 10.6% |
| $50,000 to $74,999 | 325 | 20.8% |
| $75,000 to $99,999 | 134 | 8.6% |
| $100,000 to $149,999 | 242 | 15.5% |
| $150,000 to $199,999 | 342 | 21.9% |
| $200,000+ | 250 | 16.0% |
Family Income by Famaliy Size in Nuevo
4-person families (423 | 27.1%) account for the highest median family income in Nuevo with $152,601 per family, while 4-person families (423 | 27.1%) have the highest median income of $38,150 per family member.
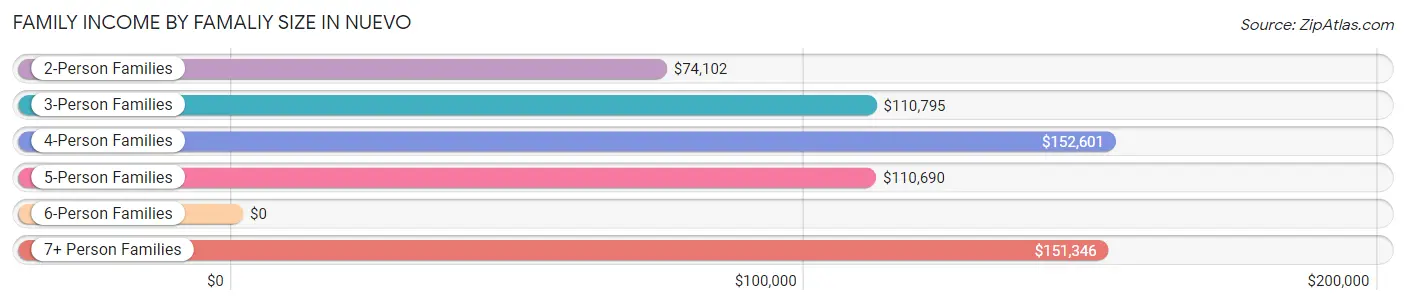
| Income Bracket | # Families | Median Income |
| 2-Person Families | 401 (25.7%) | $74,102 |
| 3-Person Families | 130 (8.3%) | $110,795 |
| 4-Person Families | 423 (27.1%) | $152,601 |
| 5-Person Families | 364 (23.3%) | $110,690 |
| 6-Person Families | 111 (7.1%) | $0 |
| 7+ Person Families | 132 (8.5%) | $151,346 |
| Total | 1,561 (100.0%) | $110,074 |
Family Income by Number of Earners in Nuevo
The median family income in Nuevo is $110,074, with families comprising 3+ earners (335) having the highest median family income of $183,594, while families with 1 earner (524) have the lowest median family income of $61,528, accounting for 21.5% and 33.6% of families, respectively.
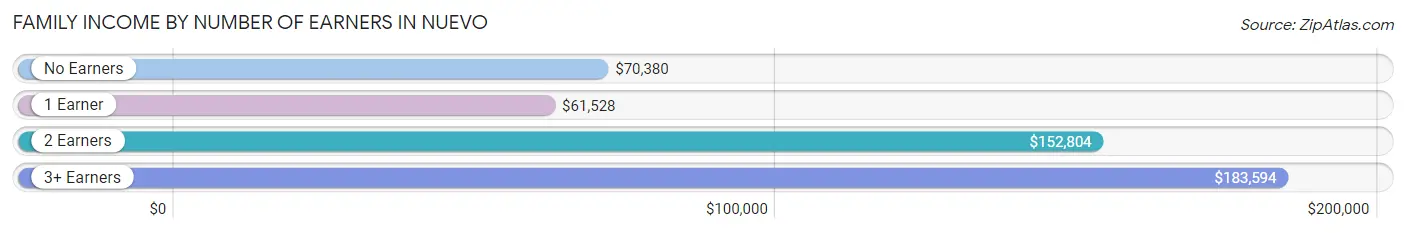
| Number of Earners | # Families | Median Income |
| No Earners | 143 (9.2%) | $70,380 |
| 1 Earner | 524 (33.6%) | $61,528 |
| 2 Earners | 559 (35.8%) | $152,804 |
| 3+ Earners | 335 (21.5%) | $183,594 |
| Total | 1,561 (100.0%) | $110,074 |
Household Income in Nuevo
Household Income Brackets in Nuevo
With 377 households falling in the category, the $150,000 to $199,999 income range is the most frequent in Nuevo, accounting for 20.8% of all households. In contrast, only 25 households (1.4%) fall into the less than $10,000 income bracket, making it the least populous group.
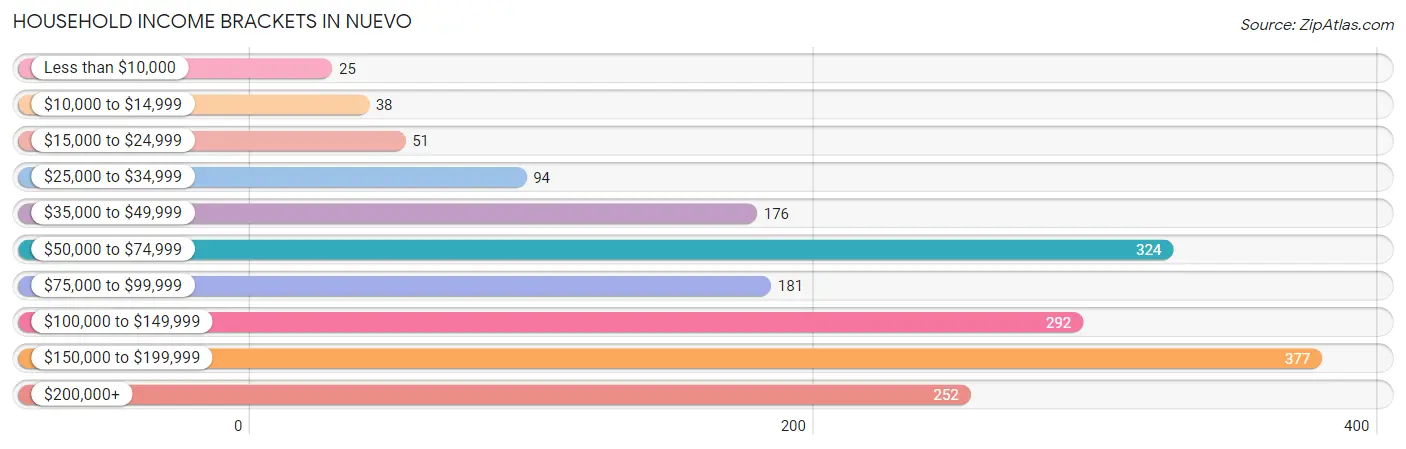
| Income Bracket | # Households | % Households |
| Less than $10,000 | 25 | 1.4% |
| $10,000 to $14,999 | 38 | 2.1% |
| $15,000 to $24,999 | 51 | 2.8% |
| $25,000 to $34,999 | 94 | 5.2% |
| $35,000 to $49,999 | 176 | 9.7% |
| $50,000 to $74,999 | 324 | 17.9% |
| $75,000 to $99,999 | 181 | 10.0% |
| $100,000 to $149,999 | 292 | 16.1% |
| $150,000 to $199,999 | 377 | 20.8% |
| $200,000+ | 252 | 13.9% |
Household Income by Householder Age in Nuevo
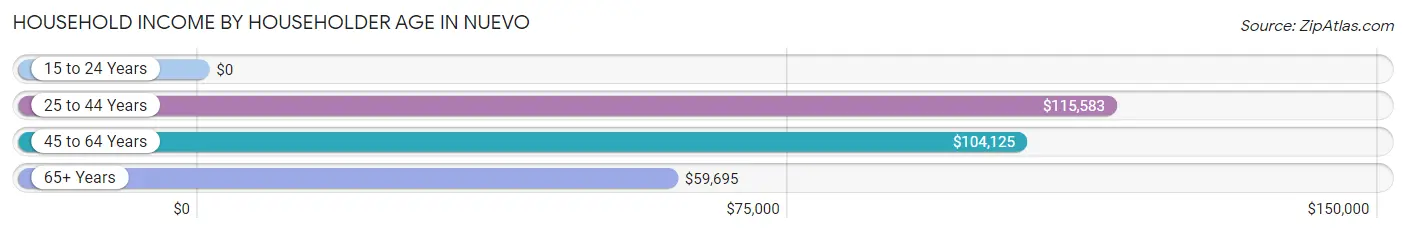
The median household income in Nuevo is $103,603, with the highest median household income of $115,583 found in the 25 to 44 years age bracket for the primary householder. A total of 779 households (43.0%) fall into this category. Meanwhile, the 15 to 24 years age bracket for the primary householder has the lowest median household income of $0, with 29 households (1.6%) in this group.
| Income Bracket | # Households | Median Income |
| 15 to 24 Years | 29 (1.6%) | $0 |
| 25 to 44 Years | 779 (43.0%) | $115,583 |
| 45 to 64 Years | 727 (40.1%) | $104,125 |
| 65+ Years | 276 (15.2%) | $59,695 |
| Total | 1,811 (100.0%) | $103,603 |
Poverty in Nuevo
Income Below Poverty by Sex and Age in Nuevo
With 13.3% poverty level for males and 9.8% for females among the residents of Nuevo, 16 and 17 year old males and 45 to 54 year old females are the most vulnerable to poverty, with 36 males (39.1%) and 78 females (18.4%) in their respective age groups living below the poverty level.
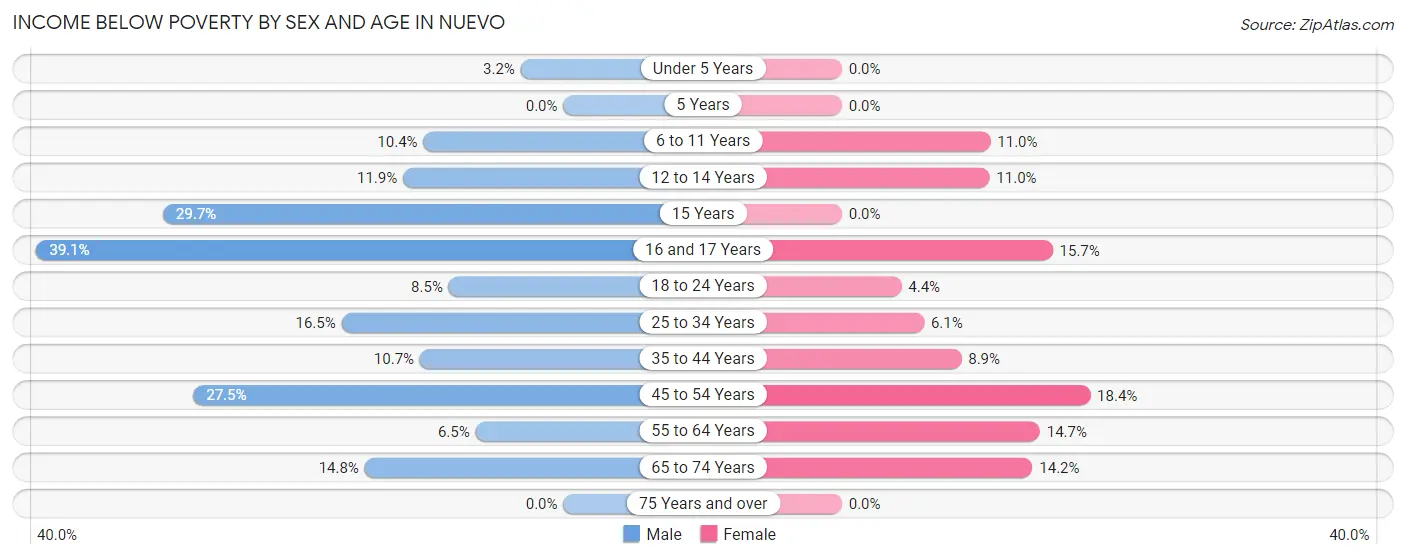
| Age Bracket | Male | Female |
| Under 5 Years | 9 (3.2%) | 0 (0.0%) |
| 5 Years | 0 (0.0%) | 0 (0.0%) |
| 6 to 11 Years | 35 (10.4%) | 31 (11.0%) |
| 12 to 14 Years | 25 (11.9%) | 41 (11.0%) |
| 15 Years | 11 (29.7%) | 0 (0.0%) |
| 16 and 17 Years | 36 (39.1%) | 41 (15.7%) |
| 18 to 24 Years | 28 (8.5%) | 20 (4.4%) |
| 25 to 34 Years | 83 (16.5%) | 28 (6.1%) |
| 35 to 44 Years | 51 (10.6%) | 48 (8.9%) |
| 45 to 54 Years | 114 (27.5%) | 78 (18.4%) |
| 55 to 64 Years | 26 (6.5%) | 66 (14.7%) |
| 65 to 74 Years | 27 (14.7%) | 30 (14.1%) |
| 75 Years and over | 0 (0.0%) | 0 (0.0%) |
| Total | 445 (13.3%) | 383 (9.8%) |
Income Above Poverty by Sex and Age in Nuevo
According to the poverty statistics in Nuevo, males aged 75 years and over and females aged under 5 years are the age groups that are most secure financially, with 100.0% of males and 100.0% of females in these age groups living above the poverty line.
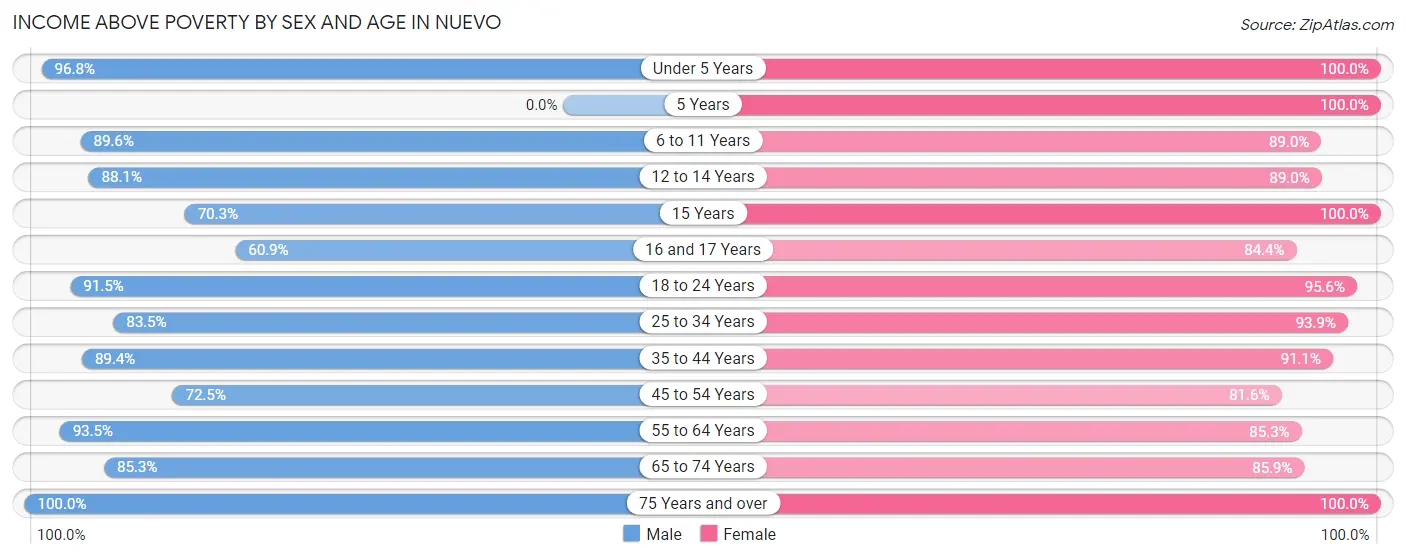
| Age Bracket | Male | Female |
| Under 5 Years | 275 (96.8%) | 230 (100.0%) |
| 5 Years | 0 (0.0%) | 7 (100.0%) |
| 6 to 11 Years | 302 (89.6%) | 250 (89.0%) |
| 12 to 14 Years | 185 (88.1%) | 333 (89.0%) |
| 15 Years | 26 (70.3%) | 54 (100.0%) |
| 16 and 17 Years | 56 (60.9%) | 221 (84.4%) |
| 18 to 24 Years | 301 (91.5%) | 433 (95.6%) |
| 25 to 34 Years | 421 (83.5%) | 431 (93.9%) |
| 35 to 44 Years | 428 (89.3%) | 493 (91.1%) |
| 45 to 54 Years | 301 (72.5%) | 345 (81.6%) |
| 55 to 64 Years | 373 (93.5%) | 383 (85.3%) |
| 65 to 74 Years | 156 (85.3%) | 182 (85.9%) |
| 75 Years and over | 77 (100.0%) | 185 (100.0%) |
| Total | 2,901 (86.7%) | 3,547 (90.2%) |
Income Below Poverty Among Married-Couple Families in Nuevo
The poverty statistics for married-couple families in Nuevo show that 6.1% or 76 of the total 1,255 families live below the poverty line. Families with 1 or 2 children have the highest poverty rate of 13.6%, comprising of 76 families. On the other hand, families with no children have the lowest poverty rate of 0.0%, which includes 0 families.
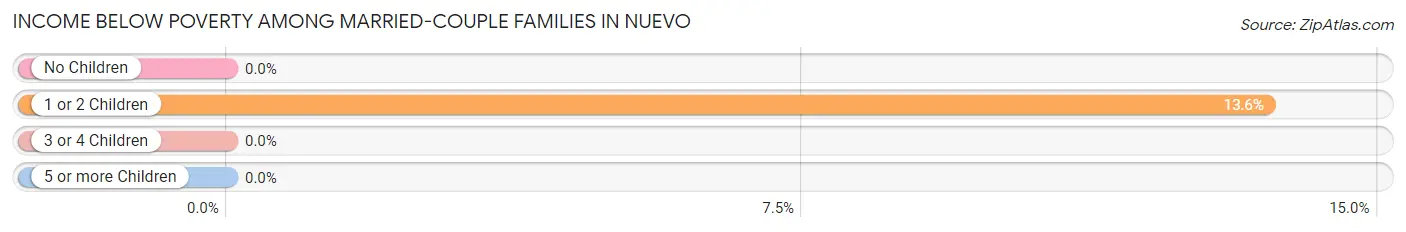
| Children | Above Poverty | Below Poverty |
| No Children | 441 (100.0%) | 0 (0.0%) |
| 1 or 2 Children | 485 (86.5%) | 76 (13.6%) |
| 3 or 4 Children | 253 (100.0%) | 0 (0.0%) |
| 5 or more Children | 0 (0.0%) | 0 (0.0%) |
| Total | 1,179 (93.9%) | 76 (6.1%) |
Income Below Poverty Among Single-Parent Households in Nuevo
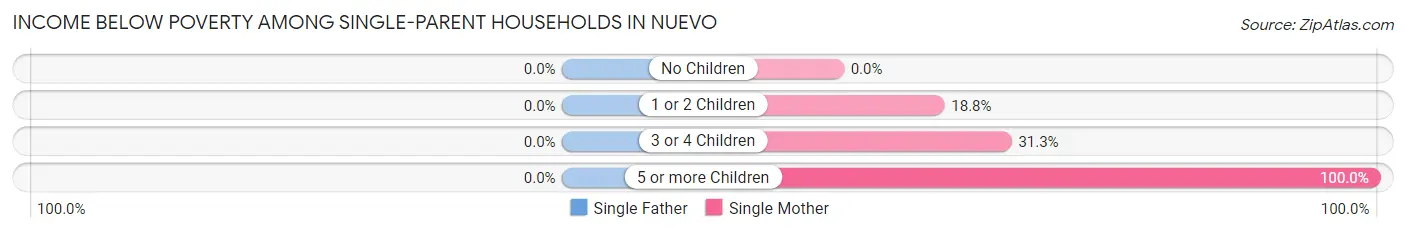
| Children | Single Father | Single Mother |
| No Children | 0 (0.0%) | 0 (0.0%) |
| 1 or 2 Children | 0 (0.0%) | 9 (18.8%) |
| 3 or 4 Children | 0 (0.0%) | 15 (31.2%) |
| 5 or more Children | 0 (0.0%) | 8 (100.0%) |
| Total | 0 (0.0%) | 32 (16.5%) |
Income Below Poverty Among Married-Couple vs Single-Parent Households in Nuevo
The poverty data for Nuevo shows that 76 of the married-couple family households (6.1%) and 32 of the single-parent households (10.5%) are living below the poverty level. Within the married-couple family households, those with 1 or 2 children have the highest poverty rate, with 76 households (13.6%) falling below the poverty line. Among the single-parent households, those with 5 or more children have the highest poverty rate, with 8 household (100.0%) living below poverty.
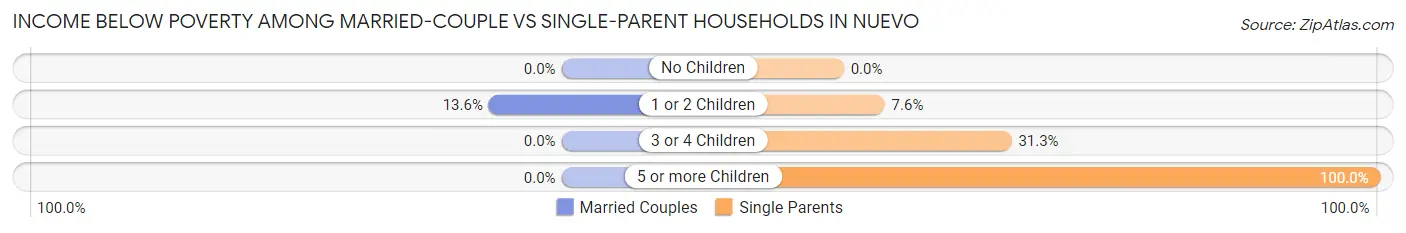
| Children | Married-Couple Families | Single-Parent Households |
| No Children | 0 (0.0%) | 0 (0.0%) |
| 1 or 2 Children | 76 (13.6%) | 9 (7.6%) |
| 3 or 4 Children | 0 (0.0%) | 15 (31.2%) |
| 5 or more Children | 0 (0.0%) | 8 (100.0%) |
| Total | 76 (6.1%) | 32 (10.5%) |
Race in Nuevo
The most populous races in Nuevo are Hispanic or Latino (4,995 | 68.4%), White / Caucasian (3,647 | 49.9%), and Some other Race (1,924 | 26.3%).
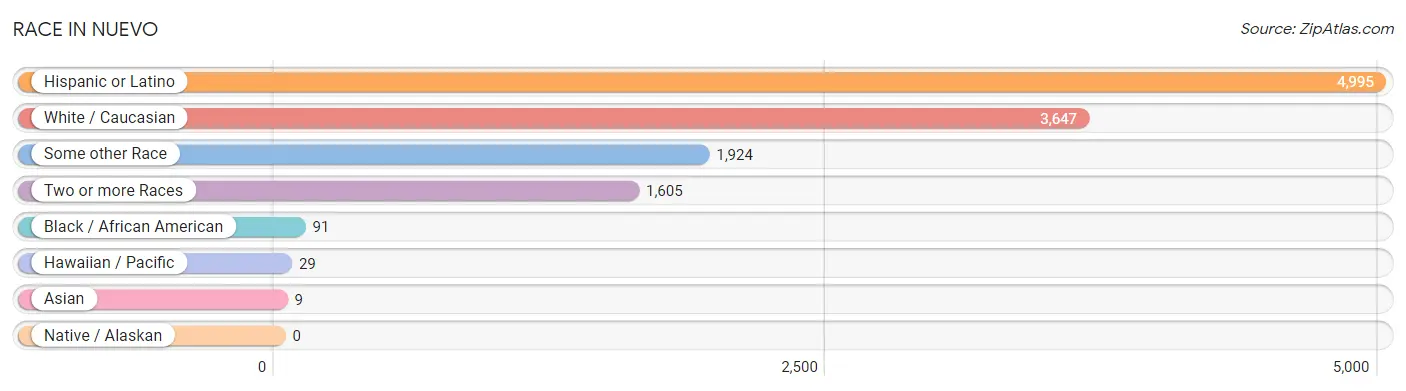
| Race | # Population | % Population |
| Asian | 9 | 0.1% |
| Black / African American | 91 | 1.3% |
| Hawaiian / Pacific | 29 | 0.4% |
| Hispanic or Latino | 4,995 | 68.4% |
| Native / Alaskan | 0 | 0.0% |
| White / Caucasian | 3,647 | 49.9% |
| Two or more Races | 1,605 | 22.0% |
| Some other Race | 1,924 | 26.3% |
| Total | 7,305 | 100.0% |
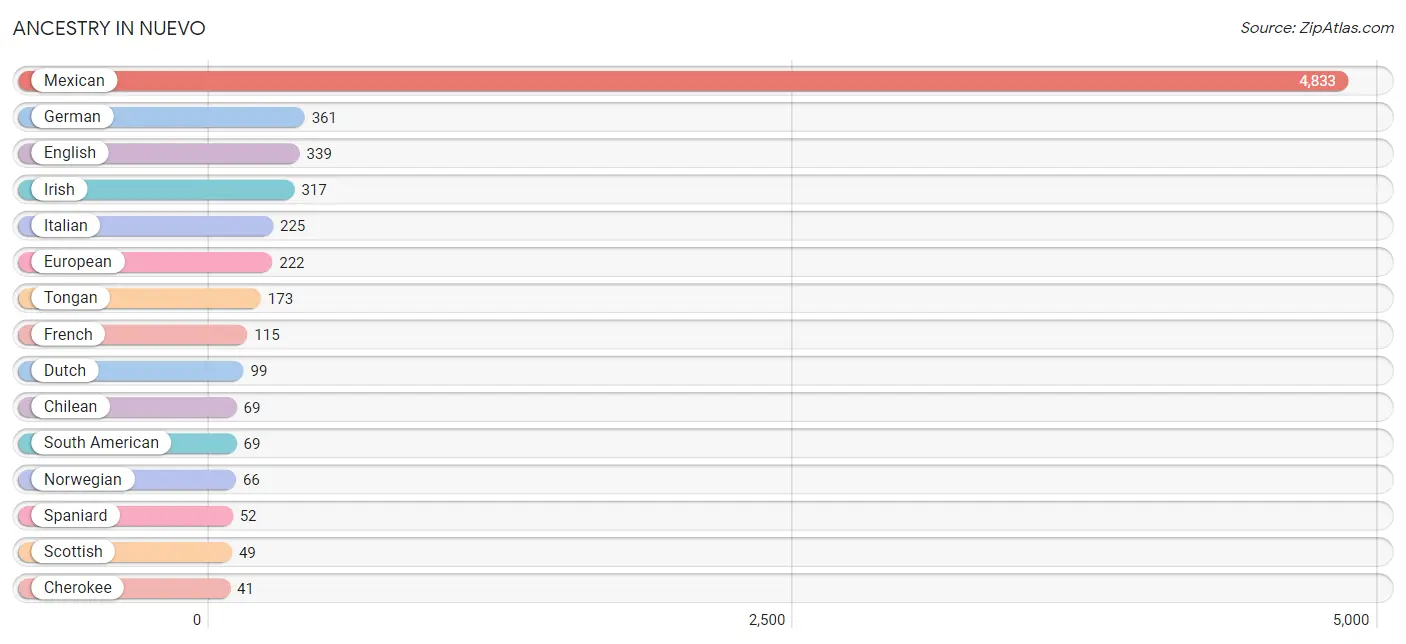
Ancestry in Nuevo
The most populous ancestries reported in Nuevo are Mexican (4,833 | 66.2%), German (361 | 4.9%), English (339 | 4.6%), Irish (317 | 4.3%), and Italian (225 | 3.1%), together accounting for 83.2% of all Nuevo residents.
| Ancestry | # Population | % Population |
| American | 27 | 0.4% |
| Apache | 11 | 0.2% |
| Arab | 11 | 0.2% |
| Armenian | 5 | 0.1% |
| Blackfeet | 11 | 0.2% |
| Central American | 12 | 0.2% |
| Central American Indian | 6 | 0.1% |
| Cherokee | 41 | 0.6% |
| Cheyenne | 14 | 0.2% |
| Chilean | 69 | 0.9% |
| Cuban | 8 | 0.1% |
| Czechoslovakian | 6 | 0.1% |
| Danish | 28 | 0.4% |
| Dutch | 99 | 1.4% |
| English | 339 | 4.6% |
| European | 222 | 3.0% |
| French | 115 | 1.6% |
| German | 361 | 4.9% |
| Greek | 21 | 0.3% |
| Guatemalan | 12 | 0.2% |
| Irish | 317 | 4.3% |
| Italian | 225 | 3.1% |
| Jamaican | 35 | 0.5% |
| Korean | 11 | 0.2% |
| Lebanese | 11 | 0.2% |
| Mexican | 4,833 | 66.2% |
| Native Hawaiian | 12 | 0.2% |
| Norwegian | 66 | 0.9% |
| Pakistani | 9 | 0.1% |
| Polish | 25 | 0.3% |
| Portuguese | 22 | 0.3% |
| Puerto Rican | 12 | 0.2% |
| Russian | 10 | 0.1% |
| Scotch-Irish | 19 | 0.3% |
| Scottish | 49 | 0.7% |
| South American | 69 | 0.9% |
| Spaniard | 52 | 0.7% |
| Swedish | 29 | 0.4% |
| Tongan | 173 | 2.4% |
| Welsh | 7 | 0.1% | View All 40 Rows |
Immigrants in Nuevo
The most numerous immigrant groups reported in Nuevo came from Latin America (1,659 | 22.7%), Central America (1,564 | 21.4%), Mexico (1,552 | 21.2%), Chile (87 | 1.2%), and South America (87 | 1.2%), together accounting for 67.8% of all Nuevo residents.
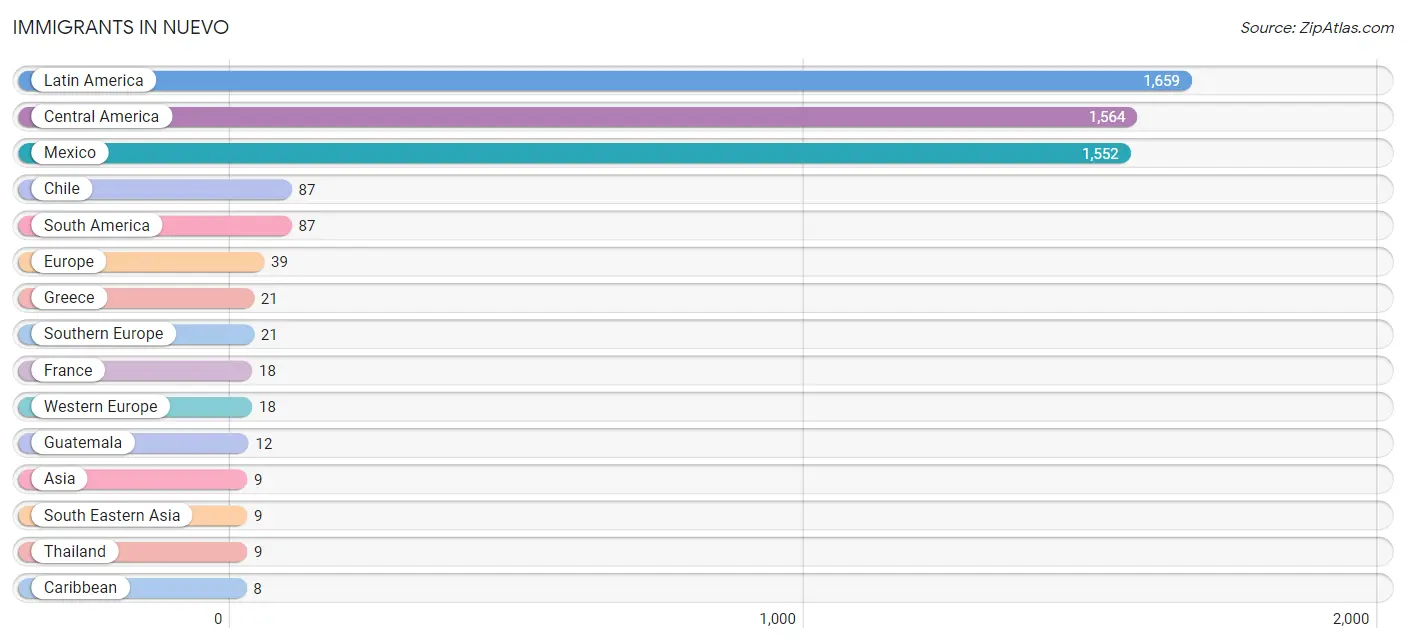
| Immigration Origin | # Population | % Population |
| Asia | 9 | 0.1% |
| Caribbean | 8 | 0.1% |
| Central America | 1,564 | 21.4% |
| Chile | 87 | 1.2% |
| Cuba | 8 | 0.1% |
| Europe | 39 | 0.5% |
| France | 18 | 0.3% |
| Greece | 21 | 0.3% |
| Guatemala | 12 | 0.2% |
| Latin America | 1,659 | 22.7% |
| Mexico | 1,552 | 21.2% |
| South America | 87 | 1.2% |
| South Eastern Asia | 9 | 0.1% |
| Southern Europe | 21 | 0.3% |
| Thailand | 9 | 0.1% |
| Western Europe | 18 | 0.3% | View All 16 Rows |
Sex and Age in Nuevo
Sex and Age in Nuevo
The most populous age groups in Nuevo are 10 to 14 Years (342 | 10.2%) for men and 10 to 14 Years (565 | 14.3%) for women.
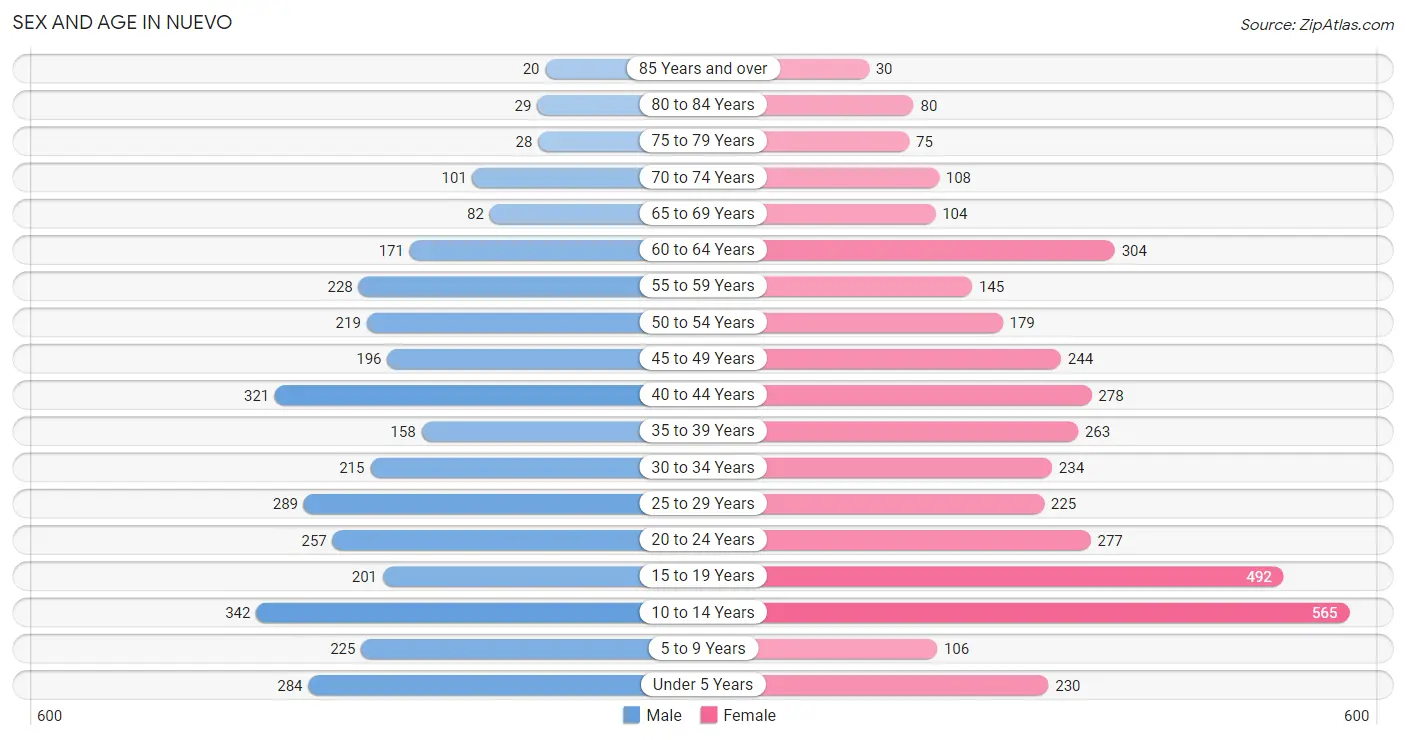
| Age Bracket | Male | Female |
| Under 5 Years | 284 (8.4%) | 230 (5.8%) |
| 5 to 9 Years | 225 (6.7%) | 106 (2.7%) |
| 10 to 14 Years | 342 (10.2%) | 565 (14.3%) |
| 15 to 19 Years | 201 (6.0%) | 492 (12.5%) |
| 20 to 24 Years | 257 (7.6%) | 277 (7.0%) |
| 25 to 29 Years | 289 (8.6%) | 225 (5.7%) |
| 30 to 34 Years | 215 (6.4%) | 234 (5.9%) |
| 35 to 39 Years | 158 (4.7%) | 263 (6.7%) |
| 40 to 44 Years | 321 (9.5%) | 278 (7.1%) |
| 45 to 49 Years | 196 (5.8%) | 244 (6.2%) |
| 50 to 54 Years | 219 (6.5%) | 179 (4.5%) |
| 55 to 59 Years | 228 (6.8%) | 145 (3.7%) |
| 60 to 64 Years | 171 (5.1%) | 304 (7.7%) |
| 65 to 69 Years | 82 (2.4%) | 104 (2.6%) |
| 70 to 74 Years | 101 (3.0%) | 108 (2.7%) |
| 75 to 79 Years | 28 (0.8%) | 75 (1.9%) |
| 80 to 84 Years | 29 (0.9%) | 80 (2.0%) |
| 85 Years and over | 20 (0.6%) | 30 (0.8%) |
| Total | 3,366 (100.0%) | 3,939 (100.0%) |
Families and Households in Nuevo
Median Family Size in Nuevo
The median family size in Nuevo is 4.28 persons per family, with married-couple families (1,255 | 80.4%) accounting for the largest median family size of 4.35 persons per family. On the other hand, single male/father families (112 | 7.2%) represent the smallest median family size with 3.67 persons per family.
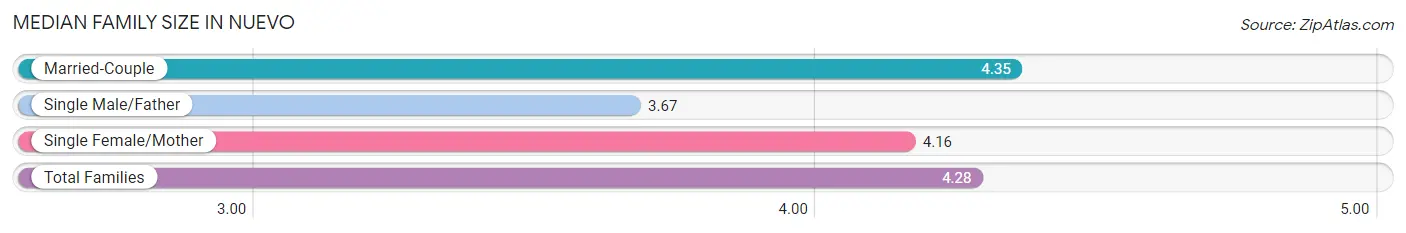
| Family Type | # Families | Family Size |
| Married-Couple | 1,255 (80.4%) | 4.35 |
| Single Male/Father | 112 (7.2%) | 3.67 |
| Single Female/Mother | 194 (12.4%) | 4.16 |
| Total Families | 1,561 (100.0%) | 4.28 |
Median Household Size in Nuevo
The median household size in Nuevo is 4.03 persons per household, with single female/mother households (194 | 10.7%) accounting for the largest median household size of 4.95 persons per household. non-family households (250 | 13.8%) represent the smallest median household size with 1.32 persons per household.
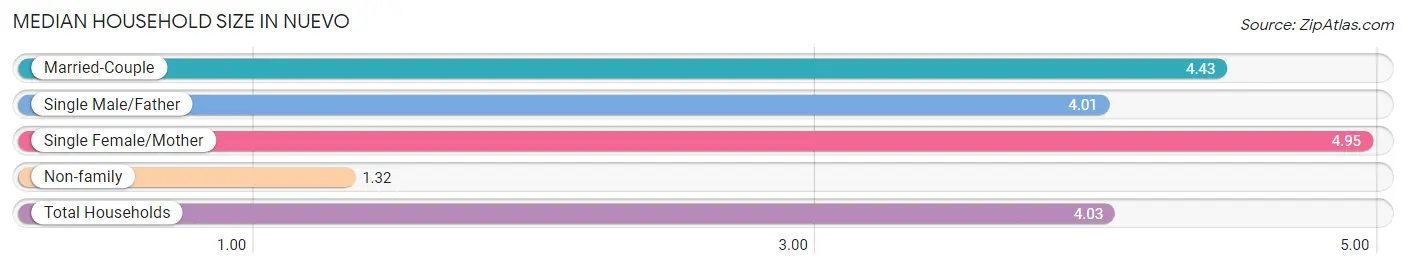
| Household Type | # Households | Household Size |
| Married-Couple | 1,255 (69.3%) | 4.43 |
| Single Male/Father | 112 (6.2%) | 4.01 |
| Single Female/Mother | 194 (10.7%) | 4.95 |
| Non-family | 250 (13.8%) | 1.32 |
| Total Households | 1,811 (100.0%) | 4.03 |
Household Size by Marriage Status in Nuevo
Out of a total of 1,811 households in Nuevo, 1,561 (86.2%) are family households, while 250 (13.8%) are nonfamily households. The most numerous type of family households are 5-person households, comprising 414, and the most common type of nonfamily households are 1-person households, comprising 166.
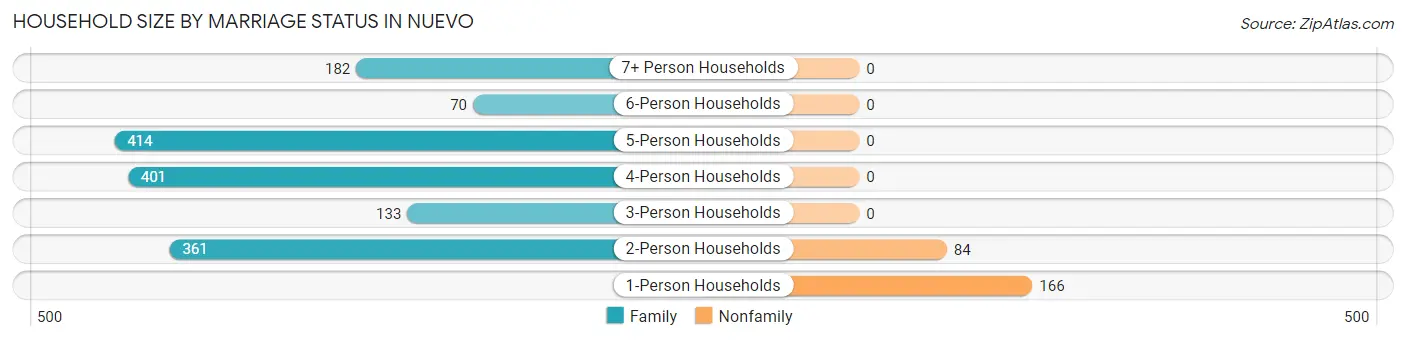
| Household Size | Family Households | Nonfamily Households |
| 1-Person Households | - | 166 (9.2%) |
| 2-Person Households | 361 (19.9%) | 84 (4.6%) |
| 3-Person Households | 133 (7.3%) | 0 (0.0%) |
| 4-Person Households | 401 (22.1%) | 0 (0.0%) |
| 5-Person Households | 414 (22.9%) | 0 (0.0%) |
| 6-Person Households | 70 (3.9%) | 0 (0.0%) |
| 7+ Person Households | 182 (10.1%) | 0 (0.0%) |
| Total | 1,561 (86.2%) | 250 (13.8%) |
Female Fertility in Nuevo
Fertility by Age in Nuevo
Average fertility rate in Nuevo is 48.0 births per 1,000 women. Women in the age bracket of 20 to 34 years have the highest fertility rate with 61.0 births per 1,000 women. Women in the age bracket of 20 to 34 years acount for 45.5% of all women with births.
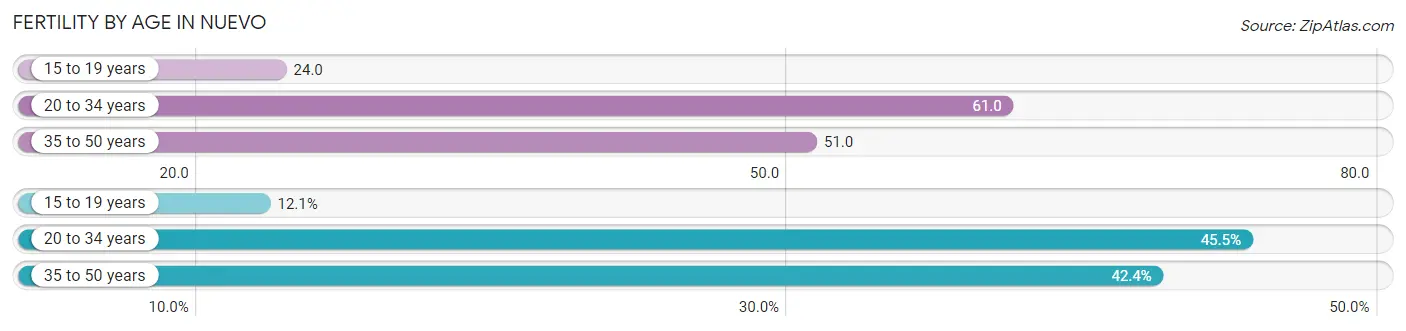
| Age Bracket | Women with Births | Births / 1,000 Women |
| 15 to 19 years | 12 (12.1%) | 24.0 |
| 20 to 34 years | 45 (45.5%) | 61.0 |
| 35 to 50 years | 42 (42.4%) | 51.0 |
| Total | 99 (100.0%) | 48.0 |
Fertility by Age by Marriage Status in Nuevo
82.8% of women with births (99) in Nuevo are married. The highest percentage of unmarried women with births falls into 15 to 19 years age bracket with 100.0% of them unmarried at the time of birth, while the lowest percentage of unmarried women with births belong to 35 to 50 years age bracket with 0.0% of them unmarried.
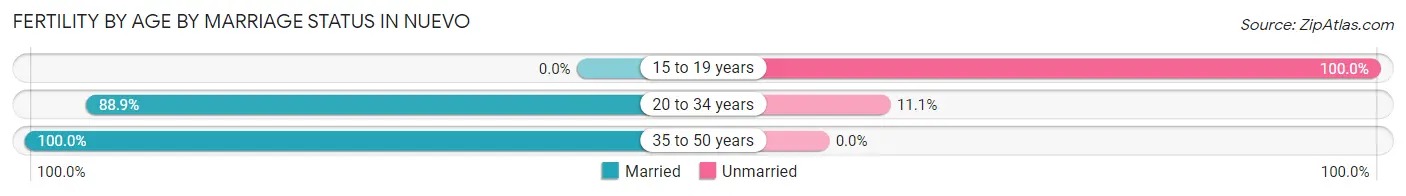
| Age Bracket | Married | Unmarried |
| 15 to 19 years | 0 (0.0%) | 12 (100.0%) |
| 20 to 34 years | 40 (88.9%) | 5 (11.1%) |
| 35 to 50 years | 42 (100.0%) | 0 (0.0%) |
| Total | 82 (82.8%) | 17 (17.2%) |
Fertility by Education in Nuevo
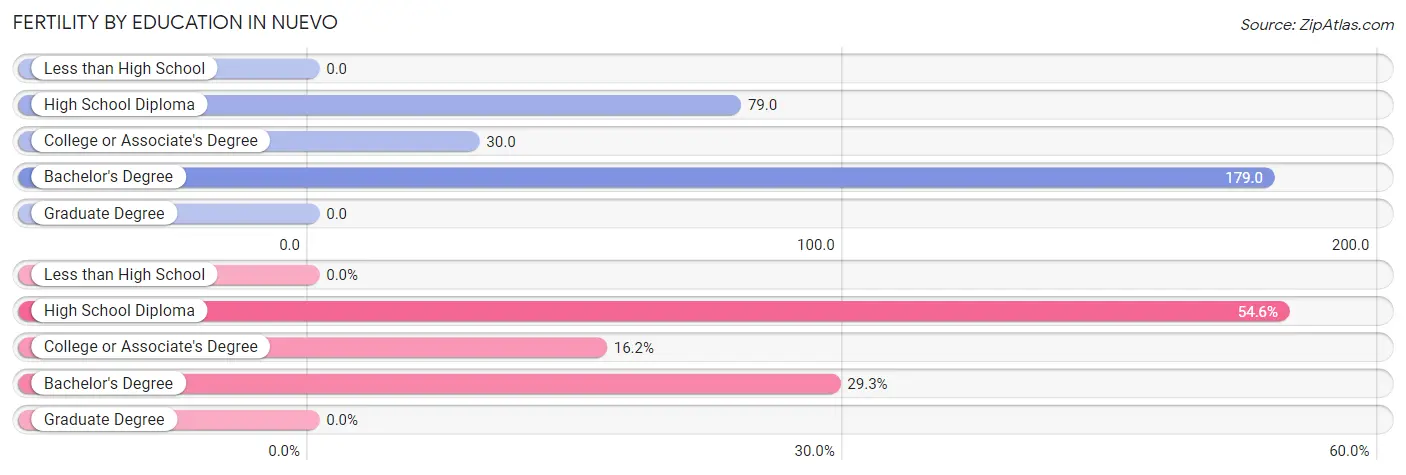
| Educational Attainment | Women with Births | Births / 1,000 Women |
| Less than High School | 0 (0.0%) | 0.0 |
| High School Diploma | 54 (54.5%) | 79.0 |
| College or Associate's Degree | 16 (16.2%) | 30.0 |
| Bachelor's Degree | 29 (29.3%) | 179.0 |
| Graduate Degree | 0 (0.0%) | 0.0 |
| Total | 99 (100.0%) | 48.0 |
Fertility by Education by Marriage Status in Nuevo
17.2% of women with births in Nuevo are unmarried. Women with the educational attainment of bachelor's degree are most likely to be married with 100.0% of them married at childbirth, while women with the educational attainment of college or associate's degree are least likely to be married with 31.2% of them unmarried at childbirth.
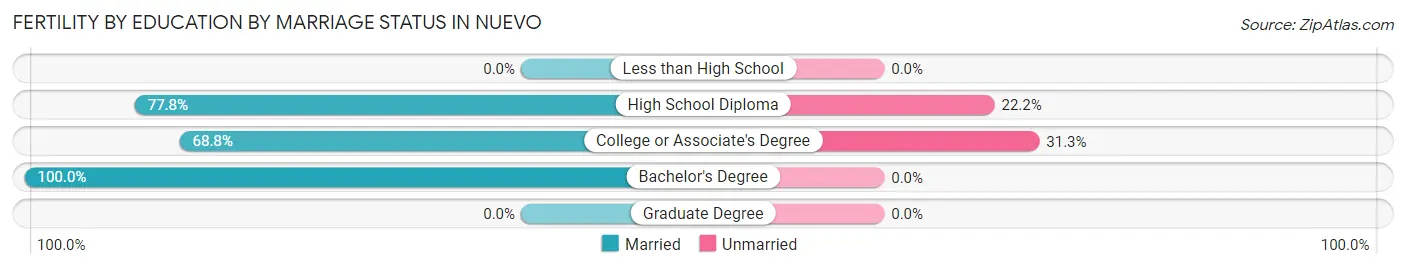
| Educational Attainment | Married | Unmarried |
| Less than High School | 0 (0.0%) | 0 (0.0%) |
| High School Diploma | 42 (77.8%) | 12 (22.2%) |
| College or Associate's Degree | 11 (68.8%) | 5 (31.2%) |
| Bachelor's Degree | 29 (100.0%) | 0 (0.0%) |
| Graduate Degree | 0 (0.0%) | 0 (0.0%) |
| Total | 82 (82.8%) | 17 (17.2%) |
Employment Characteristics in Nuevo
Employment by Class of Employer in Nuevo
Among the 3,097 employed individuals in Nuevo, private company employees (2,199 | 71.0%), self-employed (not incorporated) (249 | 8.0%), and local government employees (230 | 7.4%) make up the most common classes of employment.
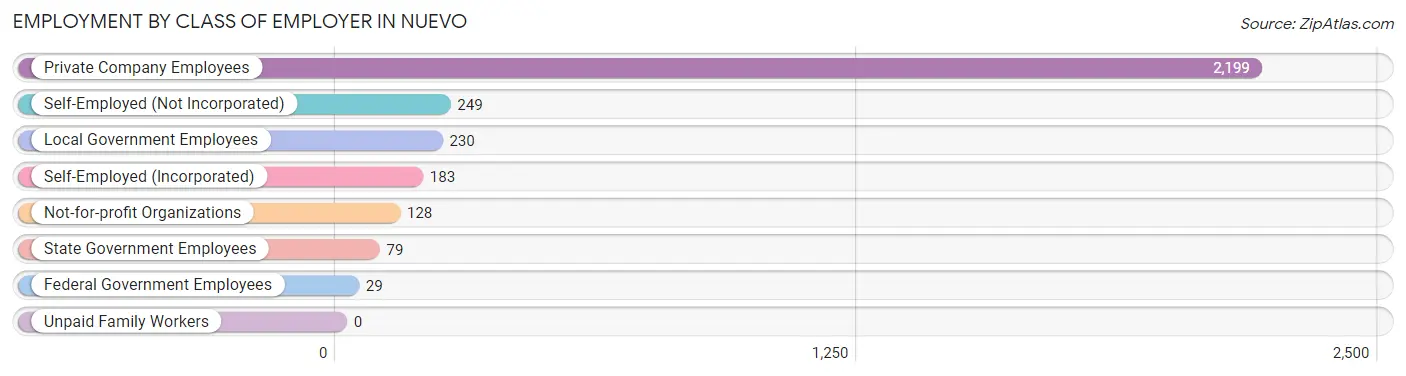
| Employer Class | # Employees | % Employees |
| Private Company Employees | 2,199 | 71.0% |
| Self-Employed (Incorporated) | 183 | 5.9% |
| Self-Employed (Not Incorporated) | 249 | 8.0% |
| Not-for-profit Organizations | 128 | 4.1% |
| Local Government Employees | 230 | 7.4% |
| State Government Employees | 79 | 2.5% |
| Federal Government Employees | 29 | 0.9% |
| Unpaid Family Workers | 0 | 0.0% |
| Total | 3,097 | 100.0% |
Employment Status by Age in Nuevo
According to the labor force statistics for Nuevo, out of the total population over 16 years of age (5,462), 62.4% or 3,408 individuals are in the labor force, with 6.9% or 235 of them unemployed. The age group with the highest labor force participation rate is 20 to 24 years, with 85.6% or 457 individuals in the labor force. Within the labor force, the 55 to 59 years age range has the highest percentage of unemployed individuals, with 13.4% or 36 of them being unemployed.
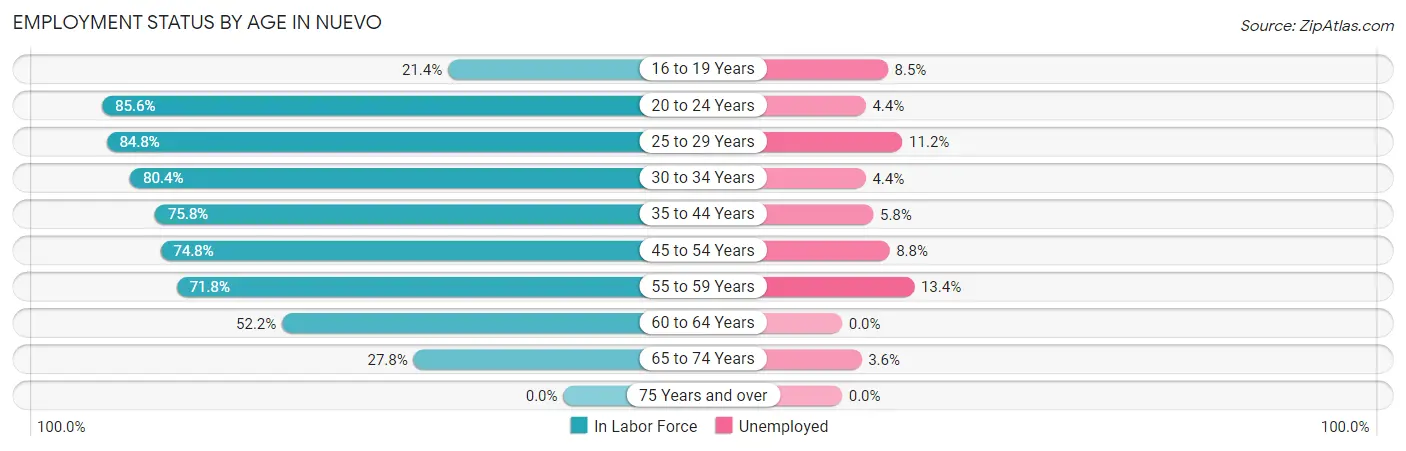
| Age Bracket | In Labor Force | Unemployed |
| 16 to 19 Years | 129 (21.4%) | 11 (8.5%) |
| 20 to 24 Years | 457 (85.6%) | 20 (4.4%) |
| 25 to 29 Years | 436 (84.8%) | 49 (11.2%) |
| 30 to 34 Years | 361 (80.4%) | 16 (4.4%) |
| 35 to 44 Years | 773 (75.8%) | 45 (5.8%) |
| 45 to 54 Years | 627 (74.8%) | 55 (8.8%) |
| 55 to 59 Years | 268 (71.8%) | 36 (13.4%) |
| 60 to 64 Years | 248 (52.2%) | 0 (0.0%) |
| 65 to 74 Years | 110 (27.8%) | 4 (3.6%) |
| 75 Years and over | 0 (0.0%) | 0 (0.0%) |
| Total | 3,408 (62.4%) | 235 (6.9%) |
Employment Status by Educational Attainment in Nuevo
According to labor force statistics for Nuevo, 73.9% of individuals (2,711) out of the total population between 25 and 64 years of age (3,669) are in the labor force, with 7.4% or 201 of them being unemployed. The group with the highest labor force participation rate are those with the educational attainment of bachelor's degree or higher, with 81.6% or 439 individuals in the labor force. Within the labor force, individuals with less than high school education have the highest percentage of unemployment, with 12.0% or 71 of them being unemployed.
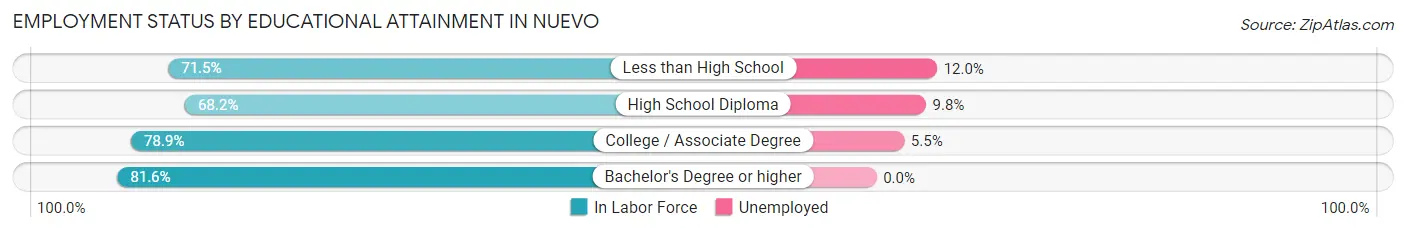
| Educational Attainment | In Labor Force | Unemployed |
| Less than High School | 593 (71.5%) | 99 (12.0%) |
| High School Diploma | 863 (68.2%) | 124 (9.8%) |
| College / Associate Degree | 818 (78.9%) | 57 (5.5%) |
| Bachelor's Degree or higher | 439 (81.6%) | 0 (0.0%) |
| Total | 2,711 (73.9%) | 272 (7.4%) |
Employment Occupations by Sex in Nuevo
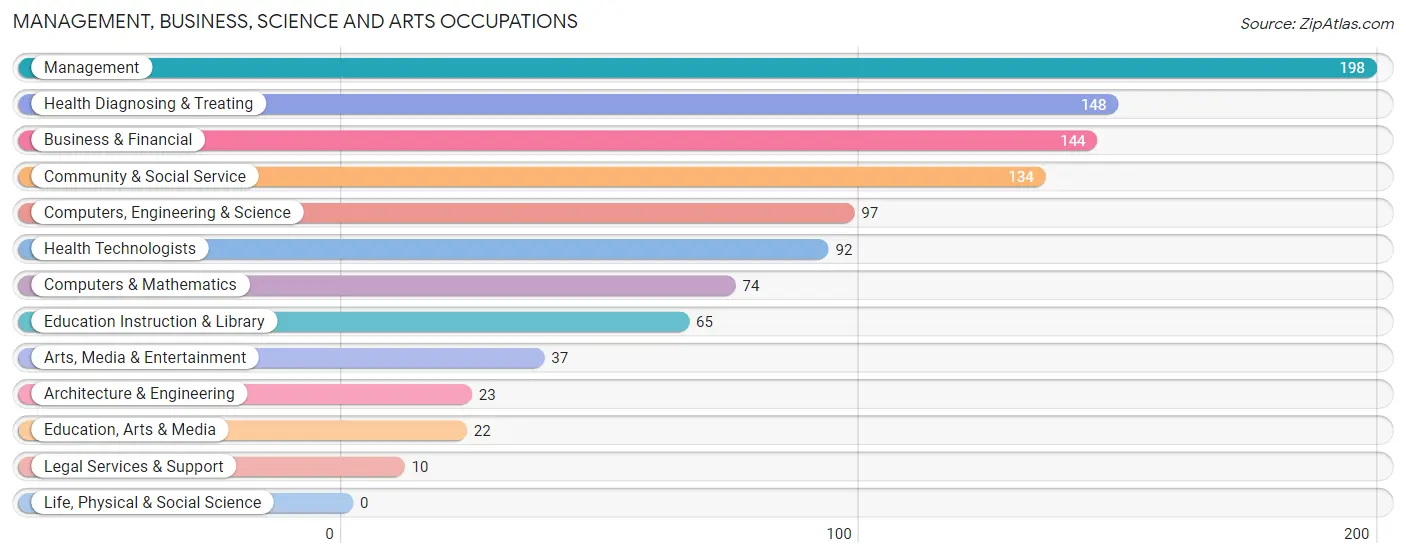
Management, Business, Science and Arts Occupations
The most common Management, Business, Science and Arts occupations in Nuevo are Management (198 | 6.2%), Health Diagnosing & Treating (148 | 4.7%), Business & Financial (144 | 4.5%), Community & Social Service (134 | 4.2%), and Computers, Engineering & Science (97 | 3.1%).
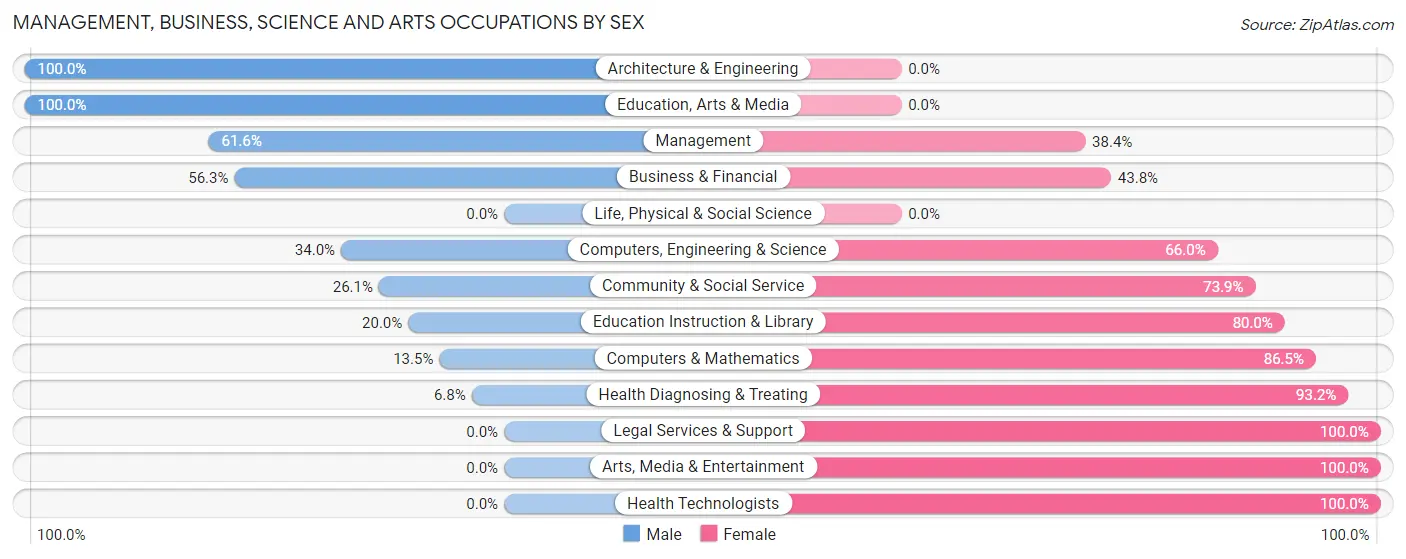
Management, Business, Science and Arts Occupations by Sex
Within the Management, Business, Science and Arts occupations in Nuevo, the most male-oriented occupations are Architecture & Engineering (100.0%), Education, Arts & Media (100.0%), and Management (61.6%), while the most female-oriented occupations are Legal Services & Support (100.0%), Arts, Media & Entertainment (100.0%), and Health Technologists (100.0%).
| Occupation | Male | Female |
| Management | 122 (61.6%) | 76 (38.4%) |
| Business & Financial | 81 (56.2%) | 63 (43.8%) |
| Computers, Engineering & Science | 33 (34.0%) | 64 (66.0%) |
| Computers & Mathematics | 10 (13.5%) | 64 (86.5%) |
| Architecture & Engineering | 23 (100.0%) | 0 (0.0%) |
| Life, Physical & Social Science | 0 (0.0%) | 0 (0.0%) |
| Community & Social Service | 35 (26.1%) | 99 (73.9%) |
| Education, Arts & Media | 22 (100.0%) | 0 (0.0%) |
| Legal Services & Support | 0 (0.0%) | 10 (100.0%) |
| Education Instruction & Library | 13 (20.0%) | 52 (80.0%) |
| Arts, Media & Entertainment | 0 (0.0%) | 37 (100.0%) |
| Health Diagnosing & Treating | 10 (6.8%) | 138 (93.2%) |
| Health Technologists | 0 (0.0%) | 92 (100.0%) |
| Total (Category) | 281 (39.0%) | 440 (61.0%) |
| Total (Overall) | 1,658 (52.2%) | 1,515 (47.7%) |
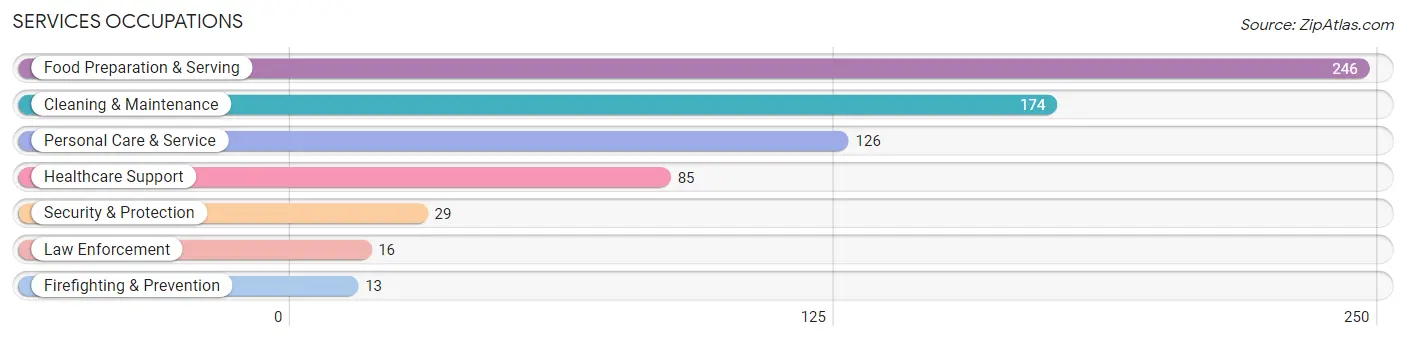
Services Occupations
The most common Services occupations in Nuevo are Food Preparation & Serving (246 | 7.7%), Cleaning & Maintenance (174 | 5.5%), Personal Care & Service (126 | 4.0%), Healthcare Support (85 | 2.7%), and Security & Protection (29 | 0.9%).
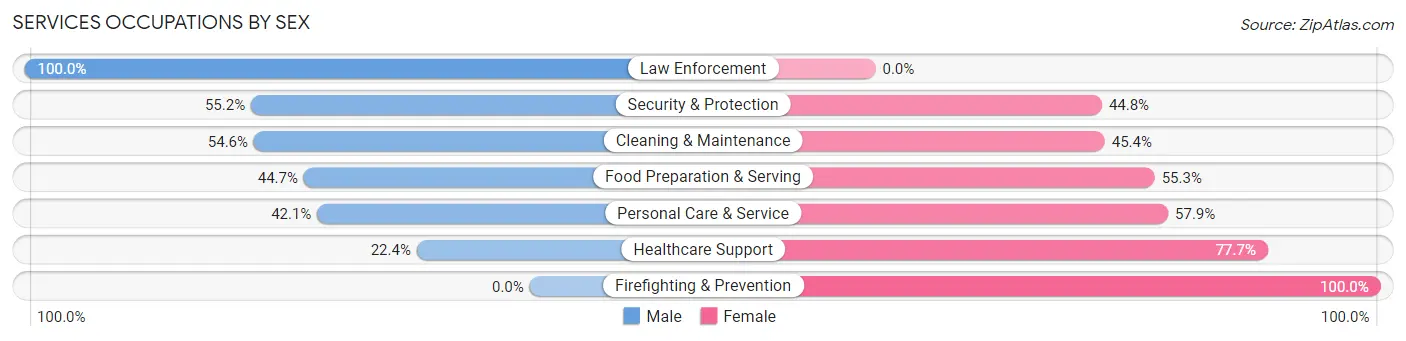
Services Occupations by Sex
Within the Services occupations in Nuevo, the most male-oriented occupations are Law Enforcement (100.0%), Security & Protection (55.2%), and Cleaning & Maintenance (54.6%), while the most female-oriented occupations are Firefighting & Prevention (100.0%), Healthcare Support (77.6%), and Personal Care & Service (57.9%).
| Occupation | Male | Female |
| Healthcare Support | 19 (22.4%) | 66 (77.6%) |
| Security & Protection | 16 (55.2%) | 13 (44.8%) |
| Firefighting & Prevention | 0 (0.0%) | 13 (100.0%) |
| Law Enforcement | 16 (100.0%) | 0 (0.0%) |
| Food Preparation & Serving | 110 (44.7%) | 136 (55.3%) |
| Cleaning & Maintenance | 95 (54.6%) | 79 (45.4%) |
| Personal Care & Service | 53 (42.1%) | 73 (57.9%) |
| Total (Category) | 293 (44.4%) | 367 (55.6%) |
| Total (Overall) | 1,658 (52.2%) | 1,515 (47.7%) |
Sales and Office Occupations
The most common Sales and Office occupations in Nuevo are Office & Administration (460 | 14.5%), and Sales & Related (294 | 9.3%).

Sales and Office Occupations by Sex

| Occupation | Male | Female |
| Sales & Related | 142 (48.3%) | 152 (51.7%) |
| Office & Administration | 36 (7.8%) | 424 (92.2%) |
| Total (Category) | 178 (23.6%) | 576 (76.4%) |
| Total (Overall) | 1,658 (52.2%) | 1,515 (47.7%) |
Natural Resources, Construction and Maintenance Occupations
The most common Natural Resources, Construction and Maintenance occupations in Nuevo are Construction & Extraction (370 | 11.7%), Installation, Maintenance & Repair (197 | 6.2%), and Farming, Fishing & Forestry (33 | 1.0%).
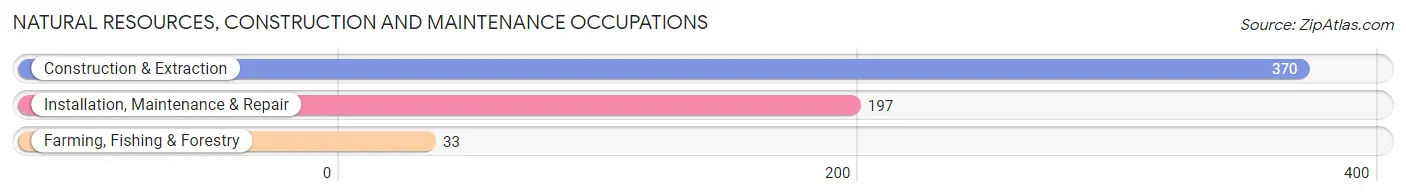
Natural Resources, Construction and Maintenance Occupations by Sex
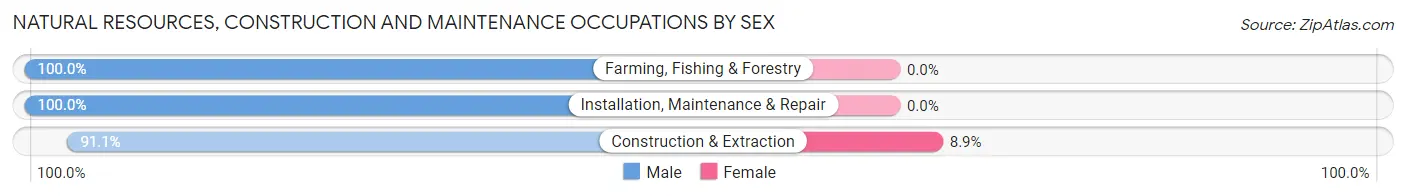
| Occupation | Male | Female |
| Farming, Fishing & Forestry | 33 (100.0%) | 0 (0.0%) |
| Construction & Extraction | 337 (91.1%) | 33 (8.9%) |
| Installation, Maintenance & Repair | 197 (100.0%) | 0 (0.0%) |
| Total (Category) | 567 (94.5%) | 33 (5.5%) |
| Total (Overall) | 1,658 (52.2%) | 1,515 (47.7%) |
Production, Transportation and Moving Occupations
The most common Production, Transportation and Moving occupations in Nuevo are Transportation (206 | 6.5%), Material Moving (150 | 4.7%), and Production (82 | 2.6%).
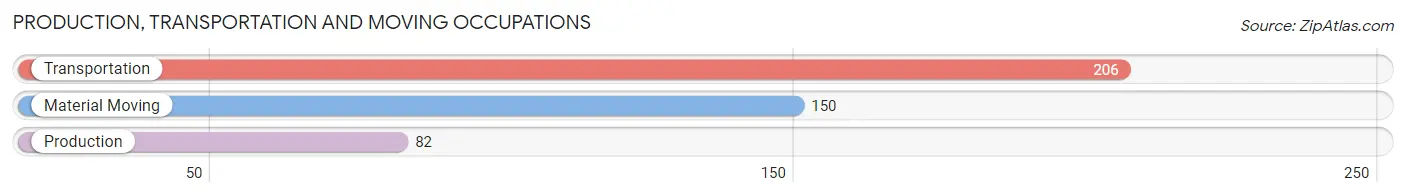
Production, Transportation and Moving Occupations by Sex
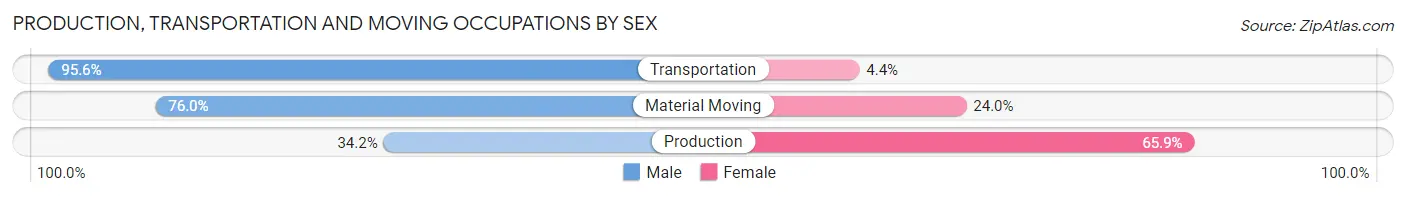
| Occupation | Male | Female |
| Production | 28 (34.2%) | 54 (65.8%) |
| Transportation | 197 (95.6%) | 9 (4.4%) |
| Material Moving | 114 (76.0%) | 36 (24.0%) |
| Total (Category) | 339 (77.4%) | 99 (22.6%) |
| Total (Overall) | 1,658 (52.2%) | 1,515 (47.7%) |
Employment Industries by Sex in Nuevo
Employment Industries in Nuevo
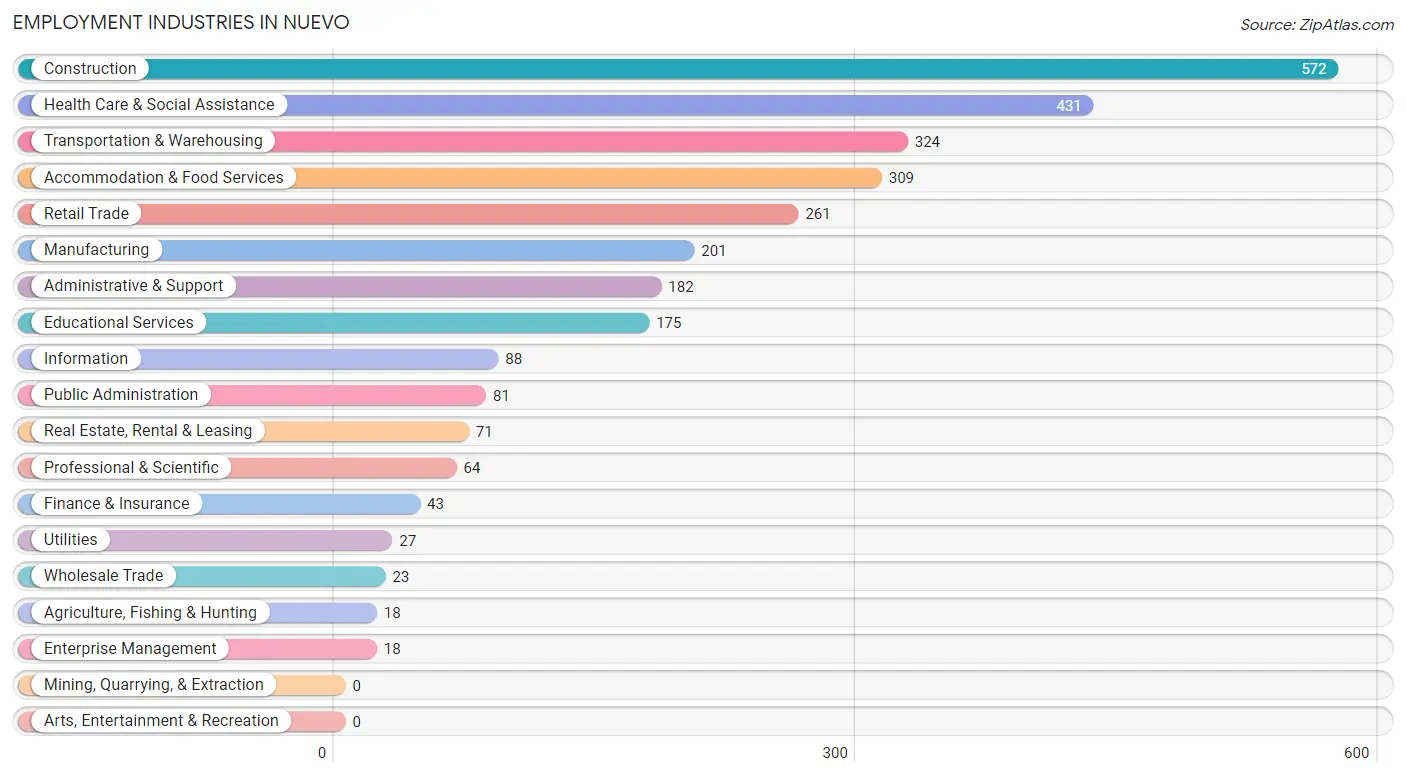
The major employment industries in Nuevo include Construction (572 | 18.0%), Health Care & Social Assistance (431 | 13.6%), Transportation & Warehousing (324 | 10.2%), Accommodation & Food Services (309 | 9.7%), and Retail Trade (261 | 8.2%).
Employment Industries by Sex in Nuevo
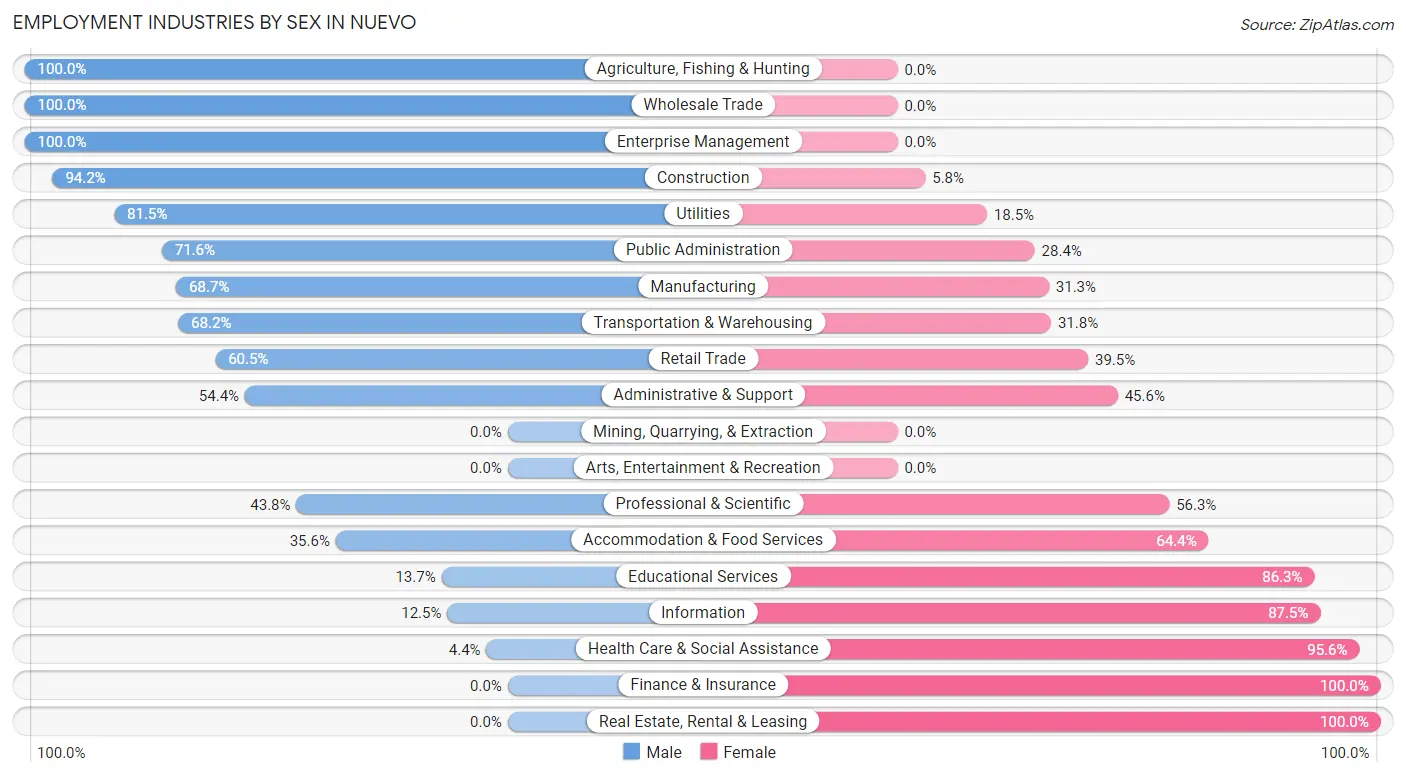
The Nuevo industries that see more men than women are Agriculture, Fishing & Hunting (100.0%), Wholesale Trade (100.0%), and Enterprise Management (100.0%), whereas the industries that tend to have a higher number of women are Finance & Insurance (100.0%), Real Estate, Rental & Leasing (100.0%), and Health Care & Social Assistance (95.6%).
| Industry | Male | Female |
| Agriculture, Fishing & Hunting | 18 (100.0%) | 0 (0.0%) |
| Mining, Quarrying, & Extraction | 0 (0.0%) | 0 (0.0%) |
| Construction | 539 (94.2%) | 33 (5.8%) |
| Manufacturing | 138 (68.7%) | 63 (31.3%) |
| Wholesale Trade | 23 (100.0%) | 0 (0.0%) |
| Retail Trade | 158 (60.5%) | 103 (39.5%) |
| Transportation & Warehousing | 221 (68.2%) | 103 (31.8%) |
| Utilities | 22 (81.5%) | 5 (18.5%) |
| Information | 11 (12.5%) | 77 (87.5%) |
| Finance & Insurance | 0 (0.0%) | 43 (100.0%) |
| Real Estate, Rental & Leasing | 0 (0.0%) | 71 (100.0%) |
| Professional & Scientific | 28 (43.8%) | 36 (56.2%) |
| Enterprise Management | 18 (100.0%) | 0 (0.0%) |
| Administrative & Support | 99 (54.4%) | 83 (45.6%) |
| Educational Services | 24 (13.7%) | 151 (86.3%) |
| Health Care & Social Assistance | 19 (4.4%) | 412 (95.6%) |
| Arts, Entertainment & Recreation | 0 (0.0%) | 0 (0.0%) |
| Accommodation & Food Services | 110 (35.6%) | 199 (64.4%) |
| Public Administration | 58 (71.6%) | 23 (28.4%) |
| Total | 1,658 (52.2%) | 1,515 (47.7%) |
Education in Nuevo
School Enrollment in Nuevo
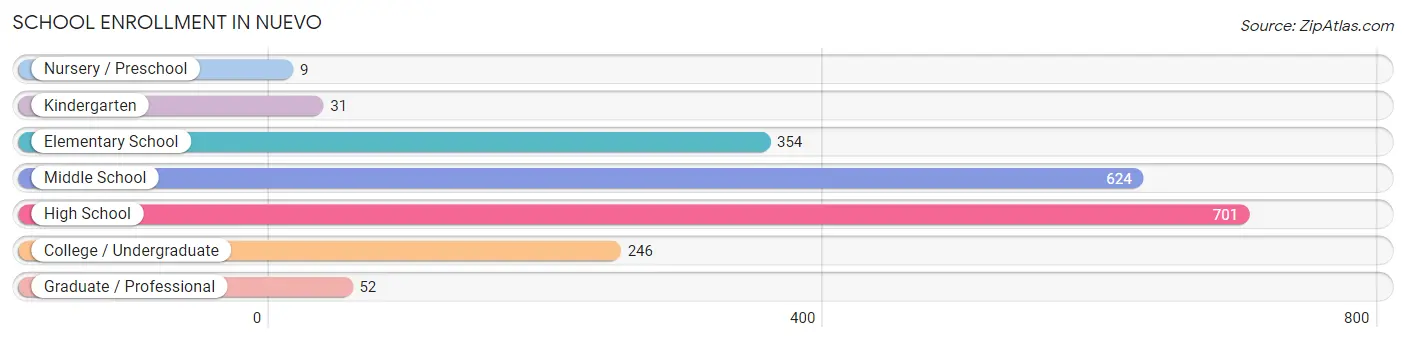
The most common levels of schooling among the 2,017 students in Nuevo are high school (701 | 34.7%), middle school (624 | 30.9%), and elementary school (354 | 17.5%).
| School Level | # Students | % Students |
| Nursery / Preschool | 9 | 0.4% |
| Kindergarten | 31 | 1.5% |
| Elementary School | 354 | 17.5% |
| Middle School | 624 | 30.9% |
| High School | 701 | 34.7% |
| College / Undergraduate | 246 | 12.2% |
| Graduate / Professional | 52 | 2.6% |
| Total | 2,017 | 100.0% |
School Enrollment by Age by Funding Source in Nuevo
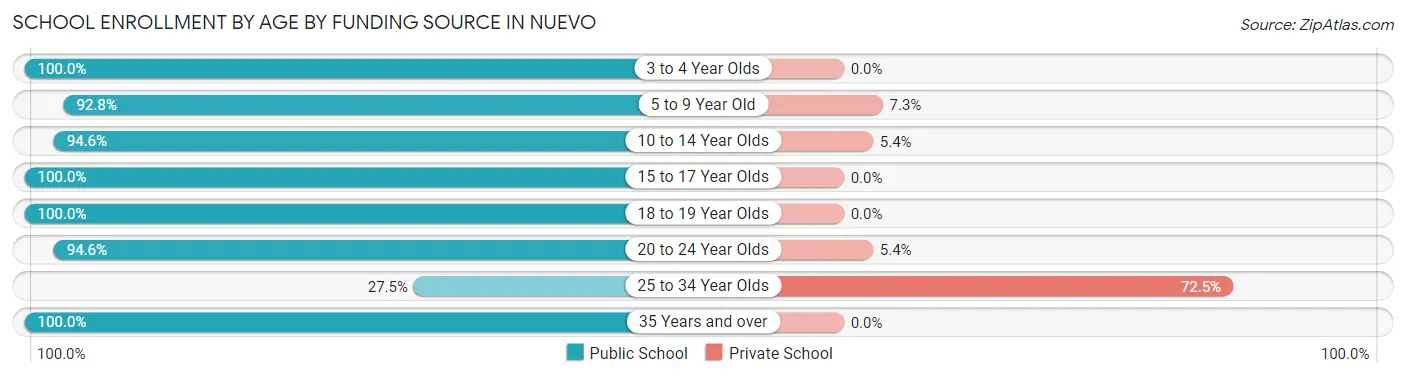
Out of a total of 2,017 students who are enrolled in schools in Nuevo, 109 (5.4%) attend a private institution, while the remaining 1,908 (94.6%) are enrolled in public schools. The age group of 25 to 34 year olds has the highest likelihood of being enrolled in private schools, with 29 (72.5% in the age bracket) enrolled. Conversely, the age group of 3 to 4 year olds has the lowest likelihood of being enrolled in a private school, with 9 (100.0% in the age bracket) attending a public institution.
| Age Bracket | Public School | Private School |
| 3 to 4 Year Olds | 9 (100.0%) | 0 (0.0%) |
| 5 to 9 Year Old | 307 (92.7%) | 24 (7.2%) |
| 10 to 14 Year Olds | 834 (94.6%) | 48 (5.4%) |
| 15 to 17 Year Olds | 420 (100.0%) | 0 (0.0%) |
| 18 to 19 Year Olds | 150 (100.0%) | 0 (0.0%) |
| 20 to 24 Year Olds | 139 (94.6%) | 8 (5.4%) |
| 25 to 34 Year Olds | 11 (27.5%) | 29 (72.5%) |
| 35 Years and over | 38 (100.0%) | 0 (0.0%) |
| Total | 1,908 (94.6%) | 109 (5.4%) |
Educational Attainment by Field of Study in Nuevo
Business (128 | 19.8%), bio, nature & agricultural (81 | 12.5%), liberal arts & history (78 | 12.0%), arts & humanities (76 | 11.7%), and education (73 | 11.3%) are the most common fields of study among 648 individuals in Nuevo who have obtained a bachelor's degree or higher.
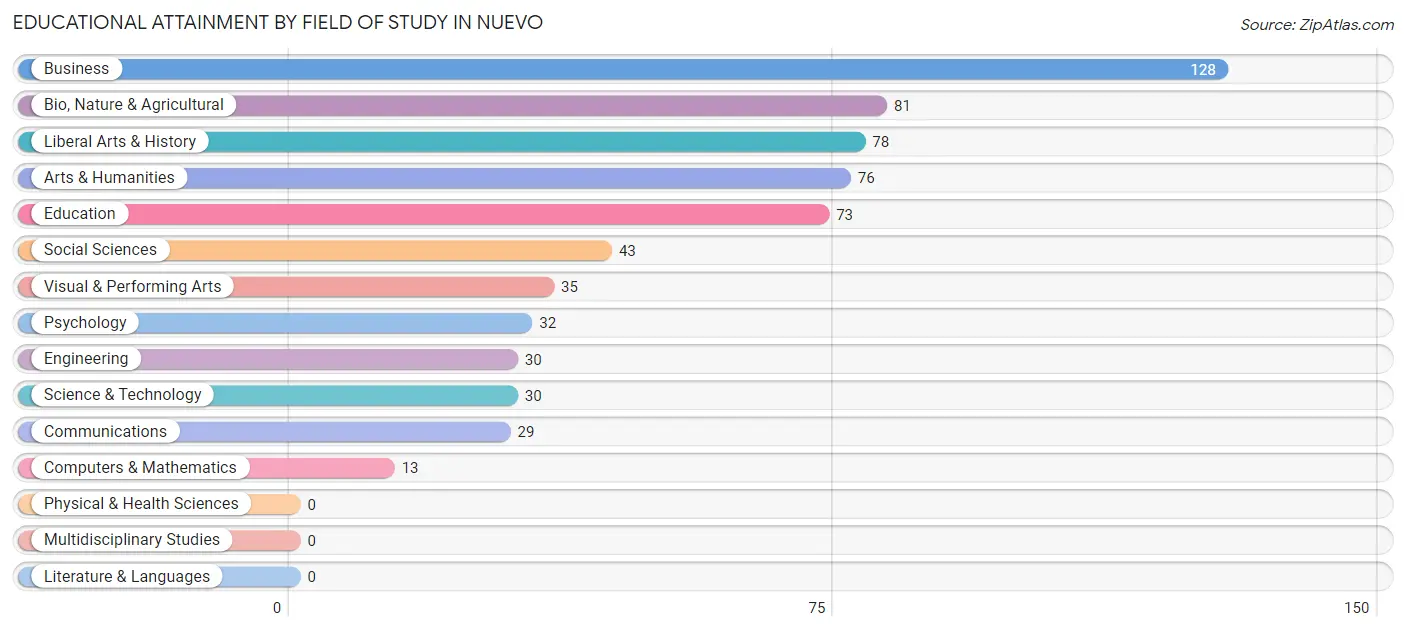
| Field of Study | # Graduates | % Graduates |
| Computers & Mathematics | 13 | 2.0% |
| Bio, Nature & Agricultural | 81 | 12.5% |
| Physical & Health Sciences | 0 | 0.0% |
| Psychology | 32 | 4.9% |
| Social Sciences | 43 | 6.6% |
| Engineering | 30 | 4.6% |
| Multidisciplinary Studies | 0 | 0.0% |
| Science & Technology | 30 | 4.6% |
| Business | 128 | 19.8% |
| Education | 73 | 11.3% |
| Literature & Languages | 0 | 0.0% |
| Liberal Arts & History | 78 | 12.0% |
| Visual & Performing Arts | 35 | 5.4% |
| Communications | 29 | 4.5% |
| Arts & Humanities | 76 | 11.7% |
| Total | 648 | 100.0% |
Transportation & Commute in Nuevo
Vehicle Availability by Sex in Nuevo
The most prevalent vehicle ownership categories in Nuevo are males with 3 vehicles (539, accounting for 33.5%) and females with 3 vehicles (502, making up 36.2%).
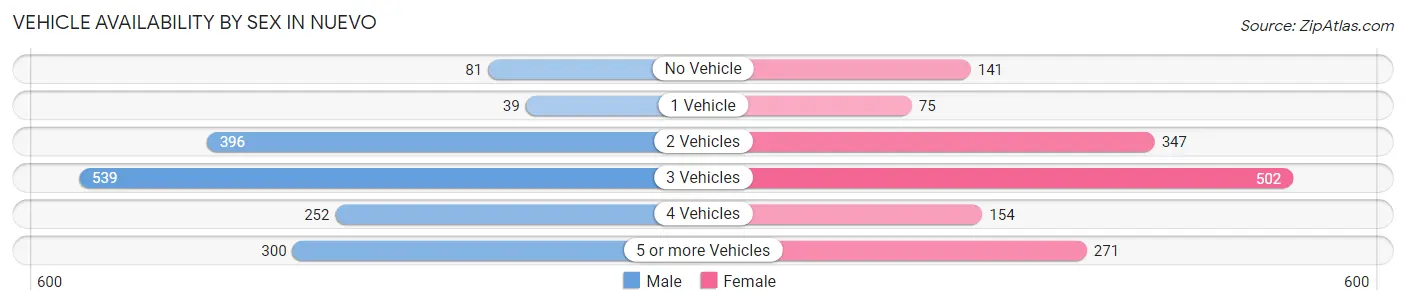
| Vehicles Available | Male | Female |
| No Vehicle | 81 (5.0%) | 141 (9.5%) |
| 1 Vehicle | 39 (2.4%) | 75 (5.0%) |
| 2 Vehicles | 396 (24.6%) | 347 (23.3%) |
| 3 Vehicles | 539 (33.5%) | 502 (33.7%) |
| 4 Vehicles | 252 (15.7%) | 154 (10.3%) |
| 5 or more Vehicles | 300 (18.7%) | 271 (18.2%) |
| Total | 1,607 (100.0%) | 1,490 (100.0%) |
Commute Time in Nuevo
The most frequently occuring commute durations in Nuevo are 15 to 19 minutes (539 commuters, 18.8%), 60 to 89 minutes (485 commuters, 16.9%), and 30 to 34 minutes (433 commuters, 15.1%).
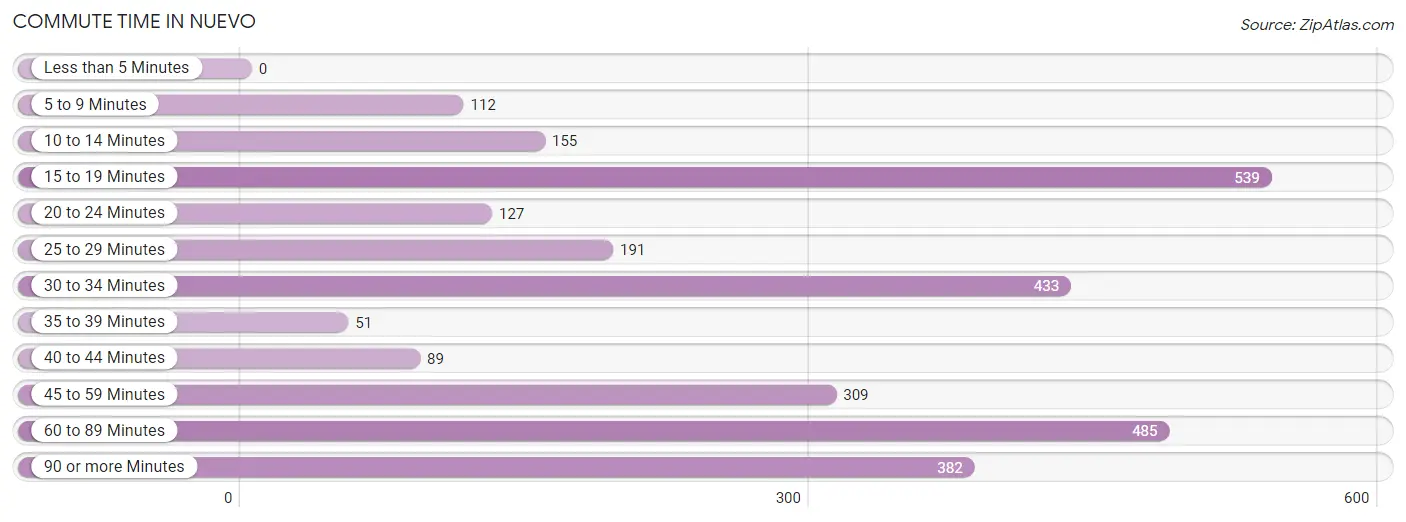
| Commute Time | # Commuters | % Commuters |
| Less than 5 Minutes | 0 | 0.0% |
| 5 to 9 Minutes | 112 | 3.9% |
| 10 to 14 Minutes | 155 | 5.4% |
| 15 to 19 Minutes | 539 | 18.8% |
| 20 to 24 Minutes | 127 | 4.4% |
| 25 to 29 Minutes | 191 | 6.7% |
| 30 to 34 Minutes | 433 | 15.1% |
| 35 to 39 Minutes | 51 | 1.8% |
| 40 to 44 Minutes | 89 | 3.1% |
| 45 to 59 Minutes | 309 | 10.8% |
| 60 to 89 Minutes | 485 | 16.9% |
| 90 or more Minutes | 382 | 13.3% |
Commute Time by Sex in Nuevo
The most common commute times in Nuevo are 60 to 89 minutes (324 commuters, 21.3%) for males and 15 to 19 minutes (252 commuters, 18.7%) for females.
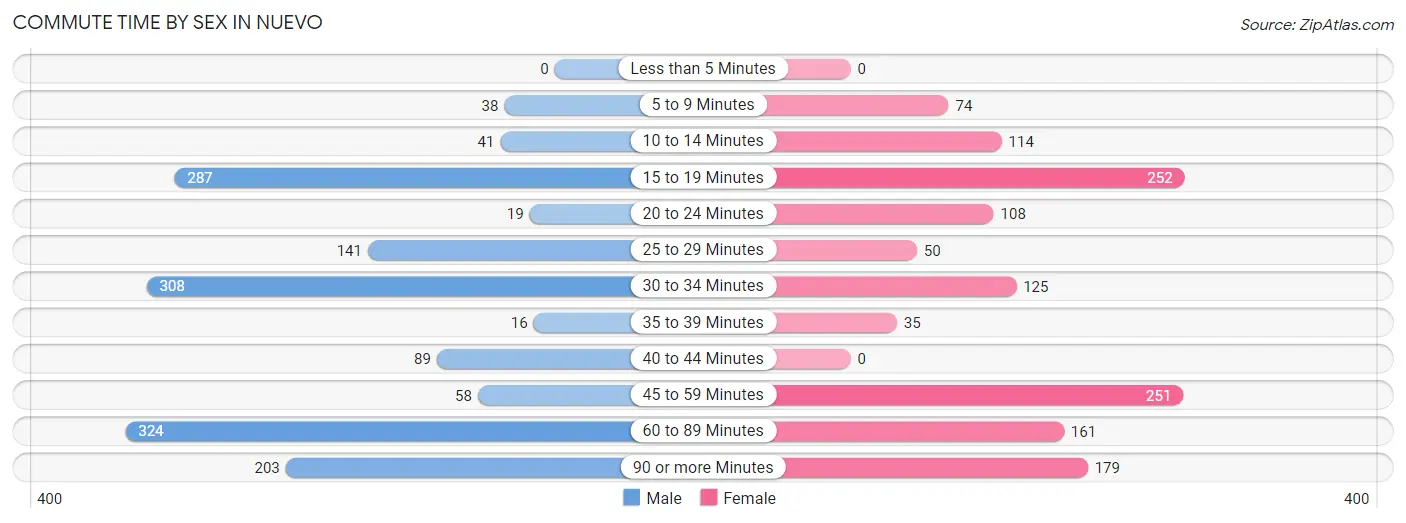
| Commute Time | Male | Female |
| Less than 5 Minutes | 0 (0.0%) | 0 (0.0%) |
| 5 to 9 Minutes | 38 (2.5%) | 74 (5.5%) |
| 10 to 14 Minutes | 41 (2.7%) | 114 (8.5%) |
| 15 to 19 Minutes | 287 (18.8%) | 252 (18.7%) |
| 20 to 24 Minutes | 19 (1.3%) | 108 (8.0%) |
| 25 to 29 Minutes | 141 (9.2%) | 50 (3.7%) |
| 30 to 34 Minutes | 308 (20.2%) | 125 (9.3%) |
| 35 to 39 Minutes | 16 (1.1%) | 35 (2.6%) |
| 40 to 44 Minutes | 89 (5.8%) | 0 (0.0%) |
| 45 to 59 Minutes | 58 (3.8%) | 251 (18.6%) |
| 60 to 89 Minutes | 324 (21.3%) | 161 (11.9%) |
| 90 or more Minutes | 203 (13.3%) | 179 (13.3%) |
Time of Departure to Work by Sex in Nuevo
The most frequent times of departure to work in Nuevo are 12:00 AM to 4:59 AM (355, 23.3%) for males and 6:00 AM to 6:29 AM (231, 17.1%) for females.
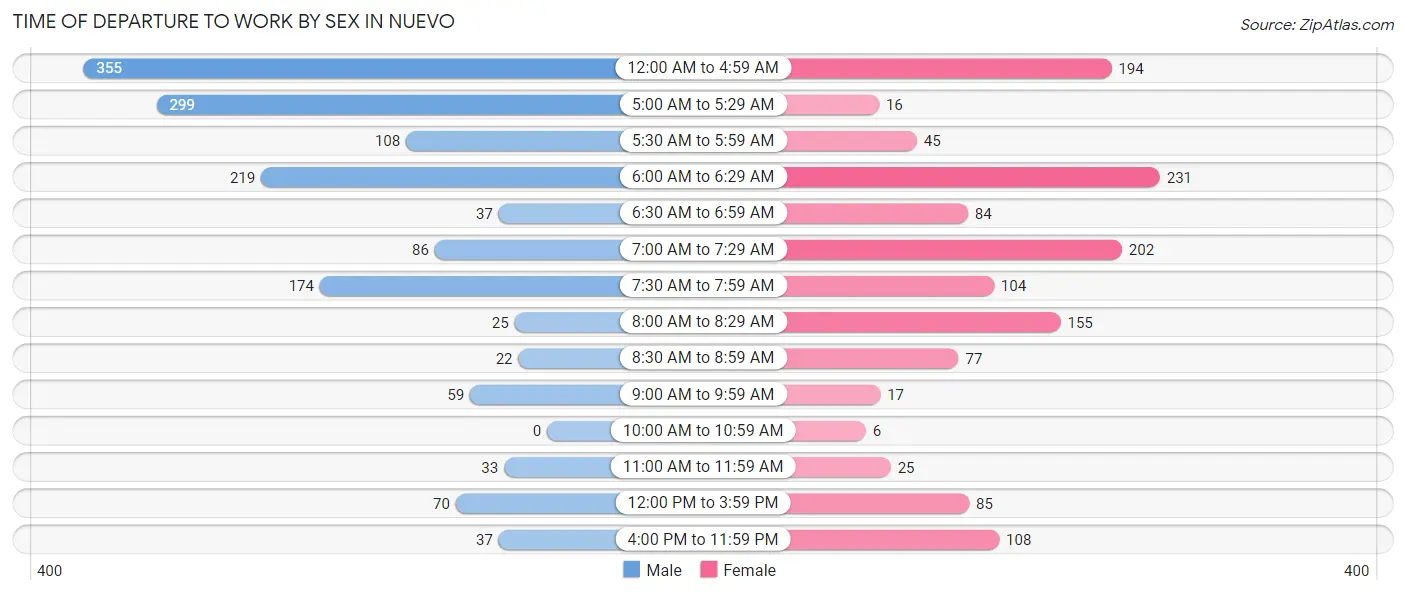
| Time of Departure | Male | Female |
| 12:00 AM to 4:59 AM | 355 (23.3%) | 194 (14.4%) |
| 5:00 AM to 5:29 AM | 299 (19.6%) | 16 (1.2%) |
| 5:30 AM to 5:59 AM | 108 (7.1%) | 45 (3.3%) |
| 6:00 AM to 6:29 AM | 219 (14.4%) | 231 (17.1%) |
| 6:30 AM to 6:59 AM | 37 (2.4%) | 84 (6.2%) |
| 7:00 AM to 7:29 AM | 86 (5.6%) | 202 (15.0%) |
| 7:30 AM to 7:59 AM | 174 (11.4%) | 104 (7.7%) |
| 8:00 AM to 8:29 AM | 25 (1.6%) | 155 (11.5%) |
| 8:30 AM to 8:59 AM | 22 (1.4%) | 77 (5.7%) |
| 9:00 AM to 9:59 AM | 59 (3.9%) | 17 (1.3%) |
| 10:00 AM to 10:59 AM | 0 (0.0%) | 6 (0.4%) |
| 11:00 AM to 11:59 AM | 33 (2.2%) | 25 (1.8%) |
| 12:00 PM to 3:59 PM | 70 (4.6%) | 85 (6.3%) |
| 4:00 PM to 11:59 PM | 37 (2.4%) | 108 (8.0%) |
| Total | 1,524 (100.0%) | 1,349 (100.0%) |
Housing Occupancy in Nuevo
Occupancy by Ownership in Nuevo
Of the total 1,811 dwellings in Nuevo, owner-occupied units account for 1,444 (79.7%), while renter-occupied units make up 367 (20.3%).
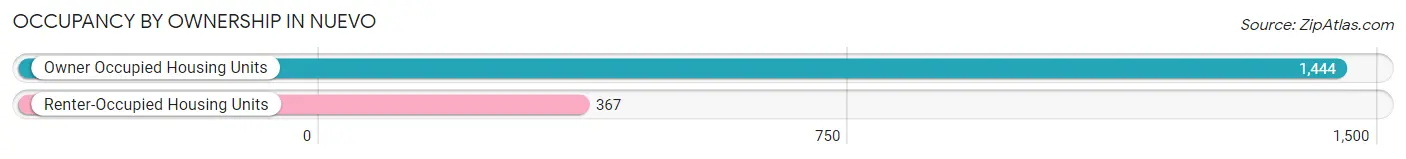
| Occupancy | # Housing Units | % Housing Units |
| Owner Occupied Housing Units | 1,444 | 79.7% |
| Renter-Occupied Housing Units | 367 | 20.3% |
| Total Occupied Housing Units | 1,811 | 100.0% |
Occupancy by Household Size in Nuevo
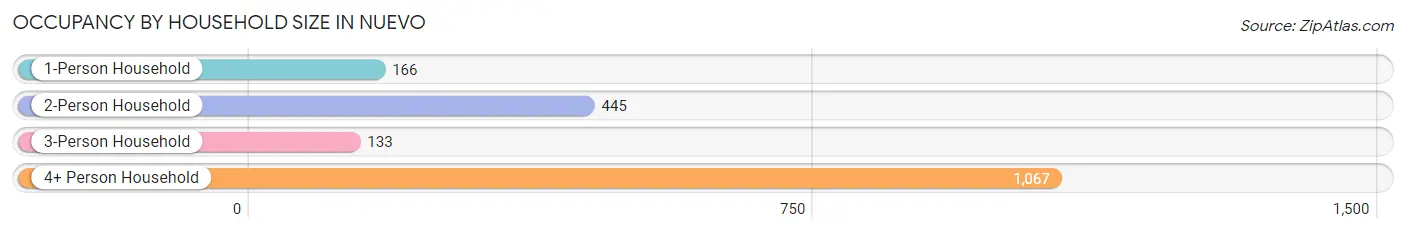
| Household Size | # Housing Units | % Housing Units |
| 1-Person Household | 166 | 9.2% |
| 2-Person Household | 445 | 24.6% |
| 3-Person Household | 133 | 7.3% |
| 4+ Person Household | 1,067 | 58.9% |
| Total Housing Units | 1,811 | 100.0% |
Occupancy by Ownership by Household Size in Nuevo
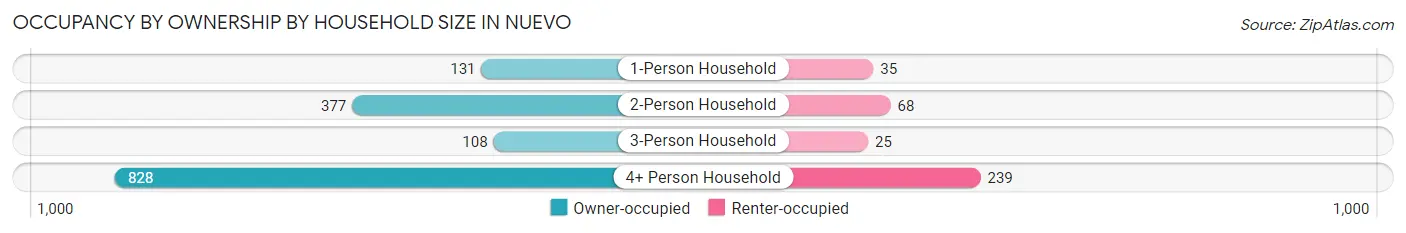
| Household Size | Owner-occupied | Renter-occupied |
| 1-Person Household | 131 (78.9%) | 35 (21.1%) |
| 2-Person Household | 377 (84.7%) | 68 (15.3%) |
| 3-Person Household | 108 (81.2%) | 25 (18.8%) |
| 4+ Person Household | 828 (77.6%) | 239 (22.4%) |
| Total Housing Units | 1,444 (79.7%) | 367 (20.3%) |
Occupancy by Educational Attainment in Nuevo
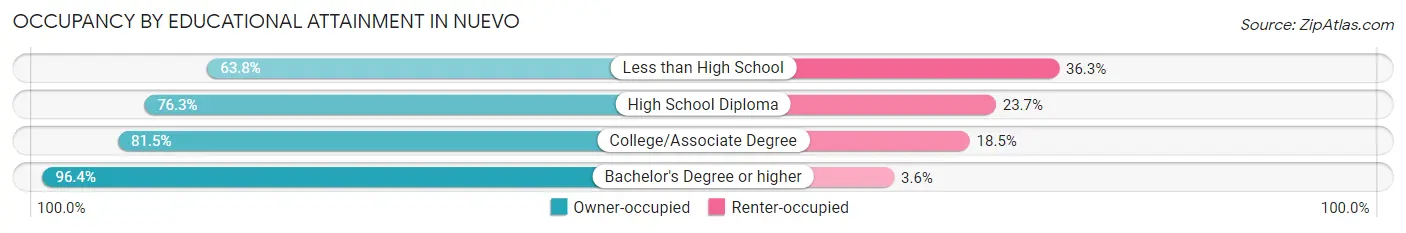
| Household Size | Owner-occupied | Renter-occupied |
| Less than High School | 204 (63.7%) | 116 (36.2%) |
| High School Diploma | 492 (76.3%) | 153 (23.7%) |
| College/Associate Degree | 369 (81.5%) | 84 (18.5%) |
| Bachelor's Degree or higher | 379 (96.4%) | 14 (3.6%) |
Occupancy by Age of Householder in Nuevo
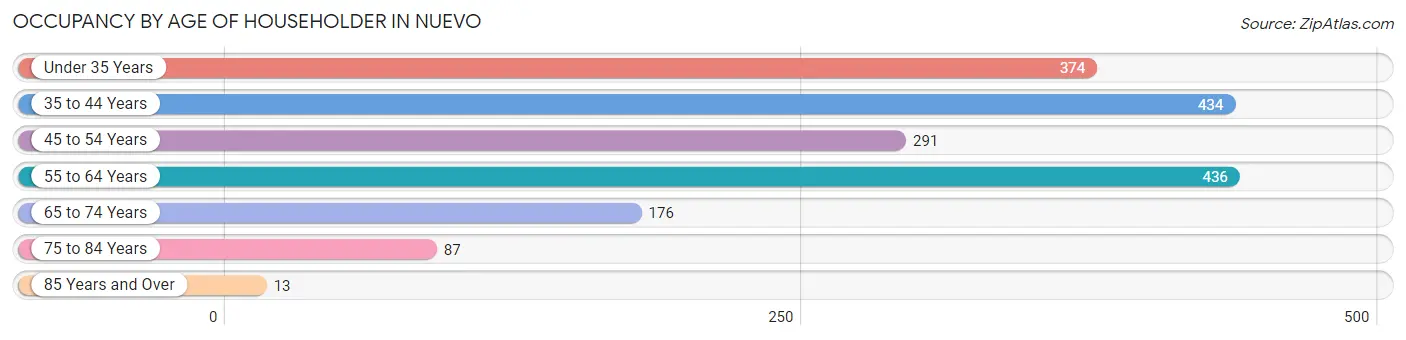
| Age Bracket | # Households | % Households |
| Under 35 Years | 374 | 20.6% |
| 35 to 44 Years | 434 | 24.0% |
| 45 to 54 Years | 291 | 16.1% |
| 55 to 64 Years | 436 | 24.1% |
| 65 to 74 Years | 176 | 9.7% |
| 75 to 84 Years | 87 | 4.8% |
| 85 Years and Over | 13 | 0.7% |
| Total | 1,811 | 100.0% |
Housing Finances in Nuevo
Median Income by Occupancy in Nuevo
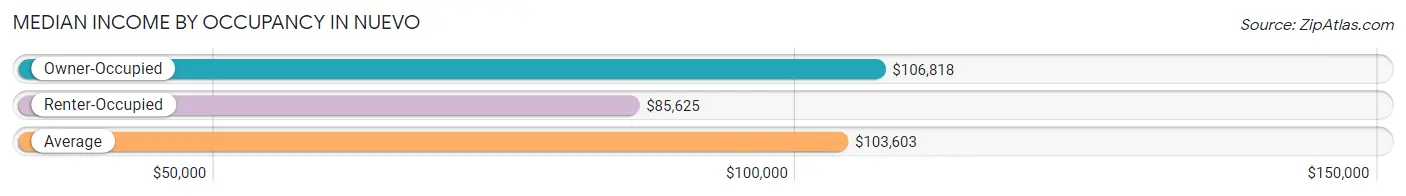
| Occupancy Type | # Households | Median Income |
| Owner-Occupied | 1,444 (79.7%) | $106,818 |
| Renter-Occupied | 367 (20.3%) | $85,625 |
| Average | 1,811 (100.0%) | $103,603 |
Occupancy by Householder Income Bracket in Nuevo
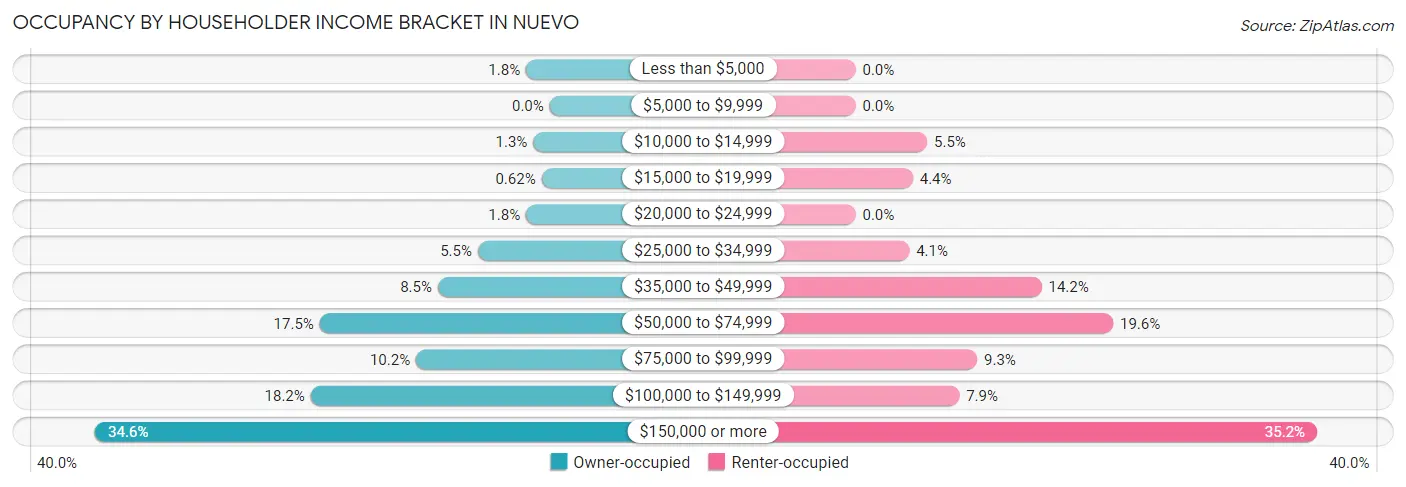
| Income Bracket | Owner-occupied | Renter-occupied |
| Less than $5,000 | 26 (1.8%) | 0 (0.0%) |
| $5,000 to $9,999 | 0 (0.0%) | 0 (0.0%) |
| $10,000 to $14,999 | 18 (1.3%) | 20 (5.4%) |
| $15,000 to $19,999 | 9 (0.6%) | 16 (4.4%) |
| $20,000 to $24,999 | 26 (1.8%) | 0 (0.0%) |
| $25,000 to $34,999 | 79 (5.5%) | 15 (4.1%) |
| $35,000 to $49,999 | 123 (8.5%) | 52 (14.2%) |
| $50,000 to $74,999 | 253 (17.5%) | 72 (19.6%) |
| $75,000 to $99,999 | 147 (10.2%) | 34 (9.3%) |
| $100,000 to $149,999 | 263 (18.2%) | 29 (7.9%) |
| $150,000 or more | 500 (34.6%) | 129 (35.1%) |
| Total | 1,444 (100.0%) | 367 (100.0%) |
Monthly Housing Cost Tiers in Nuevo
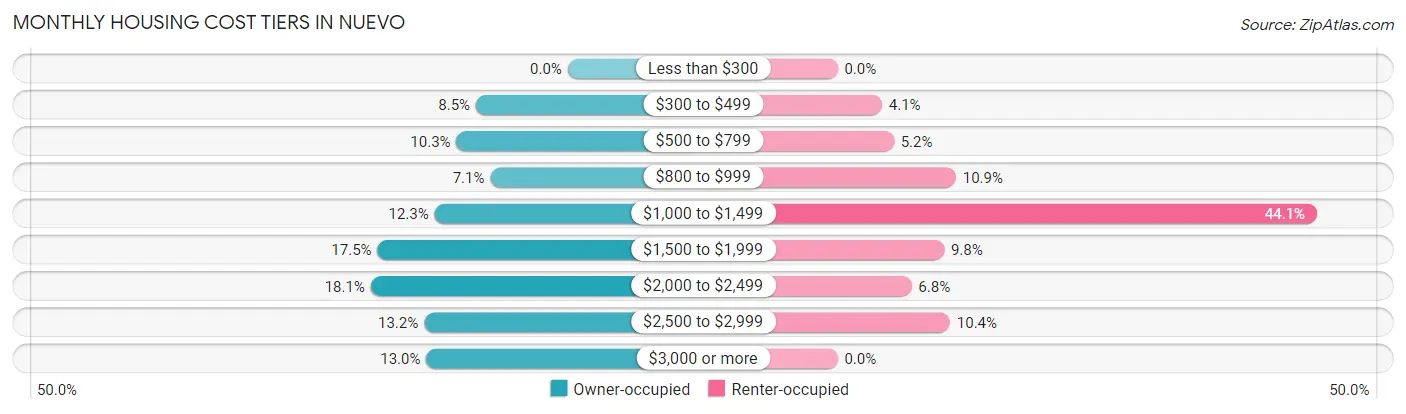
| Monthly Cost | Owner-occupied | Renter-occupied |
| Less than $300 | 0 (0.0%) | 0 (0.0%) |
| $300 to $499 | 122 (8.5%) | 15 (4.1%) |
| $500 to $799 | 148 (10.2%) | 19 (5.2%) |
| $800 to $999 | 103 (7.1%) | 40 (10.9%) |
| $1,000 to $1,499 | 177 (12.3%) | 162 (44.1%) |
| $1,500 to $1,999 | 253 (17.5%) | 36 (9.8%) |
| $2,000 to $2,499 | 262 (18.1%) | 25 (6.8%) |
| $2,500 to $2,999 | 191 (13.2%) | 38 (10.3%) |
| $3,000 or more | 188 (13.0%) | 0 (0.0%) |
| Total | 1,444 (100.0%) | 367 (100.0%) |
Physical Housing Characteristics in Nuevo
Housing Structures in Nuevo
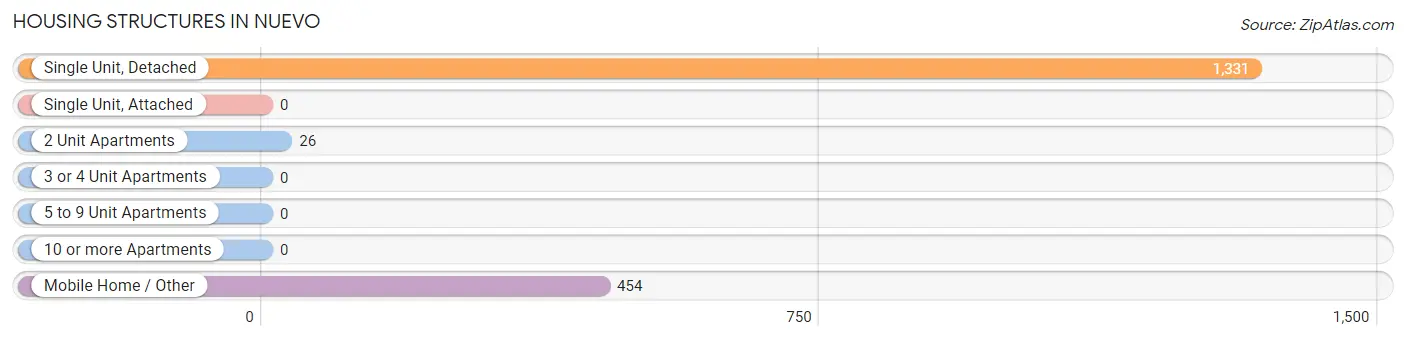
| Structure Type | # Housing Units | % Housing Units |
| Single Unit, Detached | 1,331 | 73.5% |
| Single Unit, Attached | 0 | 0.0% |
| 2 Unit Apartments | 26 | 1.4% |
| 3 or 4 Unit Apartments | 0 | 0.0% |
| 5 to 9 Unit Apartments | 0 | 0.0% |
| 10 or more Apartments | 0 | 0.0% |
| Mobile Home / Other | 454 | 25.1% |
| Total | 1,811 | 100.0% |
Housing Structures by Occupancy in Nuevo
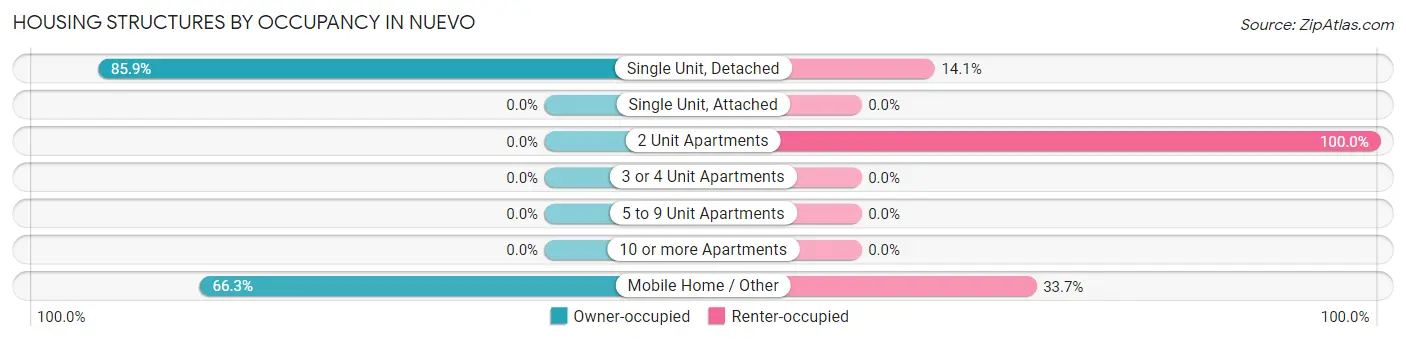
| Structure Type | Owner-occupied | Renter-occupied |
| Single Unit, Detached | 1,143 (85.9%) | 188 (14.1%) |
| Single Unit, Attached | 0 (0.0%) | 0 (0.0%) |
| 2 Unit Apartments | 0 (0.0%) | 26 (100.0%) |
| 3 or 4 Unit Apartments | 0 (0.0%) | 0 (0.0%) |
| 5 to 9 Unit Apartments | 0 (0.0%) | 0 (0.0%) |
| 10 or more Apartments | 0 (0.0%) | 0 (0.0%) |
| Mobile Home / Other | 301 (66.3%) | 153 (33.7%) |
| Total | 1,444 (79.7%) | 367 (20.3%) |
Housing Structures by Number of Rooms in Nuevo
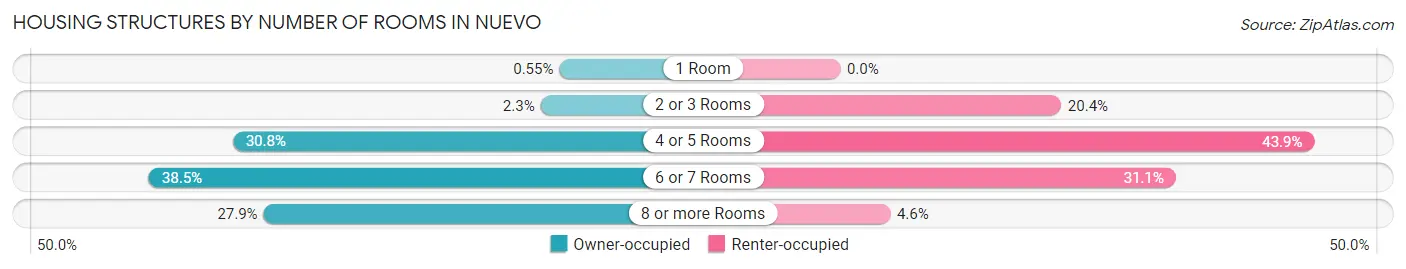
| Number of Rooms | Owner-occupied | Renter-occupied |
| 1 Room | 8 (0.5%) | 0 (0.0%) |
| 2 or 3 Rooms | 33 (2.3%) | 75 (20.4%) |
| 4 or 5 Rooms | 444 (30.7%) | 161 (43.9%) |
| 6 or 7 Rooms | 556 (38.5%) | 114 (31.1%) |
| 8 or more Rooms | 403 (27.9%) | 17 (4.6%) |
| Total | 1,444 (100.0%) | 367 (100.0%) |
Housing Structure by Heating Type in Nuevo
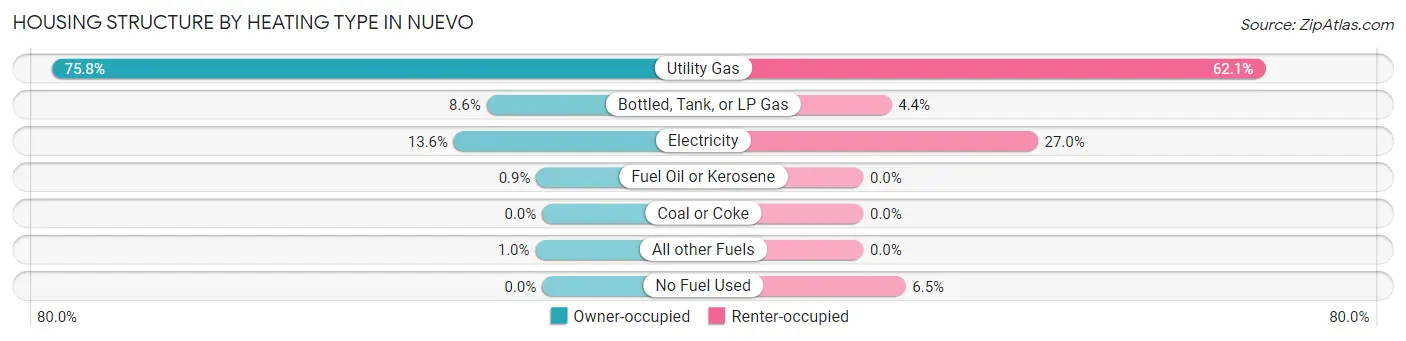
| Heating Type | Owner-occupied | Renter-occupied |
| Utility Gas | 1,095 (75.8%) | 228 (62.1%) |
| Bottled, Tank, or LP Gas | 124 (8.6%) | 16 (4.4%) |
| Electricity | 197 (13.6%) | 99 (27.0%) |
| Fuel Oil or Kerosene | 13 (0.9%) | 0 (0.0%) |
| Coal or Coke | 0 (0.0%) | 0 (0.0%) |
| All other Fuels | 15 (1.0%) | 0 (0.0%) |
| No Fuel Used | 0 (0.0%) | 24 (6.5%) |
| Total | 1,444 (100.0%) | 367 (100.0%) |
Household Vehicle Usage in Nuevo
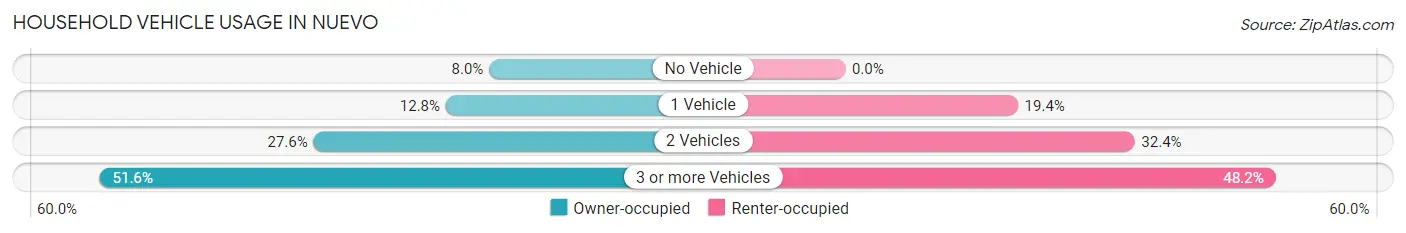
| Vehicles per Household | Owner-occupied | Renter-occupied |
| No Vehicle | 115 (8.0%) | 0 (0.0%) |
| 1 Vehicle | 185 (12.8%) | 71 (19.4%) |
| 2 Vehicles | 399 (27.6%) | 119 (32.4%) |
| 3 or more Vehicles | 745 (51.6%) | 177 (48.2%) |
| Total | 1,444 (100.0%) | 367 (100.0%) |
Real Estate & Mortgages in Nuevo
Real Estate and Mortgage Overview in Nuevo
| Characteristic | Without Mortgage | With Mortgage |
| Housing Units | 365 | 1,079 |
| Median Property Value | $461,500 | $458,900 |
| Median Household Income | $58,867 | $463 |
| Monthly Housing Costs | $701 | $188 |
| Real Estate Taxes | $2,428 | $0 |
Property Value by Mortgage Status in Nuevo
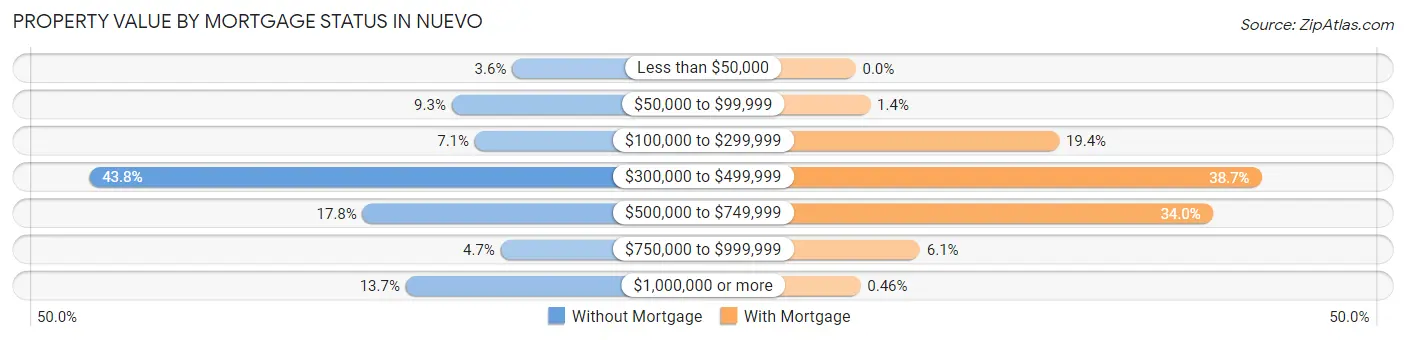
| Property Value | Without Mortgage | With Mortgage |
| Less than $50,000 | 13 (3.6%) | 0 (0.0%) |
| $50,000 to $99,999 | 34 (9.3%) | 15 (1.4%) |
| $100,000 to $299,999 | 26 (7.1%) | 209 (19.4%) |
| $300,000 to $499,999 | 160 (43.8%) | 417 (38.7%) |
| $500,000 to $749,999 | 65 (17.8%) | 367 (34.0%) |
| $750,000 to $999,999 | 17 (4.7%) | 66 (6.1%) |
| $1,000,000 or more | 50 (13.7%) | 5 (0.5%) |
| Total | 365 (100.0%) | 1,079 (100.0%) |
Household Income by Mortgage Status in Nuevo
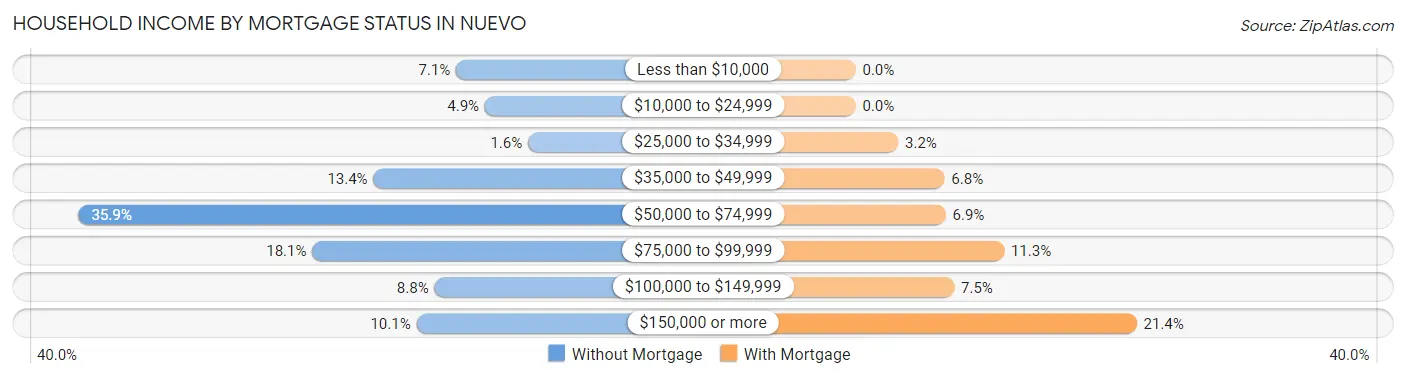
| Household Income | Without Mortgage | With Mortgage |
| Less than $10,000 | 26 (7.1%) | 0 (0.0%) |
| $10,000 to $24,999 | 18 (4.9%) | 0 (0.0%) |
| $25,000 to $34,999 | 6 (1.6%) | 35 (3.2%) |
| $35,000 to $49,999 | 49 (13.4%) | 73 (6.8%) |
| $50,000 to $74,999 | 131 (35.9%) | 74 (6.9%) |
| $75,000 to $99,999 | 66 (18.1%) | 122 (11.3%) |
| $100,000 to $149,999 | 32 (8.8%) | 81 (7.5%) |
| $150,000 or more | 37 (10.1%) | 231 (21.4%) |
| Total | 365 (100.0%) | 1,079 (100.0%) |
Property Value to Household Income Ratio in Nuevo
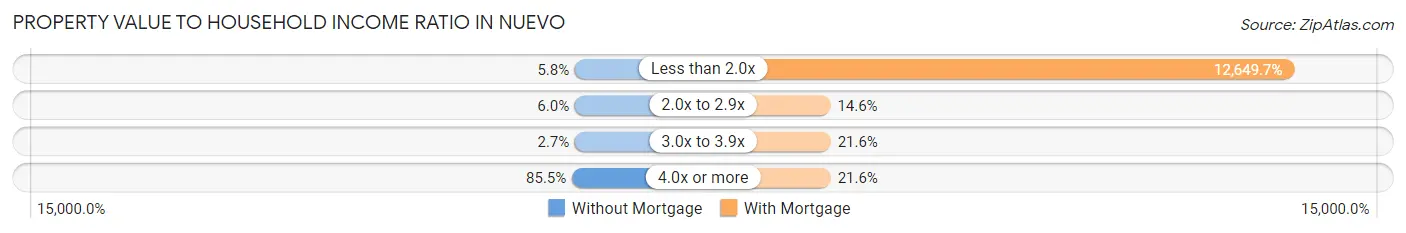
| Value-to-Income Ratio | Without Mortgage | With Mortgage |
| Less than 2.0x | 21 (5.8%) | 136,490 (12,649.7%) |
| 2.0x to 2.9x | 22 (6.0%) | 158 (14.6%) |
| 3.0x to 3.9x | 10 (2.7%) | 233 (21.6%) |
| 4.0x or more | 312 (85.5%) | 233 (21.6%) |
| Total | 365 (100.0%) | 1,079 (100.0%) |
Real Estate Taxes by Mortgage Status in Nuevo
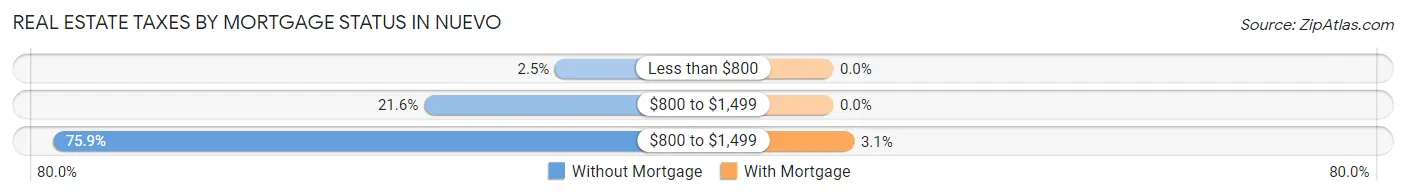
| Property Taxes | Without Mortgage | With Mortgage |
| Less than $800 | 9 (2.5%) | 0 (0.0%) |
| $800 to $1,499 | 79 (21.6%) | 0 (0.0%) |
| $800 to $1,499 | 277 (75.9%) | 33 (3.1%) |
| Total | 365 (100.0%) | 1,079 (100.0%) |
Health & Disability in Nuevo
Health Insurance Coverage by Age in Nuevo
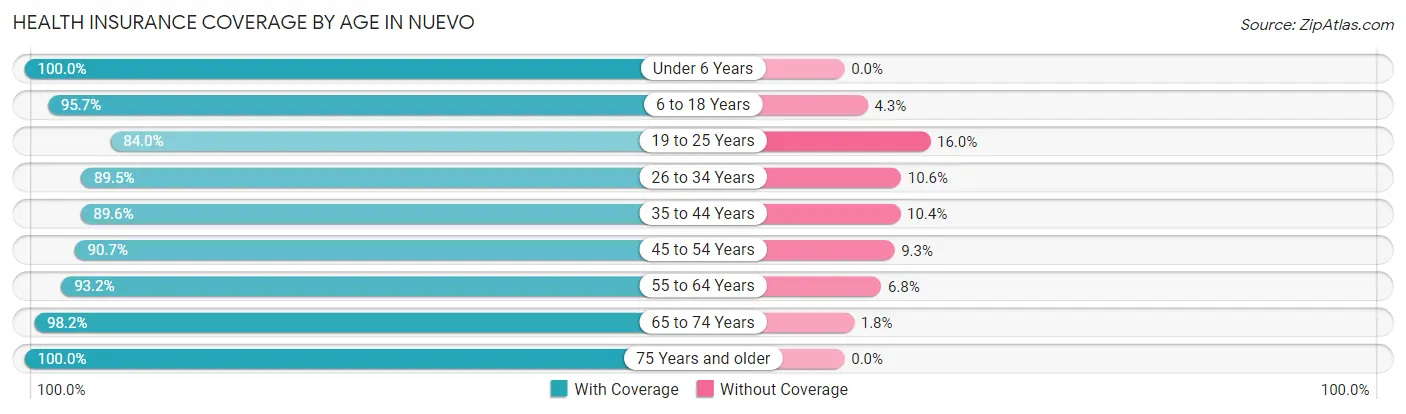
| Age Bracket | With Coverage | Without Coverage |
| Under 6 Years | 530 (100.0%) | 0 (0.0%) |
| 6 to 18 Years | 1,766 (95.7%) | 80 (4.3%) |
| 19 to 25 Years | 583 (84.0%) | 111 (16.0%) |
| 26 to 34 Years | 780 (89.4%) | 92 (10.5%) |
| 35 to 44 Years | 914 (89.6%) | 106 (10.4%) |
| 45 to 54 Years | 760 (90.7%) | 78 (9.3%) |
| 55 to 64 Years | 790 (93.2%) | 58 (6.8%) |
| 65 to 74 Years | 388 (98.2%) | 7 (1.8%) |
| 75 Years and older | 262 (100.0%) | 0 (0.0%) |
| Total | 6,773 (92.7%) | 532 (7.3%) |
Health Insurance Coverage by Citizenship Status in Nuevo
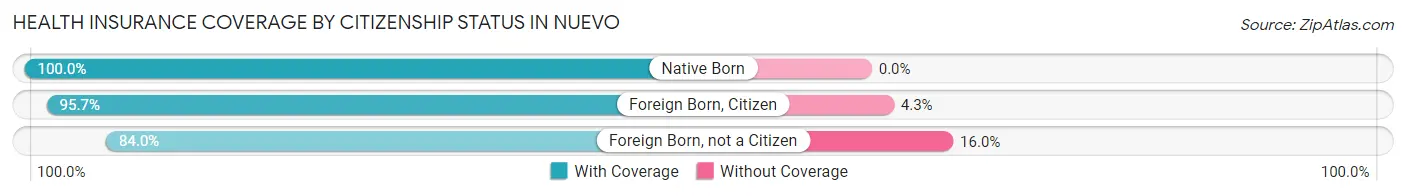
| Citizenship Status | With Coverage | Without Coverage |
| Native Born | 530 (100.0%) | 0 (0.0%) |
| Foreign Born, Citizen | 1,766 (95.7%) | 80 (4.3%) |
| Foreign Born, not a Citizen | 583 (84.0%) | 111 (16.0%) |
Health Insurance Coverage by Household Income in Nuevo
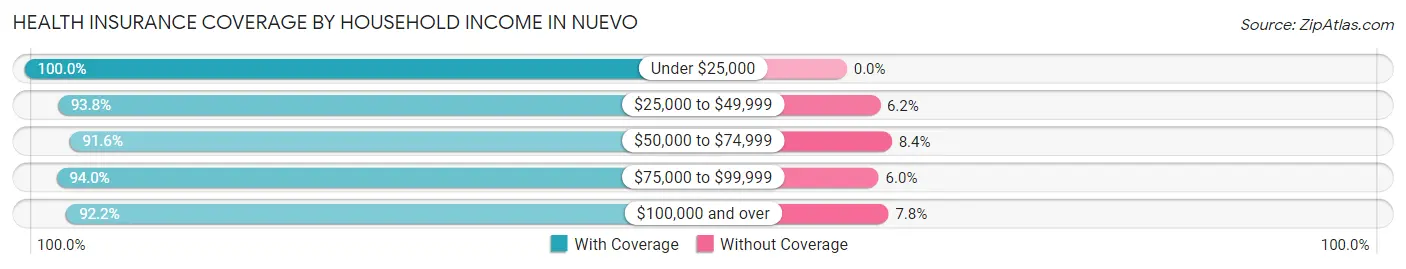
| Household Income | With Coverage | Without Coverage |
| Under $25,000 | 256 (100.0%) | 0 (0.0%) |
| $25,000 to $49,999 | 937 (93.8%) | 62 (6.2%) |
| $50,000 to $74,999 | 1,077 (91.6%) | 99 (8.4%) |
| $75,000 to $99,999 | 488 (94.0%) | 31 (6.0%) |
| $100,000 and over | 4,015 (92.2%) | 340 (7.8%) |
Public vs Private Health Insurance Coverage by Age in Nuevo
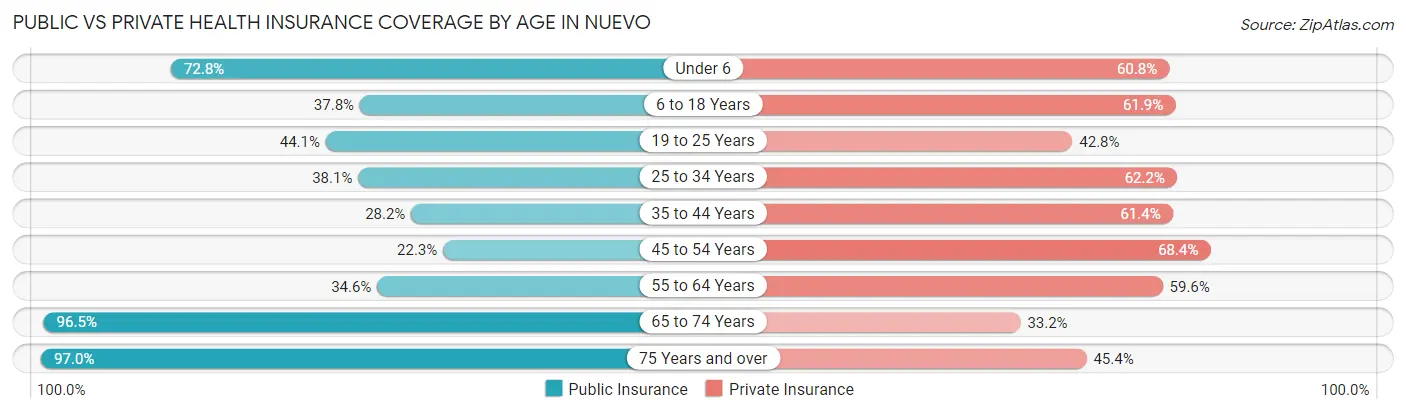
| Age Bracket | Public Insurance | Private Insurance |
| Under 6 | 386 (72.8%) | 322 (60.8%) |
| 6 to 18 Years | 697 (37.8%) | 1,142 (61.9%) |
| 19 to 25 Years | 306 (44.1%) | 297 (42.8%) |
| 25 to 34 Years | 332 (38.1%) | 542 (62.2%) |
| 35 to 44 Years | 288 (28.2%) | 626 (61.4%) |
| 45 to 54 Years | 187 (22.3%) | 573 (68.4%) |
| 55 to 64 Years | 293 (34.5%) | 505 (59.6%) |
| 65 to 74 Years | 381 (96.5%) | 131 (33.2%) |
| 75 Years and over | 254 (97.0%) | 119 (45.4%) |
| Total | 3,124 (42.8%) | 4,257 (58.3%) |
Disability Status by Sex by Age in Nuevo
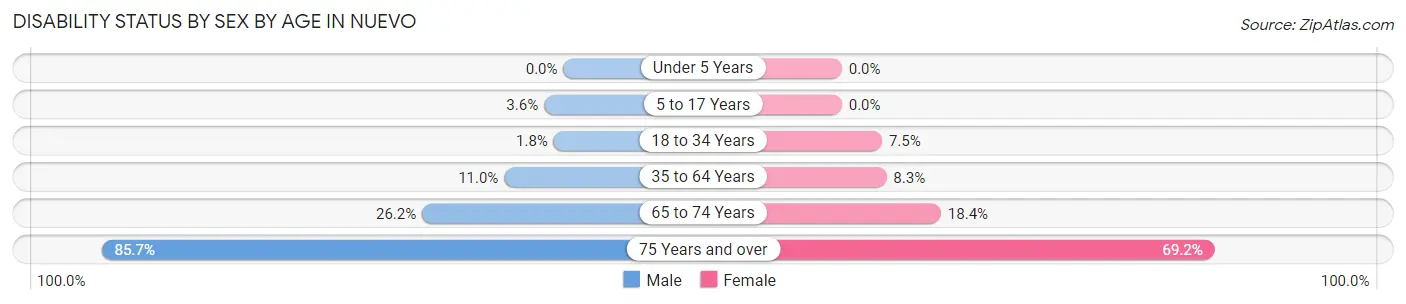
| Age Bracket | Male | Female |
| Under 5 Years | 0 (0.0%) | 0 (0.0%) |
| 5 to 17 Years | 25 (3.6%) | 0 (0.0%) |
| 18 to 34 Years | 15 (1.8%) | 68 (7.5%) |
| 35 to 64 Years | 142 (11.0%) | 117 (8.3%) |
| 65 to 74 Years | 48 (26.2%) | 39 (18.4%) |
| 75 Years and over | 66 (85.7%) | 128 (69.2%) |
Disability Class by Sex by Age in Nuevo
Disability Class: Hearing Difficulty
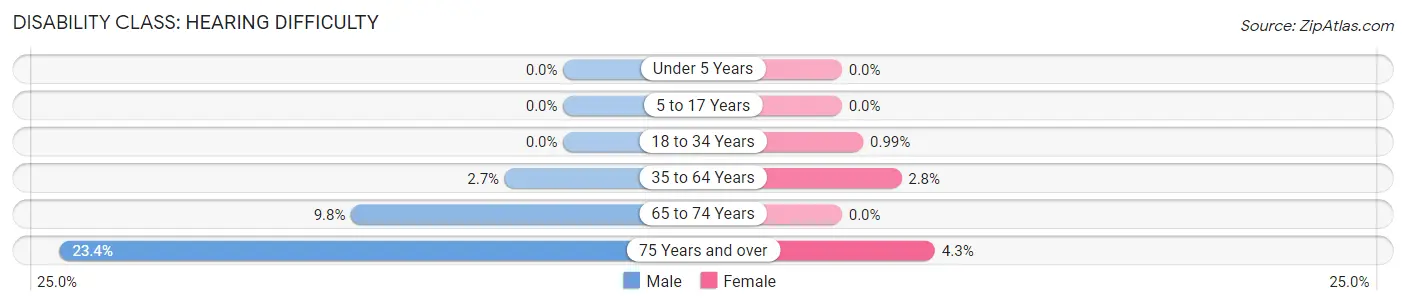
| Age Bracket | Male | Female |
| Under 5 Years | 0 (0.0%) | 0 (0.0%) |
| 5 to 17 Years | 0 (0.0%) | 0 (0.0%) |
| 18 to 34 Years | 0 (0.0%) | 9 (1.0%) |
| 35 to 64 Years | 35 (2.7%) | 39 (2.8%) |
| 65 to 74 Years | 18 (9.8%) | 0 (0.0%) |
| 75 Years and over | 18 (23.4%) | 8 (4.3%) |
Disability Class: Vision Difficulty
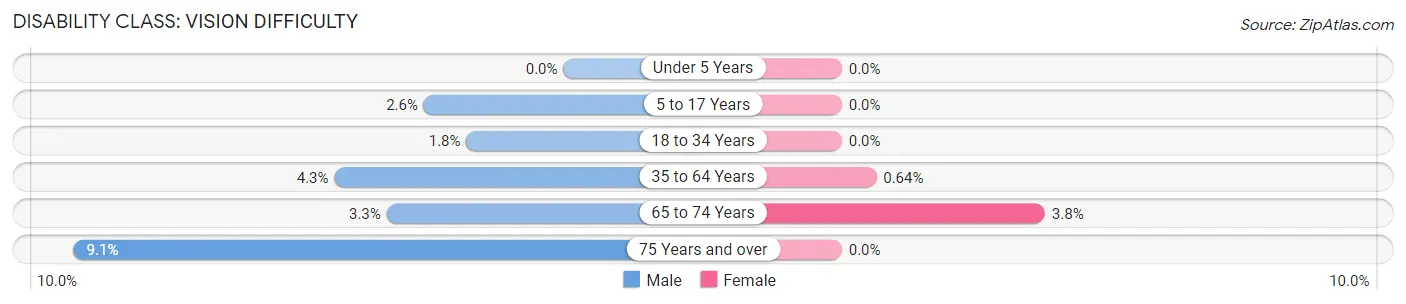
| Age Bracket | Male | Female |
| Under 5 Years | 0 (0.0%) | 0 (0.0%) |
| 5 to 17 Years | 18 (2.6%) | 0 (0.0%) |
| 18 to 34 Years | 15 (1.8%) | 0 (0.0%) |
| 35 to 64 Years | 55 (4.3%) | 9 (0.6%) |
| 65 to 74 Years | 6 (3.3%) | 8 (3.8%) |
| 75 Years and over | 7 (9.1%) | 0 (0.0%) |
Disability Class: Cognitive Difficulty
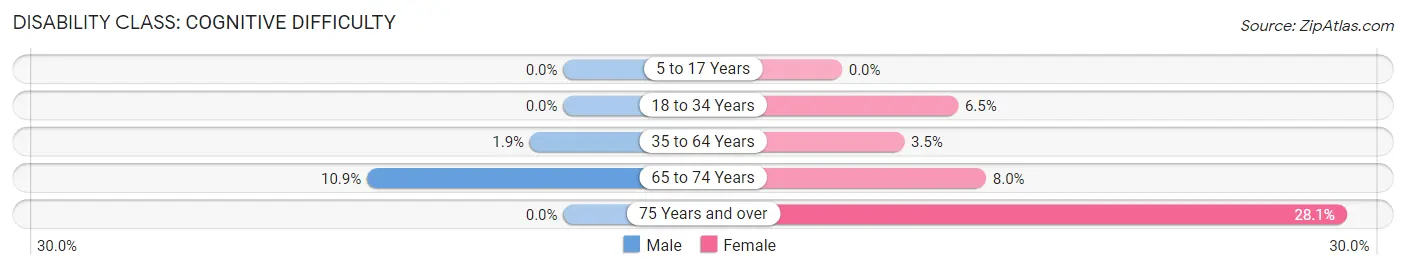
| Age Bracket | Male | Female |
| 5 to 17 Years | 0 (0.0%) | 0 (0.0%) |
| 18 to 34 Years | 0 (0.0%) | 59 (6.5%) |
| 35 to 64 Years | 24 (1.9%) | 49 (3.5%) |
| 65 to 74 Years | 20 (10.9%) | 17 (8.0%) |
| 75 Years and over | 0 (0.0%) | 52 (28.1%) |
Disability Class: Ambulatory Difficulty
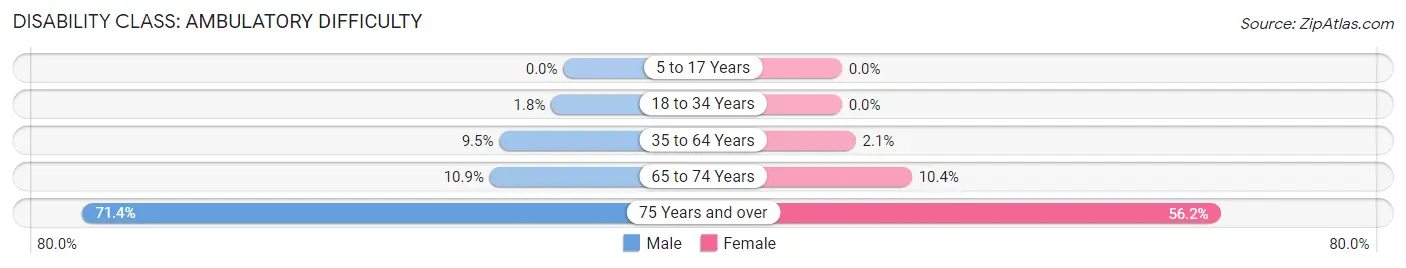
| Age Bracket | Male | Female |
| 5 to 17 Years | 0 (0.0%) | 0 (0.0%) |
| 18 to 34 Years | 15 (1.8%) | 0 (0.0%) |
| 35 to 64 Years | 123 (9.5%) | 29 (2.1%) |
| 65 to 74 Years | 20 (10.9%) | 22 (10.4%) |
| 75 Years and over | 55 (71.4%) | 104 (56.2%) |
Disability Class: Self-Care Difficulty
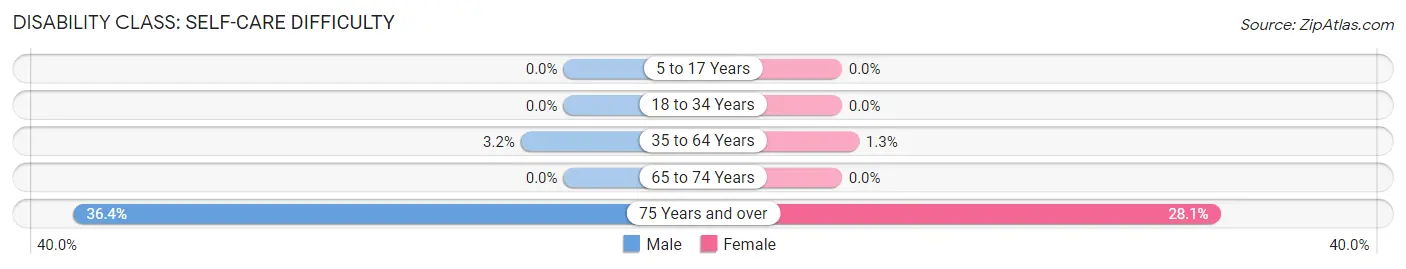
| Age Bracket | Male | Female |
| 5 to 17 Years | 0 (0.0%) | 0 (0.0%) |
| 18 to 34 Years | 0 (0.0%) | 0 (0.0%) |
| 35 to 64 Years | 41 (3.2%) | 18 (1.3%) |
| 65 to 74 Years | 0 (0.0%) | 0 (0.0%) |
| 75 Years and over | 28 (36.4%) | 52 (28.1%) |
Technology Access in Nuevo
Computing Device Access in Nuevo
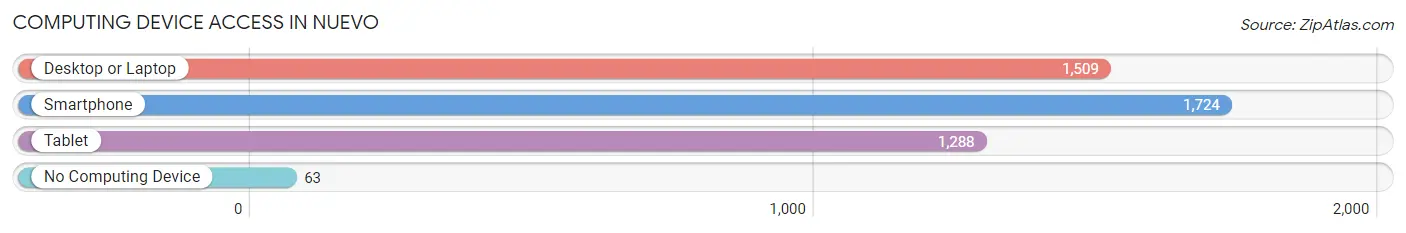
| Device Type | # Households | % Households |
| Desktop or Laptop | 1,509 | 83.3% |
| Smartphone | 1,724 | 95.2% |
| Tablet | 1,288 | 71.1% |
| No Computing Device | 63 | 3.5% |
| Total | 1,811 | 100.0% |
Internet Access in Nuevo
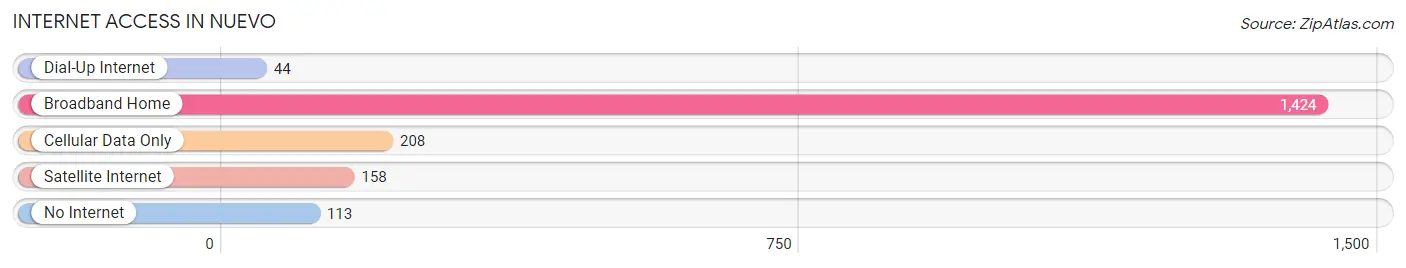
| Internet Type | # Households | % Households |
| Dial-Up Internet | 44 | 2.4% |
| Broadband Home | 1,424 | 78.6% |
| Cellular Data Only | 208 | 11.5% |
| Satellite Internet | 158 | 8.7% |
| No Internet | 113 | 6.2% |
| Total | 1,811 | 100.0% |
Nuevo Summary
Nuevo is a small unincorporated community located in Riverside County, California. It is situated in the foothills of the San Jacinto Mountains, about 10 miles east of the city of Perris. The population of Nuevo was estimated to be 8,845 in 2019.
History
Nuevo was originally inhabited by the Cahuilla Indians, who were the original inhabitants of the area. The first Europeans to settle in the area were Spanish missionaries, who established a mission in the area in 1819. The mission was abandoned in 1834, and the area was later settled by ranchers and farmers. The town of Nuevo was founded in 1887, and the first post office was established in 1891.
Geography
Nuevo is located in the foothills of the San Jacinto Mountains, about 10 miles east of the city of Perris. The area is characterized by rolling hills and valleys, with elevations ranging from 1,000 to 2,000 feet. The climate is semi-arid, with hot summers and mild winters.
Economy
Nuevo is primarily a residential community, with most of its residents commuting to nearby cities for work. The primary industries in the area are agriculture and light manufacturing. The area is also home to several wineries and vineyards, as well as a few small businesses.
Demographics
As of 2019, the population of Nuevo was estimated to be 8,845. The racial makeup of the town was 79.3% White, 8.2% Hispanic or Latino, 6.2% African American, and 4.3% Asian. The median household income was $60,945, and the median age was 37.
Nuevo is a small, rural community with a diverse population. The town is home to a variety of cultures and backgrounds, and is a great place to live for those looking for a quiet, peaceful lifestyle. The area is also known for its excellent schools and recreational opportunities, making it a great place to raise a family.
Common Questions
What is Per Capita Income in Nuevo?
Per Capita income in Nuevo is $30,515.
What is the Median Family Income in Nuevo?
Median Family Income in Nuevo is $110,074.
What is the Median Household income in Nuevo?
Median Household Income in Nuevo is $103,603.
What is Income or Wage Gap in Nuevo?
Income or Wage Gap in Nuevo is 33.0%.
Women in Nuevo earn 67.0 cents for every dollar earned by a man.
What is Family Income Deficit in Nuevo?
Family Income Deficit in Nuevo is $8,521.
Families that are below poverty line in Nuevo earn $8,521 less on average than the poverty threshold level.
What is Inequality or Gini Index in Nuevo?
Inequality or Gini Index in Nuevo is 0.38.
What is the Total Population of Nuevo?
Total Population of Nuevo is 7,305.
What is the Total Male Population of Nuevo?
Total Male Population of Nuevo is 3,366.
What is the Total Female Population of Nuevo?
Total Female Population of Nuevo is 3,939.
What is the Ratio of Males per 100 Females in Nuevo?
There are 85.45 Males per 100 Females in Nuevo.
What is the Ratio of Females per 100 Males in Nuevo?
There are 117.02 Females per 100 Males in Nuevo.
What is the Median Population Age in Nuevo?
Median Population Age in Nuevo is 31.4 Years.
What is the Average Family Size in Nuevo
Average Family Size in Nuevo is 4.3 People.
What is the Average Household Size in Nuevo
Average Household Size in Nuevo is 4.0 People.
How Large is the Labor Force in Nuevo?
There are 3,408 People in the Labor Forcein in Nuevo.
What is the Percentage of People in the Labor Force in Nuevo?
62.4% of People are in the Labor Force in Nuevo.
What is the Unemployment Rate in Nuevo?
Unemployment Rate in Nuevo is 6.9%.