Zip Codes with the Highest Percentage of Population Employed in Professional & Scientific Services in Novato, CA
RELATED REPORTS & OPTIONS
Professional & Scientific Services
Novato
Compare Zip Codes
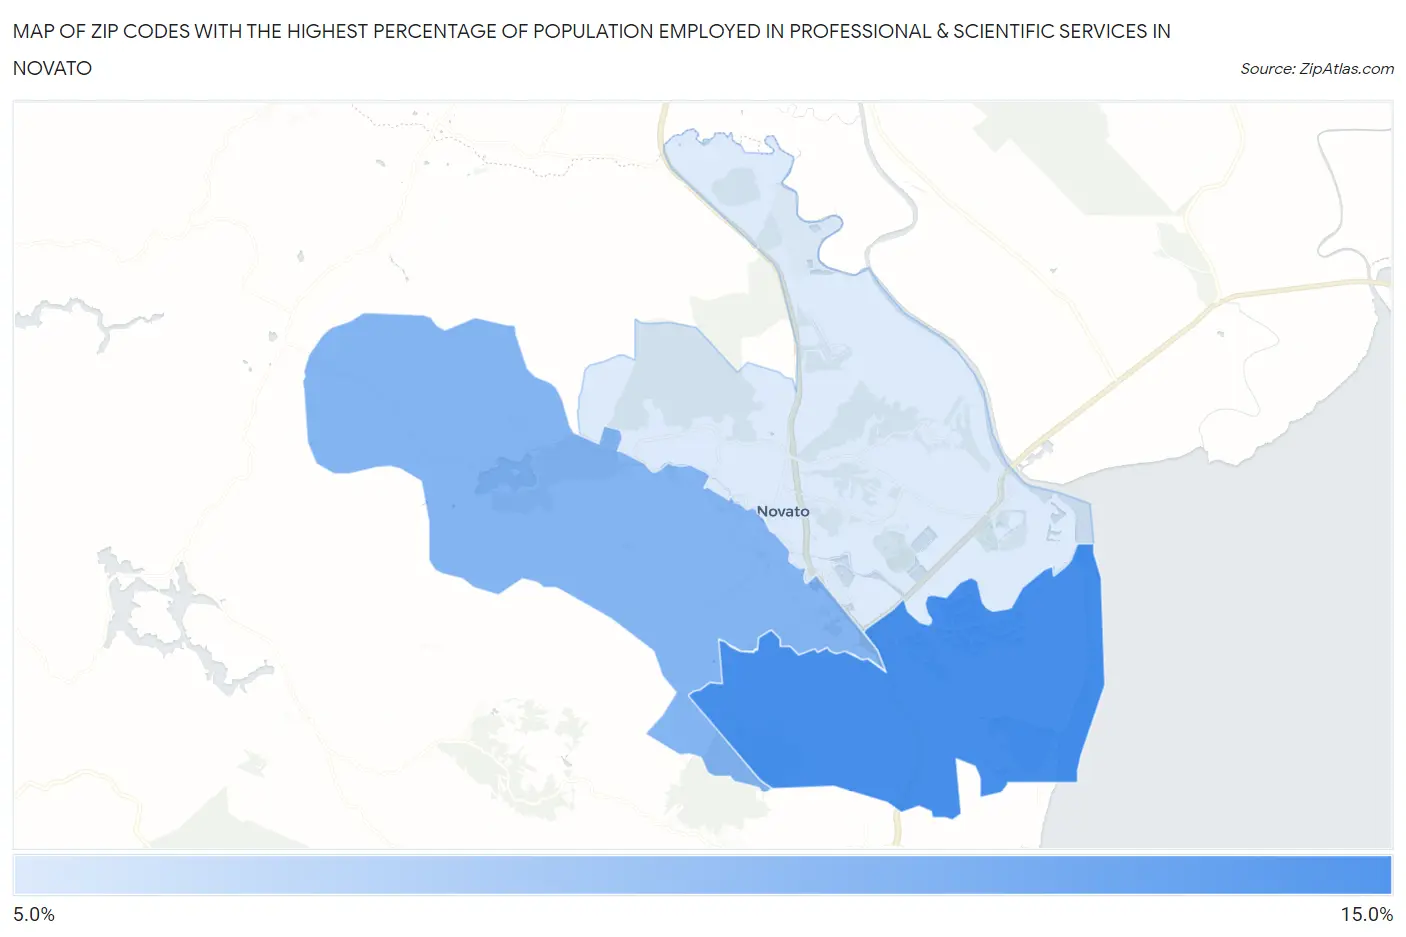
Map of Zip Codes with the Highest Percentage of Population Employed in Professional & Scientific Services in Novato
10.9%
13.8%
Zip Codes with the Highest Percentage of Population Employed in Professional & Scientific Services in Novato, CA
| Zip Code | % Employed | vs State | vs National | |
| 1. | 94949 | 13.8% | 9.4%(+4.40)#334 | 7.8%(+5.99)#2,339 |
| 2. | 94947 | 12.7% | 9.4%(+3.23)#382 | 7.8%(+4.82)#2,851 |
| 3. | 94945 | 10.9% | 9.4%(+1.50)#476 | 7.8%(+3.09)#3,890 |
1
Common Questions
What are the Top Zip Codes with the Highest Percentage of Population Employed in Professional & Scientific Services in Novato, CA?
Top Zip Codes with the Highest Percentage of Population Employed in Professional & Scientific Services in Novato, CA are:
What zip code has the Highest Percentage of Population Employed in Professional & Scientific Services in Novato, CA?
94949 has the Highest Percentage of Population Employed in Professional & Scientific Services in Novato, CA with 13.8%.
What is the Percentage of Population Employed in Professional & Scientific Services in Novato, CA?
Percentage of Population Employed in Professional & Scientific Services in Novato is 11.4%.
What is the Percentage of Population Employed in Professional & Scientific Services in California?
Percentage of Population Employed in Professional & Scientific Services in California is 9.4%.
What is the Percentage of Population Employed in Professional & Scientific Services in the United States?
Percentage of Population Employed in Professional & Scientific Services in the United States is 7.8%.