Nice, CA Map & Demographics
Nice Map
Nice Overview
$35,111
PER CAPITA INCOME
$82,321
AVG FAMILY INCOME
$69,653
AVG HOUSEHOLD INCOME
37.7%
WAGE / INCOME GAP [ % ]
62.3¢/ $1
WAGE / INCOME GAP [ $ ]
0.41
INEQUALITY / GINI INDEX
2,389
TOTAL POPULATION
1,364
MALE POPULATION
1,025
FEMALE POPULATION
133.07
MALES / 100 FEMALES
75.15
FEMALES / 100 MALES
45.5
MEDIAN AGE
2.7
AVG FAMILY SIZE
2.1
AVG HOUSEHOLD SIZE
991
LABOR FORCE [ PEOPLE ]
50.7%
PERCENT IN LABOR FORCE
5.1%
UNEMPLOYMENT RATE
Nice Zip Codes
Nice Area Codes
Income in Nice
Income Overview in Nice
Per Capita Income in Nice is $35,111, while median incomes of families and households are $82,321 and $69,653 respectively.
| Characteristic | Number | Measure |
| Per Capita Income | 2,389 | $35,111 |
| Median Family Income | 649 | $82,321 |
| Mean Family Income | 649 | $88,878 |
| Median Household Income | 1,107 | $69,653 |
| Mean Household Income | 1,107 | $72,006 |
| Income Deficit | 649 | $0 |
| Wage / Income Gap (%) | 2,389 | 37.67% |
| Wage / Income Gap ($) | 2,389 | 62.33¢ per $1 |
| Gini / Inequality Index | 2,389 | 0.41 |
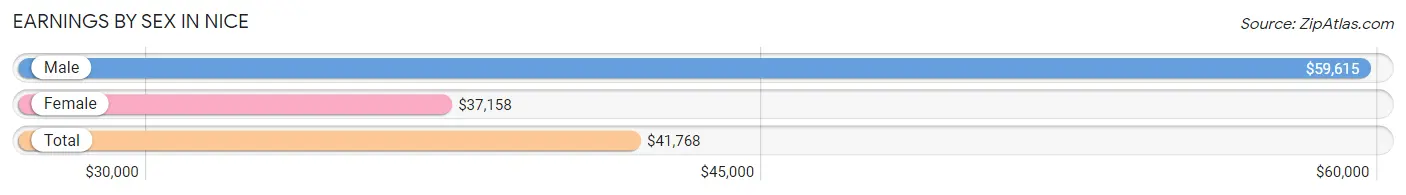
Earnings by Sex in Nice
Average Earnings in Nice are $41,768, $59,615 for men and $37,158 for women, a difference of 37.7%.
| Sex | Number | Average Earnings |
| Male | 590 (56.6%) | $59,615 |
| Female | 453 (43.4%) | $37,158 |
| Total | 1,043 (100.0%) | $41,768 |
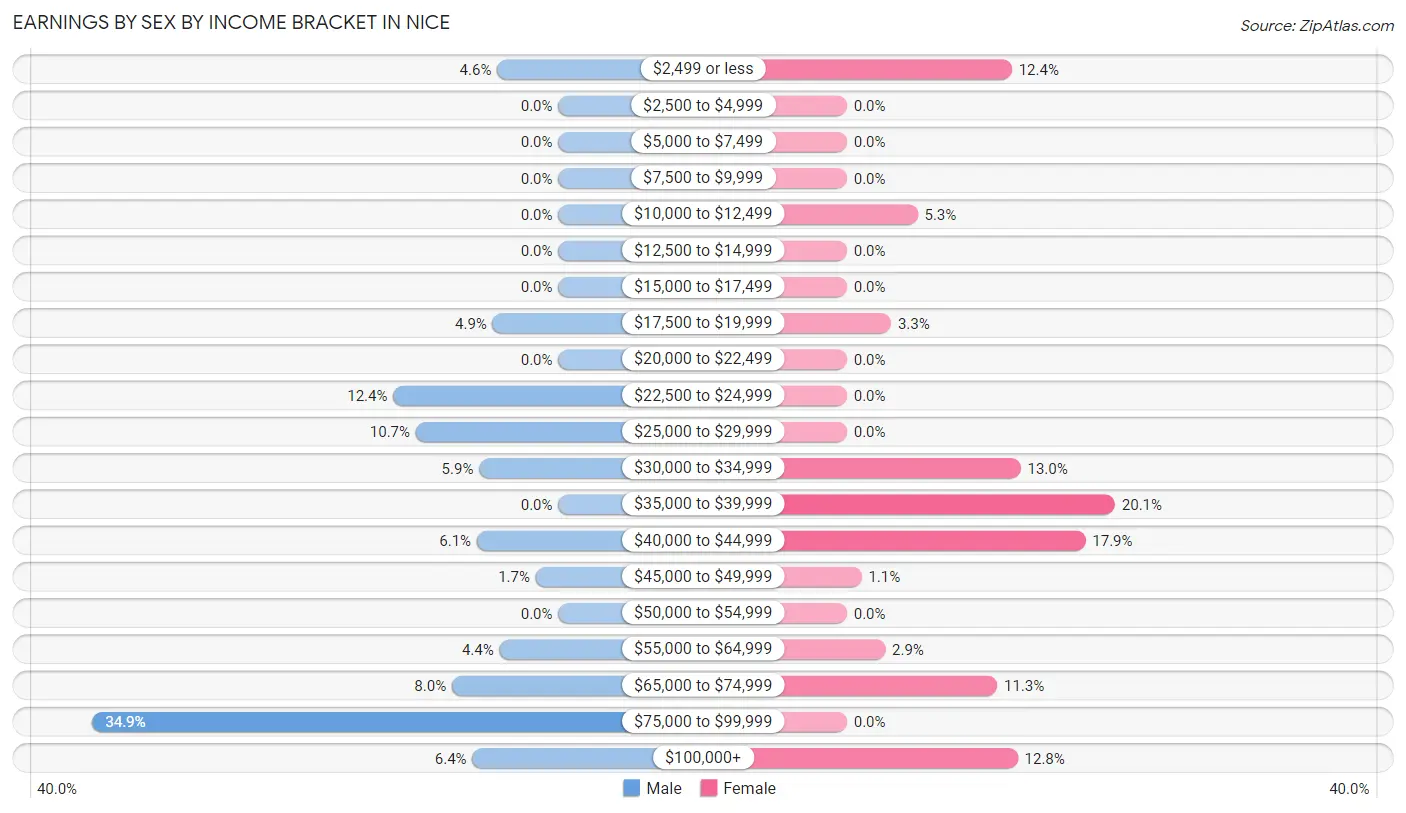
Earnings by Sex by Income Bracket in Nice
The most common earnings brackets in Nice are $75,000 to $99,999 for men (206 | 34.9%) and $35,000 to $39,999 for women (91 | 20.1%).
| Income | Male | Female |
| $2,499 or less | 27 (4.6%) | 56 (12.4%) |
| $2,500 to $4,999 | 0 (0.0%) | 0 (0.0%) |
| $5,000 to $7,499 | 0 (0.0%) | 0 (0.0%) |
| $7,500 to $9,999 | 0 (0.0%) | 0 (0.0%) |
| $10,000 to $12,499 | 0 (0.0%) | 24 (5.3%) |
| $12,500 to $14,999 | 0 (0.0%) | 0 (0.0%) |
| $15,000 to $17,499 | 0 (0.0%) | 0 (0.0%) |
| $17,500 to $19,999 | 29 (4.9%) | 15 (3.3%) |
| $20,000 to $22,499 | 0 (0.0%) | 0 (0.0%) |
| $22,500 to $24,999 | 73 (12.4%) | 0 (0.0%) |
| $25,000 to $29,999 | 63 (10.7%) | 0 (0.0%) |
| $30,000 to $34,999 | 35 (5.9%) | 59 (13.0%) |
| $35,000 to $39,999 | 0 (0.0%) | 91 (20.1%) |
| $40,000 to $44,999 | 36 (6.1%) | 81 (17.9%) |
| $45,000 to $49,999 | 10 (1.7%) | 5 (1.1%) |
| $50,000 to $54,999 | 0 (0.0%) | 0 (0.0%) |
| $55,000 to $64,999 | 26 (4.4%) | 13 (2.9%) |
| $65,000 to $74,999 | 47 (8.0%) | 51 (11.3%) |
| $75,000 to $99,999 | 206 (34.9%) | 0 (0.0%) |
| $100,000+ | 38 (6.4%) | 58 (12.8%) |
| Total | 590 (100.0%) | 453 (100.0%) |
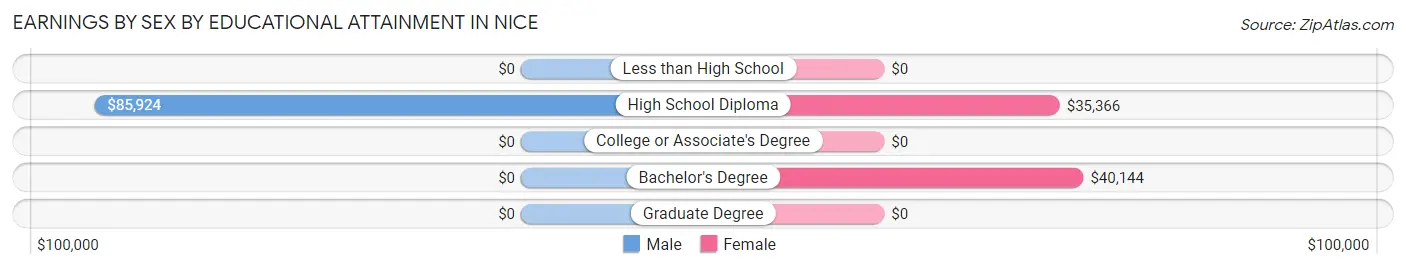
Earnings by Sex by Educational Attainment in Nice
Average earnings in Nice are $68,068 for men and $36,994 for women, a difference of 45.7%. Men with an educational attainment of high school diploma enjoy the highest average annual earnings of $85,924, while those with high school diploma education earn the least with $85,924. Women with an educational attainment of bachelor's degree earn the most with the average annual earnings of $40,144, while those with high school diploma education have the smallest earnings of $35,366.
| Educational Attainment | Male Income | Female Income |
| Less than High School | - | - |
| High School Diploma | $85,924 | $35,366 |
| College or Associate's Degree | - | - |
| Bachelor's Degree | - | - |
| Graduate Degree | - | - |
| Total | $68,068 | $36,994 |
Family Income in Nice
Family Income Brackets in Nice
According to the Nice family income data, there are 290 families falling into the $75,000 to $99,999 income range, which is the most common income bracket and makes up 44.7% of all families.
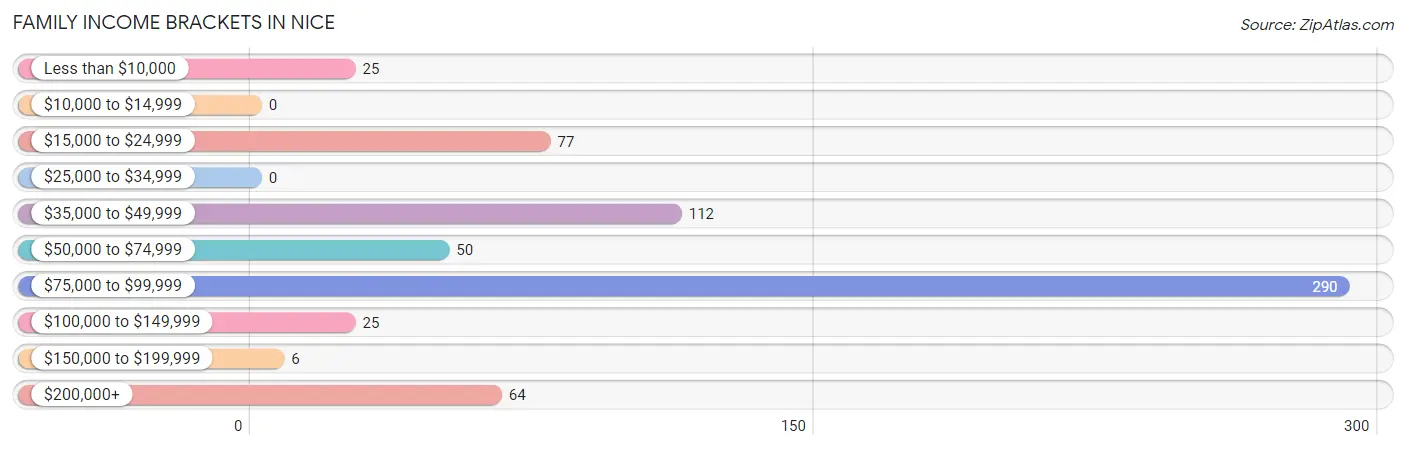
| Income Bracket | # Families | % Families |
| Less than $10,000 | 25 | 3.9% |
| $10,000 to $14,999 | 0 | 0.0% |
| $15,000 to $24,999 | 77 | 11.9% |
| $25,000 to $34,999 | 0 | 0.0% |
| $35,000 to $49,999 | 112 | 17.3% |
| $50,000 to $74,999 | 50 | 7.7% |
| $75,000 to $99,999 | 290 | 44.7% |
| $100,000 to $149,999 | 25 | 3.9% |
| $150,000 to $199,999 | 6 | 0.9% |
| $200,000+ | 64 | 9.9% |
Family Income by Famaliy Size in Nice
2-person families (351 | 54.1%) account for the highest median family income in Nice with $76,205 per family, while 2-person families (351 | 54.1%) have the highest median income of $38,102 per family member.
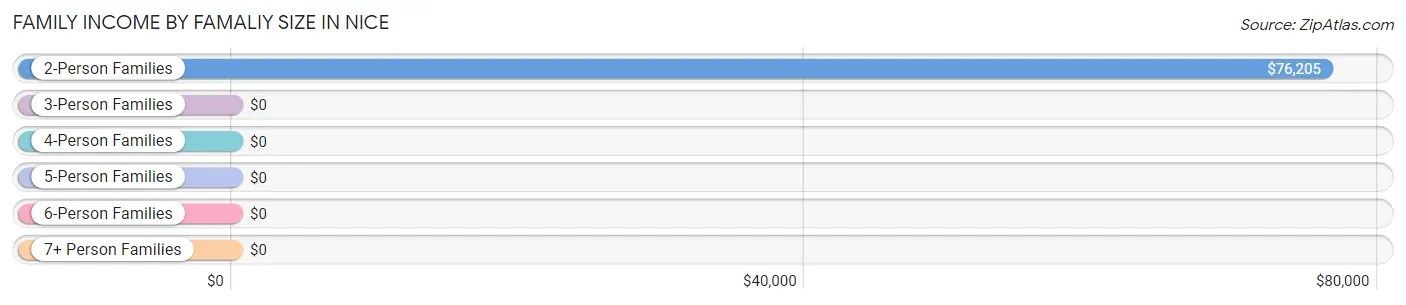
| Income Bracket | # Families | Median Income |
| 2-Person Families | 351 (54.1%) | $76,205 |
| 3-Person Families | 149 (23.0%) | $0 |
| 4-Person Families | 27 (4.2%) | $0 |
| 5-Person Families | 115 (17.7%) | $0 |
| 6-Person Families | 7 (1.1%) | $0 |
| 7+ Person Families | 0 (0.0%) | $0 |
| Total | 649 (100.0%) | $82,321 |
Family Income by Number of Earners in Nice
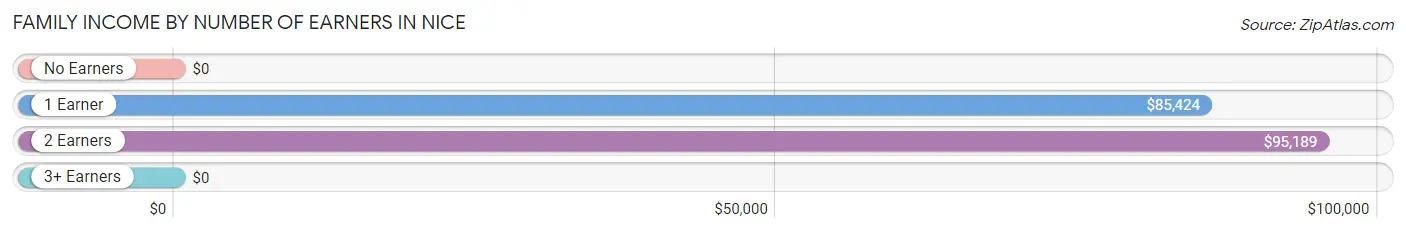
| Number of Earners | # Families | Median Income |
| No Earners | 238 (36.7%) | $0 |
| 1 Earner | 191 (29.4%) | $85,424 |
| 2 Earners | 213 (32.8%) | $95,189 |
| 3+ Earners | 7 (1.1%) | $0 |
| Total | 649 (100.0%) | $82,321 |
Household Income in Nice
Household Income Brackets in Nice
With 337 households falling in the category, the $75,000 to $99,999 income range is the most frequent in Nice, accounting for 30.4% of all households. In contrast, only 6 households (0.5%) fall into the $150,000 to $199,999 income bracket, making it the least populous group.
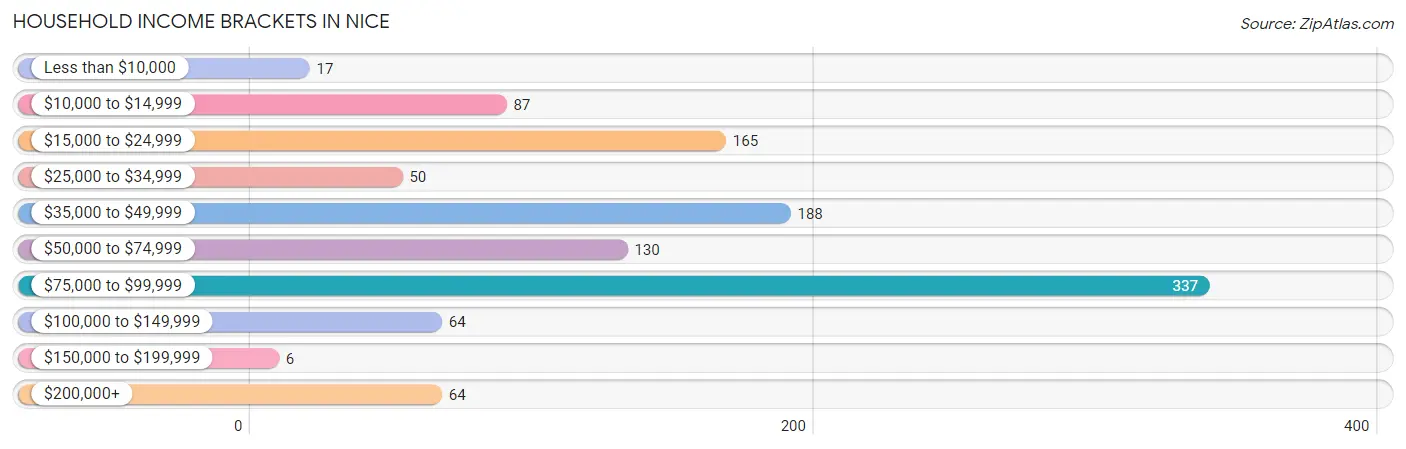
| Income Bracket | # Households | % Households |
| Less than $10,000 | 17 | 1.5% |
| $10,000 to $14,999 | 87 | 7.9% |
| $15,000 to $24,999 | 165 | 14.9% |
| $25,000 to $34,999 | 50 | 4.5% |
| $35,000 to $49,999 | 188 | 17.0% |
| $50,000 to $74,999 | 130 | 11.7% |
| $75,000 to $99,999 | 337 | 30.4% |
| $100,000 to $149,999 | 64 | 5.8% |
| $150,000 to $199,999 | 6 | 0.5% |
| $200,000+ | 64 | 5.8% |
Household Income by Householder Age in Nice
The median household income in Nice is $69,653, with the highest median household income of $83,750 found in the 25 to 44 years age bracket for the primary householder. A total of 346 households (31.3%) fall into this category. Meanwhile, the 15 to 24 years age bracket for the primary householder has the lowest median household income of $0, with 51 households (4.6%) in this group.
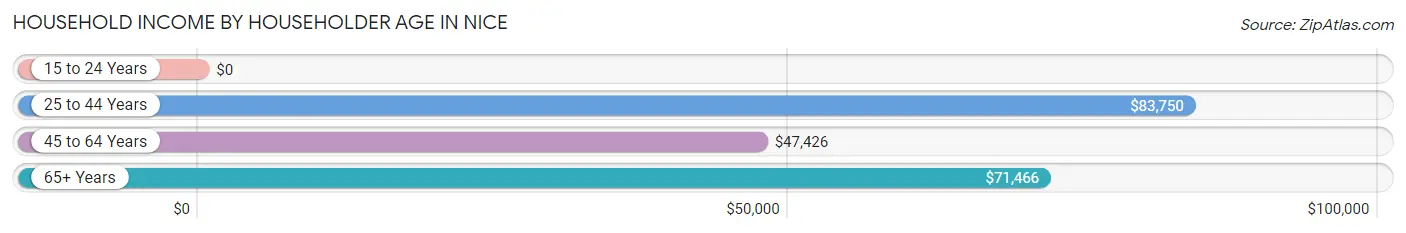
| Income Bracket | # Households | Median Income |
| 15 to 24 Years | 51 (4.6%) | $0 |
| 25 to 44 Years | 346 (31.3%) | $83,750 |
| 45 to 64 Years | 288 (26.0%) | $47,426 |
| 65+ Years | 422 (38.1%) | $71,466 |
| Total | 1,107 (100.0%) | $69,653 |
Poverty in Nice
Income Below Poverty by Sex and Age in Nice
With 12.7% poverty level for males and 13.3% for females among the residents of Nice, 12 to 14 year old males and 55 to 64 year old females are the most vulnerable to poverty, with 25 males (75.8%) and 70 females (34.8%) in their respective age groups living below the poverty level.
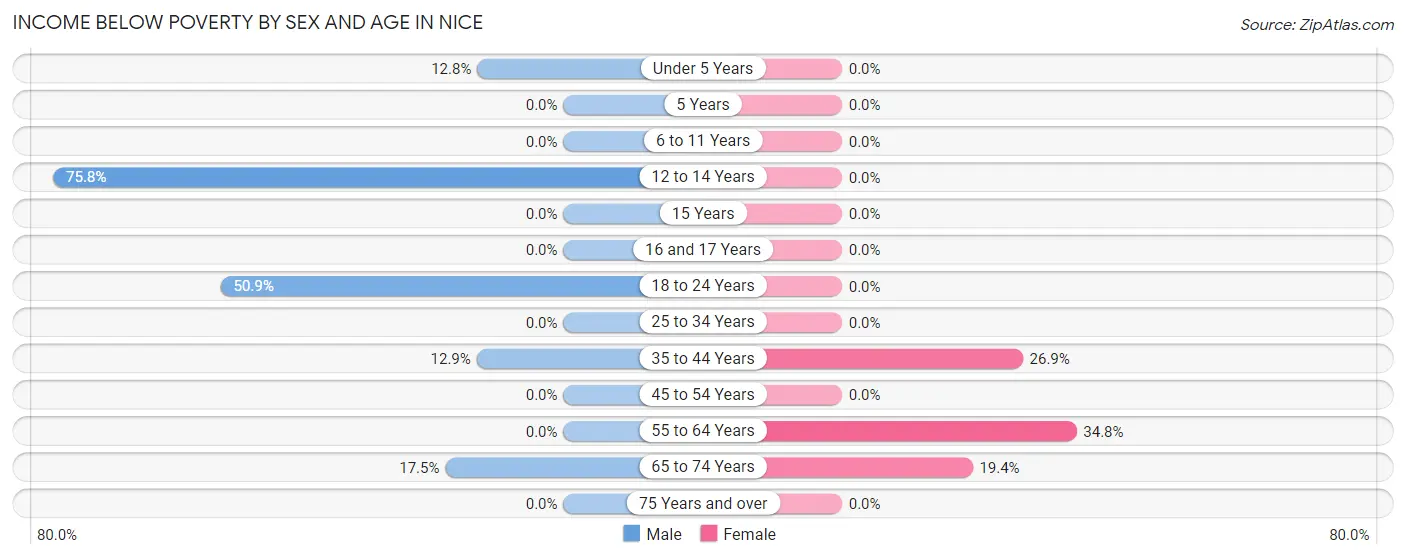
| Age Bracket | Male | Female |
| Under 5 Years | 33 (12.8%) | 0 (0.0%) |
| 5 Years | 0 (0.0%) | 0 (0.0%) |
| 6 to 11 Years | 0 (0.0%) | 0 (0.0%) |
| 12 to 14 Years | 25 (75.8%) | 0 (0.0%) |
| 15 Years | 0 (0.0%) | 0 (0.0%) |
| 16 and 17 Years | 0 (0.0%) | 0 (0.0%) |
| 18 to 24 Years | 28 (50.9%) | 0 (0.0%) |
| 25 to 34 Years | 0 (0.0%) | 0 (0.0%) |
| 35 to 44 Years | 42 (12.9%) | 40 (26.9%) |
| 45 to 54 Years | 0 (0.0%) | 0 (0.0%) |
| 55 to 64 Years | 0 (0.0%) | 70 (34.8%) |
| 65 to 74 Years | 44 (17.5%) | 26 (19.4%) |
| 75 Years and over | 0 (0.0%) | 0 (0.0%) |
| Total | 172 (12.7%) | 136 (13.3%) |
Income Above Poverty by Sex and Age in Nice
According to the poverty statistics in Nice, males aged 15 years and females aged 6 to 11 years are the age groups that are most secure financially, with 100.0% of males and 100.0% of females in these age groups living above the poverty line.
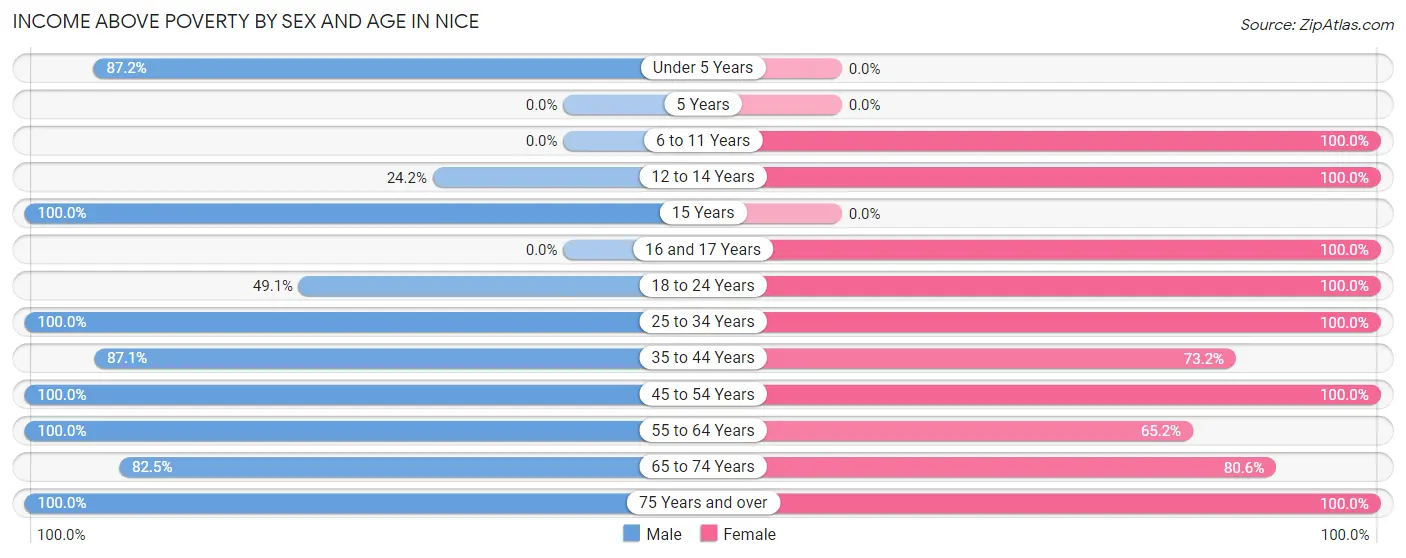
| Age Bracket | Male | Female |
| Under 5 Years | 225 (87.2%) | 0 (0.0%) |
| 5 Years | 0 (0.0%) | 0 (0.0%) |
| 6 to 11 Years | 0 (0.0%) | 96 (100.0%) |
| 12 to 14 Years | 8 (24.2%) | 36 (100.0%) |
| 15 Years | 12 (100.0%) | 0 (0.0%) |
| 16 and 17 Years | 0 (0.0%) | 26 (100.0%) |
| 18 to 24 Years | 27 (49.1%) | 59 (100.0%) |
| 25 to 34 Years | 48 (100.0%) | 80 (100.0%) |
| 35 to 44 Years | 284 (87.1%) | 109 (73.2%) |
| 45 to 54 Years | 58 (100.0%) | 118 (100.0%) |
| 55 to 64 Years | 180 (100.0%) | 131 (65.2%) |
| 65 to 74 Years | 207 (82.5%) | 108 (80.6%) |
| 75 Years and over | 136 (100.0%) | 123 (100.0%) |
| Total | 1,185 (87.3%) | 886 (86.7%) |
Income Below Poverty Among Married-Couple Families in Nice
The poverty statistics for married-couple families in Nice show that 2.9% or 15 of the total 515 families live below the poverty line. Families with no children have the highest poverty rate of 5.0%, comprising of 15 families. On the other hand, families with 1 or 2 children have the lowest poverty rate of 0.0%, which includes 0 families.
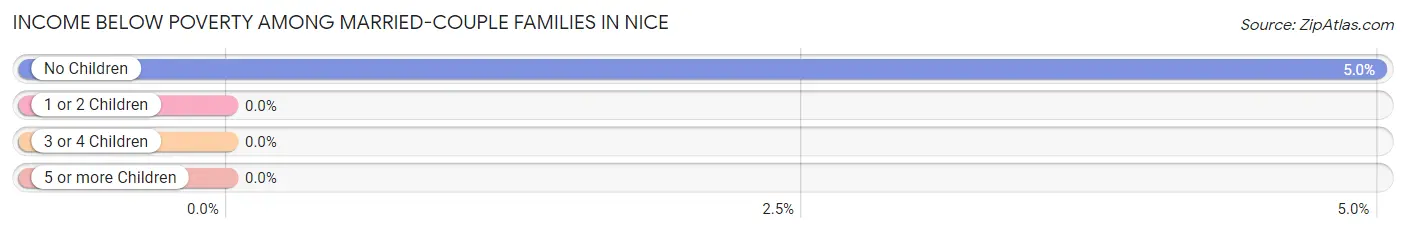
| Children | Above Poverty | Below Poverty |
| No Children | 285 (95.0%) | 15 (5.0%) |
| 1 or 2 Children | 100 (100.0%) | 0 (0.0%) |
| 3 or 4 Children | 115 (100.0%) | 0 (0.0%) |
| 5 or more Children | 0 (0.0%) | 0 (0.0%) |
| Total | 500 (97.1%) | 15 (2.9%) |
Income Below Poverty Among Single-Parent Households in Nice
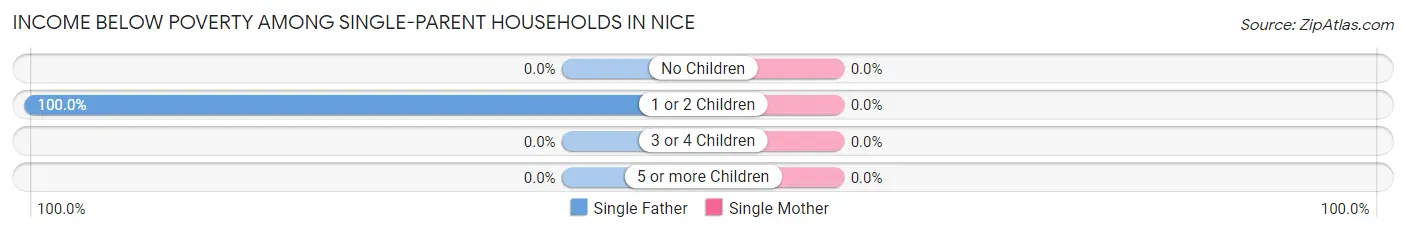
| Children | Single Father | Single Mother |
| No Children | 0 (0.0%) | 0 (0.0%) |
| 1 or 2 Children | 42 (100.0%) | 0 (0.0%) |
| 3 or 4 Children | 0 (0.0%) | 0 (0.0%) |
| 5 or more Children | 0 (0.0%) | 0 (0.0%) |
| Total | 42 (100.0%) | 0 (0.0%) |
Income Below Poverty Among Married-Couple vs Single-Parent Households in Nice
The poverty data for Nice shows that 15 of the married-couple family households (2.9%) and 42 of the single-parent households (31.3%) are living below the poverty level. Within the married-couple family households, those with no children have the highest poverty rate, with 15 households (5.0%) falling below the poverty line. Among the single-parent households, those with 1 or 2 children have the highest poverty rate, with 42 household (61.8%) living below poverty.
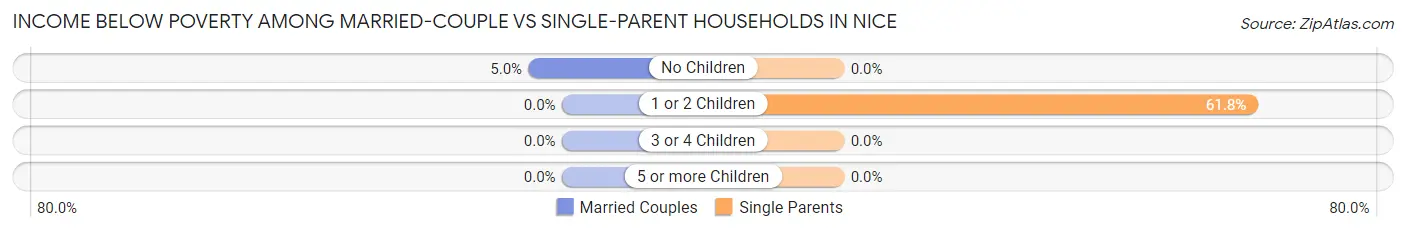
| Children | Married-Couple Families | Single-Parent Households |
| No Children | 15 (5.0%) | 0 (0.0%) |
| 1 or 2 Children | 0 (0.0%) | 42 (61.8%) |
| 3 or 4 Children | 0 (0.0%) | 0 (0.0%) |
| 5 or more Children | 0 (0.0%) | 0 (0.0%) |
| Total | 15 (2.9%) | 42 (31.3%) |
Race in Nice
The most populous races in Nice are White / Caucasian (1,515 | 63.4%), Hispanic or Latino (621 | 26.0%), and Some other Race (616 | 25.8%).
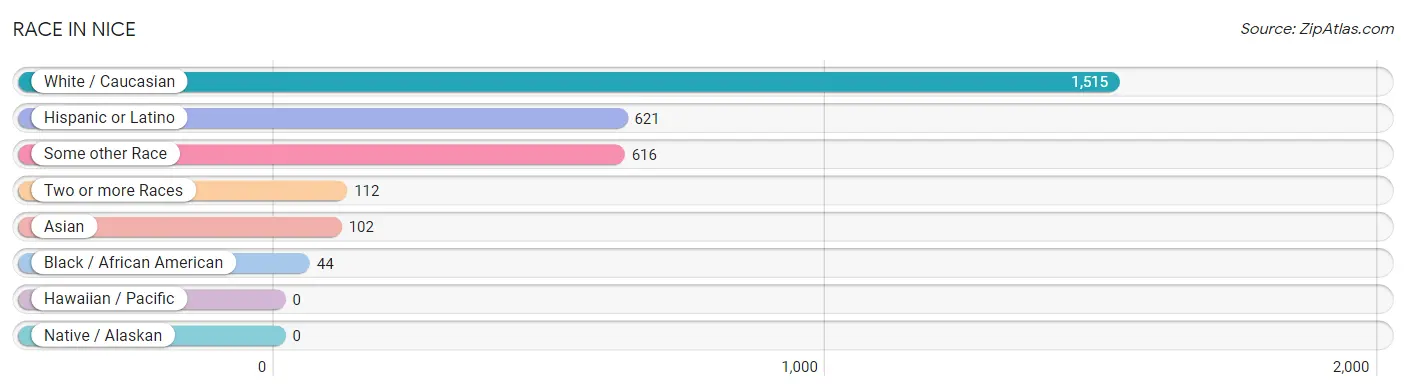
| Race | # Population | % Population |
| Asian | 102 | 4.3% |
| Black / African American | 44 | 1.8% |
| Hawaiian / Pacific | 0 | 0.0% |
| Hispanic or Latino | 621 | 26.0% |
| Native / Alaskan | 0 | 0.0% |
| White / Caucasian | 1,515 | 63.4% |
| Two or more Races | 112 | 4.7% |
| Some other Race | 616 | 25.8% |
| Total | 2,389 | 100.0% |
Ancestry in Nice
The most populous ancestries reported in Nice are Mexican (501 | 21.0%), German (384 | 16.1%), English (272 | 11.4%), Irish (198 | 8.3%), and Swedish (161 | 6.7%), together accounting for 63.5% of all Nice residents.
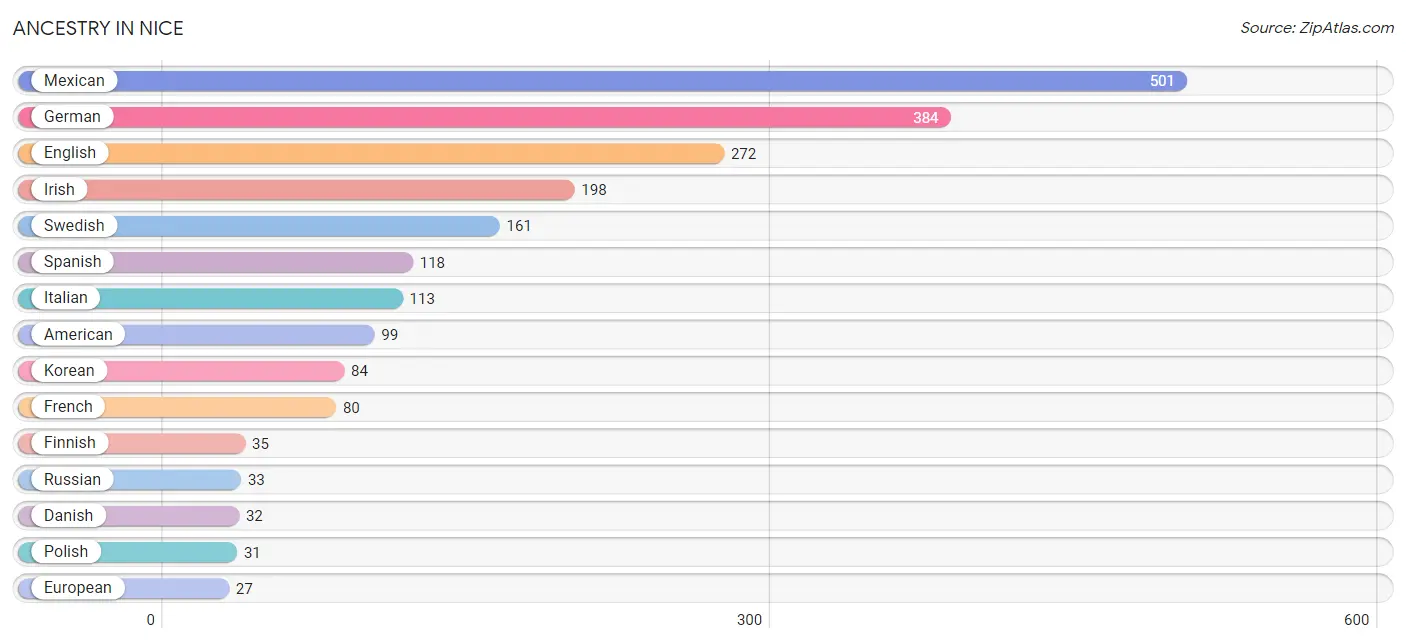
| Ancestry | # Population | % Population |
| American | 99 | 4.1% |
| Arab | 15 | 0.6% |
| Bhutanese | 17 | 0.7% |
| Burmese | 1 | 0.0% |
| Cherokee | 4 | 0.2% |
| Cuban | 2 | 0.1% |
| Danish | 32 | 1.3% |
| English | 272 | 11.4% |
| European | 27 | 1.1% |
| Finnish | 35 | 1.5% |
| French | 80 | 3.4% |
| German | 384 | 16.1% |
| Hungarian | 27 | 1.1% |
| Irish | 198 | 8.3% |
| Italian | 113 | 4.7% |
| Korean | 84 | 3.5% |
| Lebanese | 15 | 0.6% |
| Mexican | 501 | 21.0% |
| Norwegian | 22 | 0.9% |
| Polish | 31 | 1.3% |
| Portuguese | 8 | 0.3% |
| Russian | 33 | 1.4% |
| Scotch-Irish | 12 | 0.5% |
| Spanish | 118 | 4.9% |
| Swedish | 161 | 6.7% | View All 25 Rows |
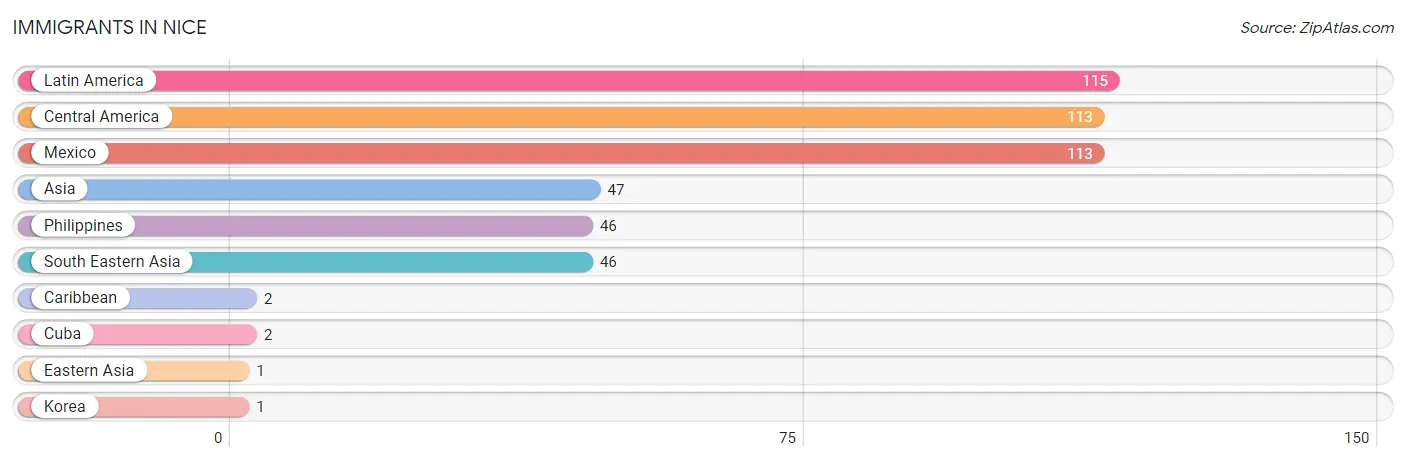
Immigrants in Nice
The most numerous immigrant groups reported in Nice came from Latin America (115 | 4.8%), Central America (113 | 4.7%), Mexico (113 | 4.7%), Asia (47 | 2.0%), and Philippines (46 | 1.9%), together accounting for 18.2% of all Nice residents.
| Immigration Origin | # Population | % Population |
| Asia | 47 | 2.0% |
| Caribbean | 2 | 0.1% |
| Central America | 113 | 4.7% |
| Cuba | 2 | 0.1% |
| Eastern Asia | 1 | 0.0% |
| Korea | 1 | 0.0% |
| Latin America | 115 | 4.8% |
| Mexico | 113 | 4.7% |
| Philippines | 46 | 1.9% |
| South Eastern Asia | 46 | 1.9% | View All 10 Rows |
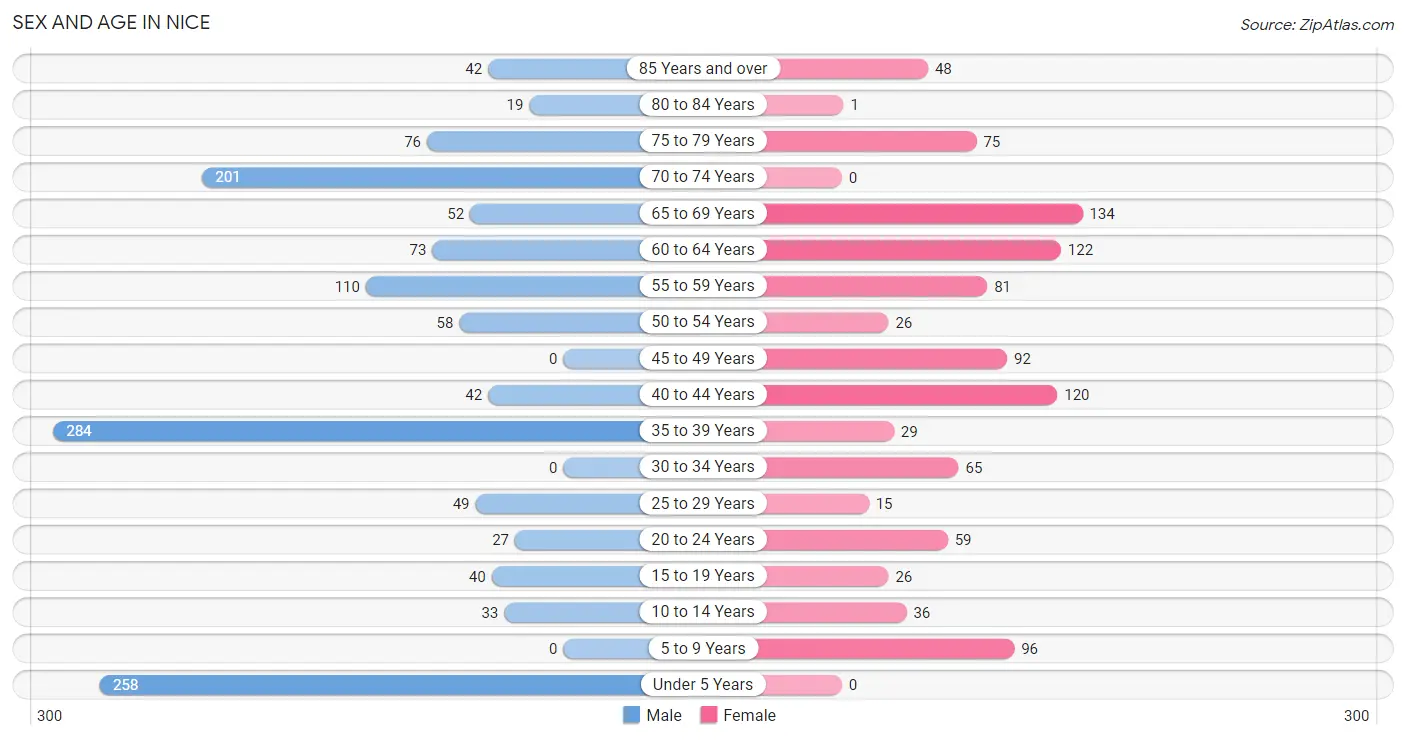
Sex and Age in Nice
Sex and Age in Nice
The most populous age groups in Nice are 35 to 39 Years (284 | 20.8%) for men and 65 to 69 Years (134 | 13.1%) for women.
| Age Bracket | Male | Female |
| Under 5 Years | 258 (18.9%) | 0 (0.0%) |
| 5 to 9 Years | 0 (0.0%) | 96 (9.4%) |
| 10 to 14 Years | 33 (2.4%) | 36 (3.5%) |
| 15 to 19 Years | 40 (2.9%) | 26 (2.5%) |
| 20 to 24 Years | 27 (2.0%) | 59 (5.8%) |
| 25 to 29 Years | 49 (3.6%) | 15 (1.5%) |
| 30 to 34 Years | 0 (0.0%) | 65 (6.3%) |
| 35 to 39 Years | 284 (20.8%) | 29 (2.8%) |
| 40 to 44 Years | 42 (3.1%) | 120 (11.7%) |
| 45 to 49 Years | 0 (0.0%) | 92 (9.0%) |
| 50 to 54 Years | 58 (4.3%) | 26 (2.5%) |
| 55 to 59 Years | 110 (8.1%) | 81 (7.9%) |
| 60 to 64 Years | 73 (5.3%) | 122 (11.9%) |
| 65 to 69 Years | 52 (3.8%) | 134 (13.1%) |
| 70 to 74 Years | 201 (14.7%) | 0 (0.0%) |
| 75 to 79 Years | 76 (5.6%) | 75 (7.3%) |
| 80 to 84 Years | 19 (1.4%) | 1 (0.1%) |
| 85 Years and over | 42 (3.1%) | 48 (4.7%) |
| Total | 1,364 (100.0%) | 1,025 (100.0%) |
Families and Households in Nice
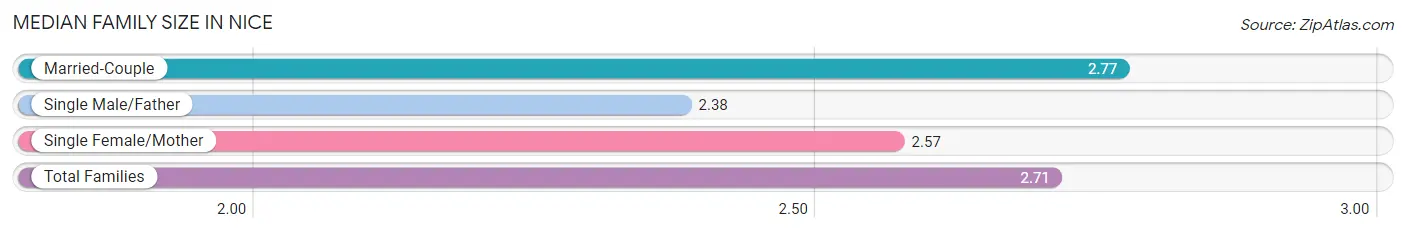
Median Family Size in Nice
The median family size in Nice is 2.71 persons per family, with married-couple families (515 | 79.3%) accounting for the largest median family size of 2.77 persons per family. On the other hand, single male/father families (42 | 6.5%) represent the smallest median family size with 2.38 persons per family.
| Family Type | # Families | Family Size |
| Married-Couple | 515 (79.3%) | 2.77 |
| Single Male/Father | 42 (6.5%) | 2.38 |
| Single Female/Mother | 92 (14.2%) | 2.57 |
| Total Families | 649 (100.0%) | 2.71 |
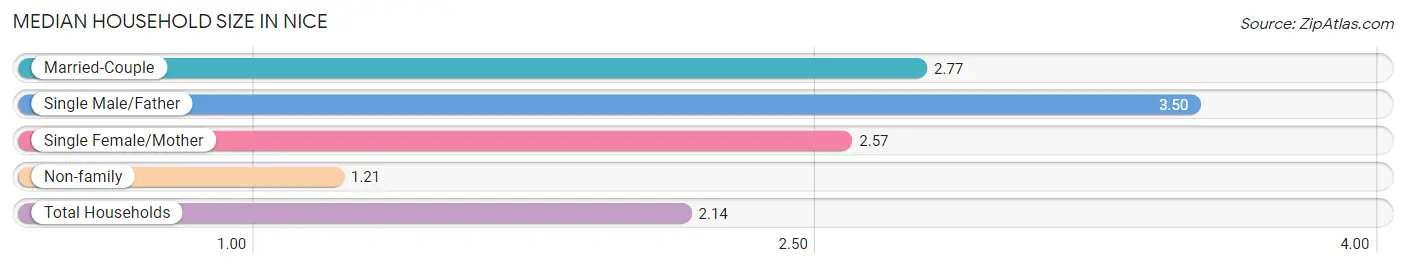
Median Household Size in Nice
The median household size in Nice is 2.14 persons per household, with single male/father households (42 | 3.8%) accounting for the largest median household size of 3.5 persons per household. non-family households (458 | 41.4%) represent the smallest median household size with 1.21 persons per household.
| Household Type | # Households | Household Size |
| Married-Couple | 515 (46.5%) | 2.77 |
| Single Male/Father | 42 (3.8%) | 3.50 |
| Single Female/Mother | 92 (8.3%) | 2.57 |
| Non-family | 458 (41.4%) | 1.21 |
| Total Households | 1,107 (100.0%) | 2.14 |
Household Size by Marriage Status in Nice
Out of a total of 1,107 households in Nice, 649 (58.6%) are family households, while 458 (41.4%) are nonfamily households. The most numerous type of family households are 2-person households, comprising 309, and the most common type of nonfamily households are 1-person households, comprising 353.
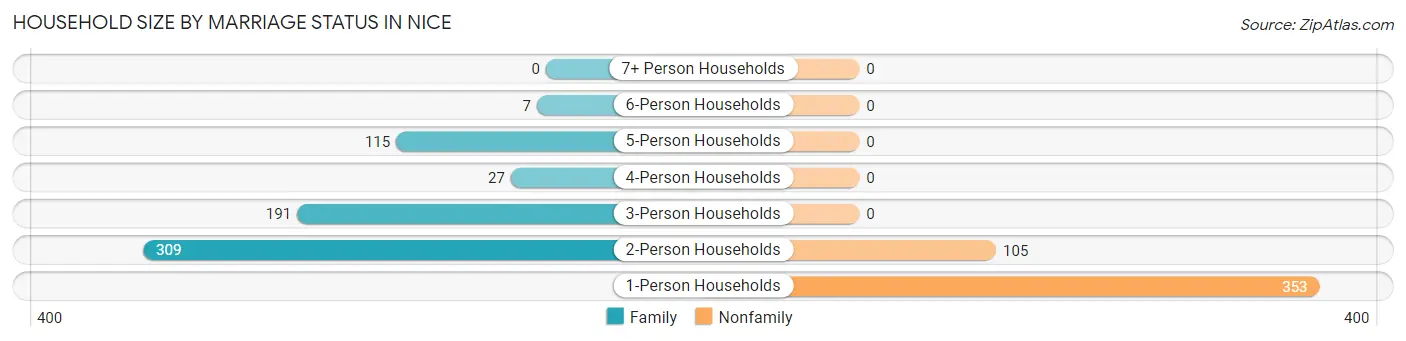
| Household Size | Family Households | Nonfamily Households |
| 1-Person Households | - | 353 (31.9%) |
| 2-Person Households | 309 (27.9%) | 105 (9.5%) |
| 3-Person Households | 191 (17.2%) | 0 (0.0%) |
| 4-Person Households | 27 (2.4%) | 0 (0.0%) |
| 5-Person Households | 115 (10.4%) | 0 (0.0%) |
| 6-Person Households | 7 (0.6%) | 0 (0.0%) |
| 7+ Person Households | 0 (0.0%) | 0 (0.0%) |
| Total | 649 (58.6%) | 458 (41.4%) |
Female Fertility in Nice
Fertility by Age in Nice
Average fertility rate in Nice is 81.0 births per 1,000 women. Women in the age bracket of 20 to 34 years have the highest fertility rate with 237.0 births per 1,000 women. Women in the age bracket of 20 to 34 years acount for 100.0% of all women with births.
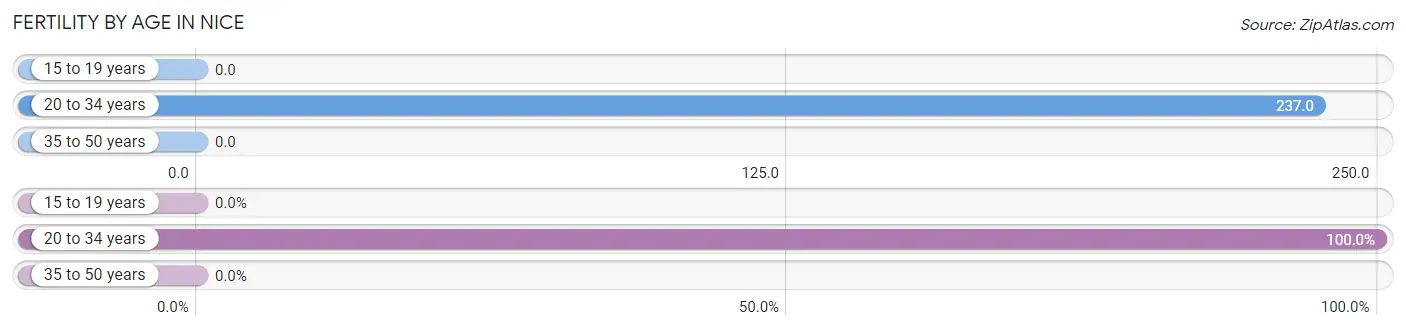
| Age Bracket | Women with Births | Births / 1,000 Women |
| 15 to 19 years | 0 (0.0%) | 0.0 |
| 20 to 34 years | 33 (100.0%) | 237.0 |
| 35 to 50 years | 0 (0.0%) | 0.0 |
| Total | 33 (100.0%) | 81.0 |
Fertility by Age by Marriage Status in Nice
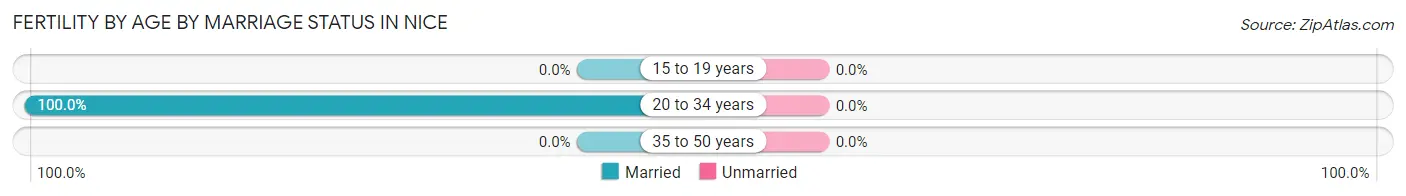
| Age Bracket | Married | Unmarried |
| 15 to 19 years | 0 (0.0%) | 0 (0.0%) |
| 20 to 34 years | 33 (100.0%) | 0 (0.0%) |
| 35 to 50 years | 0 (0.0%) | 0 (0.0%) |
| Total | 33 (100.0%) | 0 (0.0%) |
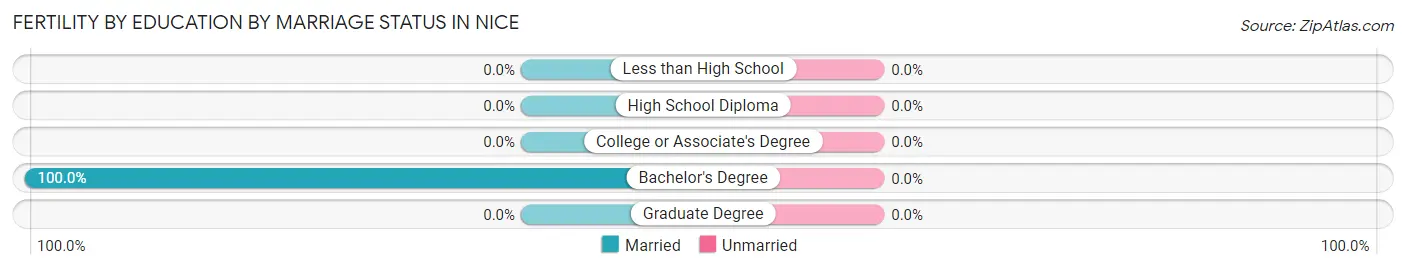
Fertility by Education in Nice
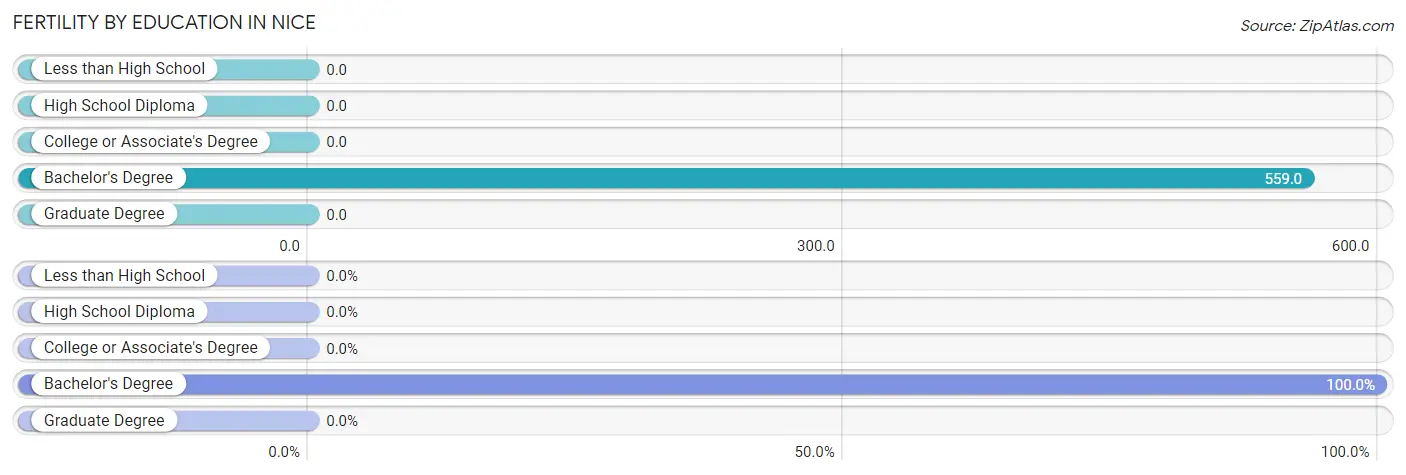
| Educational Attainment | Women with Births | Births / 1,000 Women |
| Less than High School | 0 (0.0%) | 0.0 |
| High School Diploma | 0 (0.0%) | 0.0 |
| College or Associate's Degree | 0 (0.0%) | 0.0 |
| Bachelor's Degree | 33 (100.0%) | 559.0 |
| Graduate Degree | 0 (0.0%) | 0.0 |
| Total | 33 (100.0%) | 81.0 |
Fertility by Education by Marriage Status in Nice
| Educational Attainment | Married | Unmarried |
| Less than High School | 0 (0.0%) | 0 (0.0%) |
| High School Diploma | 0 (0.0%) | 0 (0.0%) |
| College or Associate's Degree | 0 (0.0%) | 0 (0.0%) |
| Bachelor's Degree | 33 (100.0%) | 0 (0.0%) |
| Graduate Degree | 0 (0.0%) | 0 (0.0%) |
| Total | 33 (100.0%) | 0 (0.0%) |
Employment Characteristics in Nice
Employment by Class of Employer in Nice
Among the 867 employed individuals in Nice, private company employees (332 | 38.3%), not-for-profit organizations (227 | 26.2%), and self-employed (not incorporated) (118 | 13.6%) make up the most common classes of employment.
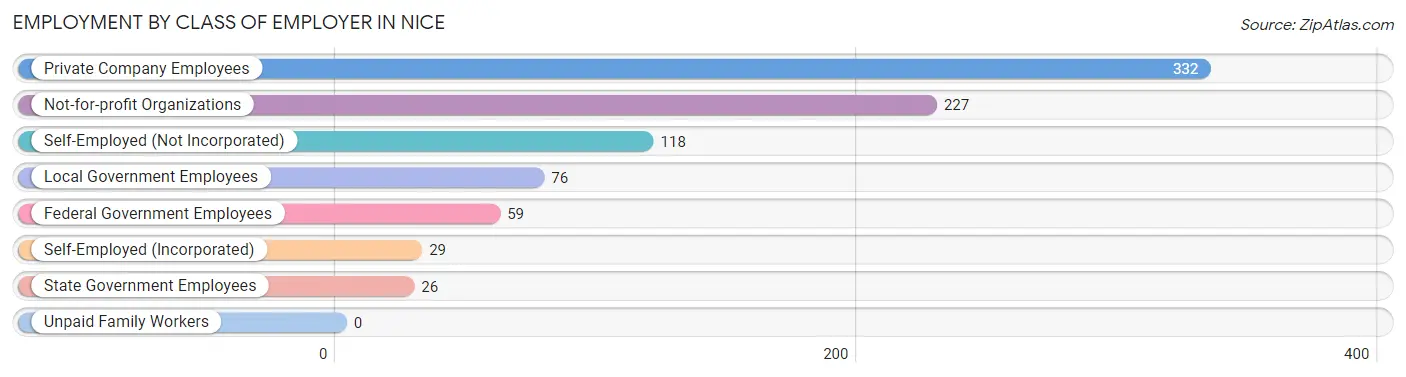
| Employer Class | # Employees | % Employees |
| Private Company Employees | 332 | 38.3% |
| Self-Employed (Incorporated) | 29 | 3.3% |
| Self-Employed (Not Incorporated) | 118 | 13.6% |
| Not-for-profit Organizations | 227 | 26.2% |
| Local Government Employees | 76 | 8.8% |
| State Government Employees | 26 | 3.0% |
| Federal Government Employees | 59 | 6.8% |
| Unpaid Family Workers | 0 | 0.0% |
| Total | 867 | 100.0% |
Employment Status by Age in Nice
According to the labor force statistics for Nice, out of the total population over 16 years of age (1,954), 50.7% or 991 individuals are in the labor force, with 5.1% or 51 of them unemployed. The age group with the highest labor force participation rate is 20 to 24 years, with 100.0% or 86 individuals in the labor force. Within the labor force, the 20 to 24 years age range has the highest percentage of unemployed individuals, with 31.4% or 27 of them being unemployed.
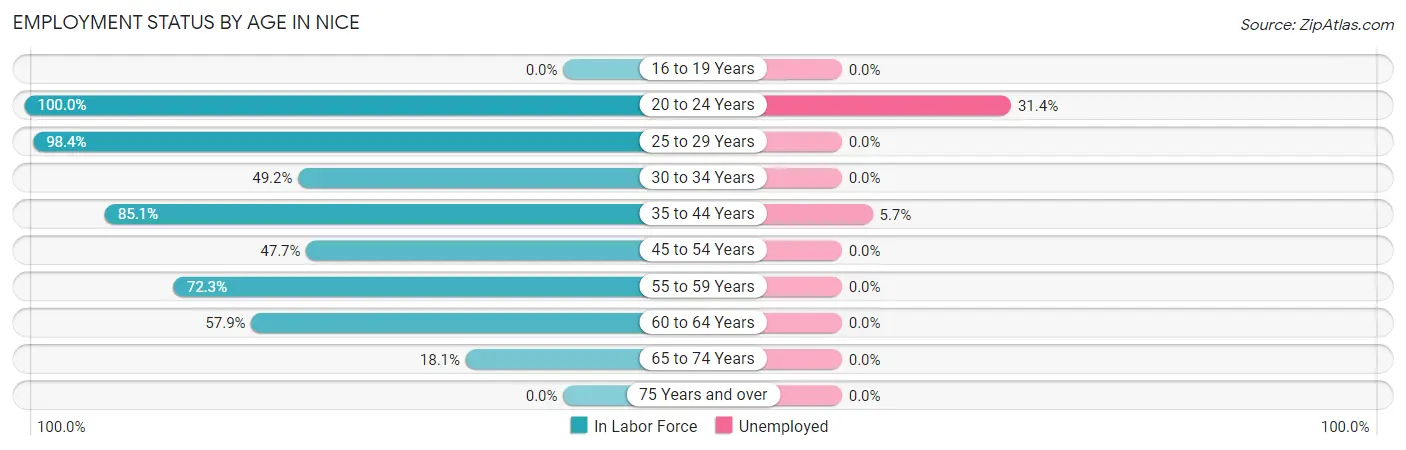
| Age Bracket | In Labor Force | Unemployed |
| 16 to 19 Years | 0 (0.0%) | 0 (0.0%) |
| 20 to 24 Years | 86 (100.0%) | 27 (31.4%) |
| 25 to 29 Years | 63 (98.4%) | 0 (0.0%) |
| 30 to 34 Years | 32 (49.2%) | 0 (0.0%) |
| 35 to 44 Years | 404 (85.1%) | 23 (5.7%) |
| 45 to 54 Years | 84 (47.7%) | 0 (0.0%) |
| 55 to 59 Years | 138 (72.3%) | 0 (0.0%) |
| 60 to 64 Years | 113 (57.9%) | 0 (0.0%) |
| 65 to 74 Years | 70 (18.1%) | 0 (0.0%) |
| 75 Years and over | 0 (0.0%) | 0 (0.0%) |
| Total | 991 (50.7%) | 51 (5.1%) |
Employment Status by Educational Attainment in Nice
According to labor force statistics for Nice, 71.5% of individuals (834) out of the total population between 25 and 64 years of age (1,166) are in the labor force, with 2.8% or 23 of them being unemployed. The group with the highest labor force participation rate are those with the educational attainment of high school diploma, with 81.0% or 306 individuals in the labor force. Within the labor force, individuals with college / associate degree education have the highest percentage of unemployment, with 7.4% or 23 of them being unemployed.
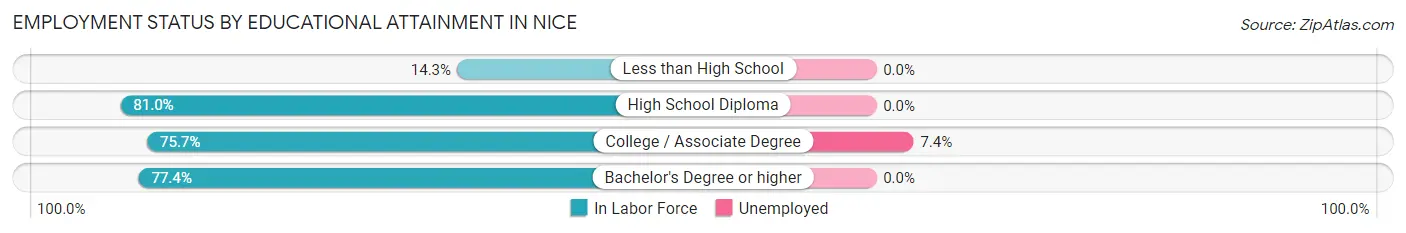
| Educational Attainment | In Labor Force | Unemployed |
| Less than High School | 17 (14.3%) | 0 (0.0%) |
| High School Diploma | 306 (81.0%) | 0 (0.0%) |
| College / Associate Degree | 309 (75.7%) | 30 (7.4%) |
| Bachelor's Degree or higher | 202 (77.4%) | 0 (0.0%) |
| Total | 834 (71.5%) | 33 (2.8%) |
Employment Occupations by Sex in Nice
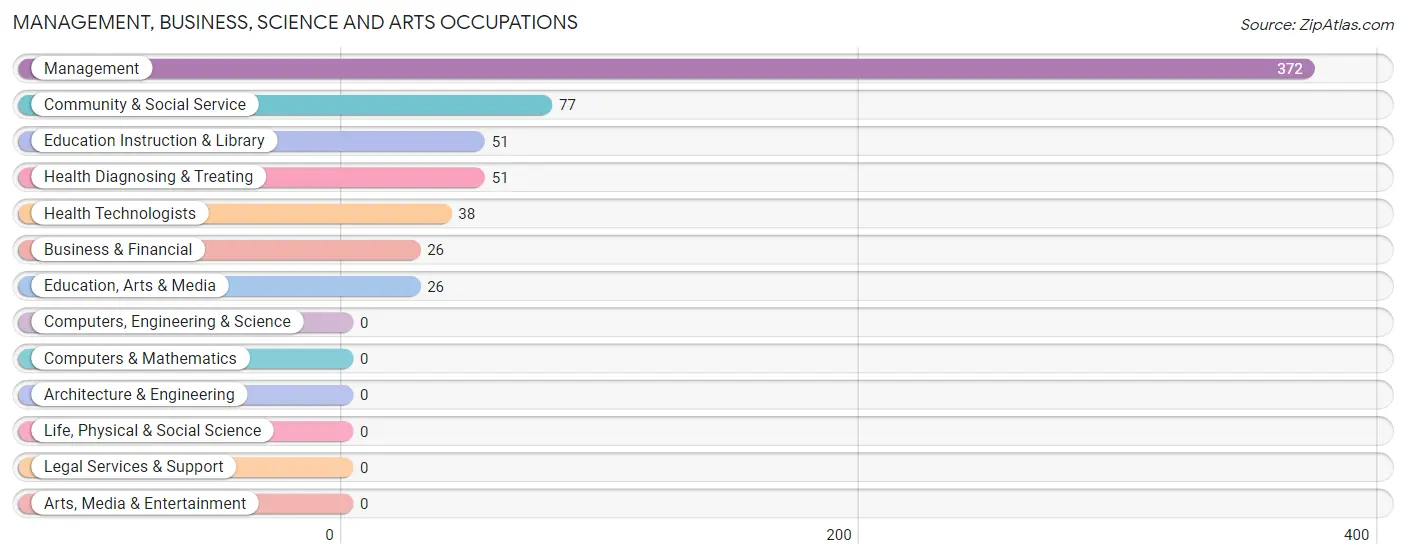
Management, Business, Science and Arts Occupations
The most common Management, Business, Science and Arts occupations in Nice are Management (372 | 39.6%), Community & Social Service (77 | 8.2%), Education Instruction & Library (51 | 5.4%), Health Diagnosing & Treating (51 | 5.4%), and Health Technologists (38 | 4.0%).
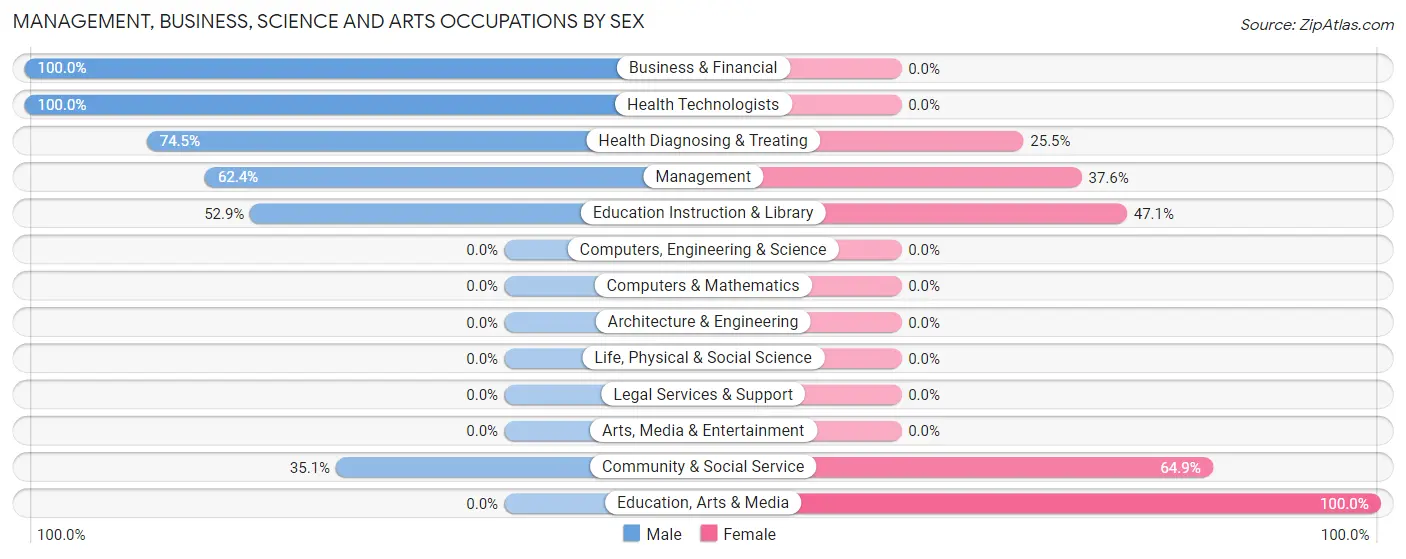
Management, Business, Science and Arts Occupations by Sex
Within the Management, Business, Science and Arts occupations in Nice, the most male-oriented occupations are Business & Financial (100.0%), Health Technologists (100.0%), and Health Diagnosing & Treating (74.5%), while the most female-oriented occupations are Education, Arts & Media (100.0%), Community & Social Service (64.9%), and Education Instruction & Library (47.1%).
| Occupation | Male | Female |
| Management | 232 (62.4%) | 140 (37.6%) |
| Business & Financial | 26 (100.0%) | 0 (0.0%) |
| Computers, Engineering & Science | 0 (0.0%) | 0 (0.0%) |
| Computers & Mathematics | 0 (0.0%) | 0 (0.0%) |
| Architecture & Engineering | 0 (0.0%) | 0 (0.0%) |
| Life, Physical & Social Science | 0 (0.0%) | 0 (0.0%) |
| Community & Social Service | 27 (35.1%) | 50 (64.9%) |
| Education, Arts & Media | 0 (0.0%) | 26 (100.0%) |
| Legal Services & Support | 0 (0.0%) | 0 (0.0%) |
| Education Instruction & Library | 27 (52.9%) | 24 (47.1%) |
| Arts, Media & Entertainment | 0 (0.0%) | 0 (0.0%) |
| Health Diagnosing & Treating | 38 (74.5%) | 13 (25.5%) |
| Health Technologists | 38 (100.0%) | 0 (0.0%) |
| Total (Category) | 323 (61.4%) | 203 (38.6%) |
| Total (Overall) | 563 (59.9%) | 377 (40.1%) |
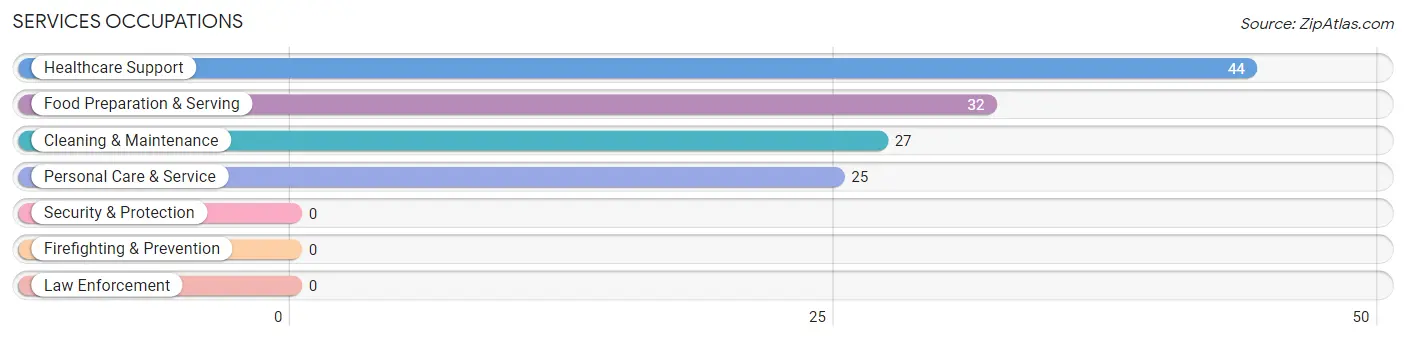
Services Occupations
The most common Services occupations in Nice are Healthcare Support (44 | 4.7%), Food Preparation & Serving (32 | 3.4%), Cleaning & Maintenance (27 | 2.9%), and Personal Care & Service (25 | 2.7%).
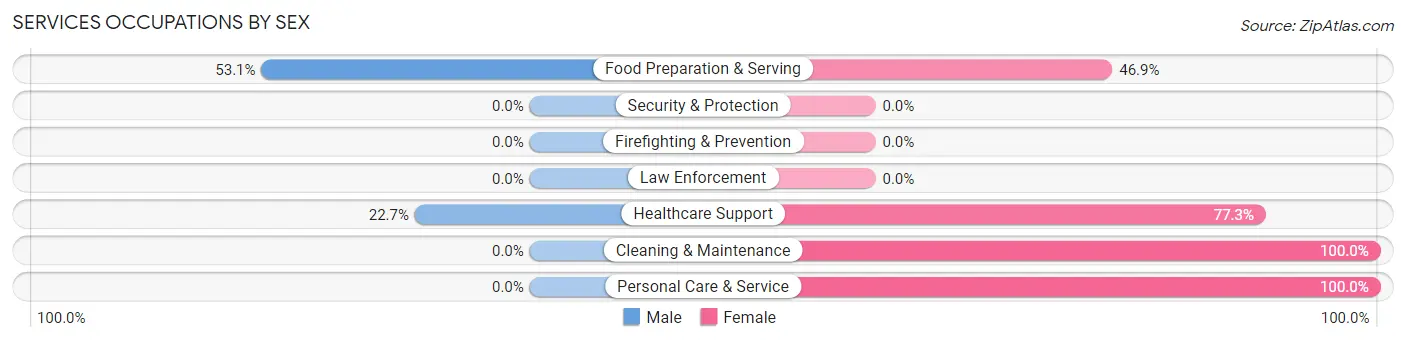
Services Occupations by Sex
Within the Services occupations in Nice, the most male-oriented occupations are Food Preparation & Serving (53.1%), and Healthcare Support (22.7%), while the most female-oriented occupations are Cleaning & Maintenance (100.0%), Personal Care & Service (100.0%), and Healthcare Support (77.3%).
| Occupation | Male | Female |
| Healthcare Support | 10 (22.7%) | 34 (77.3%) |
| Security & Protection | 0 (0.0%) | 0 (0.0%) |
| Firefighting & Prevention | 0 (0.0%) | 0 (0.0%) |
| Law Enforcement | 0 (0.0%) | 0 (0.0%) |
| Food Preparation & Serving | 17 (53.1%) | 15 (46.9%) |
| Cleaning & Maintenance | 0 (0.0%) | 27 (100.0%) |
| Personal Care & Service | 0 (0.0%) | 25 (100.0%) |
| Total (Category) | 27 (21.1%) | 101 (78.9%) |
| Total (Overall) | 563 (59.9%) | 377 (40.1%) |
Sales and Office Occupations
The most common Sales and Office occupations in Nice are Sales & Related (32 | 3.4%), and Office & Administration (7 | 0.7%).
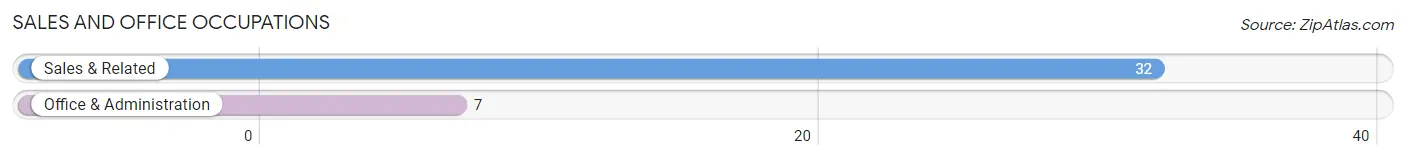
Sales and Office Occupations by Sex
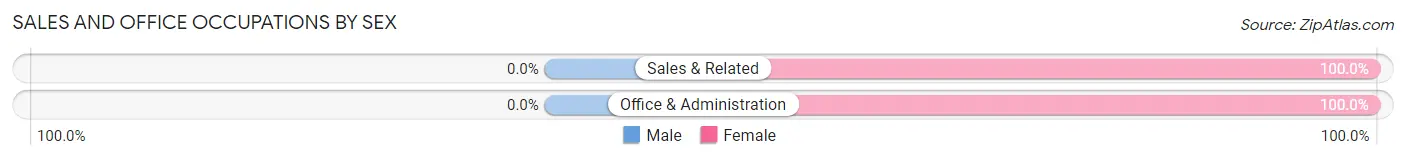
| Occupation | Male | Female |
| Sales & Related | 0 (0.0%) | 32 (100.0%) |
| Office & Administration | 0 (0.0%) | 7 (100.0%) |
| Total (Category) | 0 (0.0%) | 39 (100.0%) |
| Total (Overall) | 563 (59.9%) | 377 (40.1%) |
Natural Resources, Construction and Maintenance Occupations
The most common Natural Resources, Construction and Maintenance occupations in Nice are Construction & Extraction (86 | 9.1%), Installation, Maintenance & Repair (50 | 5.3%), and Farming, Fishing & Forestry (30 | 3.2%).
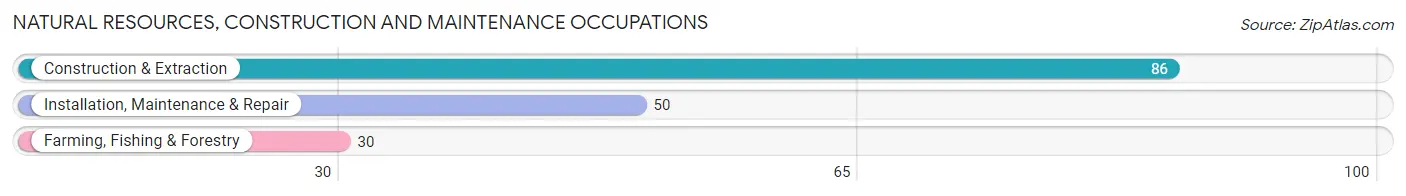
Natural Resources, Construction and Maintenance Occupations by Sex
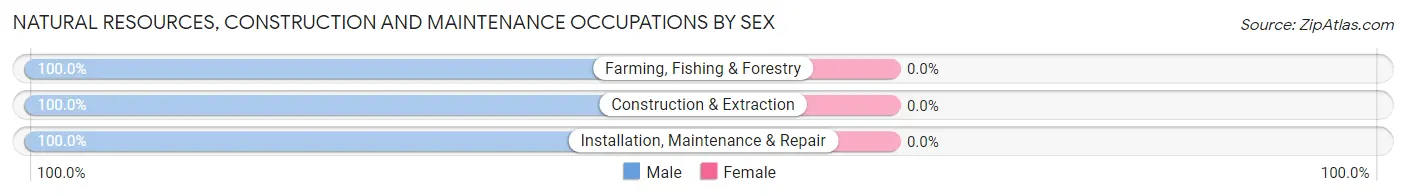
| Occupation | Male | Female |
| Farming, Fishing & Forestry | 30 (100.0%) | 0 (0.0%) |
| Construction & Extraction | 86 (100.0%) | 0 (0.0%) |
| Installation, Maintenance & Repair | 50 (100.0%) | 0 (0.0%) |
| Total (Category) | 166 (100.0%) | 0 (0.0%) |
| Total (Overall) | 563 (59.9%) | 377 (40.1%) |
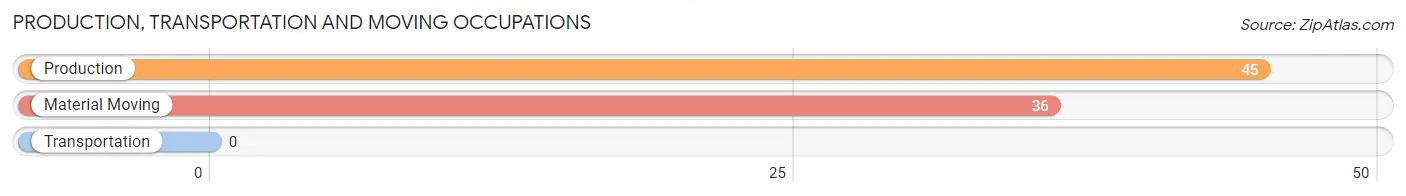
Production, Transportation and Moving Occupations
The most common Production, Transportation and Moving occupations in Nice are Production (45 | 4.8%), and Material Moving (36 | 3.8%).
Production, Transportation and Moving Occupations by Sex
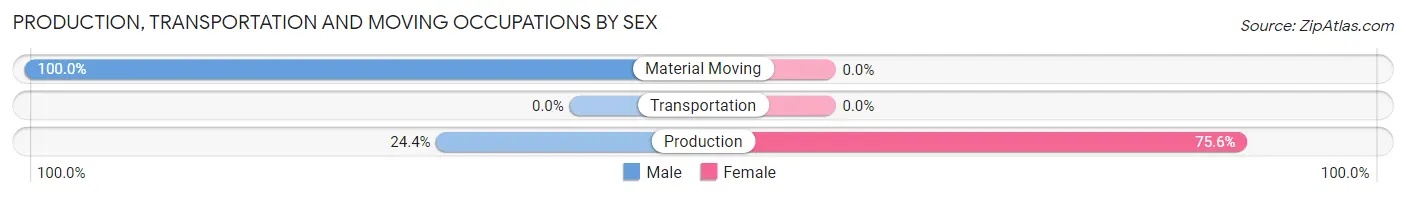
| Occupation | Male | Female |
| Production | 11 (24.4%) | 34 (75.6%) |
| Transportation | 0 (0.0%) | 0 (0.0%) |
| Material Moving | 36 (100.0%) | 0 (0.0%) |
| Total (Category) | 47 (58.0%) | 34 (42.0%) |
| Total (Overall) | 563 (59.9%) | 377 (40.1%) |
Employment Industries by Sex in Nice
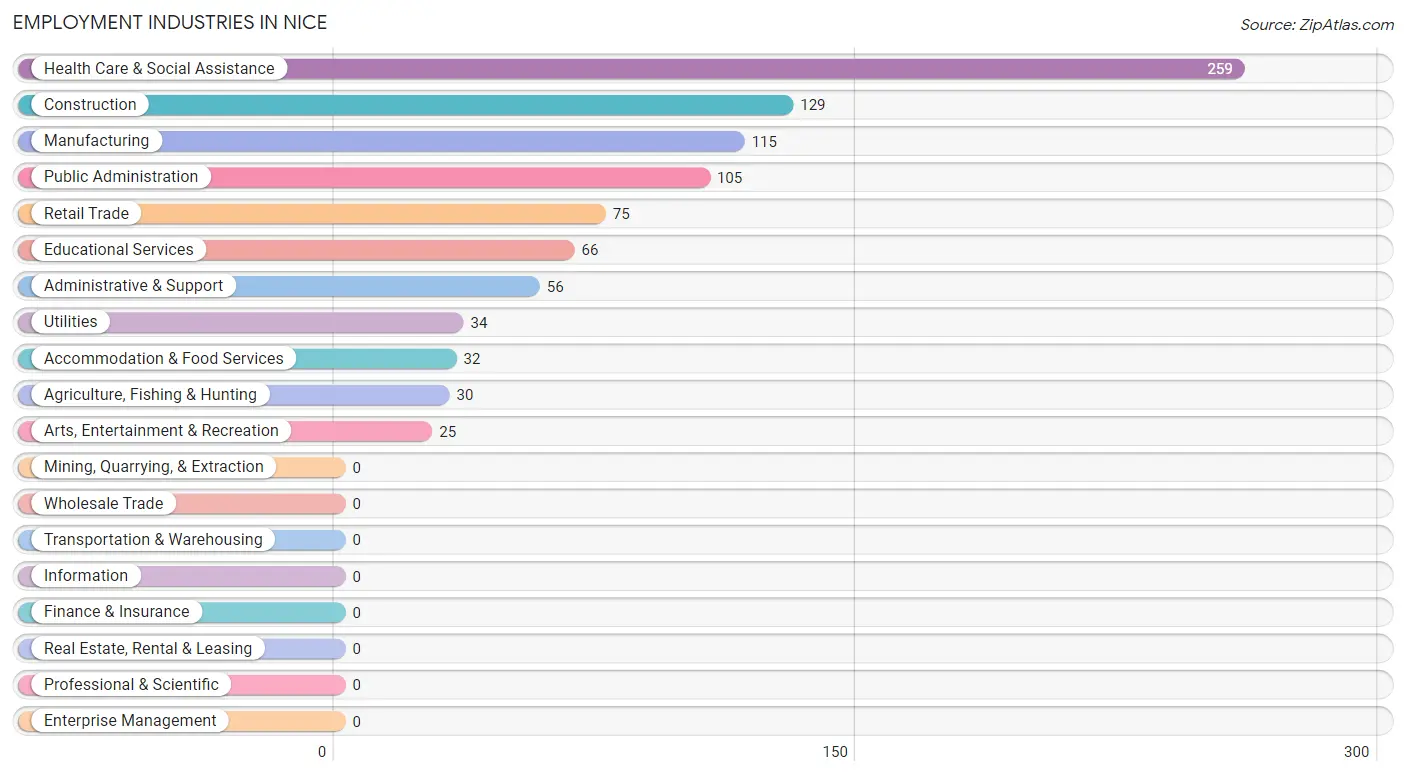
Employment Industries in Nice
The major employment industries in Nice include Health Care & Social Assistance (259 | 27.6%), Construction (129 | 13.7%), Manufacturing (115 | 12.2%), Public Administration (105 | 11.2%), and Retail Trade (75 | 8.0%).
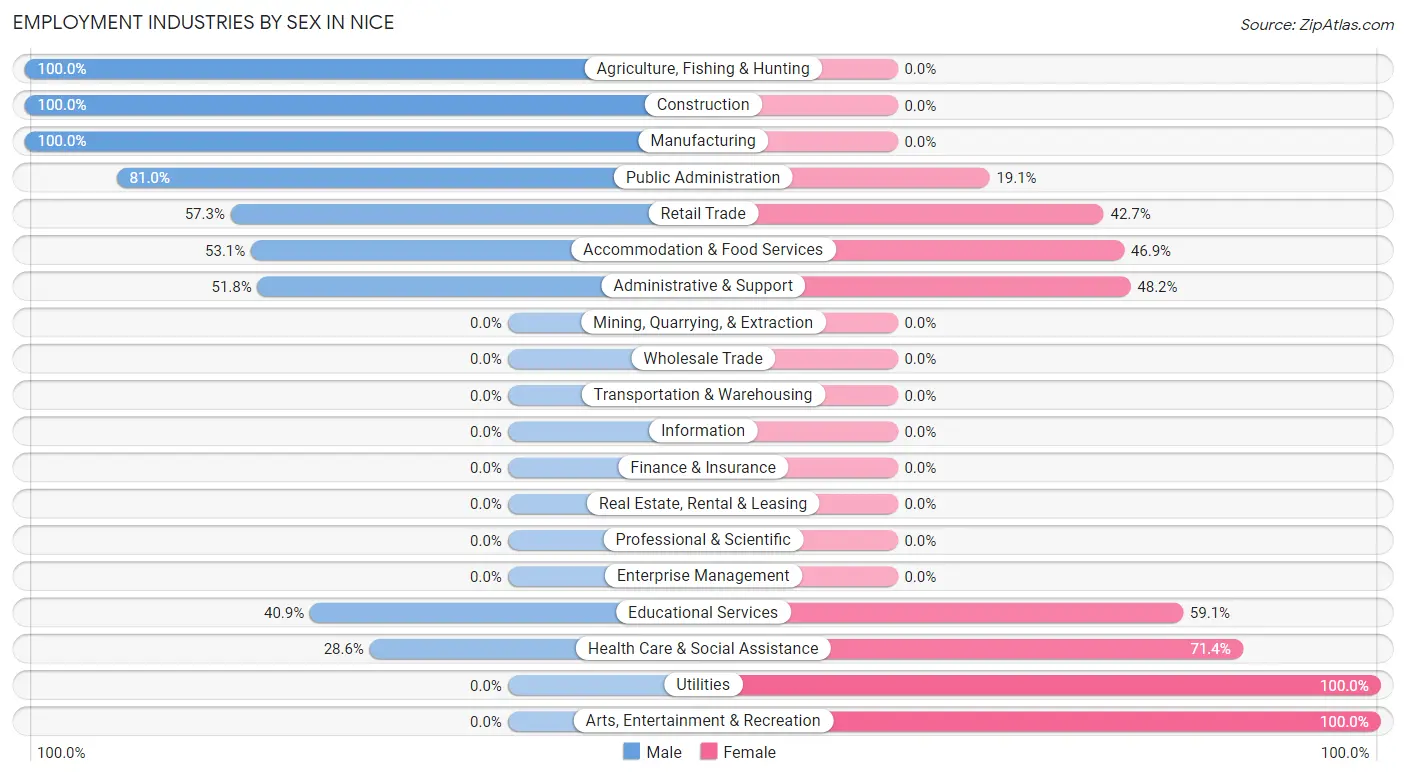
Employment Industries by Sex in Nice
The Nice industries that see more men than women are Agriculture, Fishing & Hunting (100.0%), Construction (100.0%), and Manufacturing (100.0%), whereas the industries that tend to have a higher number of women are Utilities (100.0%), Arts, Entertainment & Recreation (100.0%), and Health Care & Social Assistance (71.4%).
| Industry | Male | Female |
| Agriculture, Fishing & Hunting | 30 (100.0%) | 0 (0.0%) |
| Mining, Quarrying, & Extraction | 0 (0.0%) | 0 (0.0%) |
| Construction | 129 (100.0%) | 0 (0.0%) |
| Manufacturing | 115 (100.0%) | 0 (0.0%) |
| Wholesale Trade | 0 (0.0%) | 0 (0.0%) |
| Retail Trade | 43 (57.3%) | 32 (42.7%) |
| Transportation & Warehousing | 0 (0.0%) | 0 (0.0%) |
| Utilities | 0 (0.0%) | 34 (100.0%) |
| Information | 0 (0.0%) | 0 (0.0%) |
| Finance & Insurance | 0 (0.0%) | 0 (0.0%) |
| Real Estate, Rental & Leasing | 0 (0.0%) | 0 (0.0%) |
| Professional & Scientific | 0 (0.0%) | 0 (0.0%) |
| Enterprise Management | 0 (0.0%) | 0 (0.0%) |
| Administrative & Support | 29 (51.8%) | 27 (48.2%) |
| Educational Services | 27 (40.9%) | 39 (59.1%) |
| Health Care & Social Assistance | 74 (28.6%) | 185 (71.4%) |
| Arts, Entertainment & Recreation | 0 (0.0%) | 25 (100.0%) |
| Accommodation & Food Services | 17 (53.1%) | 15 (46.9%) |
| Public Administration | 85 (80.9%) | 20 (19.1%) |
| Total | 563 (59.9%) | 377 (40.1%) |
Education in Nice
School Enrollment in Nice
The most common levels of schooling among the 445 students in Nice are kindergarten (130 | 29.2%), elementary school (96 | 21.6%), and college / undergraduate (85 | 19.1%).
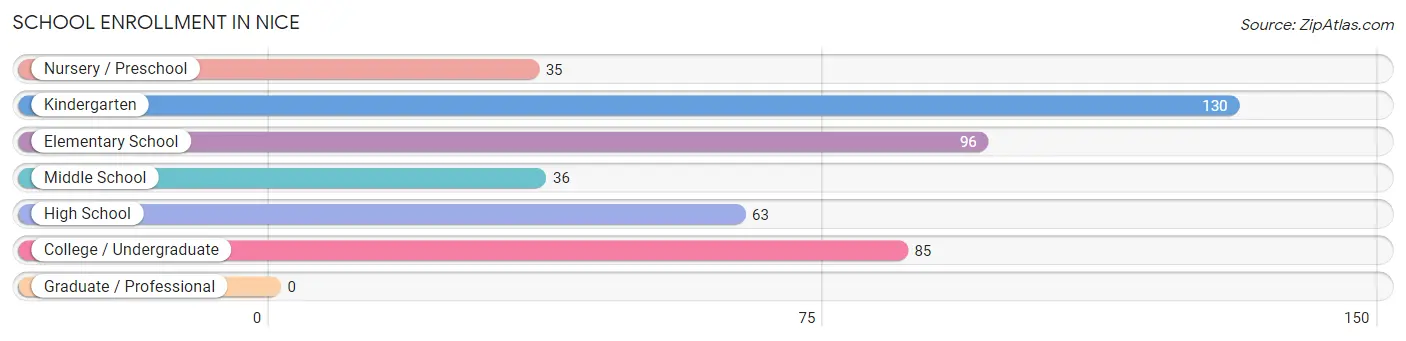
| School Level | # Students | % Students |
| Nursery / Preschool | 35 | 7.9% |
| Kindergarten | 130 | 29.2% |
| Elementary School | 96 | 21.6% |
| Middle School | 36 | 8.1% |
| High School | 63 | 14.2% |
| College / Undergraduate | 85 | 19.1% |
| Graduate / Professional | 0 | 0.0% |
| Total | 445 | 100.0% |
School Enrollment by Age by Funding Source in Nice
Out of a total of 445 students who are enrolled in schools in Nice, 63 (14.2%) attend a private institution, while the remaining 382 (85.8%) are enrolled in public schools. The age group of 20 to 24 year olds has the highest likelihood of being enrolled in private schools, with 28 (100.0% in the age bracket) enrolled. Conversely, the age group of 5 to 9 year old has the lowest likelihood of being enrolled in a private school, with 96 (100.0% in the age bracket) attending a public institution.
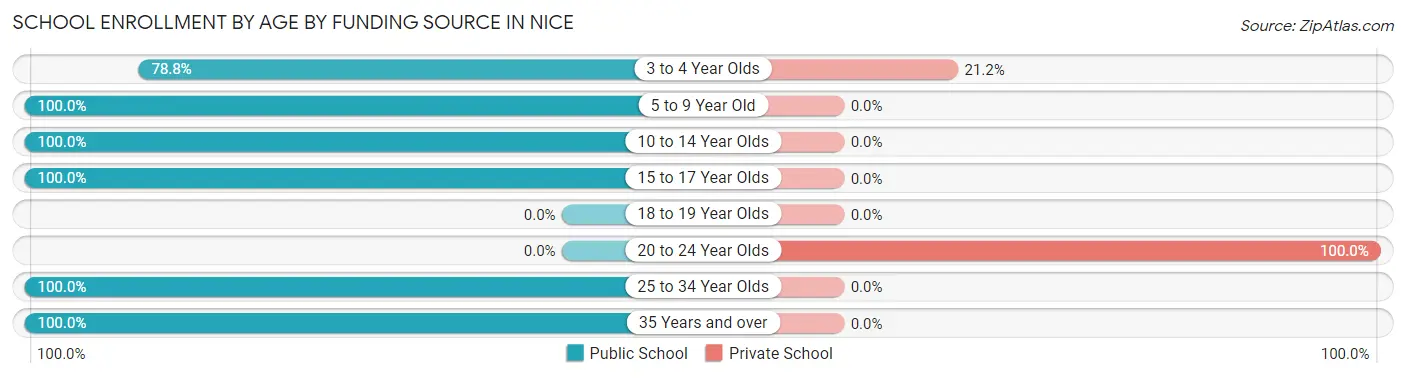
| Age Bracket | Public School | Private School |
| 3 to 4 Year Olds | 130 (78.8%) | 35 (21.2%) |
| 5 to 9 Year Old | 96 (100.0%) | 0 (0.0%) |
| 10 to 14 Year Olds | 61 (100.0%) | 0 (0.0%) |
| 15 to 17 Year Olds | 38 (100.0%) | 0 (0.0%) |
| 18 to 19 Year Olds | 0 (0.0%) | 0 (0.0%) |
| 20 to 24 Year Olds | 0 (0.0%) | 28 (100.0%) |
| 25 to 34 Year Olds | 38 (100.0%) | 0 (0.0%) |
| 35 Years and over | 19 (100.0%) | 0 (0.0%) |
| Total | 382 (85.8%) | 63 (14.2%) |
Educational Attainment by Field of Study in Nice
Engineering (143 | 35.9%), social sciences (67 | 16.8%), business (48 | 12.1%), liberal arts & history (48 | 12.1%), and bio, nature & agricultural (47 | 11.8%) are the most common fields of study among 398 individuals in Nice who have obtained a bachelor's degree or higher.
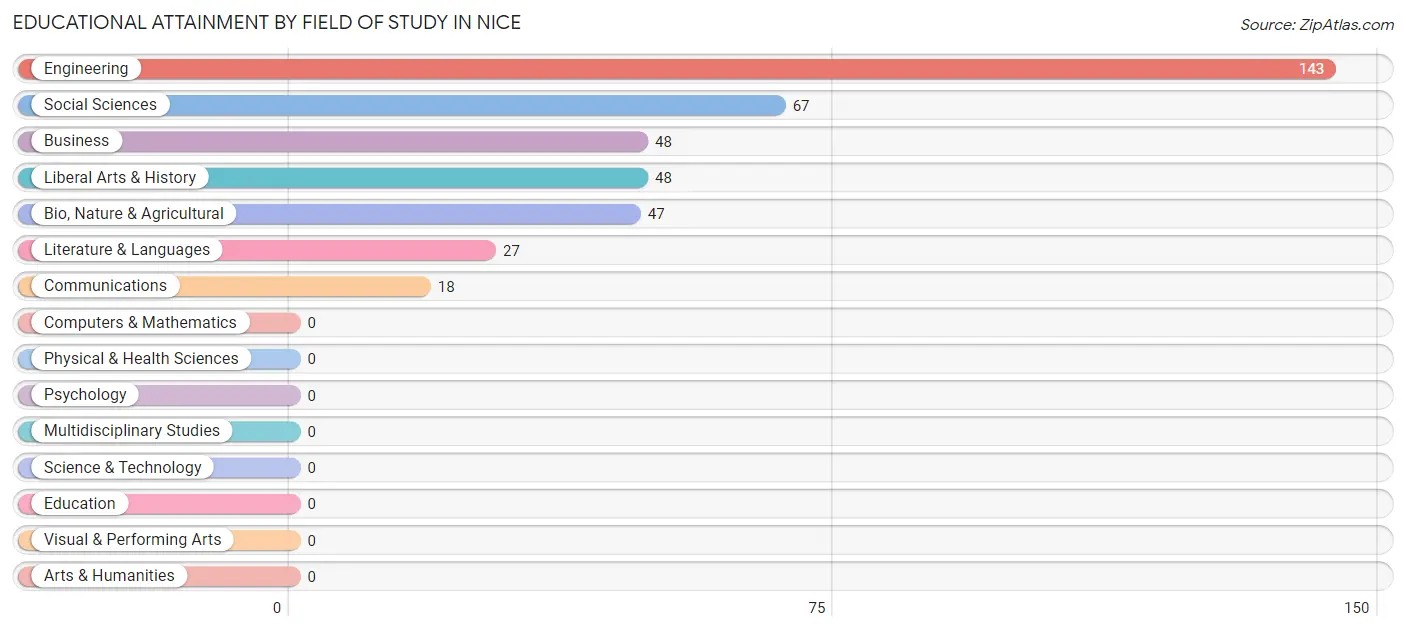
| Field of Study | # Graduates | % Graduates |
| Computers & Mathematics | 0 | 0.0% |
| Bio, Nature & Agricultural | 47 | 11.8% |
| Physical & Health Sciences | 0 | 0.0% |
| Psychology | 0 | 0.0% |
| Social Sciences | 67 | 16.8% |
| Engineering | 143 | 35.9% |
| Multidisciplinary Studies | 0 | 0.0% |
| Science & Technology | 0 | 0.0% |
| Business | 48 | 12.1% |
| Education | 0 | 0.0% |
| Literature & Languages | 27 | 6.8% |
| Liberal Arts & History | 48 | 12.1% |
| Visual & Performing Arts | 0 | 0.0% |
| Communications | 18 | 4.5% |
| Arts & Humanities | 0 | 0.0% |
| Total | 398 | 100.0% |
Transportation & Commute in Nice
Vehicle Availability by Sex in Nice
The most prevalent vehicle ownership categories in Nice are males with 2 vehicles (242, accounting for 45.6%) and females with 2 vehicles (157, making up 75.4%).
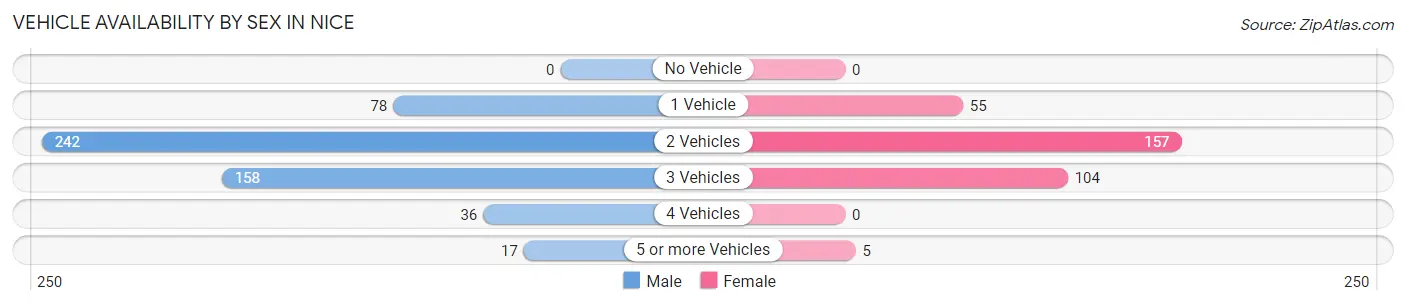
| Vehicles Available | Male | Female |
| No Vehicle | 0 (0.0%) | 0 (0.0%) |
| 1 Vehicle | 78 (14.7%) | 55 (17.1%) |
| 2 Vehicles | 242 (45.6%) | 157 (48.9%) |
| 3 Vehicles | 158 (29.8%) | 104 (32.4%) |
| 4 Vehicles | 36 (6.8%) | 0 (0.0%) |
| 5 or more Vehicles | 17 (3.2%) | 5 (1.6%) |
| Total | 531 (100.0%) | 321 (100.0%) |
Commute Time in Nice
The most frequently occuring commute durations in Nice are 15 to 19 minutes (180 commuters, 22.1%), 30 to 34 minutes (115 commuters, 14.1%), and 35 to 39 minutes (111 commuters, 13.6%).
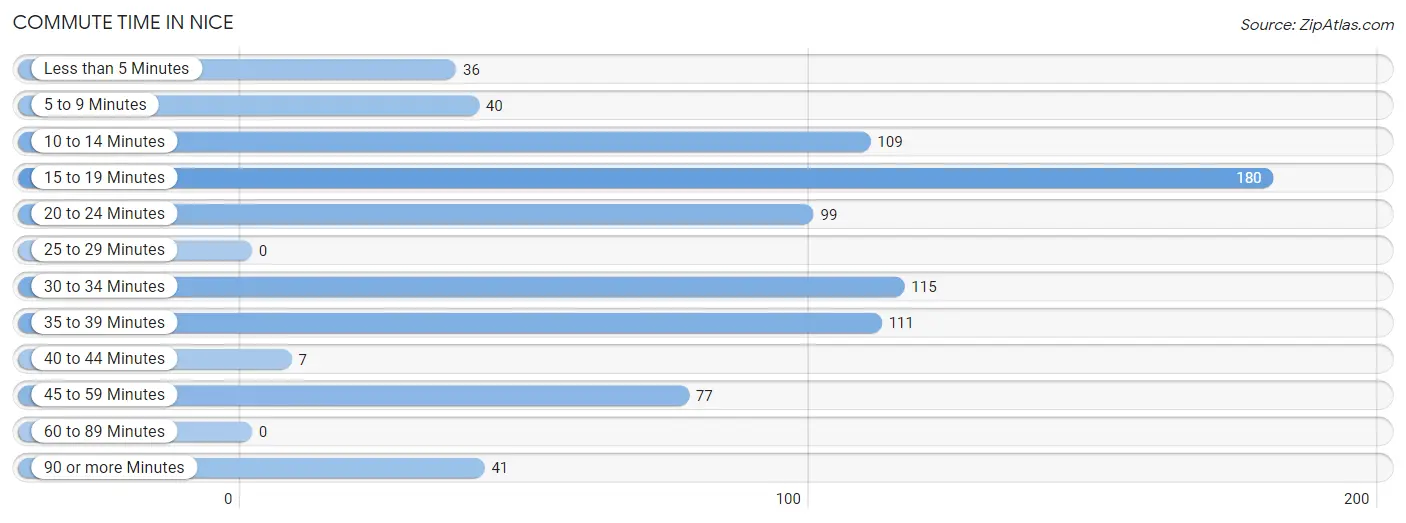
| Commute Time | # Commuters | % Commuters |
| Less than 5 Minutes | 36 | 4.4% |
| 5 to 9 Minutes | 40 | 4.9% |
| 10 to 14 Minutes | 109 | 13.4% |
| 15 to 19 Minutes | 180 | 22.1% |
| 20 to 24 Minutes | 99 | 12.1% |
| 25 to 29 Minutes | 0 | 0.0% |
| 30 to 34 Minutes | 115 | 14.1% |
| 35 to 39 Minutes | 111 | 13.6% |
| 40 to 44 Minutes | 7 | 0.9% |
| 45 to 59 Minutes | 77 | 9.5% |
| 60 to 89 Minutes | 0 | 0.0% |
| 90 or more Minutes | 41 | 5.0% |
Commute Time by Sex in Nice
The most common commute times in Nice are 30 to 34 minutes (115 commuters, 24.0%) for males and 15 to 19 minutes (93 commuters, 27.7%) for females.
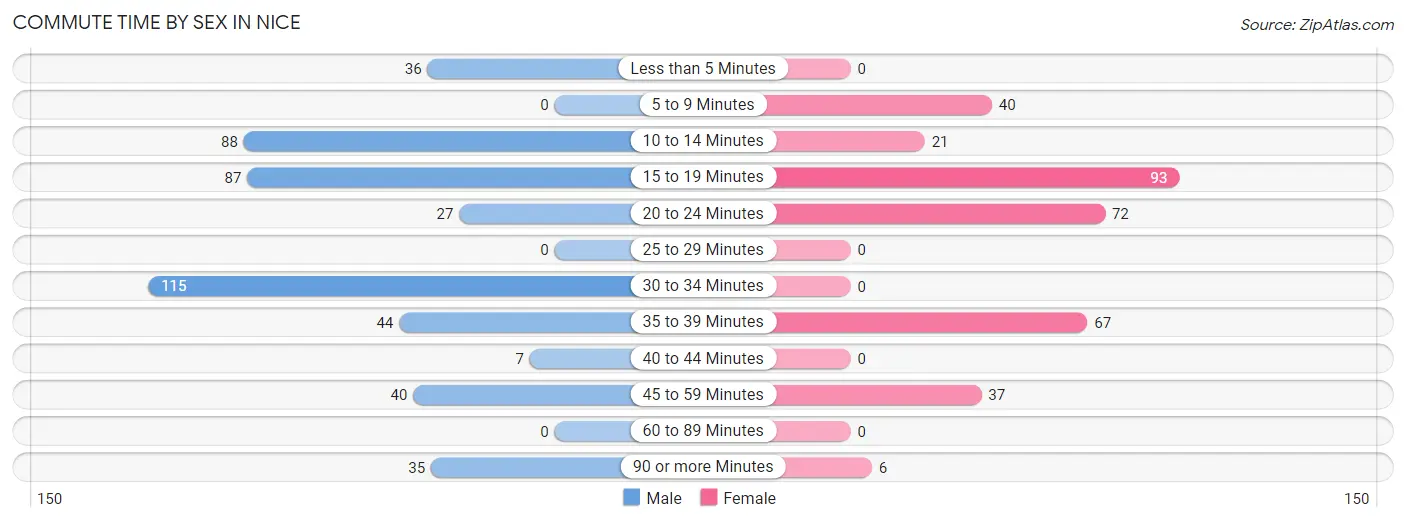
| Commute Time | Male | Female |
| Less than 5 Minutes | 36 (7.5%) | 0 (0.0%) |
| 5 to 9 Minutes | 0 (0.0%) | 40 (11.9%) |
| 10 to 14 Minutes | 88 (18.4%) | 21 (6.2%) |
| 15 to 19 Minutes | 87 (18.2%) | 93 (27.7%) |
| 20 to 24 Minutes | 27 (5.6%) | 72 (21.4%) |
| 25 to 29 Minutes | 0 (0.0%) | 0 (0.0%) |
| 30 to 34 Minutes | 115 (24.0%) | 0 (0.0%) |
| 35 to 39 Minutes | 44 (9.2%) | 67 (19.9%) |
| 40 to 44 Minutes | 7 (1.5%) | 0 (0.0%) |
| 45 to 59 Minutes | 40 (8.4%) | 37 (11.0%) |
| 60 to 89 Minutes | 0 (0.0%) | 0 (0.0%) |
| 90 or more Minutes | 35 (7.3%) | 6 (1.8%) |
Time of Departure to Work by Sex in Nice
The most frequent times of departure to work in Nice are 7:00 AM to 7:29 AM (229, 47.8%) for males and 8:00 AM to 8:29 AM (82, 24.4%) for females.
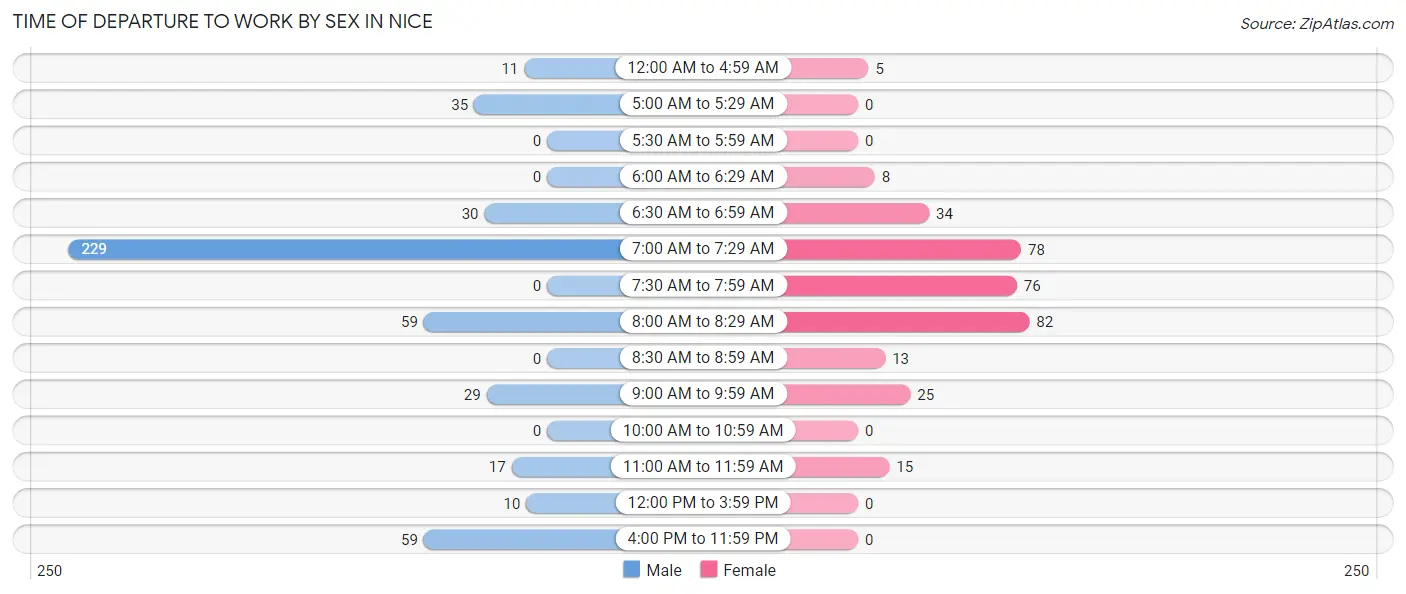
| Time of Departure | Male | Female |
| 12:00 AM to 4:59 AM | 11 (2.3%) | 5 (1.5%) |
| 5:00 AM to 5:29 AM | 35 (7.3%) | 0 (0.0%) |
| 5:30 AM to 5:59 AM | 0 (0.0%) | 0 (0.0%) |
| 6:00 AM to 6:29 AM | 0 (0.0%) | 8 (2.4%) |
| 6:30 AM to 6:59 AM | 30 (6.3%) | 34 (10.1%) |
| 7:00 AM to 7:29 AM | 229 (47.8%) | 78 (23.2%) |
| 7:30 AM to 7:59 AM | 0 (0.0%) | 76 (22.6%) |
| 8:00 AM to 8:29 AM | 59 (12.3%) | 82 (24.4%) |
| 8:30 AM to 8:59 AM | 0 (0.0%) | 13 (3.9%) |
| 9:00 AM to 9:59 AM | 29 (6.0%) | 25 (7.4%) |
| 10:00 AM to 10:59 AM | 0 (0.0%) | 0 (0.0%) |
| 11:00 AM to 11:59 AM | 17 (3.5%) | 15 (4.5%) |
| 12:00 PM to 3:59 PM | 10 (2.1%) | 0 (0.0%) |
| 4:00 PM to 11:59 PM | 59 (12.3%) | 0 (0.0%) |
| Total | 479 (100.0%) | 336 (100.0%) |
Housing Occupancy in Nice
Occupancy by Ownership in Nice
Of the total 1,107 dwellings in Nice, owner-occupied units account for 682 (61.6%), while renter-occupied units make up 425 (38.4%).
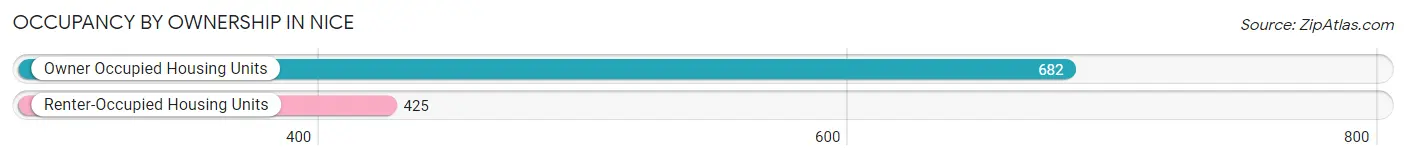
| Occupancy | # Housing Units | % Housing Units |
| Owner Occupied Housing Units | 682 | 61.6% |
| Renter-Occupied Housing Units | 425 | 38.4% |
| Total Occupied Housing Units | 1,107 | 100.0% |
Occupancy by Household Size in Nice
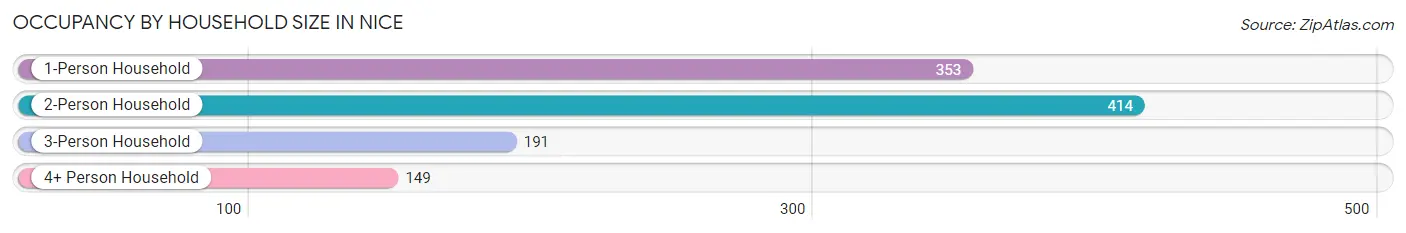
| Household Size | # Housing Units | % Housing Units |
| 1-Person Household | 353 | 31.9% |
| 2-Person Household | 414 | 37.4% |
| 3-Person Household | 191 | 17.2% |
| 4+ Person Household | 149 | 13.5% |
| Total Housing Units | 1,107 | 100.0% |
Occupancy by Ownership by Household Size in Nice
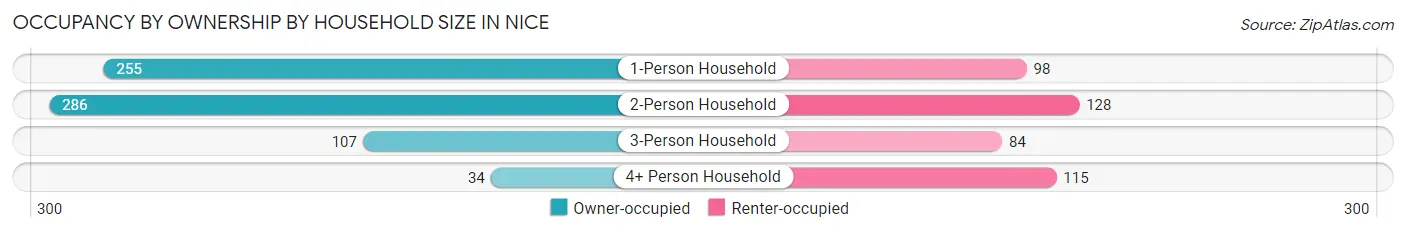
| Household Size | Owner-occupied | Renter-occupied |
| 1-Person Household | 255 (72.2%) | 98 (27.8%) |
| 2-Person Household | 286 (69.1%) | 128 (30.9%) |
| 3-Person Household | 107 (56.0%) | 84 (44.0%) |
| 4+ Person Household | 34 (22.8%) | 115 (77.2%) |
| Total Housing Units | 682 (61.6%) | 425 (38.4%) |
Occupancy by Educational Attainment in Nice
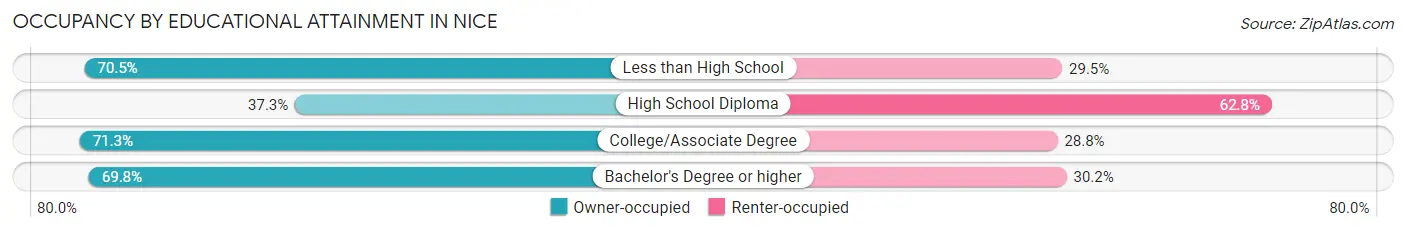
| Household Size | Owner-occupied | Renter-occupied |
| Less than High School | 55 (70.5%) | 23 (29.5%) |
| High School Diploma | 114 (37.2%) | 192 (62.7%) |
| College/Associate Degree | 409 (71.3%) | 165 (28.7%) |
| Bachelor's Degree or higher | 104 (69.8%) | 45 (30.2%) |
Occupancy by Age of Householder in Nice
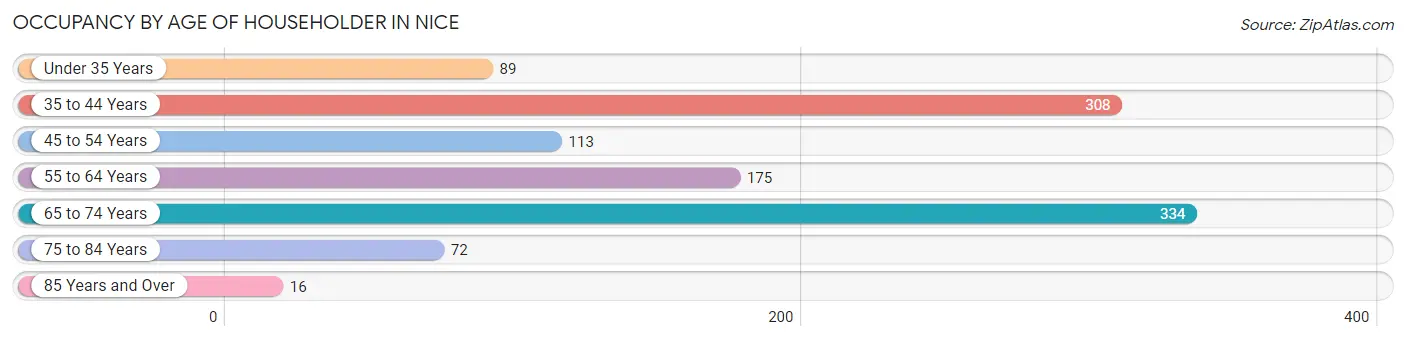
| Age Bracket | # Households | % Households |
| Under 35 Years | 89 | 8.0% |
| 35 to 44 Years | 308 | 27.8% |
| 45 to 54 Years | 113 | 10.2% |
| 55 to 64 Years | 175 | 15.8% |
| 65 to 74 Years | 334 | 30.2% |
| 75 to 84 Years | 72 | 6.5% |
| 85 Years and Over | 16 | 1.5% |
| Total | 1,107 | 100.0% |
Housing Finances in Nice
Median Income by Occupancy in Nice
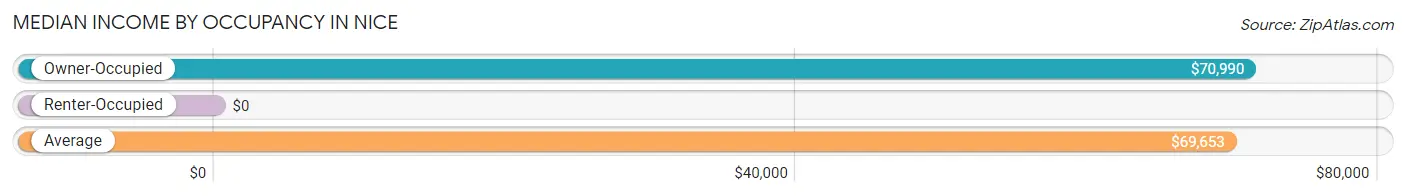
| Occupancy Type | # Households | Median Income |
| Owner-Occupied | 682 (61.6%) | $70,990 |
| Renter-Occupied | 425 (38.4%) | $0 |
| Average | 1,107 (100.0%) | $69,653 |
Occupancy by Householder Income Bracket in Nice
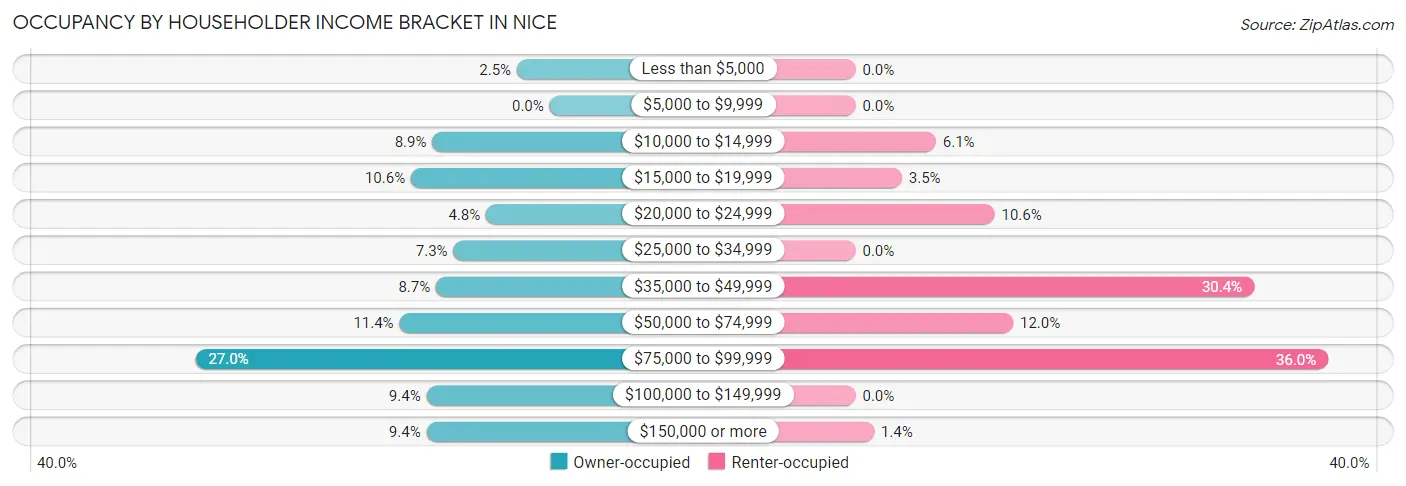
| Income Bracket | Owner-occupied | Renter-occupied |
| Less than $5,000 | 17 (2.5%) | 0 (0.0%) |
| $5,000 to $9,999 | 0 (0.0%) | 0 (0.0%) |
| $10,000 to $14,999 | 61 (8.9%) | 26 (6.1%) |
| $15,000 to $19,999 | 72 (10.6%) | 15 (3.5%) |
| $20,000 to $24,999 | 33 (4.8%) | 45 (10.6%) |
| $25,000 to $34,999 | 50 (7.3%) | 0 (0.0%) |
| $35,000 to $49,999 | 59 (8.6%) | 129 (30.3%) |
| $50,000 to $74,999 | 78 (11.4%) | 51 (12.0%) |
| $75,000 to $99,999 | 184 (27.0%) | 153 (36.0%) |
| $100,000 to $149,999 | 64 (9.4%) | 0 (0.0%) |
| $150,000 or more | 64 (9.4%) | 6 (1.4%) |
| Total | 682 (100.0%) | 425 (100.0%) |
Monthly Housing Cost Tiers in Nice
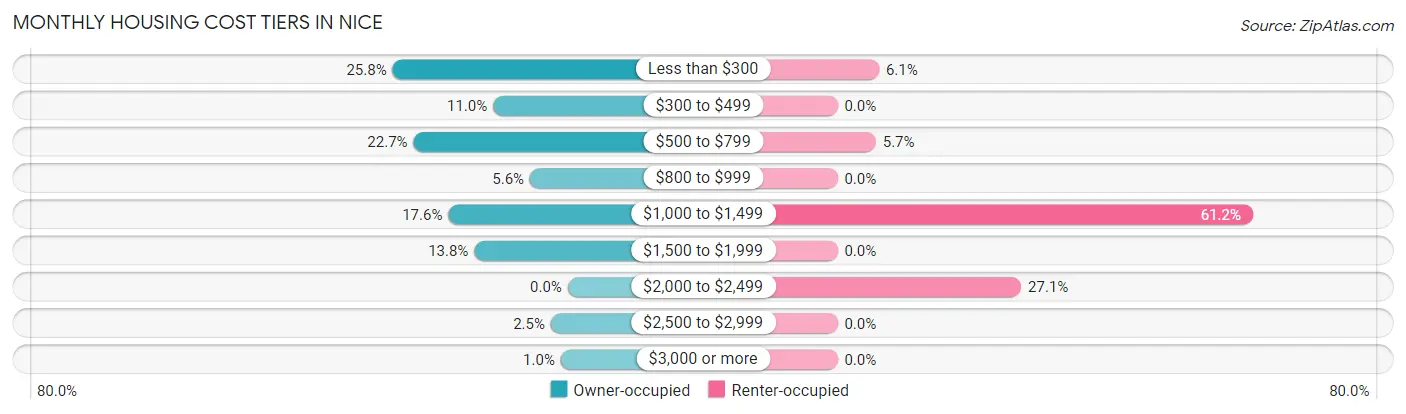
| Monthly Cost | Owner-occupied | Renter-occupied |
| Less than $300 | 176 (25.8%) | 26 (6.1%) |
| $300 to $499 | 75 (11.0%) | 0 (0.0%) |
| $500 to $799 | 155 (22.7%) | 24 (5.7%) |
| $800 to $999 | 38 (5.6%) | 0 (0.0%) |
| $1,000 to $1,499 | 120 (17.6%) | 260 (61.2%) |
| $1,500 to $1,999 | 94 (13.8%) | 0 (0.0%) |
| $2,000 to $2,499 | 0 (0.0%) | 115 (27.1%) |
| $2,500 to $2,999 | 17 (2.5%) | 0 (0.0%) |
| $3,000 or more | 7 (1.0%) | 0 (0.0%) |
| Total | 682 (100.0%) | 425 (100.0%) |
Physical Housing Characteristics in Nice
Housing Structures in Nice
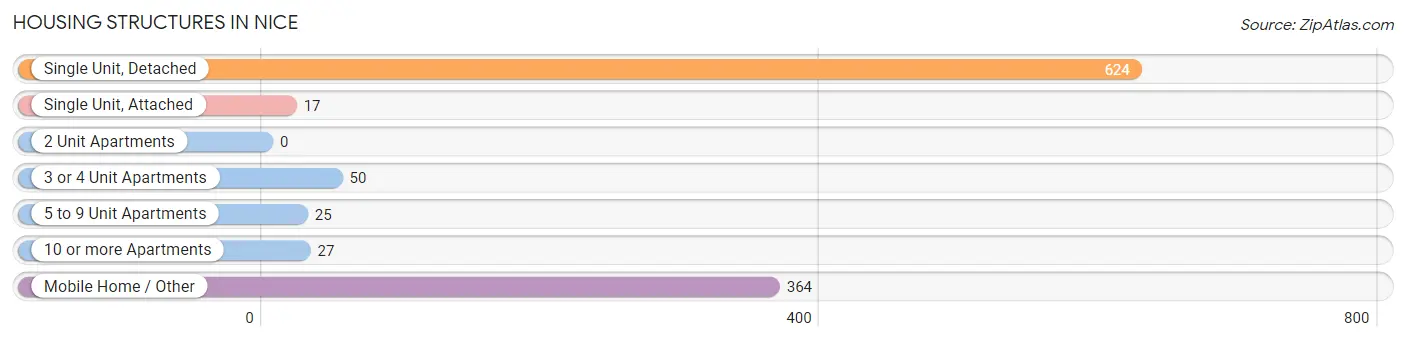
| Structure Type | # Housing Units | % Housing Units |
| Single Unit, Detached | 624 | 56.4% |
| Single Unit, Attached | 17 | 1.5% |
| 2 Unit Apartments | 0 | 0.0% |
| 3 or 4 Unit Apartments | 50 | 4.5% |
| 5 to 9 Unit Apartments | 25 | 2.3% |
| 10 or more Apartments | 27 | 2.4% |
| Mobile Home / Other | 364 | 32.9% |
| Total | 1,107 | 100.0% |
Housing Structures by Occupancy in Nice
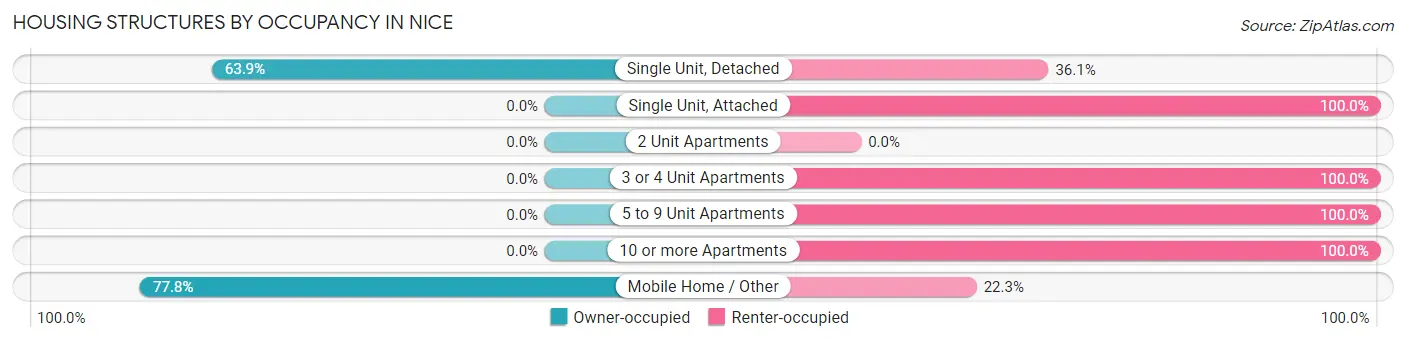
| Structure Type | Owner-occupied | Renter-occupied |
| Single Unit, Detached | 399 (63.9%) | 225 (36.1%) |
| Single Unit, Attached | 0 (0.0%) | 17 (100.0%) |
| 2 Unit Apartments | 0 (0.0%) | 0 (0.0%) |
| 3 or 4 Unit Apartments | 0 (0.0%) | 50 (100.0%) |
| 5 to 9 Unit Apartments | 0 (0.0%) | 25 (100.0%) |
| 10 or more Apartments | 0 (0.0%) | 27 (100.0%) |
| Mobile Home / Other | 283 (77.7%) | 81 (22.3%) |
| Total | 682 (61.6%) | 425 (38.4%) |
Housing Structures by Number of Rooms in Nice
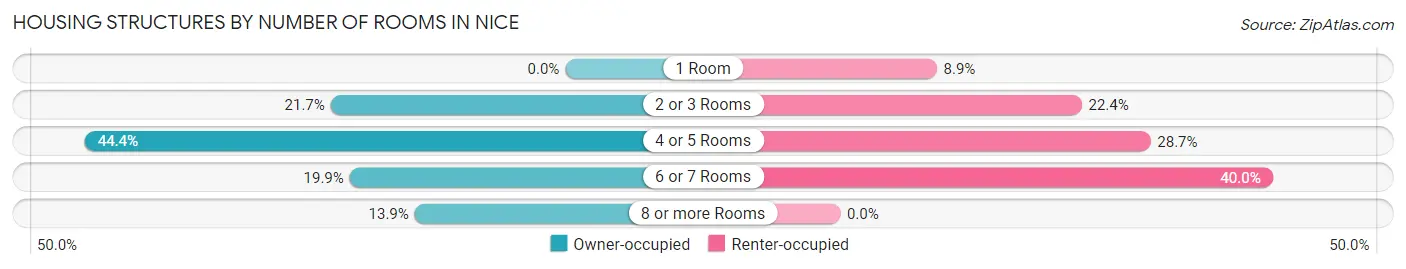
| Number of Rooms | Owner-occupied | Renter-occupied |
| 1 Room | 0 (0.0%) | 38 (8.9%) |
| 2 or 3 Rooms | 148 (21.7%) | 95 (22.4%) |
| 4 or 5 Rooms | 303 (44.4%) | 122 (28.7%) |
| 6 or 7 Rooms | 136 (19.9%) | 170 (40.0%) |
| 8 or more Rooms | 95 (13.9%) | 0 (0.0%) |
| Total | 682 (100.0%) | 425 (100.0%) |
Housing Structure by Heating Type in Nice
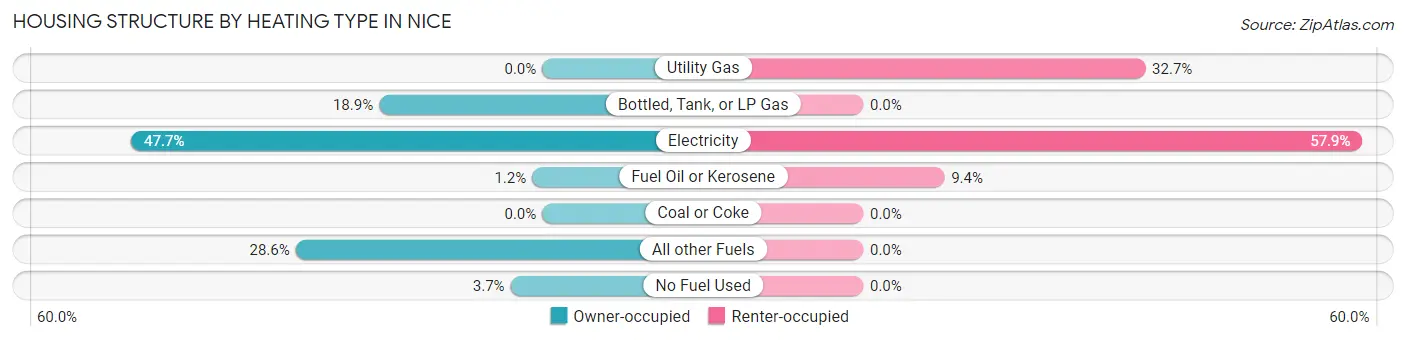
| Heating Type | Owner-occupied | Renter-occupied |
| Utility Gas | 0 (0.0%) | 139 (32.7%) |
| Bottled, Tank, or LP Gas | 129 (18.9%) | 0 (0.0%) |
| Electricity | 325 (47.6%) | 246 (57.9%) |
| Fuel Oil or Kerosene | 8 (1.2%) | 40 (9.4%) |
| Coal or Coke | 0 (0.0%) | 0 (0.0%) |
| All other Fuels | 195 (28.6%) | 0 (0.0%) |
| No Fuel Used | 25 (3.7%) | 0 (0.0%) |
| Total | 682 (100.0%) | 425 (100.0%) |
Household Vehicle Usage in Nice
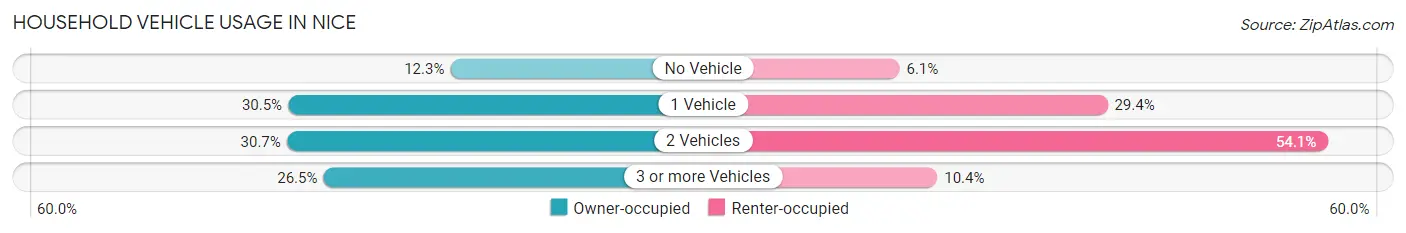
| Vehicles per Household | Owner-occupied | Renter-occupied |
| No Vehicle | 84 (12.3%) | 26 (6.1%) |
| 1 Vehicle | 208 (30.5%) | 125 (29.4%) |
| 2 Vehicles | 209 (30.6%) | 230 (54.1%) |
| 3 or more Vehicles | 181 (26.5%) | 44 (10.3%) |
| Total | 682 (100.0%) | 425 (100.0%) |
Real Estate & Mortgages in Nice
Real Estate and Mortgage Overview in Nice
| Characteristic | Without Mortgage | With Mortgage |
| Housing Units | 484 | 198 |
| Median Property Value | - | - |
| Median Household Income | $49,400 | $64 |
| Monthly Housing Costs | $478 | $7 |
| Real Estate Taxes | $745 | $0 |
Property Value by Mortgage Status in Nice
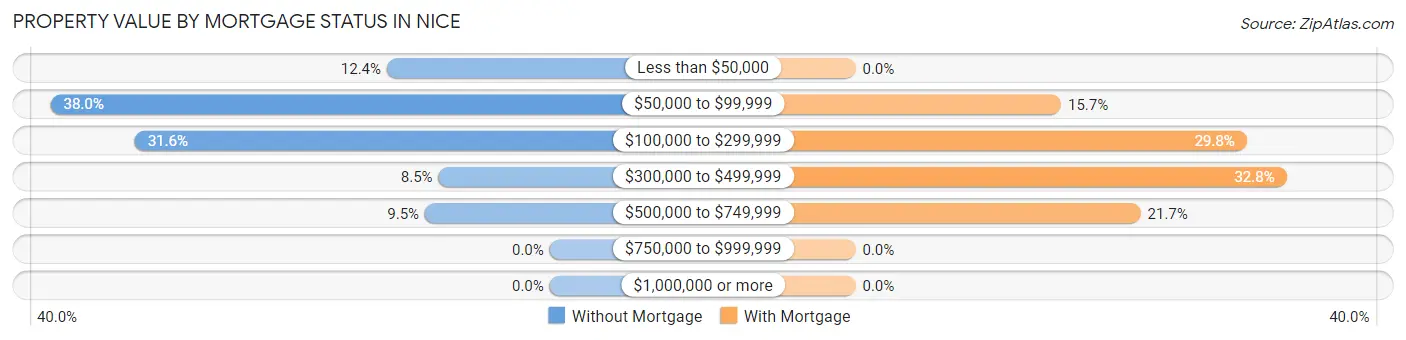
| Property Value | Without Mortgage | With Mortgage |
| Less than $50,000 | 60 (12.4%) | 0 (0.0%) |
| $50,000 to $99,999 | 184 (38.0%) | 31 (15.7%) |
| $100,000 to $299,999 | 153 (31.6%) | 59 (29.8%) |
| $300,000 to $499,999 | 41 (8.5%) | 65 (32.8%) |
| $500,000 to $749,999 | 46 (9.5%) | 43 (21.7%) |
| $750,000 to $999,999 | 0 (0.0%) | 0 (0.0%) |
| $1,000,000 or more | 0 (0.0%) | 0 (0.0%) |
| Total | 484 (100.0%) | 198 (100.0%) |
Household Income by Mortgage Status in Nice
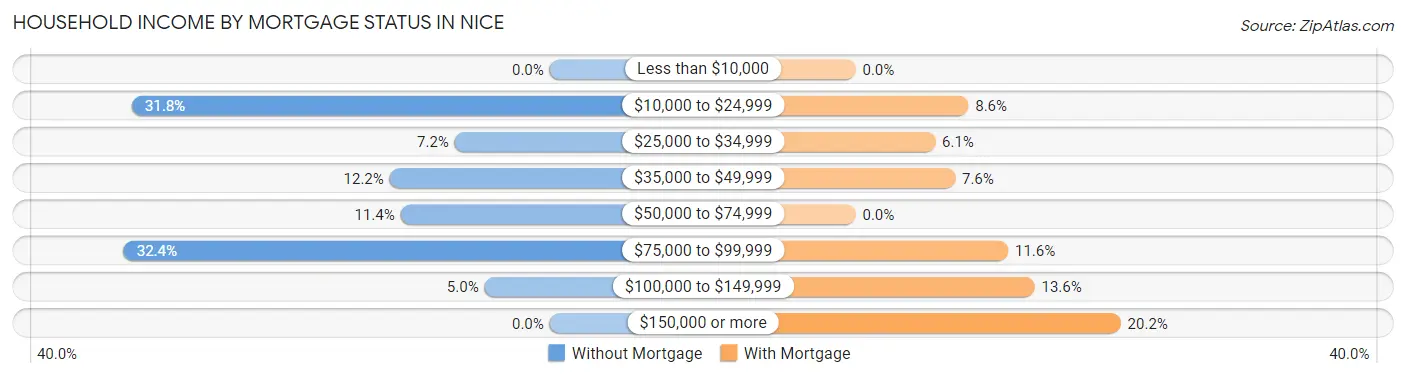
| Household Income | Without Mortgage | With Mortgage |
| Less than $10,000 | 0 (0.0%) | 0 (0.0%) |
| $10,000 to $24,999 | 154 (31.8%) | 17 (8.6%) |
| $25,000 to $34,999 | 35 (7.2%) | 12 (6.1%) |
| $35,000 to $49,999 | 59 (12.2%) | 15 (7.6%) |
| $50,000 to $74,999 | 55 (11.4%) | 0 (0.0%) |
| $75,000 to $99,999 | 157 (32.4%) | 23 (11.6%) |
| $100,000 to $149,999 | 24 (5.0%) | 27 (13.6%) |
| $150,000 or more | 0 (0.0%) | 40 (20.2%) |
| Total | 484 (100.0%) | 198 (100.0%) |
Property Value to Household Income Ratio in Nice
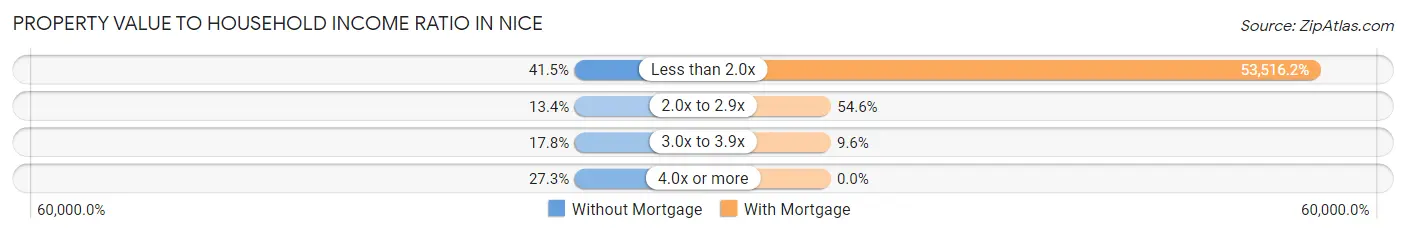
| Value-to-Income Ratio | Without Mortgage | With Mortgage |
| Less than 2.0x | 201 (41.5%) | 105,962 (53,516.2%) |
| 2.0x to 2.9x | 65 (13.4%) | 108 (54.5%) |
| 3.0x to 3.9x | 86 (17.8%) | 19 (9.6%) |
| 4.0x or more | 132 (27.3%) | 0 (0.0%) |
| Total | 484 (100.0%) | 198 (100.0%) |
Real Estate Taxes by Mortgage Status in Nice
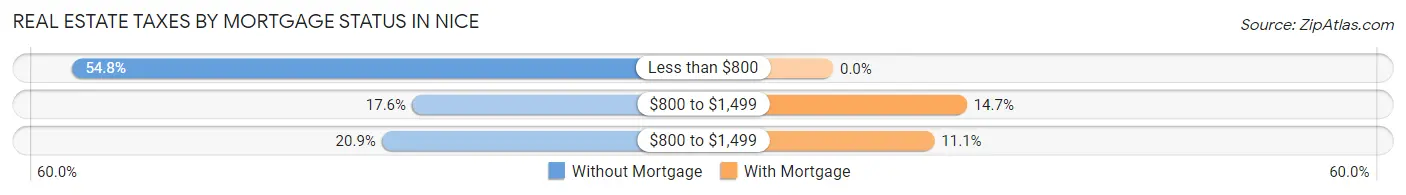
| Property Taxes | Without Mortgage | With Mortgage |
| Less than $800 | 265 (54.7%) | 0 (0.0%) |
| $800 to $1,499 | 85 (17.6%) | 29 (14.6%) |
| $800 to $1,499 | 101 (20.9%) | 22 (11.1%) |
| Total | 484 (100.0%) | 198 (100.0%) |
Health & Disability in Nice
Health Insurance Coverage by Age in Nice
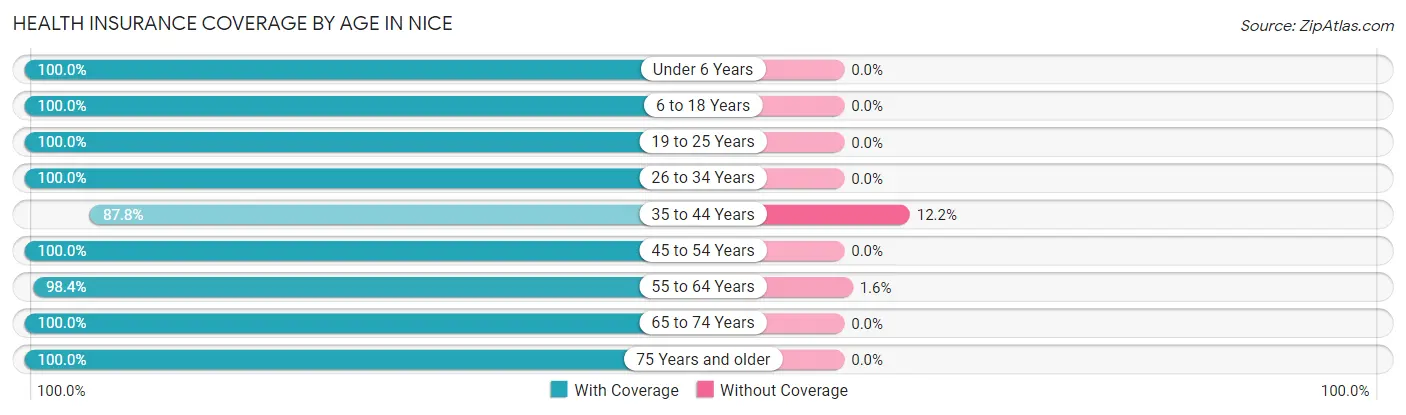
| Age Bracket | With Coverage | Without Coverage |
| Under 6 Years | 258 (100.0%) | 0 (0.0%) |
| 6 to 18 Years | 203 (100.0%) | 0 (0.0%) |
| 19 to 25 Years | 114 (100.0%) | 0 (0.0%) |
| 26 to 34 Years | 128 (100.0%) | 0 (0.0%) |
| 35 to 44 Years | 417 (87.8%) | 58 (12.2%) |
| 45 to 54 Years | 176 (100.0%) | 0 (0.0%) |
| 55 to 64 Years | 375 (98.4%) | 6 (1.6%) |
| 65 to 74 Years | 385 (100.0%) | 0 (0.0%) |
| 75 Years and older | 259 (100.0%) | 0 (0.0%) |
| Total | 2,315 (97.3%) | 64 (2.7%) |
Health Insurance Coverage by Citizenship Status in Nice
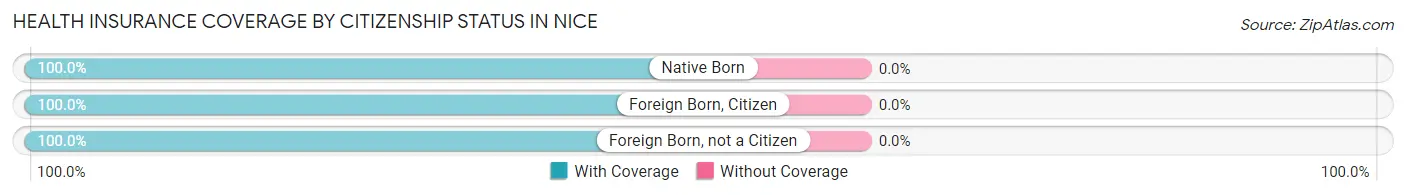
| Citizenship Status | With Coverage | Without Coverage |
| Native Born | 258 (100.0%) | 0 (0.0%) |
| Foreign Born, Citizen | 203 (100.0%) | 0 (0.0%) |
| Foreign Born, not a Citizen | 114 (100.0%) | 0 (0.0%) |
Health Insurance Coverage by Household Income in Nice
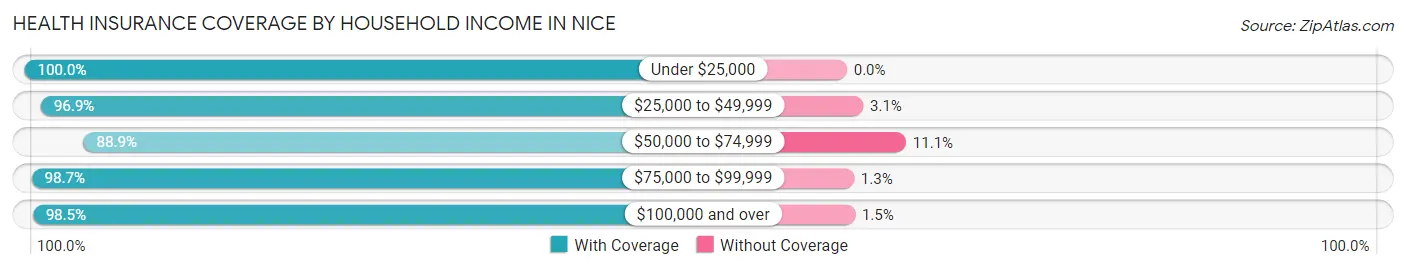
| Household Income | With Coverage | Without Coverage |
| Under $25,000 | 317 (100.0%) | 0 (0.0%) |
| $25,000 to $49,999 | 538 (96.9%) | 17 (3.1%) |
| $50,000 to $74,999 | 241 (88.9%) | 30 (11.1%) |
| $75,000 to $99,999 | 818 (98.7%) | 11 (1.3%) |
| $100,000 and over | 386 (98.5%) | 6 (1.5%) |
Public vs Private Health Insurance Coverage by Age in Nice
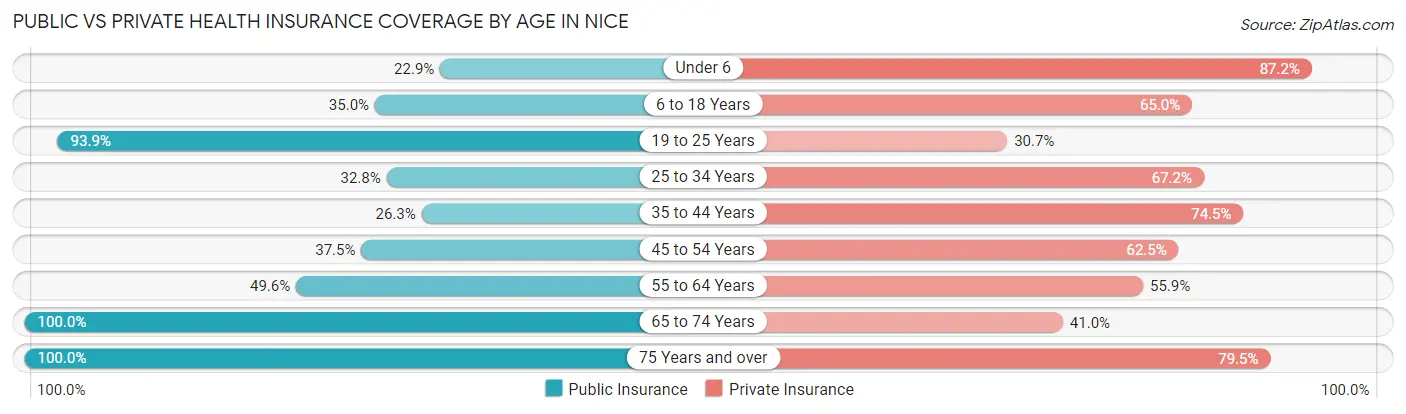
| Age Bracket | Public Insurance | Private Insurance |
| Under 6 | 59 (22.9%) | 225 (87.2%) |
| 6 to 18 Years | 71 (35.0%) | 132 (65.0%) |
| 19 to 25 Years | 107 (93.9%) | 35 (30.7%) |
| 25 to 34 Years | 42 (32.8%) | 86 (67.2%) |
| 35 to 44 Years | 125 (26.3%) | 354 (74.5%) |
| 45 to 54 Years | 66 (37.5%) | 110 (62.5%) |
| 55 to 64 Years | 189 (49.6%) | 213 (55.9%) |
| 65 to 74 Years | 385 (100.0%) | 158 (41.0%) |
| 75 Years and over | 259 (100.0%) | 206 (79.5%) |
| Total | 1,303 (54.8%) | 1,519 (63.8%) |
Disability Status by Sex by Age in Nice
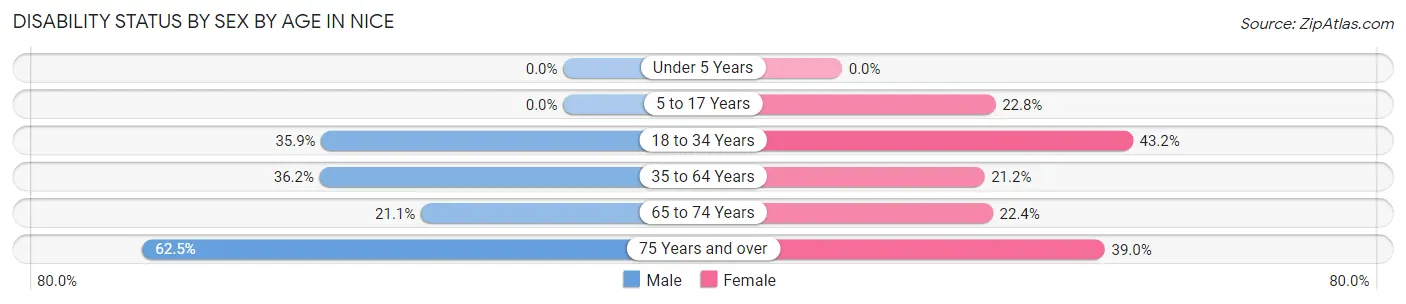
| Age Bracket | Male | Female |
| Under 5 Years | 0 (0.0%) | 0 (0.0%) |
| 5 to 17 Years | 0 (0.0%) | 36 (22.8%) |
| 18 to 34 Years | 37 (35.9%) | 60 (43.2%) |
| 35 to 64 Years | 204 (36.2%) | 99 (21.1%) |
| 65 to 74 Years | 53 (21.1%) | 30 (22.4%) |
| 75 Years and over | 85 (62.5%) | 48 (39.0%) |
Disability Class by Sex by Age in Nice
Disability Class: Hearing Difficulty
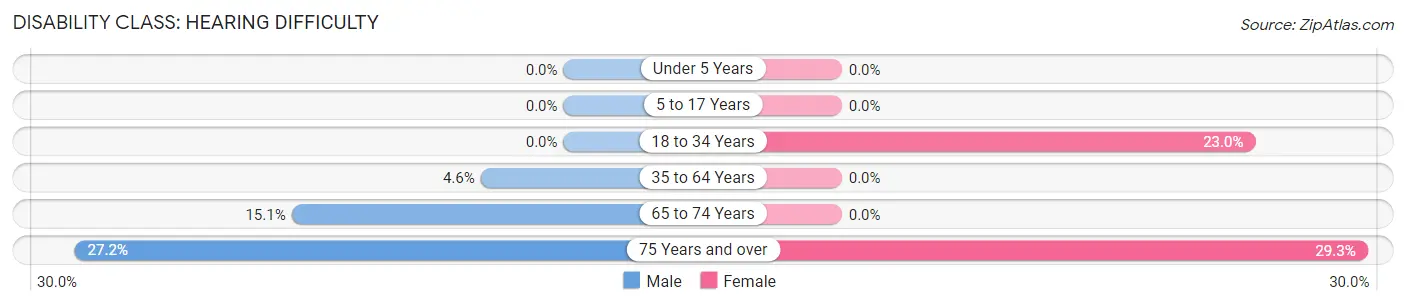
| Age Bracket | Male | Female |
| Under 5 Years | 0 (0.0%) | 0 (0.0%) |
| 5 to 17 Years | 0 (0.0%) | 0 (0.0%) |
| 18 to 34 Years | 0 (0.0%) | 32 (23.0%) |
| 35 to 64 Years | 26 (4.6%) | 0 (0.0%) |
| 65 to 74 Years | 38 (15.1%) | 0 (0.0%) |
| 75 Years and over | 37 (27.2%) | 36 (29.3%) |
Disability Class: Vision Difficulty
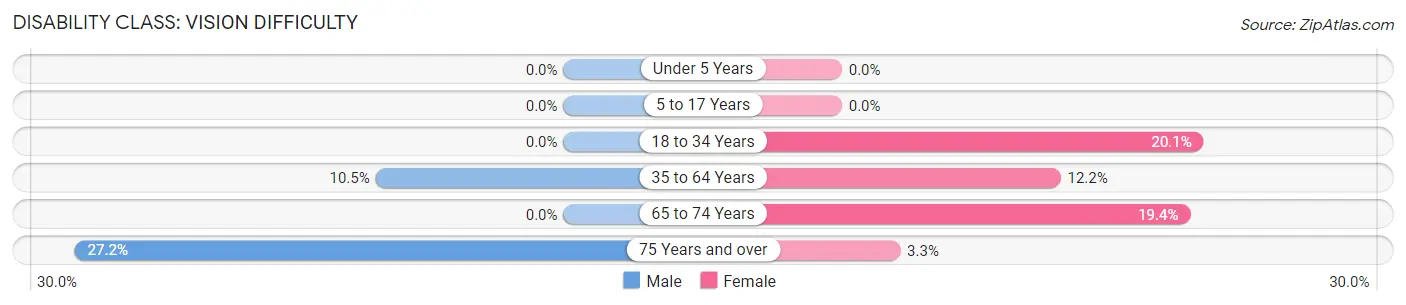
| Age Bracket | Male | Female |
| Under 5 Years | 0 (0.0%) | 0 (0.0%) |
| 5 to 17 Years | 0 (0.0%) | 0 (0.0%) |
| 18 to 34 Years | 0 (0.0%) | 28 (20.1%) |
| 35 to 64 Years | 59 (10.5%) | 57 (12.2%) |
| 65 to 74 Years | 0 (0.0%) | 26 (19.4%) |
| 75 Years and over | 37 (27.2%) | 4 (3.3%) |
Disability Class: Cognitive Difficulty
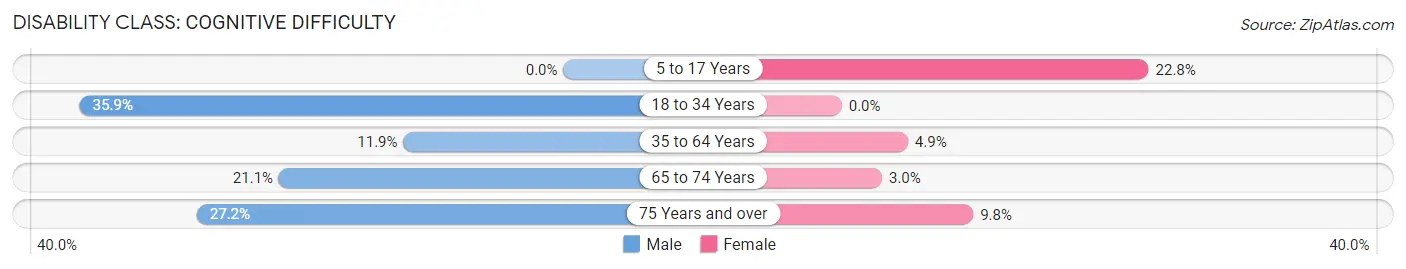
| Age Bracket | Male | Female |
| 5 to 17 Years | 0 (0.0%) | 36 (22.8%) |
| 18 to 34 Years | 37 (35.9%) | 0 (0.0%) |
| 35 to 64 Years | 67 (11.9%) | 23 (4.9%) |
| 65 to 74 Years | 53 (21.1%) | 4 (3.0%) |
| 75 Years and over | 37 (27.2%) | 12 (9.8%) |
Disability Class: Ambulatory Difficulty
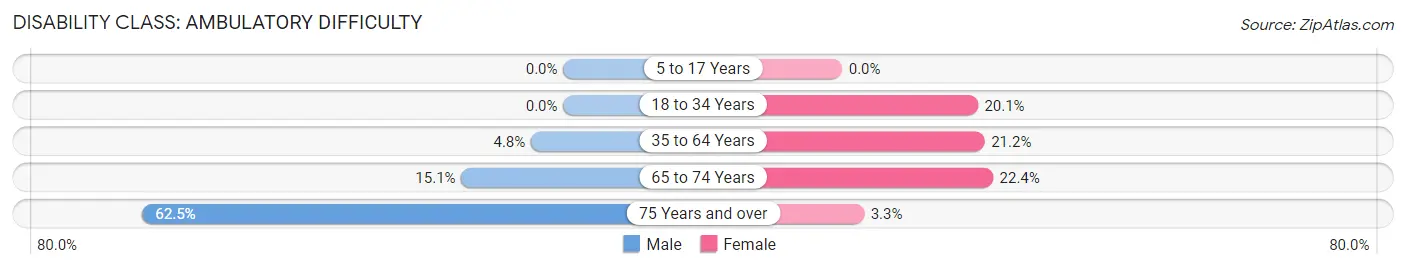
| Age Bracket | Male | Female |
| 5 to 17 Years | 0 (0.0%) | 0 (0.0%) |
| 18 to 34 Years | 0 (0.0%) | 28 (20.1%) |
| 35 to 64 Years | 27 (4.8%) | 99 (21.1%) |
| 65 to 74 Years | 38 (15.1%) | 30 (22.4%) |
| 75 Years and over | 85 (62.5%) | 4 (3.3%) |
Disability Class: Self-Care Difficulty
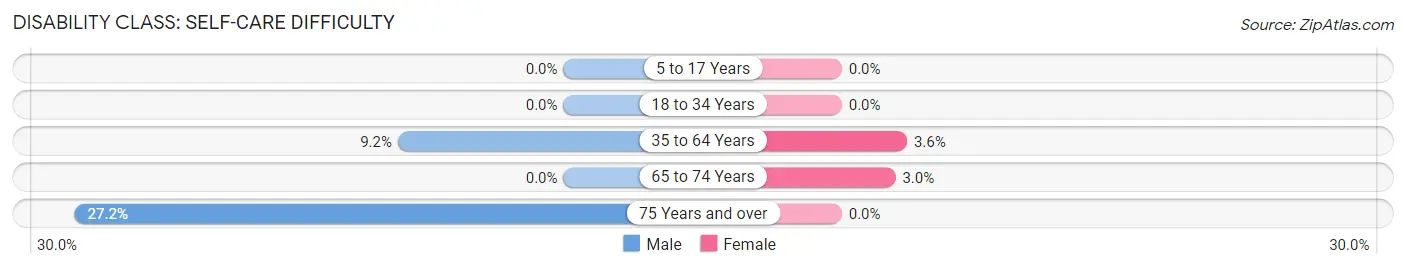
| Age Bracket | Male | Female |
| 5 to 17 Years | 0 (0.0%) | 0 (0.0%) |
| 18 to 34 Years | 0 (0.0%) | 0 (0.0%) |
| 35 to 64 Years | 52 (9.2%) | 17 (3.6%) |
| 65 to 74 Years | 0 (0.0%) | 4 (3.0%) |
| 75 Years and over | 37 (27.2%) | 0 (0.0%) |
Technology Access in Nice
Computing Device Access in Nice
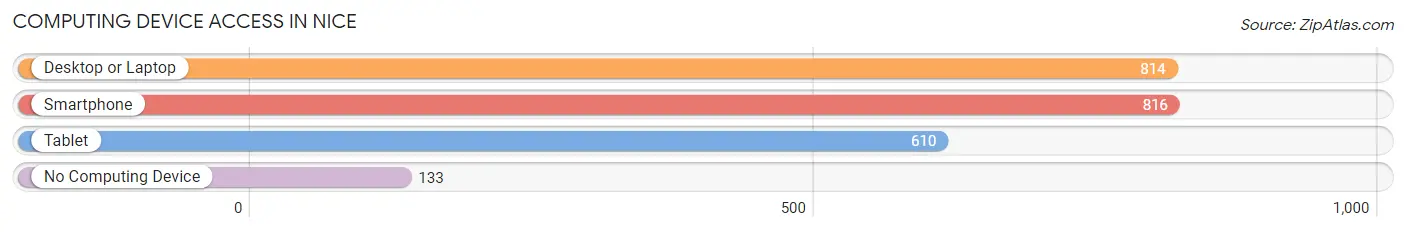
| Device Type | # Households | % Households |
| Desktop or Laptop | 814 | 73.5% |
| Smartphone | 816 | 73.7% |
| Tablet | 610 | 55.1% |
| No Computing Device | 133 | 12.0% |
| Total | 1,107 | 100.0% |
Internet Access in Nice
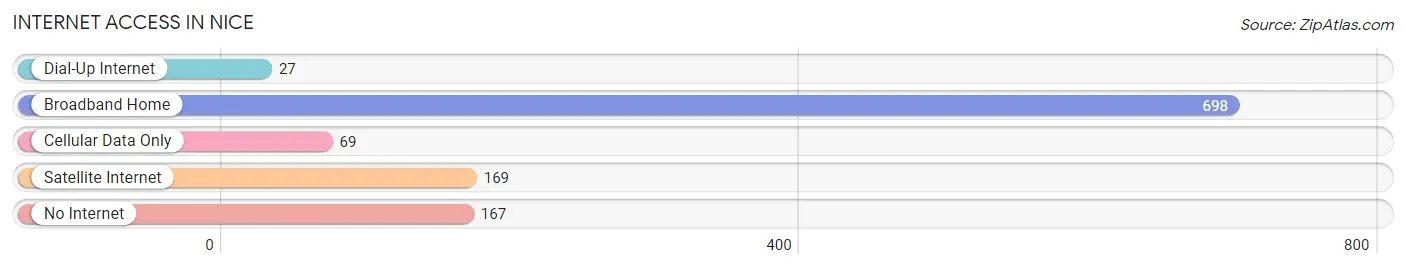
| Internet Type | # Households | % Households |
| Dial-Up Internet | 27 | 2.4% |
| Broadband Home | 698 | 63.0% |
| Cellular Data Only | 69 | 6.2% |
| Satellite Internet | 169 | 15.3% |
| No Internet | 167 | 15.1% |
| Total | 1,107 | 100.0% |
Nice Summary
Nice is a small city located in the North Coast region of California, in the United States. It is situated in the foothills of the Sierra Nevada Mountains, and is part of the larger Lake County. The city has a population of approximately 8,000 people, and is known for its rural charm and natural beauty.
History
The area that is now Nice was originally inhabited by the Pomo Native Americans. The first European settlers arrived in the area in the late 1800s, and the town was officially founded in 1875. The town was named after the nearby Nice Valley, which was named after a local rancher, John Nice.
In the early 1900s, Nice was a thriving agricultural community, with many farms and ranches in the area. The town was also home to a number of businesses, including a hotel, a general store, and a post office.
In the 1950s, the town began to experience a decline in population as many of the local farms and ranches closed down. However, in the late 1970s, the town began to experience a resurgence in population as people began to move to the area for its rural charm and natural beauty.
Geography
Nice is located in the North Coast region of California, in the United States. It is situated in the foothills of the Sierra Nevada Mountains, and is part of the larger Lake County. The city has a total area of 1.3 square miles, and is located at an elevation of 1,845 feet.
The city is located in a valley, surrounded by hills and mountains. The nearby Nice Valley is a popular destination for outdoor activities, such as hiking, camping, and fishing. The nearby Clear Lake is also a popular destination for boating and fishing.
Economy
The economy of Nice is largely based on tourism and agriculture. The city is home to a number of wineries, and is a popular destination for wine tasting. The nearby Nice Valley is also a popular destination for outdoor activities, such as hiking, camping, and fishing.
The city is also home to a number of businesses, including restaurants, shops, and hotels. The city is also home to a number of manufacturing companies, including a furniture factory and a woodworking shop.
Demographics
As of the 2010 census, the population of Nice was 8,000 people. The racial makeup of the city was 79.3% White, 0.7% African American, 0.3% Native American, 0.7% Asian, 0.1% Pacific Islander, and 18.8% from other races. The median household income was $45,000, and the median family income was $50,000.
Conclusion
Nice is a small city located in the North Coast region of California, in the United States. It is situated in the foothills of the Sierra Nevada Mountains, and is part of the larger Lake County. The city has a population of approximately 8,000 people, and is known for its rural charm and natural beauty. The economy of Nice is largely based on tourism and agriculture, and the city is home to a number of businesses, including restaurants, shops, and hotels. The racial makeup of the city is 79.3% White, 0.7% African American, 0.3% Native American, 0.7% Asian, 0.1% Pacific Islander, and 18.8% from other races.
Common Questions
What is Per Capita Income in Nice?
Per Capita income in Nice is $35,111.
What is the Median Family Income in Nice?
Median Family Income in Nice is $82,321.
What is the Median Household income in Nice?
Median Household Income in Nice is $69,653.
What is Income or Wage Gap in Nice?
Income or Wage Gap in Nice is 37.7%.
Women in Nice earn 62.3 cents for every dollar earned by a man.
What is Inequality or Gini Index in Nice?
Inequality or Gini Index in Nice is 0.41.
What is the Total Population of Nice?
Total Population of Nice is 2,389.
What is the Total Male Population of Nice?
Total Male Population of Nice is 1,364.
What is the Total Female Population of Nice?
Total Female Population of Nice is 1,025.
What is the Ratio of Males per 100 Females in Nice?
There are 133.07 Males per 100 Females in Nice.
What is the Ratio of Females per 100 Males in Nice?
There are 75.15 Females per 100 Males in Nice.
What is the Median Population Age in Nice?
Median Population Age in Nice is 45.5 Years.
What is the Average Family Size in Nice
Average Family Size in Nice is 2.7 People.
What is the Average Household Size in Nice
Average Household Size in Nice is 2.1 People.
How Large is the Labor Force in Nice?
There are 991 People in the Labor Forcein in Nice.
What is the Percentage of People in the Labor Force in Nice?
50.7% of People are in the Labor Force in Nice.
What is the Unemployment Rate in Nice?
Unemployment Rate in Nice is 5.1%.