Needles, CA Map & Demographics
Needles Map
Needles Overview
$27,969
PER CAPITA INCOME
$54,828
AVG FAMILY INCOME
$38,368
AVG HOUSEHOLD INCOME
18.5%
WAGE / INCOME GAP [ % ]
81.5¢/ $1
WAGE / INCOME GAP [ $ ]
$6,775
FAMILY INCOME DEFICIT
0.52
INEQUALITY / GINI INDEX
4,895
TOTAL POPULATION
2,505
MALE POPULATION
2,390
FEMALE POPULATION
104.81
MALES / 100 FEMALES
95.41
FEMALES / 100 MALES
48.8
MEDIAN AGE
2.9
AVG FAMILY SIZE
2.4
AVG HOUSEHOLD SIZE
1,751
LABOR FORCE [ PEOPLE ]
42.8%
PERCENT IN LABOR FORCE
14.1%
UNEMPLOYMENT RATE
Needles Zip Codes
Needles Area Codes
Income in Needles
Income Overview in Needles
Per Capita Income in Needles is $27,969, while median incomes of families and households are $54,828 and $38,368 respectively.
| Characteristic | Number | Measure |
| Per Capita Income | 4,895 | $27,969 |
| Median Family Income | 1,368 | $54,828 |
| Mean Family Income | 1,368 | $76,251 |
| Median Household Income | 2,016 | $38,368 |
| Mean Household Income | 2,016 | $66,748 |
| Income Deficit | 1,368 | $6,775 |
| Wage / Income Gap (%) | 4,895 | 18.48% |
| Wage / Income Gap ($) | 4,895 | 81.52¢ per $1 |
| Gini / Inequality Index | 4,895 | 0.52 |
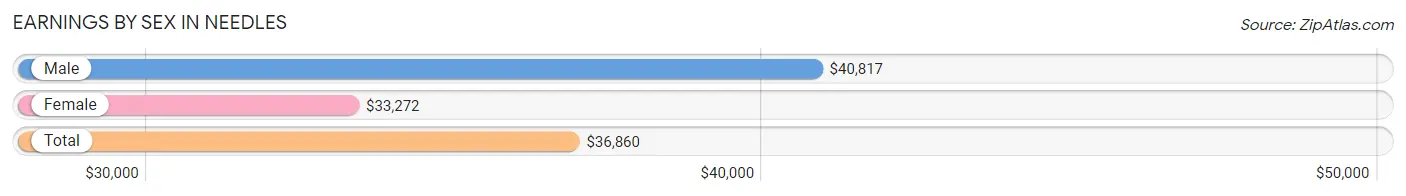
Earnings by Sex in Needles
Average Earnings in Needles are $36,860, $40,817 for men and $33,272 for women, a difference of 18.5%.
| Sex | Number | Average Earnings |
| Male | 1,030 (60.9%) | $40,817 |
| Female | 661 (39.1%) | $33,272 |
| Total | 1,691 (100.0%) | $36,860 |
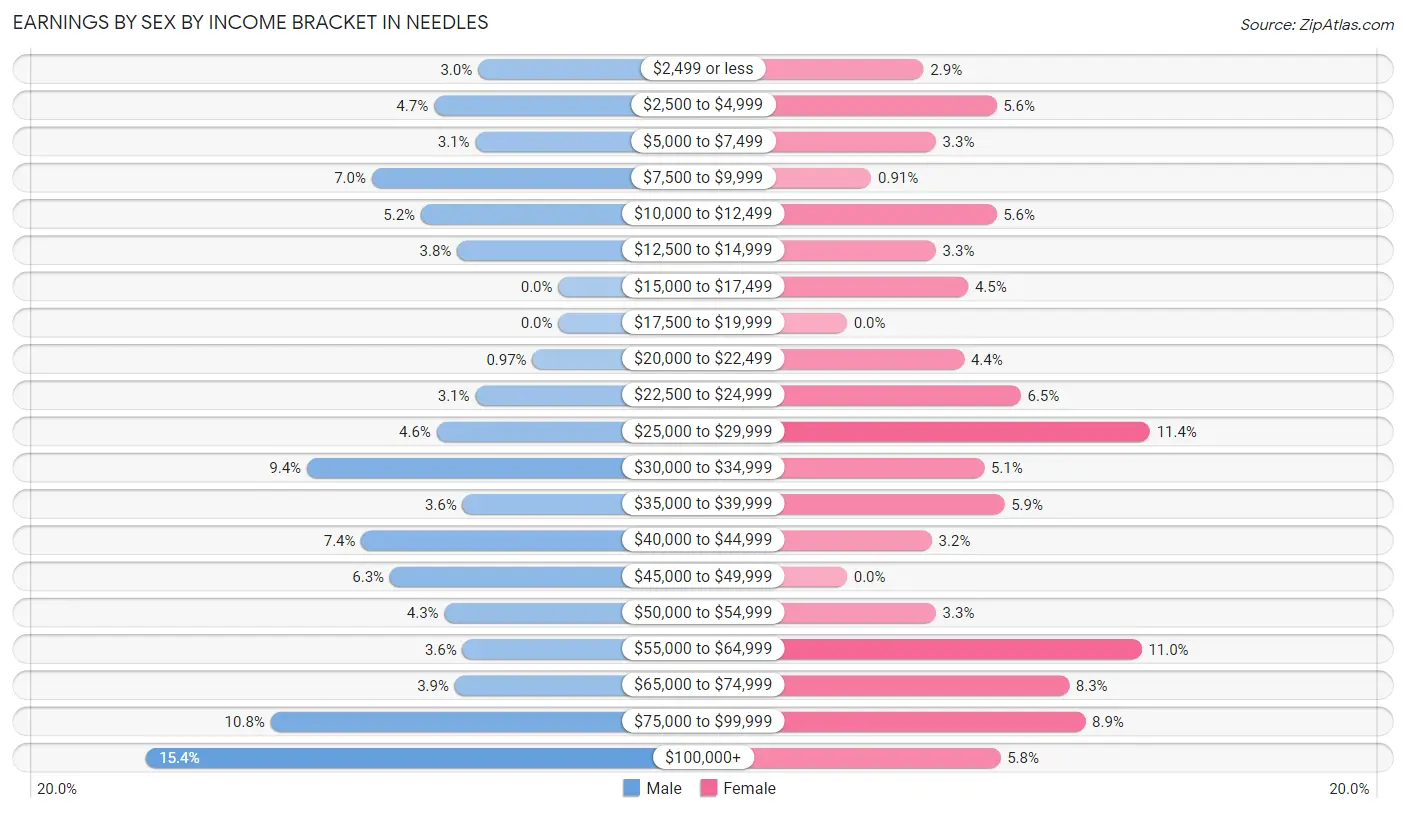
Earnings by Sex by Income Bracket in Needles
The most common earnings brackets in Needles are $100,000+ for men (159 | 15.4%) and $25,000 to $29,999 for women (75 | 11.4%).
| Income | Male | Female |
| $2,499 or less | 31 (3.0%) | 19 (2.9%) |
| $2,500 to $4,999 | 48 (4.7%) | 37 (5.6%) |
| $5,000 to $7,499 | 32 (3.1%) | 22 (3.3%) |
| $7,500 to $9,999 | 72 (7.0%) | 6 (0.9%) |
| $10,000 to $12,499 | 53 (5.1%) | 37 (5.6%) |
| $12,500 to $14,999 | 39 (3.8%) | 22 (3.3%) |
| $15,000 to $17,499 | 0 (0.0%) | 30 (4.5%) |
| $17,500 to $19,999 | 0 (0.0%) | 0 (0.0%) |
| $20,000 to $22,499 | 10 (1.0%) | 29 (4.4%) |
| $22,500 to $24,999 | 32 (3.1%) | 43 (6.5%) |
| $25,000 to $29,999 | 47 (4.6%) | 75 (11.4%) |
| $30,000 to $34,999 | 97 (9.4%) | 34 (5.1%) |
| $35,000 to $39,999 | 37 (3.6%) | 39 (5.9%) |
| $40,000 to $44,999 | 76 (7.4%) | 21 (3.2%) |
| $45,000 to $49,999 | 65 (6.3%) | 0 (0.0%) |
| $50,000 to $54,999 | 44 (4.3%) | 22 (3.3%) |
| $55,000 to $64,999 | 37 (3.6%) | 73 (11.0%) |
| $65,000 to $74,999 | 40 (3.9%) | 55 (8.3%) |
| $75,000 to $99,999 | 111 (10.8%) | 59 (8.9%) |
| $100,000+ | 159 (15.4%) | 38 (5.8%) |
| Total | 1,030 (100.0%) | 661 (100.0%) |
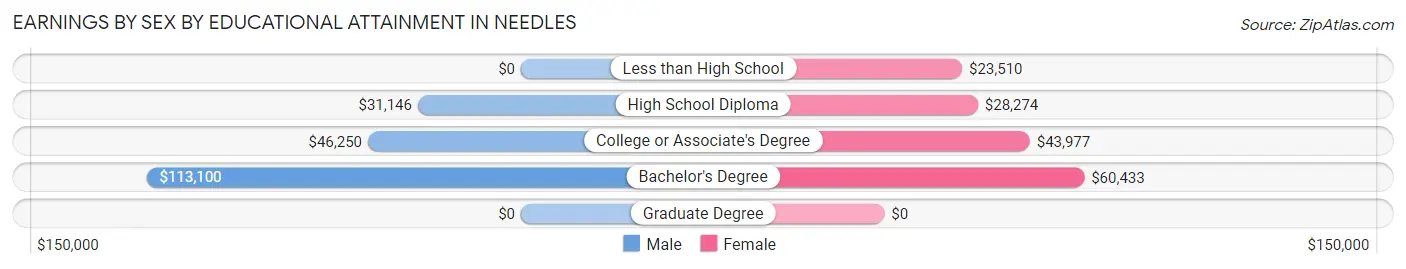
Earnings by Sex by Educational Attainment in Needles
Average earnings in Needles are $40,767 for men and $36,164 for women, a difference of 11.3%. Men with an educational attainment of bachelor's degree enjoy the highest average annual earnings of $113,100, while those with high school diploma education earn the least with $31,146. Women with an educational attainment of bachelor's degree earn the most with the average annual earnings of $60,433, while those with less than high school education have the smallest earnings of $23,510.
| Educational Attainment | Male Income | Female Income |
| Less than High School | - | - |
| High School Diploma | $31,146 | $28,274 |
| College or Associate's Degree | $46,250 | $43,977 |
| Bachelor's Degree | $113,100 | $60,433 |
| Graduate Degree | - | - |
| Total | $40,767 | $36,164 |
Family Income in Needles
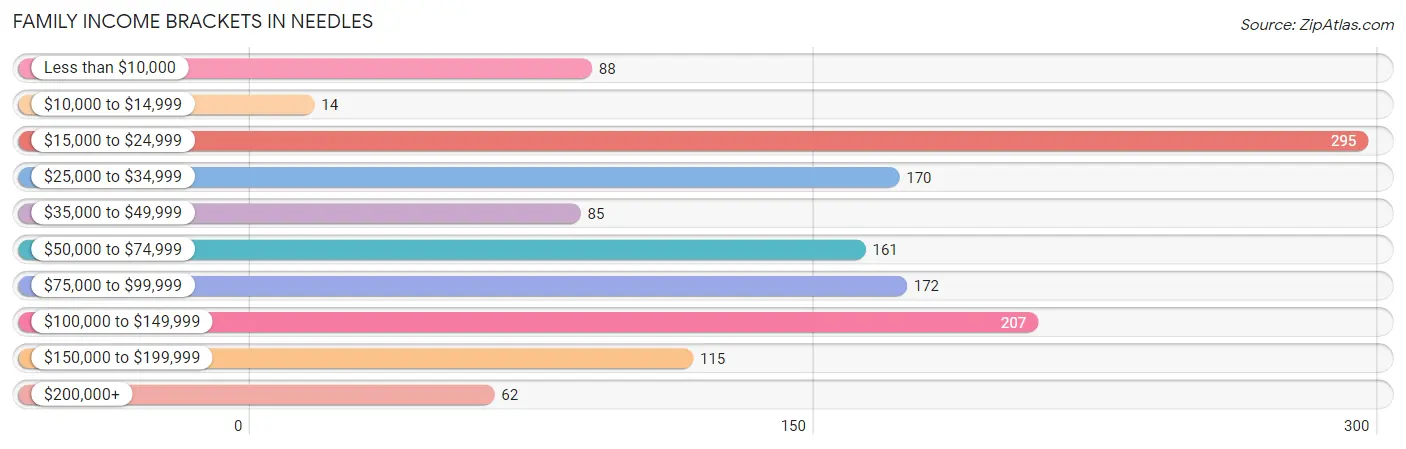
Family Income Brackets in Needles
According to the Needles family income data, there are 295 families falling into the $15,000 to $24,999 income range, which is the most common income bracket and makes up 21.6% of all families. Conversely, the $10,000 to $14,999 income bracket is the least frequent group with only 14 families (1.0%) belonging to this category.
| Income Bracket | # Families | % Families |
| Less than $10,000 | 88 | 6.4% |
| $10,000 to $14,999 | 14 | 1.0% |
| $15,000 to $24,999 | 295 | 21.6% |
| $25,000 to $34,999 | 170 | 12.4% |
| $35,000 to $49,999 | 85 | 6.2% |
| $50,000 to $74,999 | 161 | 11.8% |
| $75,000 to $99,999 | 172 | 12.6% |
| $100,000 to $149,999 | 207 | 15.1% |
| $150,000 to $199,999 | 115 | 8.4% |
| $200,000+ | 62 | 4.5% |
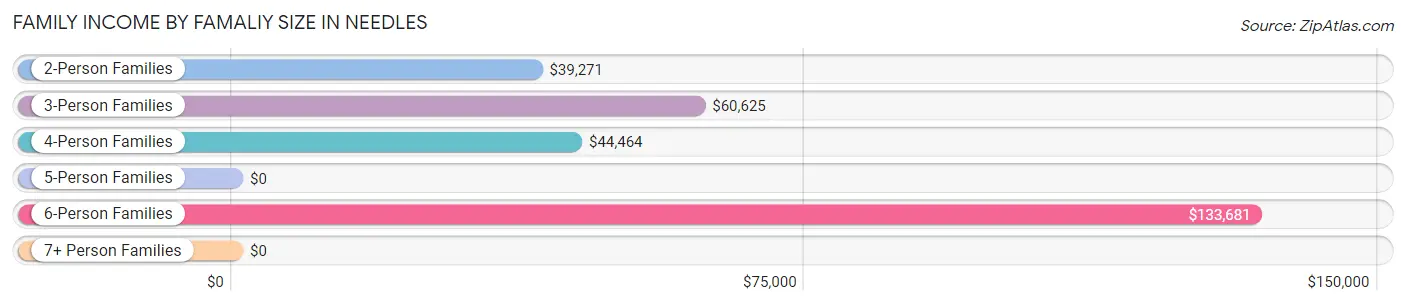
Family Income by Famaliy Size in Needles
6-person families (51 | 3.7%) account for the highest median family income in Needles with $133,681 per family, while 6-person families (51 | 3.7%) have the highest median income of $22,280 per family member.
| Income Bracket | # Families | Median Income |
| 2-Person Families | 837 (61.2%) | $39,271 |
| 3-Person Families | 236 (17.2%) | $60,625 |
| 4-Person Families | 180 (13.2%) | $44,464 |
| 5-Person Families | 64 (4.7%) | $0 |
| 6-Person Families | 51 (3.7%) | $133,681 |
| 7+ Person Families | 0 (0.0%) | $0 |
| Total | 1,368 (100.0%) | $54,828 |
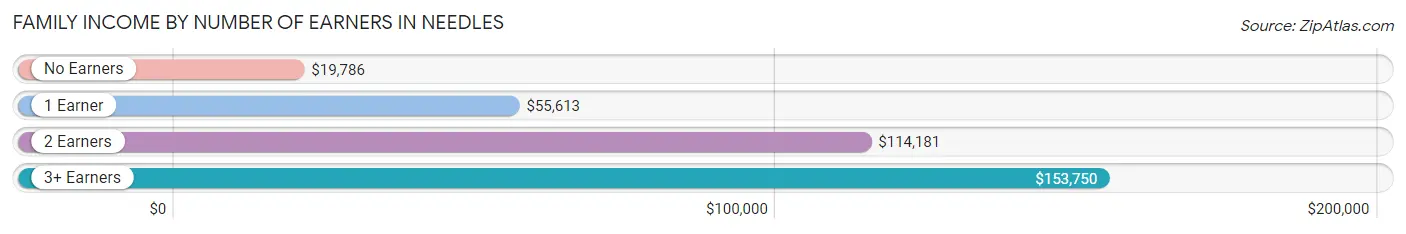
Family Income by Number of Earners in Needles
The median family income in Needles is $54,828, with families comprising 3+ earners (99) having the highest median family income of $153,750, while families with no earners (549) have the lowest median family income of $19,786, accounting for 7.2% and 40.1% of families, respectively.
| Number of Earners | # Families | Median Income |
| No Earners | 549 (40.1%) | $19,786 |
| 1 Earner | 417 (30.5%) | $55,613 |
| 2 Earners | 303 (22.2%) | $114,181 |
| 3+ Earners | 99 (7.2%) | $153,750 |
| Total | 1,368 (100.0%) | $54,828 |
Household Income in Needles
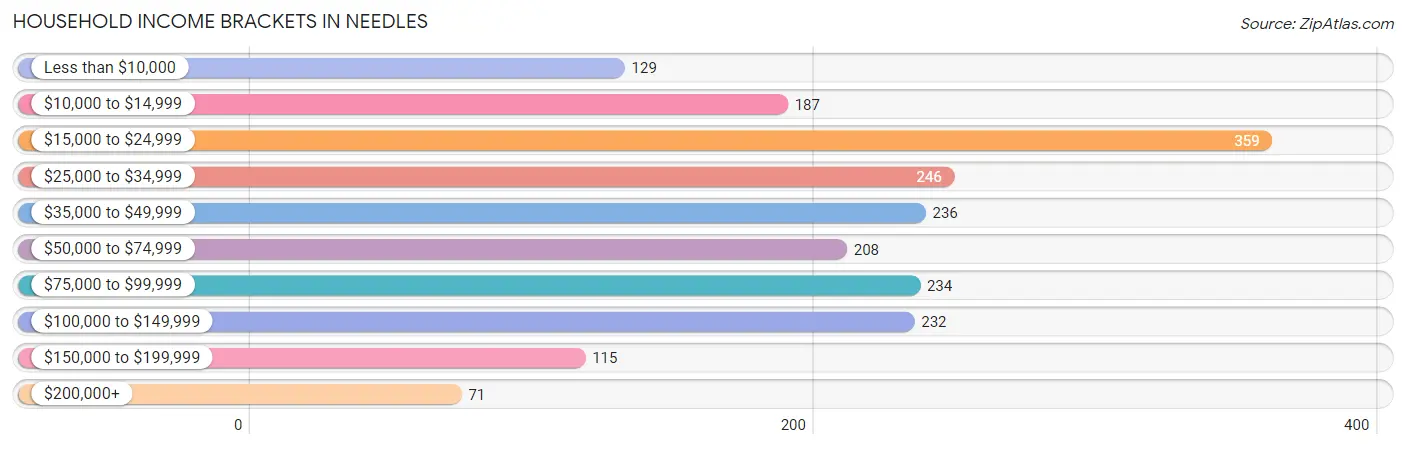
Household Income Brackets in Needles
With 359 households falling in the category, the $15,000 to $24,999 income range is the most frequent in Needles, accounting for 17.8% of all households. In contrast, only 71 households (3.5%) fall into the $200,000+ income bracket, making it the least populous group.
| Income Bracket | # Households | % Households |
| Less than $10,000 | 129 | 6.4% |
| $10,000 to $14,999 | 187 | 9.3% |
| $15,000 to $24,999 | 359 | 17.8% |
| $25,000 to $34,999 | 246 | 12.2% |
| $35,000 to $49,999 | 236 | 11.7% |
| $50,000 to $74,999 | 208 | 10.3% |
| $75,000 to $99,999 | 234 | 11.6% |
| $100,000 to $149,999 | 232 | 11.5% |
| $150,000 to $199,999 | 115 | 5.7% |
| $200,000+ | 71 | 3.5% |
Household Income by Householder Age in Needles
The median household income in Needles is $38,368, with the highest median household income of $77,386 found in the 25 to 44 years age bracket for the primary householder. A total of 381 households (18.9%) fall into this category. Meanwhile, the 45 to 64 years age bracket for the primary householder has the lowest median household income of $30,086, with 920 households (45.6%) in this group.
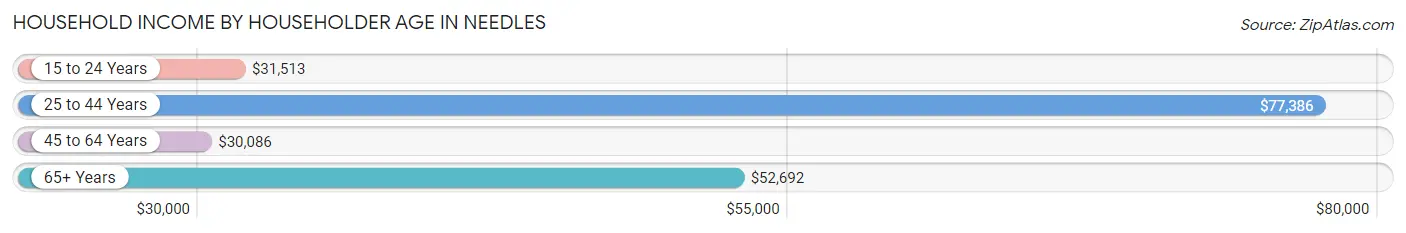
| Income Bracket | # Households | Median Income |
| 15 to 24 Years | 43 (2.1%) | $31,513 |
| 25 to 44 Years | 381 (18.9%) | $77,386 |
| 45 to 64 Years | 920 (45.6%) | $30,086 |
| 65+ Years | 672 (33.3%) | $52,692 |
| Total | 2,016 (100.0%) | $38,368 |
Poverty in Needles
Income Below Poverty by Sex and Age in Needles
With 28.1% poverty level for males and 30.5% for females among the residents of Needles, 15 year old males and 16 and 17 year old females are the most vulnerable to poverty, with 8 males (100.0%) and 43 females (86.0%) in their respective age groups living below the poverty level.
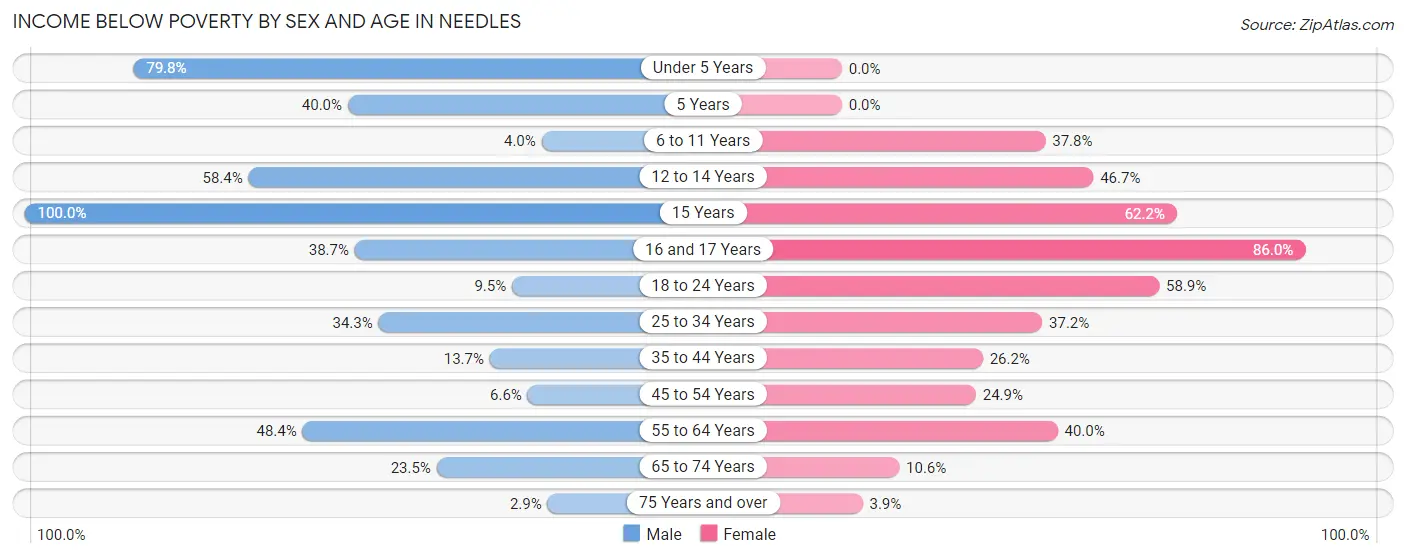
| Age Bracket | Male | Female |
| Under 5 Years | 91 (79.8%) | 0 (0.0%) |
| 5 Years | 12 (40.0%) | 0 (0.0%) |
| 6 to 11 Years | 5 (4.0%) | 71 (37.8%) |
| 12 to 14 Years | 52 (58.4%) | 56 (46.7%) |
| 15 Years | 8 (100.0%) | 23 (62.2%) |
| 16 and 17 Years | 48 (38.7%) | 43 (86.0%) |
| 18 to 24 Years | 10 (9.5%) | 96 (58.9%) |
| 25 to 34 Years | 59 (34.3%) | 58 (37.2%) |
| 35 to 44 Years | 52 (13.7%) | 74 (26.2%) |
| 45 to 54 Years | 20 (6.6%) | 54 (24.9%) |
| 55 to 64 Years | 274 (48.4%) | 207 (40.0%) |
| 65 to 74 Years | 67 (23.5%) | 38 (10.6%) |
| 75 Years and over | 6 (2.9%) | 8 (3.8%) |
| Total | 704 (28.1%) | 728 (30.5%) |
Income Above Poverty by Sex and Age in Needles
According to the poverty statistics in Needles, males aged 75 years and over and females aged under 5 years are the age groups that are most secure financially, with 97.1% of males and 100.0% of females in these age groups living above the poverty line.
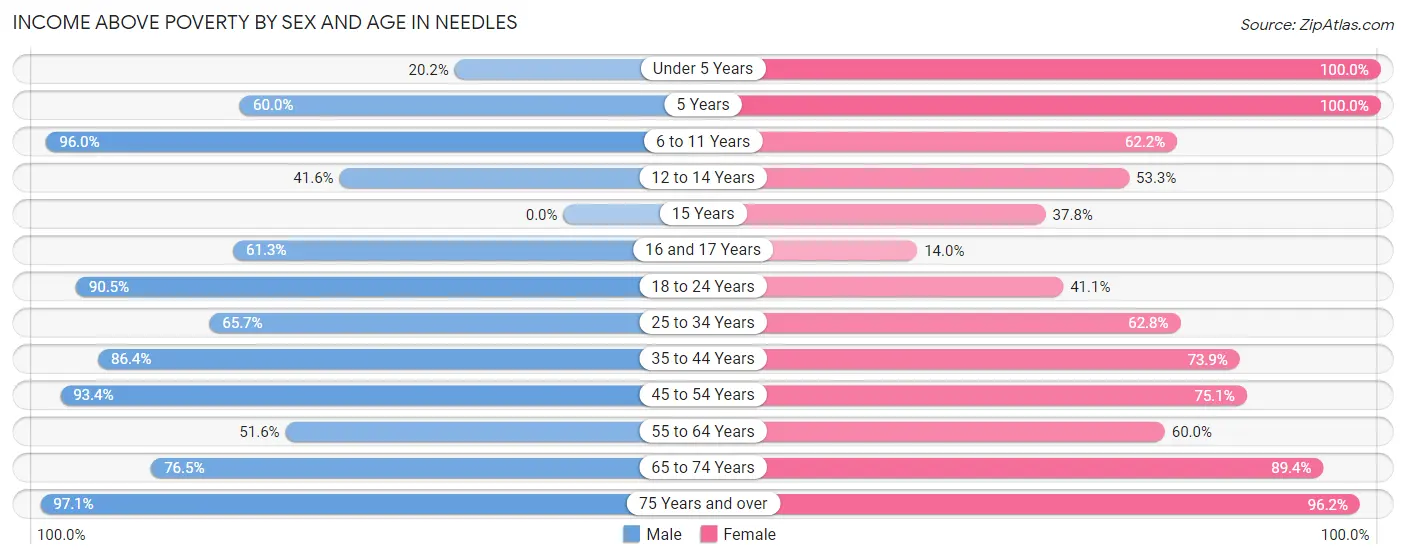
| Age Bracket | Male | Female |
| Under 5 Years | 23 (20.2%) | 72 (100.0%) |
| 5 Years | 18 (60.0%) | 22 (100.0%) |
| 6 to 11 Years | 119 (96.0%) | 117 (62.2%) |
| 12 to 14 Years | 37 (41.6%) | 64 (53.3%) |
| 15 Years | 0 (0.0%) | 14 (37.8%) |
| 16 and 17 Years | 76 (61.3%) | 7 (14.0%) |
| 18 to 24 Years | 95 (90.5%) | 67 (41.1%) |
| 25 to 34 Years | 113 (65.7%) | 98 (62.8%) |
| 35 to 44 Years | 329 (86.4%) | 209 (73.9%) |
| 45 to 54 Years | 282 (93.4%) | 163 (75.1%) |
| 55 to 64 Years | 292 (51.6%) | 310 (60.0%) |
| 65 to 74 Years | 218 (76.5%) | 319 (89.4%) |
| 75 Years and over | 199 (97.1%) | 200 (96.2%) |
| Total | 1,801 (71.9%) | 1,662 (69.5%) |
Income Below Poverty Among Married-Couple Families in Needles
The poverty statistics for married-couple families in Needles show that 20.1% or 171 of the total 850 families live below the poverty line. Families with no children have the highest poverty rate of 20.9%, comprising of 130 families. On the other hand, families with 3 or 4 children have the lowest poverty rate of 12.8%, which includes 6 families.
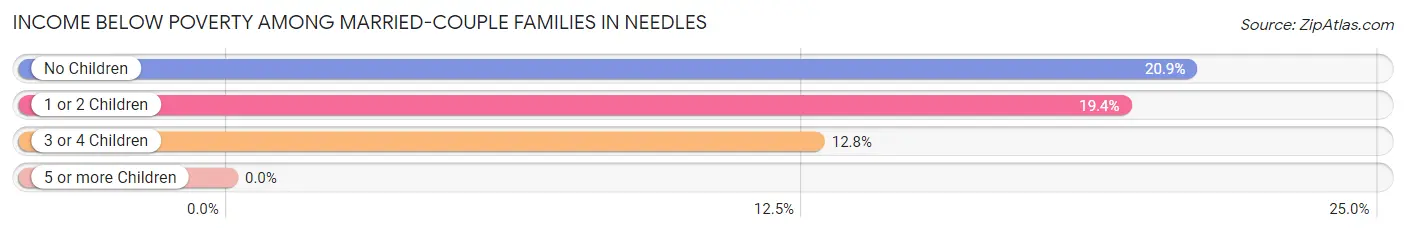
| Children | Above Poverty | Below Poverty |
| No Children | 493 (79.1%) | 130 (20.9%) |
| 1 or 2 Children | 145 (80.6%) | 35 (19.4%) |
| 3 or 4 Children | 41 (87.2%) | 6 (12.8%) |
| 5 or more Children | 0 (0.0%) | 0 (0.0%) |
| Total | 679 (79.9%) | 171 (20.1%) |
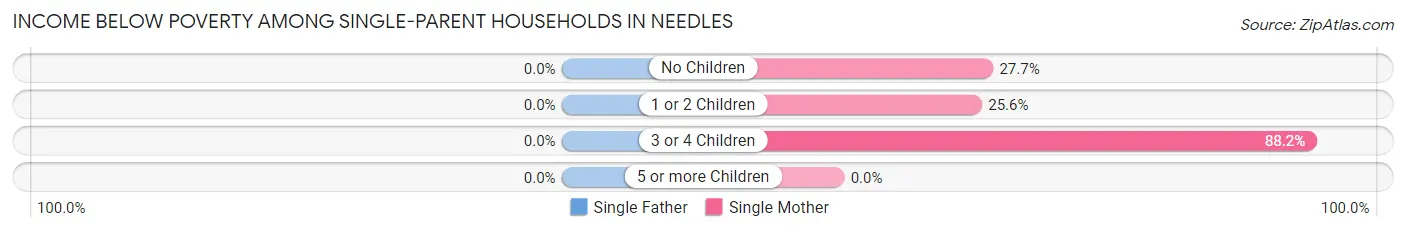
Income Below Poverty Among Single-Parent Households in Needles
| Children | Single Father | Single Mother |
| No Children | 0 (0.0%) | 56 (27.7%) |
| 1 or 2 Children | 0 (0.0%) | 20 (25.6%) |
| 3 or 4 Children | 0 (0.0%) | 82 (88.2%) |
| 5 or more Children | 0 (0.0%) | 0 (0.0%) |
| Total | 0 (0.0%) | 158 (42.4%) |
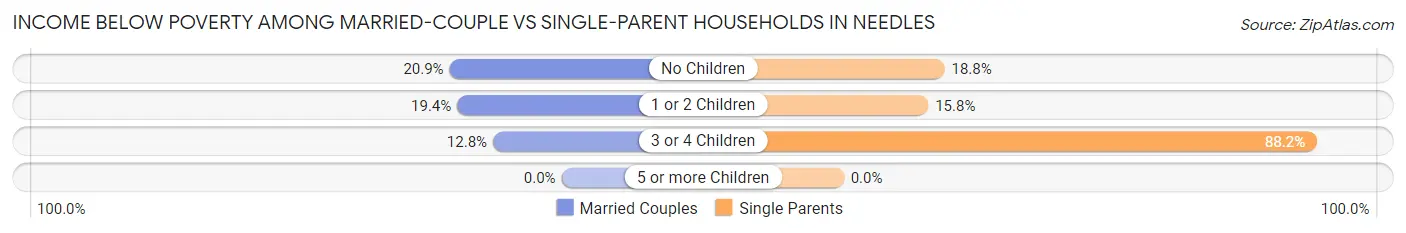
Income Below Poverty Among Married-Couple vs Single-Parent Households in Needles
The poverty data for Needles shows that 171 of the married-couple family households (20.1%) and 158 of the single-parent households (30.5%) are living below the poverty level. Within the married-couple family households, those with no children have the highest poverty rate, with 130 households (20.9%) falling below the poverty line. Among the single-parent households, those with 3 or 4 children have the highest poverty rate, with 82 household (88.2%) living below poverty.
| Children | Married-Couple Families | Single-Parent Households |
| No Children | 130 (20.9%) | 56 (18.8%) |
| 1 or 2 Children | 35 (19.4%) | 20 (15.8%) |
| 3 or 4 Children | 6 (12.8%) | 82 (88.2%) |
| 5 or more Children | 0 (0.0%) | 0 (0.0%) |
| Total | 171 (20.1%) | 158 (30.5%) |
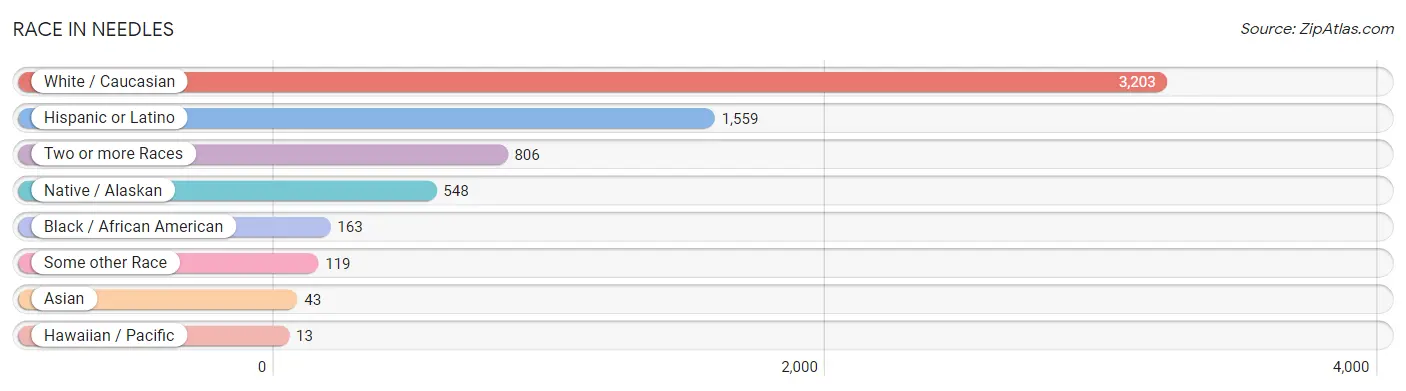
Race in Needles
The most populous races in Needles are White / Caucasian (3,203 | 65.4%), Hispanic or Latino (1,559 | 31.9%), and Two or more Races (806 | 16.5%).
| Race | # Population | % Population |
| Asian | 43 | 0.9% |
| Black / African American | 163 | 3.3% |
| Hawaiian / Pacific | 13 | 0.3% |
| Hispanic or Latino | 1,559 | 31.9% |
| Native / Alaskan | 548 | 11.2% |
| White / Caucasian | 3,203 | 65.4% |
| Two or more Races | 806 | 16.5% |
| Some other Race | 119 | 2.4% |
| Total | 4,895 | 100.0% |
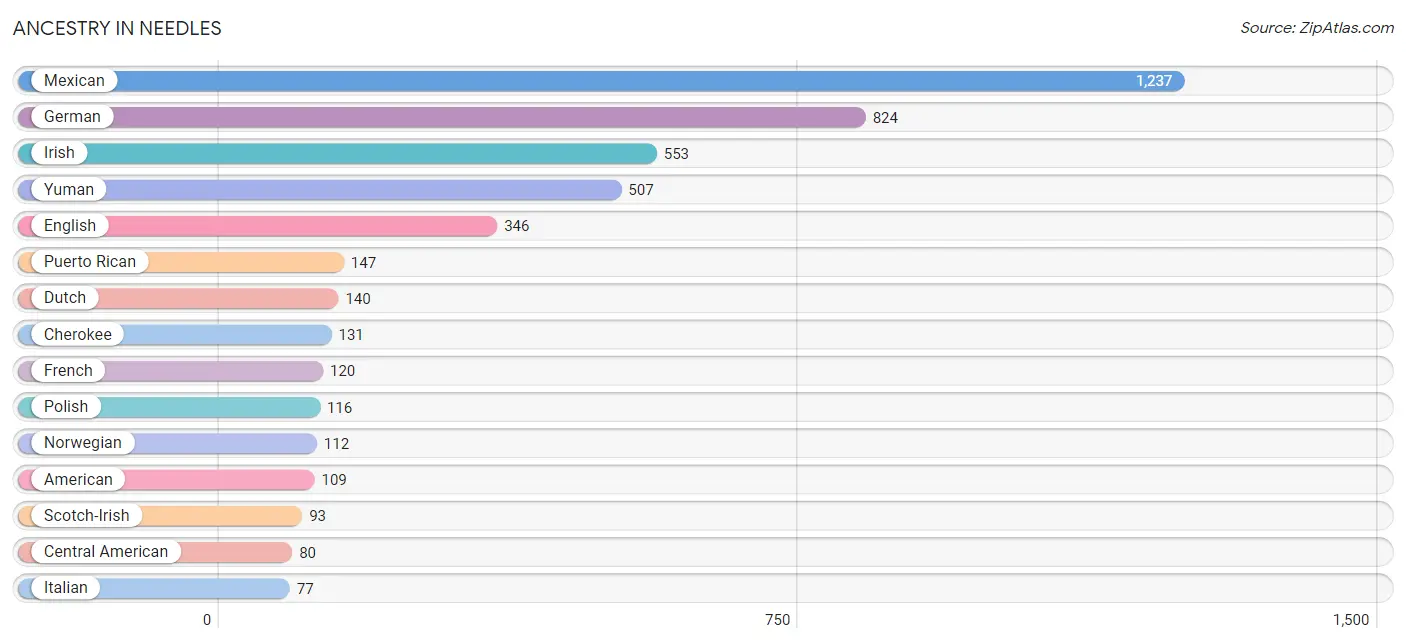
Ancestry in Needles
The most populous ancestries reported in Needles are Mexican (1,237 | 25.3%), German (824 | 16.8%), Irish (553 | 11.3%), Yuman (507 | 10.4%), and English (346 | 7.1%), together accounting for 70.8% of all Needles residents.
| Ancestry | # Population | % Population |
| American | 109 | 2.2% |
| Austrian | 10 | 0.2% |
| Blackfeet | 6 | 0.1% |
| British | 8 | 0.2% |
| Canadian | 12 | 0.3% |
| Central American | 80 | 1.6% |
| Cherokee | 131 | 2.7% |
| Croatian | 10 | 0.2% |
| Czech | 15 | 0.3% |
| Danish | 12 | 0.3% |
| Dutch | 140 | 2.9% |
| English | 346 | 7.1% |
| European | 22 | 0.4% |
| Finnish | 28 | 0.6% |
| French | 120 | 2.5% |
| German | 824 | 16.8% |
| Guatemalan | 65 | 1.3% |
| Indian (Asian) | 26 | 0.5% |
| Iranian | 10 | 0.2% |
| Irish | 553 | 11.3% |
| Italian | 77 | 1.6% |
| Korean | 3 | 0.1% |
| Mexican | 1,237 | 25.3% |
| Mexican American Indian | 24 | 0.5% |
| Native Hawaiian | 19 | 0.4% |
| Norwegian | 112 | 2.3% |
| Paiute | 47 | 1.0% |
| Pima | 39 | 0.8% |
| Polish | 116 | 2.4% |
| Portuguese | 12 | 0.3% |
| Puerto Rican | 147 | 3.0% |
| Russian | 58 | 1.2% |
| Salvadoran | 15 | 0.3% |
| Scandinavian | 15 | 0.3% |
| Scotch-Irish | 93 | 1.9% |
| Scottish | 67 | 1.4% |
| Slavic | 16 | 0.3% |
| Spaniard | 60 | 1.2% |
| Spanish | 35 | 0.7% |
| Swedish | 7 | 0.1% |
| Thai | 14 | 0.3% |
| Welsh | 42 | 0.9% |
| Yugoslavian | 3 | 0.1% |
| Yuman | 507 | 10.4% | View All 44 Rows |
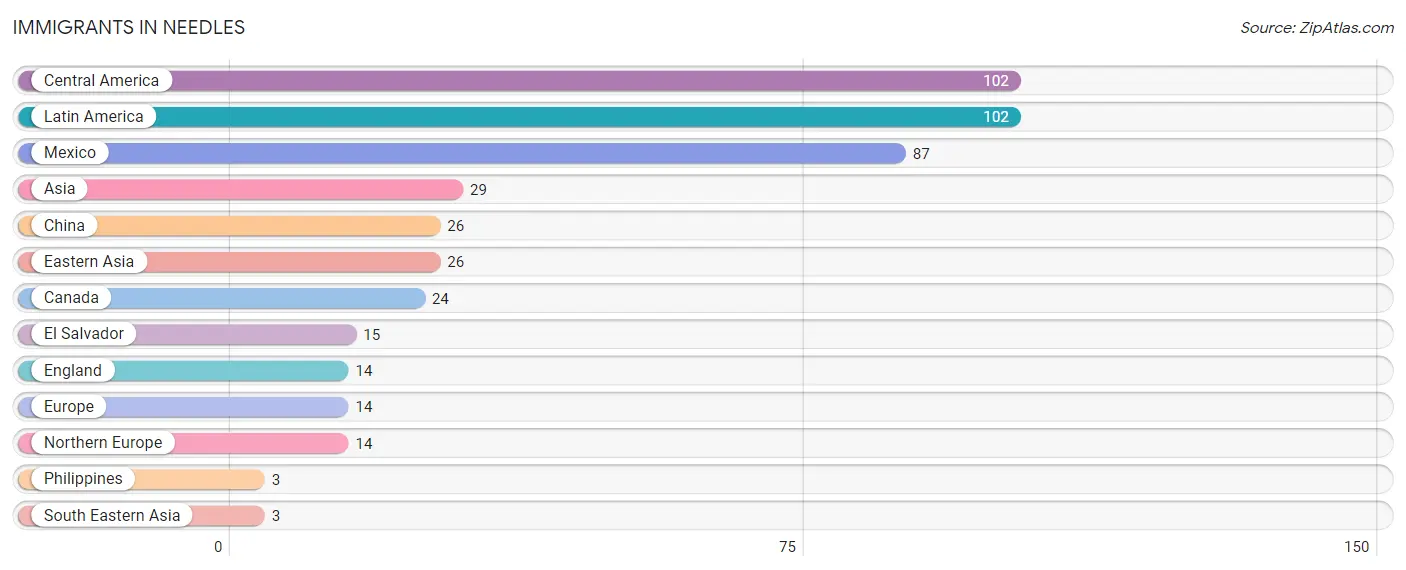
Immigrants in Needles
The most numerous immigrant groups reported in Needles came from Central America (102 | 2.1%), Latin America (102 | 2.1%), Mexico (87 | 1.8%), Asia (29 | 0.6%), and China (26 | 0.5%), together accounting for 7.1% of all Needles residents.
| Immigration Origin | # Population | % Population |
| Asia | 29 | 0.6% |
| Canada | 24 | 0.5% |
| Central America | 102 | 2.1% |
| China | 26 | 0.5% |
| Eastern Asia | 26 | 0.5% |
| El Salvador | 15 | 0.3% |
| England | 14 | 0.3% |
| Europe | 14 | 0.3% |
| Latin America | 102 | 2.1% |
| Mexico | 87 | 1.8% |
| Northern Europe | 14 | 0.3% |
| Philippines | 3 | 0.1% |
| South Eastern Asia | 3 | 0.1% | View All 13 Rows |
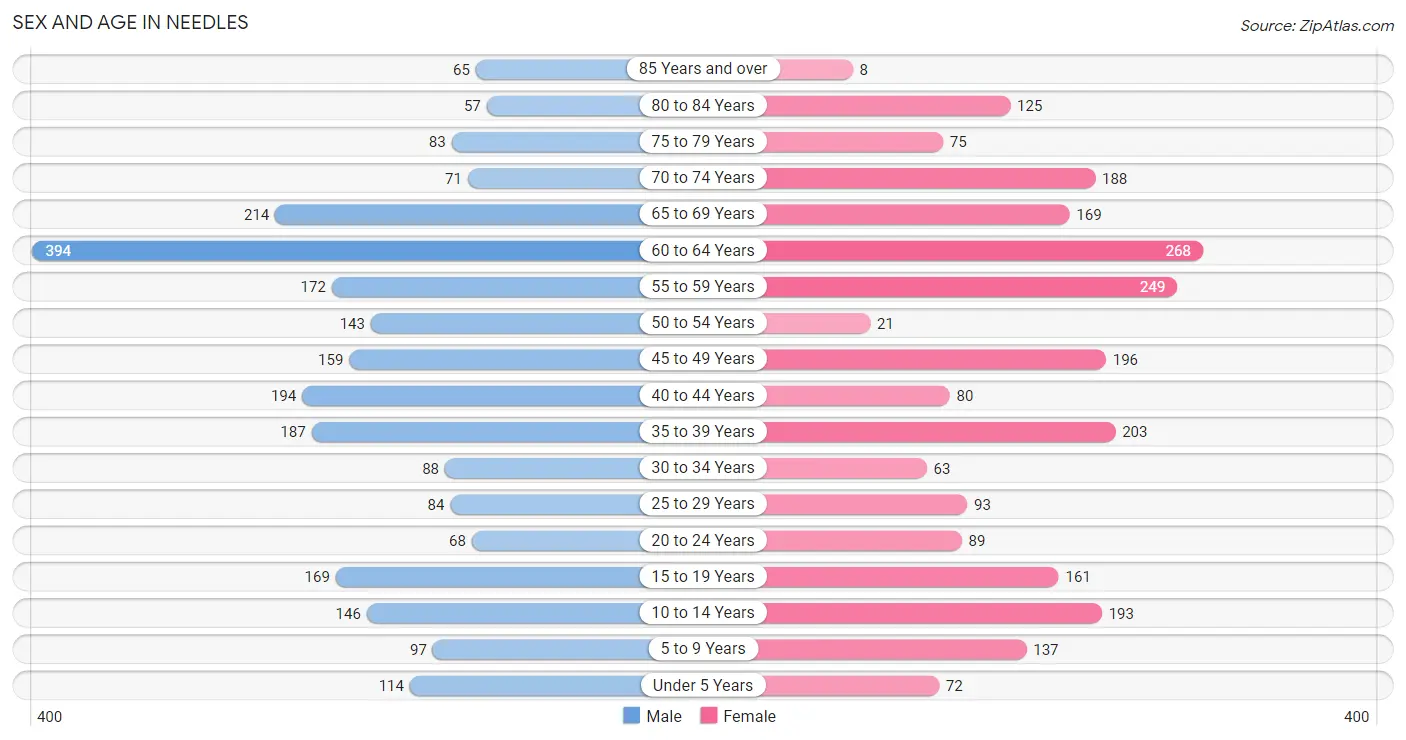
Sex and Age in Needles
Sex and Age in Needles
The most populous age groups in Needles are 60 to 64 Years (394 | 15.7%) for men and 60 to 64 Years (268 | 11.2%) for women.
| Age Bracket | Male | Female |
| Under 5 Years | 114 (4.5%) | 72 (3.0%) |
| 5 to 9 Years | 97 (3.9%) | 137 (5.7%) |
| 10 to 14 Years | 146 (5.8%) | 193 (8.1%) |
| 15 to 19 Years | 169 (6.8%) | 161 (6.7%) |
| 20 to 24 Years | 68 (2.7%) | 89 (3.7%) |
| 25 to 29 Years | 84 (3.4%) | 93 (3.9%) |
| 30 to 34 Years | 88 (3.5%) | 63 (2.6%) |
| 35 to 39 Years | 187 (7.5%) | 203 (8.5%) |
| 40 to 44 Years | 194 (7.7%) | 80 (3.4%) |
| 45 to 49 Years | 159 (6.4%) | 196 (8.2%) |
| 50 to 54 Years | 143 (5.7%) | 21 (0.9%) |
| 55 to 59 Years | 172 (6.9%) | 249 (10.4%) |
| 60 to 64 Years | 394 (15.7%) | 268 (11.2%) |
| 65 to 69 Years | 214 (8.5%) | 169 (7.1%) |
| 70 to 74 Years | 71 (2.8%) | 188 (7.9%) |
| 75 to 79 Years | 83 (3.3%) | 75 (3.1%) |
| 80 to 84 Years | 57 (2.3%) | 125 (5.2%) |
| 85 Years and over | 65 (2.6%) | 8 (0.3%) |
| Total | 2,505 (100.0%) | 2,390 (100.0%) |
Families and Households in Needles
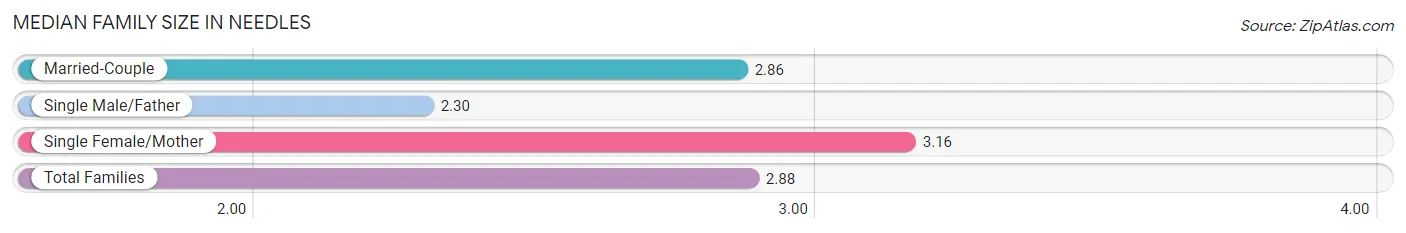
Median Family Size in Needles
The median family size in Needles is 2.88 persons per family, with single female/mother families (373 | 27.3%) accounting for the largest median family size of 3.16 persons per family. On the other hand, single male/father families (145 | 10.6%) represent the smallest median family size with 2.30 persons per family.
| Family Type | # Families | Family Size |
| Married-Couple | 850 (62.1%) | 2.86 |
| Single Male/Father | 145 (10.6%) | 2.30 |
| Single Female/Mother | 373 (27.3%) | 3.16 |
| Total Families | 1,368 (100.0%) | 2.88 |
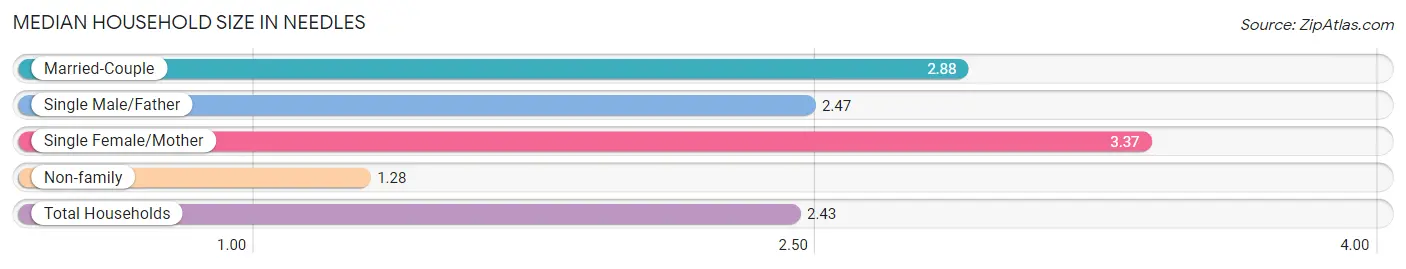
Median Household Size in Needles
The median household size in Needles is 2.43 persons per household, with single female/mother households (373 | 18.5%) accounting for the largest median household size of 3.37 persons per household. non-family households (648 | 32.1%) represent the smallest median household size with 1.28 persons per household.
| Household Type | # Households | Household Size |
| Married-Couple | 850 (42.2%) | 2.88 |
| Single Male/Father | 145 (7.2%) | 2.47 |
| Single Female/Mother | 373 (18.5%) | 3.37 |
| Non-family | 648 (32.1%) | 1.28 |
| Total Households | 2,016 (100.0%) | 2.43 |
Household Size by Marriage Status in Needles
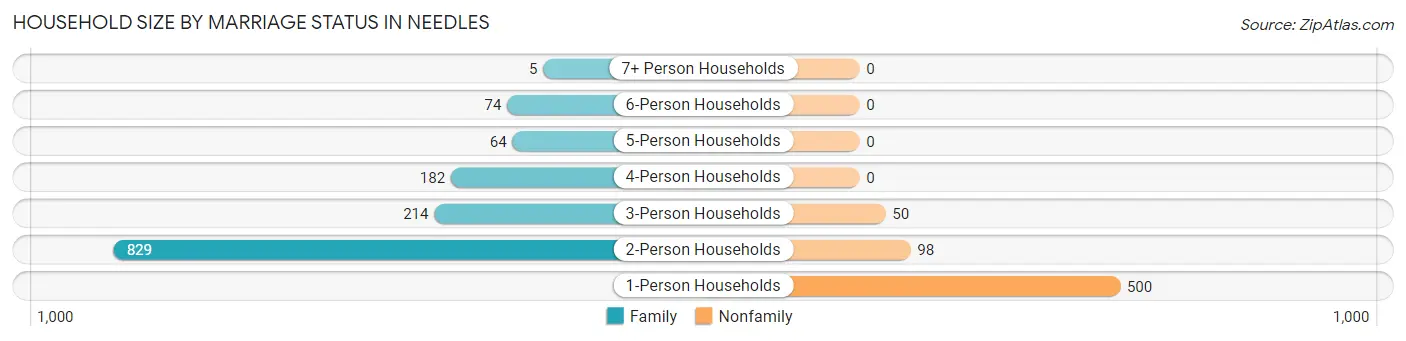
Out of a total of 2,016 households in Needles, 1,368 (67.9%) are family households, while 648 (32.1%) are nonfamily households. The most numerous type of family households are 2-person households, comprising 829, and the most common type of nonfamily households are 1-person households, comprising 500.
| Household Size | Family Households | Nonfamily Households |
| 1-Person Households | - | 500 (24.8%) |
| 2-Person Households | 829 (41.1%) | 98 (4.9%) |
| 3-Person Households | 214 (10.6%) | 50 (2.5%) |
| 4-Person Households | 182 (9.0%) | 0 (0.0%) |
| 5-Person Households | 64 (3.2%) | 0 (0.0%) |
| 6-Person Households | 74 (3.7%) | 0 (0.0%) |
| 7+ Person Households | 5 (0.3%) | 0 (0.0%) |
| Total | 1,368 (67.9%) | 648 (32.1%) |
Female Fertility in Needles
Fertility by Age in Needles
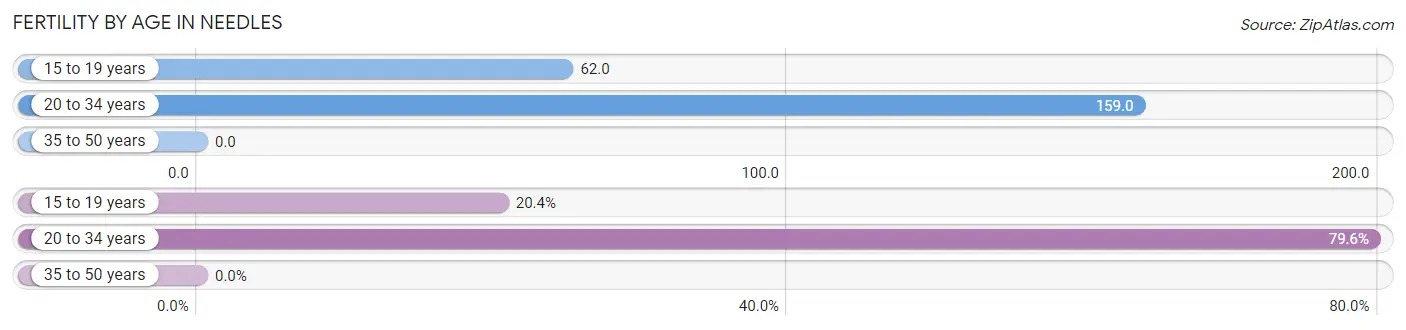
Average fertility rate in Needles is 55.0 births per 1,000 women. Women in the age bracket of 20 to 34 years have the highest fertility rate with 159.0 births per 1,000 women. Women in the age bracket of 20 to 34 years acount for 79.6% of all women with births.
| Age Bracket | Women with Births | Births / 1,000 Women |
| 15 to 19 years | 10 (20.4%) | 62.0 |
| 20 to 34 years | 39 (79.6%) | 159.0 |
| 35 to 50 years | 0 (0.0%) | 0.0 |
| Total | 49 (100.0%) | 55.0 |
Fertility by Age by Marriage Status in Needles
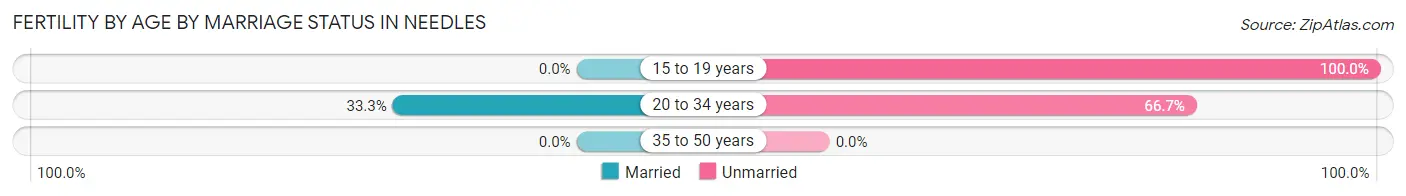
26.5% of women with births (49) in Needles are married. The highest percentage of unmarried women with births falls into 15 to 19 years age bracket with 100.0% of them unmarried at the time of birth, while the lowest percentage of unmarried women with births belong to 20 to 34 years age bracket with 66.7% of them unmarried.
| Age Bracket | Married | Unmarried |
| 15 to 19 years | 0 (0.0%) | 10 (100.0%) |
| 20 to 34 years | 13 (33.3%) | 26 (66.7%) |
| 35 to 50 years | 0 (0.0%) | 0 (0.0%) |
| Total | 13 (26.5%) | 36 (73.5%) |
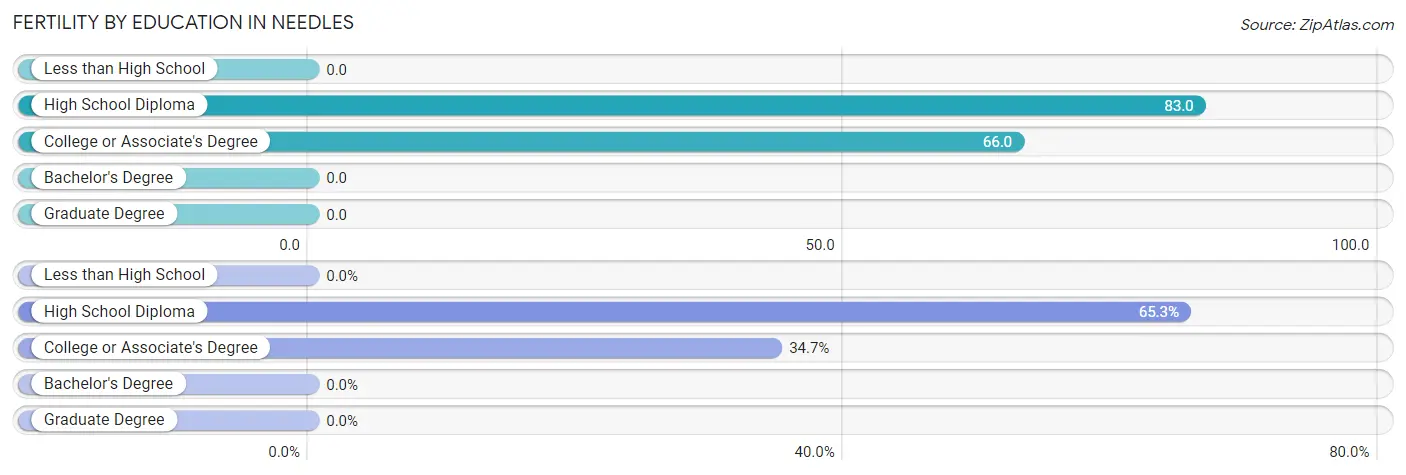
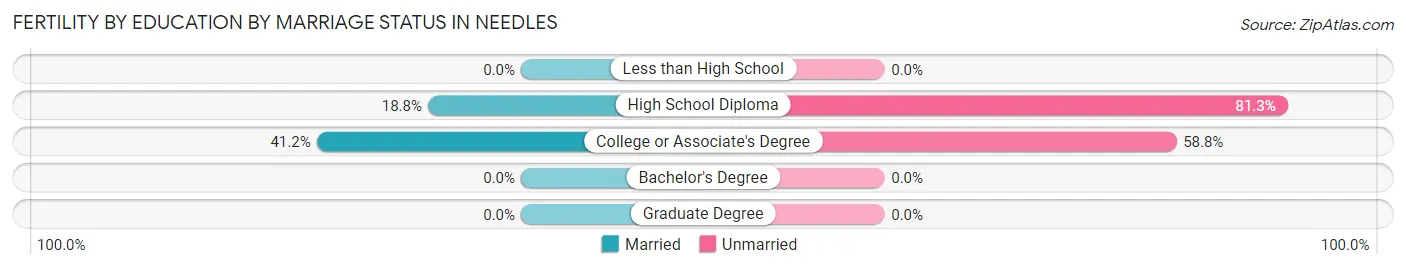
Fertility by Education in Needles
| Educational Attainment | Women with Births | Births / 1,000 Women |
| Less than High School | 0 (0.0%) | 0.0 |
| High School Diploma | 32 (65.3%) | 83.0 |
| College or Associate's Degree | 17 (34.7%) | 66.0 |
| Bachelor's Degree | 0 (0.0%) | 0.0 |
| Graduate Degree | 0 (0.0%) | 0.0 |
| Total | 49 (100.0%) | 55.0 |
Fertility by Education by Marriage Status in Needles
73.5% of women with births in Needles are unmarried. Women with the educational attainment of college or associate's degree are most likely to be married with 41.2% of them married at childbirth, while women with the educational attainment of high school diploma are least likely to be married with 81.2% of them unmarried at childbirth.
| Educational Attainment | Married | Unmarried |
| Less than High School | 0 (0.0%) | 0 (0.0%) |
| High School Diploma | 6 (18.8%) | 26 (81.2%) |
| College or Associate's Degree | 7 (41.2%) | 10 (58.8%) |
| Bachelor's Degree | 0 (0.0%) | 0 (0.0%) |
| Graduate Degree | 0 (0.0%) | 0 (0.0%) |
| Total | 13 (26.5%) | 36 (73.5%) |
Employment Characteristics in Needles
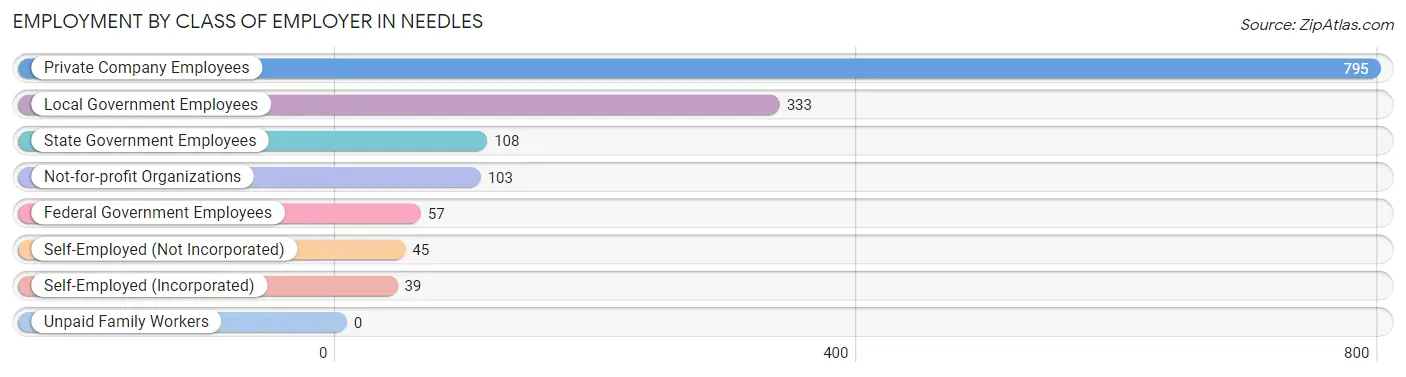
Employment by Class of Employer in Needles
Among the 1,480 employed individuals in Needles, private company employees (795 | 53.7%), local government employees (333 | 22.5%), and state government employees (108 | 7.3%) make up the most common classes of employment.
| Employer Class | # Employees | % Employees |
| Private Company Employees | 795 | 53.7% |
| Self-Employed (Incorporated) | 39 | 2.6% |
| Self-Employed (Not Incorporated) | 45 | 3.0% |
| Not-for-profit Organizations | 103 | 7.0% |
| Local Government Employees | 333 | 22.5% |
| State Government Employees | 108 | 7.3% |
| Federal Government Employees | 57 | 3.8% |
| Unpaid Family Workers | 0 | 0.0% |
| Total | 1,480 | 100.0% |
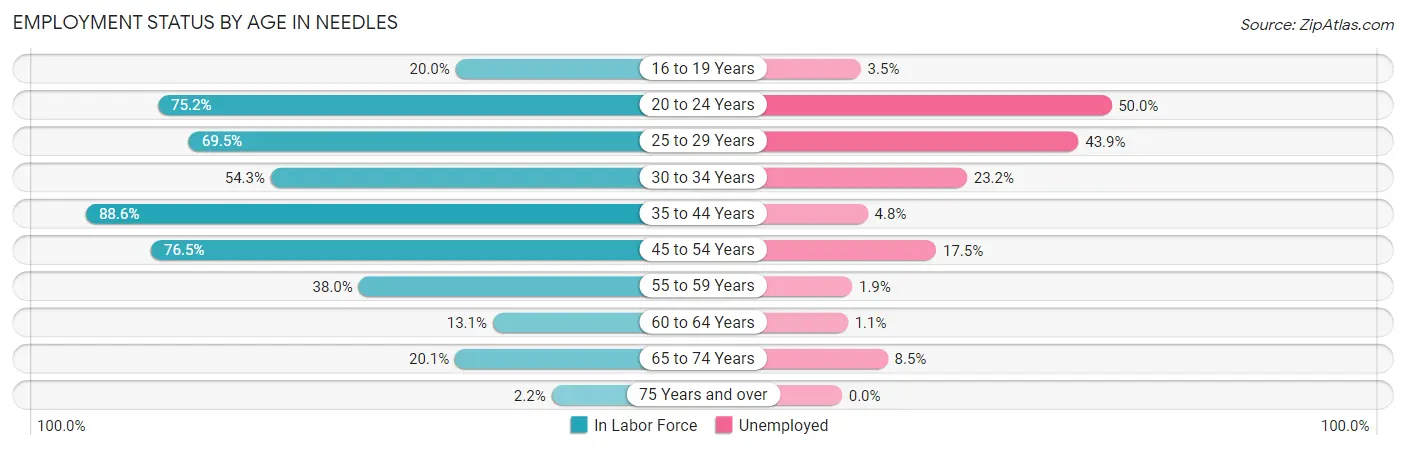
Employment Status by Age in Needles
According to the labor force statistics for Needles, out of the total population over 16 years of age (4,091), 42.8% or 1,751 individuals are in the labor force, with 14.1% or 247 of them unemployed. The age group with the highest labor force participation rate is 35 to 44 years, with 88.6% or 588 individuals in the labor force. Within the labor force, the 20 to 24 years age range has the highest percentage of unemployed individuals, with 50.0% or 59 of them being unemployed.
| Age Bracket | In Labor Force | Unemployed |
| 16 to 19 Years | 57 (20.0%) | 2 (3.5%) |
| 20 to 24 Years | 118 (75.2%) | 59 (50.0%) |
| 25 to 29 Years | 123 (69.5%) | 54 (43.9%) |
| 30 to 34 Years | 82 (54.3%) | 19 (23.2%) |
| 35 to 44 Years | 588 (88.6%) | 28 (4.8%) |
| 45 to 54 Years | 397 (76.5%) | 69 (17.5%) |
| 55 to 59 Years | 160 (38.0%) | 3 (1.9%) |
| 60 to 64 Years | 87 (13.1%) | 1 (1.1%) |
| 65 to 74 Years | 129 (20.1%) | 11 (8.5%) |
| 75 Years and over | 9 (2.2%) | 0 (0.0%) |
| Total | 1,751 (42.8%) | 247 (14.1%) |
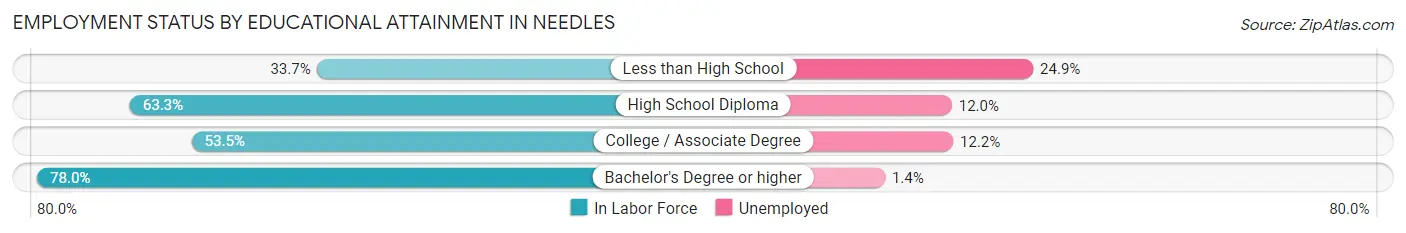
Employment Status by Educational Attainment in Needles
According to labor force statistics for Needles, 55.4% of individuals (1,437) out of the total population between 25 and 64 years of age (2,594) are in the labor force, with 12.1% or 174 of them being unemployed. The group with the highest labor force participation rate are those with the educational attainment of bachelor's degree or higher, with 78.0% or 213 individuals in the labor force. Within the labor force, individuals with less than high school education have the highest percentage of unemployment, with 24.9% or 46 of them being unemployed.
| Educational Attainment | In Labor Force | Unemployed |
| Less than High School | 185 (33.7%) | 137 (24.9%) |
| High School Diploma | 588 (63.3%) | 111 (12.0%) |
| College / Associate Degree | 451 (53.5%) | 103 (12.2%) |
| Bachelor's Degree or higher | 213 (78.0%) | 4 (1.4%) |
| Total | 1,437 (55.4%) | 314 (12.1%) |
Employment Occupations by Sex in Needles
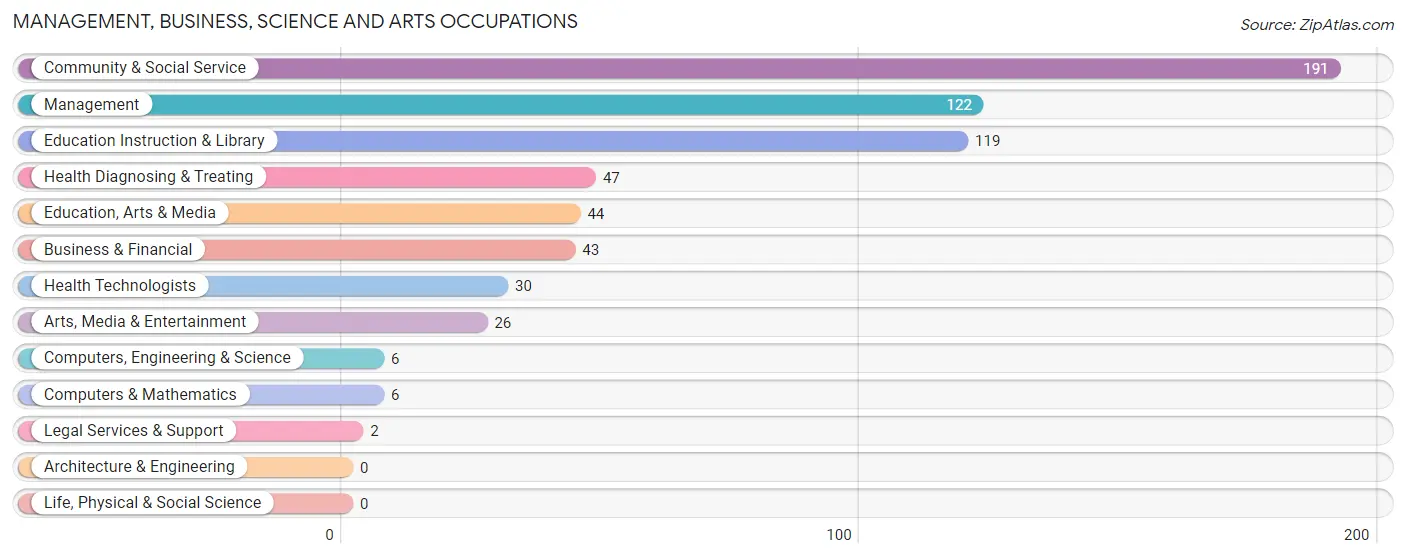
Management, Business, Science and Arts Occupations
The most common Management, Business, Science and Arts occupations in Needles are Community & Social Service (191 | 12.7%), Management (122 | 8.1%), Education Instruction & Library (119 | 7.9%), Health Diagnosing & Treating (47 | 3.1%), and Education, Arts & Media (44 | 2.9%).
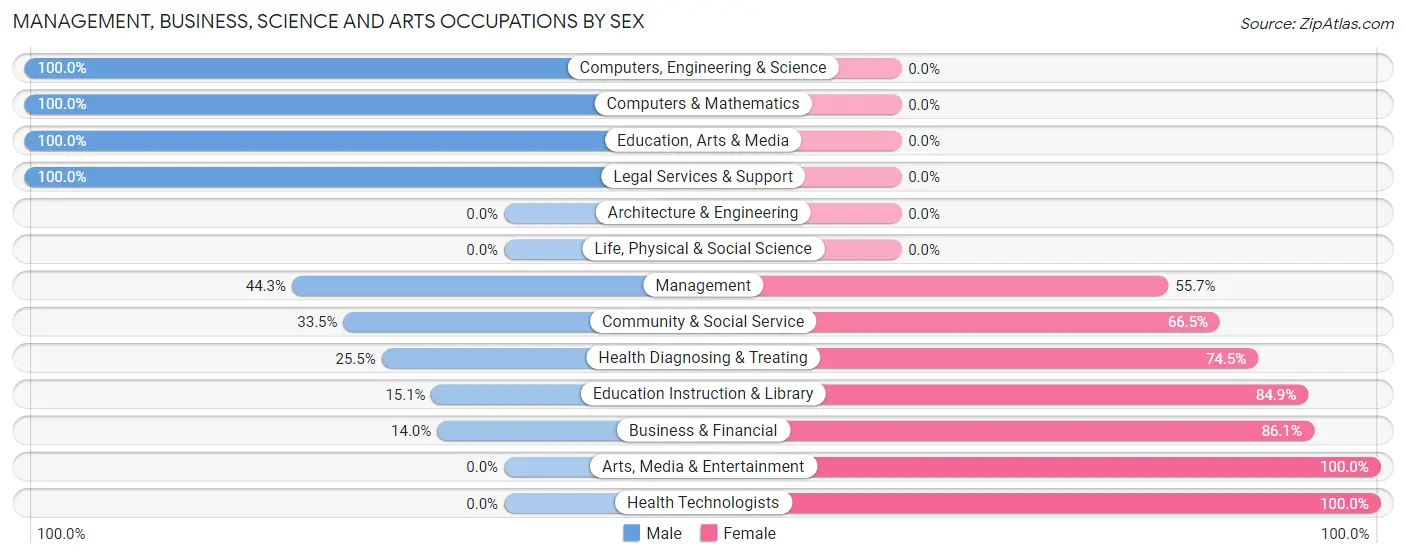
Management, Business, Science and Arts Occupations by Sex
Within the Management, Business, Science and Arts occupations in Needles, the most male-oriented occupations are Computers, Engineering & Science (100.0%), Computers & Mathematics (100.0%), and Education, Arts & Media (100.0%), while the most female-oriented occupations are Arts, Media & Entertainment (100.0%), Health Technologists (100.0%), and Business & Financial (86.1%).
| Occupation | Male | Female |
| Management | 54 (44.3%) | 68 (55.7%) |
| Business & Financial | 6 (14.0%) | 37 (86.1%) |
| Computers, Engineering & Science | 6 (100.0%) | 0 (0.0%) |
| Computers & Mathematics | 6 (100.0%) | 0 (0.0%) |
| Architecture & Engineering | 0 (0.0%) | 0 (0.0%) |
| Life, Physical & Social Science | 0 (0.0%) | 0 (0.0%) |
| Community & Social Service | 64 (33.5%) | 127 (66.5%) |
| Education, Arts & Media | 44 (100.0%) | 0 (0.0%) |
| Legal Services & Support | 2 (100.0%) | 0 (0.0%) |
| Education Instruction & Library | 18 (15.1%) | 101 (84.9%) |
| Arts, Media & Entertainment | 0 (0.0%) | 26 (100.0%) |
| Health Diagnosing & Treating | 12 (25.5%) | 35 (74.5%) |
| Health Technologists | 0 (0.0%) | 30 (100.0%) |
| Total (Category) | 142 (34.7%) | 267 (65.3%) |
| Total (Overall) | 877 (58.4%) | 624 (41.6%) |
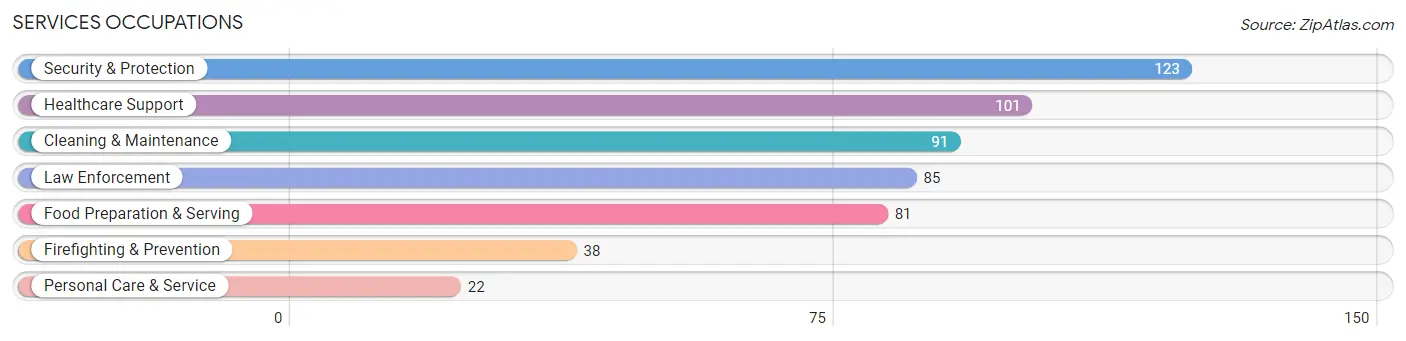
Services Occupations
The most common Services occupations in Needles are Security & Protection (123 | 8.2%), Healthcare Support (101 | 6.7%), Cleaning & Maintenance (91 | 6.1%), Law Enforcement (85 | 5.7%), and Food Preparation & Serving (81 | 5.4%).
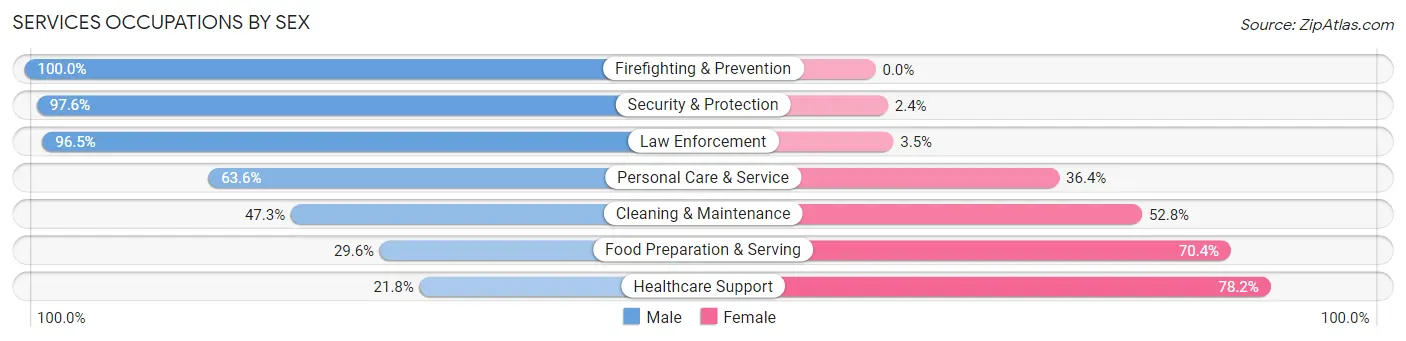
Services Occupations by Sex
Within the Services occupations in Needles, the most male-oriented occupations are Firefighting & Prevention (100.0%), Security & Protection (97.6%), and Law Enforcement (96.5%), while the most female-oriented occupations are Healthcare Support (78.2%), Food Preparation & Serving (70.4%), and Cleaning & Maintenance (52.7%).
| Occupation | Male | Female |
| Healthcare Support | 22 (21.8%) | 79 (78.2%) |
| Security & Protection | 120 (97.6%) | 3 (2.4%) |
| Firefighting & Prevention | 38 (100.0%) | 0 (0.0%) |
| Law Enforcement | 82 (96.5%) | 3 (3.5%) |
| Food Preparation & Serving | 24 (29.6%) | 57 (70.4%) |
| Cleaning & Maintenance | 43 (47.2%) | 48 (52.7%) |
| Personal Care & Service | 14 (63.6%) | 8 (36.4%) |
| Total (Category) | 223 (53.3%) | 195 (46.7%) |
| Total (Overall) | 877 (58.4%) | 624 (41.6%) |
Sales and Office Occupations
The most common Sales and Office occupations in Needles are Sales & Related (108 | 7.2%), and Office & Administration (102 | 6.8%).
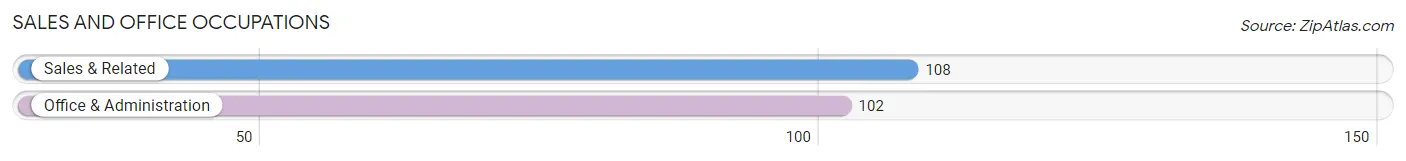
Sales and Office Occupations by Sex
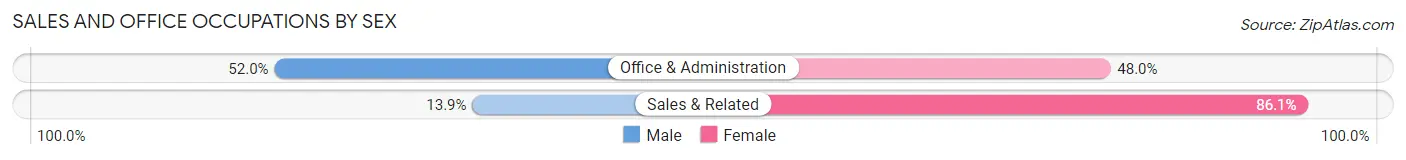
| Occupation | Male | Female |
| Sales & Related | 15 (13.9%) | 93 (86.1%) |
| Office & Administration | 53 (52.0%) | 49 (48.0%) |
| Total (Category) | 68 (32.4%) | 142 (67.6%) |
| Total (Overall) | 877 (58.4%) | 624 (41.6%) |
Natural Resources, Construction and Maintenance Occupations
The most common Natural Resources, Construction and Maintenance occupations in Needles are Construction & Extraction (89 | 5.9%), and Installation, Maintenance & Repair (81 | 5.4%).
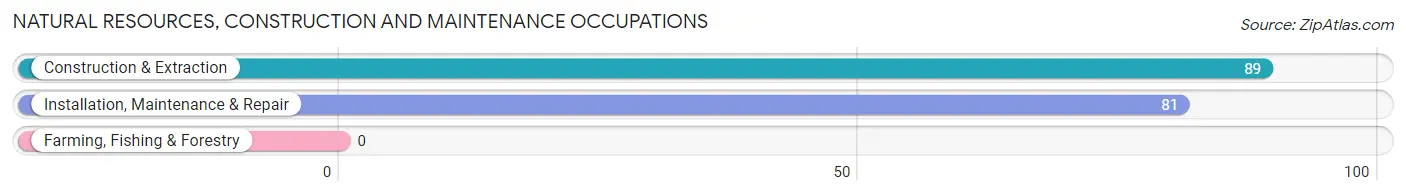
Natural Resources, Construction and Maintenance Occupations by Sex
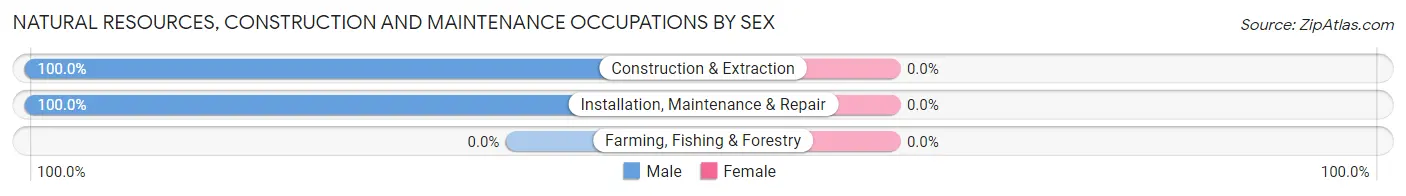
| Occupation | Male | Female |
| Farming, Fishing & Forestry | 0 (0.0%) | 0 (0.0%) |
| Construction & Extraction | 89 (100.0%) | 0 (0.0%) |
| Installation, Maintenance & Repair | 81 (100.0%) | 0 (0.0%) |
| Total (Category) | 170 (100.0%) | 0 (0.0%) |
| Total (Overall) | 877 (58.4%) | 624 (41.6%) |
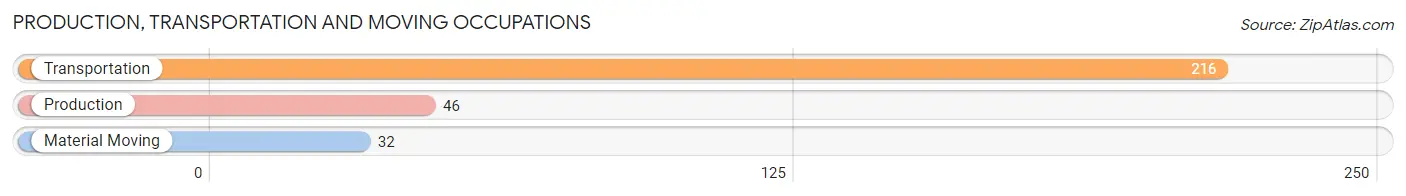
Production, Transportation and Moving Occupations
The most common Production, Transportation and Moving occupations in Needles are Transportation (216 | 14.4%), Production (46 | 3.1%), and Material Moving (32 | 2.1%).
Production, Transportation and Moving Occupations by Sex
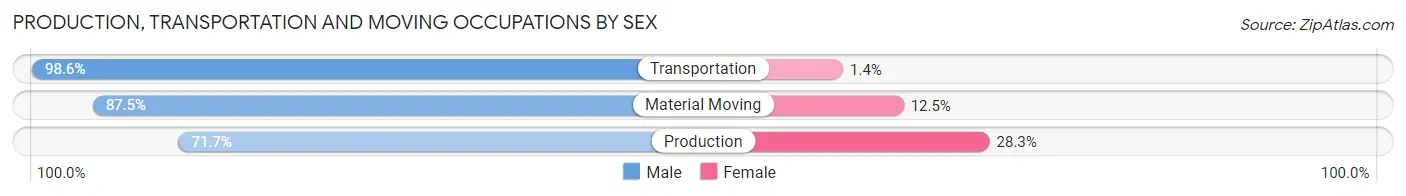
| Occupation | Male | Female |
| Production | 33 (71.7%) | 13 (28.3%) |
| Transportation | 213 (98.6%) | 3 (1.4%) |
| Material Moving | 28 (87.5%) | 4 (12.5%) |
| Total (Category) | 274 (93.2%) | 20 (6.8%) |
| Total (Overall) | 877 (58.4%) | 624 (41.6%) |
Employment Industries by Sex in Needles
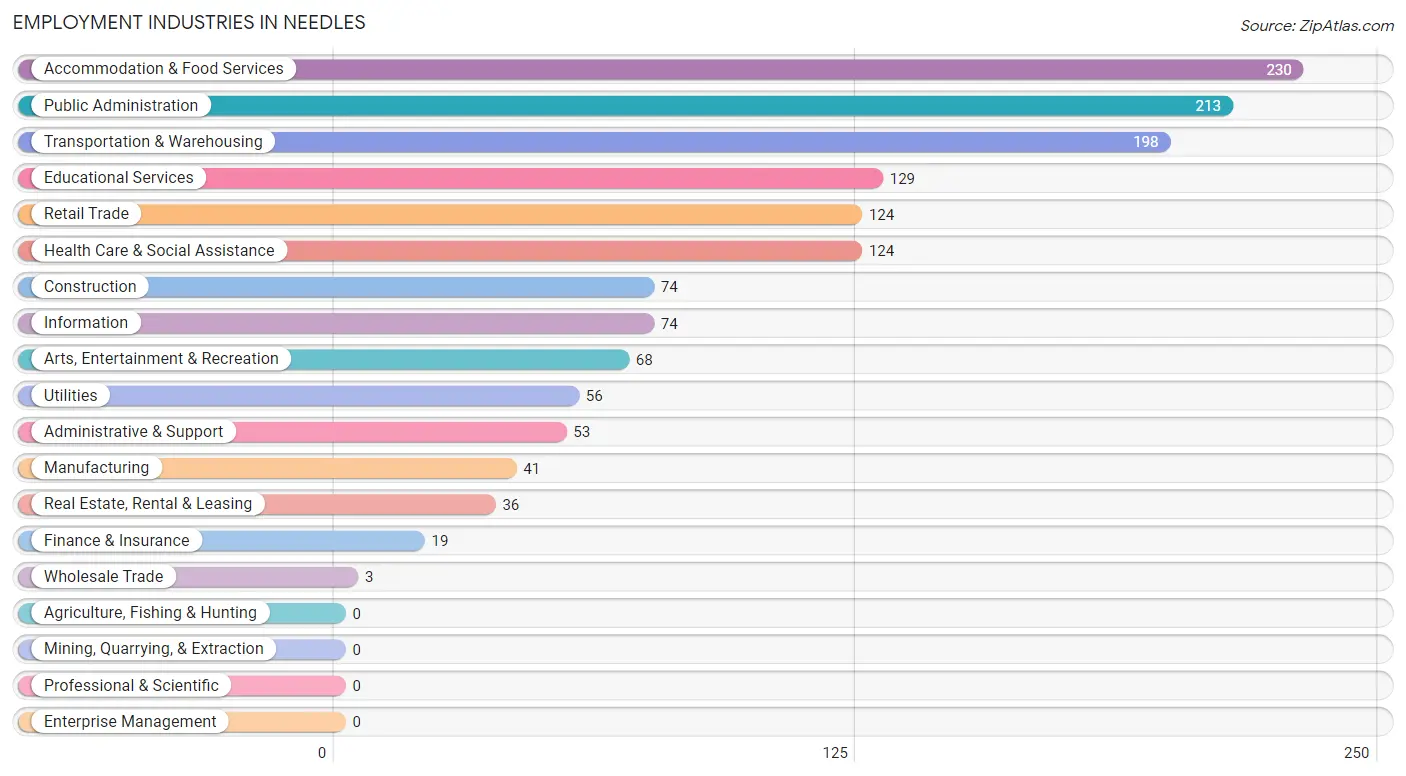
Employment Industries in Needles
The major employment industries in Needles include Accommodation & Food Services (230 | 15.3%), Public Administration (213 | 14.2%), Transportation & Warehousing (198 | 13.2%), Educational Services (129 | 8.6%), and Retail Trade (124 | 8.3%).
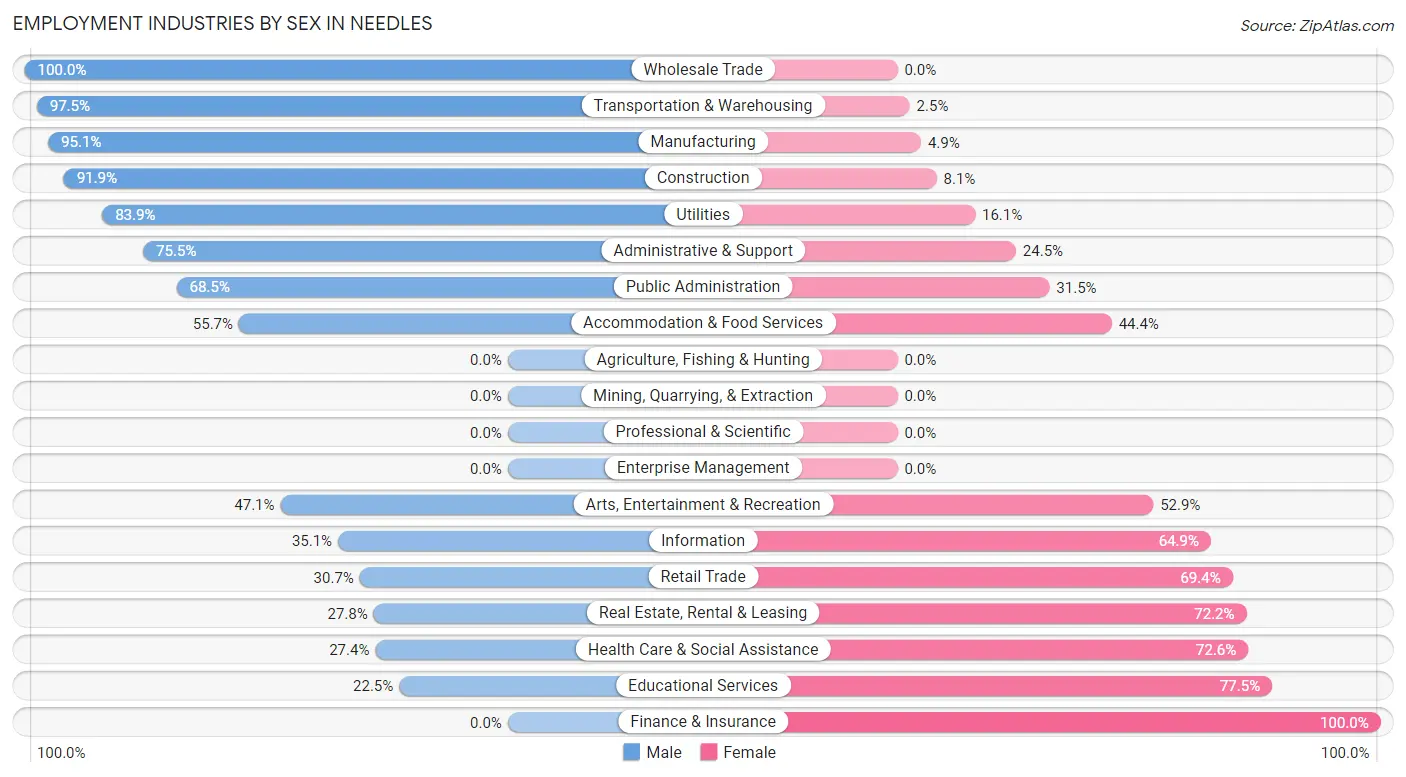
Employment Industries by Sex in Needles
The Needles industries that see more men than women are Wholesale Trade (100.0%), Transportation & Warehousing (97.5%), and Manufacturing (95.1%), whereas the industries that tend to have a higher number of women are Finance & Insurance (100.0%), Educational Services (77.5%), and Health Care & Social Assistance (72.6%).
| Industry | Male | Female |
| Agriculture, Fishing & Hunting | 0 (0.0%) | 0 (0.0%) |
| Mining, Quarrying, & Extraction | 0 (0.0%) | 0 (0.0%) |
| Construction | 68 (91.9%) | 6 (8.1%) |
| Manufacturing | 39 (95.1%) | 2 (4.9%) |
| Wholesale Trade | 3 (100.0%) | 0 (0.0%) |
| Retail Trade | 38 (30.6%) | 86 (69.4%) |
| Transportation & Warehousing | 193 (97.5%) | 5 (2.5%) |
| Utilities | 47 (83.9%) | 9 (16.1%) |
| Information | 26 (35.1%) | 48 (64.9%) |
| Finance & Insurance | 0 (0.0%) | 19 (100.0%) |
| Real Estate, Rental & Leasing | 10 (27.8%) | 26 (72.2%) |
| Professional & Scientific | 0 (0.0%) | 0 (0.0%) |
| Enterprise Management | 0 (0.0%) | 0 (0.0%) |
| Administrative & Support | 40 (75.5%) | 13 (24.5%) |
| Educational Services | 29 (22.5%) | 100 (77.5%) |
| Health Care & Social Assistance | 34 (27.4%) | 90 (72.6%) |
| Arts, Entertainment & Recreation | 32 (47.1%) | 36 (52.9%) |
| Accommodation & Food Services | 128 (55.6%) | 102 (44.4%) |
| Public Administration | 146 (68.5%) | 67 (31.5%) |
| Total | 877 (58.4%) | 624 (41.6%) |
Education in Needles
School Enrollment in Needles
The most common levels of schooling among the 908 students in Needles are high school (318 | 35.0%), middle school (251 | 27.6%), and elementary school (174 | 19.2%).
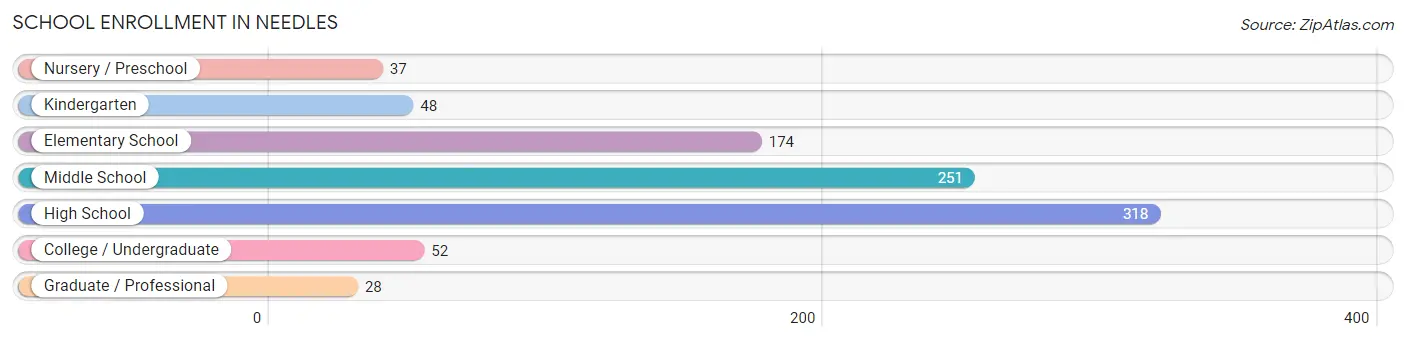
| School Level | # Students | % Students |
| Nursery / Preschool | 37 | 4.1% |
| Kindergarten | 48 | 5.3% |
| Elementary School | 174 | 19.2% |
| Middle School | 251 | 27.6% |
| High School | 318 | 35.0% |
| College / Undergraduate | 52 | 5.7% |
| Graduate / Professional | 28 | 3.1% |
| Total | 908 | 100.0% |
School Enrollment by Age by Funding Source in Needles
Out of a total of 908 students who are enrolled in schools in Needles, 95 (10.5%) attend a private institution, while the remaining 813 (89.5%) are enrolled in public schools. The age group of 35 years and over has the highest likelihood of being enrolled in private schools, with 45 (77.6% in the age bracket) enrolled. Conversely, the age group of 3 to 4 year olds has the lowest likelihood of being enrolled in a private school, with 19 (100.0% in the age bracket) attending a public institution.
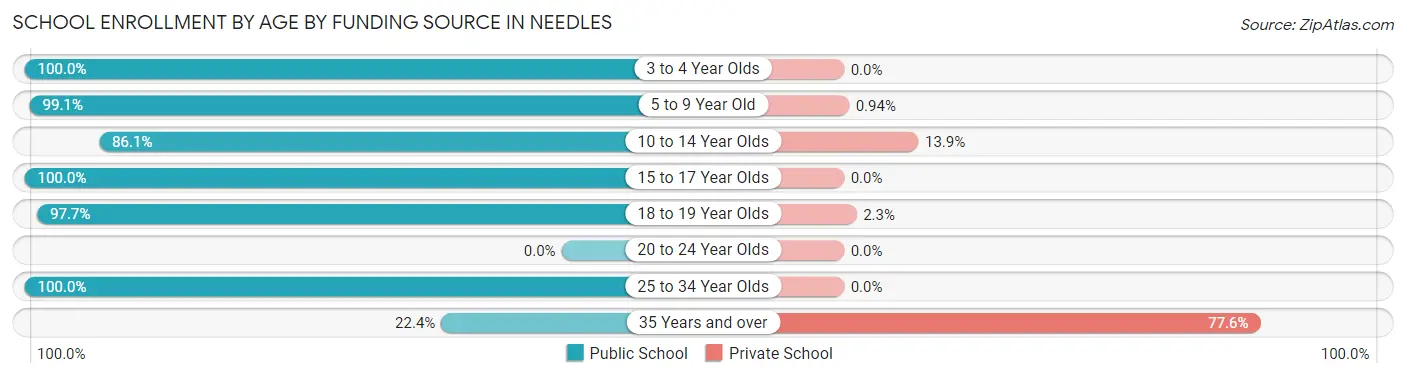
| Age Bracket | Public School | Private School |
| 3 to 4 Year Olds | 19 (100.0%) | 0 (0.0%) |
| 5 to 9 Year Old | 210 (99.1%) | 2 (0.9%) |
| 10 to 14 Year Olds | 292 (86.1%) | 47 (13.9%) |
| 15 to 17 Year Olds | 219 (100.0%) | 0 (0.0%) |
| 18 to 19 Year Olds | 42 (97.7%) | 1 (2.3%) |
| 20 to 24 Year Olds | 0 (0.0%) | 0 (0.0%) |
| 25 to 34 Year Olds | 18 (100.0%) | 0 (0.0%) |
| 35 Years and over | 13 (22.4%) | 45 (77.6%) |
| Total | 813 (89.5%) | 95 (10.5%) |
Educational Attainment by Field of Study in Needles
Business (99 | 24.9%), science & technology (50 | 12.6%), computers & mathematics (39 | 9.8%), liberal arts & history (38 | 9.6%), and education (35 | 8.8%) are the most common fields of study among 397 individuals in Needles who have obtained a bachelor's degree or higher.
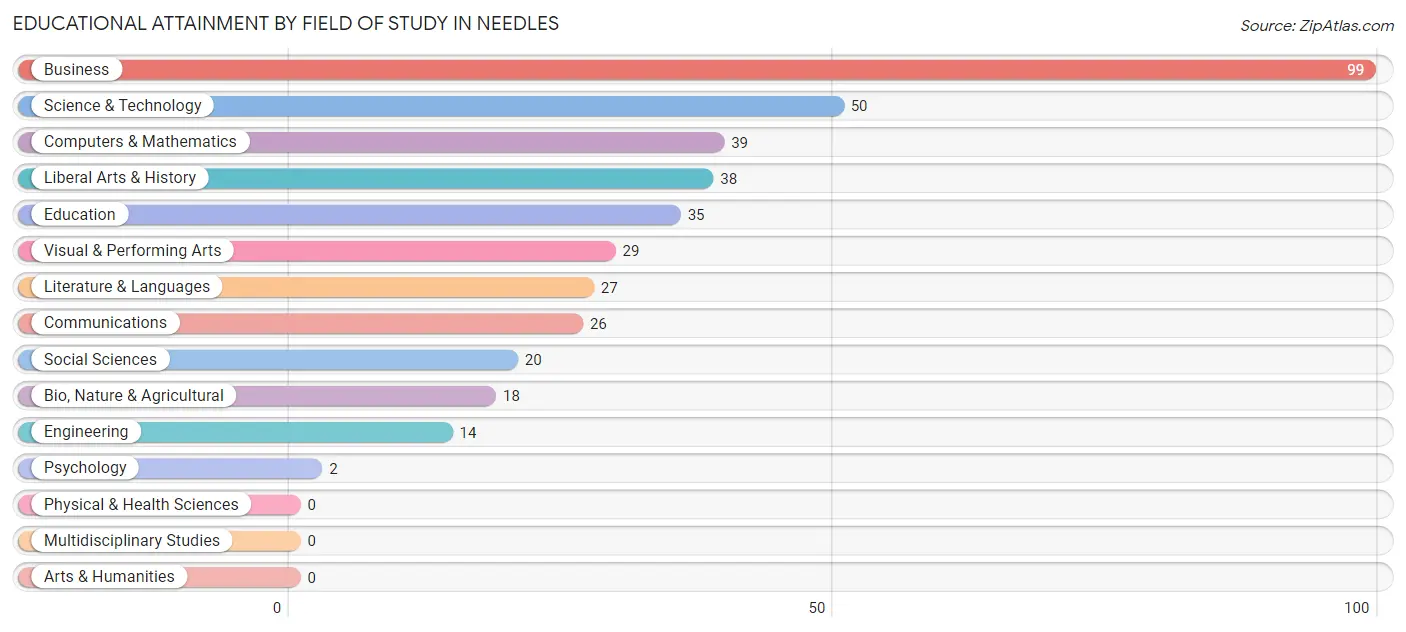
| Field of Study | # Graduates | % Graduates |
| Computers & Mathematics | 39 | 9.8% |
| Bio, Nature & Agricultural | 18 | 4.5% |
| Physical & Health Sciences | 0 | 0.0% |
| Psychology | 2 | 0.5% |
| Social Sciences | 20 | 5.0% |
| Engineering | 14 | 3.5% |
| Multidisciplinary Studies | 0 | 0.0% |
| Science & Technology | 50 | 12.6% |
| Business | 99 | 24.9% |
| Education | 35 | 8.8% |
| Literature & Languages | 27 | 6.8% |
| Liberal Arts & History | 38 | 9.6% |
| Visual & Performing Arts | 29 | 7.3% |
| Communications | 26 | 6.6% |
| Arts & Humanities | 0 | 0.0% |
| Total | 397 | 100.0% |
Transportation & Commute in Needles
Vehicle Availability by Sex in Needles
The most prevalent vehicle ownership categories in Needles are males with 2 vehicles (353, accounting for 41.2%) and females with 2 vehicles (203, making up 56.6%).
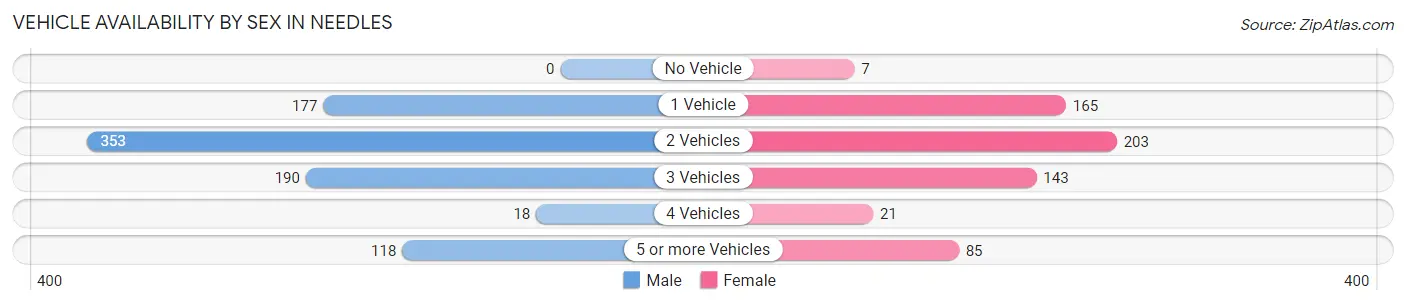
| Vehicles Available | Male | Female |
| No Vehicle | 0 (0.0%) | 7 (1.1%) |
| 1 Vehicle | 177 (20.7%) | 165 (26.4%) |
| 2 Vehicles | 353 (41.2%) | 203 (32.5%) |
| 3 Vehicles | 190 (22.2%) | 143 (22.9%) |
| 4 Vehicles | 18 (2.1%) | 21 (3.4%) |
| 5 or more Vehicles | 118 (13.8%) | 85 (13.6%) |
| Total | 856 (100.0%) | 624 (100.0%) |
Commute Time in Needles
The most frequently occuring commute durations in Needles are 5 to 9 minutes (381 commuters, 26.9%), less than 5 minutes (308 commuters, 21.7%), and 10 to 14 minutes (239 commuters, 16.8%).
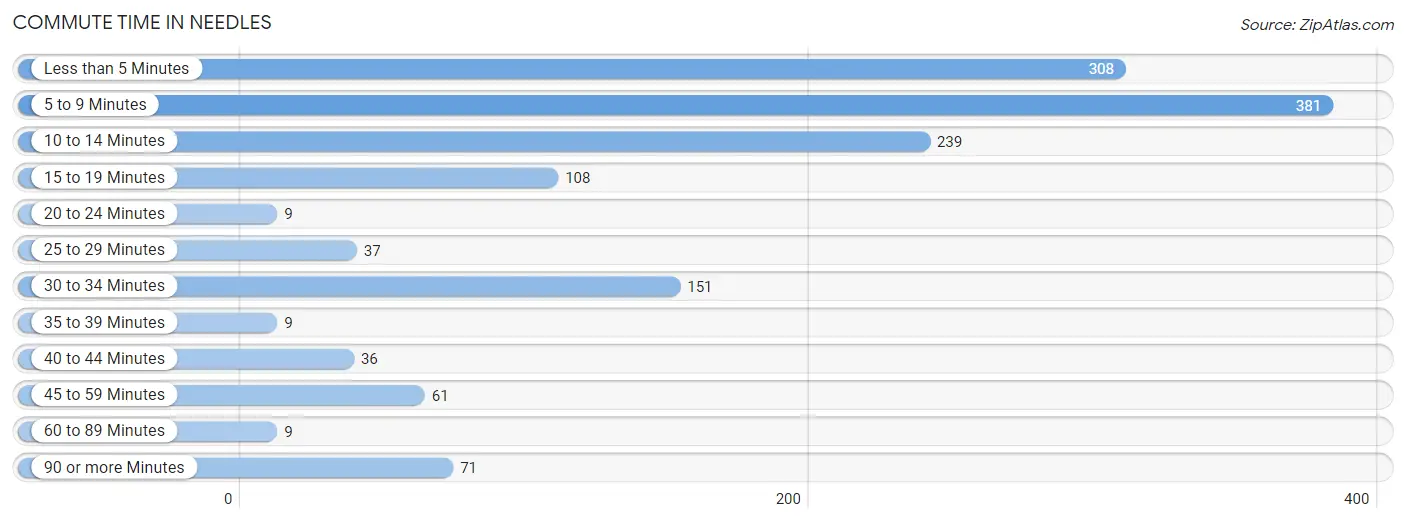
| Commute Time | # Commuters | % Commuters |
| Less than 5 Minutes | 308 | 21.7% |
| 5 to 9 Minutes | 381 | 26.9% |
| 10 to 14 Minutes | 239 | 16.8% |
| 15 to 19 Minutes | 108 | 7.6% |
| 20 to 24 Minutes | 9 | 0.6% |
| 25 to 29 Minutes | 37 | 2.6% |
| 30 to 34 Minutes | 151 | 10.6% |
| 35 to 39 Minutes | 9 | 0.6% |
| 40 to 44 Minutes | 36 | 2.5% |
| 45 to 59 Minutes | 61 | 4.3% |
| 60 to 89 Minutes | 9 | 0.6% |
| 90 or more Minutes | 71 | 5.0% |
Commute Time by Sex in Needles
The most common commute times in Needles are 5 to 9 minutes (266 commuters, 31.3%) for males and less than 5 minutes (146 commuters, 25.7%) for females.
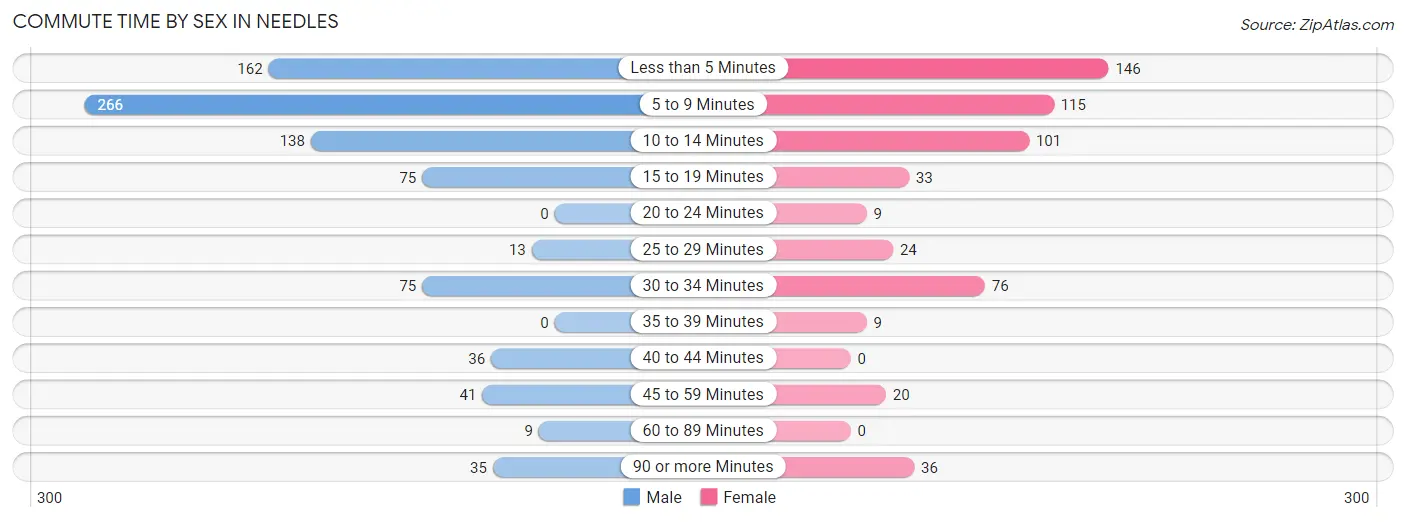
| Commute Time | Male | Female |
| Less than 5 Minutes | 162 (19.1%) | 146 (25.7%) |
| 5 to 9 Minutes | 266 (31.3%) | 115 (20.2%) |
| 10 to 14 Minutes | 138 (16.2%) | 101 (17.7%) |
| 15 to 19 Minutes | 75 (8.8%) | 33 (5.8%) |
| 20 to 24 Minutes | 0 (0.0%) | 9 (1.6%) |
| 25 to 29 Minutes | 13 (1.5%) | 24 (4.2%) |
| 30 to 34 Minutes | 75 (8.8%) | 76 (13.4%) |
| 35 to 39 Minutes | 0 (0.0%) | 9 (1.6%) |
| 40 to 44 Minutes | 36 (4.2%) | 0 (0.0%) |
| 45 to 59 Minutes | 41 (4.8%) | 20 (3.5%) |
| 60 to 89 Minutes | 9 (1.1%) | 0 (0.0%) |
| 90 or more Minutes | 35 (4.1%) | 36 (6.3%) |
Time of Departure to Work by Sex in Needles
The most frequent times of departure to work in Needles are 5:30 AM to 5:59 AM (176, 20.7%) for males and 7:00 AM to 7:29 AM (124, 21.8%) for females.
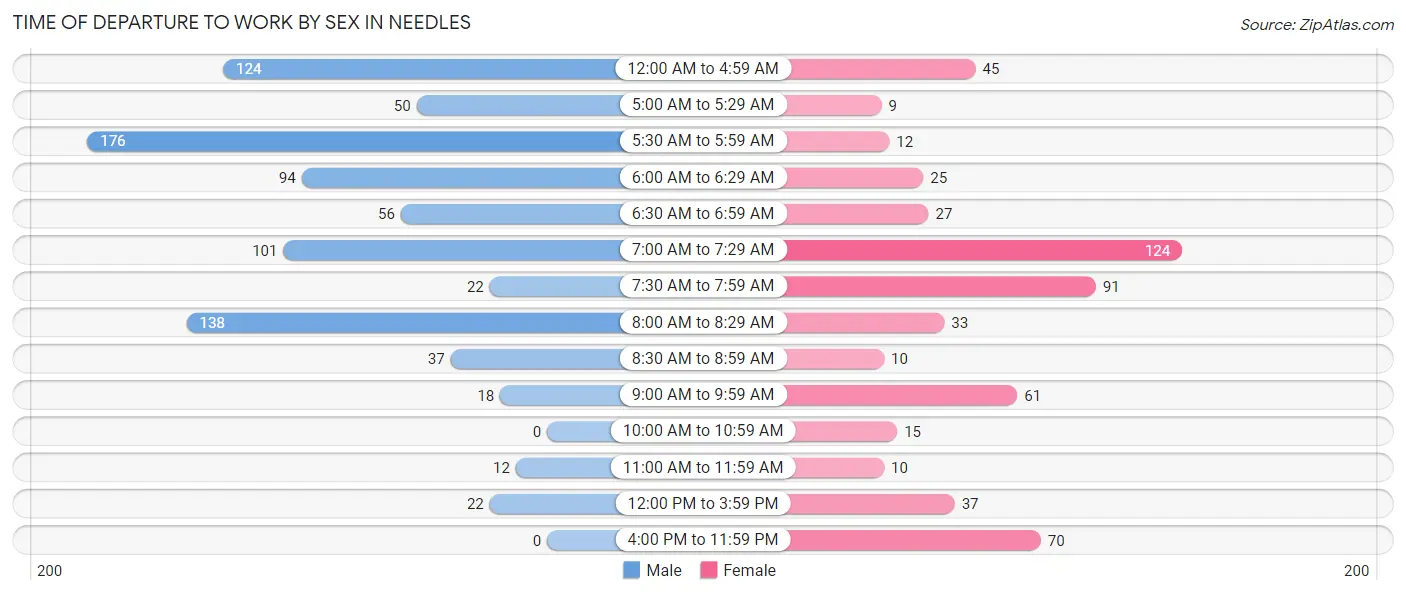
| Time of Departure | Male | Female |
| 12:00 AM to 4:59 AM | 124 (14.6%) | 45 (7.9%) |
| 5:00 AM to 5:29 AM | 50 (5.9%) | 9 (1.6%) |
| 5:30 AM to 5:59 AM | 176 (20.7%) | 12 (2.1%) |
| 6:00 AM to 6:29 AM | 94 (11.1%) | 25 (4.4%) |
| 6:30 AM to 6:59 AM | 56 (6.6%) | 27 (4.8%) |
| 7:00 AM to 7:29 AM | 101 (11.9%) | 124 (21.8%) |
| 7:30 AM to 7:59 AM | 22 (2.6%) | 91 (16.0%) |
| 8:00 AM to 8:29 AM | 138 (16.2%) | 33 (5.8%) |
| 8:30 AM to 8:59 AM | 37 (4.3%) | 10 (1.8%) |
| 9:00 AM to 9:59 AM | 18 (2.1%) | 61 (10.7%) |
| 10:00 AM to 10:59 AM | 0 (0.0%) | 15 (2.6%) |
| 11:00 AM to 11:59 AM | 12 (1.4%) | 10 (1.8%) |
| 12:00 PM to 3:59 PM | 22 (2.6%) | 37 (6.5%) |
| 4:00 PM to 11:59 PM | 0 (0.0%) | 70 (12.3%) |
| Total | 850 (100.0%) | 569 (100.0%) |
Housing Occupancy in Needles
Occupancy by Ownership in Needles
Of the total 2,016 dwellings in Needles, owner-occupied units account for 1,162 (57.6%), while renter-occupied units make up 854 (42.4%).
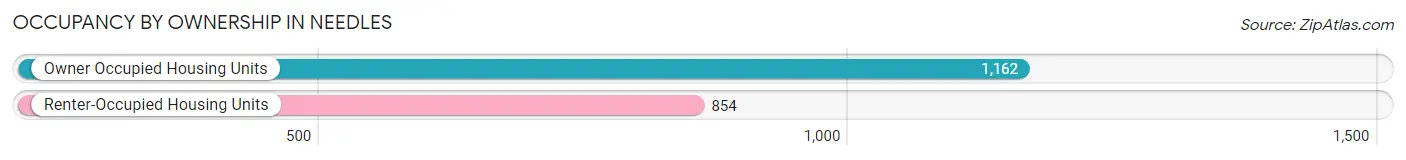
| Occupancy | # Housing Units | % Housing Units |
| Owner Occupied Housing Units | 1,162 | 57.6% |
| Renter-Occupied Housing Units | 854 | 42.4% |
| Total Occupied Housing Units | 2,016 | 100.0% |
Occupancy by Household Size in Needles
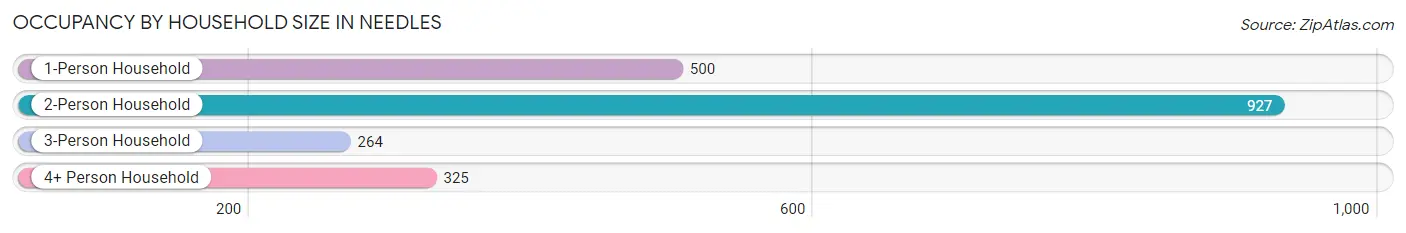
| Household Size | # Housing Units | % Housing Units |
| 1-Person Household | 500 | 24.8% |
| 2-Person Household | 927 | 46.0% |
| 3-Person Household | 264 | 13.1% |
| 4+ Person Household | 325 | 16.1% |
| Total Housing Units | 2,016 | 100.0% |
Occupancy by Ownership by Household Size in Needles
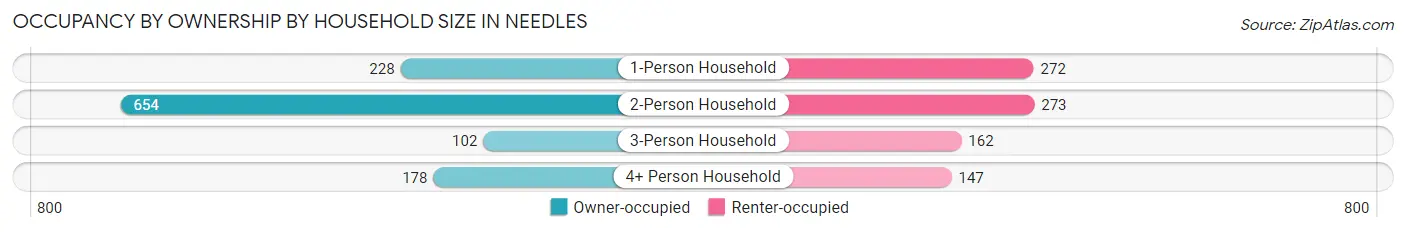
| Household Size | Owner-occupied | Renter-occupied |
| 1-Person Household | 228 (45.6%) | 272 (54.4%) |
| 2-Person Household | 654 (70.6%) | 273 (29.4%) |
| 3-Person Household | 102 (38.6%) | 162 (61.4%) |
| 4+ Person Household | 178 (54.8%) | 147 (45.2%) |
| Total Housing Units | 1,162 (57.6%) | 854 (42.4%) |
Occupancy by Educational Attainment in Needles
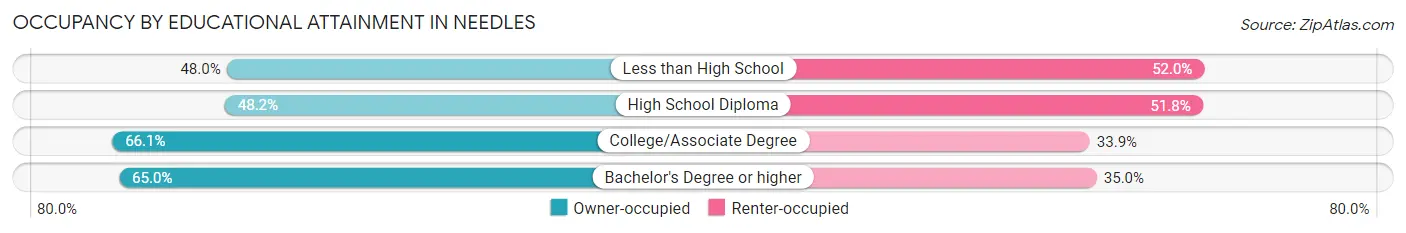
| Household Size | Owner-occupied | Renter-occupied |
| Less than High School | 178 (48.0%) | 193 (52.0%) |
| High School Diploma | 273 (48.2%) | 293 (51.8%) |
| College/Associate Degree | 581 (66.1%) | 298 (33.9%) |
| Bachelor's Degree or higher | 130 (65.0%) | 70 (35.0%) |
Occupancy by Age of Householder in Needles
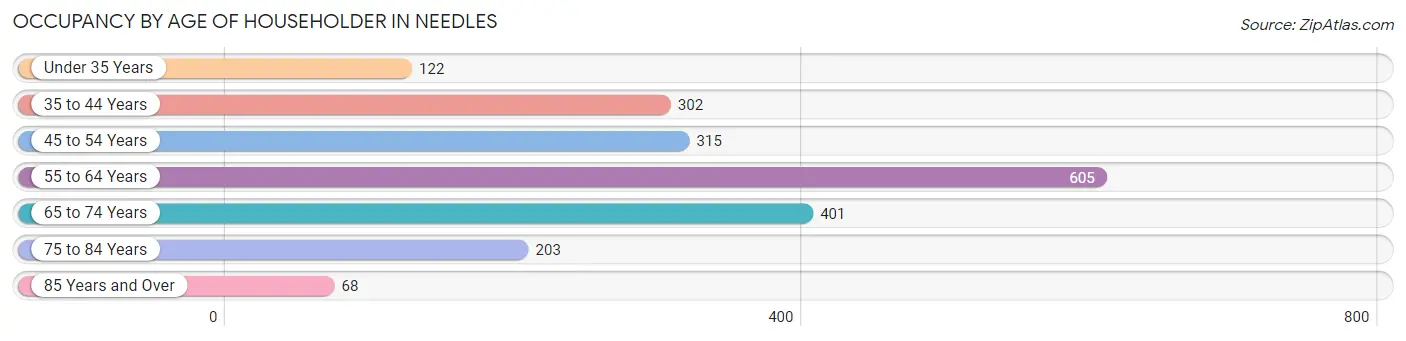
| Age Bracket | # Households | % Households |
| Under 35 Years | 122 | 6.0% |
| 35 to 44 Years | 302 | 15.0% |
| 45 to 54 Years | 315 | 15.6% |
| 55 to 64 Years | 605 | 30.0% |
| 65 to 74 Years | 401 | 19.9% |
| 75 to 84 Years | 203 | 10.1% |
| 85 Years and Over | 68 | 3.4% |
| Total | 2,016 | 100.0% |
Housing Finances in Needles
Median Income by Occupancy in Needles
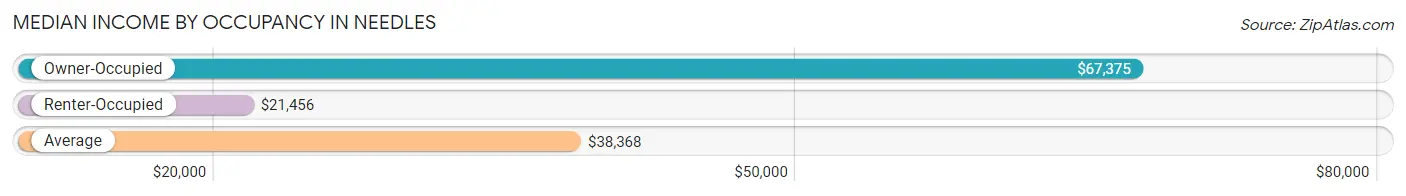
| Occupancy Type | # Households | Median Income |
| Owner-Occupied | 1,162 (57.6%) | $67,375 |
| Renter-Occupied | 854 (42.4%) | $21,456 |
| Average | 2,016 (100.0%) | $38,368 |
Occupancy by Householder Income Bracket in Needles
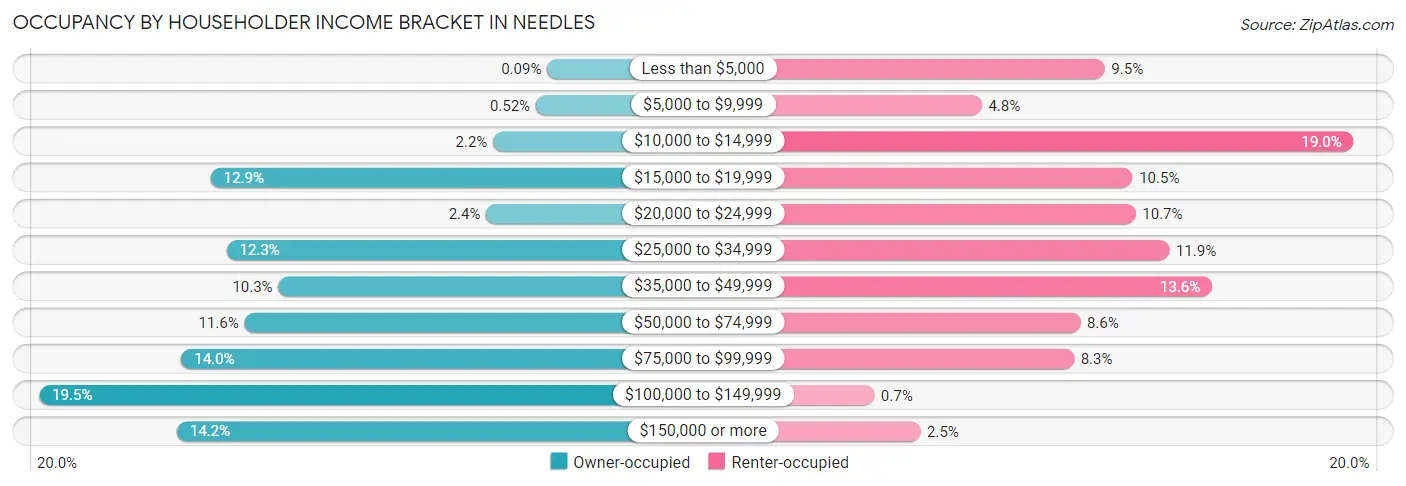
| Income Bracket | Owner-occupied | Renter-occupied |
| Less than $5,000 | 1 (0.1%) | 81 (9.5%) |
| $5,000 to $9,999 | 6 (0.5%) | 41 (4.8%) |
| $10,000 to $14,999 | 25 (2.1%) | 162 (19.0%) |
| $15,000 to $19,999 | 150 (12.9%) | 90 (10.5%) |
| $20,000 to $24,999 | 28 (2.4%) | 91 (10.7%) |
| $25,000 to $34,999 | 143 (12.3%) | 102 (11.9%) |
| $35,000 to $49,999 | 120 (10.3%) | 116 (13.6%) |
| $50,000 to $74,999 | 135 (11.6%) | 73 (8.6%) |
| $75,000 to $99,999 | 163 (14.0%) | 71 (8.3%) |
| $100,000 to $149,999 | 226 (19.5%) | 6 (0.7%) |
| $150,000 or more | 165 (14.2%) | 21 (2.5%) |
| Total | 1,162 (100.0%) | 854 (100.0%) |
Monthly Housing Cost Tiers in Needles
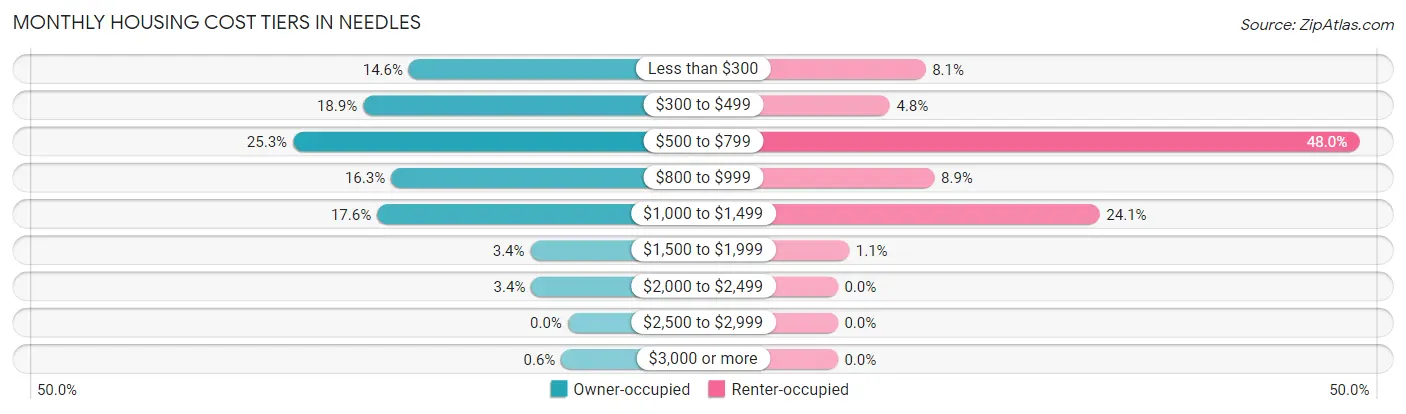
| Monthly Cost | Owner-occupied | Renter-occupied |
| Less than $300 | 170 (14.6%) | 69 (8.1%) |
| $300 to $499 | 219 (18.9%) | 41 (4.8%) |
| $500 to $799 | 294 (25.3%) | 410 (48.0%) |
| $800 to $999 | 189 (16.3%) | 76 (8.9%) |
| $1,000 to $1,499 | 204 (17.6%) | 206 (24.1%) |
| $1,500 to $1,999 | 40 (3.4%) | 9 (1.1%) |
| $2,000 to $2,499 | 39 (3.4%) | 0 (0.0%) |
| $2,500 to $2,999 | 0 (0.0%) | 0 (0.0%) |
| $3,000 or more | 7 (0.6%) | 0 (0.0%) |
| Total | 1,162 (100.0%) | 854 (100.0%) |
Physical Housing Characteristics in Needles
Housing Structures in Needles
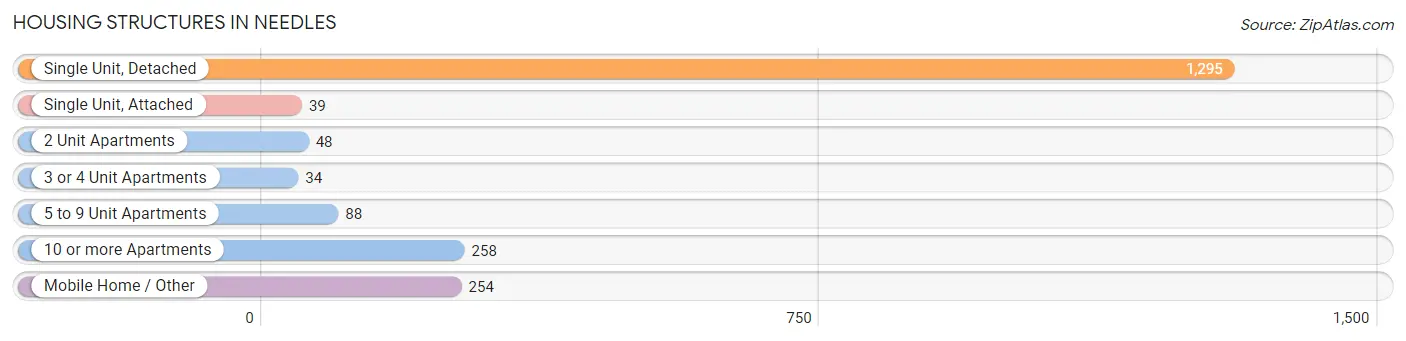
| Structure Type | # Housing Units | % Housing Units |
| Single Unit, Detached | 1,295 | 64.2% |
| Single Unit, Attached | 39 | 1.9% |
| 2 Unit Apartments | 48 | 2.4% |
| 3 or 4 Unit Apartments | 34 | 1.7% |
| 5 to 9 Unit Apartments | 88 | 4.4% |
| 10 or more Apartments | 258 | 12.8% |
| Mobile Home / Other | 254 | 12.6% |
| Total | 2,016 | 100.0% |
Housing Structures by Occupancy in Needles
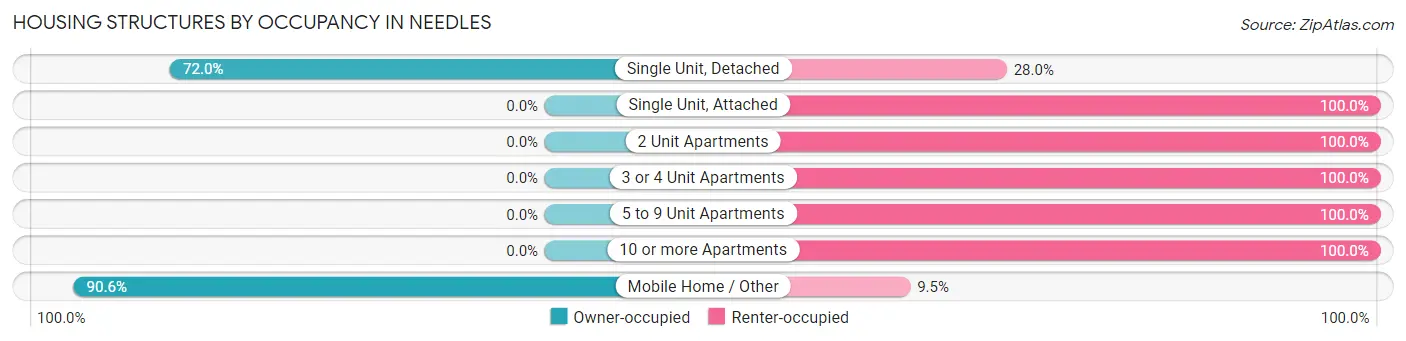
| Structure Type | Owner-occupied | Renter-occupied |
| Single Unit, Detached | 932 (72.0%) | 363 (28.0%) |
| Single Unit, Attached | 0 (0.0%) | 39 (100.0%) |
| 2 Unit Apartments | 0 (0.0%) | 48 (100.0%) |
| 3 or 4 Unit Apartments | 0 (0.0%) | 34 (100.0%) |
| 5 to 9 Unit Apartments | 0 (0.0%) | 88 (100.0%) |
| 10 or more Apartments | 0 (0.0%) | 258 (100.0%) |
| Mobile Home / Other | 230 (90.5%) | 24 (9.5%) |
| Total | 1,162 (57.6%) | 854 (42.4%) |
Housing Structures by Number of Rooms in Needles
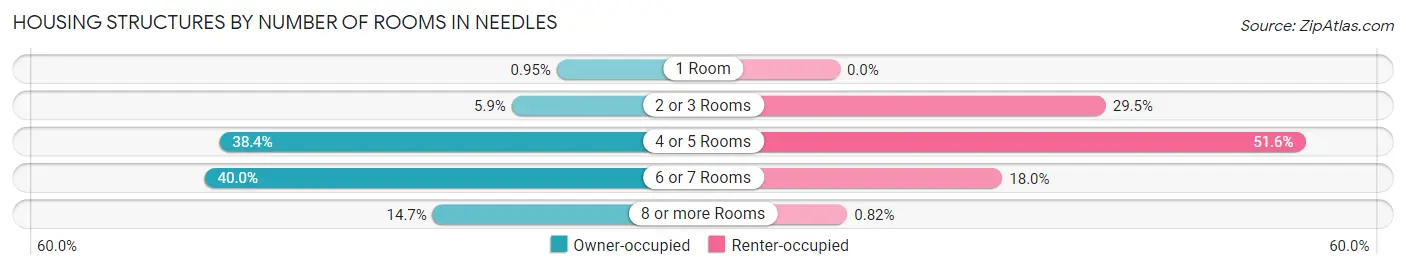
| Number of Rooms | Owner-occupied | Renter-occupied |
| 1 Room | 11 (0.9%) | 0 (0.0%) |
| 2 or 3 Rooms | 69 (5.9%) | 252 (29.5%) |
| 4 or 5 Rooms | 446 (38.4%) | 441 (51.6%) |
| 6 or 7 Rooms | 465 (40.0%) | 154 (18.0%) |
| 8 or more Rooms | 171 (14.7%) | 7 (0.8%) |
| Total | 1,162 (100.0%) | 854 (100.0%) |
Housing Structure by Heating Type in Needles
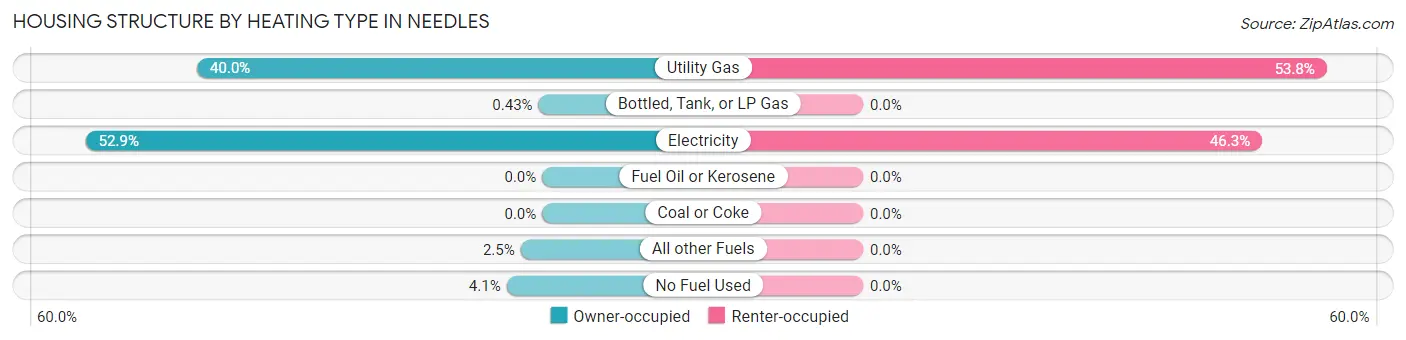
| Heating Type | Owner-occupied | Renter-occupied |
| Utility Gas | 465 (40.0%) | 459 (53.7%) |
| Bottled, Tank, or LP Gas | 5 (0.4%) | 0 (0.0%) |
| Electricity | 615 (52.9%) | 395 (46.3%) |
| Fuel Oil or Kerosene | 0 (0.0%) | 0 (0.0%) |
| Coal or Coke | 0 (0.0%) | 0 (0.0%) |
| All other Fuels | 29 (2.5%) | 0 (0.0%) |
| No Fuel Used | 48 (4.1%) | 0 (0.0%) |
| Total | 1,162 (100.0%) | 854 (100.0%) |
Household Vehicle Usage in Needles
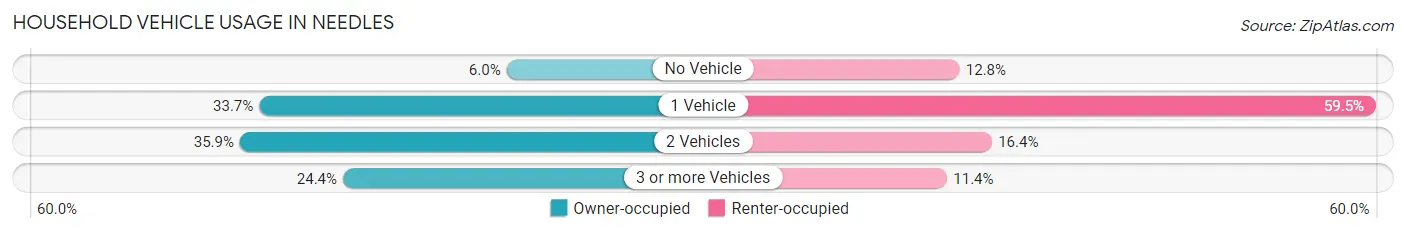
| Vehicles per Household | Owner-occupied | Renter-occupied |
| No Vehicle | 70 (6.0%) | 109 (12.8%) |
| 1 Vehicle | 392 (33.7%) | 508 (59.5%) |
| 2 Vehicles | 417 (35.9%) | 140 (16.4%) |
| 3 or more Vehicles | 283 (24.3%) | 97 (11.4%) |
| Total | 1,162 (100.0%) | 854 (100.0%) |
Real Estate & Mortgages in Needles
Real Estate and Mortgage Overview in Needles
| Characteristic | Without Mortgage | With Mortgage |
| Housing Units | 708 | 454 |
| Median Property Value | $115,500 | $137,000 |
| Median Household Income | $73,750 | $75 |
| Monthly Housing Costs | $478 | $7 |
| Real Estate Taxes | $892 | $39 |
Property Value by Mortgage Status in Needles
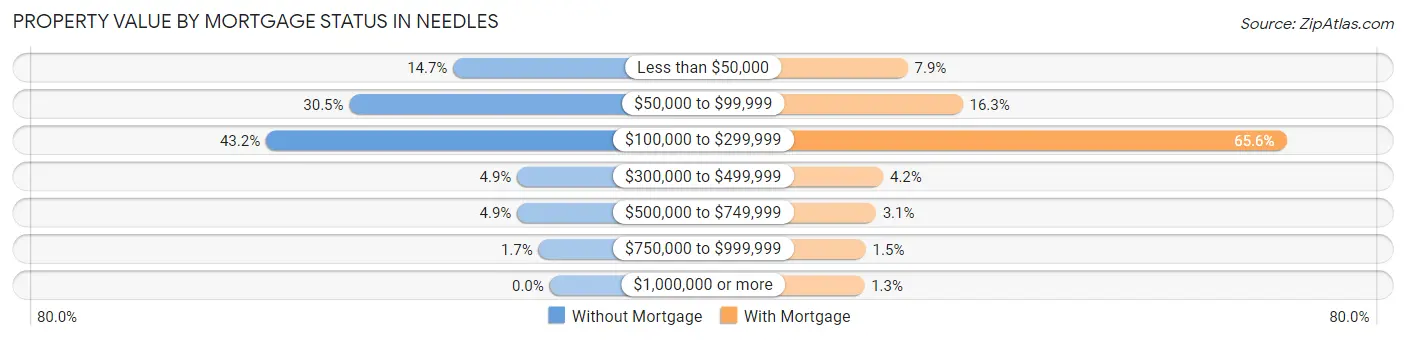
| Property Value | Without Mortgage | With Mortgage |
| Less than $50,000 | 104 (14.7%) | 36 (7.9%) |
| $50,000 to $99,999 | 216 (30.5%) | 74 (16.3%) |
| $100,000 to $299,999 | 306 (43.2%) | 298 (65.6%) |
| $300,000 to $499,999 | 35 (4.9%) | 19 (4.2%) |
| $500,000 to $749,999 | 35 (4.9%) | 14 (3.1%) |
| $750,000 to $999,999 | 12 (1.7%) | 7 (1.5%) |
| $1,000,000 or more | 0 (0.0%) | 6 (1.3%) |
| Total | 708 (100.0%) | 454 (100.0%) |
Household Income by Mortgage Status in Needles
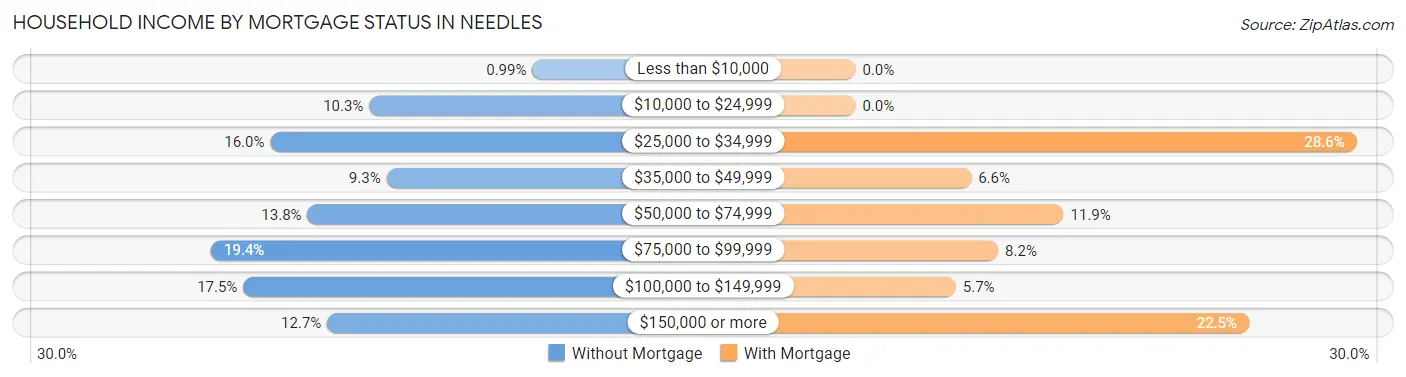
| Household Income | Without Mortgage | With Mortgage |
| Less than $10,000 | 7 (1.0%) | 0 (0.0%) |
| $10,000 to $24,999 | 73 (10.3%) | 0 (0.0%) |
| $25,000 to $34,999 | 113 (16.0%) | 130 (28.6%) |
| $35,000 to $49,999 | 66 (9.3%) | 30 (6.6%) |
| $50,000 to $74,999 | 98 (13.8%) | 54 (11.9%) |
| $75,000 to $99,999 | 137 (19.4%) | 37 (8.2%) |
| $100,000 to $149,999 | 124 (17.5%) | 26 (5.7%) |
| $150,000 or more | 90 (12.7%) | 102 (22.5%) |
| Total | 708 (100.0%) | 454 (100.0%) |
Property Value to Household Income Ratio in Needles
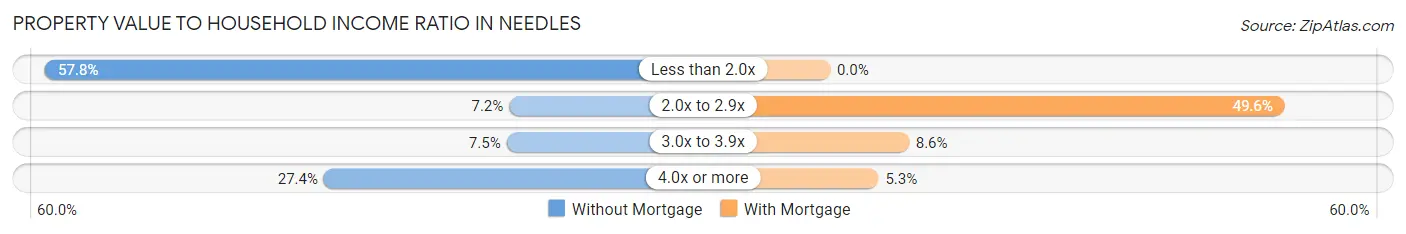
| Value-to-Income Ratio | Without Mortgage | With Mortgage |
| Less than 2.0x | 409 (57.8%) | 0 (0.0%) |
| 2.0x to 2.9x | 51 (7.2%) | 225 (49.6%) |
| 3.0x to 3.9x | 53 (7.5%) | 39 (8.6%) |
| 4.0x or more | 194 (27.4%) | 24 (5.3%) |
| Total | 708 (100.0%) | 454 (100.0%) |
Real Estate Taxes by Mortgage Status in Needles
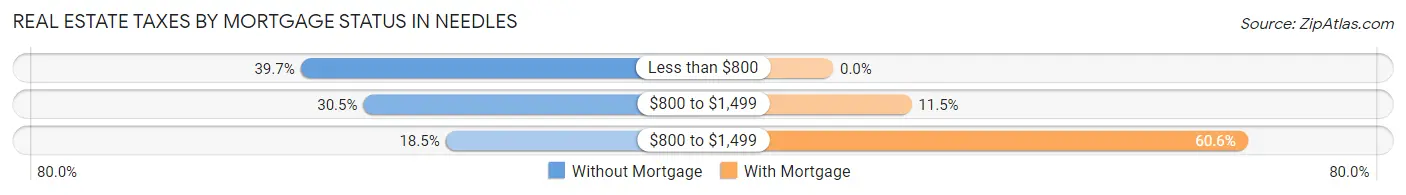
| Property Taxes | Without Mortgage | With Mortgage |
| Less than $800 | 281 (39.7%) | 0 (0.0%) |
| $800 to $1,499 | 216 (30.5%) | 52 (11.5%) |
| $800 to $1,499 | 131 (18.5%) | 275 (60.6%) |
| Total | 708 (100.0%) | 454 (100.0%) |
Health & Disability in Needles
Health Insurance Coverage by Age in Needles
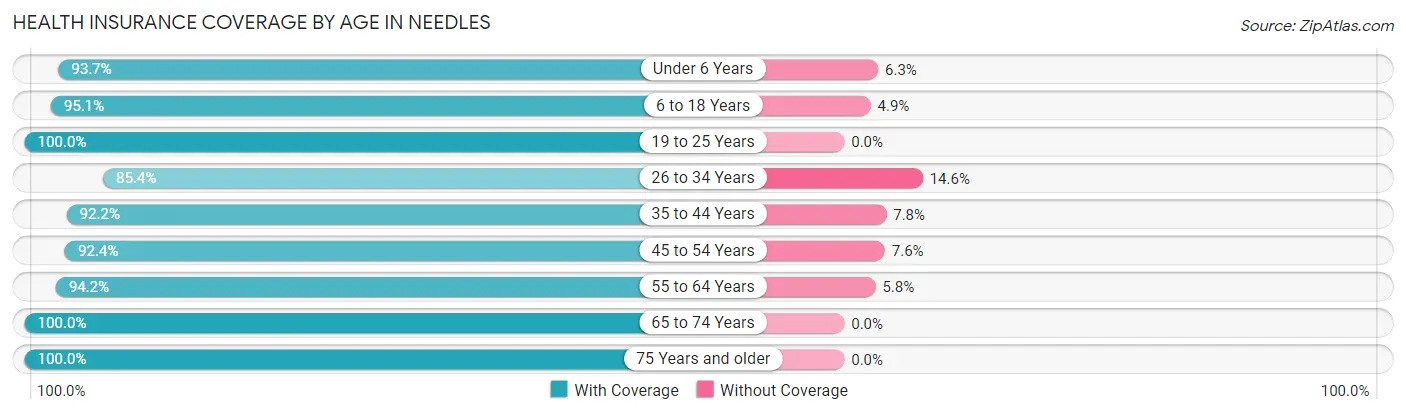
| Age Bracket | With Coverage | Without Coverage |
| Under 6 Years | 223 (93.7%) | 15 (6.3%) |
| 6 to 18 Years | 795 (95.1%) | 41 (4.9%) |
| 19 to 25 Years | 172 (100.0%) | 0 (0.0%) |
| 26 to 34 Years | 280 (85.4%) | 48 (14.6%) |
| 35 to 44 Years | 612 (92.2%) | 52 (7.8%) |
| 45 to 54 Years | 477 (92.4%) | 39 (7.6%) |
| 55 to 64 Years | 1,020 (94.2%) | 63 (5.8%) |
| 65 to 74 Years | 642 (100.0%) | 0 (0.0%) |
| 75 Years and older | 413 (100.0%) | 0 (0.0%) |
| Total | 4,634 (94.7%) | 258 (5.3%) |
Health Insurance Coverage by Citizenship Status in Needles
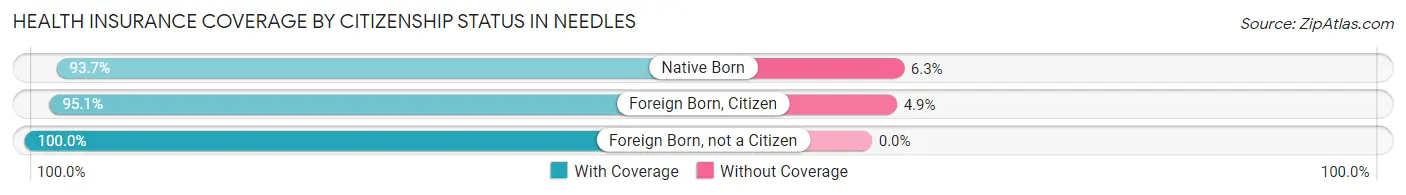
| Citizenship Status | With Coverage | Without Coverage |
| Native Born | 223 (93.7%) | 15 (6.3%) |
| Foreign Born, Citizen | 795 (95.1%) | 41 (4.9%) |
| Foreign Born, not a Citizen | 172 (100.0%) | 0 (0.0%) |
Health Insurance Coverage by Household Income in Needles
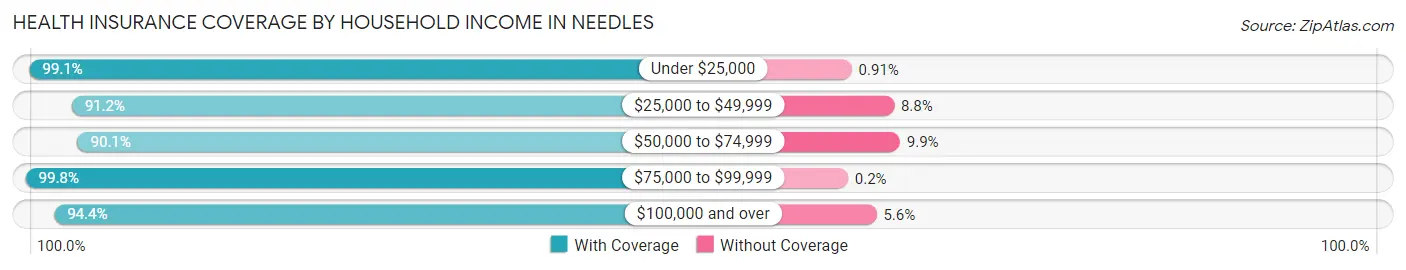
| Household Income | With Coverage | Without Coverage |
| Under $25,000 | 1,203 (99.1%) | 11 (0.9%) |
| $25,000 to $49,999 | 1,167 (91.2%) | 113 (8.8%) |
| $50,000 to $74,999 | 571 (90.1%) | 63 (9.9%) |
| $75,000 to $99,999 | 503 (99.8%) | 1 (0.2%) |
| $100,000 and over | 1,190 (94.4%) | 70 (5.6%) |
Public vs Private Health Insurance Coverage by Age in Needles
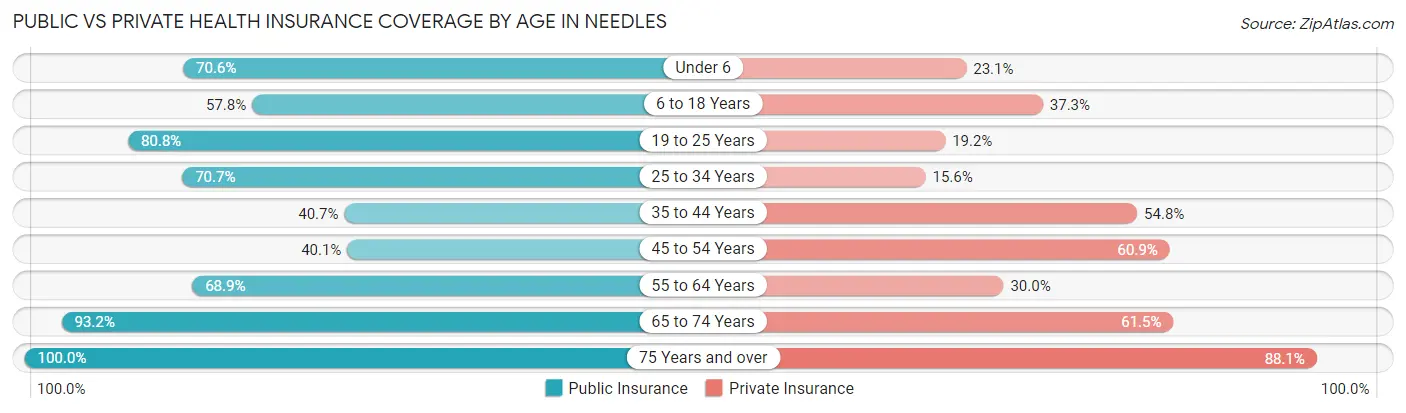
| Age Bracket | Public Insurance | Private Insurance |
| Under 6 | 168 (70.6%) | 55 (23.1%) |
| 6 to 18 Years | 483 (57.8%) | 312 (37.3%) |
| 19 to 25 Years | 139 (80.8%) | 33 (19.2%) |
| 25 to 34 Years | 232 (70.7%) | 51 (15.5%) |
| 35 to 44 Years | 270 (40.7%) | 364 (54.8%) |
| 45 to 54 Years | 207 (40.1%) | 314 (60.9%) |
| 55 to 64 Years | 746 (68.9%) | 325 (30.0%) |
| 65 to 74 Years | 598 (93.1%) | 395 (61.5%) |
| 75 Years and over | 413 (100.0%) | 364 (88.1%) |
| Total | 3,256 (66.6%) | 2,213 (45.2%) |
Disability Status by Sex by Age in Needles
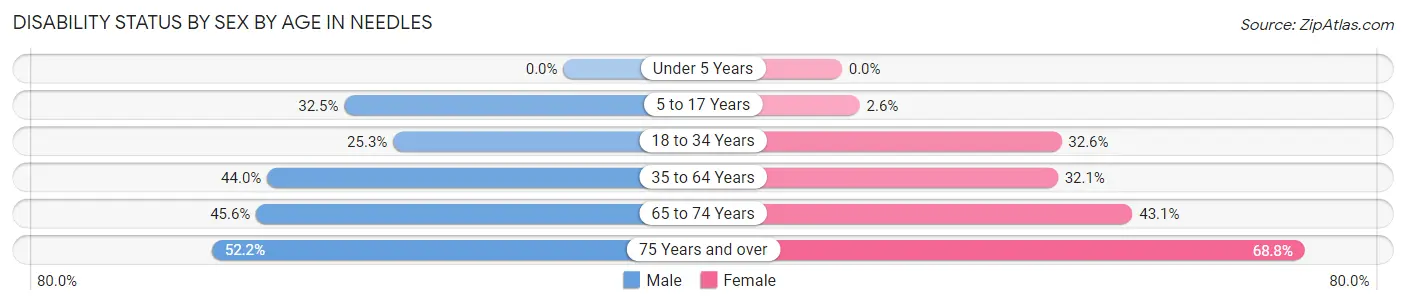
| Age Bracket | Male | Female |
| Under 5 Years | 0 (0.0%) | 0 (0.0%) |
| 5 to 17 Years | 122 (32.5%) | 11 (2.6%) |
| 18 to 34 Years | 70 (25.3%) | 104 (32.6%) |
| 35 to 64 Years | 548 (44.0%) | 326 (32.1%) |
| 65 to 74 Years | 130 (45.6%) | 154 (43.1%) |
| 75 Years and over | 107 (52.2%) | 143 (68.8%) |
Disability Class by Sex by Age in Needles
Disability Class: Hearing Difficulty
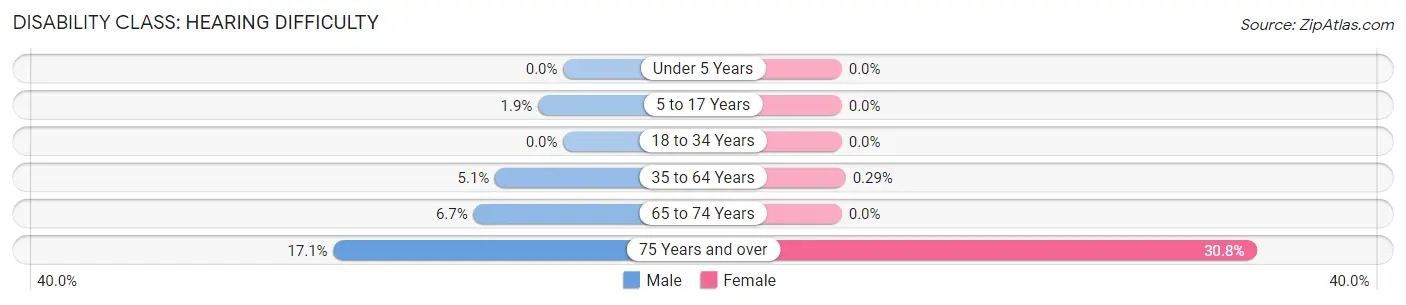
| Age Bracket | Male | Female |
| Under 5 Years | 0 (0.0%) | 0 (0.0%) |
| 5 to 17 Years | 7 (1.9%) | 0 (0.0%) |
| 18 to 34 Years | 0 (0.0%) | 0 (0.0%) |
| 35 to 64 Years | 63 (5.1%) | 3 (0.3%) |
| 65 to 74 Years | 19 (6.7%) | 0 (0.0%) |
| 75 Years and over | 35 (17.1%) | 64 (30.8%) |
Disability Class: Vision Difficulty
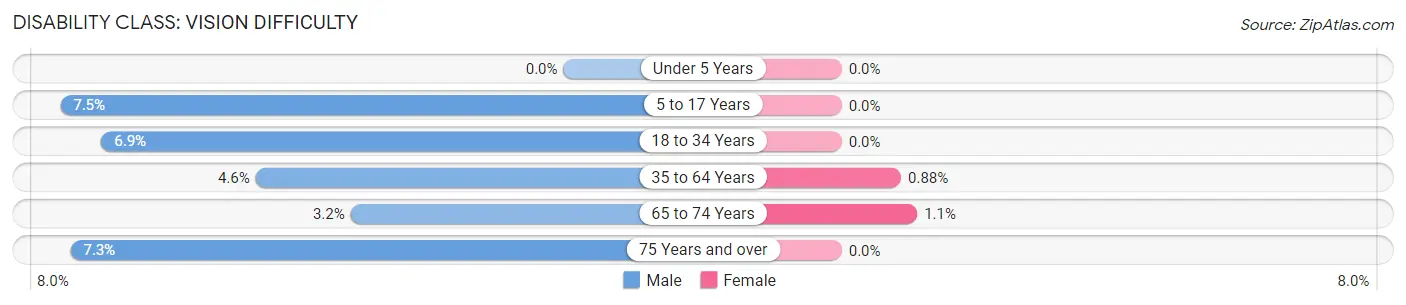
| Age Bracket | Male | Female |
| Under 5 Years | 0 (0.0%) | 0 (0.0%) |
| 5 to 17 Years | 28 (7.5%) | 0 (0.0%) |
| 18 to 34 Years | 19 (6.9%) | 0 (0.0%) |
| 35 to 64 Years | 57 (4.6%) | 9 (0.9%) |
| 65 to 74 Years | 9 (3.2%) | 4 (1.1%) |
| 75 Years and over | 15 (7.3%) | 0 (0.0%) |
Disability Class: Cognitive Difficulty
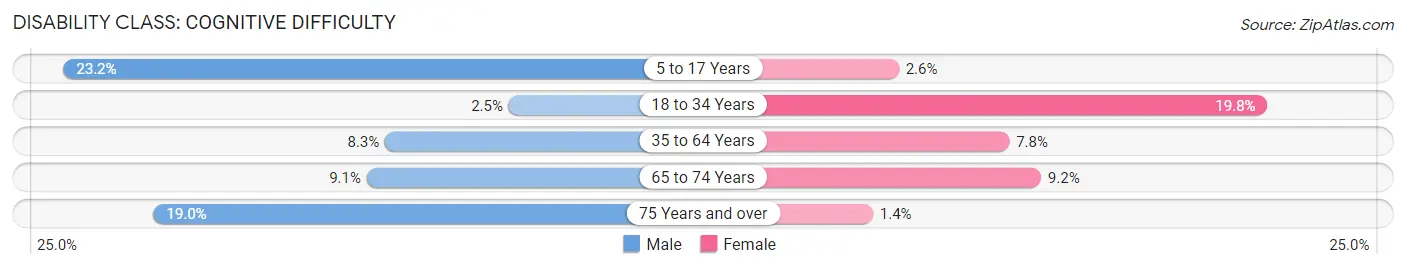
| Age Bracket | Male | Female |
| 5 to 17 Years | 87 (23.2%) | 11 (2.6%) |
| 18 to 34 Years | 7 (2.5%) | 63 (19.8%) |
| 35 to 64 Years | 103 (8.3%) | 79 (7.8%) |
| 65 to 74 Years | 26 (9.1%) | 33 (9.2%) |
| 75 Years and over | 39 (19.0%) | 3 (1.4%) |
Disability Class: Ambulatory Difficulty
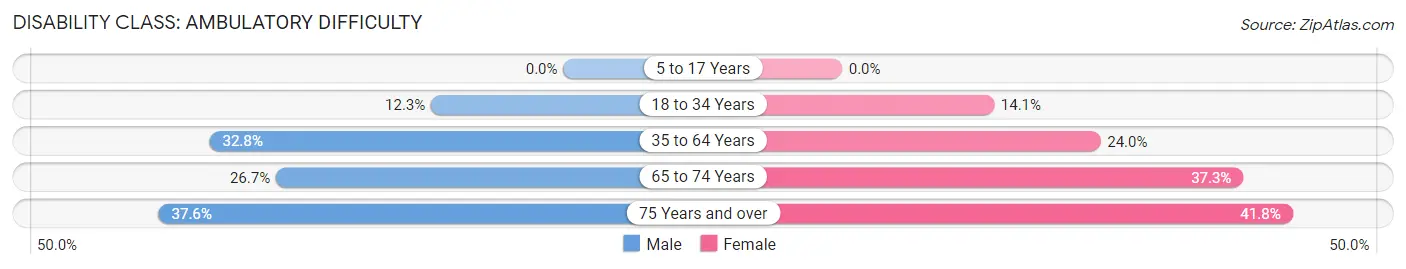
| Age Bracket | Male | Female |
| 5 to 17 Years | 0 (0.0%) | 0 (0.0%) |
| 18 to 34 Years | 34 (12.3%) | 45 (14.1%) |
| 35 to 64 Years | 409 (32.8%) | 244 (24.0%) |
| 65 to 74 Years | 76 (26.7%) | 133 (37.2%) |
| 75 Years and over | 77 (37.6%) | 87 (41.8%) |
Disability Class: Self-Care Difficulty
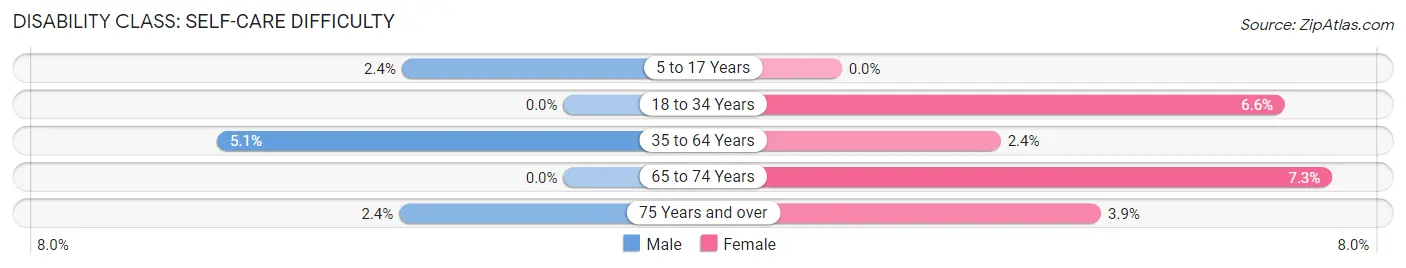
| Age Bracket | Male | Female |
| 5 to 17 Years | 9 (2.4%) | 0 (0.0%) |
| 18 to 34 Years | 0 (0.0%) | 21 (6.6%) |
| 35 to 64 Years | 64 (5.1%) | 24 (2.4%) |
| 65 to 74 Years | 0 (0.0%) | 26 (7.3%) |
| 75 Years and over | 5 (2.4%) | 8 (3.8%) |
Technology Access in Needles
Computing Device Access in Needles
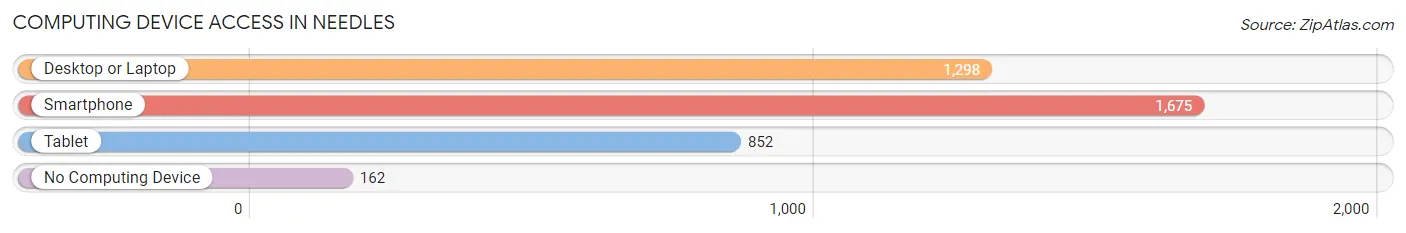
| Device Type | # Households | % Households |
| Desktop or Laptop | 1,298 | 64.4% |
| Smartphone | 1,675 | 83.1% |
| Tablet | 852 | 42.3% |
| No Computing Device | 162 | 8.0% |
| Total | 2,016 | 100.0% |
Internet Access in Needles
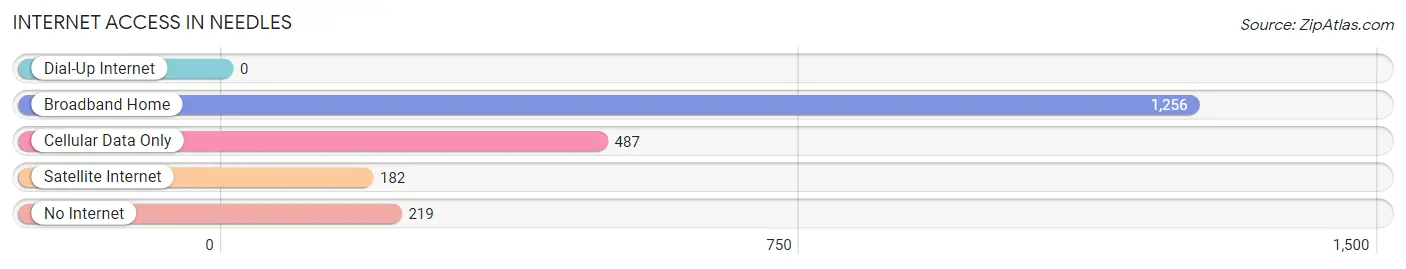
| Internet Type | # Households | % Households |
| Dial-Up Internet | 0 | 0.0% |
| Broadband Home | 1,256 | 62.3% |
| Cellular Data Only | 487 | 24.2% |
| Satellite Internet | 182 | 9.0% |
| No Internet | 219 | 10.9% |
| Total | 2,016 | 100.0% |
Needles Summary
Needles is a city located in San Bernardino County, California, United States. It is situated on the western banks of the Colorado River in the Mojave Desert. The city is located in the easternmost part of the Mojave Desert, near the Arizona border. As of the 2010 census, the population of Needles was 4,844.
History
Needles was founded in 1883 by Charles M. Needles, a former railroad executive. The city was named after the nearby mountain peak, which was named for its resemblance to a sewing needle. The city was originally a railroad town, and the Atchison, Topeka and Santa Fe Railway still runs through the city.
In the early 1900s, Needles became a popular stop for travelers on the National Old Trails Road, which ran from New York to Los Angeles. The city was also a popular stop for travelers on the Arrowhead Trail, which ran from Chicago to Los Angeles.
In the 1920s, Needles became a popular destination for tourists, who came to enjoy the warm desert climate and the nearby Colorado River. The city was also a popular destination for Hollywood stars, who came to Needles to film westerns.
Geography
Needles is located at 34°49'17" North, 114°35'2" West (34.8214, -114.5839). The city is situated on the western banks of the Colorado River in the Mojave Desert. The city is located in the easternmost part of the Mojave Desert, near the Arizona border.
The city has a total area of 10.2 square miles, of which 10.1 square miles is land and 0.1 square miles is water. The city is located in the Mojave Desert, and the climate is hot and dry. The average temperature in the summer is over 100°F, and the average temperature in the winter is around 50°F.
Economy
Needles is a small city, and the economy is largely based on tourism and services. The city is home to several hotels, restaurants, and other tourist attractions. The city is also home to several casinos, which attract visitors from all over the region.
The city is also home to several manufacturing companies, including a factory that produces solar panels. The city is also home to a large number of trucking companies, which transport goods to and from the city.
Demographics
As of the 2010 census, the population of Needles was 4,844. The population is largely white (77.2%), with a small Hispanic population (17.2%). The median household income is $30,938, and the median age is 39.7 years. The city has a poverty rate of 22.3%.
Conclusion
Needles is a small city located in San Bernardino County, California, United States. It is situated on the western banks of the Colorado River in the Mojave Desert. The city was founded in 1883 by Charles M. Needles, and it was originally a railroad town. The city is now a popular tourist destination, and the economy is largely based on tourism and services. As of the 2010 census, the population of Needles was 4,844. The population is largely white, with a small Hispanic population. The median household income is $30,938, and the median age is 39.7 years. The city has a poverty rate of 22.3%.
Common Questions
What is Per Capita Income in Needles?
Per Capita income in Needles is $27,969.
What is the Median Family Income in Needles?
Median Family Income in Needles is $54,828.
What is the Median Household income in Needles?
Median Household Income in Needles is $38,368.
What is Income or Wage Gap in Needles?
Income or Wage Gap in Needles is 18.5%.
Women in Needles earn 81.5 cents for every dollar earned by a man.
What is Family Income Deficit in Needles?
Family Income Deficit in Needles is $6,775.
Families that are below poverty line in Needles earn $6,775 less on average than the poverty threshold level.
What is Inequality or Gini Index in Needles?
Inequality or Gini Index in Needles is 0.52.
What is the Total Population of Needles?
Total Population of Needles is 4,895.
What is the Total Male Population of Needles?
Total Male Population of Needles is 2,505.
What is the Total Female Population of Needles?
Total Female Population of Needles is 2,390.
What is the Ratio of Males per 100 Females in Needles?
There are 104.81 Males per 100 Females in Needles.
What is the Ratio of Females per 100 Males in Needles?
There are 95.41 Females per 100 Males in Needles.
What is the Median Population Age in Needles?
Median Population Age in Needles is 48.8 Years.
What is the Average Family Size in Needles
Average Family Size in Needles is 2.9 People.
What is the Average Household Size in Needles
Average Household Size in Needles is 2.4 People.
How Large is the Labor Force in Needles?
There are 1,751 People in the Labor Forcein in Needles.
What is the Percentage of People in the Labor Force in Needles?
42.8% of People are in the Labor Force in Needles.
What is the Unemployment Rate in Needles?
Unemployment Rate in Needles is 14.1%.