Napa, CA Map & Demographics
Napa Map
Napa Overview
$48,578
PER CAPITA INCOME
$114,511
AVG FAMILY INCOME
$100,273
AVG HOUSEHOLD INCOME
15.9%
WAGE / INCOME GAP [ % ]
84.1¢/ $1
WAGE / INCOME GAP [ $ ]
$9,632
FAMILY INCOME DEFICIT
0.43
INEQUALITY / GINI INDEX
79,233
TOTAL POPULATION
39,337
MALE POPULATION
39,896
FEMALE POPULATION
98.60
MALES / 100 FEMALES
101.42
FEMALES / 100 MALES
40.5
MEDIAN AGE
3.2
AVG FAMILY SIZE
2.6
AVG HOUSEHOLD SIZE
42,780
LABOR FORCE [ PEOPLE ]
66.1%
PERCENT IN LABOR FORCE
5.8%
UNEMPLOYMENT RATE
Napa Area Codes
Income in Napa
Income Overview in Napa
Per Capita Income in Napa is $48,578, while median incomes of families and households are $114,511 and $100,273 respectively.
| Characteristic | Number | Measure |
| Per Capita Income | 79,233 | $48,578 |
| Median Family Income | 19,469 | $114,511 |
| Mean Family Income | 19,469 | $141,800 |
| Median Household Income | 29,443 | $100,273 |
| Mean Household Income | 29,443 | $127,154 |
| Income Deficit | 19,469 | $9,632 |
| Wage / Income Gap (%) | 79,233 | 15.90% |
| Wage / Income Gap ($) | 79,233 | 84.10¢ per $1 |
| Gini / Inequality Index | 79,233 | 0.43 |
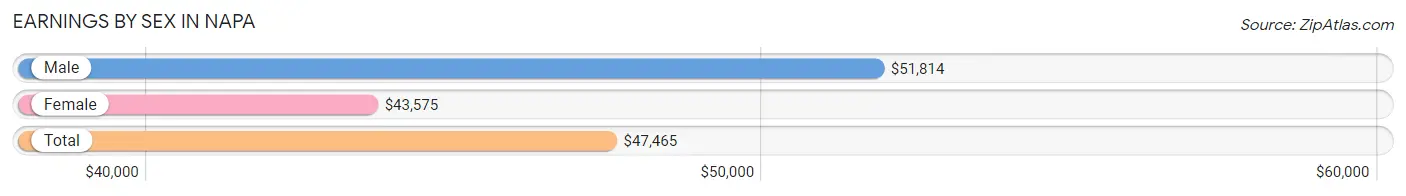
Earnings by Sex in Napa
Average Earnings in Napa are $47,465, $51,814 for men and $43,575 for women, a difference of 15.9%.
| Sex | Number | Average Earnings |
| Male | 23,125 (52.7%) | $51,814 |
| Female | 20,789 (47.3%) | $43,575 |
| Total | 43,914 (100.0%) | $47,465 |
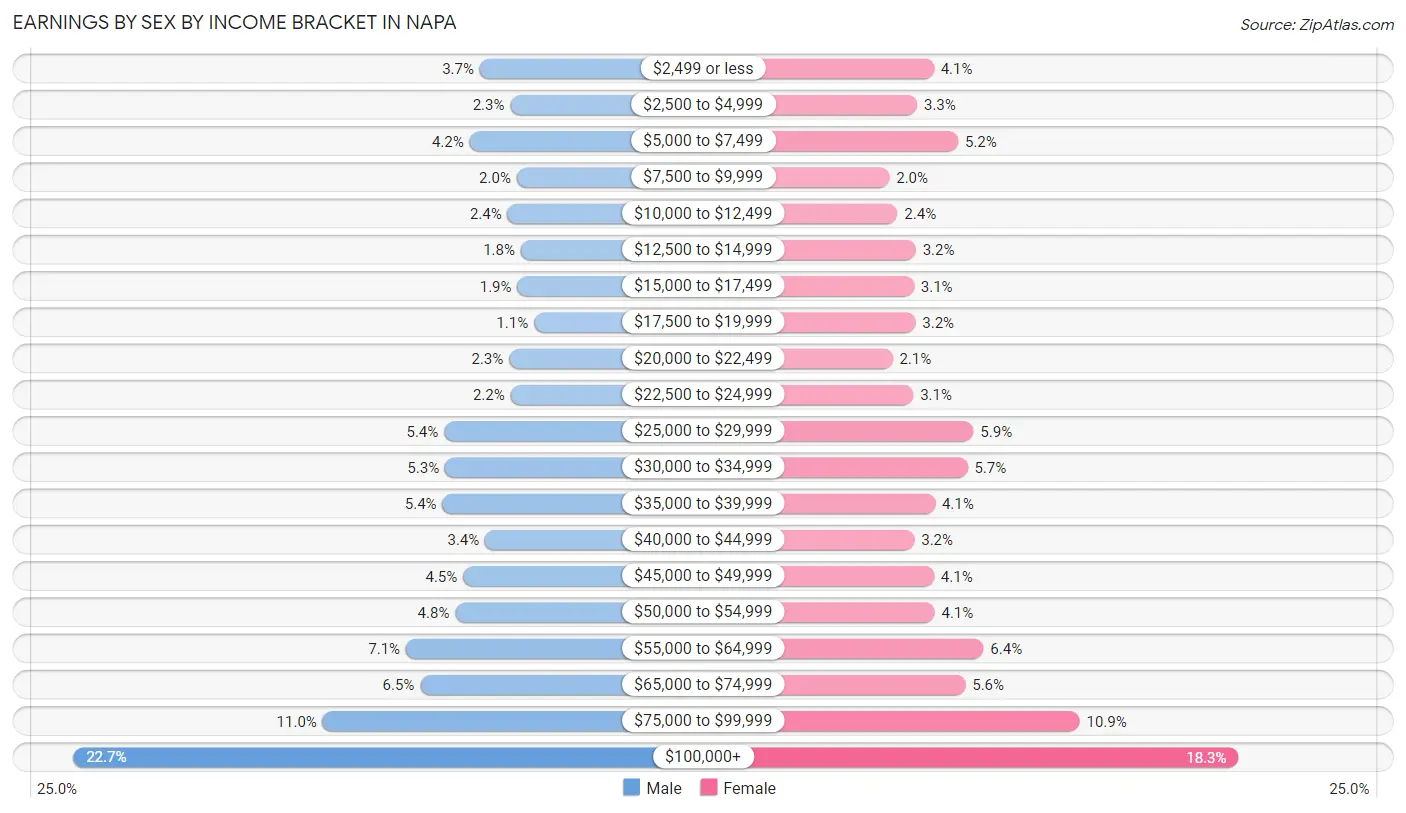
Earnings by Sex by Income Bracket in Napa
The most common earnings brackets in Napa are $100,000+ for men (5,254 | 22.7%) and $100,000+ for women (3,813 | 18.3%).
| Income | Male | Female |
| $2,499 or less | 851 (3.7%) | 847 (4.1%) |
| $2,500 to $4,999 | 521 (2.2%) | 684 (3.3%) |
| $5,000 to $7,499 | 963 (4.2%) | 1,084 (5.2%) |
| $7,500 to $9,999 | 452 (1.9%) | 413 (2.0%) |
| $10,000 to $12,499 | 550 (2.4%) | 493 (2.4%) |
| $12,500 to $14,999 | 407 (1.8%) | 671 (3.2%) |
| $15,000 to $17,499 | 444 (1.9%) | 652 (3.1%) |
| $17,500 to $19,999 | 264 (1.1%) | 667 (3.2%) |
| $20,000 to $22,499 | 535 (2.3%) | 444 (2.1%) |
| $22,500 to $24,999 | 517 (2.2%) | 646 (3.1%) |
| $25,000 to $29,999 | 1,237 (5.3%) | 1,232 (5.9%) |
| $30,000 to $34,999 | 1,229 (5.3%) | 1,174 (5.7%) |
| $35,000 to $39,999 | 1,256 (5.4%) | 858 (4.1%) |
| $40,000 to $44,999 | 793 (3.4%) | 656 (3.2%) |
| $45,000 to $49,999 | 1,032 (4.5%) | 849 (4.1%) |
| $50,000 to $54,999 | 1,118 (4.8%) | 855 (4.1%) |
| $55,000 to $64,999 | 1,651 (7.1%) | 1,331 (6.4%) |
| $65,000 to $74,999 | 1,497 (6.5%) | 1,154 (5.6%) |
| $75,000 to $99,999 | 2,554 (11.0%) | 2,266 (10.9%) |
| $100,000+ | 5,254 (22.7%) | 3,813 (18.3%) |
| Total | 23,125 (100.0%) | 20,789 (100.0%) |
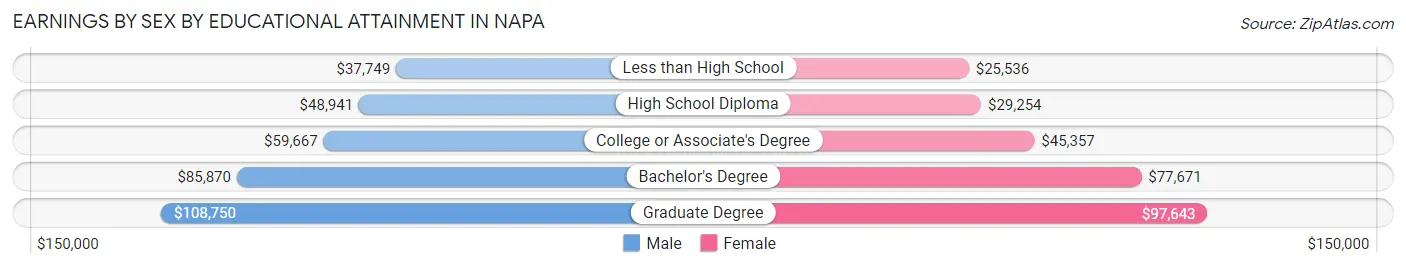
Earnings by Sex by Educational Attainment in Napa
Average earnings in Napa are $57,881 for men and $52,591 for women, a difference of 9.1%. Men with an educational attainment of graduate degree enjoy the highest average annual earnings of $108,750, while those with less than high school education earn the least with $37,749. Women with an educational attainment of graduate degree earn the most with the average annual earnings of $97,643, while those with less than high school education have the smallest earnings of $25,536.
| Educational Attainment | Male Income | Female Income |
| Less than High School | $37,749 | $25,536 |
| High School Diploma | $48,941 | $29,254 |
| College or Associate's Degree | $59,667 | $45,357 |
| Bachelor's Degree | $85,870 | $77,671 |
| Graduate Degree | $108,750 | $97,643 |
| Total | $57,881 | $52,591 |
Family Income in Napa
Family Income Brackets in Napa
According to the Napa family income data, there are 4,400 families falling into the $100,000 to $149,999 income range, which is the most common income bracket and makes up 22.6% of all families. Conversely, the $10,000 to $14,999 income bracket is the least frequent group with only 214 families (1.1%) belonging to this category.
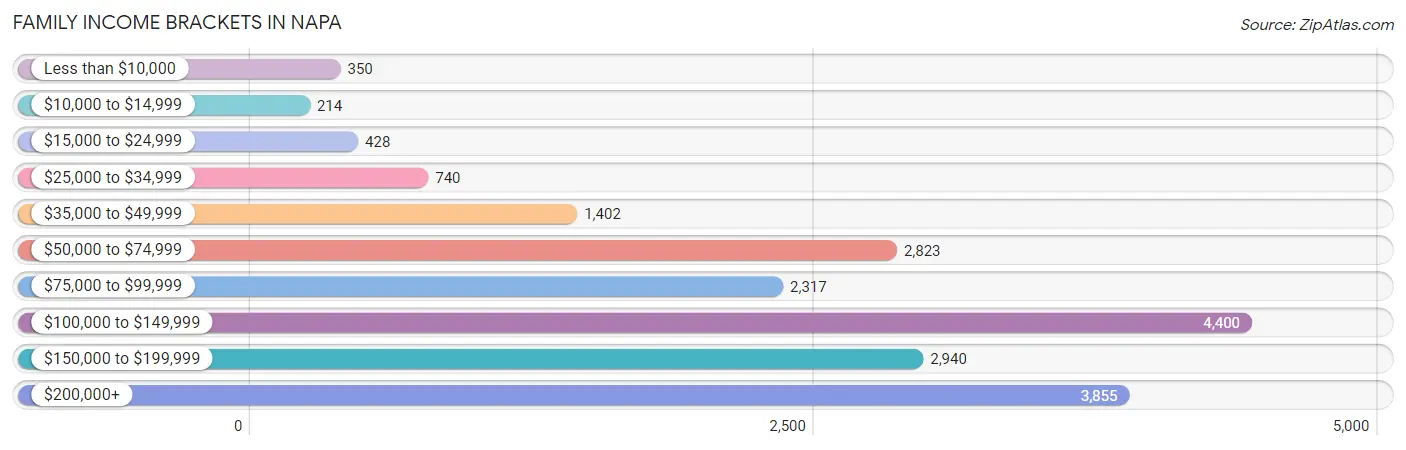
| Income Bracket | # Families | % Families |
| Less than $10,000 | 350 | 1.8% |
| $10,000 to $14,999 | 214 | 1.1% |
| $15,000 to $24,999 | 428 | 2.2% |
| $25,000 to $34,999 | 740 | 3.8% |
| $35,000 to $49,999 | 1,402 | 7.2% |
| $50,000 to $74,999 | 2,823 | 14.5% |
| $75,000 to $99,999 | 2,317 | 11.9% |
| $100,000 to $149,999 | 4,400 | 22.6% |
| $150,000 to $199,999 | 2,940 | 15.1% |
| $200,000+ | 3,855 | 19.8% |
Family Income by Famaliy Size in Napa
7+ person families (384 | 2.0%) account for the highest median family income in Napa with $152,000 per family, while 2-person families (9,287 | 47.7%) have the highest median income of $54,441 per family member.
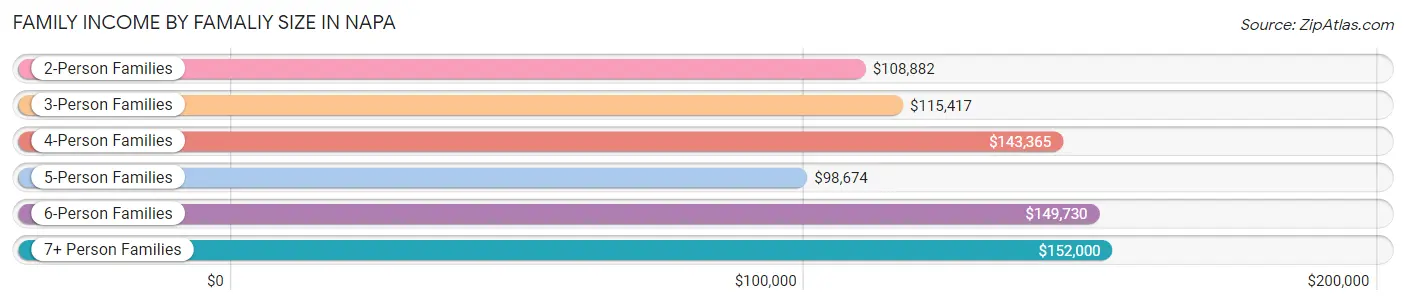
| Income Bracket | # Families | Median Income |
| 2-Person Families | 9,287 (47.7%) | $108,882 |
| 3-Person Families | 3,654 (18.8%) | $115,417 |
| 4-Person Families | 3,565 (18.3%) | $143,365 |
| 5-Person Families | 1,949 (10.0%) | $98,674 |
| 6-Person Families | 630 (3.2%) | $149,730 |
| 7+ Person Families | 384 (2.0%) | $152,000 |
| Total | 19,469 (100.0%) | $114,511 |
Family Income by Number of Earners in Napa
The median family income in Napa is $114,511, with families comprising 3+ earners (2,951) having the highest median family income of $143,319, while families with 1 earner (5,765) have the lowest median family income of $73,726, accounting for 15.2% and 29.6% of families, respectively.
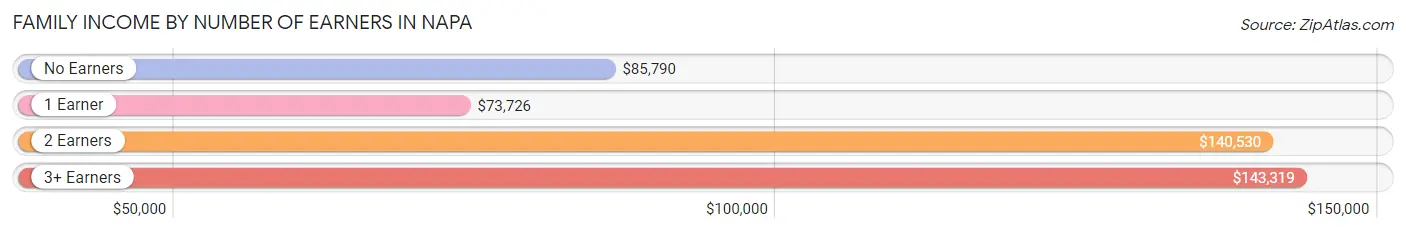
| Number of Earners | # Families | Median Income |
| No Earners | 2,555 (13.1%) | $85,790 |
| 1 Earner | 5,765 (29.6%) | $73,726 |
| 2 Earners | 8,198 (42.1%) | $140,530 |
| 3+ Earners | 2,951 (15.2%) | $143,319 |
| Total | 19,469 (100.0%) | $114,511 |
Household Income in Napa
Household Income Brackets in Napa
With 6,036 households falling in the category, the $100,000 to $149,999 income range is the most frequent in Napa, accounting for 20.5% of all households. In contrast, only 707 households (2.4%) fall into the $10,000 to $14,999 income bracket, making it the least populous group.
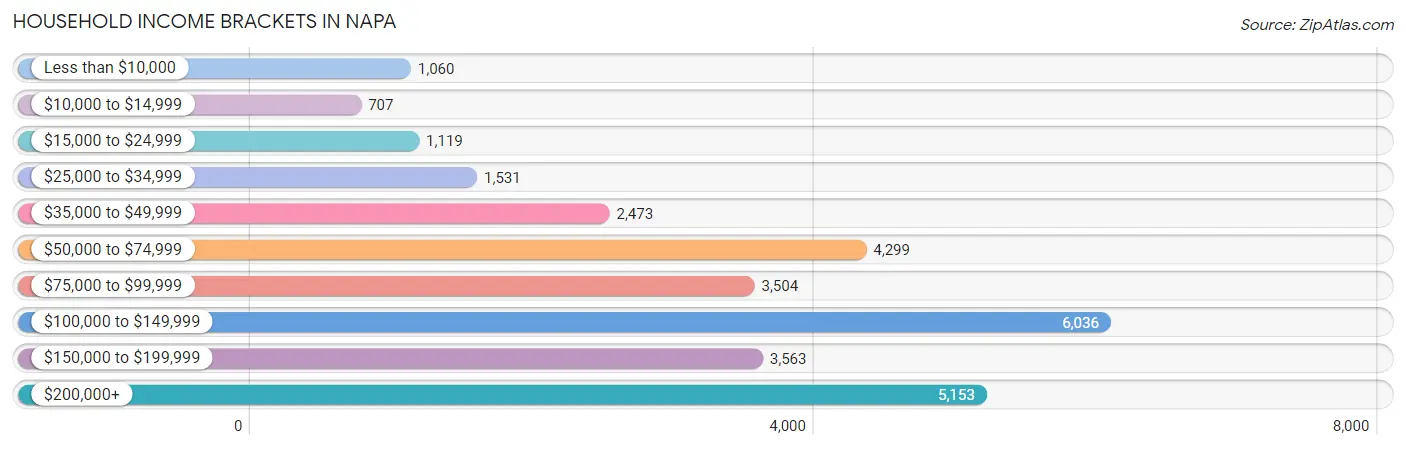
| Income Bracket | # Households | % Households |
| Less than $10,000 | 1,060 | 3.6% |
| $10,000 to $14,999 | 707 | 2.4% |
| $15,000 to $24,999 | 1,119 | 3.8% |
| $25,000 to $34,999 | 1,531 | 5.2% |
| $35,000 to $49,999 | 2,473 | 8.4% |
| $50,000 to $74,999 | 4,299 | 14.6% |
| $75,000 to $99,999 | 3,504 | 11.9% |
| $100,000 to $149,999 | 6,036 | 20.5% |
| $150,000 to $199,999 | 3,563 | 12.1% |
| $200,000+ | 5,153 | 17.5% |
Household Income by Householder Age in Napa
The median household income in Napa is $100,273, with the highest median household income of $118,440 found in the 45 to 64 years age bracket for the primary householder. A total of 10,778 households (36.6%) fall into this category. Meanwhile, the 15 to 24 years age bracket for the primary householder has the lowest median household income of $43,558, with 449 households (1.5%) in this group.
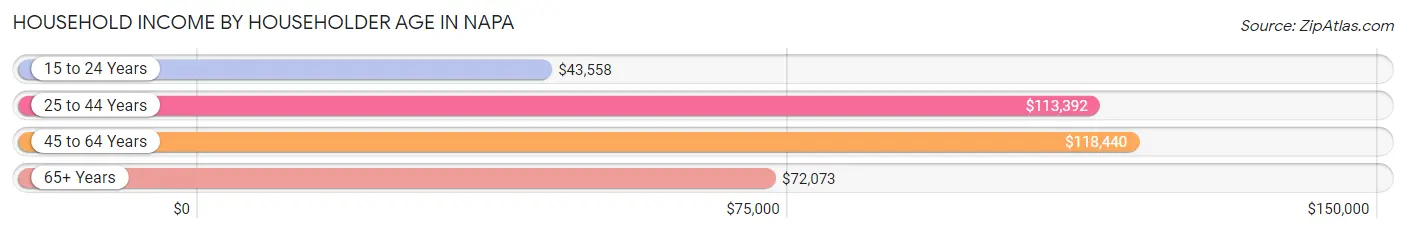
| Income Bracket | # Households | Median Income |
| 15 to 24 Years | 449 (1.5%) | $43,558 |
| 25 to 44 Years | 9,213 (31.3%) | $113,392 |
| 45 to 64 Years | 10,778 (36.6%) | $118,440 |
| 65+ Years | 9,003 (30.6%) | $72,073 |
| Total | 29,443 (100.0%) | $100,273 |
Poverty in Napa
Income Below Poverty by Sex and Age in Napa
With 7.4% poverty level for males and 8.8% for females among the residents of Napa, under 5 year old males and 5 year old females are the most vulnerable to poverty, with 385 males (19.2%) and 54 females (15.7%) in their respective age groups living below the poverty level.
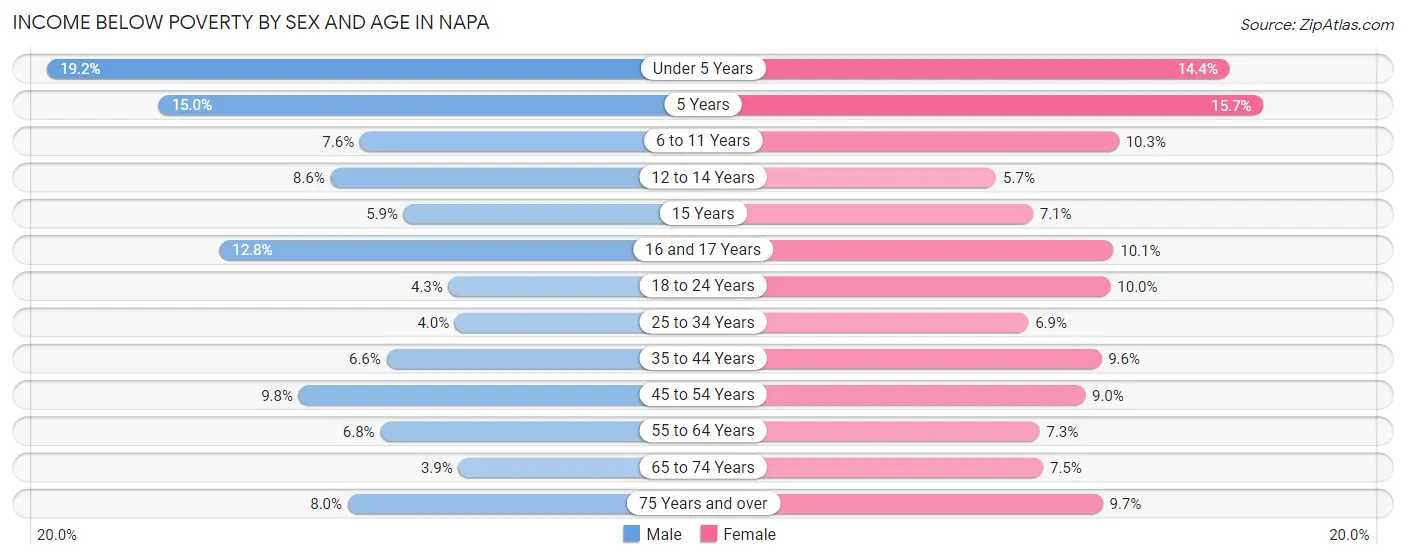
| Age Bracket | Male | Female |
| Under 5 Years | 385 (19.2%) | 292 (14.4%) |
| 5 Years | 79 (15.0%) | 54 (15.7%) |
| 6 to 11 Years | 202 (7.5%) | 220 (10.3%) |
| 12 to 14 Years | 153 (8.6%) | 108 (5.7%) |
| 15 Years | 25 (5.9%) | 38 (7.1%) |
| 16 and 17 Years | 157 (12.8%) | 104 (10.1%) |
| 18 to 24 Years | 133 (4.3%) | 318 (10.0%) |
| 25 to 34 Years | 202 (4.0%) | 371 (6.9%) |
| 35 to 44 Years | 380 (6.6%) | 488 (9.6%) |
| 45 to 54 Years | 490 (9.8%) | 465 (9.0%) |
| 55 to 64 Years | 343 (6.8%) | 365 (7.3%) |
| 65 to 74 Years | 154 (3.9%) | 318 (7.5%) |
| 75 Years and over | 194 (8.0%) | 341 (9.7%) |
| Total | 2,897 (7.4%) | 3,482 (8.8%) |
Income Above Poverty by Sex and Age in Napa
According to the poverty statistics in Napa, males aged 65 to 74 years and females aged 12 to 14 years are the age groups that are most secure financially, with 96.1% of males and 94.3% of females in these age groups living above the poverty line.
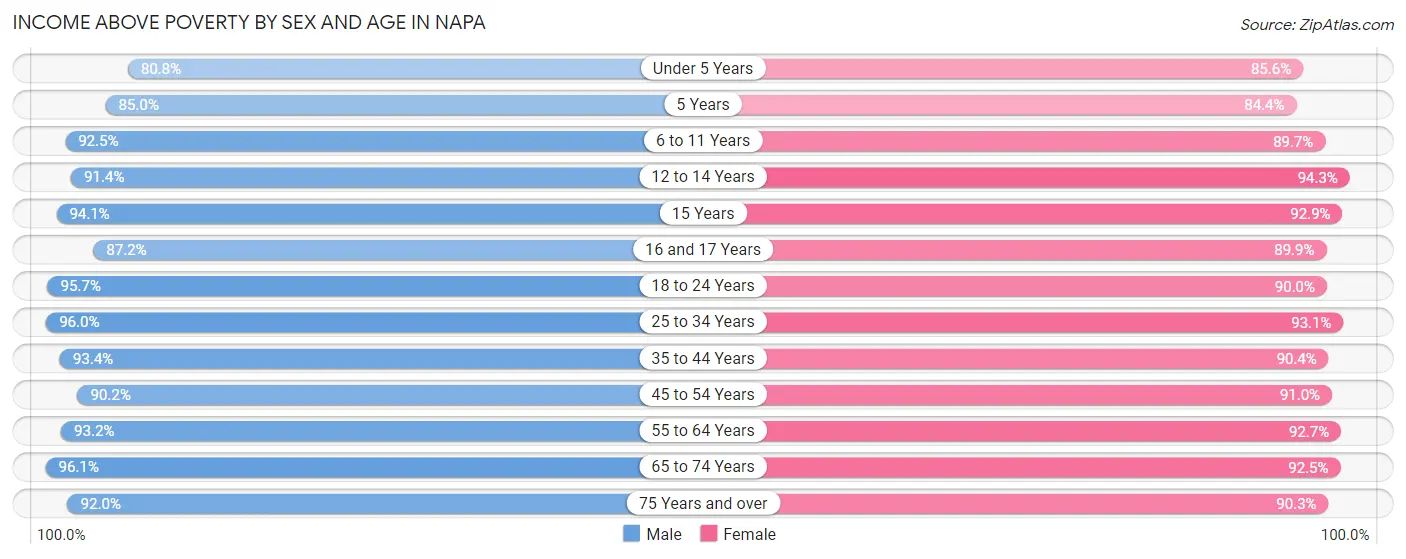
| Age Bracket | Male | Female |
| Under 5 Years | 1,624 (80.8%) | 1,736 (85.6%) |
| 5 Years | 447 (85.0%) | 291 (84.4%) |
| 6 to 11 Years | 2,474 (92.4%) | 1,920 (89.7%) |
| 12 to 14 Years | 1,617 (91.4%) | 1,778 (94.3%) |
| 15 Years | 397 (94.1%) | 498 (92.9%) |
| 16 and 17 Years | 1,072 (87.2%) | 928 (89.9%) |
| 18 to 24 Years | 2,986 (95.7%) | 2,870 (90.0%) |
| 25 to 34 Years | 4,819 (96.0%) | 4,993 (93.1%) |
| 35 to 44 Years | 5,411 (93.4%) | 4,582 (90.4%) |
| 45 to 54 Years | 4,500 (90.2%) | 4,682 (91.0%) |
| 55 to 64 Years | 4,710 (93.2%) | 4,609 (92.7%) |
| 65 to 74 Years | 3,806 (96.1%) | 3,940 (92.5%) |
| 75 Years and over | 2,231 (92.0%) | 3,183 (90.3%) |
| Total | 36,094 (92.6%) | 36,010 (91.2%) |
Income Below Poverty Among Married-Couple Families in Napa
The poverty statistics for married-couple families in Napa show that 3.3% or 496 of the total 14,854 families live below the poverty line. Families with 5 or more children have the highest poverty rate of 19.7%, comprising of 12 families. On the other hand, families with no children have the lowest poverty rate of 2.7%, which includes 232 families.
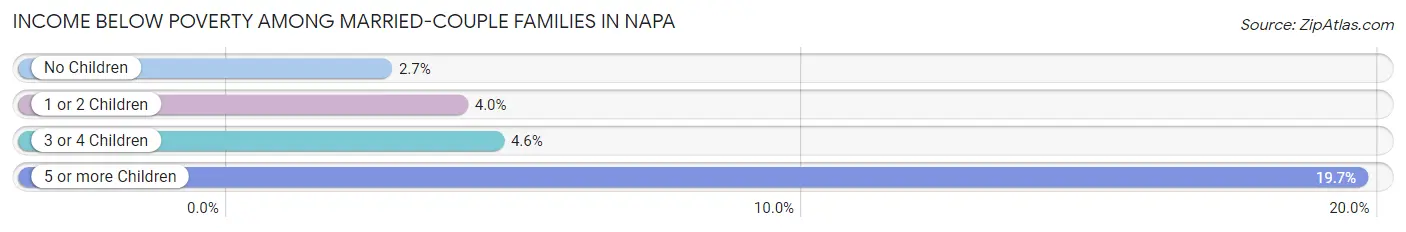
| Children | Above Poverty | Below Poverty |
| No Children | 8,438 (97.3%) | 232 (2.7%) |
| 1 or 2 Children | 4,820 (96.0%) | 201 (4.0%) |
| 3 or 4 Children | 1,051 (95.4%) | 51 (4.6%) |
| 5 or more Children | 49 (80.3%) | 12 (19.7%) |
| Total | 14,358 (96.7%) | 496 (3.3%) |
Income Below Poverty Among Single-Parent Households in Napa
According to the poverty data in Napa, 9.5% or 152 single-father households and 12.8% or 385 single-mother households are living below the poverty line. Among single-father households, those with 3 or 4 children have the highest poverty rate, with 32 households (26.0%) experiencing poverty. Likewise, among single-mother households, those with 3 or 4 children have the highest poverty rate, with 65 households (24.0%) falling below the poverty line.
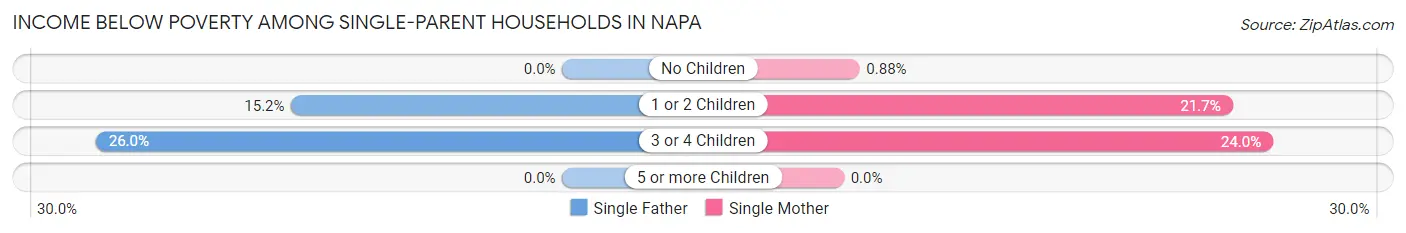
| Children | Single Father | Single Mother |
| No Children | 0 (0.0%) | 11 (0.9%) |
| 1 or 2 Children | 120 (15.1%) | 309 (21.7%) |
| 3 or 4 Children | 32 (26.0%) | 65 (24.0%) |
| 5 or more Children | 0 (0.0%) | 0 (0.0%) |
| Total | 152 (9.5%) | 385 (12.8%) |
Income Below Poverty Among Married-Couple vs Single-Parent Households in Napa
The poverty data for Napa shows that 496 of the married-couple family households (3.3%) and 537 of the single-parent households (11.6%) are living below the poverty level. Within the married-couple family households, those with 5 or more children have the highest poverty rate, with 12 households (19.7%) falling below the poverty line. Among the single-parent households, those with 3 or 4 children have the highest poverty rate, with 97 household (24.6%) living below poverty.
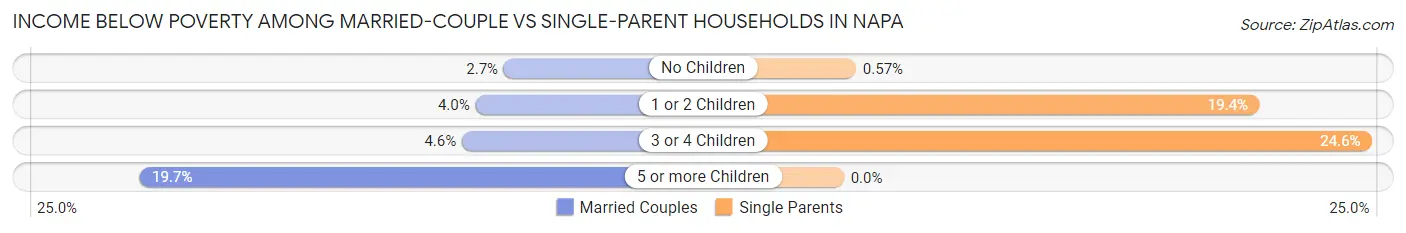
| Children | Married-Couple Families | Single-Parent Households |
| No Children | 232 (2.7%) | 11 (0.6%) |
| 1 or 2 Children | 201 (4.0%) | 429 (19.4%) |
| 3 or 4 Children | 51 (4.6%) | 97 (24.6%) |
| 5 or more Children | 12 (19.7%) | 0 (0.0%) |
| Total | 496 (3.3%) | 537 (11.6%) |
Race in Napa
The most populous races in Napa are White / Caucasian (52,666 | 66.5%), Hispanic or Latino (32,356 | 40.8%), and Some other Race (12,519 | 15.8%).
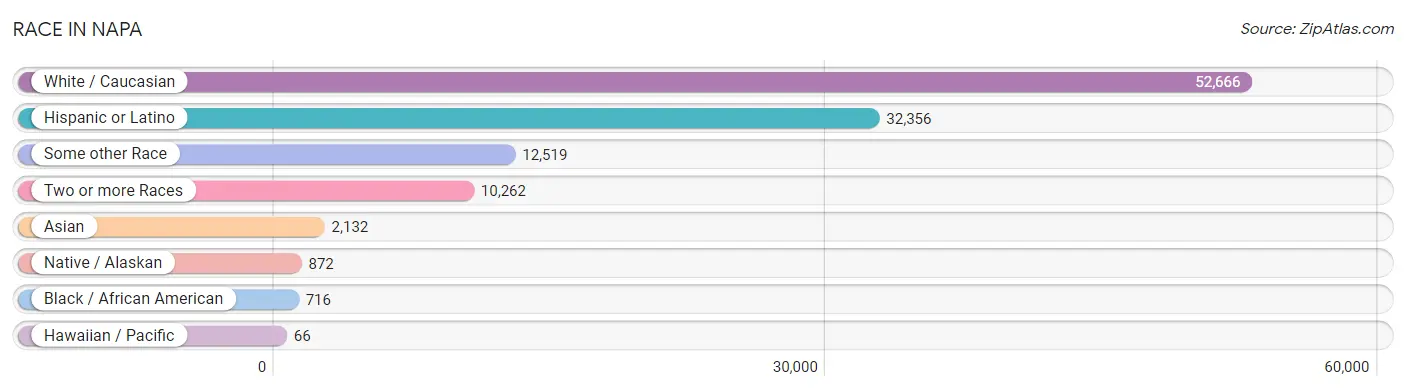
| Race | # Population | % Population |
| Asian | 2,132 | 2.7% |
| Black / African American | 716 | 0.9% |
| Hawaiian / Pacific | 66 | 0.1% |
| Hispanic or Latino | 32,356 | 40.8% |
| Native / Alaskan | 872 | 1.1% |
| White / Caucasian | 52,666 | 66.5% |
| Two or more Races | 10,262 | 13.0% |
| Some other Race | 12,519 | 15.8% |
| Total | 79,233 | 100.0% |
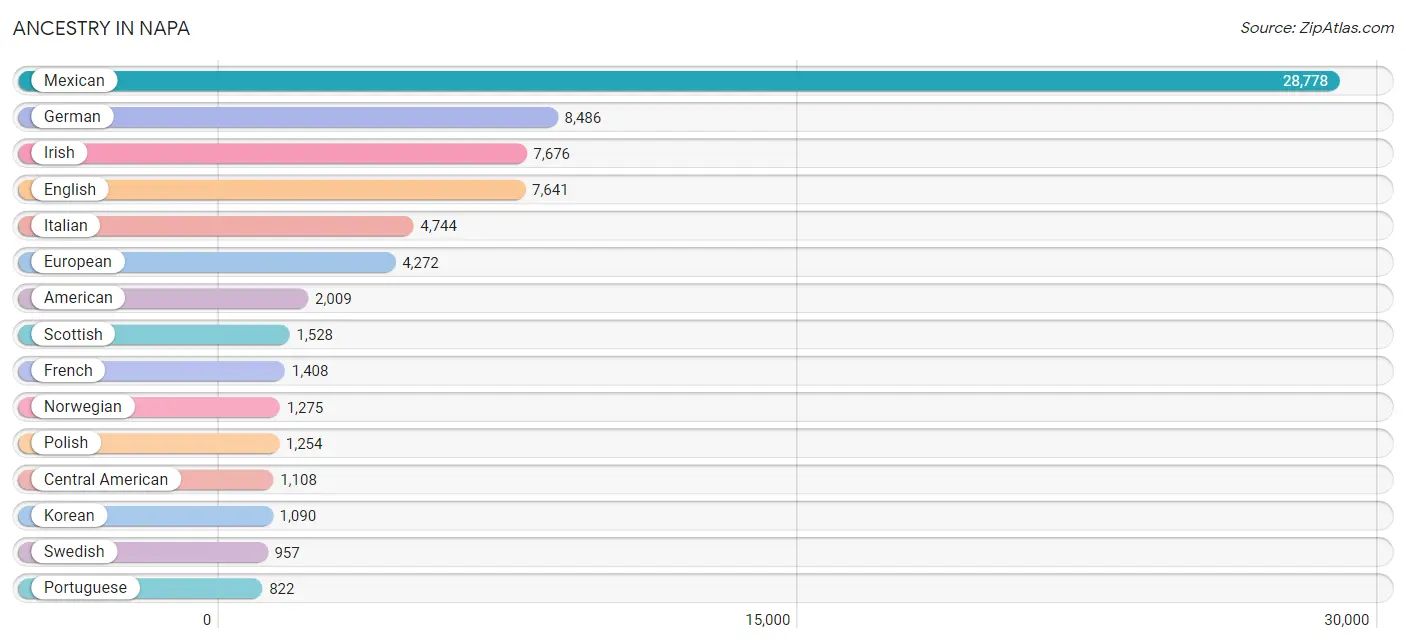
Ancestry in Napa
The most populous ancestries reported in Napa are Mexican (28,778 | 36.3%), German (8,486 | 10.7%), Irish (7,676 | 9.7%), English (7,641 | 9.6%), and Italian (4,744 | 6.0%), together accounting for 72.4% of all Napa residents.
| Ancestry | # Population | % Population |
| African | 11 | 0.0% |
| Alaska Native | 19 | 0.0% |
| Alsatian | 14 | 0.0% |
| American | 2,009 | 2.5% |
| Apache | 145 | 0.2% |
| Arab | 250 | 0.3% |
| Argentinean | 15 | 0.0% |
| Armenian | 142 | 0.2% |
| Assyrian / Chaldean / Syriac | 5 | 0.0% |
| Australian | 32 | 0.0% |
| Austrian | 73 | 0.1% |
| Bangladeshi | 16 | 0.0% |
| Basque | 70 | 0.1% |
| Belgian | 33 | 0.0% |
| Bhutanese | 648 | 0.8% |
| Blackfeet | 61 | 0.1% |
| Brazilian | 43 | 0.1% |
| British | 787 | 1.0% |
| Burmese | 215 | 0.3% |
| Canadian | 247 | 0.3% |
| Cape Verdean | 24 | 0.0% |
| Central American | 1,108 | 1.4% |
| Central American Indian | 163 | 0.2% |
| Cherokee | 234 | 0.3% |
| Cheyenne | 10 | 0.0% |
| Chilean | 41 | 0.1% |
| Choctaw | 254 | 0.3% |
| Colombian | 136 | 0.2% |
| Costa Rican | 9 | 0.0% |
| Cree | 7 | 0.0% |
| Croatian | 57 | 0.1% |
| Cuban | 155 | 0.2% |
| Czech | 325 | 0.4% |
| Czechoslovakian | 57 | 0.1% |
| Danish | 772 | 1.0% |
| Dominican | 27 | 0.0% |
| Dutch | 591 | 0.7% |
| Eastern European | 268 | 0.3% |
| Ecuadorian | 12 | 0.0% |
| Egyptian | 2 | 0.0% |
| English | 7,641 | 9.6% |
| Estonian | 19 | 0.0% |
| Ethiopian | 24 | 0.0% |
| European | 4,272 | 5.4% |
| Filipino | 19 | 0.0% |
| Finnish | 184 | 0.2% |
| French | 1,408 | 1.8% |
| French Canadian | 173 | 0.2% |
| German | 8,486 | 10.7% |
| Ghanaian | 2 | 0.0% |
| Greek | 229 | 0.3% |
| Guatemalan | 742 | 0.9% |
| Honduran | 9 | 0.0% |
| Hungarian | 202 | 0.3% |
| Indian (Asian) | 815 | 1.0% |
| Indonesian | 12 | 0.0% |
| Iranian | 103 | 0.1% |
| Irish | 7,676 | 9.7% |
| Iroquois | 12 | 0.0% |
| Israeli | 56 | 0.1% |
| Italian | 4,744 | 6.0% |
| Jamaican | 137 | 0.2% |
| Korean | 1,090 | 1.4% |
| Laotian | 103 | 0.1% |
| Latvian | 14 | 0.0% |
| Lebanese | 101 | 0.1% |
| Lithuanian | 139 | 0.2% |
| Macedonian | 17 | 0.0% |
| Malaysian | 6 | 0.0% |
| Mexican | 28,778 | 36.3% |
| Mexican American Indian | 690 | 0.9% |
| Mongolian | 8 | 0.0% |
| Moroccan | 8 | 0.0% |
| Native Hawaiian | 271 | 0.3% |
| Navajo | 25 | 0.0% |
| Nicaraguan | 106 | 0.1% |
| Nigerian | 26 | 0.0% |
| Northern European | 471 | 0.6% |
| Norwegian | 1,275 | 1.6% |
| Pakistani | 43 | 0.1% |
| Palestinian | 22 | 0.0% |
| Panamanian | 16 | 0.0% |
| Pennsylvania German | 12 | 0.0% |
| Peruvian | 235 | 0.3% |
| Polish | 1,254 | 1.6% |
| Portuguese | 822 | 1.0% |
| Potawatomi | 48 | 0.1% |
| Puerto Rican | 260 | 0.3% |
| Romanian | 60 | 0.1% |
| Russian | 493 | 0.6% |
| Salvadoran | 226 | 0.3% |
| Samoan | 94 | 0.1% |
| Scandinavian | 312 | 0.4% |
| Scotch-Irish | 486 | 0.6% |
| Scottish | 1,528 | 1.9% |
| Serbian | 11 | 0.0% |
| Sioux | 51 | 0.1% |
| Slavic | 18 | 0.0% |
| Slovak | 26 | 0.0% |
| Slovene | 48 | 0.1% |
| South African | 13 | 0.0% |
| South American | 508 | 0.6% |
| South American Indian | 6 | 0.0% |
| Spaniard | 356 | 0.4% |
| Spanish | 671 | 0.9% |
| Sri Lankan | 191 | 0.2% |
| Subsaharan African | 100 | 0.1% |
| Swedish | 957 | 1.2% |
| Swiss | 370 | 0.5% |
| Syrian | 43 | 0.1% |
| Thai | 543 | 0.7% |
| Tongan | 5 | 0.0% |
| Turkish | 57 | 0.1% |
| Ukrainian | 97 | 0.1% |
| Ute | 6 | 0.0% |
| Venezuelan | 51 | 0.1% |
| Welsh | 408 | 0.5% |
| Yugoslavian | 25 | 0.0% | View All 118 Rows |
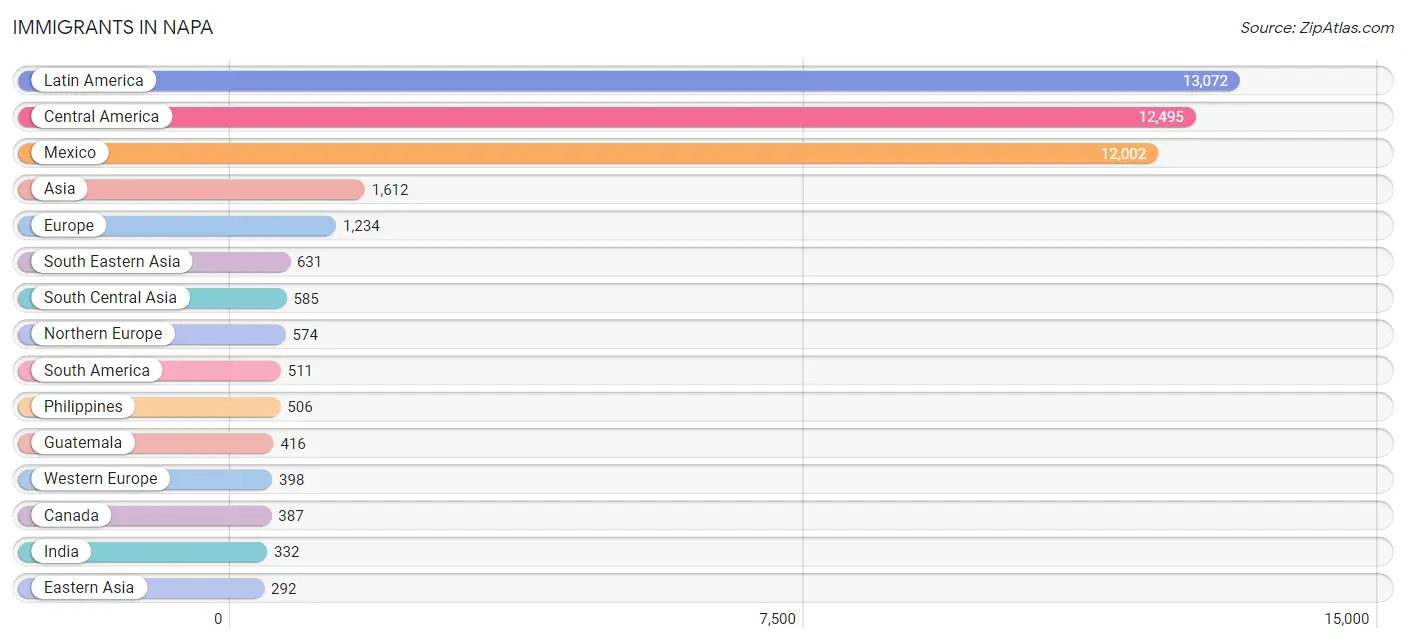
Immigrants in Napa
The most numerous immigrant groups reported in Napa came from Latin America (13,072 | 16.5%), Central America (12,495 | 15.8%), Mexico (12,002 | 15.1%), Asia (1,612 | 2.0%), and Europe (1,234 | 1.6%), together accounting for 51.0% of all Napa residents.
| Immigration Origin | # Population | % Population |
| Africa | 55 | 0.1% |
| Argentina | 15 | 0.0% |
| Armenia | 6 | 0.0% |
| Asia | 1,612 | 2.0% |
| Australia | 9 | 0.0% |
| Austria | 8 | 0.0% |
| Bangladesh | 3 | 0.0% |
| Belarus | 5 | 0.0% |
| Brazil | 175 | 0.2% |
| Canada | 387 | 0.5% |
| Caribbean | 66 | 0.1% |
| Central America | 12,495 | 15.8% |
| Chile | 35 | 0.0% |
| China | 147 | 0.2% |
| Colombia | 64 | 0.1% |
| Czechoslovakia | 20 | 0.0% |
| Denmark | 41 | 0.1% |
| Eastern Africa | 36 | 0.1% |
| Eastern Asia | 292 | 0.4% |
| Eastern Europe | 160 | 0.2% |
| Ecuador | 29 | 0.0% |
| El Salvador | 68 | 0.1% |
| England | 248 | 0.3% |
| Europe | 1,234 | 1.6% |
| Fiji | 6 | 0.0% |
| France | 185 | 0.2% |
| Germany | 150 | 0.2% |
| Greece | 11 | 0.0% |
| Guatemala | 416 | 0.5% |
| Honduras | 9 | 0.0% |
| Hong Kong | 13 | 0.0% |
| Hungary | 71 | 0.1% |
| India | 332 | 0.4% |
| Indonesia | 24 | 0.0% |
| Iran | 65 | 0.1% |
| Ireland | 39 | 0.1% |
| Italy | 13 | 0.0% |
| Jamaica | 66 | 0.1% |
| Japan | 24 | 0.0% |
| Kenya | 15 | 0.0% |
| Korea | 121 | 0.2% |
| Latin America | 13,072 | 16.5% |
| Lebanon | 56 | 0.1% |
| Malaysia | 8 | 0.0% |
| Mexico | 12,002 | 15.1% |
| Morocco | 8 | 0.0% |
| Nepal | 181 | 0.2% |
| Netherlands | 5 | 0.0% |
| Northern Africa | 8 | 0.0% |
| Northern Europe | 574 | 0.7% |
| Oceania | 24 | 0.0% |
| Peru | 188 | 0.2% |
| Philippines | 506 | 0.6% |
| Poland | 29 | 0.0% |
| Portugal | 16 | 0.0% |
| Russia | 9 | 0.0% |
| Scotland | 20 | 0.0% |
| Serbia | 5 | 0.0% |
| Singapore | 9 | 0.0% |
| South Africa | 11 | 0.0% |
| South America | 511 | 0.6% |
| South Central Asia | 585 | 0.7% |
| South Eastern Asia | 631 | 0.8% |
| Southern Europe | 98 | 0.1% |
| Spain | 58 | 0.1% |
| Sweden | 70 | 0.1% |
| Switzerland | 50 | 0.1% |
| Syria | 17 | 0.0% |
| Taiwan | 18 | 0.0% |
| Thailand | 29 | 0.0% |
| Ukraine | 12 | 0.0% |
| Uzbekistan | 4 | 0.0% |
| Venezuela | 5 | 0.0% |
| Vietnam | 37 | 0.1% |
| Western Asia | 104 | 0.1% |
| Western Europe | 398 | 0.5% |
| Yemen | 25 | 0.0% | View All 77 Rows |
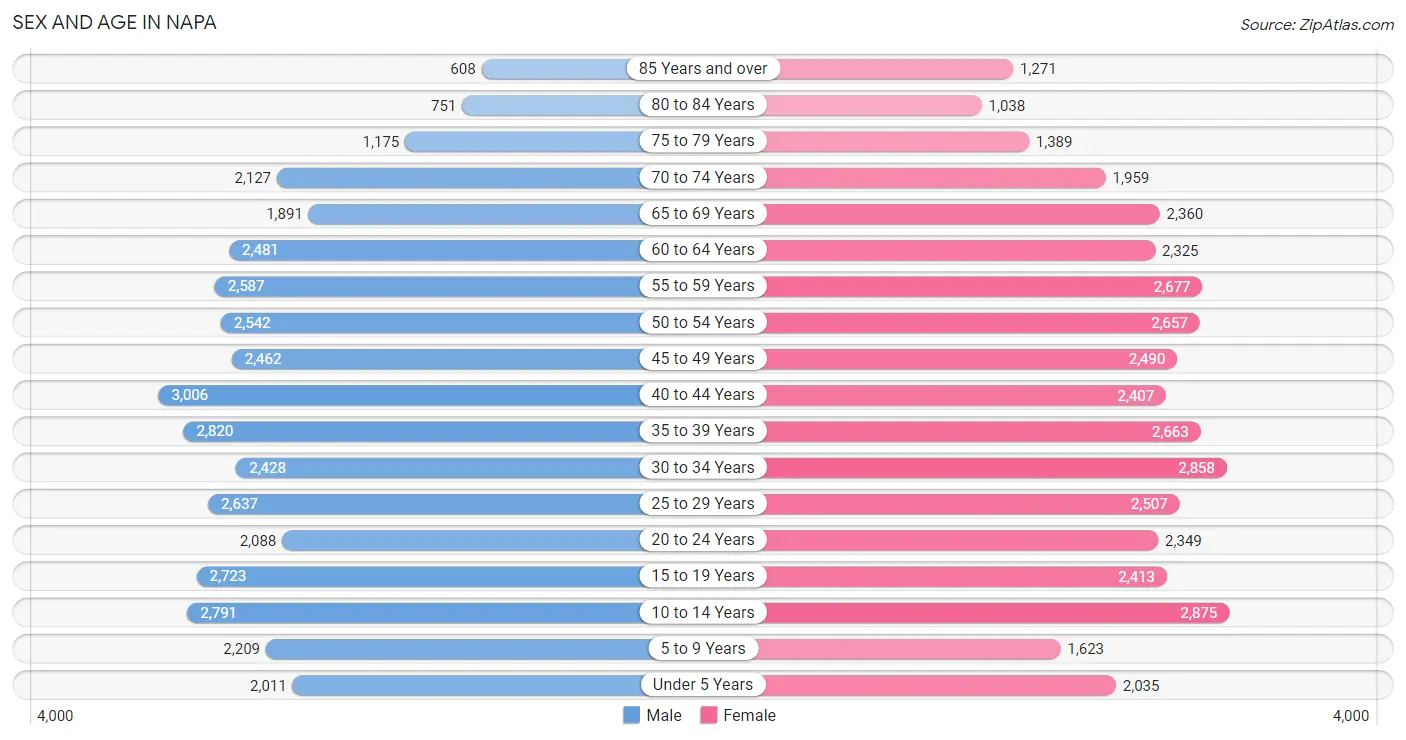
Sex and Age in Napa
Sex and Age in Napa
The most populous age groups in Napa are 40 to 44 Years (3,006 | 7.6%) for men and 10 to 14 Years (2,875 | 7.2%) for women.
| Age Bracket | Male | Female |
| Under 5 Years | 2,011 (5.1%) | 2,035 (5.1%) |
| 5 to 9 Years | 2,209 (5.6%) | 1,623 (4.1%) |
| 10 to 14 Years | 2,791 (7.1%) | 2,875 (7.2%) |
| 15 to 19 Years | 2,723 (6.9%) | 2,413 (6.0%) |
| 20 to 24 Years | 2,088 (5.3%) | 2,349 (5.9%) |
| 25 to 29 Years | 2,637 (6.7%) | 2,507 (6.3%) |
| 30 to 34 Years | 2,428 (6.2%) | 2,858 (7.2%) |
| 35 to 39 Years | 2,820 (7.2%) | 2,663 (6.7%) |
| 40 to 44 Years | 3,006 (7.6%) | 2,407 (6.0%) |
| 45 to 49 Years | 2,462 (6.3%) | 2,490 (6.2%) |
| 50 to 54 Years | 2,542 (6.5%) | 2,657 (6.7%) |
| 55 to 59 Years | 2,587 (6.6%) | 2,677 (6.7%) |
| 60 to 64 Years | 2,481 (6.3%) | 2,325 (5.8%) |
| 65 to 69 Years | 1,891 (4.8%) | 2,360 (5.9%) |
| 70 to 74 Years | 2,127 (5.4%) | 1,959 (4.9%) |
| 75 to 79 Years | 1,175 (3.0%) | 1,389 (3.5%) |
| 80 to 84 Years | 751 (1.9%) | 1,038 (2.6%) |
| 85 Years and over | 608 (1.5%) | 1,271 (3.2%) |
| Total | 39,337 (100.0%) | 39,896 (100.0%) |
Families and Households in Napa
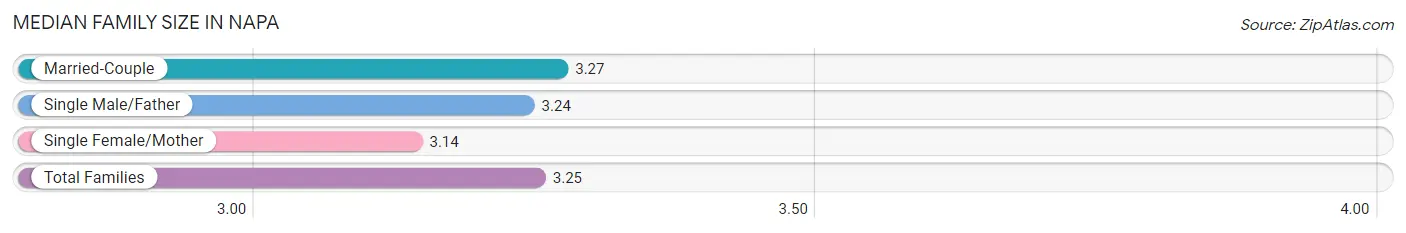
Median Family Size in Napa
The median family size in Napa is 3.25 persons per family, with married-couple families (14,854 | 76.3%) accounting for the largest median family size of 3.27 persons per family. On the other hand, single female/mother families (3,016 | 15.5%) represent the smallest median family size with 3.14 persons per family.
| Family Type | # Families | Family Size |
| Married-Couple | 14,854 (76.3%) | 3.27 |
| Single Male/Father | 1,599 (8.2%) | 3.24 |
| Single Female/Mother | 3,016 (15.5%) | 3.14 |
| Total Families | 19,469 (100.0%) | 3.25 |
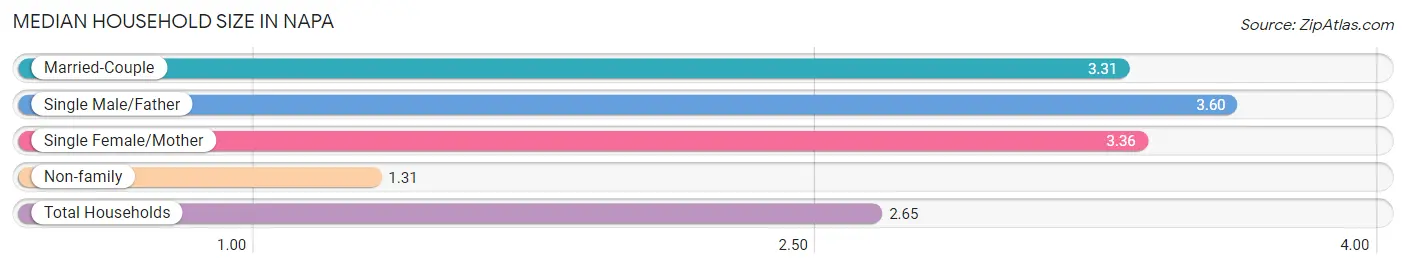
Median Household Size in Napa
The median household size in Napa is 2.65 persons per household, with single male/father households (1,599 | 5.4%) accounting for the largest median household size of 3.6 persons per household. non-family households (9,974 | 33.9%) represent the smallest median household size with 1.31 persons per household.
| Household Type | # Households | Household Size |
| Married-Couple | 14,854 (50.4%) | 3.31 |
| Single Male/Father | 1,599 (5.4%) | 3.60 |
| Single Female/Mother | 3,016 (10.2%) | 3.36 |
| Non-family | 9,974 (33.9%) | 1.31 |
| Total Households | 29,443 (100.0%) | 2.65 |
Household Size by Marriage Status in Napa
Out of a total of 29,443 households in Napa, 19,469 (66.1%) are family households, while 9,974 (33.9%) are nonfamily households. The most numerous type of family households are 2-person households, comprising 8,633, and the most common type of nonfamily households are 1-person households, comprising 7,729.
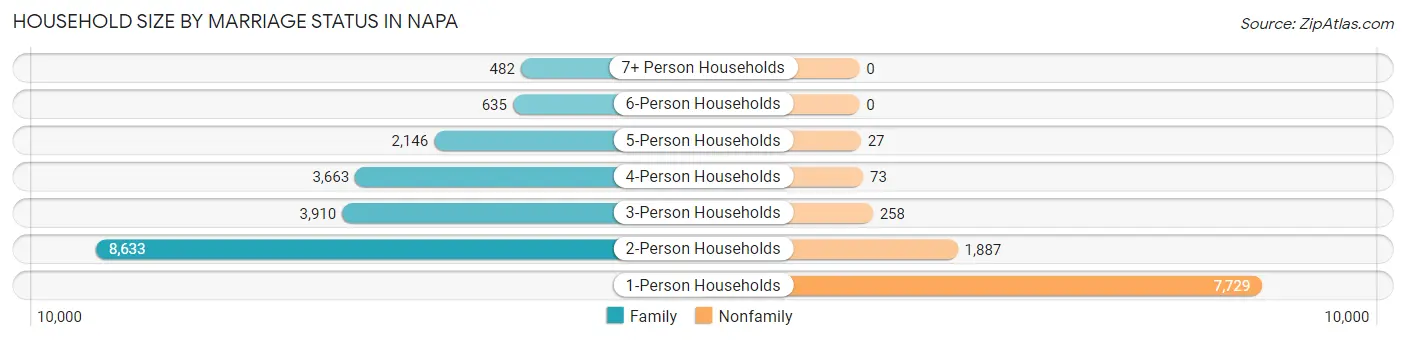
| Household Size | Family Households | Nonfamily Households |
| 1-Person Households | - | 7,729 (26.3%) |
| 2-Person Households | 8,633 (29.3%) | 1,887 (6.4%) |
| 3-Person Households | 3,910 (13.3%) | 258 (0.9%) |
| 4-Person Households | 3,663 (12.4%) | 73 (0.3%) |
| 5-Person Households | 2,146 (7.3%) | 27 (0.1%) |
| 6-Person Households | 635 (2.2%) | 0 (0.0%) |
| 7+ Person Households | 482 (1.6%) | 0 (0.0%) |
| Total | 19,469 (66.1%) | 9,974 (33.9%) |
Female Fertility in Napa
Fertility by Age in Napa
Average fertility rate in Napa is 48.0 births per 1,000 women. Women in the age bracket of 20 to 34 years have the highest fertility rate with 56.0 births per 1,000 women. Women in the age bracket of 35 to 50 years acount for 49.9% of all women with births.
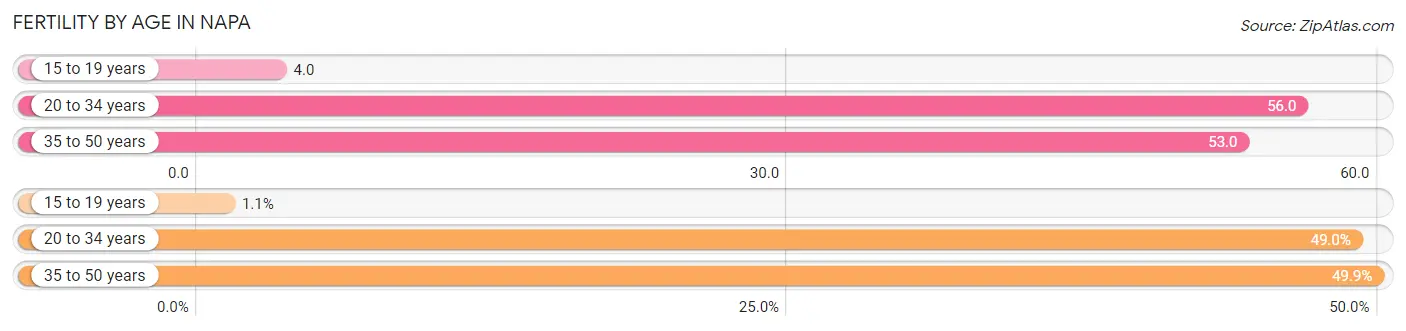
| Age Bracket | Women with Births | Births / 1,000 Women |
| 15 to 19 years | 10 (1.1%) | 4.0 |
| 20 to 34 years | 431 (49.0%) | 56.0 |
| 35 to 50 years | 439 (49.9%) | 53.0 |
| Total | 880 (100.0%) | 48.0 |
Fertility by Age by Marriage Status in Napa
62.5% of women with births (880) in Napa are married. The highest percentage of unmarried women with births falls into 15 to 19 years age bracket with 100.0% of them unmarried at the time of birth, while the lowest percentage of unmarried women with births belong to 35 to 50 years age bracket with 34.9% of them unmarried.
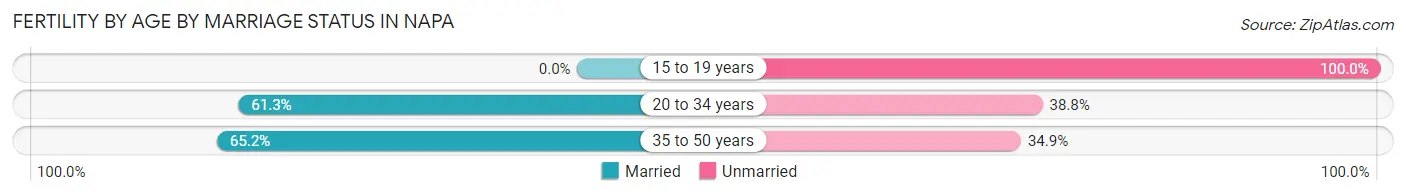
| Age Bracket | Married | Unmarried |
| 15 to 19 years | 0 (0.0%) | 10 (100.0%) |
| 20 to 34 years | 264 (61.3%) | 167 (38.8%) |
| 35 to 50 years | 286 (65.1%) | 153 (34.8%) |
| Total | 550 (62.5%) | 330 (37.5%) |
Fertility by Education in Napa
Average fertility rate in Napa is 48.0 births per 1,000 women. Women with the education attainment of graduate degree have the highest fertility rate of 122.0 births per 1,000 women, while women with the education attainment of less than high school have the lowest fertility at 32.0 births per 1,000 women. Women with the education attainment of graduate degree represent 25.3% of all women with births.
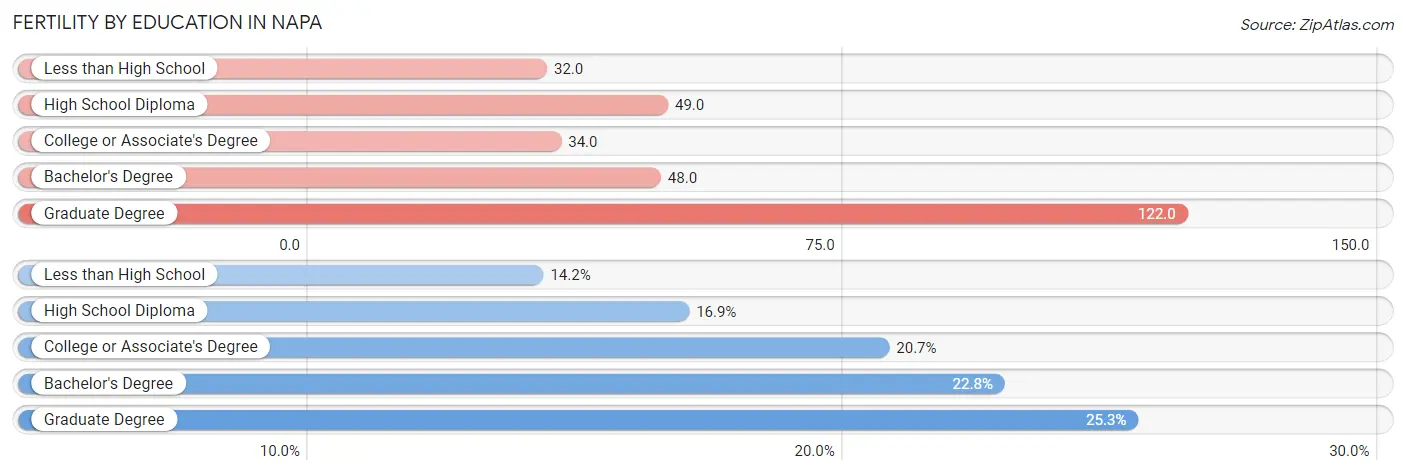
| Educational Attainment | Women with Births | Births / 1,000 Women |
| Less than High School | 125 (14.2%) | 32.0 |
| High School Diploma | 149 (16.9%) | 49.0 |
| College or Associate's Degree | 182 (20.7%) | 34.0 |
| Bachelor's Degree | 201 (22.8%) | 48.0 |
| Graduate Degree | 223 (25.3%) | 122.0 |
| Total | 880 (100.0%) | 48.0 |
Fertility by Education by Marriage Status in Napa
37.5% of women with births in Napa are unmarried. Women with the educational attainment of bachelor's degree are most likely to be married with 100.0% of them married at childbirth, while women with the educational attainment of college or associate's degree are least likely to be married with 68.1% of them unmarried at childbirth.
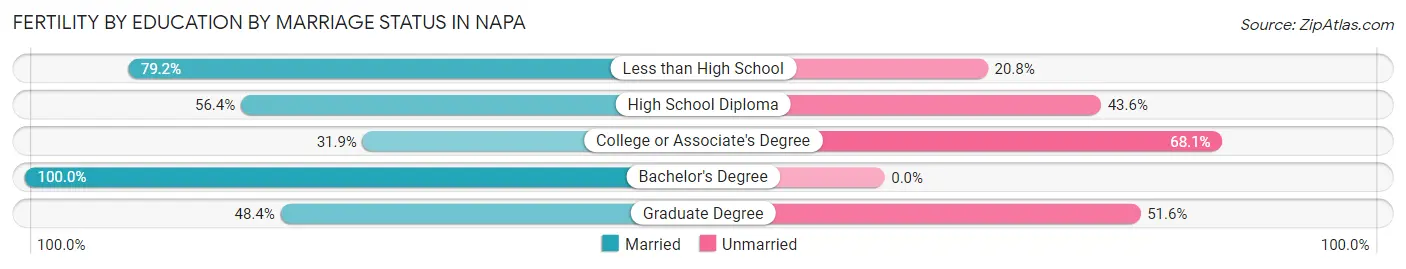
| Educational Attainment | Married | Unmarried |
| Less than High School | 99 (79.2%) | 26 (20.8%) |
| High School Diploma | 84 (56.4%) | 65 (43.6%) |
| College or Associate's Degree | 58 (31.9%) | 124 (68.1%) |
| Bachelor's Degree | 201 (100.0%) | 0 (0.0%) |
| Graduate Degree | 108 (48.4%) | 115 (51.6%) |
| Total | 550 (62.5%) | 330 (37.5%) |
Employment Characteristics in Napa
Employment by Class of Employer in Napa
Among the 39,479 employed individuals in Napa, private company employees (26,397 | 66.9%), local government employees (3,559 | 9.0%), and not-for-profit organizations (3,115 | 7.9%) make up the most common classes of employment.
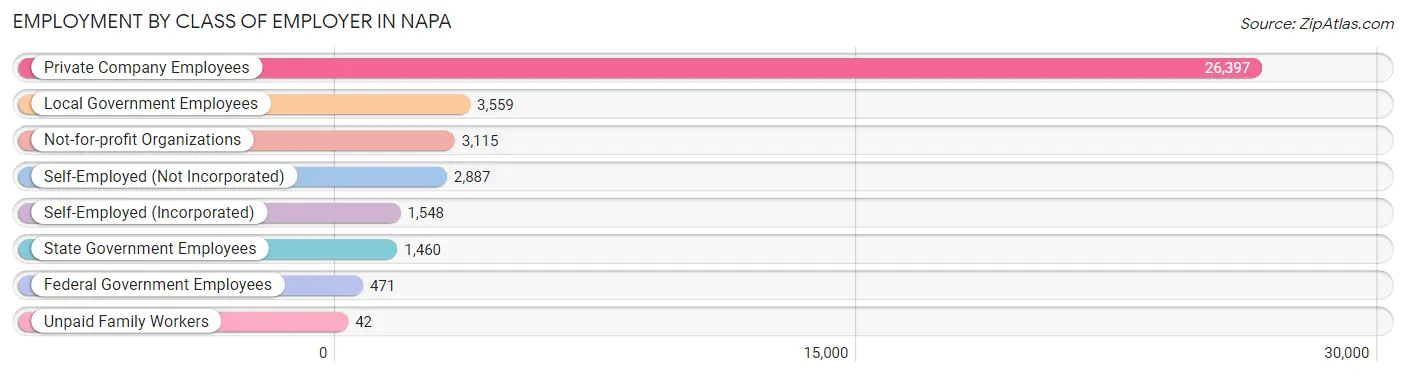
| Employer Class | # Employees | % Employees |
| Private Company Employees | 26,397 | 66.9% |
| Self-Employed (Incorporated) | 1,548 | 3.9% |
| Self-Employed (Not Incorporated) | 2,887 | 7.3% |
| Not-for-profit Organizations | 3,115 | 7.9% |
| Local Government Employees | 3,559 | 9.0% |
| State Government Employees | 1,460 | 3.7% |
| Federal Government Employees | 471 | 1.2% |
| Unpaid Family Workers | 42 | 0.1% |
| Total | 39,479 | 100.0% |
Employment Status by Age in Napa
According to the labor force statistics for Napa, out of the total population over 16 years of age (64,720), 66.1% or 42,780 individuals are in the labor force, with 5.8% or 2,481 of them unemployed. The age group with the highest labor force participation rate is 30 to 34 years, with 88.9% or 4,699 individuals in the labor force. Within the labor force, the 20 to 24 years age range has the highest percentage of unemployed individuals, with 13.9% or 473 of them being unemployed.
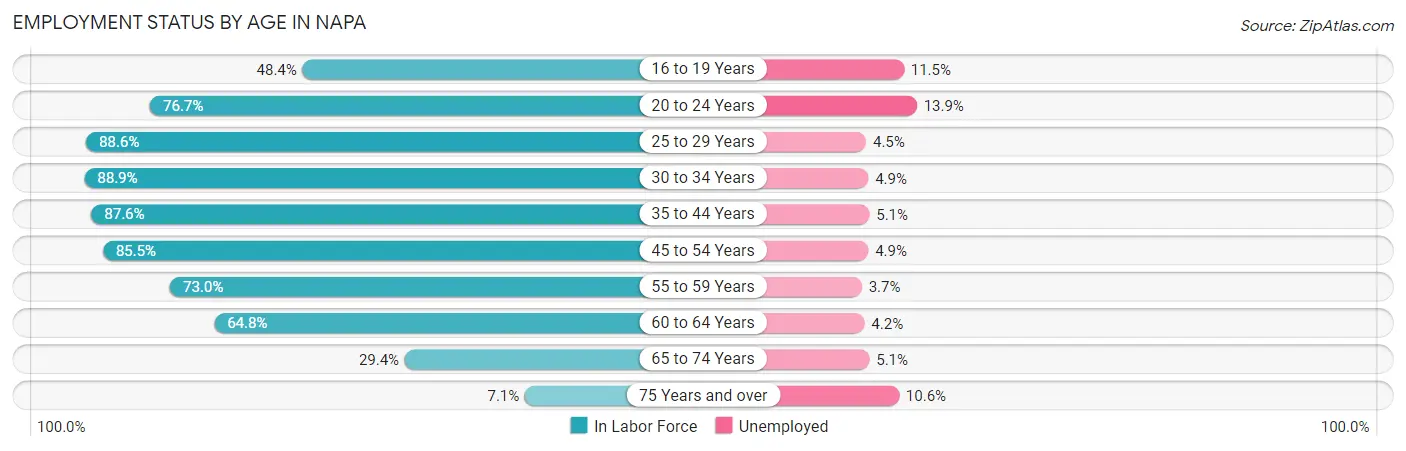
| Age Bracket | In Labor Force | Unemployed |
| 16 to 19 Years | 2,017 (48.4%) | 232 (11.5%) |
| 20 to 24 Years | 3,403 (76.7%) | 473 (13.9%) |
| 25 to 29 Years | 4,558 (88.6%) | 205 (4.5%) |
| 30 to 34 Years | 4,699 (88.9%) | 230 (4.9%) |
| 35 to 44 Years | 9,545 (87.6%) | 487 (5.1%) |
| 45 to 54 Years | 8,679 (85.5%) | 425 (4.9%) |
| 55 to 59 Years | 3,843 (73.0%) | 142 (3.7%) |
| 60 to 64 Years | 3,114 (64.8%) | 131 (4.2%) |
| 65 to 74 Years | 2,451 (29.4%) | 125 (5.1%) |
| 75 Years and over | 442 (7.1%) | 47 (10.6%) |
| Total | 42,780 (66.1%) | 2,481 (5.8%) |
Employment Status by Educational Attainment in Napa
According to labor force statistics for Napa, 82.9% of individuals (34,442) out of the total population between 25 and 64 years of age (41,547) are in the labor force, with 4.7% or 1,619 of them being unemployed. The group with the highest labor force participation rate are those with the educational attainment of bachelor's degree or higher, with 88.4% or 13,282 individuals in the labor force. Within the labor force, individuals with less than high school education have the highest percentage of unemployment, with 6.2% or 351 of them being unemployed.
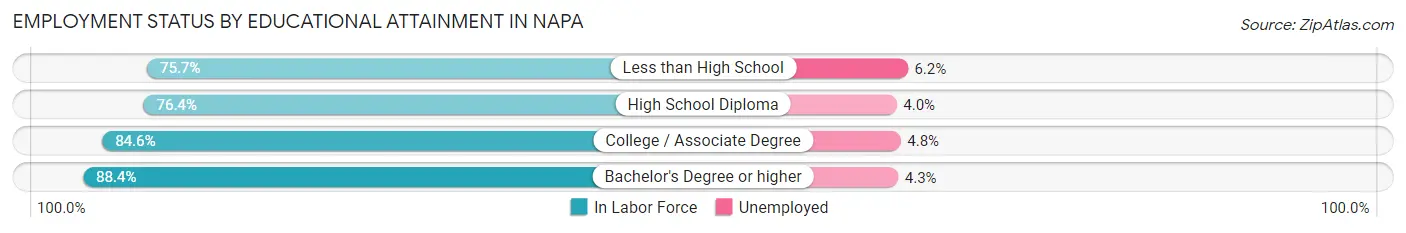
| Educational Attainment | In Labor Force | Unemployed |
| Less than High School | 5,665 (75.7%) | 464 (6.2%) |
| High School Diploma | 5,683 (76.4%) | 298 (4.0%) |
| College / Associate Degree | 9,814 (84.6%) | 557 (4.8%) |
| Bachelor's Degree or higher | 13,282 (88.4%) | 646 (4.3%) |
| Total | 34,442 (82.9%) | 1,953 (4.7%) |
Employment Occupations by Sex in Napa
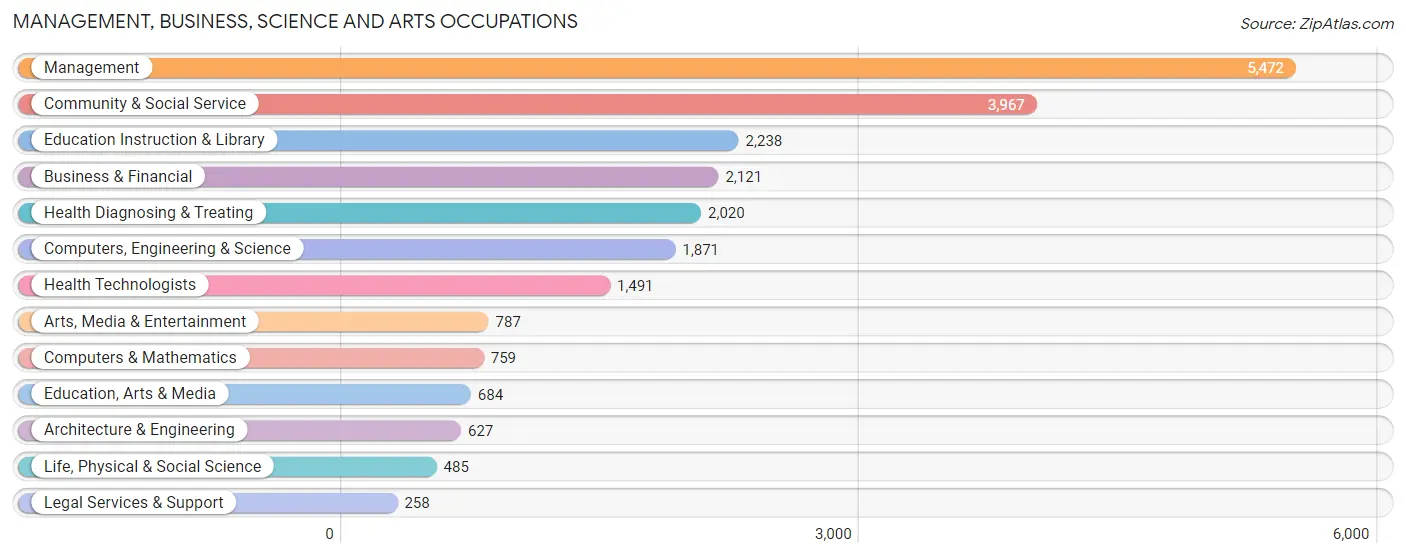
Management, Business, Science and Arts Occupations
The most common Management, Business, Science and Arts occupations in Napa are Management (5,472 | 13.6%), Community & Social Service (3,967 | 9.9%), Education Instruction & Library (2,238 | 5.6%), Business & Financial (2,121 | 5.3%), and Health Diagnosing & Treating (2,020 | 5.0%).
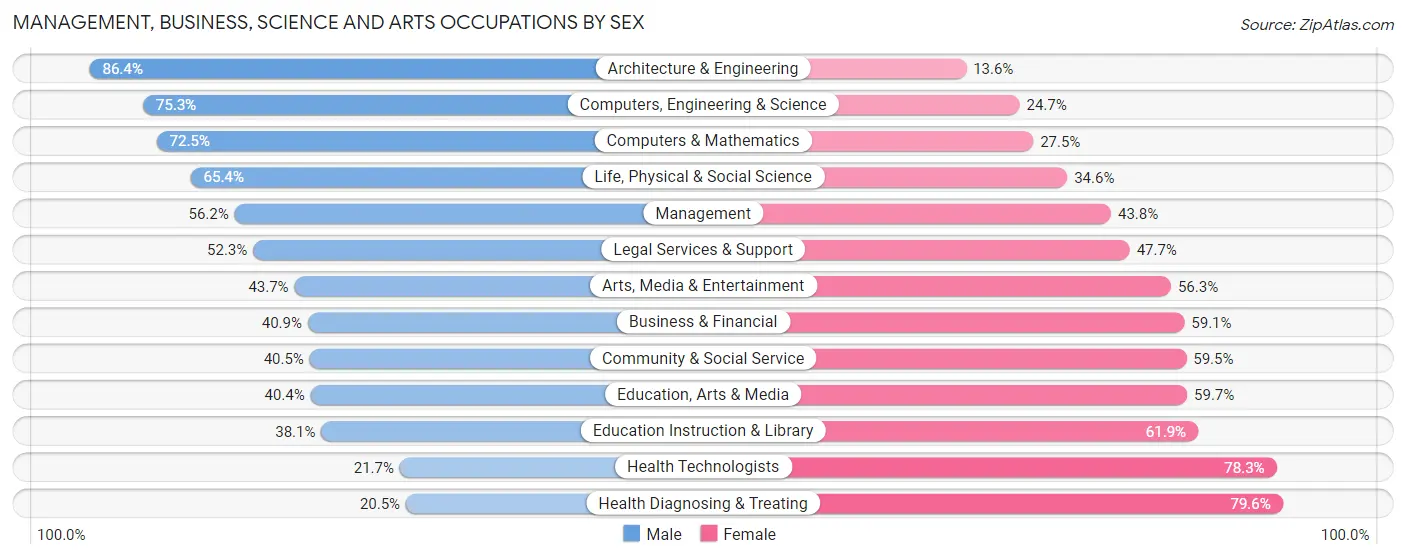
Management, Business, Science and Arts Occupations by Sex
Within the Management, Business, Science and Arts occupations in Napa, the most male-oriented occupations are Architecture & Engineering (86.4%), Computers, Engineering & Science (75.3%), and Computers & Mathematics (72.5%), while the most female-oriented occupations are Health Diagnosing & Treating (79.5%), Health Technologists (78.3%), and Education Instruction & Library (61.9%).
| Occupation | Male | Female |
| Management | 3,076 (56.2%) | 2,396 (43.8%) |
| Business & Financial | 868 (40.9%) | 1,253 (59.1%) |
| Computers, Engineering & Science | 1,409 (75.3%) | 462 (24.7%) |
| Computers & Mathematics | 550 (72.5%) | 209 (27.5%) |
| Architecture & Engineering | 542 (86.4%) | 85 (13.6%) |
| Life, Physical & Social Science | 317 (65.4%) | 168 (34.6%) |
| Community & Social Service | 1,608 (40.5%) | 2,359 (59.5%) |
| Education, Arts & Media | 276 (40.4%) | 408 (59.7%) |
| Legal Services & Support | 135 (52.3%) | 123 (47.7%) |
| Education Instruction & Library | 853 (38.1%) | 1,385 (61.9%) |
| Arts, Media & Entertainment | 344 (43.7%) | 443 (56.3%) |
| Health Diagnosing & Treating | 413 (20.4%) | 1,607 (79.5%) |
| Health Technologists | 324 (21.7%) | 1,167 (78.3%) |
| Total (Category) | 7,374 (47.7%) | 8,077 (52.3%) |
| Total (Overall) | 21,263 (52.9%) | 18,963 (47.1%) |
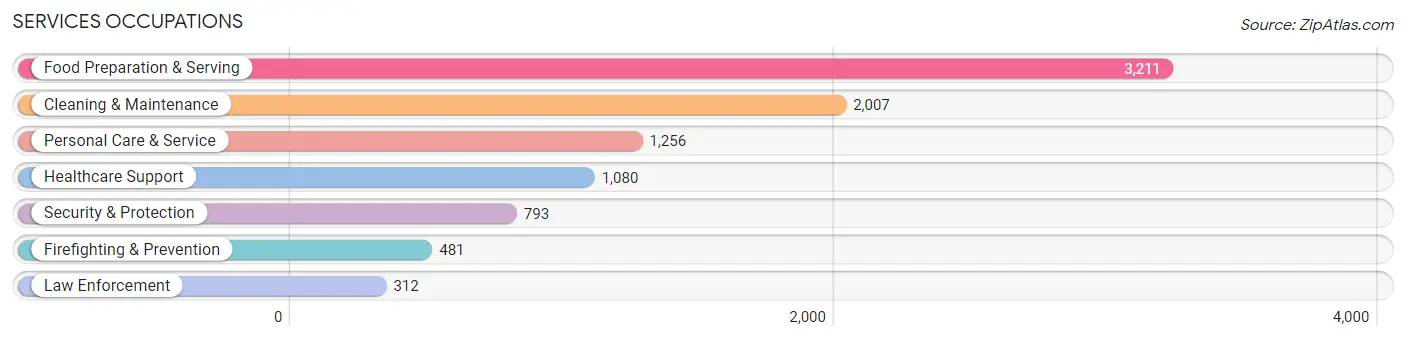
Services Occupations
The most common Services occupations in Napa are Food Preparation & Serving (3,211 | 8.0%), Cleaning & Maintenance (2,007 | 5.0%), Personal Care & Service (1,256 | 3.1%), Healthcare Support (1,080 | 2.7%), and Security & Protection (793 | 2.0%).
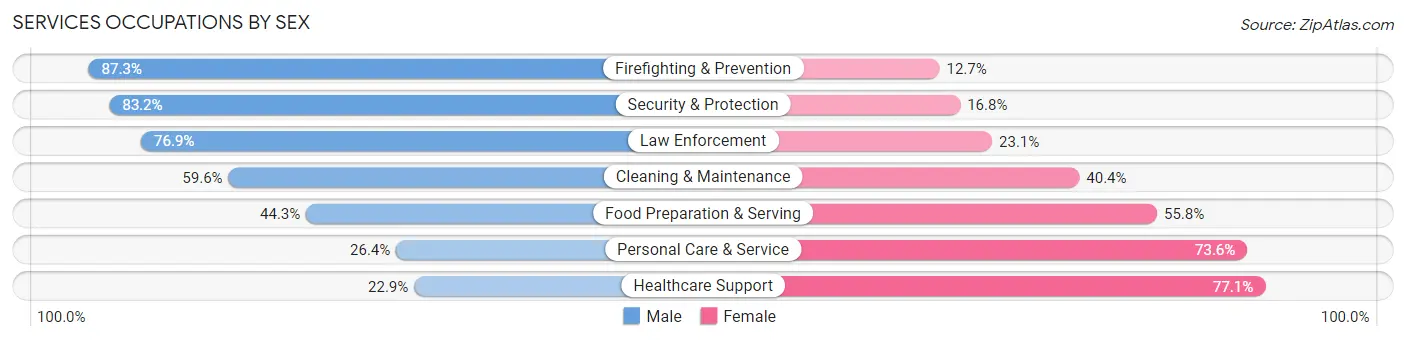
Services Occupations by Sex
Within the Services occupations in Napa, the most male-oriented occupations are Firefighting & Prevention (87.3%), Security & Protection (83.2%), and Law Enforcement (76.9%), while the most female-oriented occupations are Healthcare Support (77.1%), Personal Care & Service (73.6%), and Food Preparation & Serving (55.7%).
| Occupation | Male | Female |
| Healthcare Support | 247 (22.9%) | 833 (77.1%) |
| Security & Protection | 660 (83.2%) | 133 (16.8%) |
| Firefighting & Prevention | 420 (87.3%) | 61 (12.7%) |
| Law Enforcement | 240 (76.9%) | 72 (23.1%) |
| Food Preparation & Serving | 1,421 (44.3%) | 1,790 (55.7%) |
| Cleaning & Maintenance | 1,197 (59.6%) | 810 (40.4%) |
| Personal Care & Service | 332 (26.4%) | 924 (73.6%) |
| Total (Category) | 3,857 (46.2%) | 4,490 (53.8%) |
| Total (Overall) | 21,263 (52.9%) | 18,963 (47.1%) |
Sales and Office Occupations
The most common Sales and Office occupations in Napa are Office & Administration (3,846 | 9.6%), and Sales & Related (3,733 | 9.3%).

Sales and Office Occupations by Sex
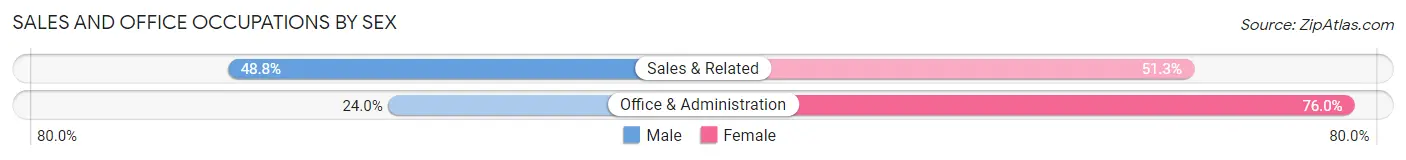
| Occupation | Male | Female |
| Sales & Related | 1,820 (48.7%) | 1,913 (51.2%) |
| Office & Administration | 924 (24.0%) | 2,922 (76.0%) |
| Total (Category) | 2,744 (36.2%) | 4,835 (63.8%) |
| Total (Overall) | 21,263 (52.9%) | 18,963 (47.1%) |
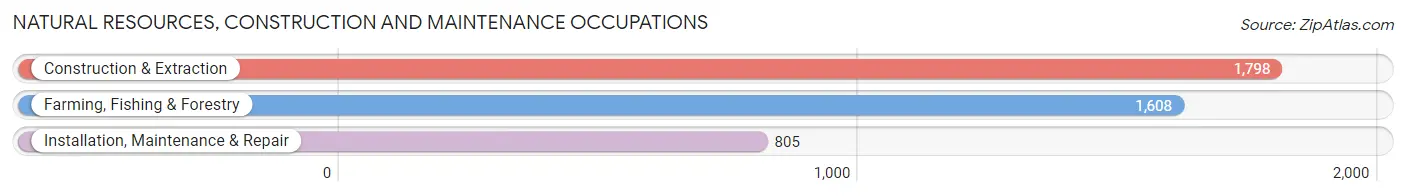
Natural Resources, Construction and Maintenance Occupations
The most common Natural Resources, Construction and Maintenance occupations in Napa are Construction & Extraction (1,798 | 4.5%), Farming, Fishing & Forestry (1,608 | 4.0%), and Installation, Maintenance & Repair (805 | 2.0%).
Natural Resources, Construction and Maintenance Occupations by Sex
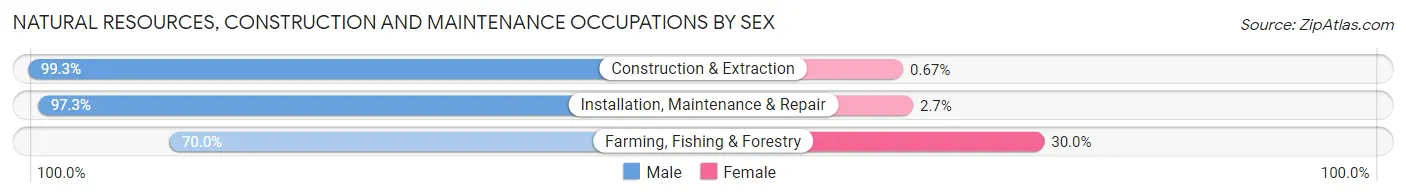
| Occupation | Male | Female |
| Farming, Fishing & Forestry | 1,125 (70.0%) | 483 (30.0%) |
| Construction & Extraction | 1,786 (99.3%) | 12 (0.7%) |
| Installation, Maintenance & Repair | 783 (97.3%) | 22 (2.7%) |
| Total (Category) | 3,694 (87.7%) | 517 (12.3%) |
| Total (Overall) | 21,263 (52.9%) | 18,963 (47.1%) |
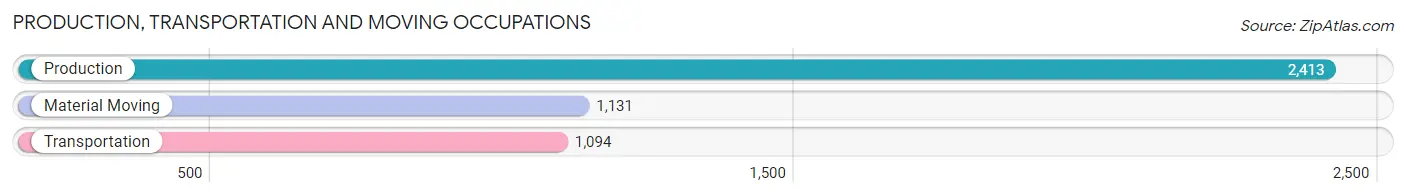
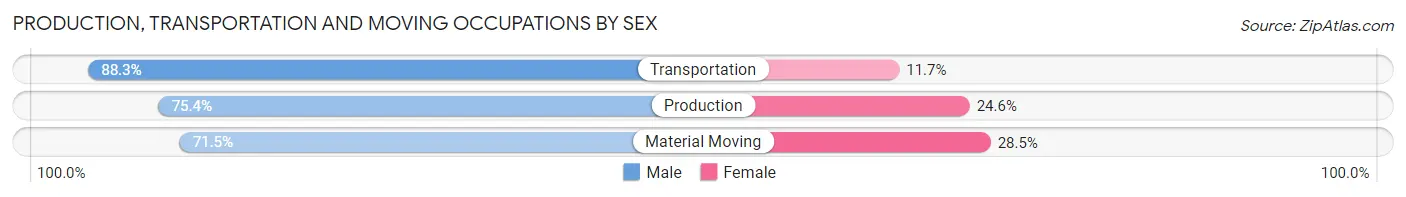
Production, Transportation and Moving Occupations
The most common Production, Transportation and Moving occupations in Napa are Production (2,413 | 6.0%), Material Moving (1,131 | 2.8%), and Transportation (1,094 | 2.7%).
Production, Transportation and Moving Occupations by Sex
| Occupation | Male | Female |
| Production | 1,819 (75.4%) | 594 (24.6%) |
| Transportation | 966 (88.3%) | 128 (11.7%) |
| Material Moving | 809 (71.5%) | 322 (28.5%) |
| Total (Category) | 3,594 (77.5%) | 1,044 (22.5%) |
| Total (Overall) | 21,263 (52.9%) | 18,963 (47.1%) |
Employment Industries by Sex in Napa
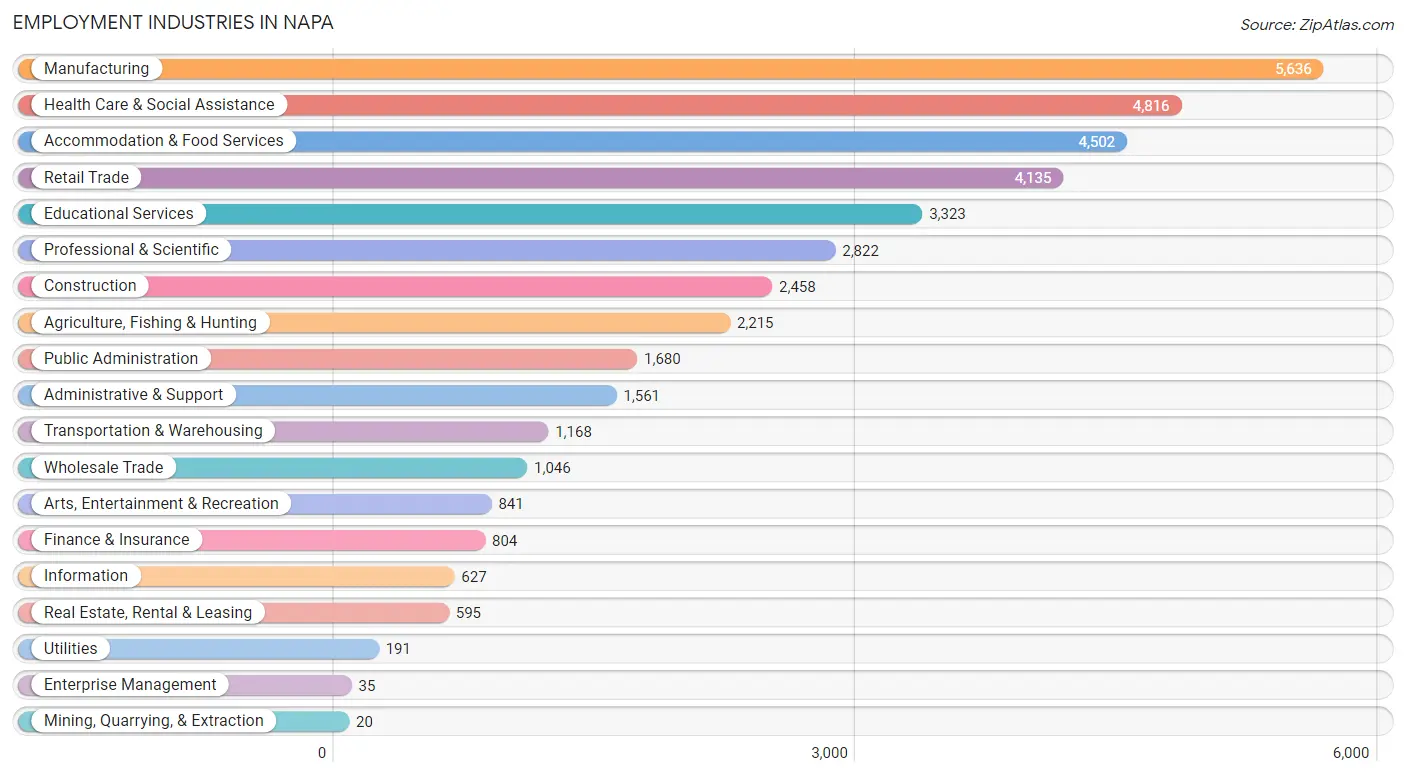
Employment Industries in Napa
The major employment industries in Napa include Manufacturing (5,636 | 14.0%), Health Care & Social Assistance (4,816 | 12.0%), Accommodation & Food Services (4,502 | 11.2%), Retail Trade (4,135 | 10.3%), and Educational Services (3,323 | 8.3%).
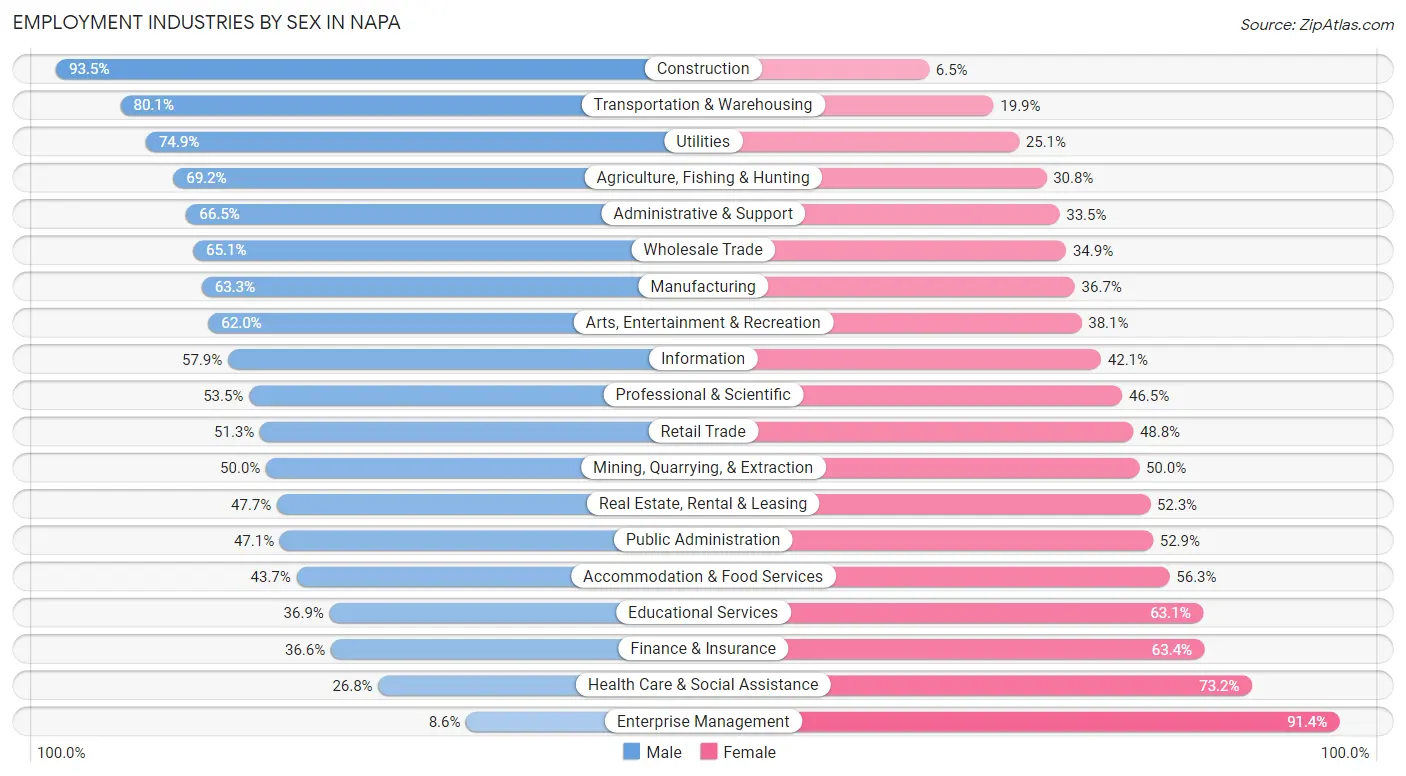
Employment Industries by Sex in Napa
The Napa industries that see more men than women are Construction (93.5%), Transportation & Warehousing (80.1%), and Utilities (74.9%), whereas the industries that tend to have a higher number of women are Enterprise Management (91.4%), Health Care & Social Assistance (73.2%), and Finance & Insurance (63.4%).
| Industry | Male | Female |
| Agriculture, Fishing & Hunting | 1,533 (69.2%) | 682 (30.8%) |
| Mining, Quarrying, & Extraction | 10 (50.0%) | 10 (50.0%) |
| Construction | 2,298 (93.5%) | 160 (6.5%) |
| Manufacturing | 3,568 (63.3%) | 2,068 (36.7%) |
| Wholesale Trade | 681 (65.1%) | 365 (34.9%) |
| Retail Trade | 2,119 (51.2%) | 2,016 (48.7%) |
| Transportation & Warehousing | 936 (80.1%) | 232 (19.9%) |
| Utilities | 143 (74.9%) | 48 (25.1%) |
| Information | 363 (57.9%) | 264 (42.1%) |
| Finance & Insurance | 294 (36.6%) | 510 (63.4%) |
| Real Estate, Rental & Leasing | 284 (47.7%) | 311 (52.3%) |
| Professional & Scientific | 1,510 (53.5%) | 1,312 (46.5%) |
| Enterprise Management | 3 (8.6%) | 32 (91.4%) |
| Administrative & Support | 1,038 (66.5%) | 523 (33.5%) |
| Educational Services | 1,225 (36.9%) | 2,098 (63.1%) |
| Health Care & Social Assistance | 1,289 (26.8%) | 3,527 (73.2%) |
| Arts, Entertainment & Recreation | 521 (62.0%) | 320 (38.1%) |
| Accommodation & Food Services | 1,968 (43.7%) | 2,534 (56.3%) |
| Public Administration | 792 (47.1%) | 888 (52.9%) |
| Total | 21,263 (52.9%) | 18,963 (47.1%) |
Education in Napa
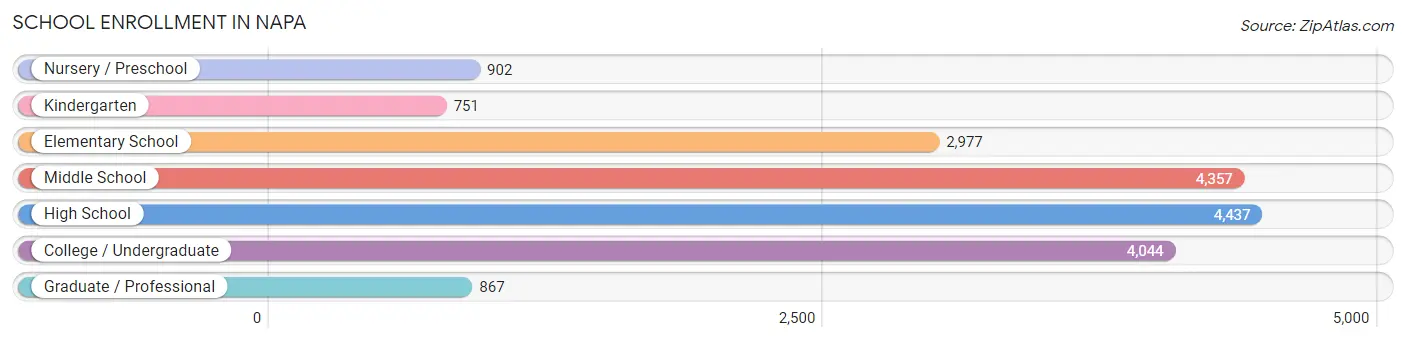
School Enrollment in Napa
The most common levels of schooling among the 18,335 students in Napa are high school (4,437 | 24.2%), middle school (4,357 | 23.8%), and college / undergraduate (4,044 | 22.1%).
| School Level | # Students | % Students |
| Nursery / Preschool | 902 | 4.9% |
| Kindergarten | 751 | 4.1% |
| Elementary School | 2,977 | 16.2% |
| Middle School | 4,357 | 23.8% |
| High School | 4,437 | 24.2% |
| College / Undergraduate | 4,044 | 22.1% |
| Graduate / Professional | 867 | 4.7% |
| Total | 18,335 | 100.0% |
School Enrollment by Age by Funding Source in Napa
Out of a total of 18,335 students who are enrolled in schools in Napa, 2,622 (14.3%) attend a private institution, while the remaining 15,713 (85.7%) are enrolled in public schools. The age group of 3 to 4 year olds has the highest likelihood of being enrolled in private schools, with 337 (49.1% in the age bracket) enrolled. Conversely, the age group of 10 to 14 year olds has the lowest likelihood of being enrolled in a private school, with 5,047 (90.2% in the age bracket) attending a public institution.
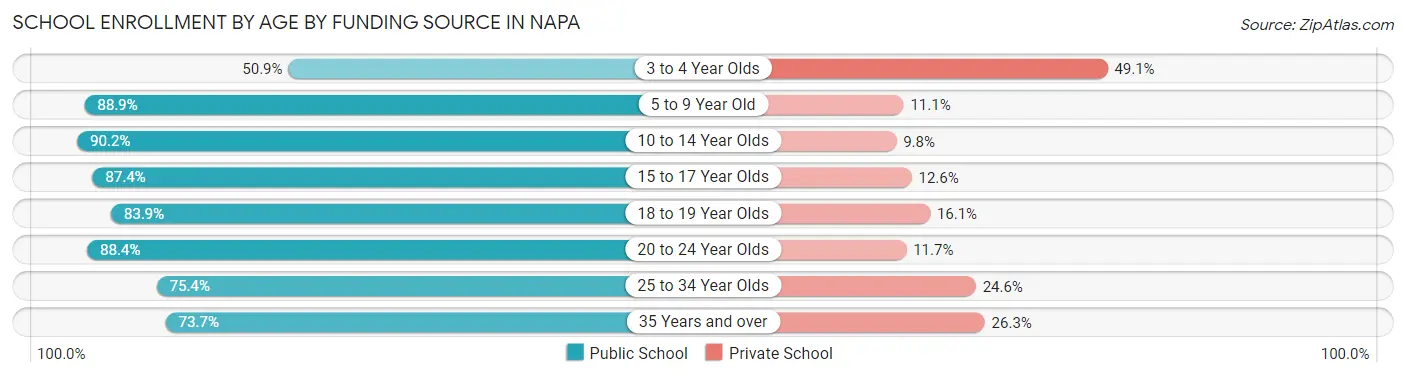
| Age Bracket | Public School | Private School |
| 3 to 4 Year Olds | 349 (50.9%) | 337 (49.1%) |
| 5 to 9 Year Old | 3,214 (88.9%) | 403 (11.1%) |
| 10 to 14 Year Olds | 5,047 (90.2%) | 547 (9.8%) |
| 15 to 17 Year Olds | 2,778 (87.4%) | 402 (12.6%) |
| 18 to 19 Year Olds | 1,060 (83.9%) | 203 (16.1%) |
| 20 to 24 Year Olds | 1,836 (88.3%) | 242 (11.7%) |
| 25 to 34 Year Olds | 650 (75.4%) | 212 (24.6%) |
| 35 Years and over | 778 (73.7%) | 277 (26.3%) |
| Total | 15,713 (85.7%) | 2,622 (14.3%) |
Educational Attainment by Field of Study in Napa
Business (4,264 | 19.4%), social sciences (2,394 | 10.9%), bio, nature & agricultural (2,200 | 10.0%), science & technology (1,668 | 7.6%), and liberal arts & history (1,661 | 7.5%) are the most common fields of study among 22,025 individuals in Napa who have obtained a bachelor's degree or higher.
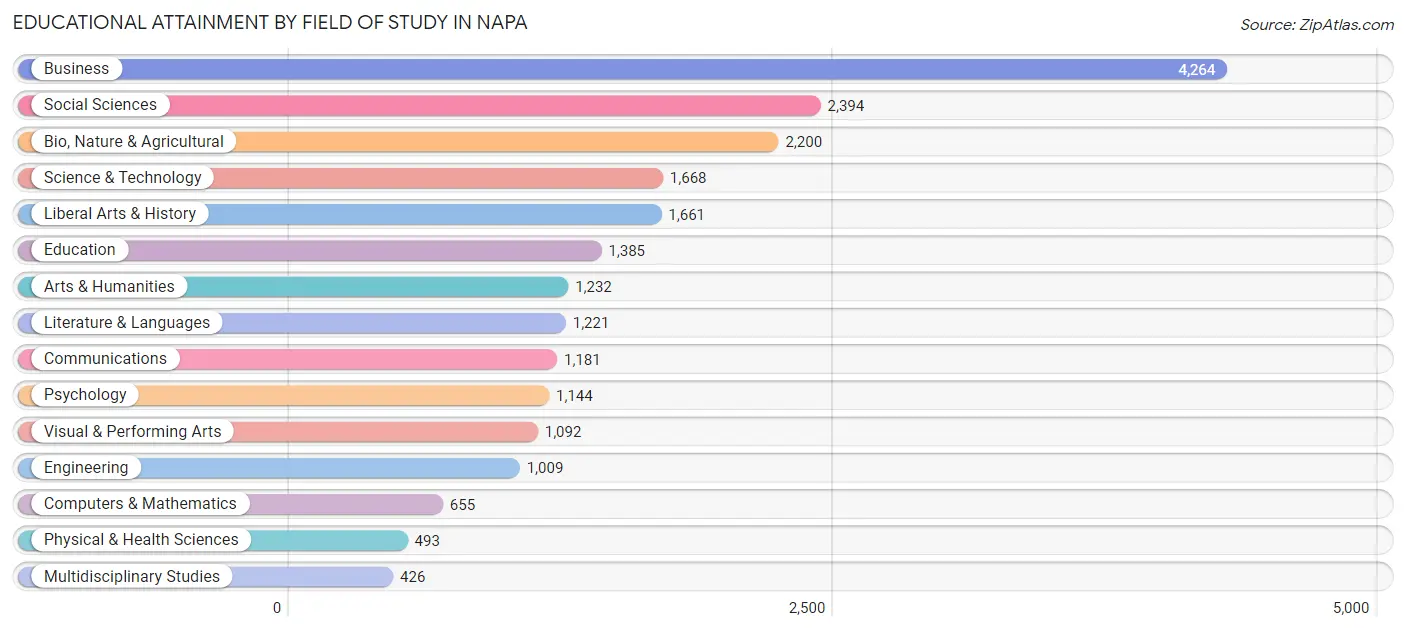
| Field of Study | # Graduates | % Graduates |
| Computers & Mathematics | 655 | 3.0% |
| Bio, Nature & Agricultural | 2,200 | 10.0% |
| Physical & Health Sciences | 493 | 2.2% |
| Psychology | 1,144 | 5.2% |
| Social Sciences | 2,394 | 10.9% |
| Engineering | 1,009 | 4.6% |
| Multidisciplinary Studies | 426 | 1.9% |
| Science & Technology | 1,668 | 7.6% |
| Business | 4,264 | 19.4% |
| Education | 1,385 | 6.3% |
| Literature & Languages | 1,221 | 5.5% |
| Liberal Arts & History | 1,661 | 7.5% |
| Visual & Performing Arts | 1,092 | 5.0% |
| Communications | 1,181 | 5.4% |
| Arts & Humanities | 1,232 | 5.6% |
| Total | 22,025 | 100.0% |
Transportation & Commute in Napa
Vehicle Availability by Sex in Napa
The most prevalent vehicle ownership categories in Napa are males with 2 vehicles (8,580, accounting for 41.3%) and females with 2 vehicles (7,518, making up 46.3%).
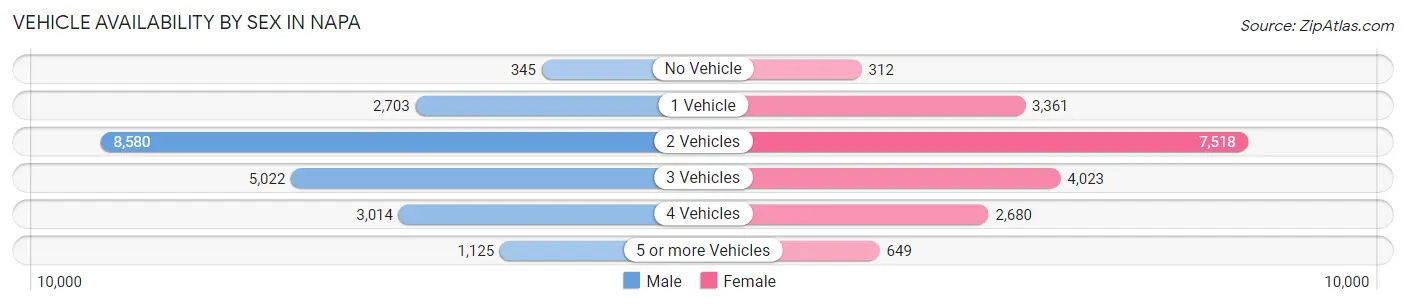
| Vehicles Available | Male | Female |
| No Vehicle | 345 (1.7%) | 312 (1.7%) |
| 1 Vehicle | 2,703 (13.0%) | 3,361 (18.1%) |
| 2 Vehicles | 8,580 (41.3%) | 7,518 (40.5%) |
| 3 Vehicles | 5,022 (24.2%) | 4,023 (21.7%) |
| 4 Vehicles | 3,014 (14.5%) | 2,680 (14.4%) |
| 5 or more Vehicles | 1,125 (5.4%) | 649 (3.5%) |
| Total | 20,789 (100.0%) | 18,543 (100.0%) |
Commute Time in Napa
The most frequently occuring commute durations in Napa are 10 to 14 minutes (6,480 commuters, 18.3%), 15 to 19 minutes (6,160 commuters, 17.4%), and 5 to 9 minutes (5,171 commuters, 14.6%).
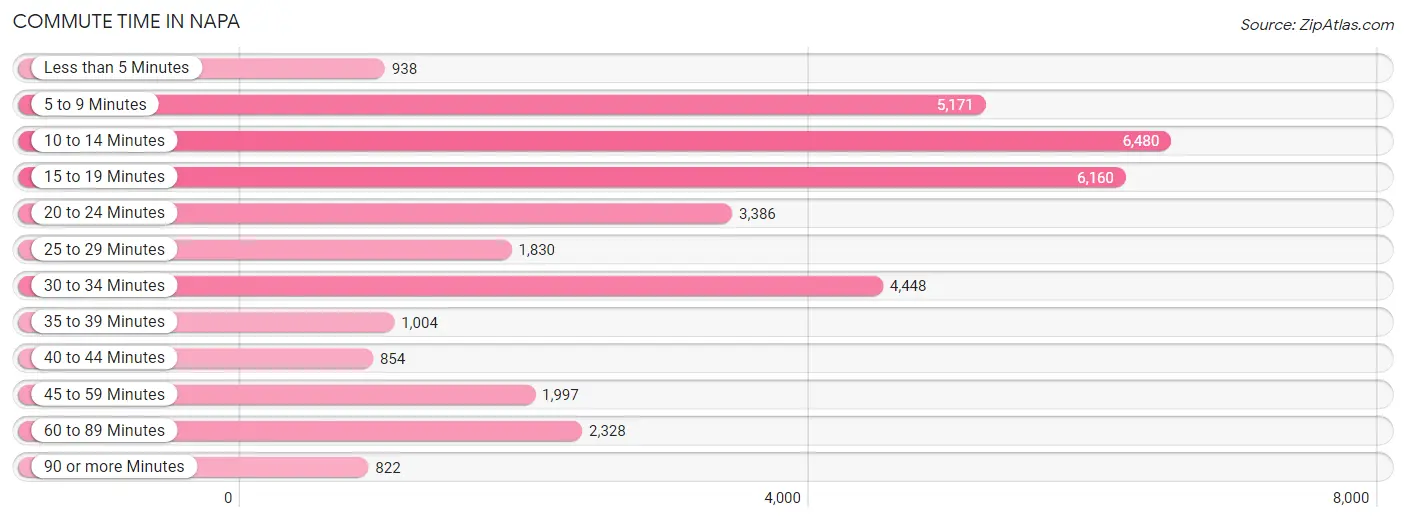
| Commute Time | # Commuters | % Commuters |
| Less than 5 Minutes | 938 | 2.6% |
| 5 to 9 Minutes | 5,171 | 14.6% |
| 10 to 14 Minutes | 6,480 | 18.3% |
| 15 to 19 Minutes | 6,160 | 17.4% |
| 20 to 24 Minutes | 3,386 | 9.6% |
| 25 to 29 Minutes | 1,830 | 5.2% |
| 30 to 34 Minutes | 4,448 | 12.6% |
| 35 to 39 Minutes | 1,004 | 2.8% |
| 40 to 44 Minutes | 854 | 2.4% |
| 45 to 59 Minutes | 1,997 | 5.6% |
| 60 to 89 Minutes | 2,328 | 6.6% |
| 90 or more Minutes | 822 | 2.3% |
Commute Time by Sex in Napa
The most common commute times in Napa are 15 to 19 minutes (3,429 commuters, 18.1%) for males and 10 to 14 minutes (3,459 commuters, 21.0%) for females.
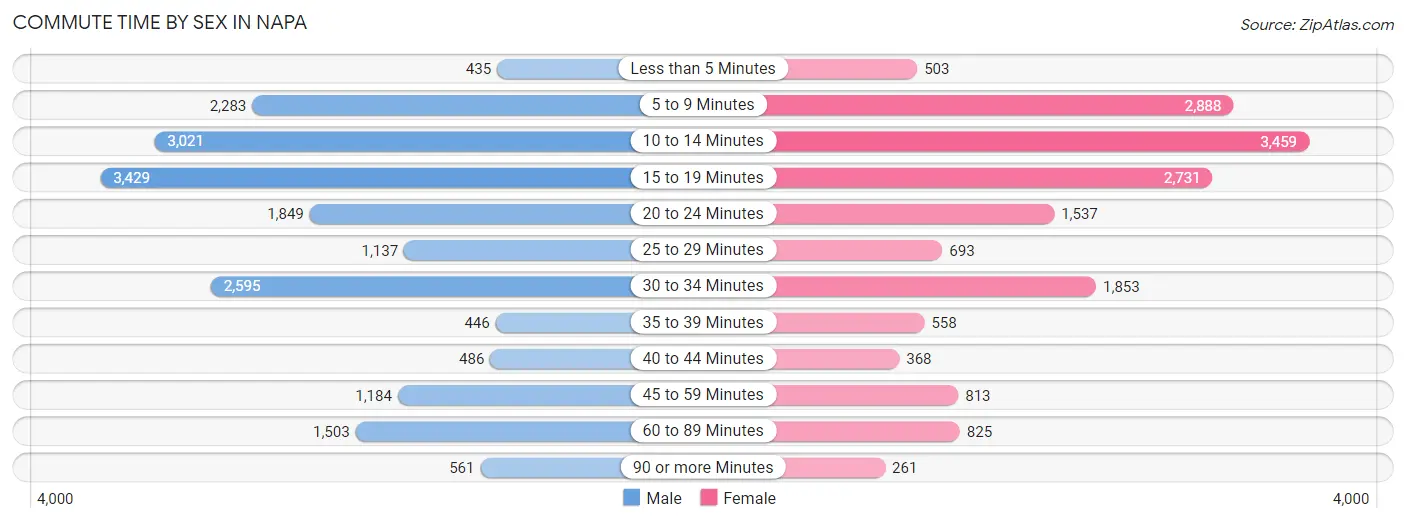
| Commute Time | Male | Female |
| Less than 5 Minutes | 435 (2.3%) | 503 (3.0%) |
| 5 to 9 Minutes | 2,283 (12.1%) | 2,888 (17.5%) |
| 10 to 14 Minutes | 3,021 (16.0%) | 3,459 (21.0%) |
| 15 to 19 Minutes | 3,429 (18.1%) | 2,731 (16.6%) |
| 20 to 24 Minutes | 1,849 (9.8%) | 1,537 (9.3%) |
| 25 to 29 Minutes | 1,137 (6.0%) | 693 (4.2%) |
| 30 to 34 Minutes | 2,595 (13.7%) | 1,853 (11.2%) |
| 35 to 39 Minutes | 446 (2.4%) | 558 (3.4%) |
| 40 to 44 Minutes | 486 (2.6%) | 368 (2.2%) |
| 45 to 59 Minutes | 1,184 (6.2%) | 813 (4.9%) |
| 60 to 89 Minutes | 1,503 (7.9%) | 825 (5.0%) |
| 90 or more Minutes | 561 (3.0%) | 261 (1.6%) |
Time of Departure to Work by Sex in Napa
The most frequent times of departure to work in Napa are 8:00 AM to 8:29 AM (2,507, 13.2%) for males and 7:30 AM to 7:59 AM (2,783, 16.9%) for females.
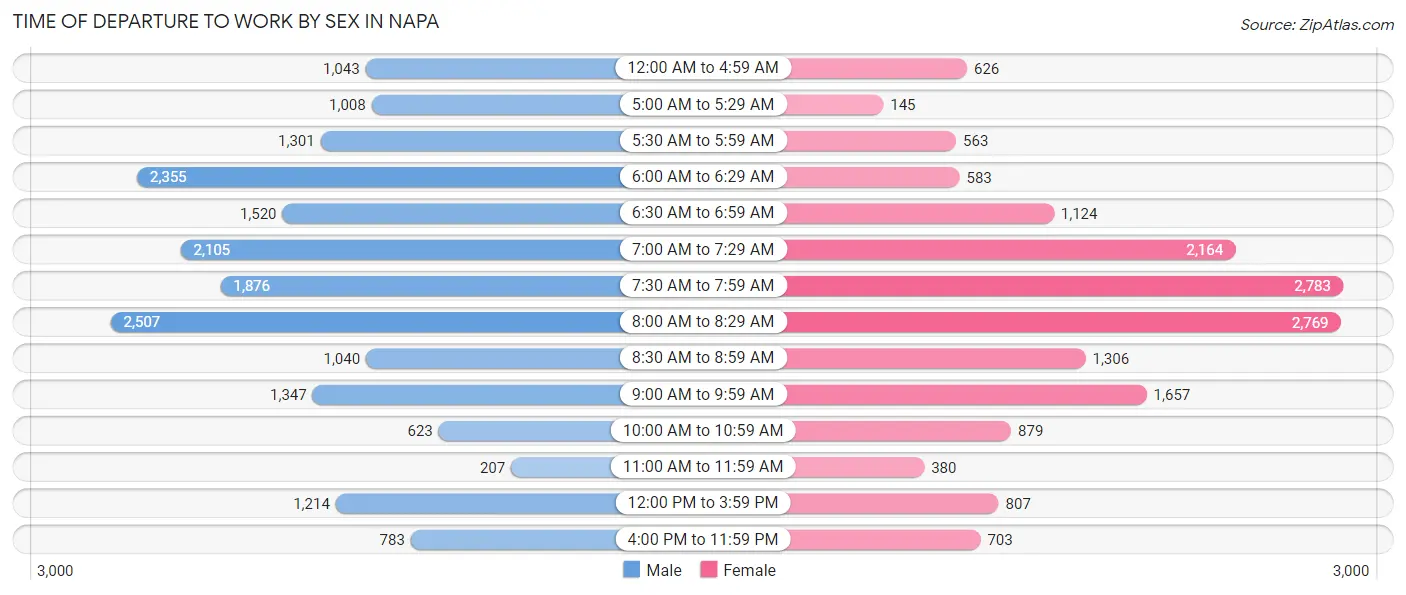
| Time of Departure | Male | Female |
| 12:00 AM to 4:59 AM | 1,043 (5.5%) | 626 (3.8%) |
| 5:00 AM to 5:29 AM | 1,008 (5.3%) | 145 (0.9%) |
| 5:30 AM to 5:59 AM | 1,301 (6.9%) | 563 (3.4%) |
| 6:00 AM to 6:29 AM | 2,355 (12.4%) | 583 (3.5%) |
| 6:30 AM to 6:59 AM | 1,520 (8.0%) | 1,124 (6.8%) |
| 7:00 AM to 7:29 AM | 2,105 (11.1%) | 2,164 (13.1%) |
| 7:30 AM to 7:59 AM | 1,876 (9.9%) | 2,783 (16.9%) |
| 8:00 AM to 8:29 AM | 2,507 (13.2%) | 2,769 (16.8%) |
| 8:30 AM to 8:59 AM | 1,040 (5.5%) | 1,306 (7.9%) |
| 9:00 AM to 9:59 AM | 1,347 (7.1%) | 1,657 (10.1%) |
| 10:00 AM to 10:59 AM | 623 (3.3%) | 879 (5.3%) |
| 11:00 AM to 11:59 AM | 207 (1.1%) | 380 (2.3%) |
| 12:00 PM to 3:59 PM | 1,214 (6.4%) | 807 (4.9%) |
| 4:00 PM to 11:59 PM | 783 (4.1%) | 703 (4.3%) |
| Total | 18,929 (100.0%) | 16,489 (100.0%) |
Housing Occupancy in Napa
Occupancy by Ownership in Napa
Of the total 29,443 dwellings in Napa, owner-occupied units account for 17,391 (59.1%), while renter-occupied units make up 12,052 (40.9%).
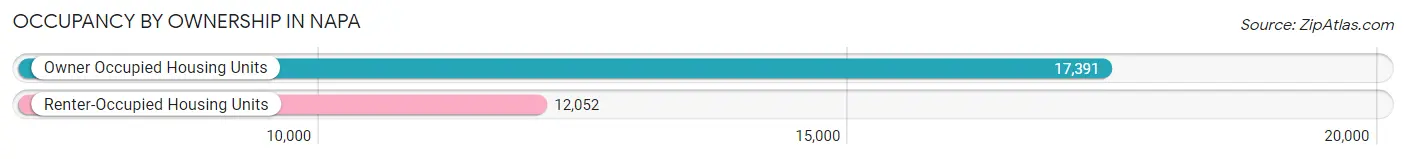
| Occupancy | # Housing Units | % Housing Units |
| Owner Occupied Housing Units | 17,391 | 59.1% |
| Renter-Occupied Housing Units | 12,052 | 40.9% |
| Total Occupied Housing Units | 29,443 | 100.0% |
Occupancy by Household Size in Napa
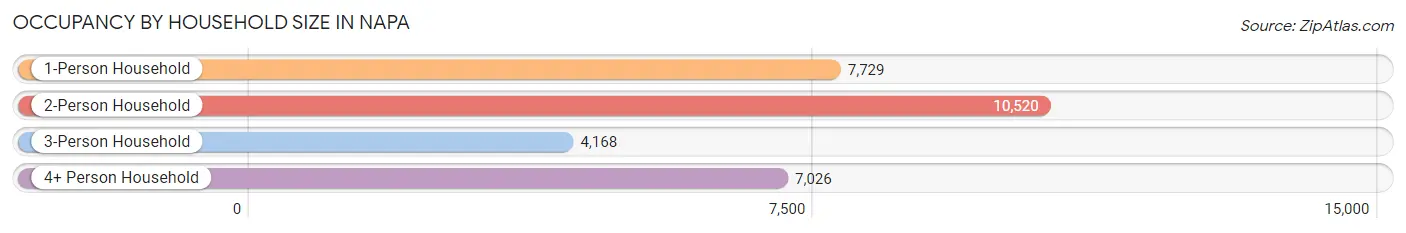
| Household Size | # Housing Units | % Housing Units |
| 1-Person Household | 7,729 | 26.3% |
| 2-Person Household | 10,520 | 35.7% |
| 3-Person Household | 4,168 | 14.2% |
| 4+ Person Household | 7,026 | 23.9% |
| Total Housing Units | 29,443 | 100.0% |
Occupancy by Ownership by Household Size in Napa
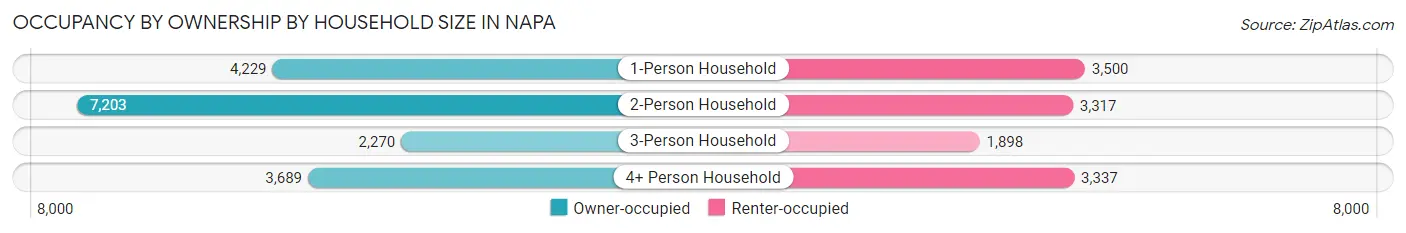
| Household Size | Owner-occupied | Renter-occupied |
| 1-Person Household | 4,229 (54.7%) | 3,500 (45.3%) |
| 2-Person Household | 7,203 (68.5%) | 3,317 (31.5%) |
| 3-Person Household | 2,270 (54.5%) | 1,898 (45.5%) |
| 4+ Person Household | 3,689 (52.5%) | 3,337 (47.5%) |
| Total Housing Units | 17,391 (59.1%) | 12,052 (40.9%) |
Occupancy by Educational Attainment in Napa
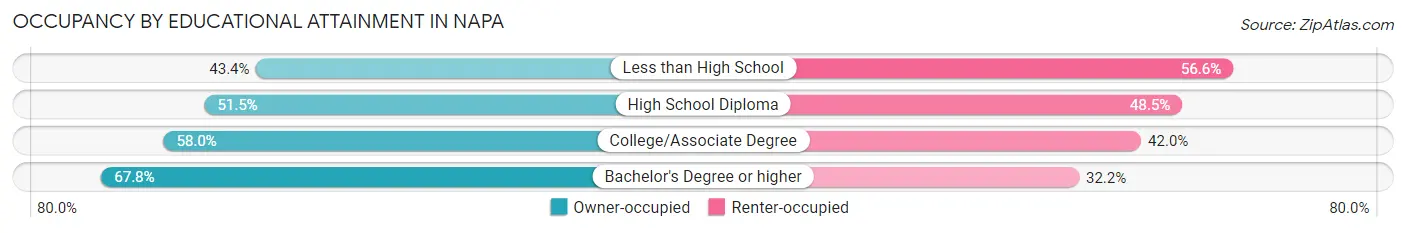
| Household Size | Owner-occupied | Renter-occupied |
| Less than High School | 1,732 (43.4%) | 2,259 (56.6%) |
| High School Diploma | 2,213 (51.5%) | 2,087 (48.5%) |
| College/Associate Degree | 5,290 (58.0%) | 3,836 (42.0%) |
| Bachelor's Degree or higher | 8,156 (67.8%) | 3,870 (32.2%) |
Occupancy by Age of Householder in Napa
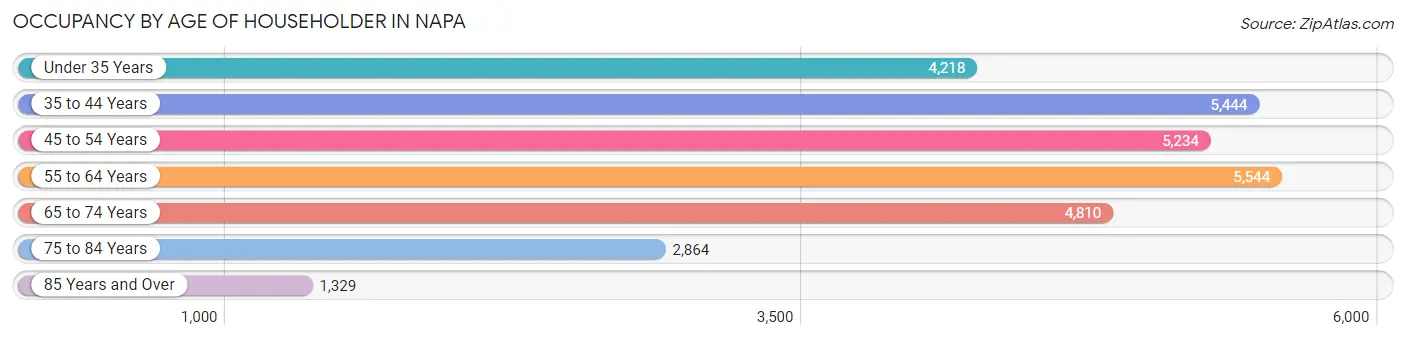
| Age Bracket | # Households | % Households |
| Under 35 Years | 4,218 | 14.3% |
| 35 to 44 Years | 5,444 | 18.5% |
| 45 to 54 Years | 5,234 | 17.8% |
| 55 to 64 Years | 5,544 | 18.8% |
| 65 to 74 Years | 4,810 | 16.3% |
| 75 to 84 Years | 2,864 | 9.7% |
| 85 Years and Over | 1,329 | 4.5% |
| Total | 29,443 | 100.0% |
Housing Finances in Napa
Median Income by Occupancy in Napa
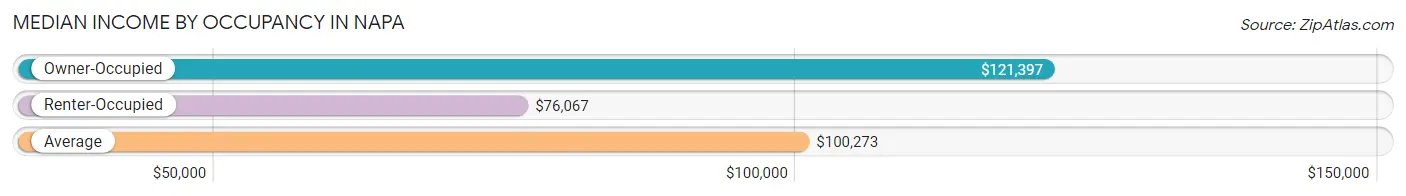
| Occupancy Type | # Households | Median Income |
| Owner-Occupied | 17,391 (59.1%) | $121,397 |
| Renter-Occupied | 12,052 (40.9%) | $76,067 |
| Average | 29,443 (100.0%) | $100,273 |
Occupancy by Householder Income Bracket in Napa
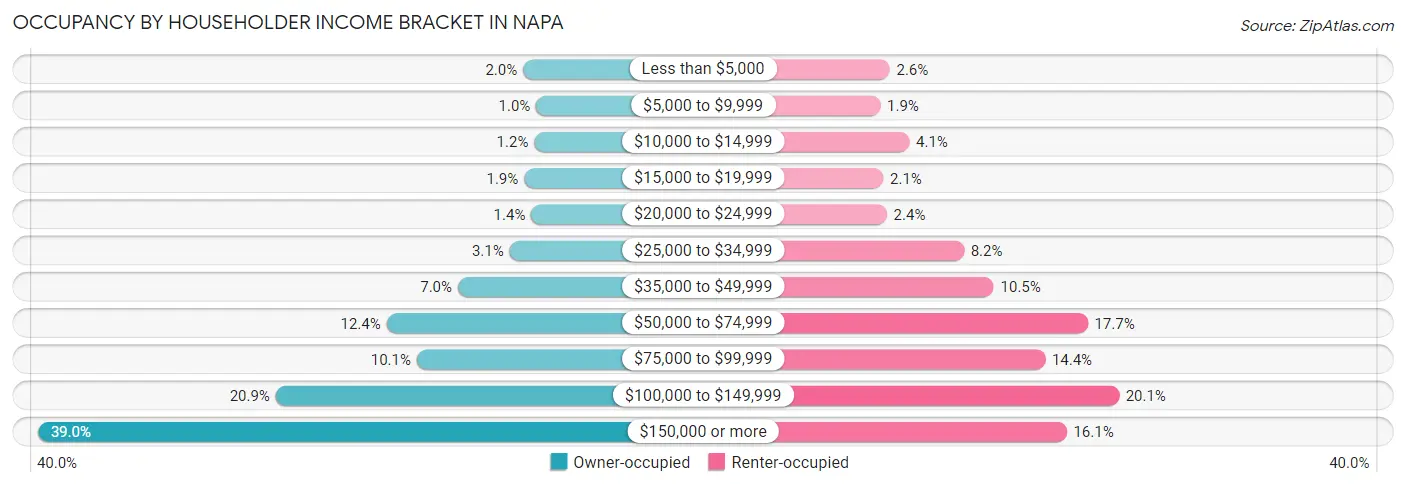
| Income Bracket | Owner-occupied | Renter-occupied |
| Less than $5,000 | 351 (2.0%) | 312 (2.6%) |
| $5,000 to $9,999 | 177 (1.0%) | 225 (1.9%) |
| $10,000 to $14,999 | 203 (1.2%) | 492 (4.1%) |
| $15,000 to $19,999 | 338 (1.9%) | 253 (2.1%) |
| $20,000 to $24,999 | 244 (1.4%) | 286 (2.4%) |
| $25,000 to $34,999 | 531 (3.0%) | 993 (8.2%) |
| $35,000 to $49,999 | 1,216 (7.0%) | 1,268 (10.5%) |
| $50,000 to $74,999 | 2,160 (12.4%) | 2,130 (17.7%) |
| $75,000 to $99,999 | 1,760 (10.1%) | 1,739 (14.4%) |
| $100,000 to $149,999 | 3,629 (20.9%) | 2,417 (20.1%) |
| $150,000 or more | 6,782 (39.0%) | 1,937 (16.1%) |
| Total | 17,391 (100.0%) | 12,052 (100.0%) |
Monthly Housing Cost Tiers in Napa
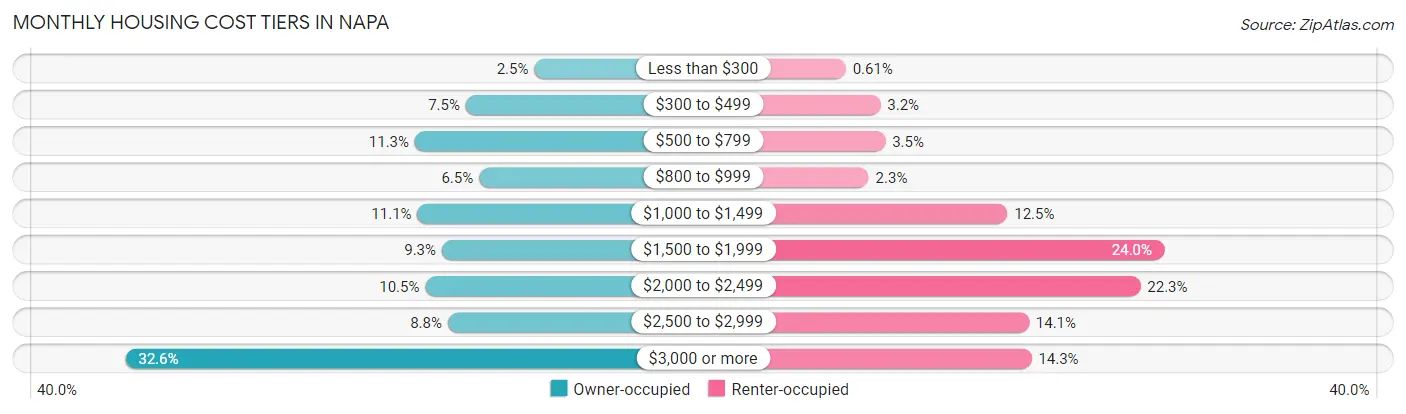
| Monthly Cost | Owner-occupied | Renter-occupied |
| Less than $300 | 427 (2.5%) | 74 (0.6%) |
| $300 to $499 | 1,306 (7.5%) | 381 (3.2%) |
| $500 to $799 | 1,958 (11.3%) | 424 (3.5%) |
| $800 to $999 | 1,136 (6.5%) | 277 (2.3%) |
| $1,000 to $1,499 | 1,926 (11.1%) | 1,508 (12.5%) |
| $1,500 to $1,999 | 1,612 (9.3%) | 2,897 (24.0%) |
| $2,000 to $2,499 | 1,824 (10.5%) | 2,689 (22.3%) |
| $2,500 to $2,999 | 1,536 (8.8%) | 1,699 (14.1%) |
| $3,000 or more | 5,666 (32.6%) | 1,722 (14.3%) |
| Total | 17,391 (100.0%) | 12,052 (100.0%) |
Physical Housing Characteristics in Napa
Housing Structures in Napa
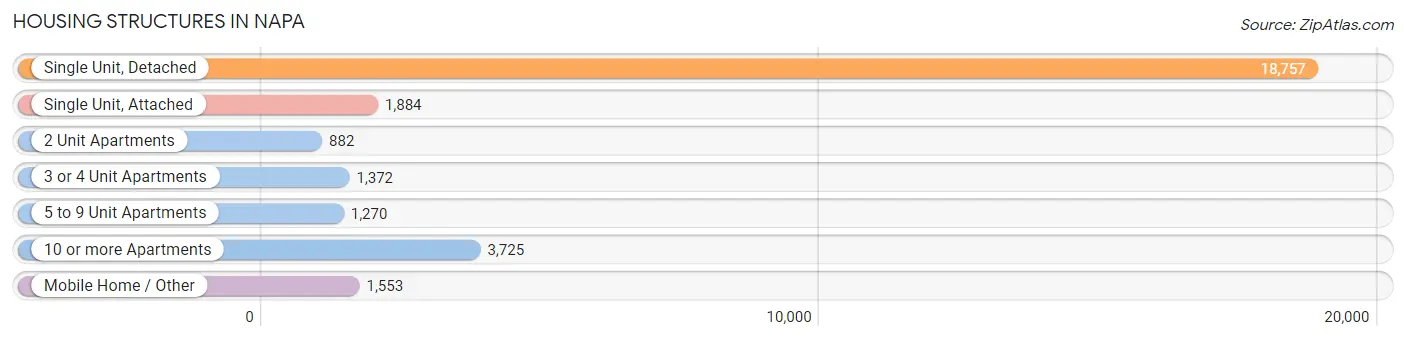
| Structure Type | # Housing Units | % Housing Units |
| Single Unit, Detached | 18,757 | 63.7% |
| Single Unit, Attached | 1,884 | 6.4% |
| 2 Unit Apartments | 882 | 3.0% |
| 3 or 4 Unit Apartments | 1,372 | 4.7% |
| 5 to 9 Unit Apartments | 1,270 | 4.3% |
| 10 or more Apartments | 3,725 | 12.7% |
| Mobile Home / Other | 1,553 | 5.3% |
| Total | 29,443 | 100.0% |
Housing Structures by Occupancy in Napa
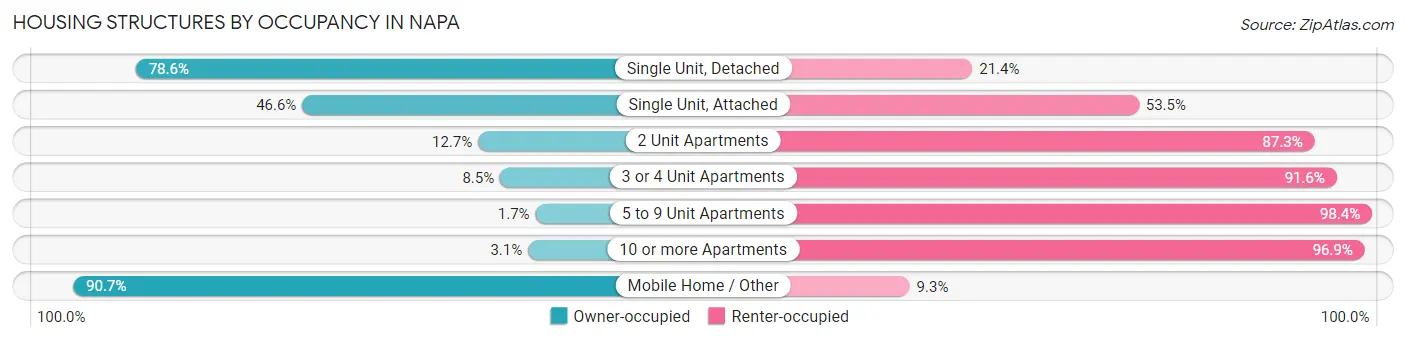
| Structure Type | Owner-occupied | Renter-occupied |
| Single Unit, Detached | 14,743 (78.6%) | 4,014 (21.4%) |
| Single Unit, Attached | 877 (46.6%) | 1,007 (53.4%) |
| 2 Unit Apartments | 112 (12.7%) | 770 (87.3%) |
| 3 or 4 Unit Apartments | 116 (8.5%) | 1,256 (91.5%) |
| 5 to 9 Unit Apartments | 21 (1.7%) | 1,249 (98.4%) |
| 10 or more Apartments | 114 (3.1%) | 3,611 (96.9%) |
| Mobile Home / Other | 1,408 (90.7%) | 145 (9.3%) |
| Total | 17,391 (59.1%) | 12,052 (40.9%) |
Housing Structures by Number of Rooms in Napa
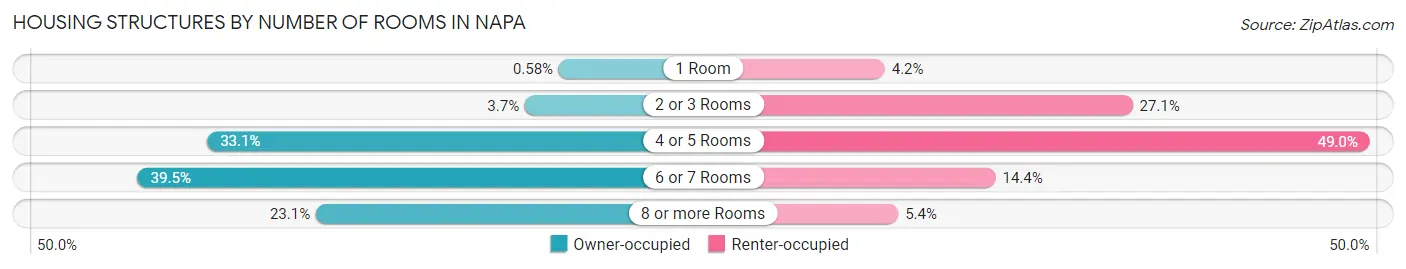
| Number of Rooms | Owner-occupied | Renter-occupied |
| 1 Room | 101 (0.6%) | 500 (4.2%) |
| 2 or 3 Rooms | 647 (3.7%) | 3,262 (27.1%) |
| 4 or 5 Rooms | 5,758 (33.1%) | 5,906 (49.0%) |
| 6 or 7 Rooms | 6,876 (39.5%) | 1,734 (14.4%) |
| 8 or more Rooms | 4,009 (23.1%) | 650 (5.4%) |
| Total | 17,391 (100.0%) | 12,052 (100.0%) |
Housing Structure by Heating Type in Napa
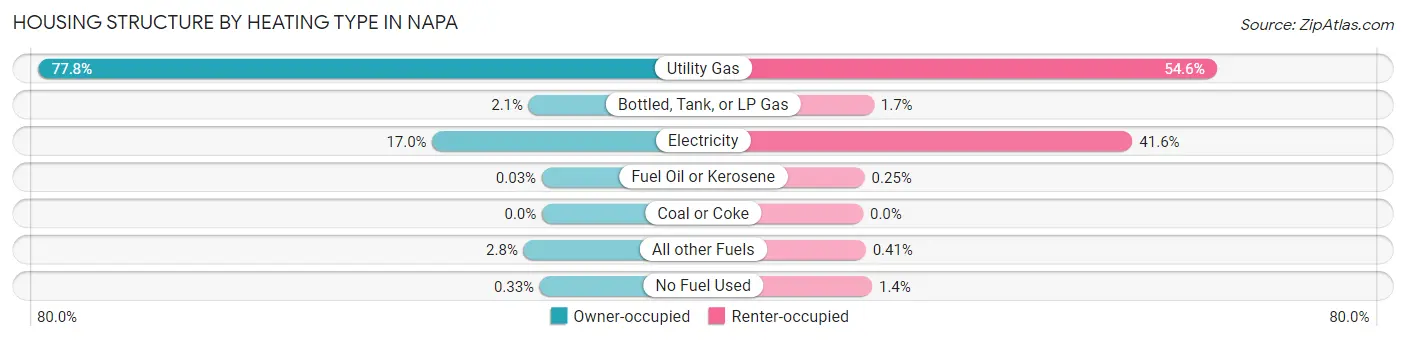
| Heating Type | Owner-occupied | Renter-occupied |
| Utility Gas | 13,528 (77.8%) | 6,585 (54.6%) |
| Bottled, Tank, or LP Gas | 357 (2.1%) | 201 (1.7%) |
| Electricity | 2,948 (17.0%) | 5,018 (41.6%) |
| Fuel Oil or Kerosene | 6 (0.0%) | 30 (0.3%) |
| Coal or Coke | 0 (0.0%) | 0 (0.0%) |
| All other Fuels | 494 (2.8%) | 50 (0.4%) |
| No Fuel Used | 58 (0.3%) | 168 (1.4%) |
| Total | 17,391 (100.0%) | 12,052 (100.0%) |
Household Vehicle Usage in Napa
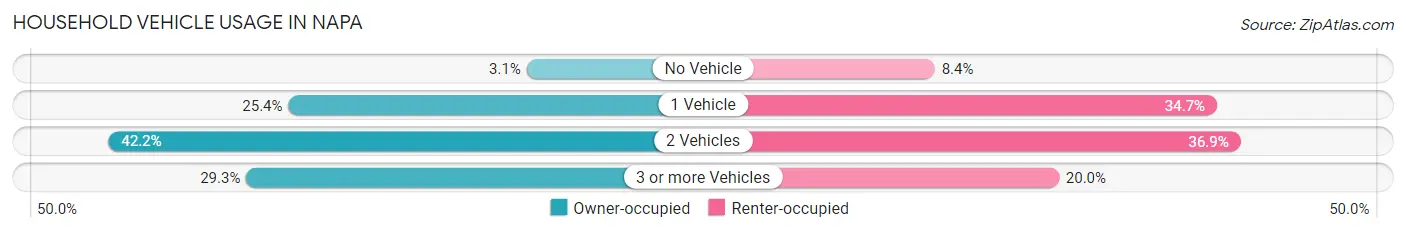
| Vehicles per Household | Owner-occupied | Renter-occupied |
| No Vehicle | 544 (3.1%) | 1,010 (8.4%) |
| 1 Vehicle | 4,414 (25.4%) | 4,184 (34.7%) |
| 2 Vehicles | 7,335 (42.2%) | 4,451 (36.9%) |
| 3 or more Vehicles | 5,098 (29.3%) | 2,407 (20.0%) |
| Total | 17,391 (100.0%) | 12,052 (100.0%) |
Real Estate & Mortgages in Napa
Real Estate and Mortgage Overview in Napa
| Characteristic | Without Mortgage | With Mortgage |
| Housing Units | 6,081 | 11,310 |
| Median Property Value | $696,600 | $803,100 |
| Median Household Income | $86,771 | $5,371 |
| Monthly Housing Costs | $743 | $5,653 |
| Real Estate Taxes | $3,516 | $257 |
Property Value by Mortgage Status in Napa
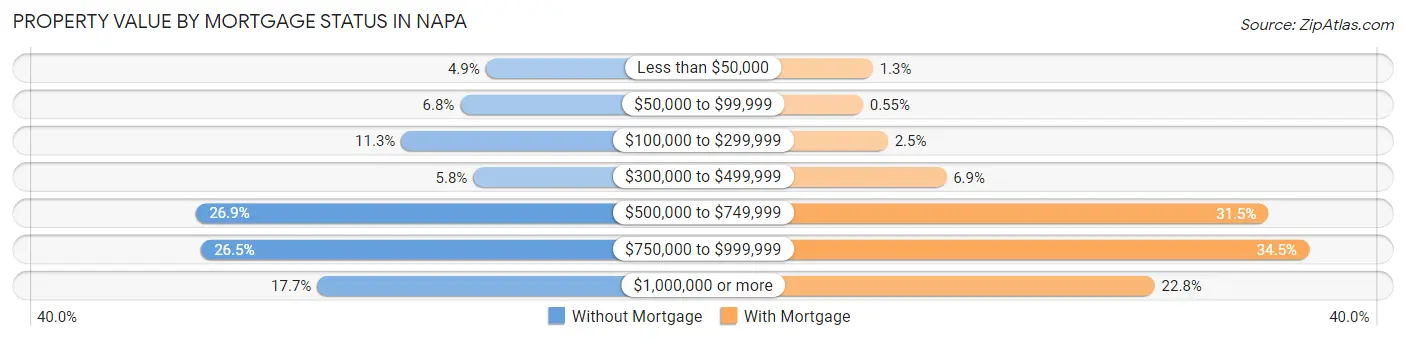
| Property Value | Without Mortgage | With Mortgage |
| Less than $50,000 | 297 (4.9%) | 148 (1.3%) |
| $50,000 to $99,999 | 414 (6.8%) | 62 (0.5%) |
| $100,000 to $299,999 | 688 (11.3%) | 277 (2.5%) |
| $300,000 to $499,999 | 354 (5.8%) | 782 (6.9%) |
| $500,000 to $749,999 | 1,637 (26.9%) | 3,557 (31.5%) |
| $750,000 to $999,999 | 1,614 (26.5%) | 3,906 (34.5%) |
| $1,000,000 or more | 1,077 (17.7%) | 2,578 (22.8%) |
| Total | 6,081 (100.0%) | 11,310 (100.0%) |
Household Income by Mortgage Status in Napa
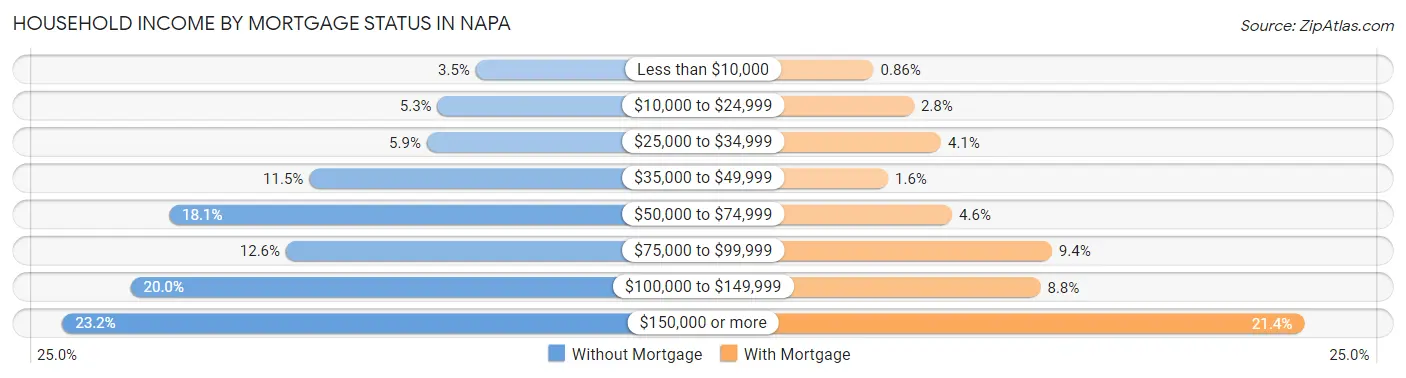
| Household Income | Without Mortgage | With Mortgage |
| Less than $10,000 | 214 (3.5%) | 97 (0.9%) |
| $10,000 to $24,999 | 325 (5.3%) | 314 (2.8%) |
| $25,000 to $34,999 | 356 (5.9%) | 460 (4.1%) |
| $35,000 to $49,999 | 696 (11.5%) | 175 (1.5%) |
| $50,000 to $74,999 | 1,102 (18.1%) | 520 (4.6%) |
| $75,000 to $99,999 | 764 (12.6%) | 1,058 (9.3%) |
| $100,000 to $149,999 | 1,213 (20.0%) | 996 (8.8%) |
| $150,000 or more | 1,411 (23.2%) | 2,416 (21.4%) |
| Total | 6,081 (100.0%) | 11,310 (100.0%) |
Property Value to Household Income Ratio in Napa
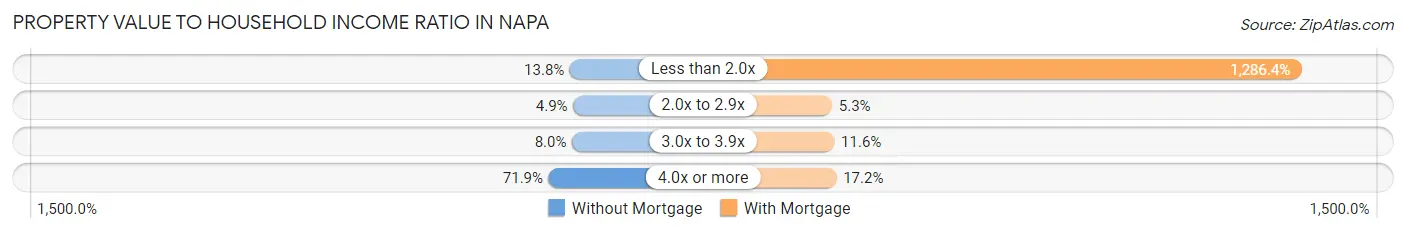
| Value-to-Income Ratio | Without Mortgage | With Mortgage |
| Less than 2.0x | 836 (13.8%) | 145,487 (1,286.4%) |
| 2.0x to 2.9x | 298 (4.9%) | 601 (5.3%) |
| 3.0x to 3.9x | 487 (8.0%) | 1,310 (11.6%) |
| 4.0x or more | 4,369 (71.9%) | 1,943 (17.2%) |
| Total | 6,081 (100.0%) | 11,310 (100.0%) |
Real Estate Taxes by Mortgage Status in Napa
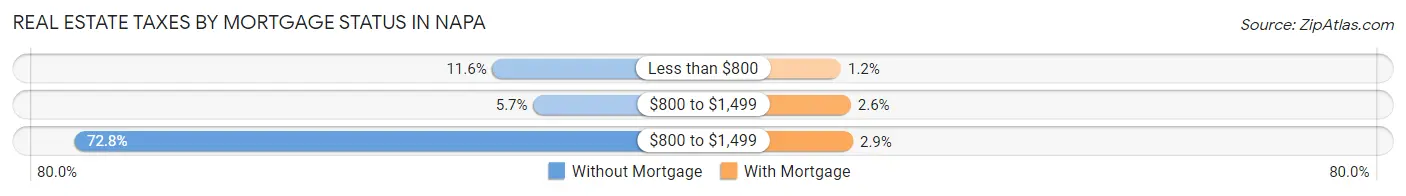
| Property Taxes | Without Mortgage | With Mortgage |
| Less than $800 | 707 (11.6%) | 132 (1.2%) |
| $800 to $1,499 | 344 (5.7%) | 294 (2.6%) |
| $800 to $1,499 | 4,425 (72.8%) | 330 (2.9%) |
| Total | 6,081 (100.0%) | 11,310 (100.0%) |
Health & Disability in Napa
Health Insurance Coverage by Age in Napa
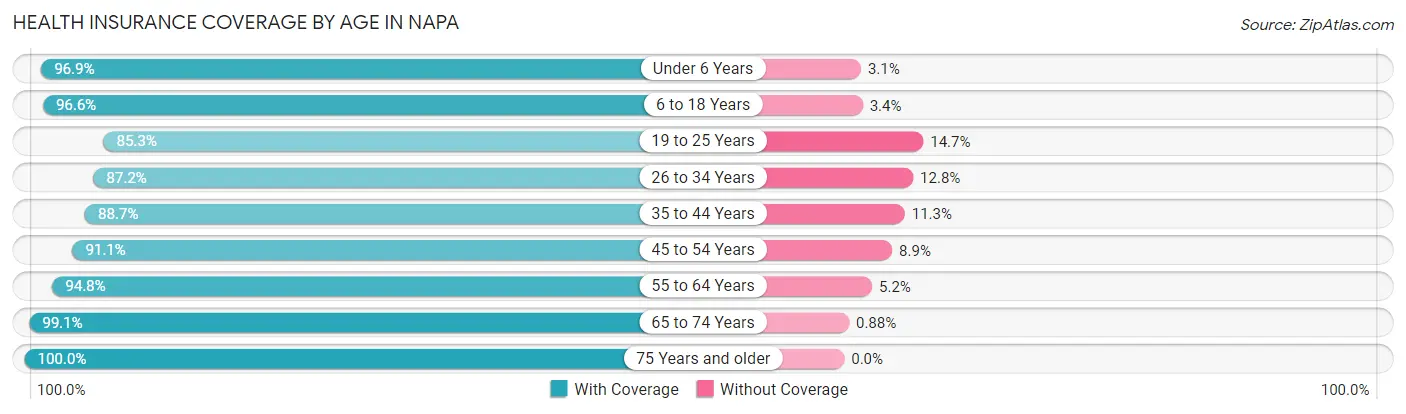
| Age Bracket | With Coverage | Without Coverage |
| Under 6 Years | 4,762 (96.9%) | 153 (3.1%) |
| 6 to 18 Years | 12,342 (96.6%) | 439 (3.4%) |
| 19 to 25 Years | 5,146 (85.3%) | 889 (14.7%) |
| 26 to 34 Years | 8,464 (87.2%) | 1,247 (12.8%) |
| 35 to 44 Years | 9,636 (88.7%) | 1,225 (11.3%) |
| 45 to 54 Years | 9,218 (91.1%) | 904 (8.9%) |
| 55 to 64 Years | 9,508 (94.8%) | 519 (5.2%) |
| 65 to 74 Years | 8,146 (99.1%) | 72 (0.9%) |
| 75 Years and older | 5,949 (100.0%) | 0 (0.0%) |
| Total | 73,171 (93.1%) | 5,448 (6.9%) |
Health Insurance Coverage by Citizenship Status in Napa

| Citizenship Status | With Coverage | Without Coverage |
| Native Born | 4,762 (96.9%) | 153 (3.1%) |
| Foreign Born, Citizen | 12,342 (96.6%) | 439 (3.4%) |
| Foreign Born, not a Citizen | 5,146 (85.3%) | 889 (14.7%) |
Health Insurance Coverage by Household Income in Napa
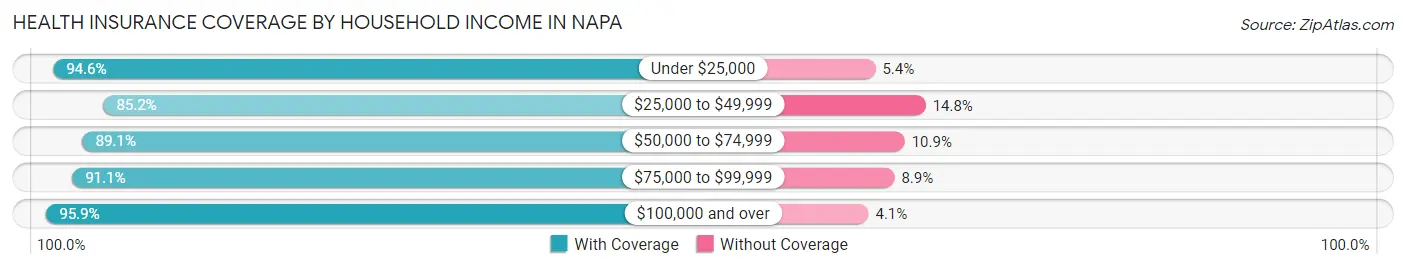
| Household Income | With Coverage | Without Coverage |
| Under $25,000 | 4,319 (94.6%) | 245 (5.4%) |
| $25,000 to $49,999 | 7,130 (85.2%) | 1,237 (14.8%) |
| $50,000 to $74,999 | 10,206 (89.1%) | 1,244 (10.9%) |
| $75,000 to $99,999 | 8,642 (91.1%) | 847 (8.9%) |
| $100,000 and over | 42,420 (95.9%) | 1,799 (4.1%) |
Public vs Private Health Insurance Coverage by Age in Napa
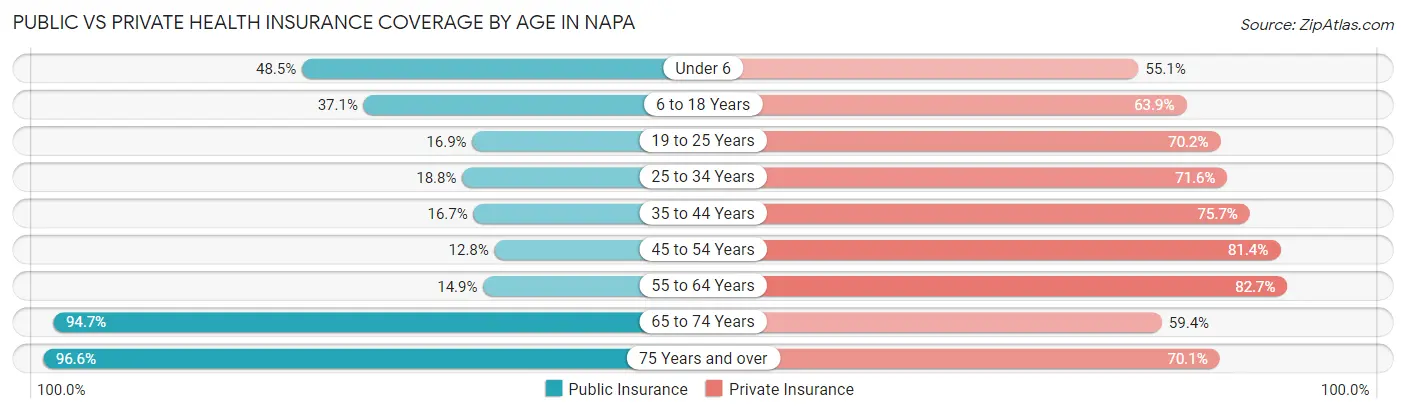
| Age Bracket | Public Insurance | Private Insurance |
| Under 6 | 2,384 (48.5%) | 2,707 (55.1%) |
| 6 to 18 Years | 4,735 (37.0%) | 8,171 (63.9%) |
| 19 to 25 Years | 1,019 (16.9%) | 4,239 (70.2%) |
| 25 to 34 Years | 1,822 (18.8%) | 6,949 (71.6%) |
| 35 to 44 Years | 1,811 (16.7%) | 8,222 (75.7%) |
| 45 to 54 Years | 1,292 (12.8%) | 8,234 (81.4%) |
| 55 to 64 Years | 1,490 (14.9%) | 8,291 (82.7%) |
| 65 to 74 Years | 7,785 (94.7%) | 4,883 (59.4%) |
| 75 Years and over | 5,748 (96.6%) | 4,171 (70.1%) |
| Total | 28,086 (35.7%) | 55,867 (71.1%) |
Disability Status by Sex by Age in Napa
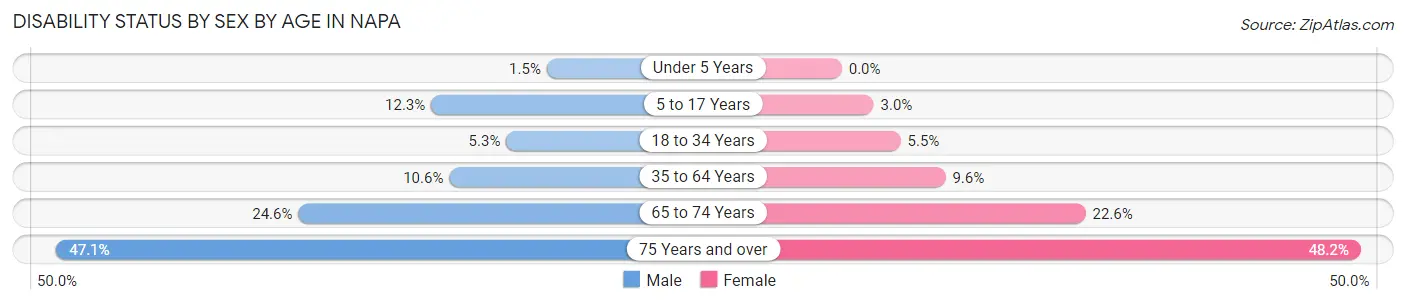
| Age Bracket | Male | Female |
| Under 5 Years | 31 (1.5%) | 0 (0.0%) |
| 5 to 17 Years | 816 (12.3%) | 179 (2.9%) |
| 18 to 34 Years | 431 (5.3%) | 467 (5.5%) |
| 35 to 64 Years | 1,676 (10.6%) | 1,462 (9.6%) |
| 65 to 74 Years | 974 (24.6%) | 963 (22.6%) |
| 75 Years and over | 1,141 (47.0%) | 1,697 (48.2%) |
Disability Class by Sex by Age in Napa
Disability Class: Hearing Difficulty
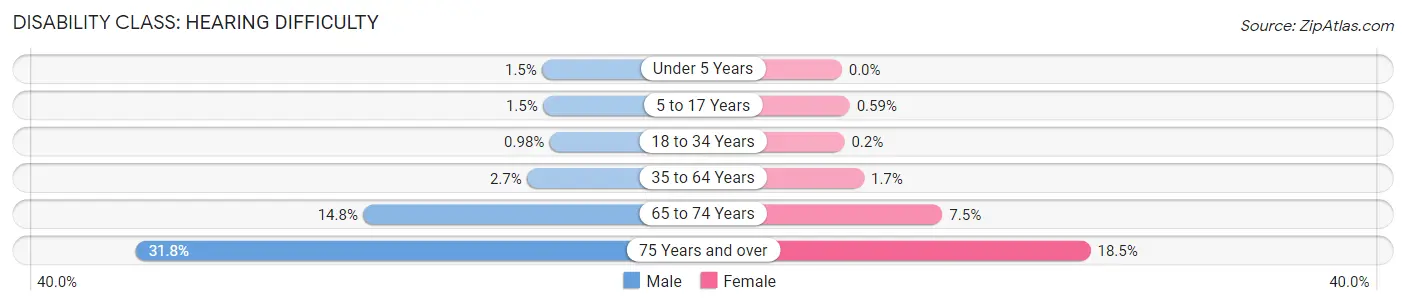
| Age Bracket | Male | Female |
| Under 5 Years | 31 (1.5%) | 0 (0.0%) |
| 5 to 17 Years | 98 (1.5%) | 36 (0.6%) |
| 18 to 34 Years | 80 (1.0%) | 17 (0.2%) |
| 35 to 64 Years | 420 (2.7%) | 250 (1.7%) |
| 65 to 74 Years | 587 (14.8%) | 318 (7.5%) |
| 75 Years and over | 770 (31.8%) | 651 (18.5%) |
Disability Class: Vision Difficulty
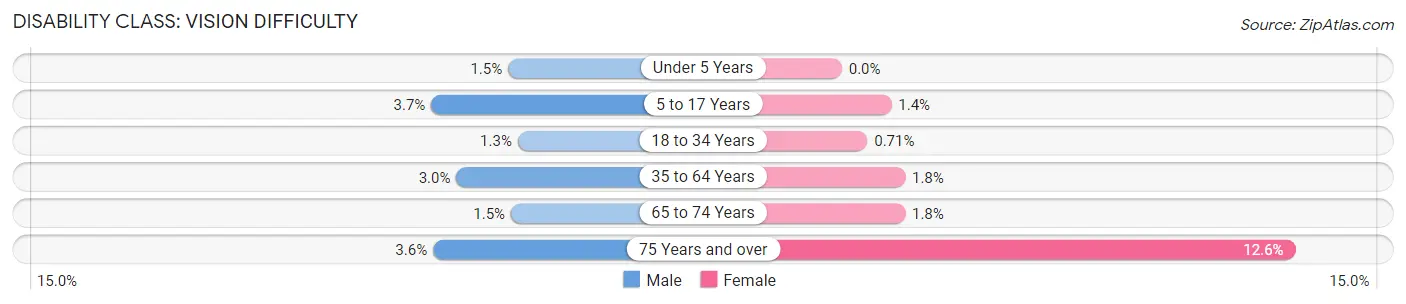
| Age Bracket | Male | Female |
| Under 5 Years | 31 (1.5%) | 0 (0.0%) |
| 5 to 17 Years | 245 (3.7%) | 84 (1.4%) |
| 18 to 34 Years | 103 (1.3%) | 61 (0.7%) |
| 35 to 64 Years | 472 (3.0%) | 267 (1.8%) |
| 65 to 74 Years | 58 (1.5%) | 75 (1.8%) |
| 75 Years and over | 88 (3.6%) | 445 (12.6%) |
Disability Class: Cognitive Difficulty
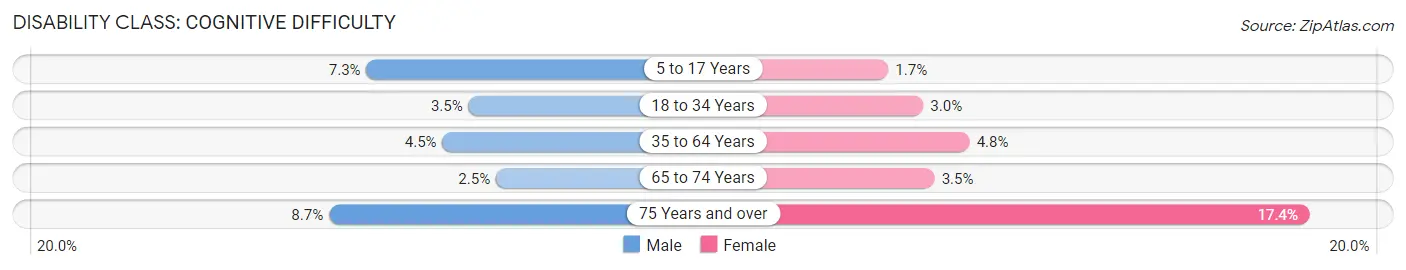
| Age Bracket | Male | Female |
| 5 to 17 Years | 486 (7.3%) | 105 (1.7%) |
| 18 to 34 Years | 286 (3.5%) | 259 (3.0%) |
| 35 to 64 Years | 711 (4.5%) | 722 (4.8%) |
| 65 to 74 Years | 99 (2.5%) | 147 (3.5%) |
| 75 Years and over | 211 (8.7%) | 612 (17.4%) |
Disability Class: Ambulatory Difficulty
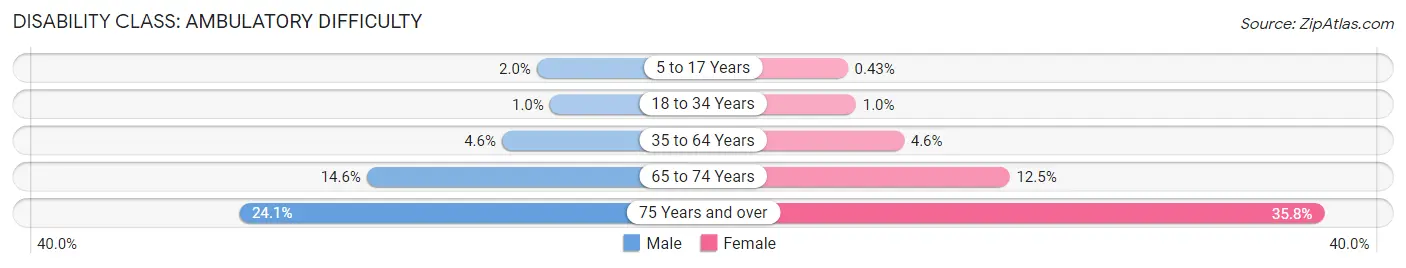
| Age Bracket | Male | Female |
| 5 to 17 Years | 132 (2.0%) | 26 (0.4%) |
| 18 to 34 Years | 83 (1.0%) | 89 (1.0%) |
| 35 to 64 Years | 723 (4.6%) | 699 (4.6%) |
| 65 to 74 Years | 578 (14.6%) | 530 (12.4%) |
| 75 Years and over | 584 (24.1%) | 1,262 (35.8%) |
Disability Class: Self-Care Difficulty
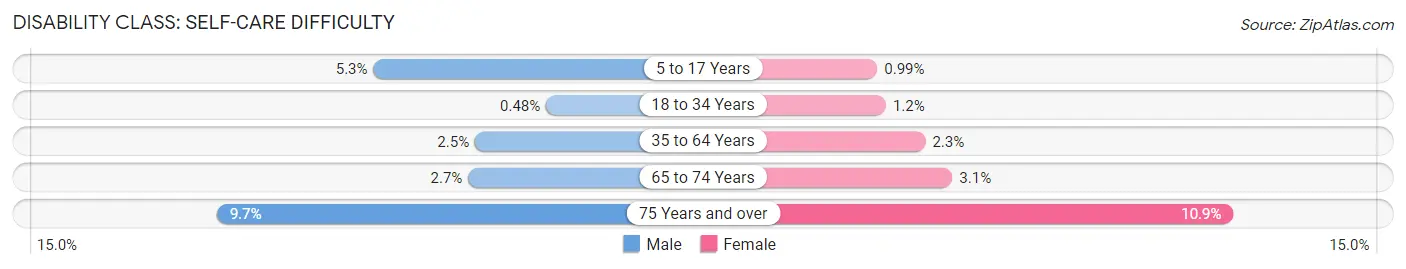
| Age Bracket | Male | Female |
| 5 to 17 Years | 352 (5.3%) | 60 (1.0%) |
| 18 to 34 Years | 39 (0.5%) | 105 (1.2%) |
| 35 to 64 Years | 389 (2.5%) | 354 (2.3%) |
| 65 to 74 Years | 105 (2.6%) | 131 (3.1%) |
| 75 Years and over | 234 (9.7%) | 384 (10.9%) |
Technology Access in Napa
Computing Device Access in Napa
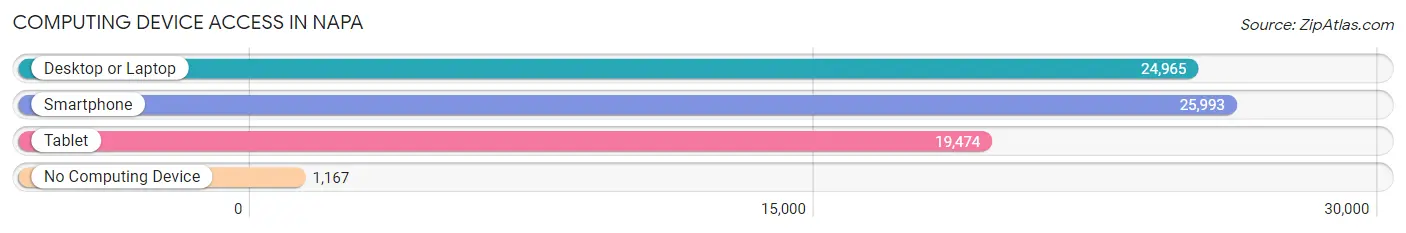
| Device Type | # Households | % Households |
| Desktop or Laptop | 24,965 | 84.8% |
| Smartphone | 25,993 | 88.3% |
| Tablet | 19,474 | 66.1% |
| No Computing Device | 1,167 | 4.0% |
| Total | 29,443 | 100.0% |
Internet Access in Napa
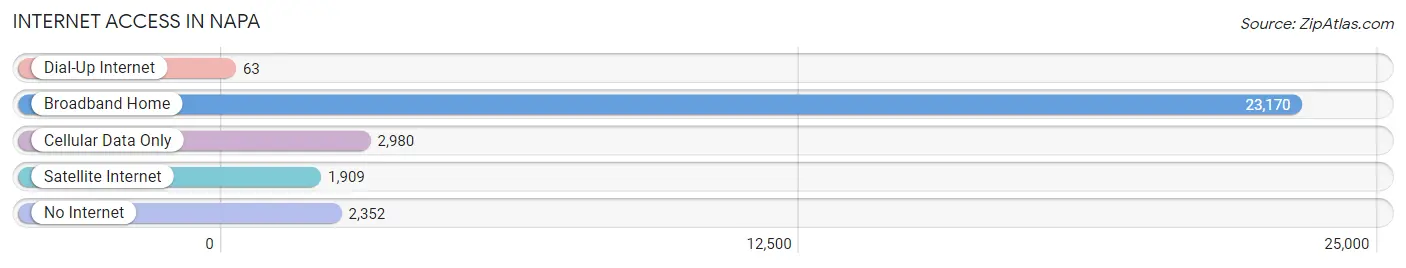
| Internet Type | # Households | % Households |
| Dial-Up Internet | 63 | 0.2% |
| Broadband Home | 23,170 | 78.7% |
| Cellular Data Only | 2,980 | 10.1% |
| Satellite Internet | 1,909 | 6.5% |
| No Internet | 2,352 | 8.0% |
| Total | 29,443 | 100.0% |
Napa Summary
Napa, California is a city located in the northern part of the state, in Napa County. It is situated in the heart of the Napa Valley, a region known for its wine production and tourism. The city has a population of approximately 80,000 people and is the county seat of Napa County.
History
The area that is now Napa was originally inhabited by the Wappo and Patwin Native American tribes. The first European settlers arrived in the area in the early 1800s, and the town of Napa was founded in 1847. The town was named after the Napa Valley, which was named after the Native American word for “plenty”.
In the late 1800s, the area became known for its wine production, and the first winery was established in 1858. The wine industry has continued to be an important part of the local economy ever since.
In the early 1900s, the city of Napa was incorporated and began to grow rapidly. The city was a popular destination for tourists, and the population increased significantly. In the 1950s, the city was the site of a major earthquake, which caused significant damage to the downtown area.
Geography
Napa is located in the northern part of California, in Napa County. It is situated in the heart of the Napa Valley, a region known for its wine production and tourism. The city is located at the base of the Mayacamas Mountains, and the Napa River runs through the city.
The city has a Mediterranean climate, with hot, dry summers and mild, wet winters. The average temperature in the summer is around 75°F (24°C), and the average temperature in the winter is around 55°F (13°C).
Economy
The economy of Napa is largely based on the wine industry, tourism, and agriculture. The wine industry is the largest employer in the city, and the city is home to over 400 wineries. Tourism is also an important part of the local economy, and the city is a popular destination for wine-tasting and other activities.
Agriculture is also an important part of the local economy, and the city is home to many farms and ranches. The city is also home to several manufacturing companies, including a large paper mill.
Demographics
As of the 2010 census, the population of Napa was 79,128. The racial makeup of the city was 68.2% White, 11.3% Hispanic or Latino, 8.2% Asian, 6.2% African American, and 6.1% other. The median household income was $63,837, and the median home value was $541,000.
The city is home to a diverse population, and the city is known for its vibrant arts and culture scene. The city is home to several museums, galleries, and theaters, and the city hosts a variety of festivals and events throughout the year.
Conclusion
Napa, California is a city located in the northern part of the state, in Napa County. It is situated in the heart of the Napa Valley, a region known for its wine production and tourism. The city has a population of approximately 80,000 people and is the county seat of Napa County. The economy of Napa is largely based on the wine industry, tourism, and agriculture. The city is home to a diverse population, and the city is known for its vibrant arts and culture scene.
Common Questions
What is Per Capita Income in Napa?
Per Capita income in Napa is $48,578.
What is the Median Family Income in Napa?
Median Family Income in Napa is $114,511.
What is the Median Household income in Napa?
Median Household Income in Napa is $100,273.
What is Income or Wage Gap in Napa?
Income or Wage Gap in Napa is 15.9%.
Women in Napa earn 84.1 cents for every dollar earned by a man.
What is Family Income Deficit in Napa?
Family Income Deficit in Napa is $9,632.
Families that are below poverty line in Napa earn $9,632 less on average than the poverty threshold level.
What is Inequality or Gini Index in Napa?
Inequality or Gini Index in Napa is 0.43.
What is the Total Population of Napa?
Total Population of Napa is 79,233.
What is the Total Male Population of Napa?
Total Male Population of Napa is 39,337.
What is the Total Female Population of Napa?
Total Female Population of Napa is 39,896.
What is the Ratio of Males per 100 Females in Napa?
There are 98.60 Males per 100 Females in Napa.
What is the Ratio of Females per 100 Males in Napa?
There are 101.42 Females per 100 Males in Napa.
What is the Median Population Age in Napa?
Median Population Age in Napa is 40.5 Years.
What is the Average Family Size in Napa
Average Family Size in Napa is 3.2 People.
What is the Average Household Size in Napa
Average Household Size in Napa is 2.6 People.
How Large is the Labor Force in Napa?
There are 42,780 People in the Labor Forcein in Napa.
What is the Percentage of People in the Labor Force in Napa?
66.1% of People are in the Labor Force in Napa.
What is the Unemployment Rate in Napa?
Unemployment Rate in Napa is 5.8%.