Morongo Valley, CA Map & Demographics
Morongo Valley Map
Morongo Valley Overview
$29,393
PER CAPITA INCOME
$60,048
AVG FAMILY INCOME
$45,938
AVG HOUSEHOLD INCOME
10.3%
WAGE / INCOME GAP [ % ]
89.7¢/ $1
WAGE / INCOME GAP [ $ ]
0.47
INEQUALITY / GINI INDEX
3,387
TOTAL POPULATION
1,830
MALE POPULATION
1,557
FEMALE POPULATION
117.53
MALES / 100 FEMALES
85.08
FEMALES / 100 MALES
45.6
MEDIAN AGE
3.0
AVG FAMILY SIZE
2.2
AVG HOUSEHOLD SIZE
1,482
LABOR FORCE [ PEOPLE ]
53.4%
PERCENT IN LABOR FORCE
8.8%
UNEMPLOYMENT RATE
Morongo Valley Zip Codes
Morongo Valley Area Codes
Income in Morongo Valley
Income Overview in Morongo Valley
Per Capita Income in Morongo Valley is $29,393, while median incomes of families and households are $60,048 and $45,938 respectively.
| Characteristic | Number | Measure |
| Per Capita Income | 3,387 | $29,393 |
| Median Family Income | 785 | $60,048 |
| Mean Family Income | 785 | $72,225 |
| Median Household Income | 1,559 | $45,938 |
| Mean Household Income | 1,559 | $62,294 |
| Income Deficit | 785 | $0 |
| Wage / Income Gap (%) | 3,387 | 10.32% |
| Wage / Income Gap ($) | 3,387 | 89.68¢ per $1 |
| Gini / Inequality Index | 3,387 | 0.47 |
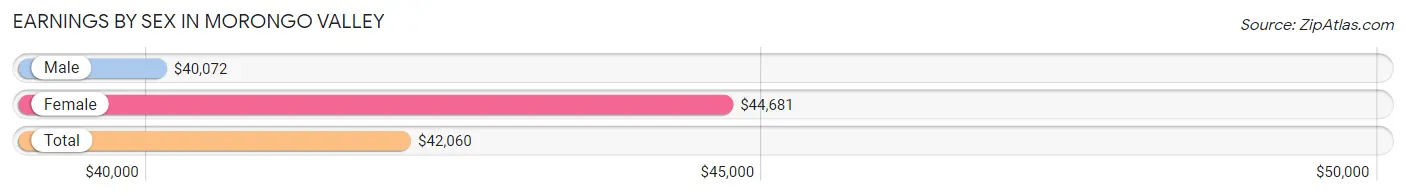
Earnings by Sex in Morongo Valley
Average Earnings in Morongo Valley are $42,060, $40,072 for men and $44,681 for women, a difference of 10.3%.
| Sex | Number | Average Earnings |
| Male | 1,029 (66.1%) | $40,072 |
| Female | 528 (33.9%) | $44,681 |
| Total | 1,557 (100.0%) | $42,060 |
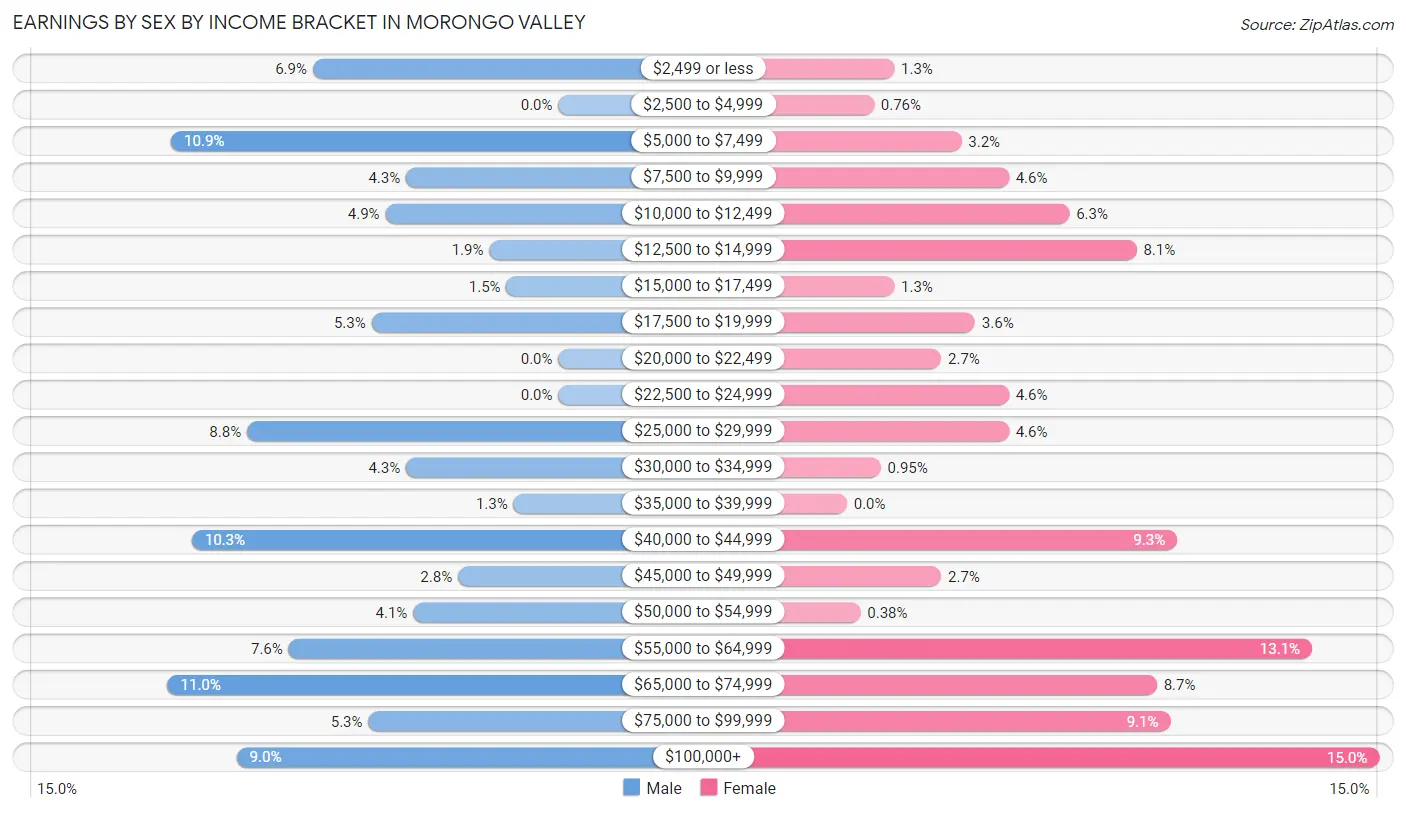
Earnings by Sex by Income Bracket in Morongo Valley
The most common earnings brackets in Morongo Valley are $65,000 to $74,999 for men (113 | 11.0%) and $100,000+ for women (79 | 15.0%).
| Income | Male | Female |
| $2,499 or less | 71 (6.9%) | 7 (1.3%) |
| $2,500 to $4,999 | 0 (0.0%) | 4 (0.8%) |
| $5,000 to $7,499 | 112 (10.9%) | 17 (3.2%) |
| $7,500 to $9,999 | 44 (4.3%) | 24 (4.5%) |
| $10,000 to $12,499 | 50 (4.9%) | 33 (6.2%) |
| $12,500 to $14,999 | 20 (1.9%) | 43 (8.1%) |
| $15,000 to $17,499 | 15 (1.5%) | 7 (1.3%) |
| $17,500 to $19,999 | 54 (5.2%) | 19 (3.6%) |
| $20,000 to $22,499 | 0 (0.0%) | 14 (2.6%) |
| $22,500 to $24,999 | 0 (0.0%) | 24 (4.5%) |
| $25,000 to $29,999 | 90 (8.7%) | 24 (4.5%) |
| $30,000 to $34,999 | 44 (4.3%) | 5 (0.9%) |
| $35,000 to $39,999 | 13 (1.3%) | 0 (0.0%) |
| $40,000 to $44,999 | 106 (10.3%) | 49 (9.3%) |
| $45,000 to $49,999 | 29 (2.8%) | 14 (2.6%) |
| $50,000 to $54,999 | 42 (4.1%) | 2 (0.4%) |
| $55,000 to $64,999 | 78 (7.6%) | 69 (13.1%) |
| $65,000 to $74,999 | 113 (11.0%) | 46 (8.7%) |
| $75,000 to $99,999 | 55 (5.3%) | 48 (9.1%) |
| $100,000+ | 93 (9.0%) | 79 (15.0%) |
| Total | 1,029 (100.0%) | 528 (100.0%) |
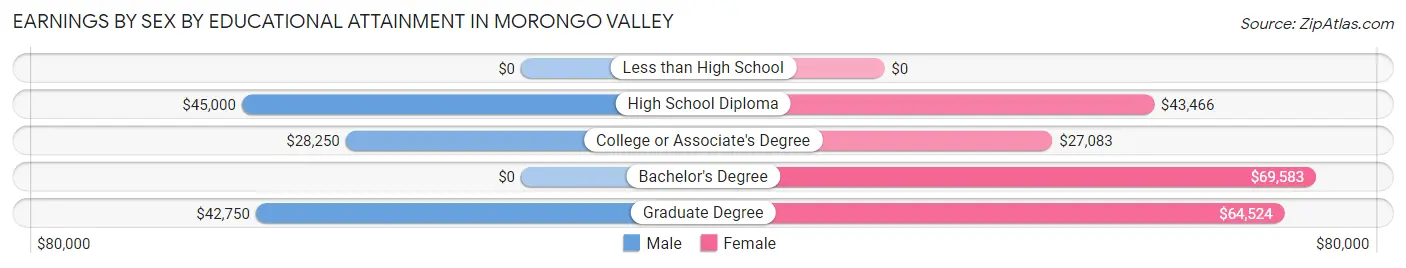
Earnings by Sex by Educational Attainment in Morongo Valley
Average earnings in Morongo Valley are $40,409 for men and $47,054 for women, a difference of 14.1%. Men with an educational attainment of high school diploma enjoy the highest average annual earnings of $45,000, while those with college or associate's degree education earn the least with $28,250. Women with an educational attainment of bachelor's degree earn the most with the average annual earnings of $69,583, while those with college or associate's degree education have the smallest earnings of $27,083.
| Educational Attainment | Male Income | Female Income |
| Less than High School | - | - |
| High School Diploma | $45,000 | $43,466 |
| College or Associate's Degree | $28,250 | $27,083 |
| Bachelor's Degree | - | - |
| Graduate Degree | $42,750 | $64,524 |
| Total | $40,409 | $47,054 |
Family Income in Morongo Valley
Family Income Brackets in Morongo Valley
According to the Morongo Valley family income data, there are 148 families falling into the $50,000 to $74,999 income range, which is the most common income bracket and makes up 18.9% of all families. Conversely, the $200,000+ income bracket is the least frequent group with only 23 families (2.9%) belonging to this category.
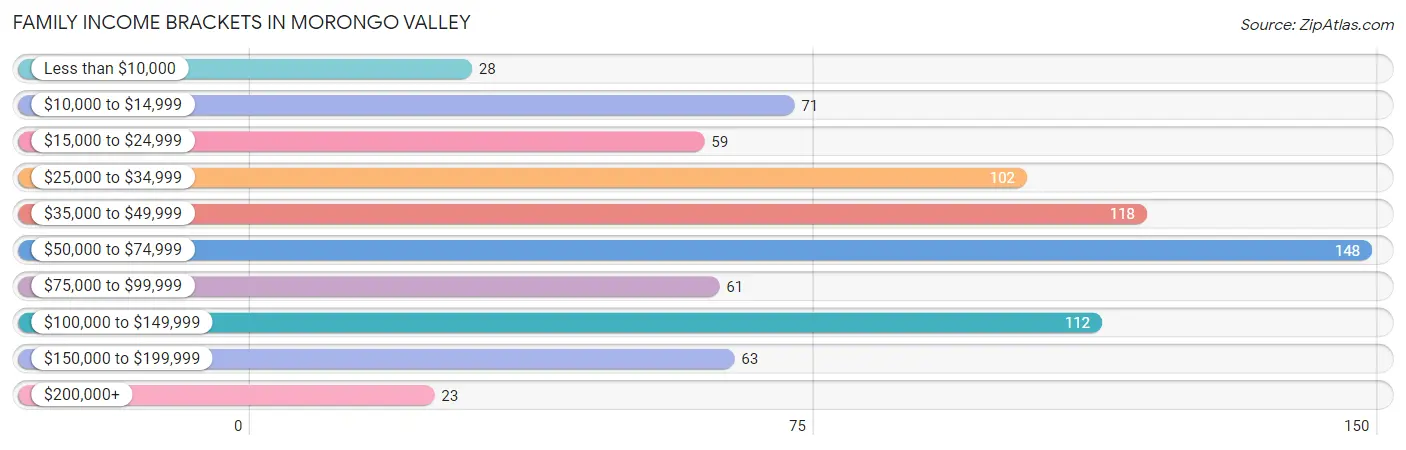
| Income Bracket | # Families | % Families |
| Less than $10,000 | 28 | 3.6% |
| $10,000 to $14,999 | 71 | 9.0% |
| $15,000 to $24,999 | 59 | 7.5% |
| $25,000 to $34,999 | 102 | 13.0% |
| $35,000 to $49,999 | 118 | 15.0% |
| $50,000 to $74,999 | 148 | 18.9% |
| $75,000 to $99,999 | 61 | 7.8% |
| $100,000 to $149,999 | 112 | 14.3% |
| $150,000 to $199,999 | 63 | 8.0% |
| $200,000+ | 23 | 2.9% |
Family Income by Famaliy Size in Morongo Valley
2-person families (421 | 53.6%) account for the highest median family income in Morongo Valley with $68,472 per family, while 2-person families (421 | 53.6%) have the highest median income of $34,236 per family member.
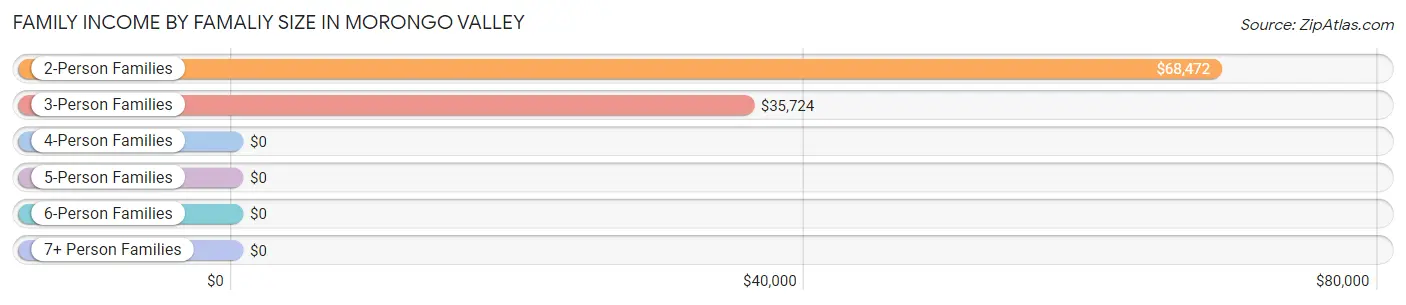
| Income Bracket | # Families | Median Income |
| 2-Person Families | 421 (53.6%) | $68,472 |
| 3-Person Families | 197 (25.1%) | $35,724 |
| 4-Person Families | 112 (14.3%) | $0 |
| 5-Person Families | 16 (2.0%) | $0 |
| 6-Person Families | 39 (5.0%) | $0 |
| 7+ Person Families | 0 (0.0%) | $0 |
| Total | 785 (100.0%) | $60,048 |
Family Income by Number of Earners in Morongo Valley
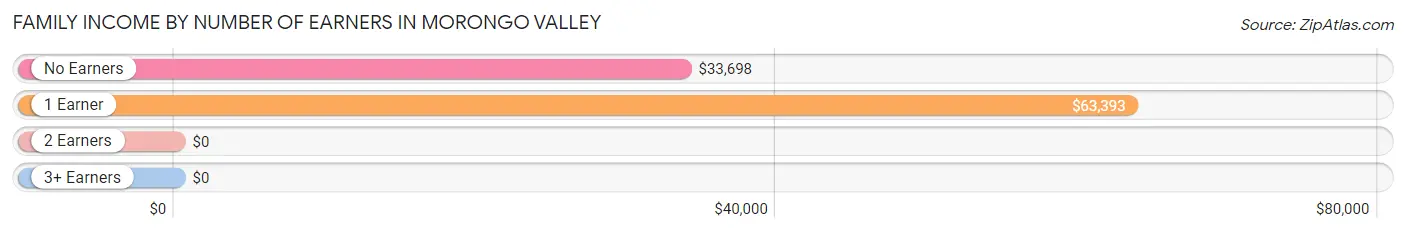
| Number of Earners | # Families | Median Income |
| No Earners | 143 (18.2%) | $33,698 |
| 1 Earner | 375 (47.8%) | $63,393 |
| 2 Earners | 265 (33.8%) | $0 |
| 3+ Earners | 2 (0.3%) | $0 |
| Total | 785 (100.0%) | $60,048 |
Household Income in Morongo Valley
Household Income Brackets in Morongo Valley
With 278 households falling in the category, the $50,000 to $74,999 income range is the most frequent in Morongo Valley, accounting for 17.8% of all households. In contrast, only 47 households (3.0%) fall into the $200,000+ income bracket, making it the least populous group.
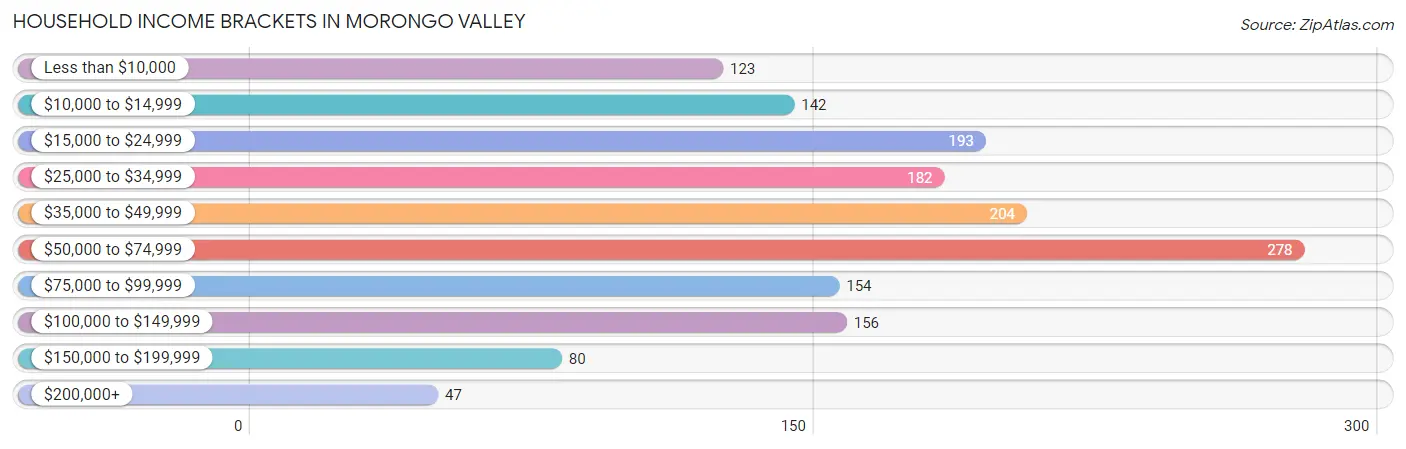
| Income Bracket | # Households | % Households |
| Less than $10,000 | 123 | 7.9% |
| $10,000 to $14,999 | 142 | 9.1% |
| $15,000 to $24,999 | 193 | 12.4% |
| $25,000 to $34,999 | 182 | 11.7% |
| $35,000 to $49,999 | 204 | 13.1% |
| $50,000 to $74,999 | 278 | 17.8% |
| $75,000 to $99,999 | 154 | 9.9% |
| $100,000 to $149,999 | 156 | 10.0% |
| $150,000 to $199,999 | 80 | 5.1% |
| $200,000+ | 47 | 3.0% |
Household Income by Householder Age in Morongo Valley
The median household income in Morongo Valley is $45,938, with the highest median household income of $64,327 found in the 25 to 44 years age bracket for the primary householder. A total of 372 households (23.9%) fall into this category. Meanwhile, the 15 to 24 years age bracket for the primary householder has the lowest median household income of $0, with 10 households (0.6%) in this group.
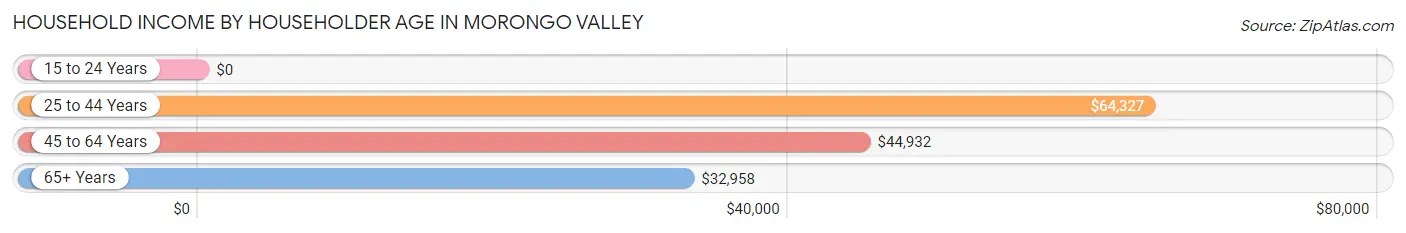
| Income Bracket | # Households | Median Income |
| 15 to 24 Years | 10 (0.6%) | $0 |
| 25 to 44 Years | 372 (23.9%) | $64,327 |
| 45 to 64 Years | 686 (44.0%) | $44,932 |
| 65+ Years | 491 (31.5%) | $32,958 |
| Total | 1,559 (100.0%) | $45,938 |
Poverty in Morongo Valley
Income Below Poverty by Sex and Age in Morongo Valley
With 22.1% poverty level for males and 30.1% for females among the residents of Morongo Valley, 12 to 14 year old males and 15 year old females are the most vulnerable to poverty, with 76 males (71.7%) and 10 females (100.0%) in their respective age groups living below the poverty level.
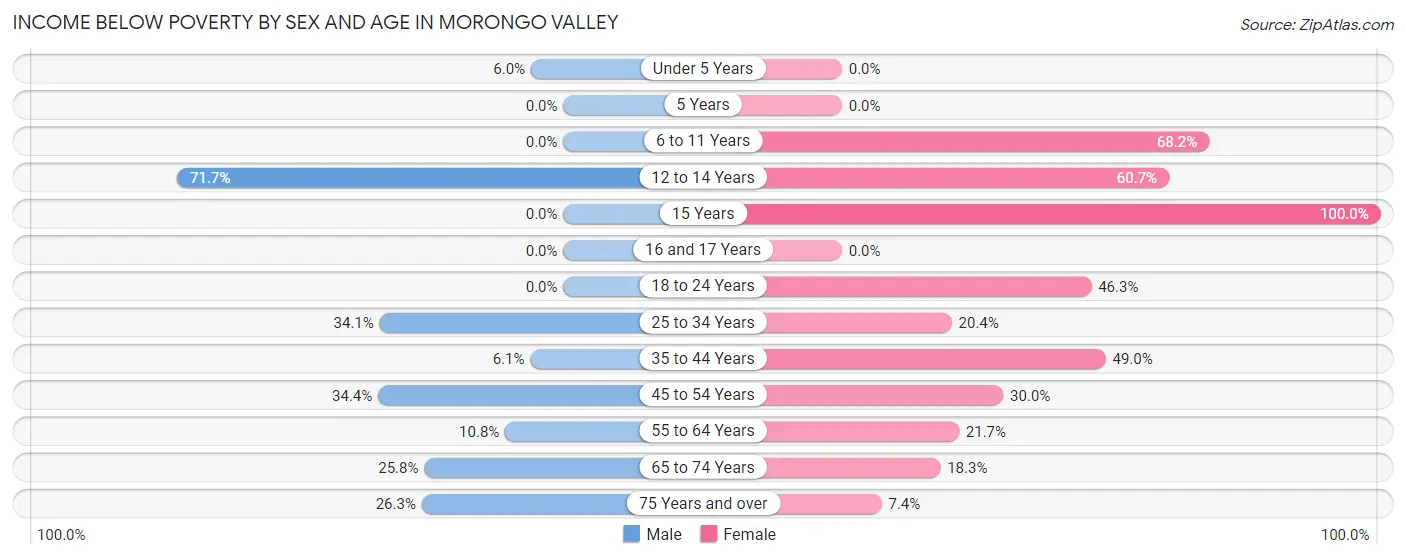
| Age Bracket | Male | Female |
| Under 5 Years | 8 (6.0%) | 0 (0.0%) |
| 5 Years | 0 (0.0%) | 0 (0.0%) |
| 6 to 11 Years | 0 (0.0%) | 92 (68.1%) |
| 12 to 14 Years | 76 (71.7%) | 34 (60.7%) |
| 15 Years | 0 (0.0%) | 10 (100.0%) |
| 16 and 17 Years | 0 (0.0%) | 0 (0.0%) |
| 18 to 24 Years | 0 (0.0%) | 25 (46.3%) |
| 25 to 34 Years | 89 (34.1%) | 32 (20.4%) |
| 35 to 44 Years | 17 (6.1%) | 93 (48.9%) |
| 45 to 54 Years | 99 (34.4%) | 65 (29.9%) |
| 55 to 64 Years | 27 (10.8%) | 73 (21.7%) |
| 65 to 74 Years | 40 (25.8%) | 36 (18.3%) |
| 75 Years and over | 46 (26.3%) | 9 (7.4%) |
| Total | 402 (22.1%) | 469 (30.1%) |
Income Above Poverty by Sex and Age in Morongo Valley
According to the poverty statistics in Morongo Valley, males aged 6 to 11 years and females aged under 5 years are the age groups that are most secure financially, with 100.0% of males and 100.0% of females in these age groups living above the poverty line.
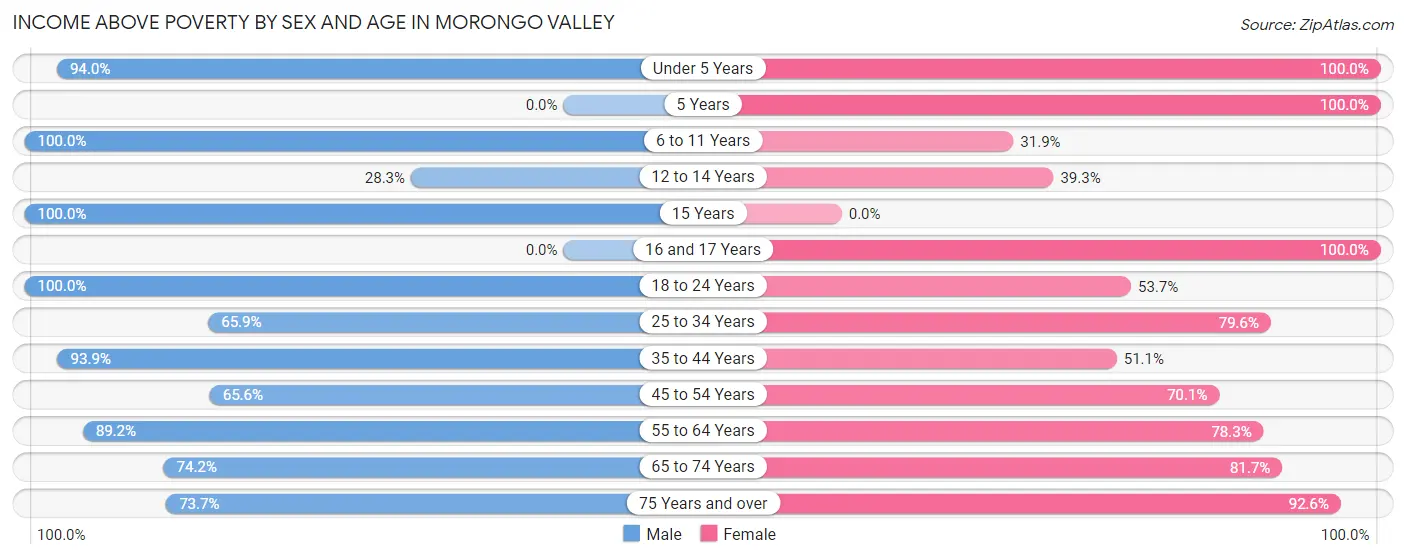
| Age Bracket | Male | Female |
| Under 5 Years | 125 (94.0%) | 46 (100.0%) |
| 5 Years | 0 (0.0%) | 15 (100.0%) |
| 6 to 11 Years | 79 (100.0%) | 43 (31.9%) |
| 12 to 14 Years | 30 (28.3%) | 22 (39.3%) |
| 15 Years | 23 (100.0%) | 0 (0.0%) |
| 16 and 17 Years | 0 (0.0%) | 22 (100.0%) |
| 18 to 24 Years | 75 (100.0%) | 29 (53.7%) |
| 25 to 34 Years | 172 (65.9%) | 125 (79.6%) |
| 35 to 44 Years | 260 (93.9%) | 97 (51.0%) |
| 45 to 54 Years | 189 (65.6%) | 152 (70.1%) |
| 55 to 64 Years | 223 (89.2%) | 263 (78.3%) |
| 65 to 74 Years | 115 (74.2%) | 161 (81.7%) |
| 75 Years and over | 129 (73.7%) | 113 (92.6%) |
| Total | 1,420 (77.9%) | 1,088 (69.9%) |
Income Below Poverty Among Married-Couple Families in Morongo Valley
The poverty statistics for married-couple families in Morongo Valley show that 18.4% or 104 of the total 566 families live below the poverty line. Families with 1 or 2 children have the highest poverty rate of 47.8%, comprising of 98 families. On the other hand, families with 3 or 4 children have the lowest poverty rate of 0.0%, which includes 0 families.
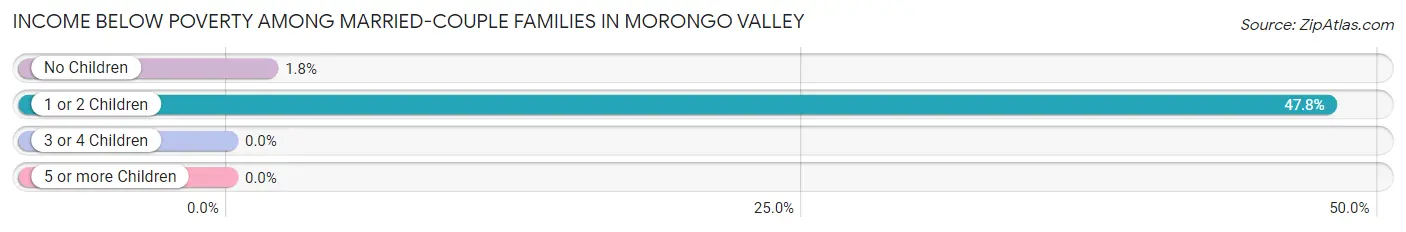
| Children | Above Poverty | Below Poverty |
| No Children | 336 (98.3%) | 6 (1.8%) |
| 1 or 2 Children | 107 (52.2%) | 98 (47.8%) |
| 3 or 4 Children | 19 (100.0%) | 0 (0.0%) |
| 5 or more Children | 0 (0.0%) | 0 (0.0%) |
| Total | 462 (81.6%) | 104 (18.4%) |
Income Below Poverty Among Single-Parent Households in Morongo Valley
According to the poverty data in Morongo Valley, 11.1% or 8 single-father households and 31.3% or 46 single-mother households are living below the poverty line. Among single-father households, those with 3 or 4 children have the highest poverty rate, with 8 households (100.0%) experiencing poverty. Likewise, among single-mother households, those with 1 or 2 children have the highest poverty rate, with 46 households (33.8%) falling below the poverty line.
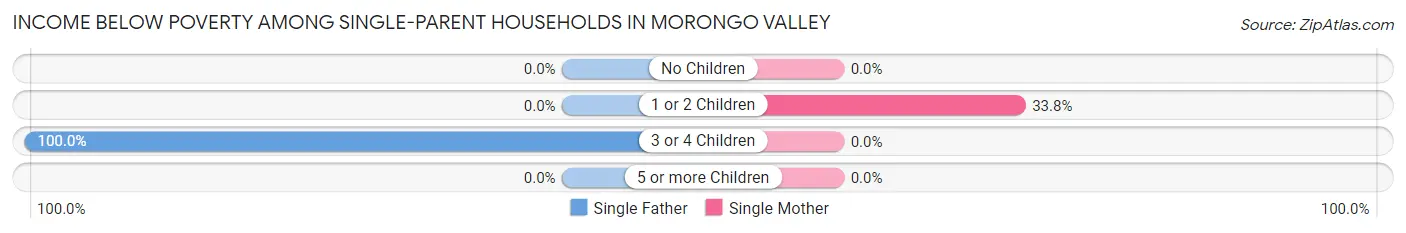
| Children | Single Father | Single Mother |
| No Children | 0 (0.0%) | 0 (0.0%) |
| 1 or 2 Children | 0 (0.0%) | 46 (33.8%) |
| 3 or 4 Children | 8 (100.0%) | 0 (0.0%) |
| 5 or more Children | 0 (0.0%) | 0 (0.0%) |
| Total | 8 (11.1%) | 46 (31.3%) |
Income Below Poverty Among Married-Couple vs Single-Parent Households in Morongo Valley
The poverty data for Morongo Valley shows that 104 of the married-couple family households (18.4%) and 54 of the single-parent households (24.7%) are living below the poverty level. Within the married-couple family households, those with 1 or 2 children have the highest poverty rate, with 98 households (47.8%) falling below the poverty line. Among the single-parent households, those with 3 or 4 children have the highest poverty rate, with 8 household (100.0%) living below poverty.
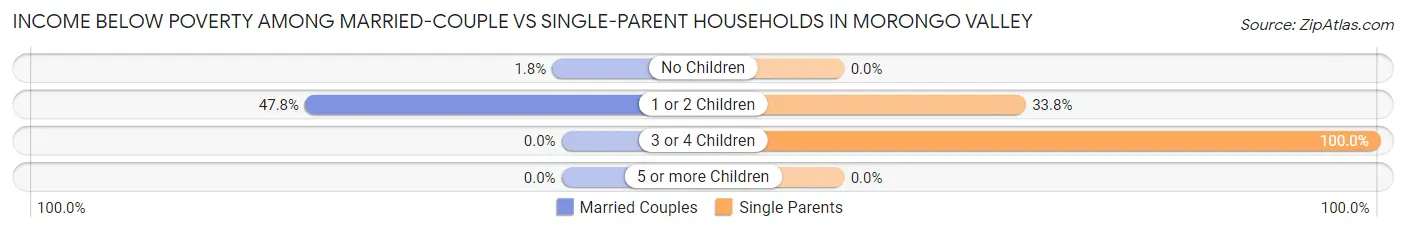
| Children | Married-Couple Families | Single-Parent Households |
| No Children | 6 (1.8%) | 0 (0.0%) |
| 1 or 2 Children | 98 (47.8%) | 46 (33.8%) |
| 3 or 4 Children | 0 (0.0%) | 8 (100.0%) |
| 5 or more Children | 0 (0.0%) | 0 (0.0%) |
| Total | 104 (18.4%) | 54 (24.7%) |
Race in Morongo Valley
The most populous races in Morongo Valley are White / Caucasian (2,663 | 78.6%), Hispanic or Latino (857 | 25.3%), and Some other Race (357 | 10.5%).
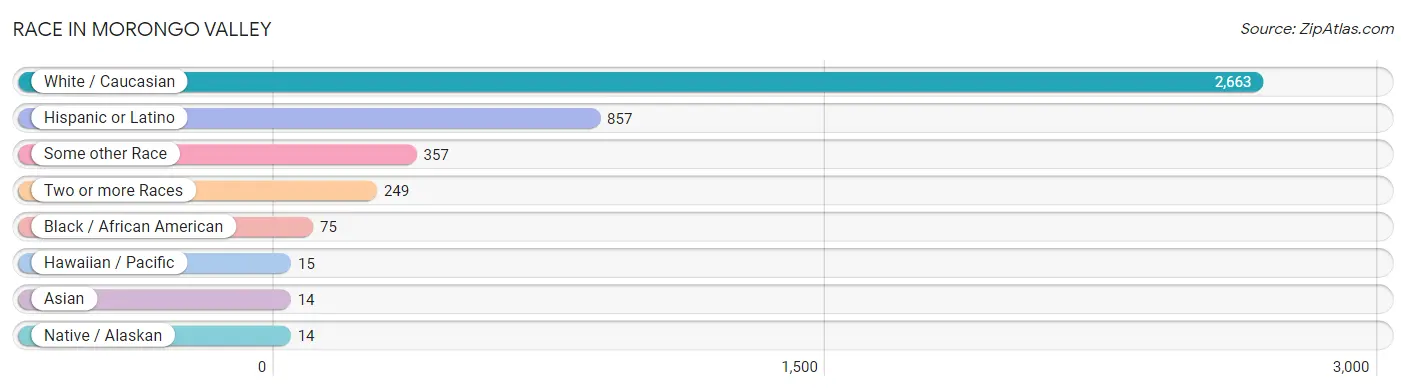
| Race | # Population | % Population |
| Asian | 14 | 0.4% |
| Black / African American | 75 | 2.2% |
| Hawaiian / Pacific | 15 | 0.4% |
| Hispanic or Latino | 857 | 25.3% |
| Native / Alaskan | 14 | 0.4% |
| White / Caucasian | 2,663 | 78.6% |
| Two or more Races | 249 | 7.3% |
| Some other Race | 357 | 10.5% |
| Total | 3,387 | 100.0% |
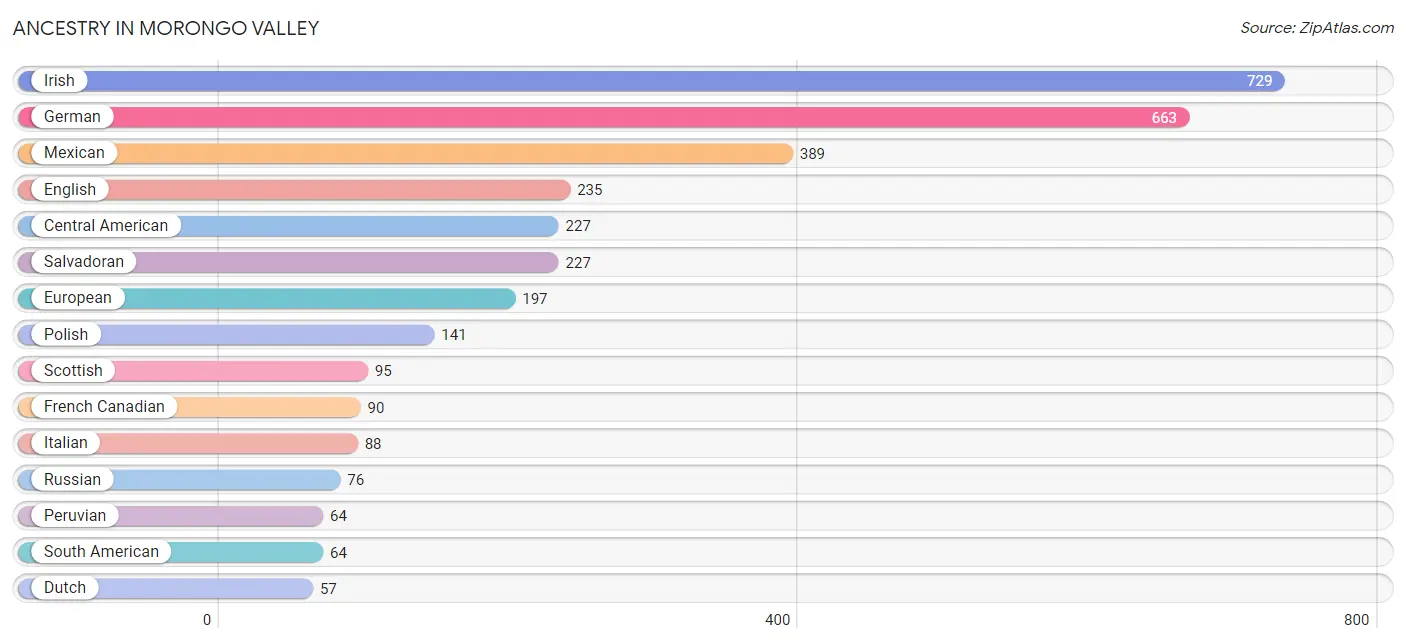
Ancestry in Morongo Valley
The most populous ancestries reported in Morongo Valley are Irish (729 | 21.5%), German (663 | 19.6%), Mexican (389 | 11.5%), English (235 | 6.9%), and Central American (227 | 6.7%), together accounting for 66.2% of all Morongo Valley residents.
| Ancestry | # Population | % Population |
| American | 46 | 1.4% |
| Arab | 15 | 0.4% |
| British | 15 | 0.4% |
| Canadian | 17 | 0.5% |
| Central American | 227 | 6.7% |
| Cherokee | 6 | 0.2% |
| Chippewa | 6 | 0.2% |
| Cuban | 14 | 0.4% |
| Danish | 21 | 0.6% |
| Dutch | 57 | 1.7% |
| Egyptian | 7 | 0.2% |
| English | 235 | 6.9% |
| European | 197 | 5.8% |
| Finnish | 27 | 0.8% |
| French | 34 | 1.0% |
| French Canadian | 90 | 2.7% |
| German | 663 | 19.6% |
| Guamanian / Chamorro | 44 | 1.3% |
| Indian (Asian) | 14 | 0.4% |
| Iranian | 8 | 0.2% |
| Irish | 729 | 21.5% |
| Italian | 88 | 2.6% |
| Jamaican | 26 | 0.8% |
| Korean | 4 | 0.1% |
| Latvian | 9 | 0.3% |
| Lithuanian | 8 | 0.2% |
| Mexican | 389 | 11.5% |
| Mexican American Indian | 8 | 0.2% |
| Native Hawaiian | 15 | 0.4% |
| Northern European | 6 | 0.2% |
| Norwegian | 43 | 1.3% |
| Palestinian | 7 | 0.2% |
| Peruvian | 64 | 1.9% |
| Polish | 141 | 4.2% |
| Puerto Rican | 36 | 1.1% |
| Russian | 76 | 2.2% |
| Salvadoran | 227 | 6.7% |
| Scandinavian | 25 | 0.7% |
| Scotch-Irish | 7 | 0.2% |
| Scottish | 95 | 2.8% |
| Serbian | 9 | 0.3% |
| South American | 64 | 1.9% |
| Spaniard | 10 | 0.3% |
| Spanish | 6 | 0.2% |
| Swedish | 33 | 1.0% |
| Swiss | 7 | 0.2% |
| Welsh | 18 | 0.5% | View All 47 Rows |
Immigrants in Morongo Valley
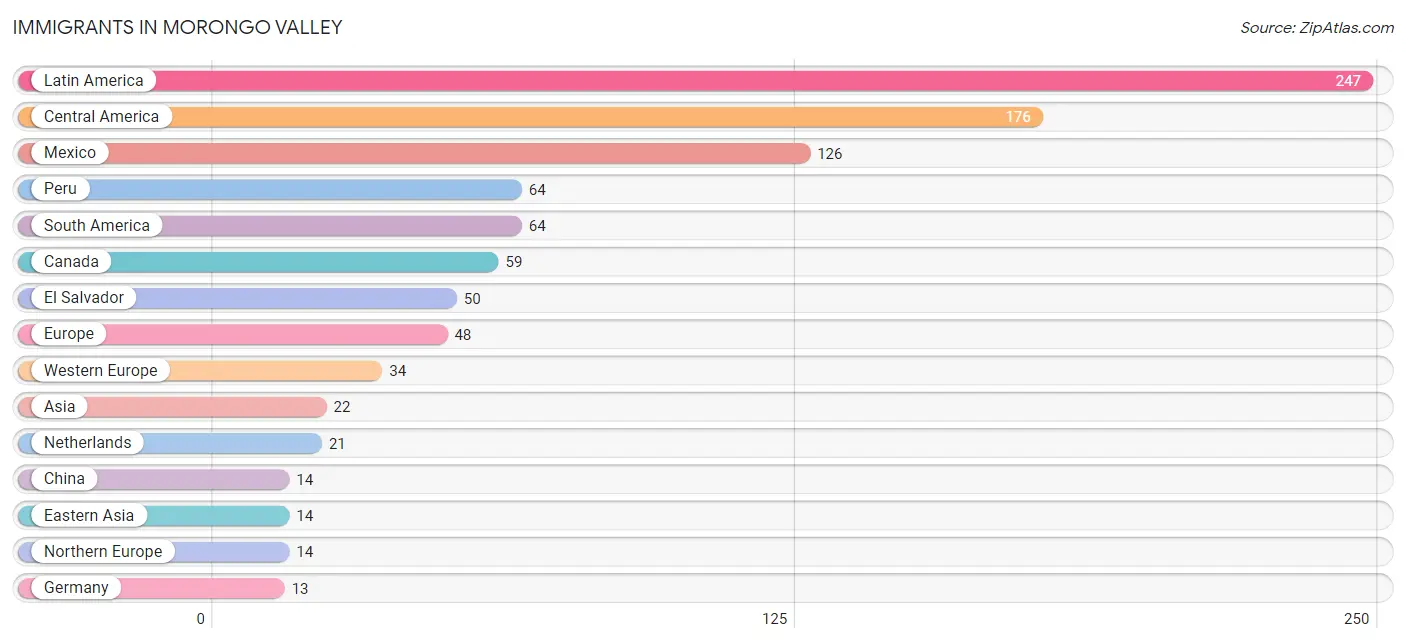
The most numerous immigrant groups reported in Morongo Valley came from Latin America (247 | 7.3%), Central America (176 | 5.2%), Mexico (126 | 3.7%), Peru (64 | 1.9%), and South America (64 | 1.9%), together accounting for 20.0% of all Morongo Valley residents.
| Immigration Origin | # Population | % Population |
| Africa | 8 | 0.2% |
| Asia | 22 | 0.6% |
| Canada | 59 | 1.7% |
| Caribbean | 7 | 0.2% |
| Central America | 176 | 5.2% |
| China | 14 | 0.4% |
| Cuba | 7 | 0.2% |
| Eastern Asia | 14 | 0.4% |
| El Salvador | 50 | 1.5% |
| England | 7 | 0.2% |
| Europe | 48 | 1.4% |
| Germany | 13 | 0.4% |
| Iran | 8 | 0.2% |
| Latin America | 247 | 7.3% |
| Mexico | 126 | 3.7% |
| Netherlands | 21 | 0.6% |
| Northern Europe | 14 | 0.4% |
| Norway | 7 | 0.2% |
| Peru | 64 | 1.9% |
| South Africa | 8 | 0.2% |
| South America | 64 | 1.9% |
| South Central Asia | 8 | 0.2% |
| Western Europe | 34 | 1.0% | View All 23 Rows |
Sex and Age in Morongo Valley
Sex and Age in Morongo Valley
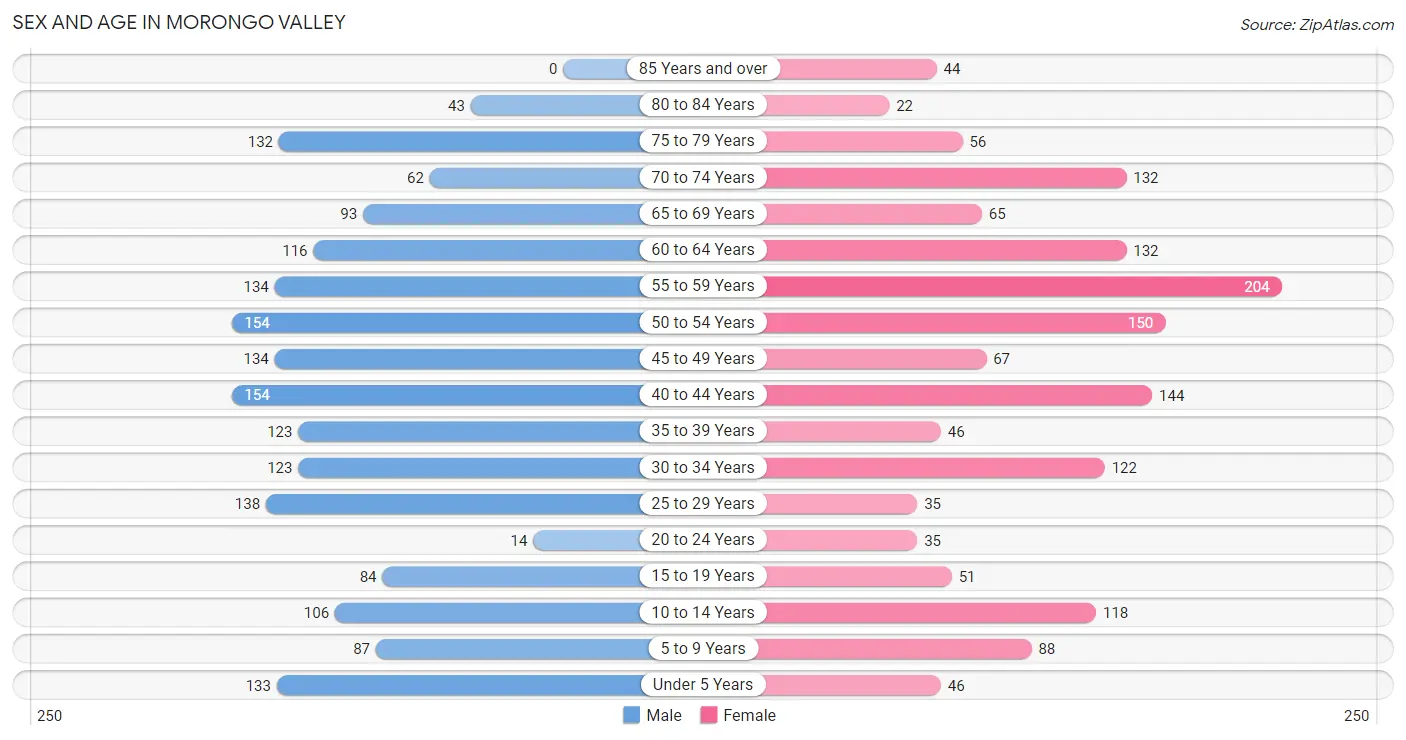
The most populous age groups in Morongo Valley are 40 to 44 Years (154 | 8.4%) for men and 55 to 59 Years (204 | 13.1%) for women.
| Age Bracket | Male | Female |
| Under 5 Years | 133 (7.3%) | 46 (2.9%) |
| 5 to 9 Years | 87 (4.8%) | 88 (5.7%) |
| 10 to 14 Years | 106 (5.8%) | 118 (7.6%) |
| 15 to 19 Years | 84 (4.6%) | 51 (3.3%) |
| 20 to 24 Years | 14 (0.8%) | 35 (2.2%) |
| 25 to 29 Years | 138 (7.5%) | 35 (2.2%) |
| 30 to 34 Years | 123 (6.7%) | 122 (7.8%) |
| 35 to 39 Years | 123 (6.7%) | 46 (2.9%) |
| 40 to 44 Years | 154 (8.4%) | 144 (9.2%) |
| 45 to 49 Years | 134 (7.3%) | 67 (4.3%) |
| 50 to 54 Years | 154 (8.4%) | 150 (9.6%) |
| 55 to 59 Years | 134 (7.3%) | 204 (13.1%) |
| 60 to 64 Years | 116 (6.3%) | 132 (8.5%) |
| 65 to 69 Years | 93 (5.1%) | 65 (4.2%) |
| 70 to 74 Years | 62 (3.4%) | 132 (8.5%) |
| 75 to 79 Years | 132 (7.2%) | 56 (3.6%) |
| 80 to 84 Years | 43 (2.4%) | 22 (1.4%) |
| 85 Years and over | 0 (0.0%) | 44 (2.8%) |
| Total | 1,830 (100.0%) | 1,557 (100.0%) |
Families and Households in Morongo Valley
Median Family Size in Morongo Valley
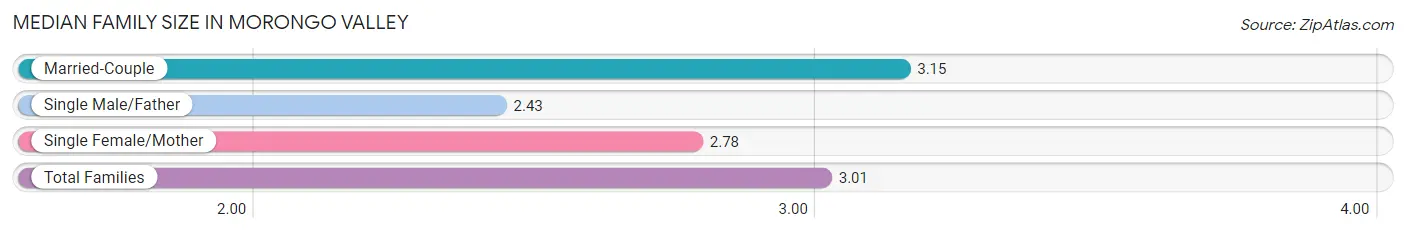
The median family size in Morongo Valley is 3.01 persons per family, with married-couple families (566 | 72.1%) accounting for the largest median family size of 3.15 persons per family. On the other hand, single male/father families (72 | 9.2%) represent the smallest median family size with 2.43 persons per family.
| Family Type | # Families | Family Size |
| Married-Couple | 566 (72.1%) | 3.15 |
| Single Male/Father | 72 (9.2%) | 2.43 |
| Single Female/Mother | 147 (18.7%) | 2.78 |
| Total Families | 785 (100.0%) | 3.01 |
Median Household Size in Morongo Valley
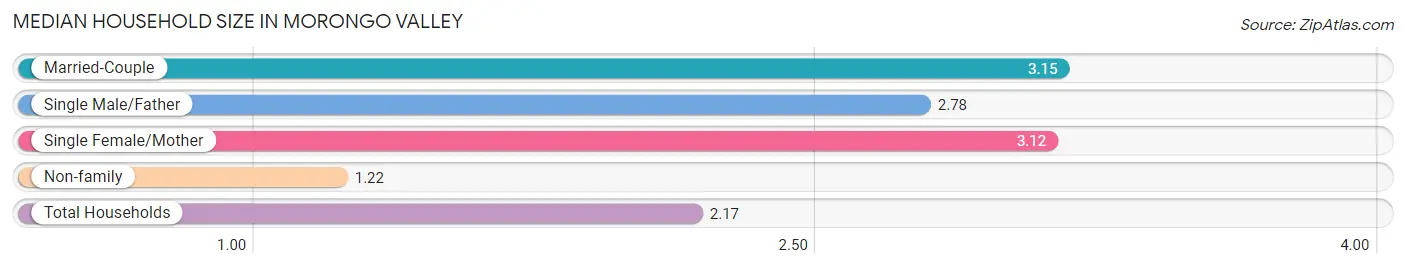
The median household size in Morongo Valley is 2.17 persons per household, with married-couple households (566 | 36.3%) accounting for the largest median household size of 3.15 persons per household. non-family households (774 | 49.6%) represent the smallest median household size with 1.22 persons per household.
| Household Type | # Households | Household Size |
| Married-Couple | 566 (36.3%) | 3.15 |
| Single Male/Father | 72 (4.6%) | 2.78 |
| Single Female/Mother | 147 (9.4%) | 3.12 |
| Non-family | 774 (49.6%) | 1.22 |
| Total Households | 1,559 (100.0%) | 2.17 |
Household Size by Marriage Status in Morongo Valley
Out of a total of 1,559 households in Morongo Valley, 785 (50.3%) are family households, while 774 (49.6%) are nonfamily households. The most numerous type of family households are 2-person households, comprising 400, and the most common type of nonfamily households are 1-person households, comprising 606.
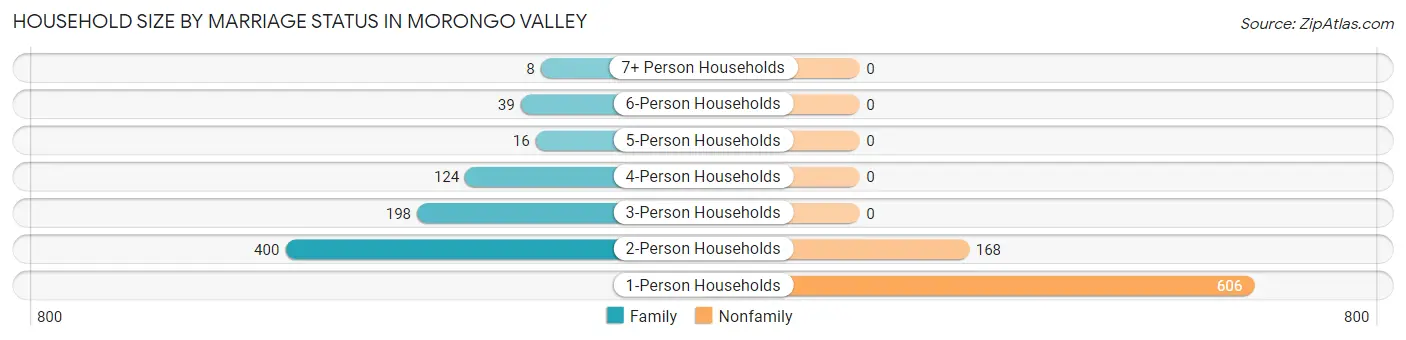
| Household Size | Family Households | Nonfamily Households |
| 1-Person Households | - | 606 (38.9%) |
| 2-Person Households | 400 (25.7%) | 168 (10.8%) |
| 3-Person Households | 198 (12.7%) | 0 (0.0%) |
| 4-Person Households | 124 (8.0%) | 0 (0.0%) |
| 5-Person Households | 16 (1.0%) | 0 (0.0%) |
| 6-Person Households | 39 (2.5%) | 0 (0.0%) |
| 7+ Person Households | 8 (0.5%) | 0 (0.0%) |
| Total | 785 (50.3%) | 774 (49.6%) |
Female Fertility in Morongo Valley
Fertility by Age in Morongo Valley
Average fertility rate in Morongo Valley is 35.0 births per 1,000 women. Women in the age bracket of 20 to 34 years have the highest fertility rate with 99.0 births per 1,000 women. Women in the age bracket of 20 to 34 years acount for 100.0% of all women with births.
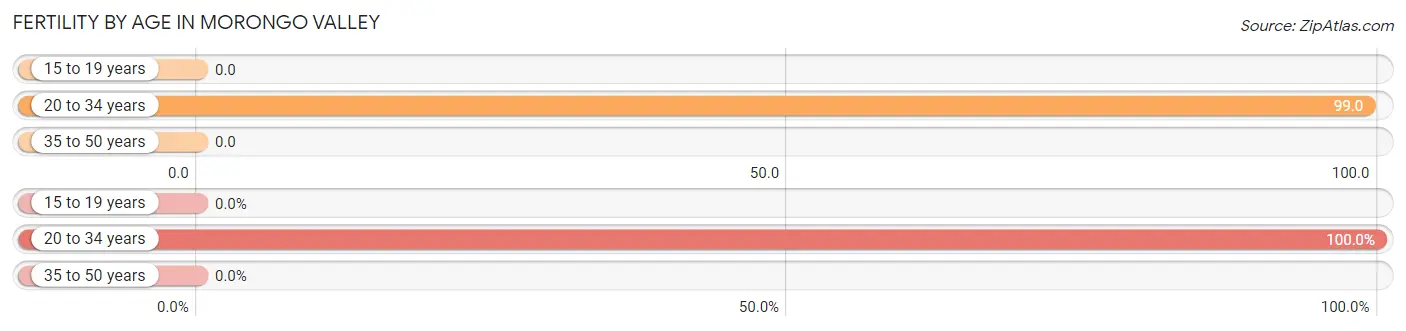
| Age Bracket | Women with Births | Births / 1,000 Women |
| 15 to 19 years | 0 (0.0%) | 0.0 |
| 20 to 34 years | 19 (100.0%) | 99.0 |
| 35 to 50 years | 0 (0.0%) | 0.0 |
| Total | 19 (100.0%) | 35.0 |
Fertility by Age by Marriage Status in Morongo Valley
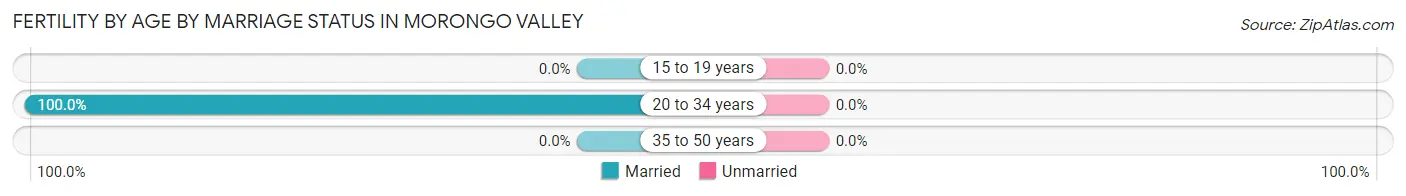
| Age Bracket | Married | Unmarried |
| 15 to 19 years | 0 (0.0%) | 0 (0.0%) |
| 20 to 34 years | 19 (100.0%) | 0 (0.0%) |
| 35 to 50 years | 0 (0.0%) | 0 (0.0%) |
| Total | 19 (100.0%) | 0 (0.0%) |
Fertility by Education in Morongo Valley
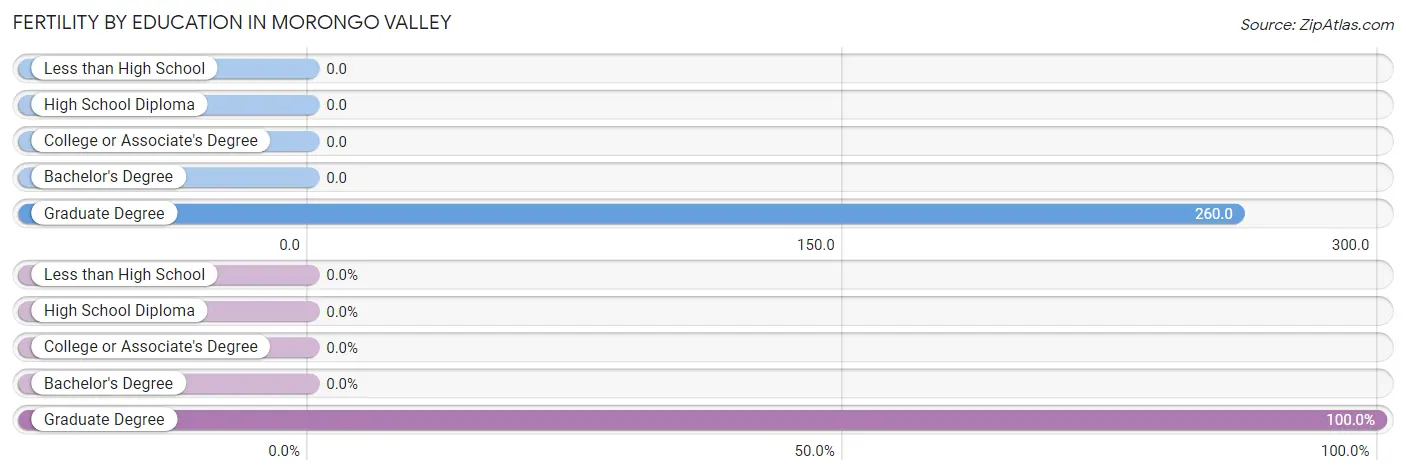
| Educational Attainment | Women with Births | Births / 1,000 Women |
| Less than High School | 0 (0.0%) | 0.0 |
| High School Diploma | 0 (0.0%) | 0.0 |
| College or Associate's Degree | 0 (0.0%) | 0.0 |
| Bachelor's Degree | 0 (0.0%) | 0.0 |
| Graduate Degree | 19 (100.0%) | 260.0 |
| Total | 19 (100.0%) | 35.0 |
Fertility by Education by Marriage Status in Morongo Valley
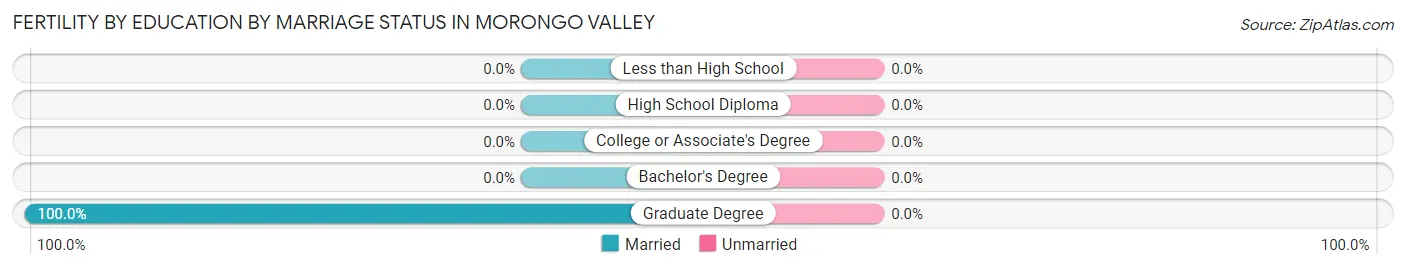
| Educational Attainment | Married | Unmarried |
| Less than High School | 0 (0.0%) | 0 (0.0%) |
| High School Diploma | 0 (0.0%) | 0 (0.0%) |
| College or Associate's Degree | 0 (0.0%) | 0 (0.0%) |
| Bachelor's Degree | 0 (0.0%) | 0 (0.0%) |
| Graduate Degree | 19 (100.0%) | 0 (0.0%) |
| Total | 19 (100.0%) | 0 (0.0%) |
Employment Characteristics in Morongo Valley
Employment by Class of Employer in Morongo Valley
Among the 1,301 employed individuals in Morongo Valley, private company employees (711 | 54.6%), self-employed (not incorporated) (279 | 21.4%), and local government employees (121 | 9.3%) make up the most common classes of employment.
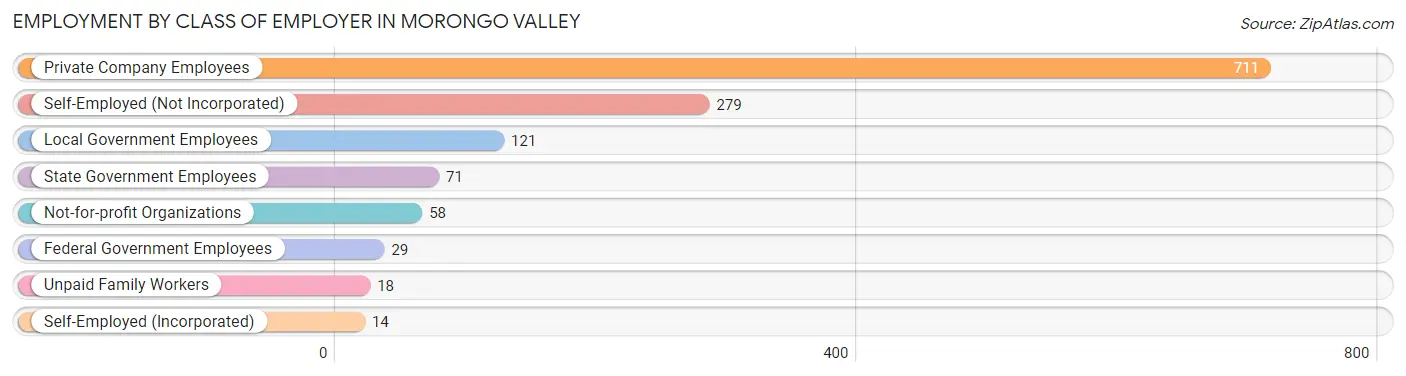
| Employer Class | # Employees | % Employees |
| Private Company Employees | 711 | 54.6% |
| Self-Employed (Incorporated) | 14 | 1.1% |
| Self-Employed (Not Incorporated) | 279 | 21.4% |
| Not-for-profit Organizations | 58 | 4.5% |
| Local Government Employees | 121 | 9.3% |
| State Government Employees | 71 | 5.5% |
| Federal Government Employees | 29 | 2.2% |
| Unpaid Family Workers | 18 | 1.4% |
| Total | 1,301 | 100.0% |
Employment Status by Age in Morongo Valley
According to the labor force statistics for Morongo Valley, out of the total population over 16 years of age (2,776), 53.4% or 1,482 individuals are in the labor force, with 8.8% or 130 of them unemployed. The age group with the highest labor force participation rate is 20 to 24 years, with 100.0% or 49 individuals in the labor force. Within the labor force, the 16 to 19 years age range has the highest percentage of unemployed individuals, with 100.0% or 60 of them being unemployed.
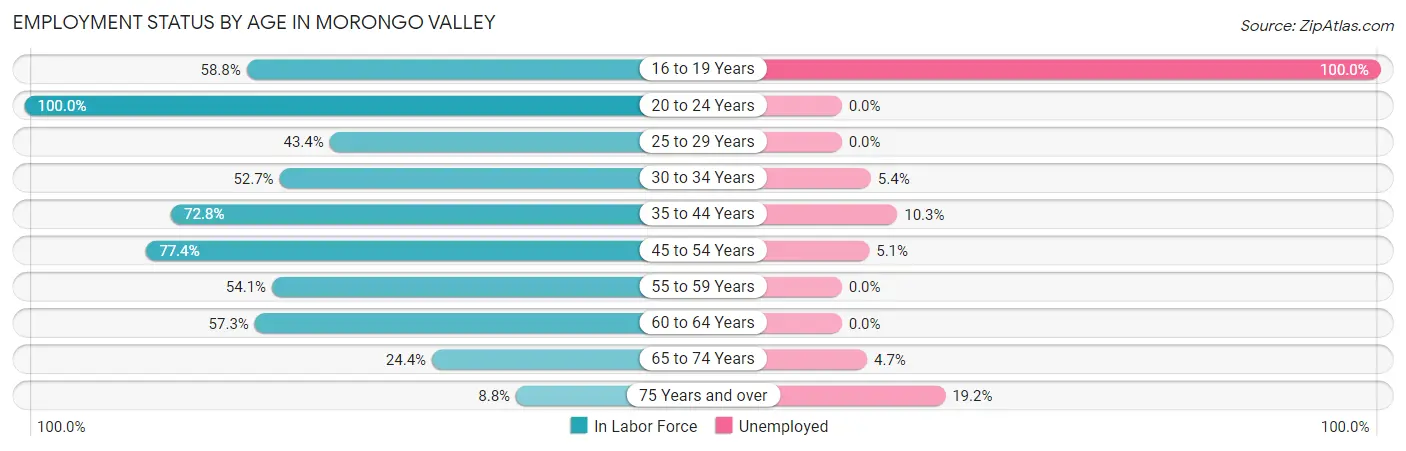
| Age Bracket | In Labor Force | Unemployed |
| 16 to 19 Years | 60 (58.8%) | 60 (100.0%) |
| 20 to 24 Years | 49 (100.0%) | 0 (0.0%) |
| 25 to 29 Years | 75 (43.4%) | 0 (0.0%) |
| 30 to 34 Years | 129 (52.7%) | 7 (5.4%) |
| 35 to 44 Years | 340 (72.8%) | 35 (10.3%) |
| 45 to 54 Years | 391 (77.4%) | 20 (5.1%) |
| 55 to 59 Years | 183 (54.1%) | 0 (0.0%) |
| 60 to 64 Years | 142 (57.3%) | 0 (0.0%) |
| 65 to 74 Years | 86 (24.4%) | 4 (4.7%) |
| 75 Years and over | 26 (8.8%) | 5 (19.2%) |
| Total | 1,482 (53.4%) | 130 (8.8%) |
Employment Status by Educational Attainment in Morongo Valley
According to labor force statistics for Morongo Valley, 63.8% of individuals (1,261) out of the total population between 25 and 64 years of age (1,976) are in the labor force, with 4.9% or 62 of them being unemployed. The group with the highest labor force participation rate are those with the educational attainment of bachelor's degree or higher, with 70.3% or 225 individuals in the labor force. Within the labor force, individuals with high school diploma education have the highest percentage of unemployment, with 6.7% or 20 of them being unemployed.
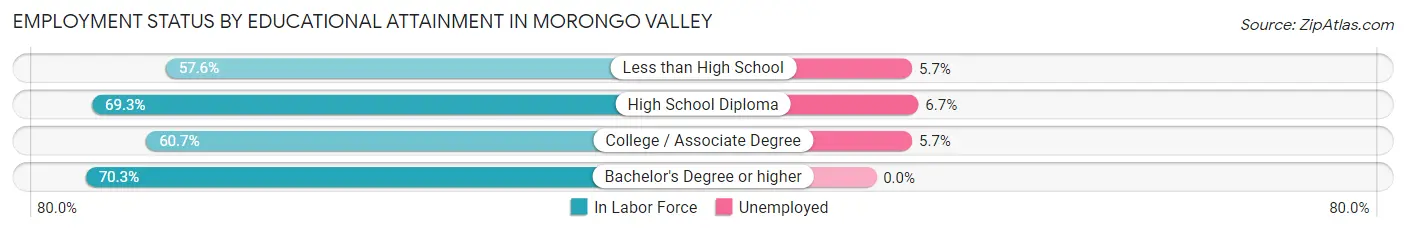
| Educational Attainment | In Labor Force | Unemployed |
| Less than High School | 141 (57.6%) | 14 (5.7%) |
| High School Diploma | 300 (69.3%) | 29 (6.7%) |
| College / Associate Degree | 594 (60.7%) | 56 (5.7%) |
| Bachelor's Degree or higher | 225 (70.3%) | 0 (0.0%) |
| Total | 1,261 (63.8%) | 97 (4.9%) |
Employment Occupations by Sex in Morongo Valley
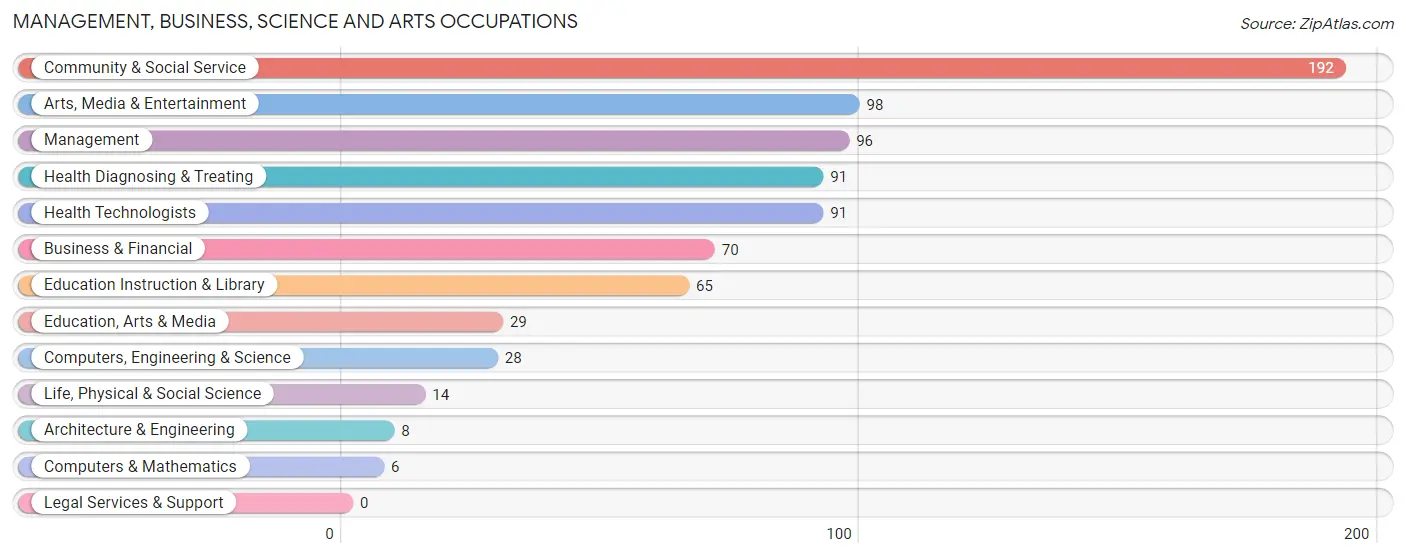
Management, Business, Science and Arts Occupations
The most common Management, Business, Science and Arts occupations in Morongo Valley are Community & Social Service (192 | 14.2%), Arts, Media & Entertainment (98 | 7.3%), Management (96 | 7.1%), Health Diagnosing & Treating (91 | 6.7%), and Health Technologists (91 | 6.7%).
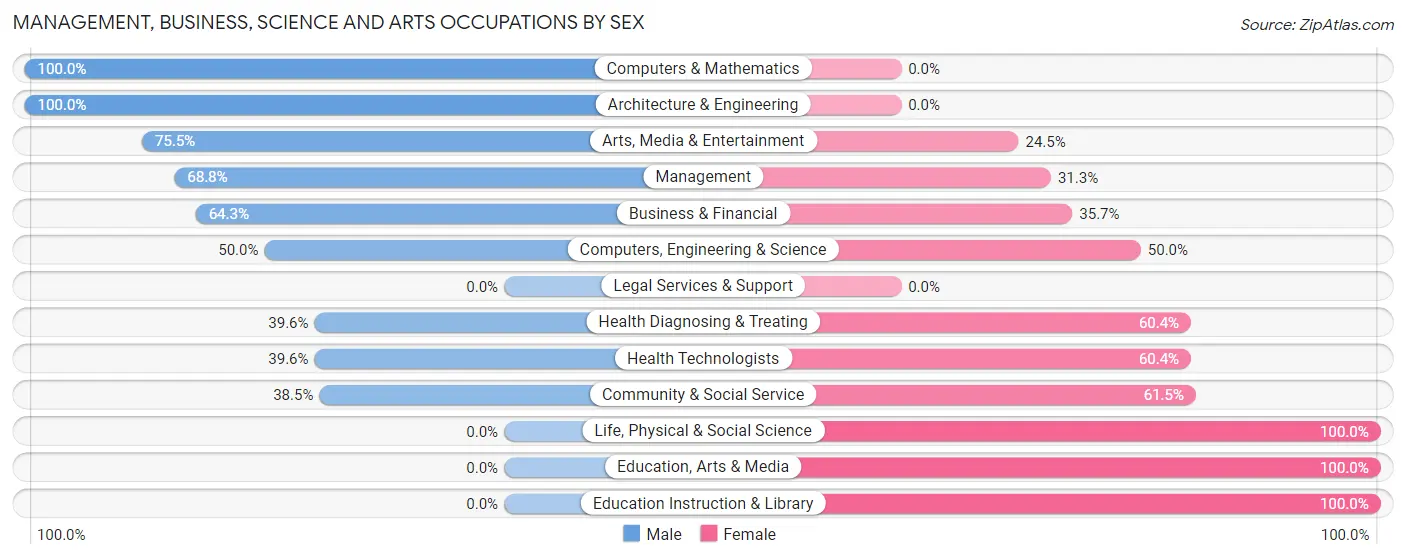
Management, Business, Science and Arts Occupations by Sex
Within the Management, Business, Science and Arts occupations in Morongo Valley, the most male-oriented occupations are Computers & Mathematics (100.0%), Architecture & Engineering (100.0%), and Arts, Media & Entertainment (75.5%), while the most female-oriented occupations are Life, Physical & Social Science (100.0%), Education, Arts & Media (100.0%), and Education Instruction & Library (100.0%).
| Occupation | Male | Female |
| Management | 66 (68.8%) | 30 (31.2%) |
| Business & Financial | 45 (64.3%) | 25 (35.7%) |
| Computers, Engineering & Science | 14 (50.0%) | 14 (50.0%) |
| Computers & Mathematics | 6 (100.0%) | 0 (0.0%) |
| Architecture & Engineering | 8 (100.0%) | 0 (0.0%) |
| Life, Physical & Social Science | 0 (0.0%) | 14 (100.0%) |
| Community & Social Service | 74 (38.5%) | 118 (61.5%) |
| Education, Arts & Media | 0 (0.0%) | 29 (100.0%) |
| Legal Services & Support | 0 (0.0%) | 0 (0.0%) |
| Education Instruction & Library | 0 (0.0%) | 65 (100.0%) |
| Arts, Media & Entertainment | 74 (75.5%) | 24 (24.5%) |
| Health Diagnosing & Treating | 36 (39.6%) | 55 (60.4%) |
| Health Technologists | 36 (39.6%) | 55 (60.4%) |
| Total (Category) | 235 (49.3%) | 242 (50.7%) |
| Total (Overall) | 867 (64.2%) | 483 (35.8%) |
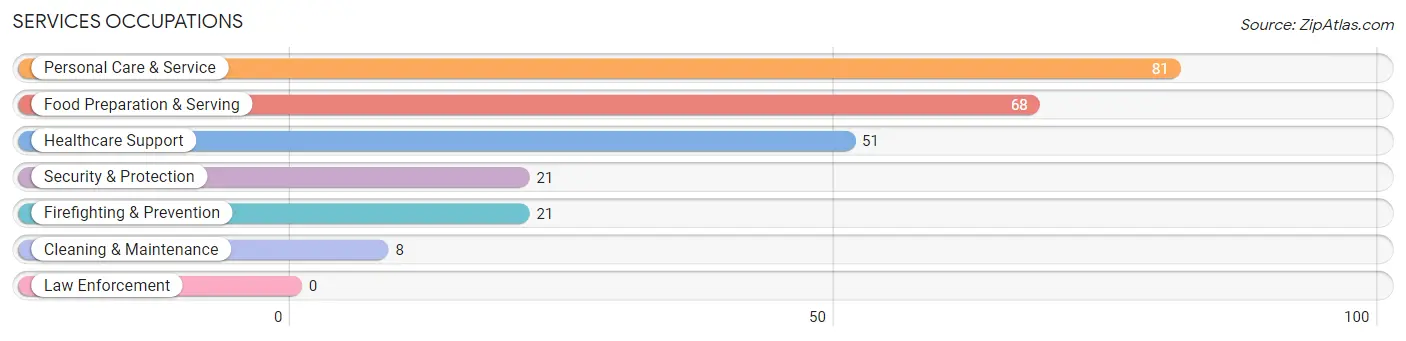
Services Occupations
The most common Services occupations in Morongo Valley are Personal Care & Service (81 | 6.0%), Food Preparation & Serving (68 | 5.0%), Healthcare Support (51 | 3.8%), Security & Protection (21 | 1.6%), and Firefighting & Prevention (21 | 1.6%).
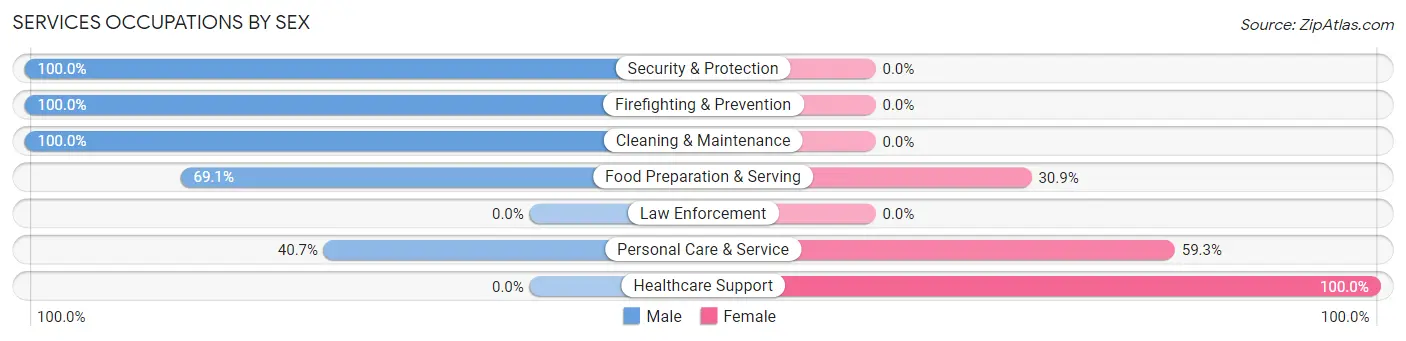
Services Occupations by Sex
Within the Services occupations in Morongo Valley, the most male-oriented occupations are Security & Protection (100.0%), Firefighting & Prevention (100.0%), and Cleaning & Maintenance (100.0%), while the most female-oriented occupations are Healthcare Support (100.0%), Personal Care & Service (59.3%), and Food Preparation & Serving (30.9%).
| Occupation | Male | Female |
| Healthcare Support | 0 (0.0%) | 51 (100.0%) |
| Security & Protection | 21 (100.0%) | 0 (0.0%) |
| Firefighting & Prevention | 21 (100.0%) | 0 (0.0%) |
| Law Enforcement | 0 (0.0%) | 0 (0.0%) |
| Food Preparation & Serving | 47 (69.1%) | 21 (30.9%) |
| Cleaning & Maintenance | 8 (100.0%) | 0 (0.0%) |
| Personal Care & Service | 33 (40.7%) | 48 (59.3%) |
| Total (Category) | 109 (47.6%) | 120 (52.4%) |
| Total (Overall) | 867 (64.2%) | 483 (35.8%) |
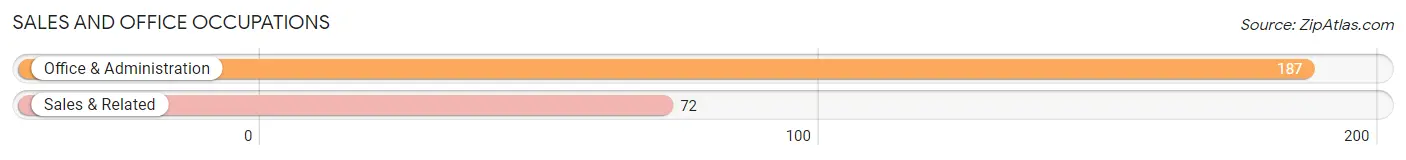
Sales and Office Occupations
The most common Sales and Office occupations in Morongo Valley are Office & Administration (187 | 13.9%), and Sales & Related (72 | 5.3%).
Sales and Office Occupations by Sex
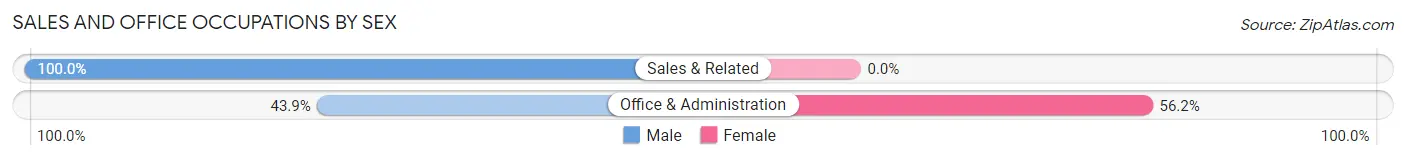
| Occupation | Male | Female |
| Sales & Related | 72 (100.0%) | 0 (0.0%) |
| Office & Administration | 82 (43.9%) | 105 (56.1%) |
| Total (Category) | 154 (59.5%) | 105 (40.5%) |
| Total (Overall) | 867 (64.2%) | 483 (35.8%) |
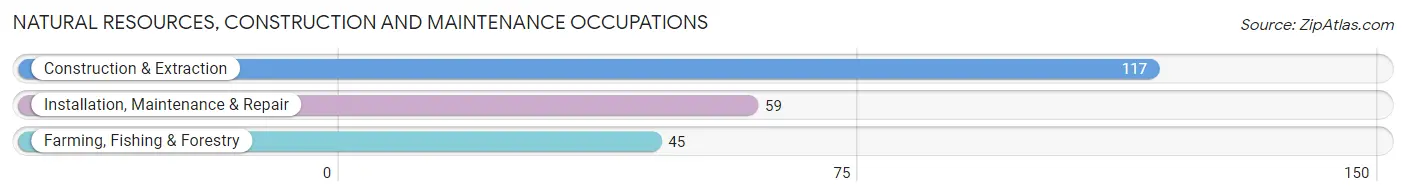
Natural Resources, Construction and Maintenance Occupations
The most common Natural Resources, Construction and Maintenance occupations in Morongo Valley are Construction & Extraction (117 | 8.7%), Installation, Maintenance & Repair (59 | 4.4%), and Farming, Fishing & Forestry (45 | 3.3%).
Natural Resources, Construction and Maintenance Occupations by Sex
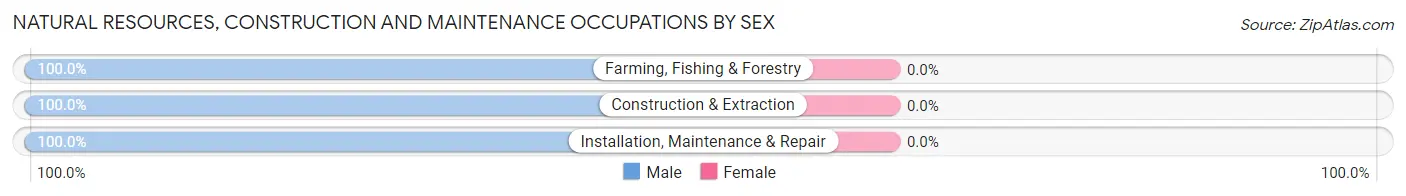
| Occupation | Male | Female |
| Farming, Fishing & Forestry | 45 (100.0%) | 0 (0.0%) |
| Construction & Extraction | 117 (100.0%) | 0 (0.0%) |
| Installation, Maintenance & Repair | 59 (100.0%) | 0 (0.0%) |
| Total (Category) | 221 (100.0%) | 0 (0.0%) |
| Total (Overall) | 867 (64.2%) | 483 (35.8%) |
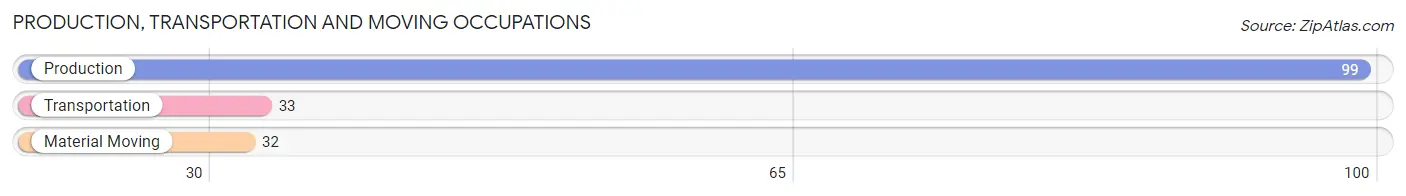
Production, Transportation and Moving Occupations
The most common Production, Transportation and Moving occupations in Morongo Valley are Production (99 | 7.3%), Transportation (33 | 2.4%), and Material Moving (32 | 2.4%).
Production, Transportation and Moving Occupations by Sex
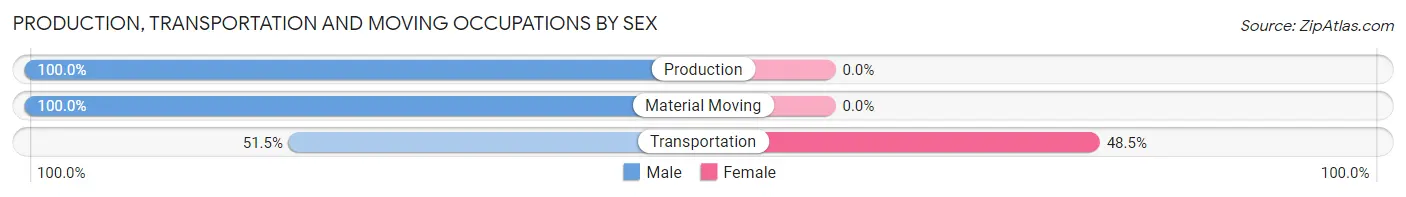
| Occupation | Male | Female |
| Production | 99 (100.0%) | 0 (0.0%) |
| Transportation | 17 (51.5%) | 16 (48.5%) |
| Material Moving | 32 (100.0%) | 0 (0.0%) |
| Total (Category) | 148 (90.2%) | 16 (9.8%) |
| Total (Overall) | 867 (64.2%) | 483 (35.8%) |
Employment Industries by Sex in Morongo Valley
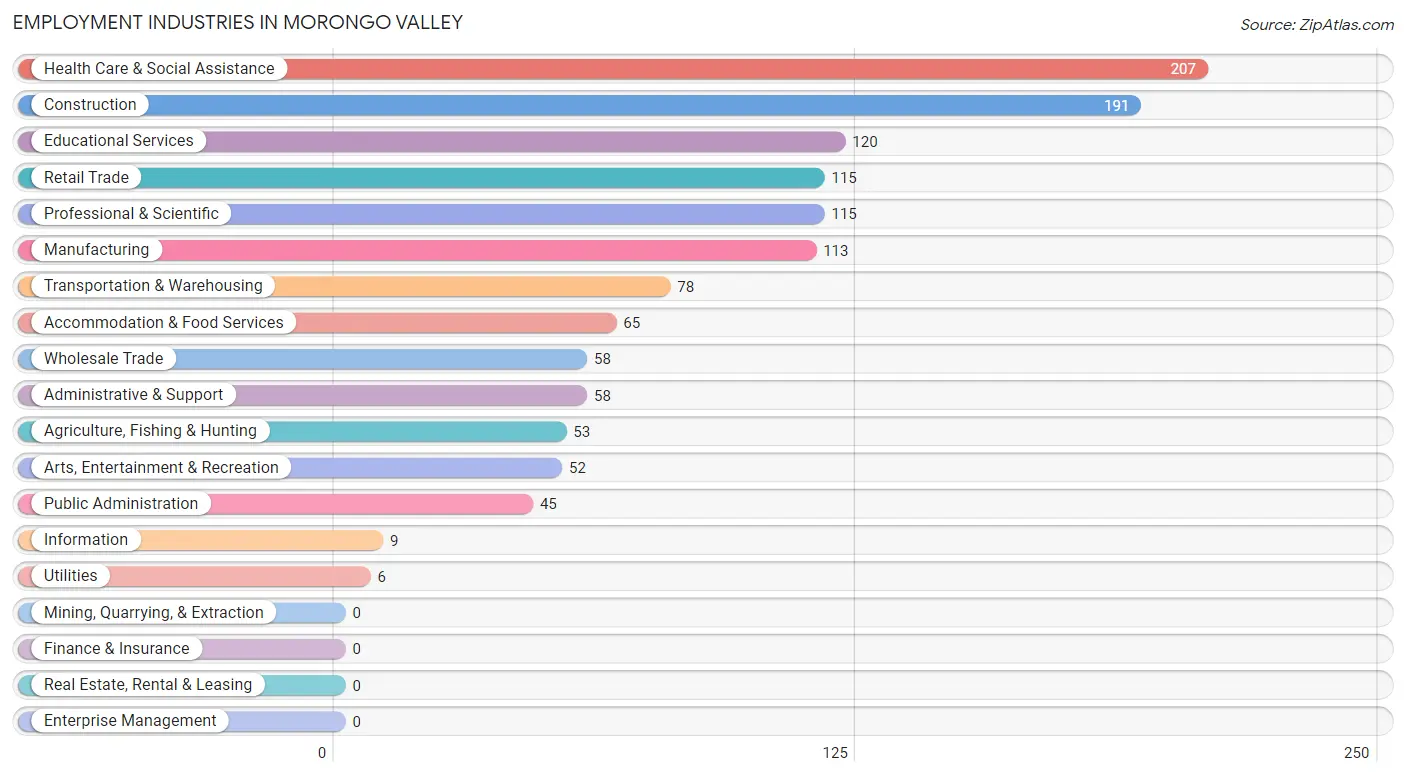
Employment Industries in Morongo Valley
The major employment industries in Morongo Valley include Health Care & Social Assistance (207 | 15.3%), Construction (191 | 14.1%), Educational Services (120 | 8.9%), Retail Trade (115 | 8.5%), and Professional & Scientific (115 | 8.5%).
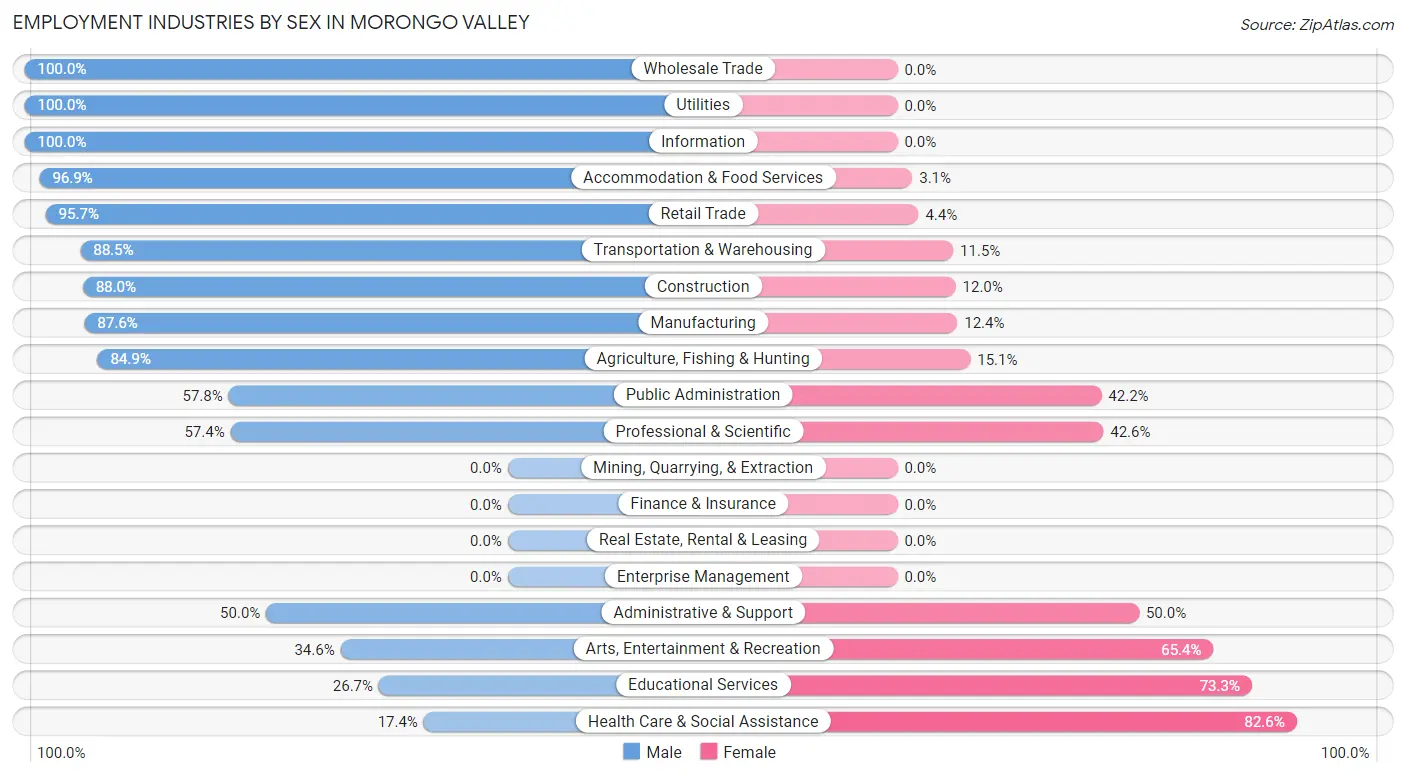
Employment Industries by Sex in Morongo Valley
The Morongo Valley industries that see more men than women are Wholesale Trade (100.0%), Utilities (100.0%), and Information (100.0%), whereas the industries that tend to have a higher number of women are Health Care & Social Assistance (82.6%), Educational Services (73.3%), and Arts, Entertainment & Recreation (65.4%).
| Industry | Male | Female |
| Agriculture, Fishing & Hunting | 45 (84.9%) | 8 (15.1%) |
| Mining, Quarrying, & Extraction | 0 (0.0%) | 0 (0.0%) |
| Construction | 168 (88.0%) | 23 (12.0%) |
| Manufacturing | 99 (87.6%) | 14 (12.4%) |
| Wholesale Trade | 58 (100.0%) | 0 (0.0%) |
| Retail Trade | 110 (95.7%) | 5 (4.3%) |
| Transportation & Warehousing | 69 (88.5%) | 9 (11.5%) |
| Utilities | 6 (100.0%) | 0 (0.0%) |
| Information | 9 (100.0%) | 0 (0.0%) |
| Finance & Insurance | 0 (0.0%) | 0 (0.0%) |
| Real Estate, Rental & Leasing | 0 (0.0%) | 0 (0.0%) |
| Professional & Scientific | 66 (57.4%) | 49 (42.6%) |
| Enterprise Management | 0 (0.0%) | 0 (0.0%) |
| Administrative & Support | 29 (50.0%) | 29 (50.0%) |
| Educational Services | 32 (26.7%) | 88 (73.3%) |
| Health Care & Social Assistance | 36 (17.4%) | 171 (82.6%) |
| Arts, Entertainment & Recreation | 18 (34.6%) | 34 (65.4%) |
| Accommodation & Food Services | 63 (96.9%) | 2 (3.1%) |
| Public Administration | 26 (57.8%) | 19 (42.2%) |
| Total | 867 (64.2%) | 483 (35.8%) |
Education in Morongo Valley
School Enrollment in Morongo Valley
The most common levels of schooling among the 824 students in Morongo Valley are college / undergraduate (255 | 30.9%), elementary school (157 | 19.1%), and middle school (128 | 15.5%).
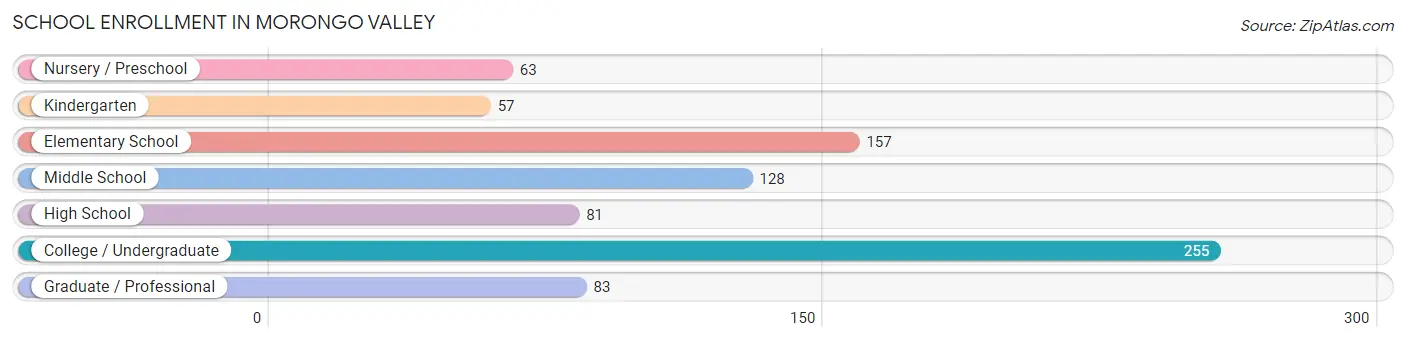
| School Level | # Students | % Students |
| Nursery / Preschool | 63 | 7.6% |
| Kindergarten | 57 | 6.9% |
| Elementary School | 157 | 19.1% |
| Middle School | 128 | 15.5% |
| High School | 81 | 9.8% |
| College / Undergraduate | 255 | 30.9% |
| Graduate / Professional | 83 | 10.1% |
| Total | 824 | 100.0% |
School Enrollment by Age by Funding Source in Morongo Valley
Out of a total of 824 students who are enrolled in schools in Morongo Valley, 248 (30.1%) attend a private institution, while the remaining 576 (69.9%) are enrolled in public schools. The age group of 3 to 4 year olds has the highest likelihood of being enrolled in private schools, with 63 (100.0% in the age bracket) enrolled. Conversely, the age group of 18 to 19 year olds has the lowest likelihood of being enrolled in a private school, with 61 (100.0% in the age bracket) attending a public institution.
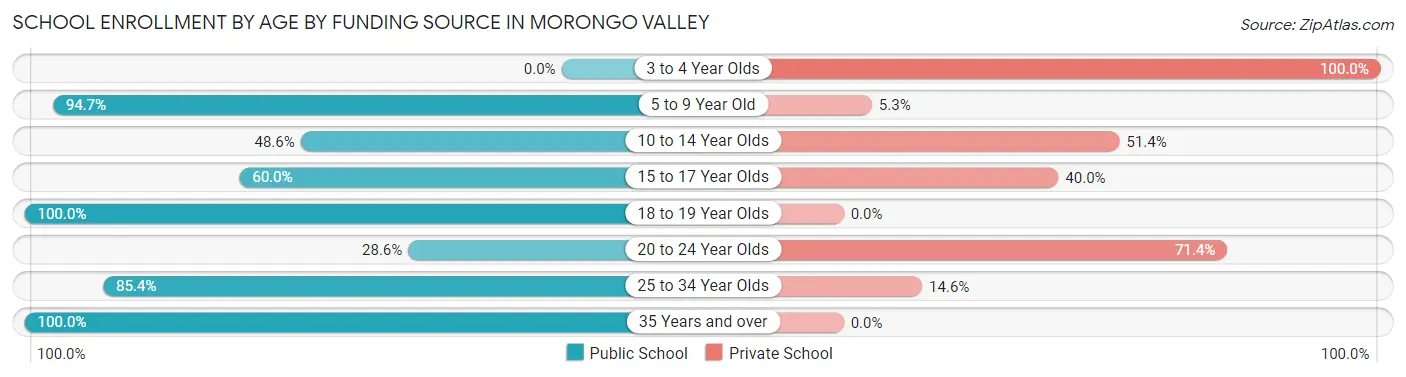
| Age Bracket | Public School | Private School |
| 3 to 4 Year Olds | 0 (0.0%) | 63 (100.0%) |
| 5 to 9 Year Old | 144 (94.7%) | 8 (5.3%) |
| 10 to 14 Year Olds | 105 (48.6%) | 111 (51.4%) |
| 15 to 17 Year Olds | 33 (60.0%) | 22 (40.0%) |
| 18 to 19 Year Olds | 61 (100.0%) | 0 (0.0%) |
| 20 to 24 Year Olds | 10 (28.6%) | 25 (71.4%) |
| 25 to 34 Year Olds | 111 (85.4%) | 19 (14.6%) |
| 35 Years and over | 112 (100.0%) | 0 (0.0%) |
| Total | 576 (69.9%) | 248 (30.1%) |
Educational Attainment by Field of Study in Morongo Valley
Social sciences (77 | 17.0%), arts & humanities (72 | 15.9%), science & technology (66 | 14.6%), education (48 | 10.6%), and literature & languages (39 | 8.6%) are the most common fields of study among 452 individuals in Morongo Valley who have obtained a bachelor's degree or higher.
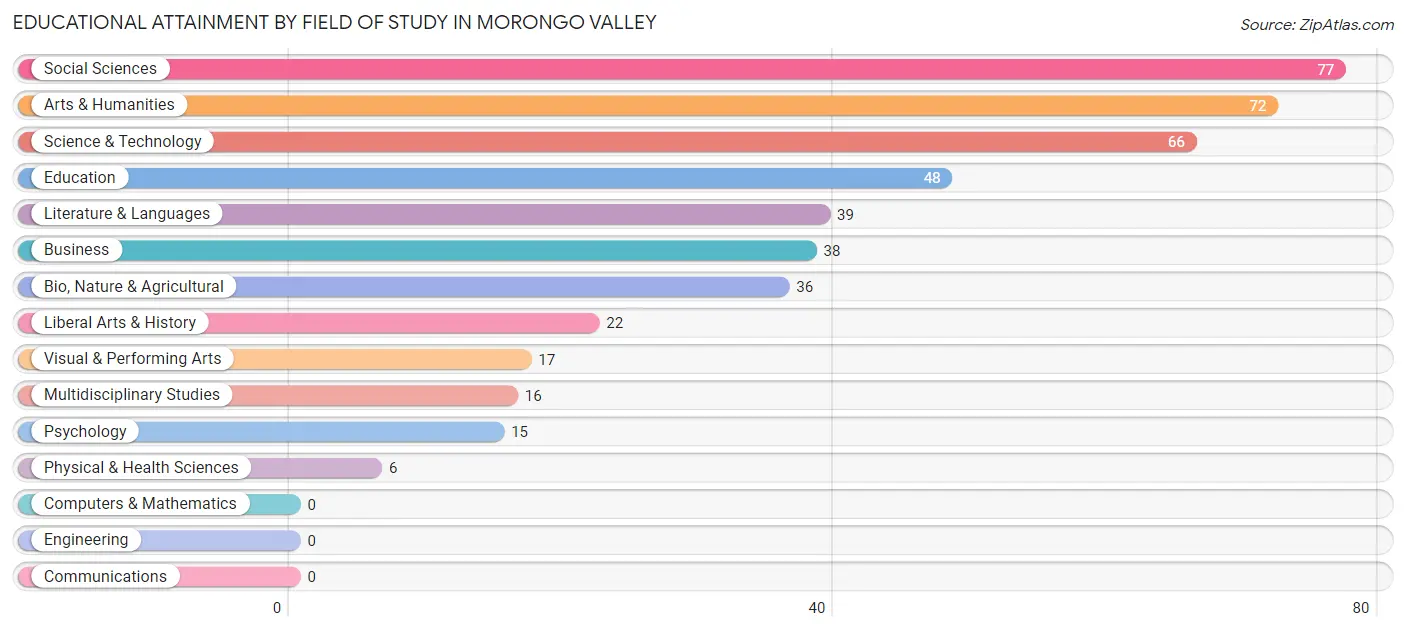
| Field of Study | # Graduates | % Graduates |
| Computers & Mathematics | 0 | 0.0% |
| Bio, Nature & Agricultural | 36 | 8.0% |
| Physical & Health Sciences | 6 | 1.3% |
| Psychology | 15 | 3.3% |
| Social Sciences | 77 | 17.0% |
| Engineering | 0 | 0.0% |
| Multidisciplinary Studies | 16 | 3.5% |
| Science & Technology | 66 | 14.6% |
| Business | 38 | 8.4% |
| Education | 48 | 10.6% |
| Literature & Languages | 39 | 8.6% |
| Liberal Arts & History | 22 | 4.9% |
| Visual & Performing Arts | 17 | 3.8% |
| Communications | 0 | 0.0% |
| Arts & Humanities | 72 | 15.9% |
| Total | 452 | 100.0% |
Transportation & Commute in Morongo Valley
Vehicle Availability by Sex in Morongo Valley
The most prevalent vehicle ownership categories in Morongo Valley are males with 2 vehicles (314, accounting for 37.0%) and females with 2 vehicles (187, making up 69.5%).
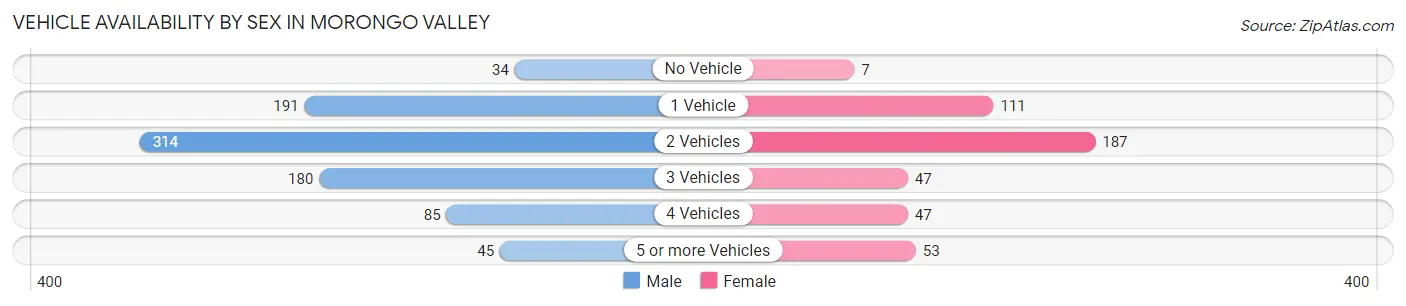
| Vehicles Available | Male | Female |
| No Vehicle | 34 (4.0%) | 7 (1.5%) |
| 1 Vehicle | 191 (22.5%) | 111 (24.6%) |
| 2 Vehicles | 314 (37.0%) | 187 (41.4%) |
| 3 Vehicles | 180 (21.2%) | 47 (10.4%) |
| 4 Vehicles | 85 (10.0%) | 47 (10.4%) |
| 5 or more Vehicles | 45 (5.3%) | 53 (11.7%) |
| Total | 849 (100.0%) | 452 (100.0%) |
Commute Time in Morongo Valley
The most frequently occuring commute durations in Morongo Valley are 60 to 89 minutes (261 commuters, 23.1%), 15 to 19 minutes (200 commuters, 17.7%), and 45 to 59 minutes (126 commuters, 11.2%).
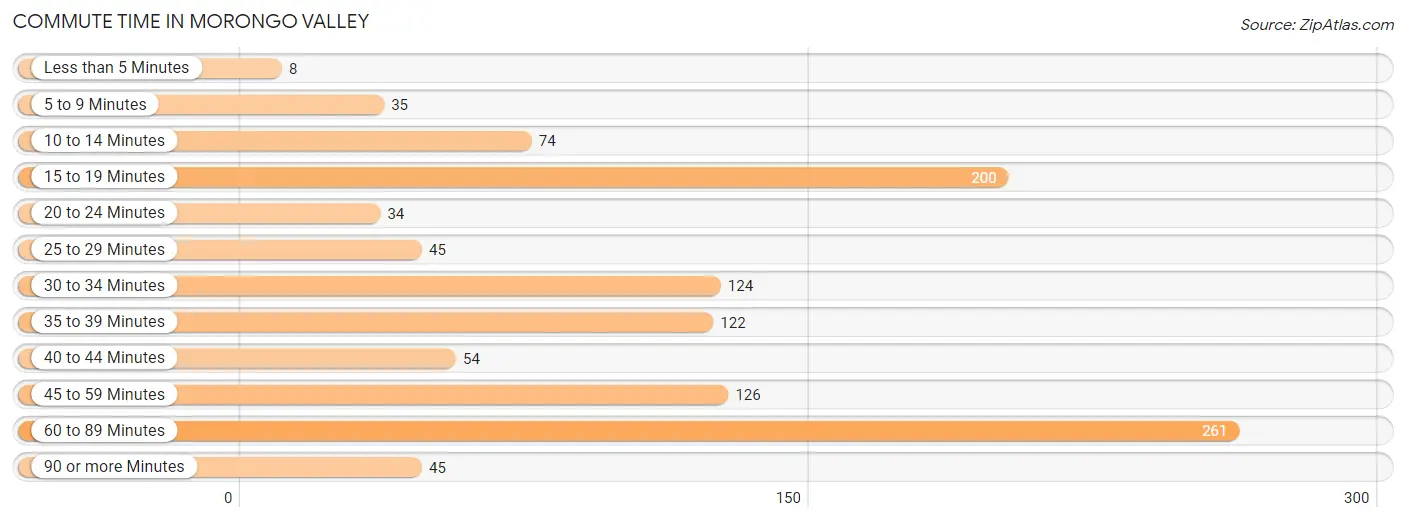
| Commute Time | # Commuters | % Commuters |
| Less than 5 Minutes | 8 | 0.7% |
| 5 to 9 Minutes | 35 | 3.1% |
| 10 to 14 Minutes | 74 | 6.6% |
| 15 to 19 Minutes | 200 | 17.7% |
| 20 to 24 Minutes | 34 | 3.0% |
| 25 to 29 Minutes | 45 | 4.0% |
| 30 to 34 Minutes | 124 | 11.0% |
| 35 to 39 Minutes | 122 | 10.8% |
| 40 to 44 Minutes | 54 | 4.8% |
| 45 to 59 Minutes | 126 | 11.2% |
| 60 to 89 Minutes | 261 | 23.1% |
| 90 or more Minutes | 45 | 4.0% |
Commute Time by Sex in Morongo Valley
The most common commute times in Morongo Valley are 60 to 89 minutes (229 commuters, 29.7%) for males and 45 to 59 minutes (88 commuters, 24.6%) for females.
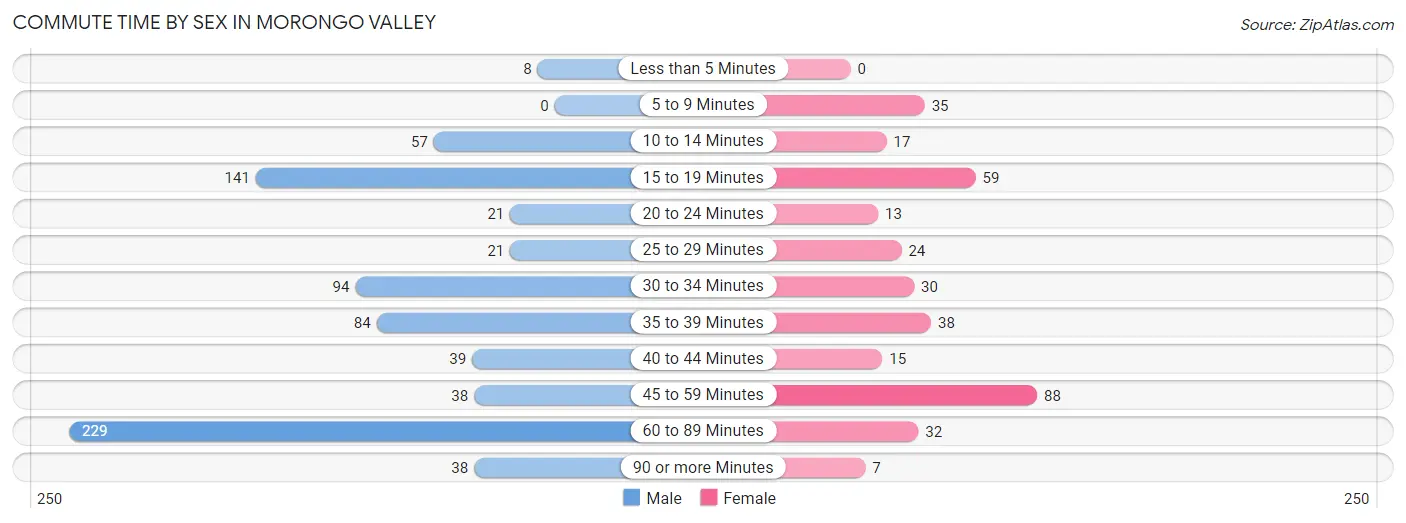
| Commute Time | Male | Female |
| Less than 5 Minutes | 8 (1.0%) | 0 (0.0%) |
| 5 to 9 Minutes | 0 (0.0%) | 35 (9.8%) |
| 10 to 14 Minutes | 57 (7.4%) | 17 (4.8%) |
| 15 to 19 Minutes | 141 (18.3%) | 59 (16.5%) |
| 20 to 24 Minutes | 21 (2.7%) | 13 (3.6%) |
| 25 to 29 Minutes | 21 (2.7%) | 24 (6.7%) |
| 30 to 34 Minutes | 94 (12.2%) | 30 (8.4%) |
| 35 to 39 Minutes | 84 (10.9%) | 38 (10.6%) |
| 40 to 44 Minutes | 39 (5.1%) | 15 (4.2%) |
| 45 to 59 Minutes | 38 (4.9%) | 88 (24.6%) |
| 60 to 89 Minutes | 229 (29.7%) | 32 (8.9%) |
| 90 or more Minutes | 38 (4.9%) | 7 (2.0%) |
Time of Departure to Work by Sex in Morongo Valley
The most frequent times of departure to work in Morongo Valley are 7:00 AM to 7:29 AM (197, 25.6%) for males and 7:00 AM to 7:29 AM (85, 23.7%) for females.
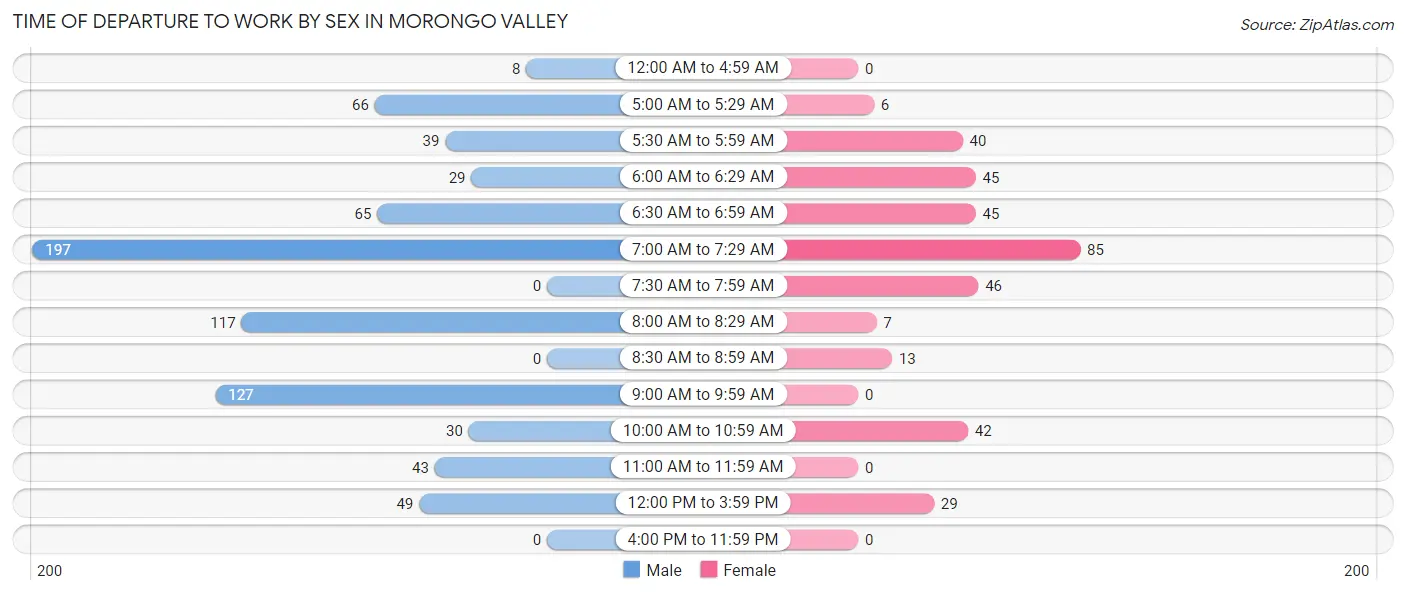
| Time of Departure | Male | Female |
| 12:00 AM to 4:59 AM | 8 (1.0%) | 0 (0.0%) |
| 5:00 AM to 5:29 AM | 66 (8.6%) | 6 (1.7%) |
| 5:30 AM to 5:59 AM | 39 (5.1%) | 40 (11.2%) |
| 6:00 AM to 6:29 AM | 29 (3.8%) | 45 (12.6%) |
| 6:30 AM to 6:59 AM | 65 (8.4%) | 45 (12.6%) |
| 7:00 AM to 7:29 AM | 197 (25.6%) | 85 (23.7%) |
| 7:30 AM to 7:59 AM | 0 (0.0%) | 46 (12.9%) |
| 8:00 AM to 8:29 AM | 117 (15.2%) | 7 (2.0%) |
| 8:30 AM to 8:59 AM | 0 (0.0%) | 13 (3.6%) |
| 9:00 AM to 9:59 AM | 127 (16.5%) | 0 (0.0%) |
| 10:00 AM to 10:59 AM | 30 (3.9%) | 42 (11.7%) |
| 11:00 AM to 11:59 AM | 43 (5.6%) | 0 (0.0%) |
| 12:00 PM to 3:59 PM | 49 (6.4%) | 29 (8.1%) |
| 4:00 PM to 11:59 PM | 0 (0.0%) | 0 (0.0%) |
| Total | 770 (100.0%) | 358 (100.0%) |
Housing Occupancy in Morongo Valley
Occupancy by Ownership in Morongo Valley
Of the total 1,559 dwellings in Morongo Valley, owner-occupied units account for 1,081 (69.3%), while renter-occupied units make up 478 (30.7%).
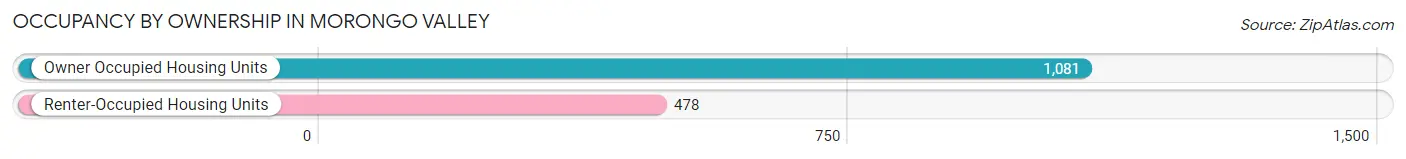
| Occupancy | # Housing Units | % Housing Units |
| Owner Occupied Housing Units | 1,081 | 69.3% |
| Renter-Occupied Housing Units | 478 | 30.7% |
| Total Occupied Housing Units | 1,559 | 100.0% |
Occupancy by Household Size in Morongo Valley
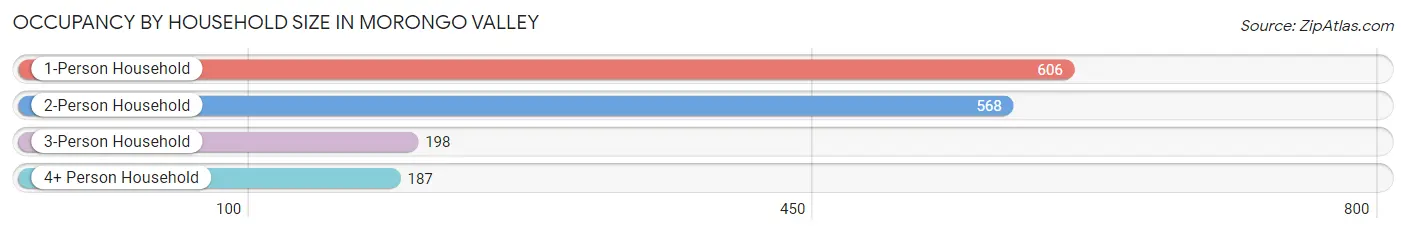
| Household Size | # Housing Units | % Housing Units |
| 1-Person Household | 606 | 38.9% |
| 2-Person Household | 568 | 36.4% |
| 3-Person Household | 198 | 12.7% |
| 4+ Person Household | 187 | 12.0% |
| Total Housing Units | 1,559 | 100.0% |
Occupancy by Ownership by Household Size in Morongo Valley
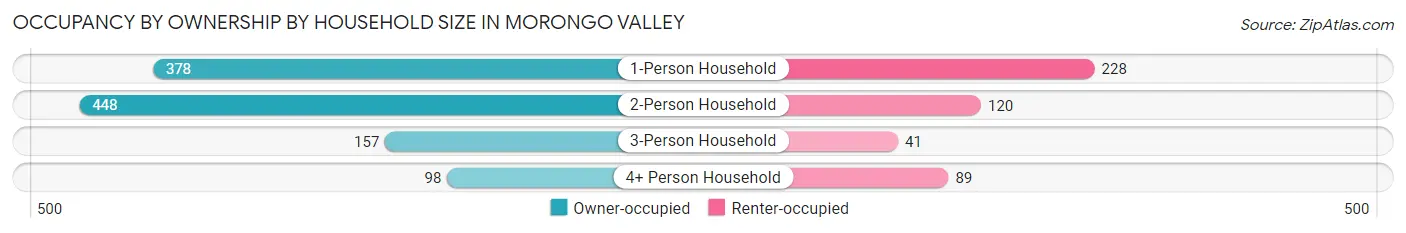
| Household Size | Owner-occupied | Renter-occupied |
| 1-Person Household | 378 (62.4%) | 228 (37.6%) |
| 2-Person Household | 448 (78.9%) | 120 (21.1%) |
| 3-Person Household | 157 (79.3%) | 41 (20.7%) |
| 4+ Person Household | 98 (52.4%) | 89 (47.6%) |
| Total Housing Units | 1,081 (69.3%) | 478 (30.7%) |
Occupancy by Educational Attainment in Morongo Valley
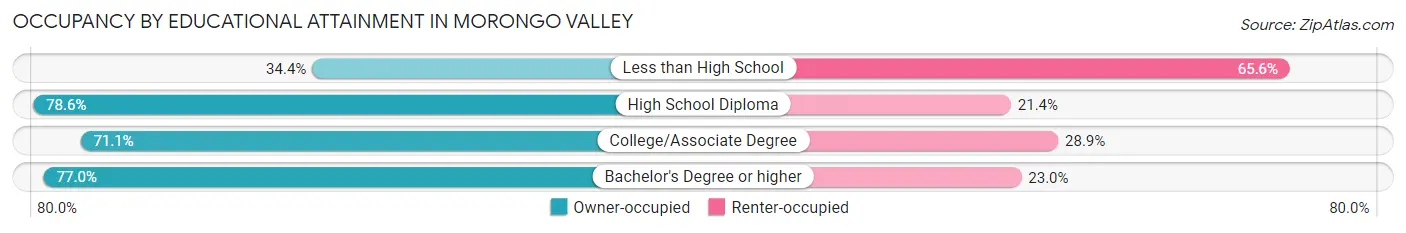
| Household Size | Owner-occupied | Renter-occupied |
| Less than High School | 65 (34.4%) | 124 (65.6%) |
| High School Diploma | 232 (78.6%) | 63 (21.4%) |
| College/Associate Degree | 530 (71.1%) | 215 (28.9%) |
| Bachelor's Degree or higher | 254 (77.0%) | 76 (23.0%) |
Occupancy by Age of Householder in Morongo Valley
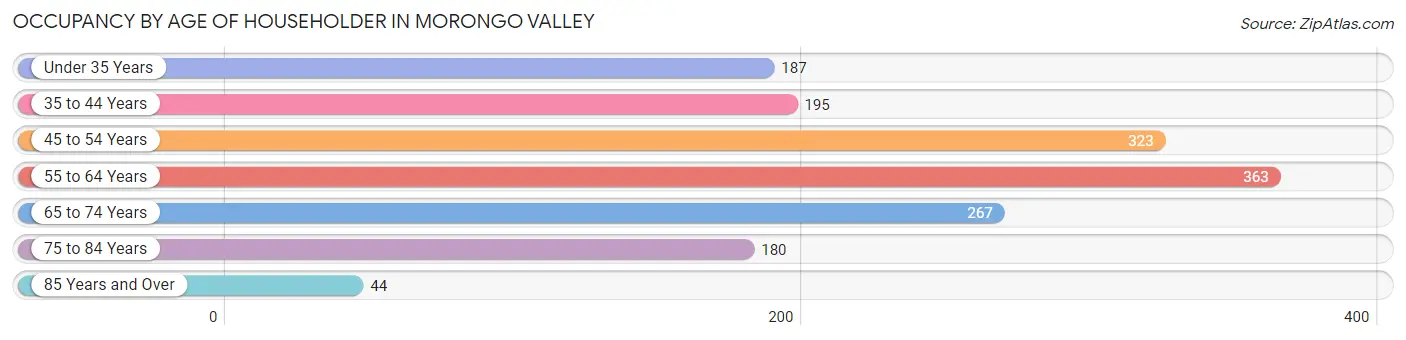
| Age Bracket | # Households | % Households |
| Under 35 Years | 187 | 12.0% |
| 35 to 44 Years | 195 | 12.5% |
| 45 to 54 Years | 323 | 20.7% |
| 55 to 64 Years | 363 | 23.3% |
| 65 to 74 Years | 267 | 17.1% |
| 75 to 84 Years | 180 | 11.6% |
| 85 Years and Over | 44 | 2.8% |
| Total | 1,559 | 100.0% |
Housing Finances in Morongo Valley
Median Income by Occupancy in Morongo Valley
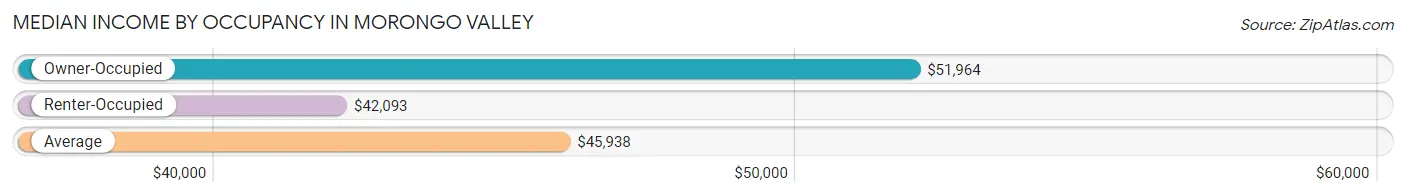
| Occupancy Type | # Households | Median Income |
| Owner-Occupied | 1,081 (69.3%) | $51,964 |
| Renter-Occupied | 478 (30.7%) | $42,093 |
| Average | 1,559 (100.0%) | $45,938 |
Occupancy by Householder Income Bracket in Morongo Valley
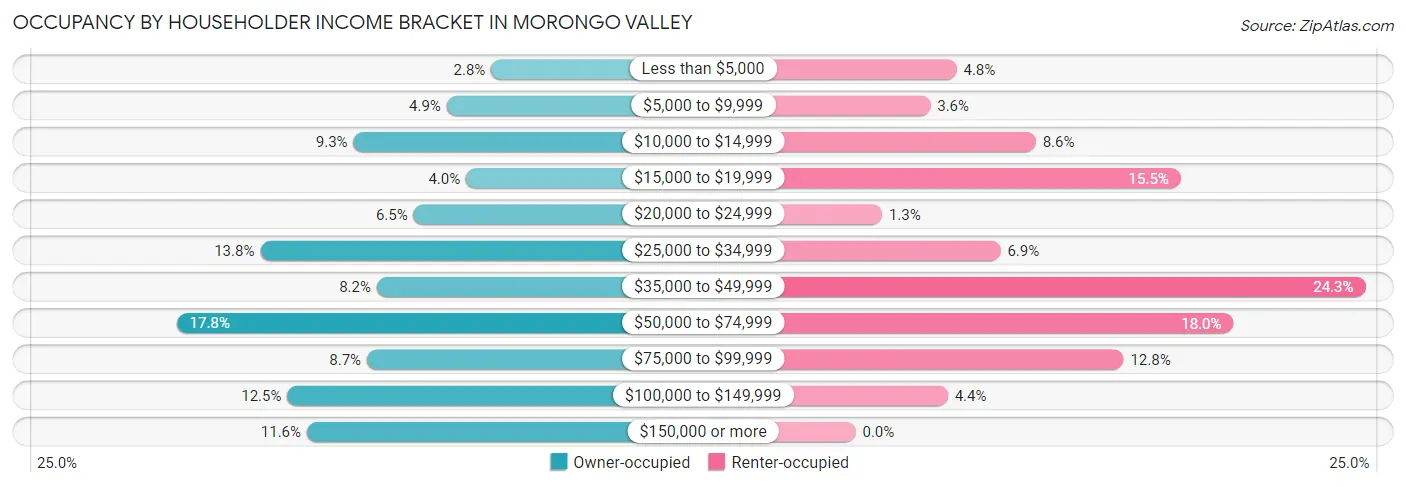
| Income Bracket | Owner-occupied | Renter-occupied |
| Less than $5,000 | 30 (2.8%) | 23 (4.8%) |
| $5,000 to $9,999 | 53 (4.9%) | 17 (3.6%) |
| $10,000 to $14,999 | 101 (9.3%) | 41 (8.6%) |
| $15,000 to $19,999 | 43 (4.0%) | 74 (15.5%) |
| $20,000 to $24,999 | 70 (6.5%) | 6 (1.3%) |
| $25,000 to $34,999 | 149 (13.8%) | 33 (6.9%) |
| $35,000 to $49,999 | 89 (8.2%) | 116 (24.3%) |
| $50,000 to $74,999 | 192 (17.8%) | 86 (18.0%) |
| $75,000 to $99,999 | 94 (8.7%) | 61 (12.8%) |
| $100,000 to $149,999 | 135 (12.5%) | 21 (4.4%) |
| $150,000 or more | 125 (11.6%) | 0 (0.0%) |
| Total | 1,081 (100.0%) | 478 (100.0%) |
Monthly Housing Cost Tiers in Morongo Valley
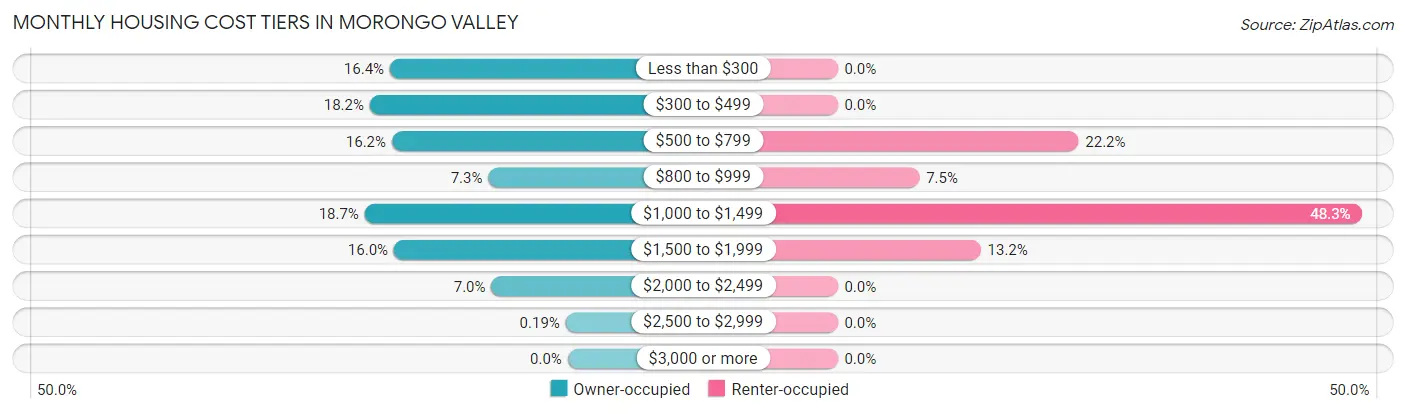
| Monthly Cost | Owner-occupied | Renter-occupied |
| Less than $300 | 177 (16.4%) | 0 (0.0%) |
| $300 to $499 | 197 (18.2%) | 0 (0.0%) |
| $500 to $799 | 175 (16.2%) | 106 (22.2%) |
| $800 to $999 | 79 (7.3%) | 36 (7.5%) |
| $1,000 to $1,499 | 202 (18.7%) | 231 (48.3%) |
| $1,500 to $1,999 | 173 (16.0%) | 63 (13.2%) |
| $2,000 to $2,499 | 76 (7.0%) | 0 (0.0%) |
| $2,500 to $2,999 | 2 (0.2%) | 0 (0.0%) |
| $3,000 or more | 0 (0.0%) | 0 (0.0%) |
| Total | 1,081 (100.0%) | 478 (100.0%) |
Physical Housing Characteristics in Morongo Valley
Housing Structures in Morongo Valley
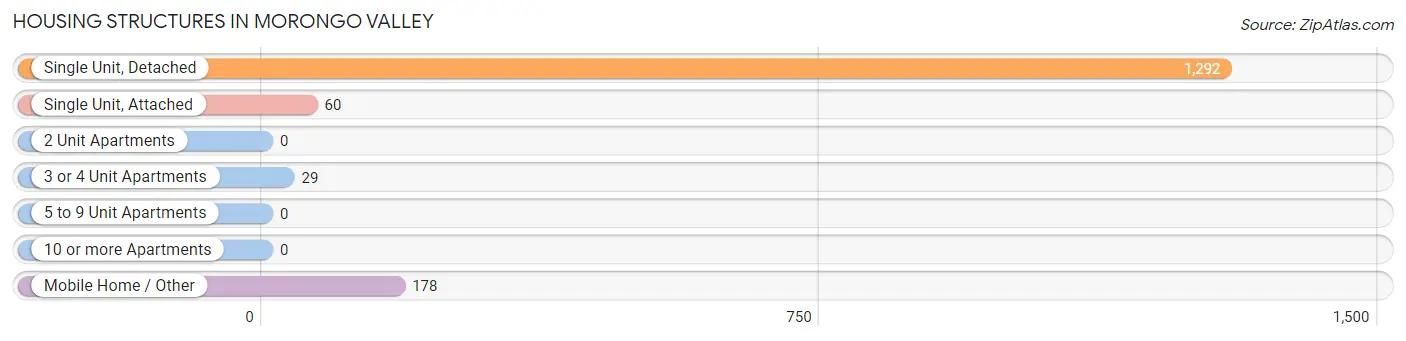
| Structure Type | # Housing Units | % Housing Units |
| Single Unit, Detached | 1,292 | 82.9% |
| Single Unit, Attached | 60 | 3.8% |
| 2 Unit Apartments | 0 | 0.0% |
| 3 or 4 Unit Apartments | 29 | 1.9% |
| 5 to 9 Unit Apartments | 0 | 0.0% |
| 10 or more Apartments | 0 | 0.0% |
| Mobile Home / Other | 178 | 11.4% |
| Total | 1,559 | 100.0% |
Housing Structures by Occupancy in Morongo Valley
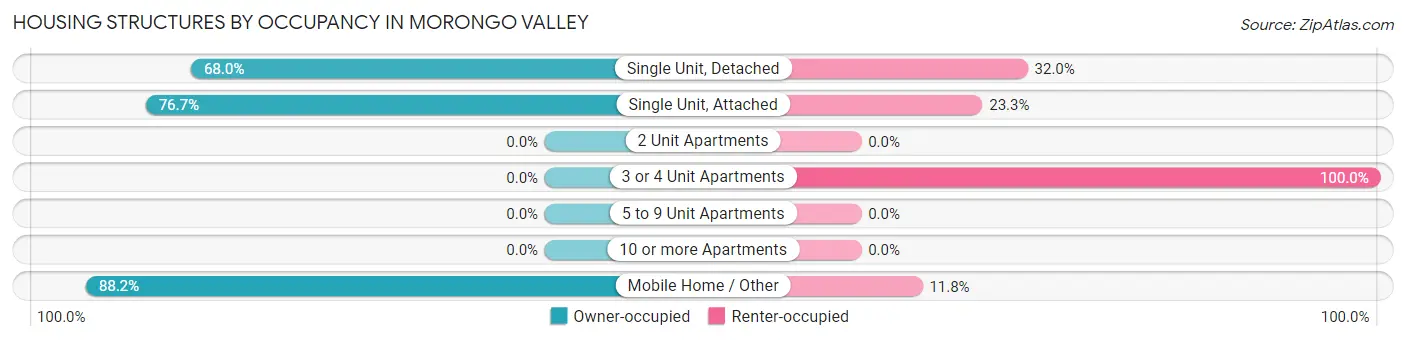
| Structure Type | Owner-occupied | Renter-occupied |
| Single Unit, Detached | 878 (68.0%) | 414 (32.0%) |
| Single Unit, Attached | 46 (76.7%) | 14 (23.3%) |
| 2 Unit Apartments | 0 (0.0%) | 0 (0.0%) |
| 3 or 4 Unit Apartments | 0 (0.0%) | 29 (100.0%) |
| 5 to 9 Unit Apartments | 0 (0.0%) | 0 (0.0%) |
| 10 or more Apartments | 0 (0.0%) | 0 (0.0%) |
| Mobile Home / Other | 157 (88.2%) | 21 (11.8%) |
| Total | 1,081 (69.3%) | 478 (30.7%) |
Housing Structures by Number of Rooms in Morongo Valley
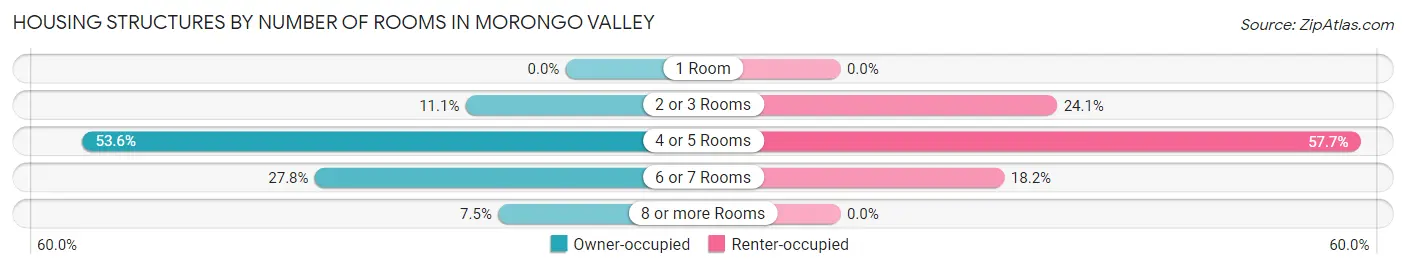
| Number of Rooms | Owner-occupied | Renter-occupied |
| 1 Room | 0 (0.0%) | 0 (0.0%) |
| 2 or 3 Rooms | 120 (11.1%) | 115 (24.1%) |
| 4 or 5 Rooms | 579 (53.6%) | 276 (57.7%) |
| 6 or 7 Rooms | 301 (27.8%) | 87 (18.2%) |
| 8 or more Rooms | 81 (7.5%) | 0 (0.0%) |
| Total | 1,081 (100.0%) | 478 (100.0%) |
Housing Structure by Heating Type in Morongo Valley
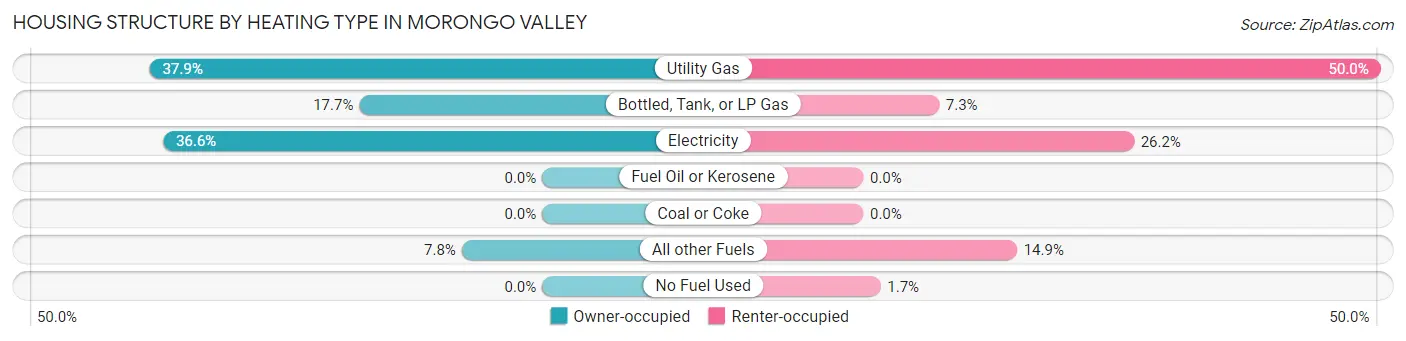
| Heating Type | Owner-occupied | Renter-occupied |
| Utility Gas | 410 (37.9%) | 239 (50.0%) |
| Bottled, Tank, or LP Gas | 191 (17.7%) | 35 (7.3%) |
| Electricity | 396 (36.6%) | 125 (26.2%) |
| Fuel Oil or Kerosene | 0 (0.0%) | 0 (0.0%) |
| Coal or Coke | 0 (0.0%) | 0 (0.0%) |
| All other Fuels | 84 (7.8%) | 71 (14.8%) |
| No Fuel Used | 0 (0.0%) | 8 (1.7%) |
| Total | 1,081 (100.0%) | 478 (100.0%) |
Household Vehicle Usage in Morongo Valley
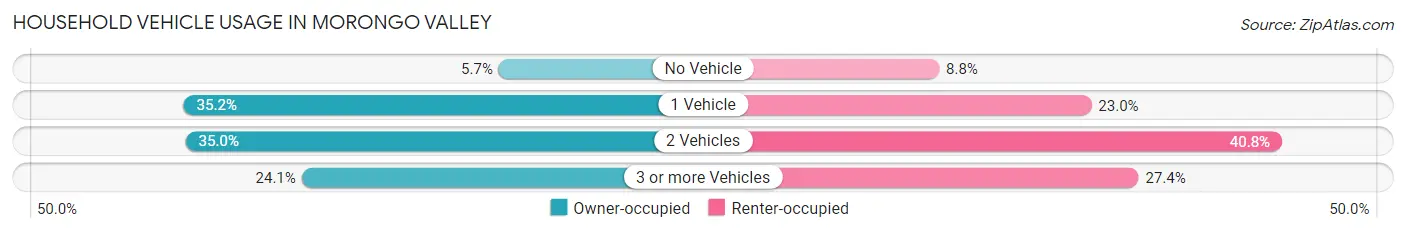
| Vehicles per Household | Owner-occupied | Renter-occupied |
| No Vehicle | 62 (5.7%) | 42 (8.8%) |
| 1 Vehicle | 380 (35.1%) | 110 (23.0%) |
| 2 Vehicles | 378 (35.0%) | 195 (40.8%) |
| 3 or more Vehicles | 261 (24.1%) | 131 (27.4%) |
| Total | 1,081 (100.0%) | 478 (100.0%) |
Real Estate & Mortgages in Morongo Valley
Real Estate and Mortgage Overview in Morongo Valley
| Characteristic | Without Mortgage | With Mortgage |
| Housing Units | 533 | 548 |
| Median Property Value | $205,400 | $292,200 |
| Median Household Income | $31,553 | $97 |
| Monthly Housing Costs | $384 | $0 |
| Real Estate Taxes | $1,225 | $17 |
Property Value by Mortgage Status in Morongo Valley
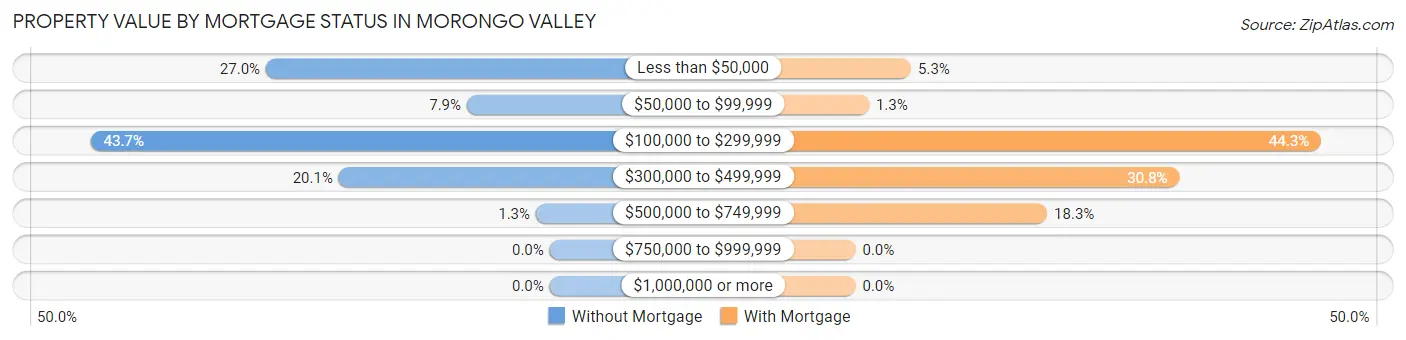
| Property Value | Without Mortgage | With Mortgage |
| Less than $50,000 | 144 (27.0%) | 29 (5.3%) |
| $50,000 to $99,999 | 42 (7.9%) | 7 (1.3%) |
| $100,000 to $299,999 | 233 (43.7%) | 243 (44.3%) |
| $300,000 to $499,999 | 107 (20.1%) | 169 (30.8%) |
| $500,000 to $749,999 | 7 (1.3%) | 100 (18.2%) |
| $750,000 to $999,999 | 0 (0.0%) | 0 (0.0%) |
| $1,000,000 or more | 0 (0.0%) | 0 (0.0%) |
| Total | 533 (100.0%) | 548 (100.0%) |
Household Income by Mortgage Status in Morongo Valley
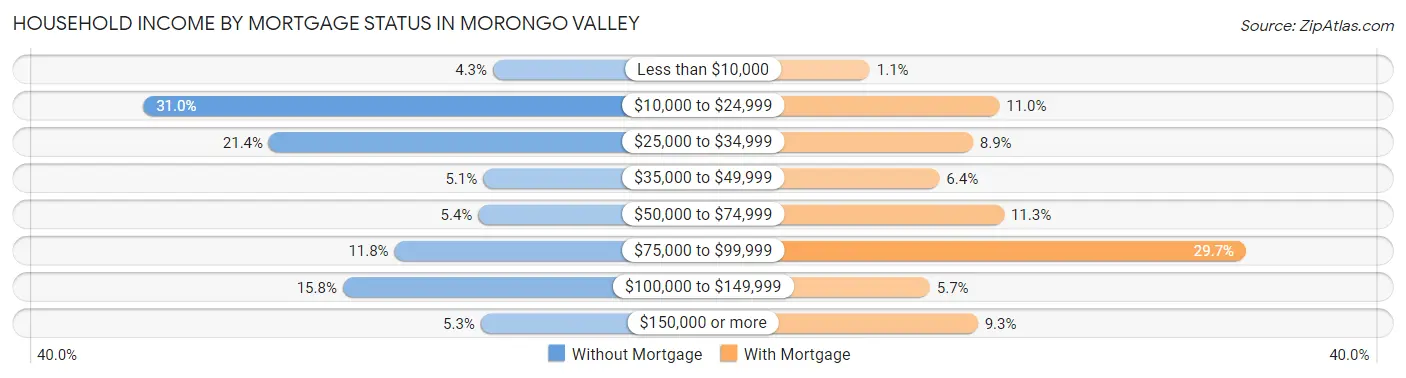
| Household Income | Without Mortgage | With Mortgage |
| Less than $10,000 | 23 (4.3%) | 6 (1.1%) |
| $10,000 to $24,999 | 165 (31.0%) | 60 (11.0%) |
| $25,000 to $34,999 | 114 (21.4%) | 49 (8.9%) |
| $35,000 to $49,999 | 27 (5.1%) | 35 (6.4%) |
| $50,000 to $74,999 | 29 (5.4%) | 62 (11.3%) |
| $75,000 to $99,999 | 63 (11.8%) | 163 (29.7%) |
| $100,000 to $149,999 | 84 (15.8%) | 31 (5.7%) |
| $150,000 or more | 28 (5.2%) | 51 (9.3%) |
| Total | 533 (100.0%) | 548 (100.0%) |
Property Value to Household Income Ratio in Morongo Valley
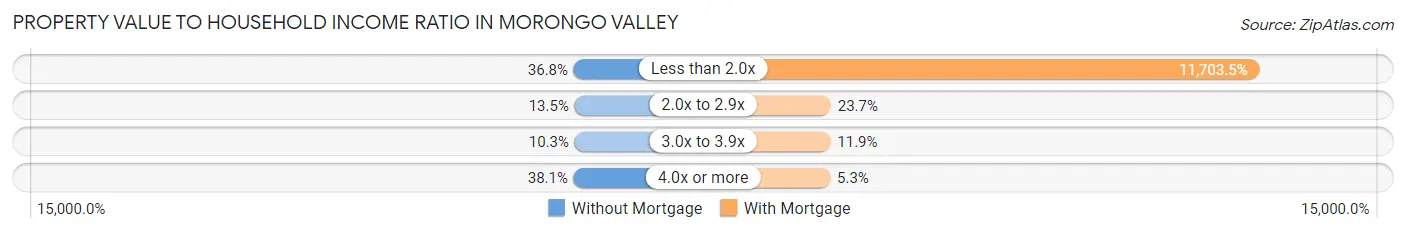
| Value-to-Income Ratio | Without Mortgage | With Mortgage |
| Less than 2.0x | 196 (36.8%) | 64,135 (11,703.5%) |
| 2.0x to 2.9x | 72 (13.5%) | 130 (23.7%) |
| 3.0x to 3.9x | 55 (10.3%) | 65 (11.9%) |
| 4.0x or more | 203 (38.1%) | 29 (5.3%) |
| Total | 533 (100.0%) | 548 (100.0%) |
Real Estate Taxes by Mortgage Status in Morongo Valley
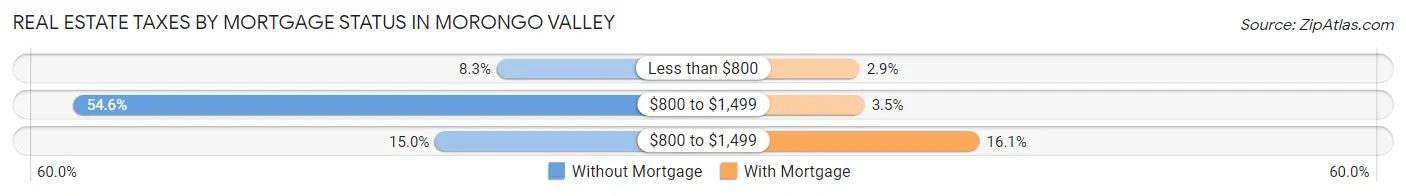
| Property Taxes | Without Mortgage | With Mortgage |
| Less than $800 | 44 (8.3%) | 16 (2.9%) |
| $800 to $1,499 | 291 (54.6%) | 19 (3.5%) |
| $800 to $1,499 | 80 (15.0%) | 88 (16.1%) |
| Total | 533 (100.0%) | 548 (100.0%) |
Health & Disability in Morongo Valley
Health Insurance Coverage by Age in Morongo Valley
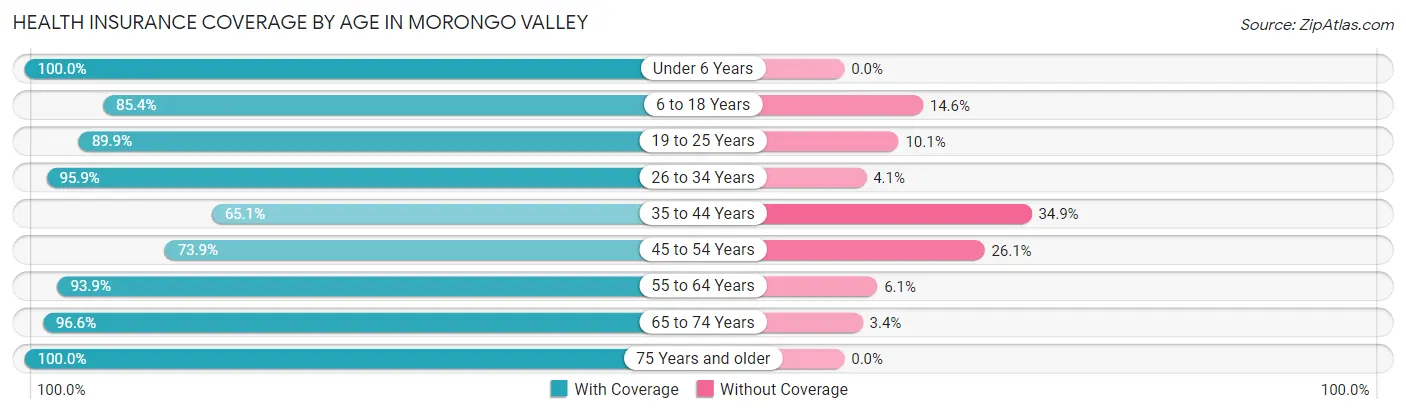
| Age Bracket | With Coverage | Without Coverage |
| Under 6 Years | 194 (100.0%) | 0 (0.0%) |
| 6 to 18 Years | 443 (85.4%) | 76 (14.6%) |
| 19 to 25 Years | 89 (89.9%) | 10 (10.1%) |
| 26 to 34 Years | 353 (95.9%) | 15 (4.1%) |
| 35 to 44 Years | 304 (65.1%) | 163 (34.9%) |
| 45 to 54 Years | 373 (73.9%) | 132 (26.1%) |
| 55 to 64 Years | 550 (93.9%) | 36 (6.1%) |
| 65 to 74 Years | 340 (96.6%) | 12 (3.4%) |
| 75 Years and older | 297 (100.0%) | 0 (0.0%) |
| Total | 2,943 (86.9%) | 444 (13.1%) |
Health Insurance Coverage by Citizenship Status in Morongo Valley
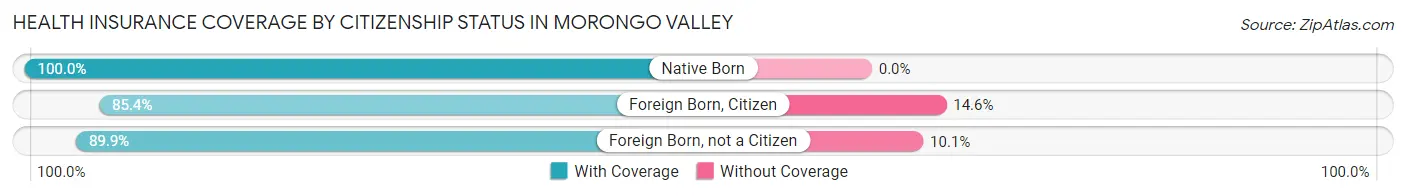
| Citizenship Status | With Coverage | Without Coverage |
| Native Born | 194 (100.0%) | 0 (0.0%) |
| Foreign Born, Citizen | 443 (85.4%) | 76 (14.6%) |
| Foreign Born, not a Citizen | 89 (89.9%) | 10 (10.1%) |
Health Insurance Coverage by Household Income in Morongo Valley
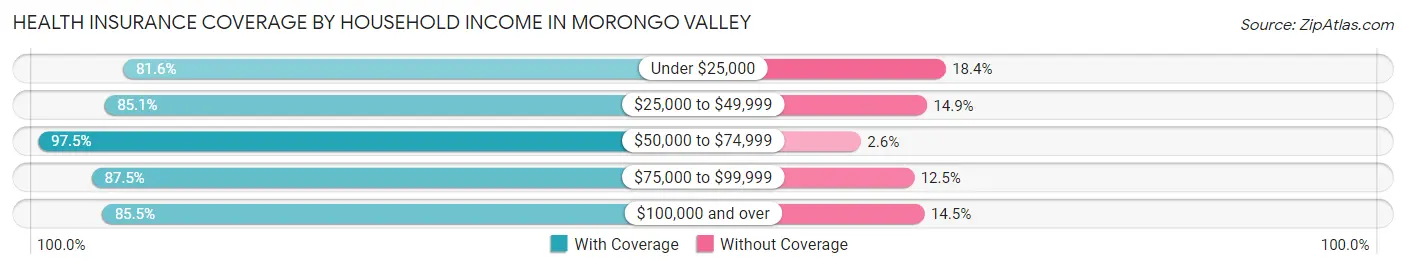
| Household Income | With Coverage | Without Coverage |
| Under $25,000 | 761 (81.6%) | 172 (18.4%) |
| $25,000 to $49,999 | 650 (85.1%) | 114 (14.9%) |
| $50,000 to $74,999 | 649 (97.5%) | 17 (2.5%) |
| $75,000 to $99,999 | 321 (87.5%) | 46 (12.5%) |
| $100,000 and over | 562 (85.5%) | 95 (14.5%) |
Public vs Private Health Insurance Coverage by Age in Morongo Valley
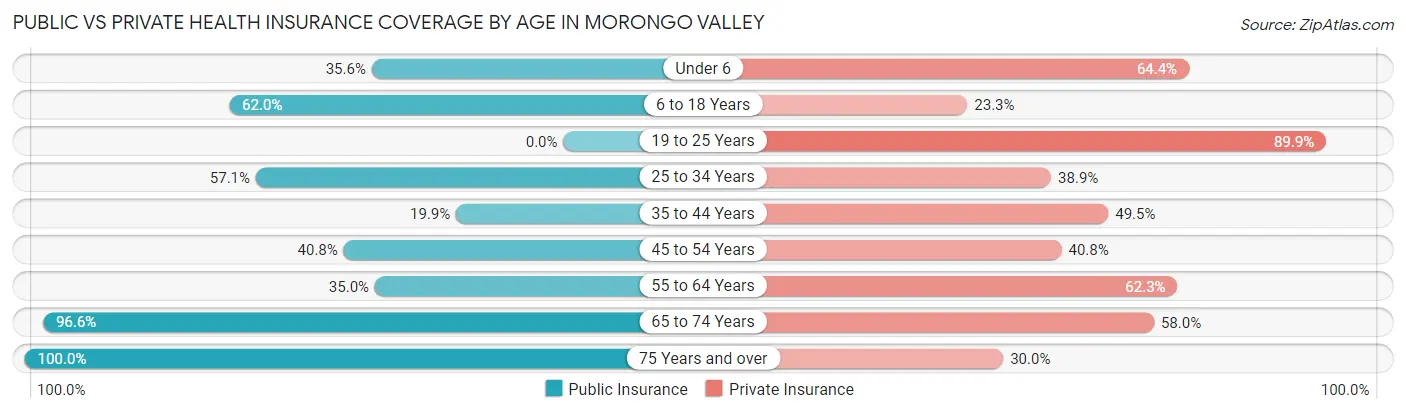
| Age Bracket | Public Insurance | Private Insurance |
| Under 6 | 69 (35.6%) | 125 (64.4%) |
| 6 to 18 Years | 322 (62.0%) | 121 (23.3%) |
| 19 to 25 Years | 0 (0.0%) | 89 (89.9%) |
| 25 to 34 Years | 210 (57.1%) | 143 (38.9%) |
| 35 to 44 Years | 93 (19.9%) | 231 (49.5%) |
| 45 to 54 Years | 206 (40.8%) | 206 (40.8%) |
| 55 to 64 Years | 205 (35.0%) | 365 (62.3%) |
| 65 to 74 Years | 340 (96.6%) | 204 (58.0%) |
| 75 Years and over | 297 (100.0%) | 89 (30.0%) |
| Total | 1,742 (51.4%) | 1,573 (46.4%) |
Disability Status by Sex by Age in Morongo Valley
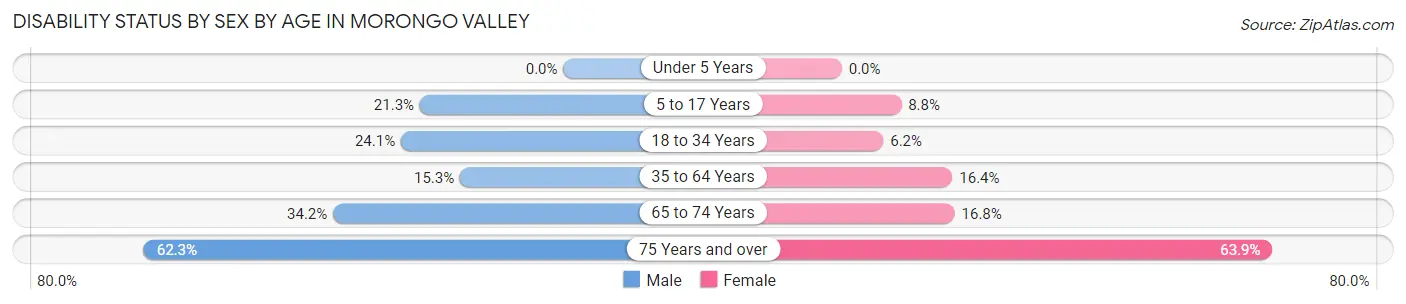
| Age Bracket | Male | Female |
| Under 5 Years | 0 (0.0%) | 0 (0.0%) |
| 5 to 17 Years | 46 (21.3%) | 21 (8.8%) |
| 18 to 34 Years | 81 (24.1%) | 13 (6.2%) |
| 35 to 64 Years | 125 (15.3%) | 122 (16.4%) |
| 65 to 74 Years | 53 (34.2%) | 33 (16.8%) |
| 75 Years and over | 109 (62.3%) | 78 (63.9%) |
Disability Class by Sex by Age in Morongo Valley
Disability Class: Hearing Difficulty
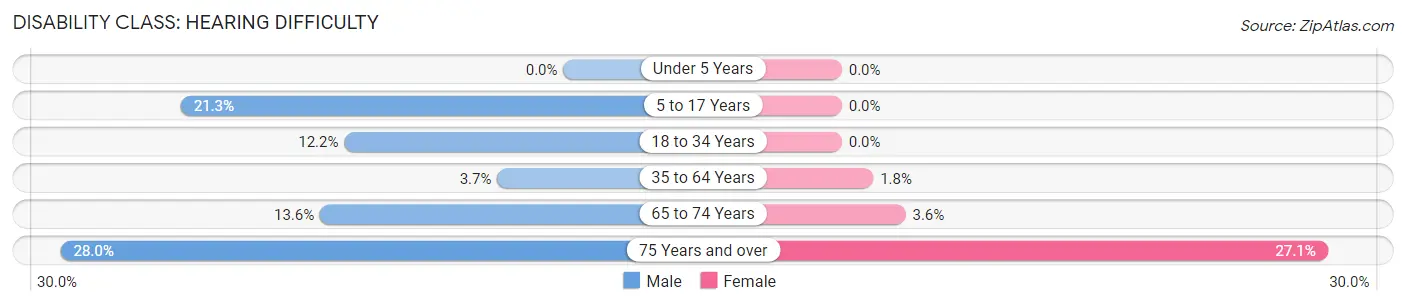
| Age Bracket | Male | Female |
| Under 5 Years | 0 (0.0%) | 0 (0.0%) |
| 5 to 17 Years | 46 (21.3%) | 0 (0.0%) |
| 18 to 34 Years | 41 (12.2%) | 0 (0.0%) |
| 35 to 64 Years | 30 (3.7%) | 13 (1.8%) |
| 65 to 74 Years | 21 (13.6%) | 7 (3.5%) |
| 75 Years and over | 49 (28.0%) | 33 (27.1%) |
Disability Class: Vision Difficulty
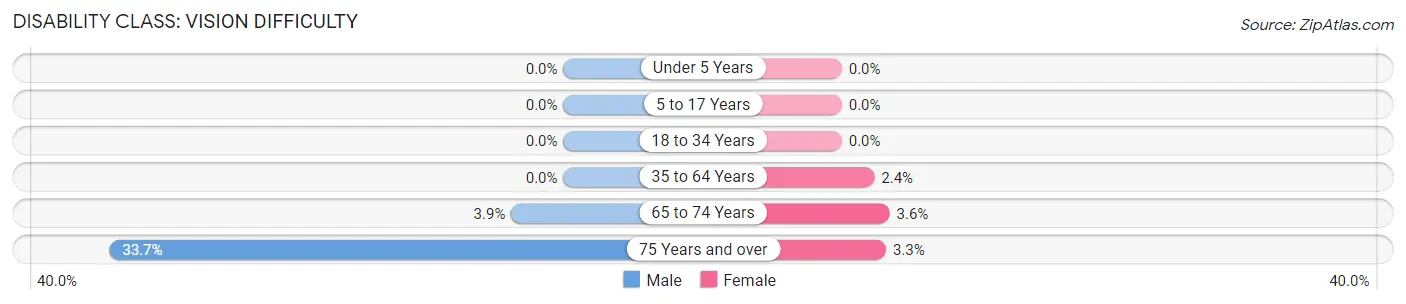
| Age Bracket | Male | Female |
| Under 5 Years | 0 (0.0%) | 0 (0.0%) |
| 5 to 17 Years | 0 (0.0%) | 0 (0.0%) |
| 18 to 34 Years | 0 (0.0%) | 0 (0.0%) |
| 35 to 64 Years | 0 (0.0%) | 18 (2.4%) |
| 65 to 74 Years | 6 (3.9%) | 7 (3.5%) |
| 75 Years and over | 59 (33.7%) | 4 (3.3%) |
Disability Class: Cognitive Difficulty
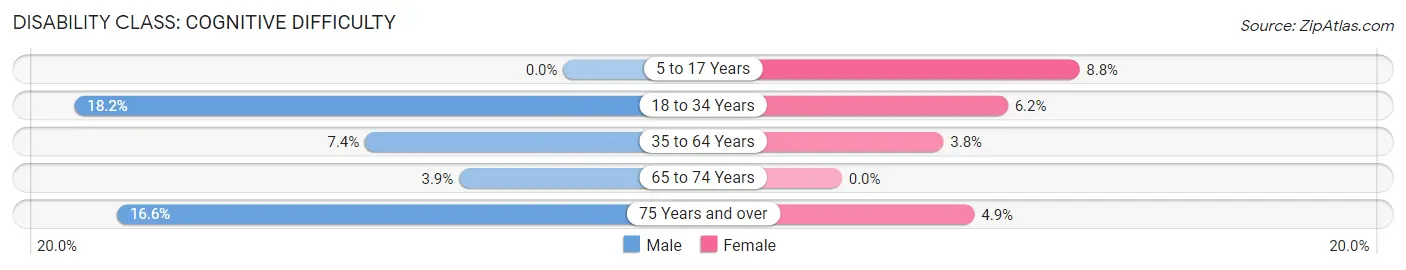
| Age Bracket | Male | Female |
| 5 to 17 Years | 0 (0.0%) | 21 (8.8%) |
| 18 to 34 Years | 61 (18.1%) | 13 (6.2%) |
| 35 to 64 Years | 60 (7.4%) | 28 (3.8%) |
| 65 to 74 Years | 6 (3.9%) | 0 (0.0%) |
| 75 Years and over | 29 (16.6%) | 6 (4.9%) |
Disability Class: Ambulatory Difficulty
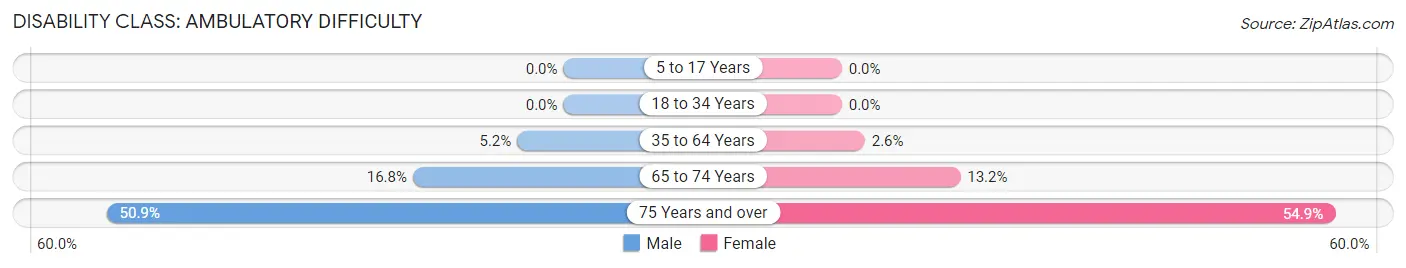
| Age Bracket | Male | Female |
| 5 to 17 Years | 0 (0.0%) | 0 (0.0%) |
| 18 to 34 Years | 0 (0.0%) | 0 (0.0%) |
| 35 to 64 Years | 42 (5.1%) | 19 (2.6%) |
| 65 to 74 Years | 26 (16.8%) | 26 (13.2%) |
| 75 Years and over | 89 (50.9%) | 67 (54.9%) |
Disability Class: Self-Care Difficulty
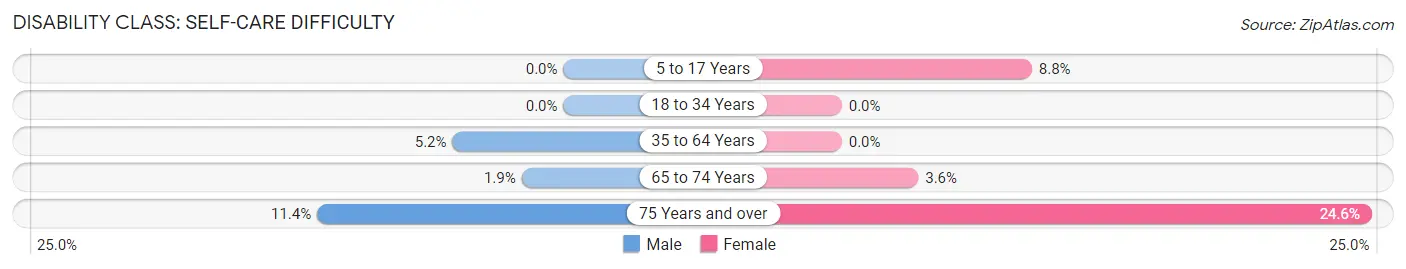
| Age Bracket | Male | Female |
| 5 to 17 Years | 0 (0.0%) | 21 (8.8%) |
| 18 to 34 Years | 0 (0.0%) | 0 (0.0%) |
| 35 to 64 Years | 42 (5.1%) | 0 (0.0%) |
| 65 to 74 Years | 3 (1.9%) | 7 (3.5%) |
| 75 Years and over | 20 (11.4%) | 30 (24.6%) |
Technology Access in Morongo Valley
Computing Device Access in Morongo Valley
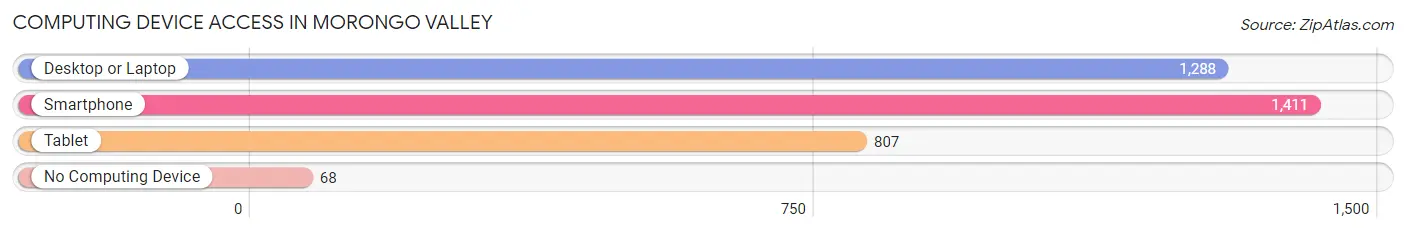
| Device Type | # Households | % Households |
| Desktop or Laptop | 1,288 | 82.6% |
| Smartphone | 1,411 | 90.5% |
| Tablet | 807 | 51.8% |
| No Computing Device | 68 | 4.4% |
| Total | 1,559 | 100.0% |
Internet Access in Morongo Valley
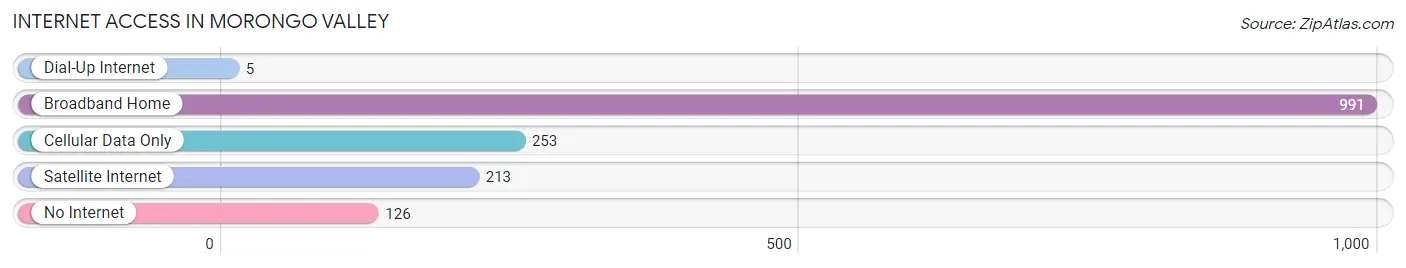
| Internet Type | # Households | % Households |
| Dial-Up Internet | 5 | 0.3% |
| Broadband Home | 991 | 63.6% |
| Cellular Data Only | 253 | 16.2% |
| Satellite Internet | 213 | 13.7% |
| No Internet | 126 | 8.1% |
| Total | 1,559 | 100.0% |
Morongo Valley Summary
History
The area now known as Morongo Valley, California was originally inhabited by the Serrano and Cahuilla Native American tribes. The Serrano were the first to settle in the area, and they named it “Muliwai”, which means “place of the sun”. The Cahuilla arrived later and named the area “Muliwai-pa”, which means “place of the sun and moon”.
The first non-Native American settlers arrived in the area in the late 1800s. These settlers were mostly ranchers and farmers who were attracted to the area by its fertile soil and abundant water sources. The area was also known for its abundant wildlife, including deer, antelope, and bighorn sheep.
In the early 1900s, the area began to attract more settlers, including miners and prospectors. The area was also home to a number of small towns, including Morongo Valley, which was founded in 1910. The town was named after the nearby Morongo Valley, which was named after the Morongo Indians who lived in the area.
In the 1950s, the area began to attract more tourists, as the nearby Joshua Tree National Park became a popular destination. The area also began to attract retirees, who were drawn to the area’s mild climate and low cost of living.
Geography
Morongo Valley is located in the Mojave Desert of Southern California, about 100 miles east of Los Angeles. The area is bordered by the San Bernardino Mountains to the north, the San Gorgonio Pass to the east, and the San Jacinto Mountains to the south.
The area is characterized by its dry climate and sparse vegetation. The average annual rainfall is only about 8 inches, and the area is mostly covered in desert scrub and Joshua trees.
The area is also home to a number of natural features, including the Morongo Valley Wildlife Area, the Morongo Valley State Park, and the Morongo Valley National Wildlife Refuge.
Economy
The economy of Morongo Valley is largely based on tourism and retirement. The area is home to a number of resorts and retirement communities, as well as a number of small businesses.
The area is also home to a number of agricultural operations, including cattle ranches, date farms, and alfalfa farms. The area is also home to a number of mining operations, including gold, silver, and copper mines.
Demographics
As of the 2010 census, the population of Morongo Valley was 2,711. The population is largely white (77.3%), with smaller percentages of Hispanic (14.2%), African American (2.2%), and Native American (1.2%) residents.
The median household income in Morongo Valley is $41,944, and the median home value is $179,400. The area has a poverty rate of 11.3%, which is slightly higher than the national average.
Conclusion
Morongo Valley, California is a small desert town located in the Mojave Desert of Southern California. The area is known for its mild climate, low cost of living, and abundance of natural beauty. The economy of the area is largely based on tourism and retirement, and the population is largely white. The area is also home to a number of agricultural operations, mining operations, and natural features.
Common Questions
What is Per Capita Income in Morongo Valley?
Per Capita income in Morongo Valley is $29,393.
What is the Median Family Income in Morongo Valley?
Median Family Income in Morongo Valley is $60,048.
What is the Median Household income in Morongo Valley?
Median Household Income in Morongo Valley is $45,938.
What is Income or Wage Gap in Morongo Valley?
Income or Wage Gap in Morongo Valley is 10.3%.
Women in Morongo Valley earn 89.7 cents for every dollar earned by a man.
What is Inequality or Gini Index in Morongo Valley?
Inequality or Gini Index in Morongo Valley is 0.47.
What is the Total Population of Morongo Valley?
Total Population of Morongo Valley is 3,387.
What is the Total Male Population of Morongo Valley?
Total Male Population of Morongo Valley is 1,830.
What is the Total Female Population of Morongo Valley?
Total Female Population of Morongo Valley is 1,557.
What is the Ratio of Males per 100 Females in Morongo Valley?
There are 117.53 Males per 100 Females in Morongo Valley.
What is the Ratio of Females per 100 Males in Morongo Valley?
There are 85.08 Females per 100 Males in Morongo Valley.
What is the Median Population Age in Morongo Valley?
Median Population Age in Morongo Valley is 45.6 Years.
What is the Average Family Size in Morongo Valley
Average Family Size in Morongo Valley is 3.0 People.
What is the Average Household Size in Morongo Valley
Average Household Size in Morongo Valley is 2.2 People.
How Large is the Labor Force in Morongo Valley?
There are 1,482 People in the Labor Forcein in Morongo Valley.
What is the Percentage of People in the Labor Force in Morongo Valley?
53.4% of People are in the Labor Force in Morongo Valley.
What is the Unemployment Rate in Morongo Valley?
Unemployment Rate in Morongo Valley is 8.8%.