Monte Rio, CA Map & Demographics
Monte Rio Map
Monte Rio Overview
$63,325
PER CAPITA INCOME
$48,906
AVG HOUSEHOLD INCOME
$5,217
FAMILY INCOME DEFICIT
0.53
INEQUALITY / GINI INDEX
771
TOTAL POPULATION
436
MALE POPULATION
335
FEMALE POPULATION
130.15
MALES / 100 FEMALES
76.83
FEMALES / 100 MALES
61.2
MEDIAN AGE
2.3
AVG FAMILY SIZE
1.8
AVG HOUSEHOLD SIZE
413
LABOR FORCE [ PEOPLE ]
56.5%
PERCENT IN LABOR FORCE
7.3%
UNEMPLOYMENT RATE
Monte Rio Zip Codes
Monte Rio Area Codes
Income in Monte Rio
Income Overview in Monte Rio
| Characteristic | Number | Measure |
| Per Capita Income | 771 | $63,325 |
| Median Family Income | 229 | $0 |
| Mean Family Income | 229 | $143,574 |
| Median Household Income | 427 | $48,906 |
| Mean Household Income | 427 | $114,095 |
| Income Deficit | 229 | $5,217 |
| Wage / Income Gap (%) | 771 | 0.00% |
| Wage / Income Gap ($) | 771 | 100.00¢ per $1 |
| Gini / Inequality Index | 771 | 0.53 |
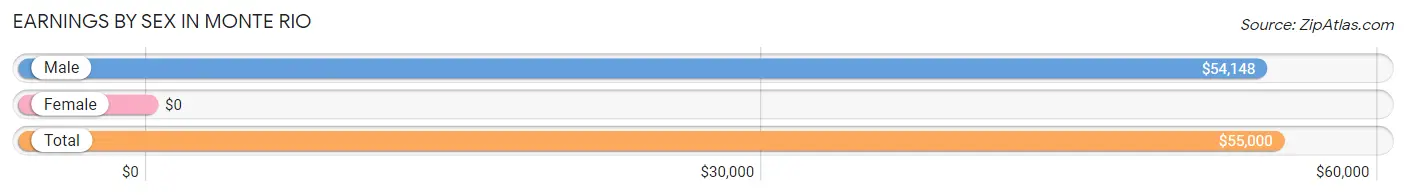
Earnings by Sex in Monte Rio
| Sex | Number | Average Earnings |
| Male | 265 (61.1%) | $54,148 |
| Female | 169 (38.9%) | $0 |
| Total | 434 (100.0%) | $55,000 |
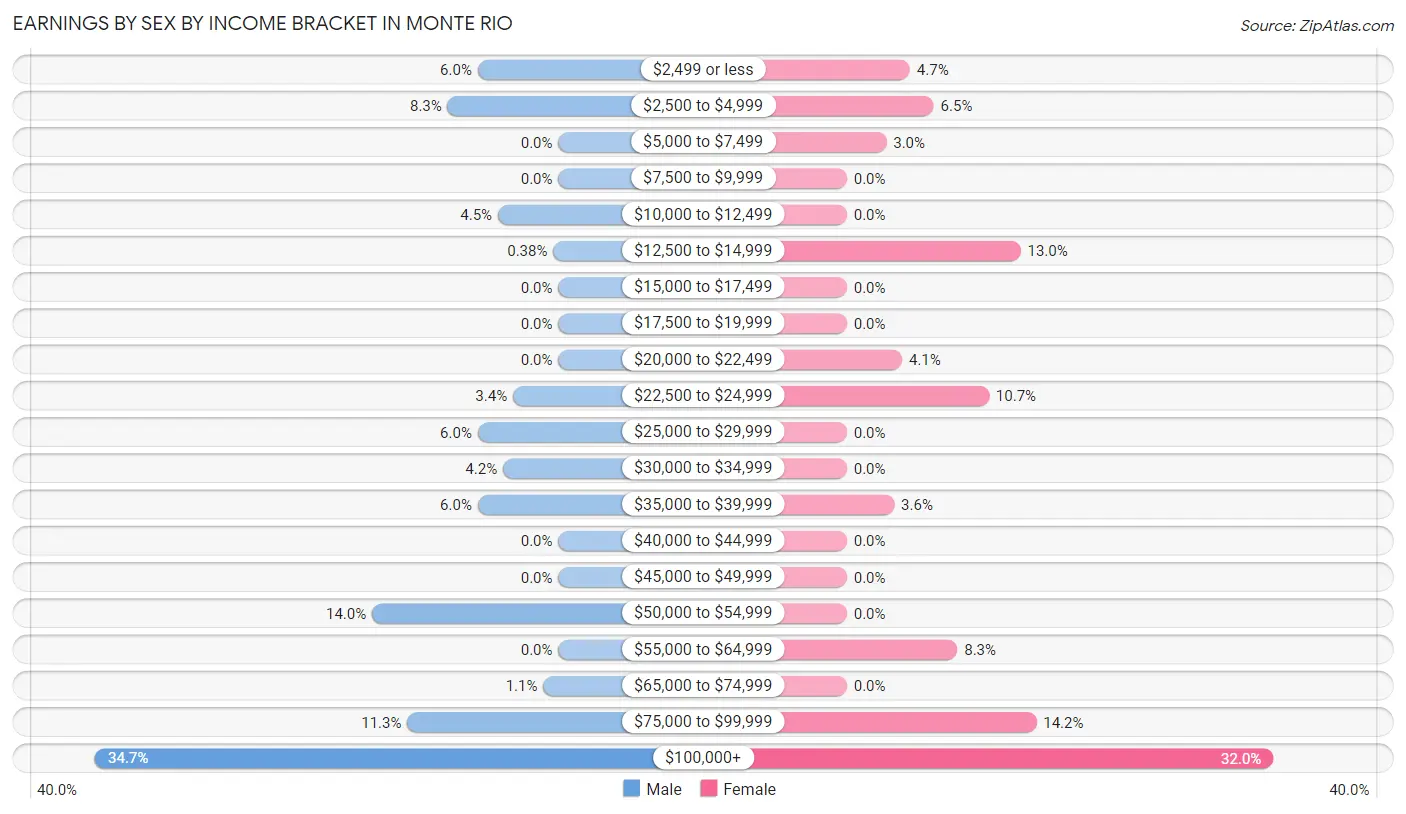
Earnings by Sex by Income Bracket in Monte Rio
The most common earnings brackets in Monte Rio are $100,000+ for men (92 | 34.7%) and $100,000+ for women (54 | 32.0%).
| Income | Male | Female |
| $2,499 or less | 16 (6.0%) | 8 (4.7%) |
| $2,500 to $4,999 | 22 (8.3%) | 11 (6.5%) |
| $5,000 to $7,499 | 0 (0.0%) | 5 (3.0%) |
| $7,500 to $9,999 | 0 (0.0%) | 0 (0.0%) |
| $10,000 to $12,499 | 12 (4.5%) | 0 (0.0%) |
| $12,500 to $14,999 | 1 (0.4%) | 22 (13.0%) |
| $15,000 to $17,499 | 0 (0.0%) | 0 (0.0%) |
| $17,500 to $19,999 | 0 (0.0%) | 0 (0.0%) |
| $20,000 to $22,499 | 0 (0.0%) | 7 (4.1%) |
| $22,500 to $24,999 | 9 (3.4%) | 18 (10.6%) |
| $25,000 to $29,999 | 16 (6.0%) | 0 (0.0%) |
| $30,000 to $34,999 | 11 (4.2%) | 0 (0.0%) |
| $35,000 to $39,999 | 16 (6.0%) | 6 (3.5%) |
| $40,000 to $44,999 | 0 (0.0%) | 0 (0.0%) |
| $45,000 to $49,999 | 0 (0.0%) | 0 (0.0%) |
| $50,000 to $54,999 | 37 (14.0%) | 0 (0.0%) |
| $55,000 to $64,999 | 0 (0.0%) | 14 (8.3%) |
| $65,000 to $74,999 | 3 (1.1%) | 0 (0.0%) |
| $75,000 to $99,999 | 30 (11.3%) | 24 (14.2%) |
| $100,000+ | 92 (34.7%) | 54 (32.0%) |
| Total | 265 (100.0%) | 169 (100.0%) |
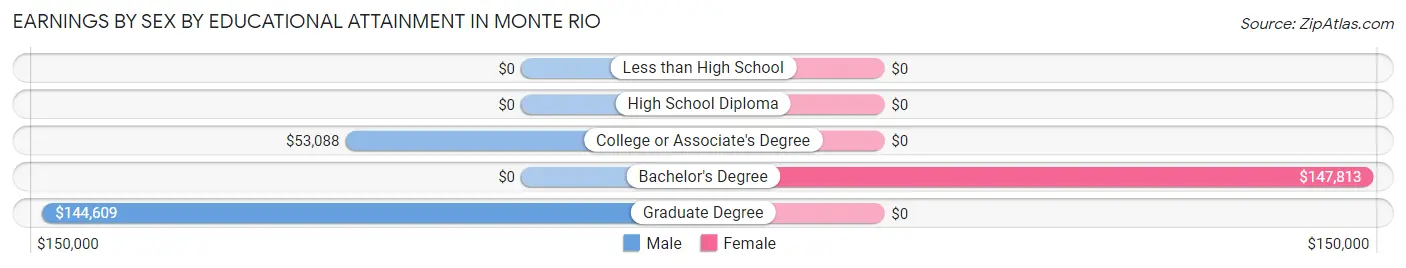
Earnings by Sex by Educational Attainment in Monte Rio
| Educational Attainment | Male Income | Female Income |
| Less than High School | - | - |
| High School Diploma | - | - |
| College or Associate's Degree | $53,088 | $0 |
| Bachelor's Degree | - | - |
| Graduate Degree | $144,609 | $0 |
| Total | $83,529 | $0 |
Family Income in Monte Rio
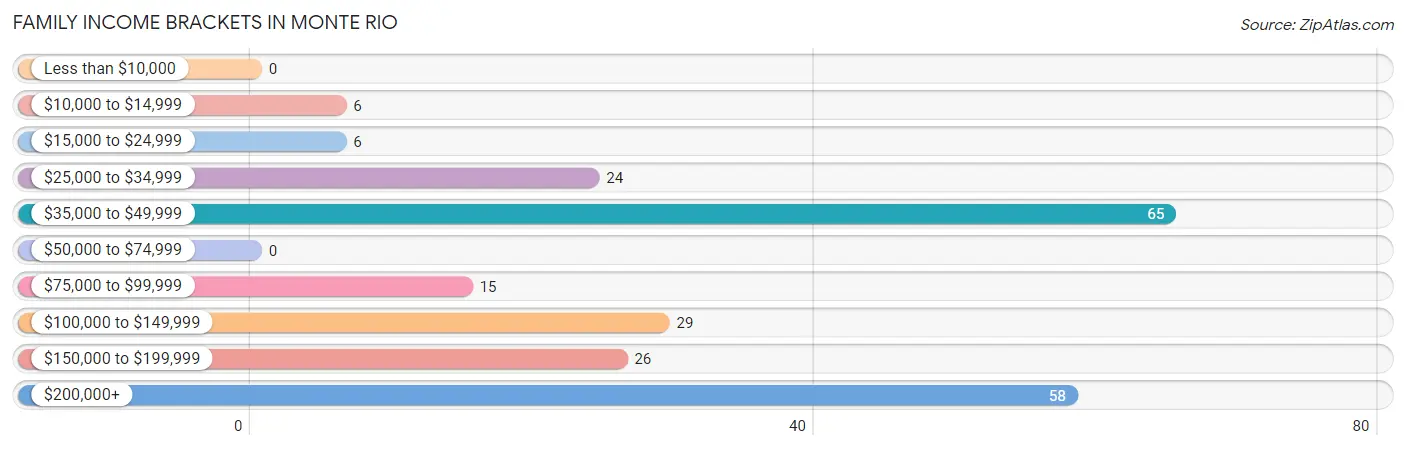
Family Income Brackets in Monte Rio
According to the Monte Rio family income data, there are 65 families falling into the $35,000 to $49,999 income range, which is the most common income bracket and makes up 28.4% of all families.
| Income Bracket | # Families | % Families |
| Less than $10,000 | 0 | 0.0% |
| $10,000 to $14,999 | 6 | 2.6% |
| $15,000 to $24,999 | 6 | 2.6% |
| $25,000 to $34,999 | 24 | 10.5% |
| $35,000 to $49,999 | 65 | 28.4% |
| $50,000 to $74,999 | 0 | 0.0% |
| $75,000 to $99,999 | 15 | 6.6% |
| $100,000 to $149,999 | 29 | 12.7% |
| $150,000 to $199,999 | 26 | 11.4% |
| $200,000+ | 58 | 25.3% |
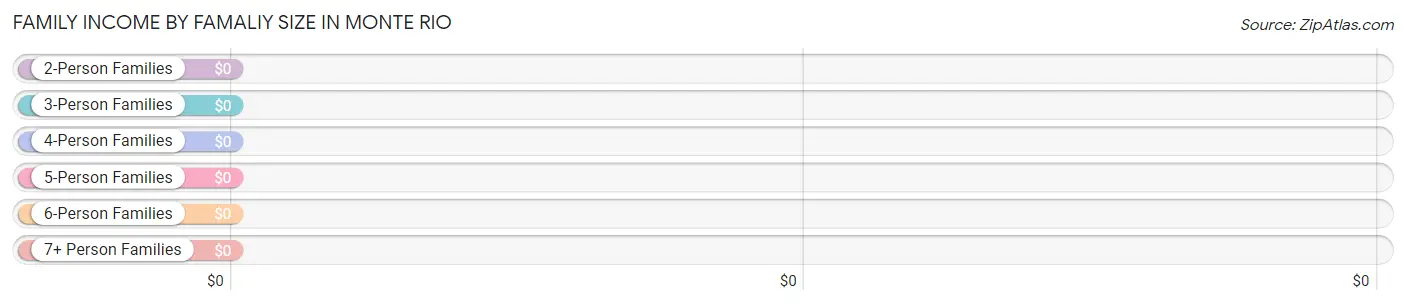
Family Income by Famaliy Size in Monte Rio
| Income Bracket | # Families | Median Income |
| 2-Person Families | 195 (85.2%) | $0 |
| 3-Person Families | 7 (3.1%) | $0 |
| 4-Person Families | 27 (11.8%) | $0 |
| 5-Person Families | 0 (0.0%) | $0 |
| 6-Person Families | 0 (0.0%) | $0 |
| 7+ Person Families | 0 (0.0%) | $0 |
| Total | 229 (100.0%) | $0 |
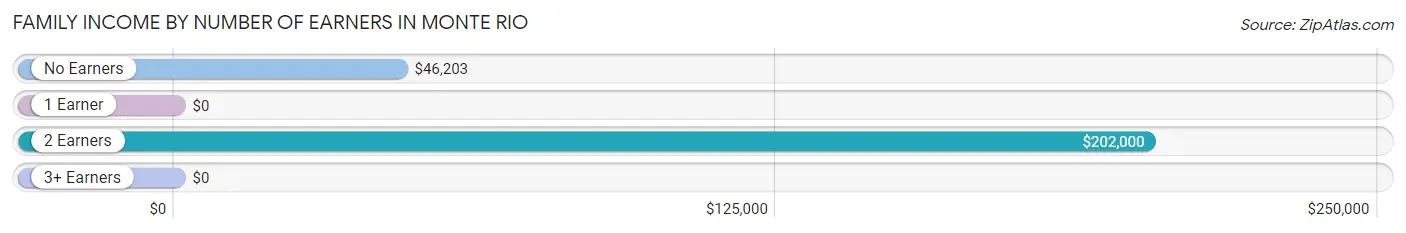
Family Income by Number of Earners in Monte Rio
| Number of Earners | # Families | Median Income |
| No Earners | 63 (27.5%) | $46,203 |
| 1 Earner | 67 (29.3%) | $0 |
| 2 Earners | 84 (36.7%) | $202,000 |
| 3+ Earners | 15 (6.6%) | $0 |
| Total | 229 (100.0%) | $0 |
Household Income in Monte Rio
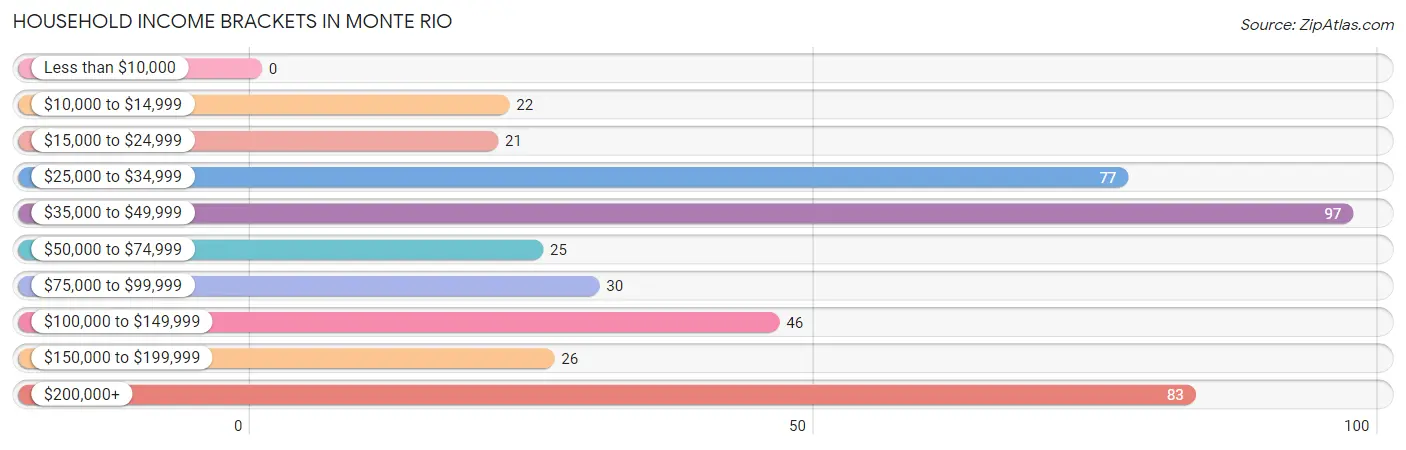
Household Income Brackets in Monte Rio
With 97 households falling in the category, the $35,000 to $49,999 income range is the most frequent in Monte Rio, accounting for 22.7% of all households.
| Income Bracket | # Households | % Households |
| Less than $10,000 | 0 | 0.0% |
| $10,000 to $14,999 | 22 | 5.2% |
| $15,000 to $24,999 | 21 | 4.9% |
| $25,000 to $34,999 | 77 | 18.0% |
| $35,000 to $49,999 | 97 | 22.7% |
| $50,000 to $74,999 | 25 | 5.9% |
| $75,000 to $99,999 | 30 | 7.0% |
| $100,000 to $149,999 | 46 | 10.8% |
| $150,000 to $199,999 | 26 | 6.1% |
| $200,000+ | 83 | 19.4% |
Household Income by Householder Age in Monte Rio
The median household income in Monte Rio is $48,906, with the highest median household income of $160,833 found in the 25 to 44 years age bracket for the primary householder. A total of 46 households (10.8%) fall into this category. Meanwhile, the 15 to 24 years age bracket for the primary householder has the lowest median household income of $0, with 16 households (3.7%) in this group.
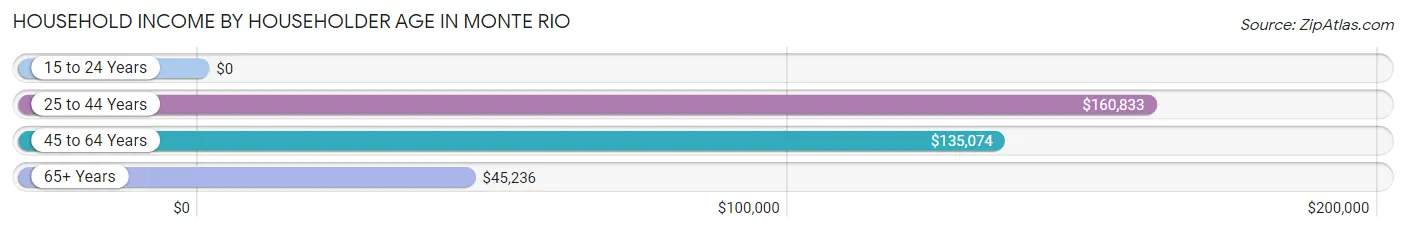
| Income Bracket | # Households | Median Income |
| 15 to 24 Years | 16 (3.7%) | $0 |
| 25 to 44 Years | 46 (10.8%) | $160,833 |
| 45 to 64 Years | 151 (35.4%) | $135,074 |
| 65+ Years | 214 (50.1%) | $45,236 |
| Total | 427 (100.0%) | $48,906 |
Poverty in Monte Rio
Income Below Poverty by Sex and Age in Monte Rio
With 6.2% poverty level for males and 15.8% for females among the residents of Monte Rio, 65 to 74 year old males and 6 to 11 year old females are the most vulnerable to poverty, with 22 males (17.5%) and 1 females (100.0%) in their respective age groups living below the poverty level.
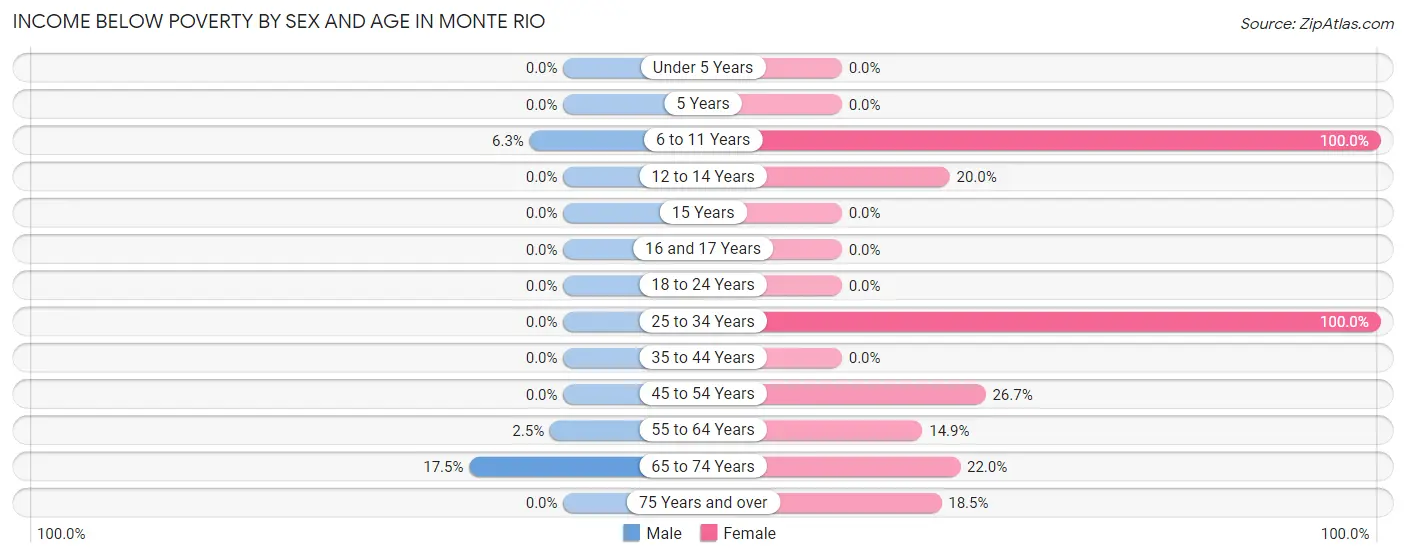
| Age Bracket | Male | Female |
| Under 5 Years | 0 (0.0%) | 0 (0.0%) |
| 5 Years | 0 (0.0%) | 0 (0.0%) |
| 6 to 11 Years | 1 (6.2%) | 1 (100.0%) |
| 12 to 14 Years | 0 (0.0%) | 4 (20.0%) |
| 15 Years | 0 (0.0%) | 0 (0.0%) |
| 16 and 17 Years | 0 (0.0%) | 0 (0.0%) |
| 18 to 24 Years | 0 (0.0%) | 0 (0.0%) |
| 25 to 34 Years | 0 (0.0%) | 1 (100.0%) |
| 35 to 44 Years | 0 (0.0%) | 0 (0.0%) |
| 45 to 54 Years | 0 (0.0%) | 4 (26.7%) |
| 55 to 64 Years | 4 (2.5%) | 13 (14.9%) |
| 65 to 74 Years | 22 (17.5%) | 18 (22.0%) |
| 75 Years and over | 0 (0.0%) | 12 (18.5%) |
| Total | 27 (6.2%) | 53 (15.8%) |
Income Above Poverty by Sex and Age in Monte Rio
According to the poverty statistics in Monte Rio, males aged 18 to 24 years and females aged under 5 years are the age groups that are most secure financially, with 100.0% of males and 100.0% of females in these age groups living above the poverty line.
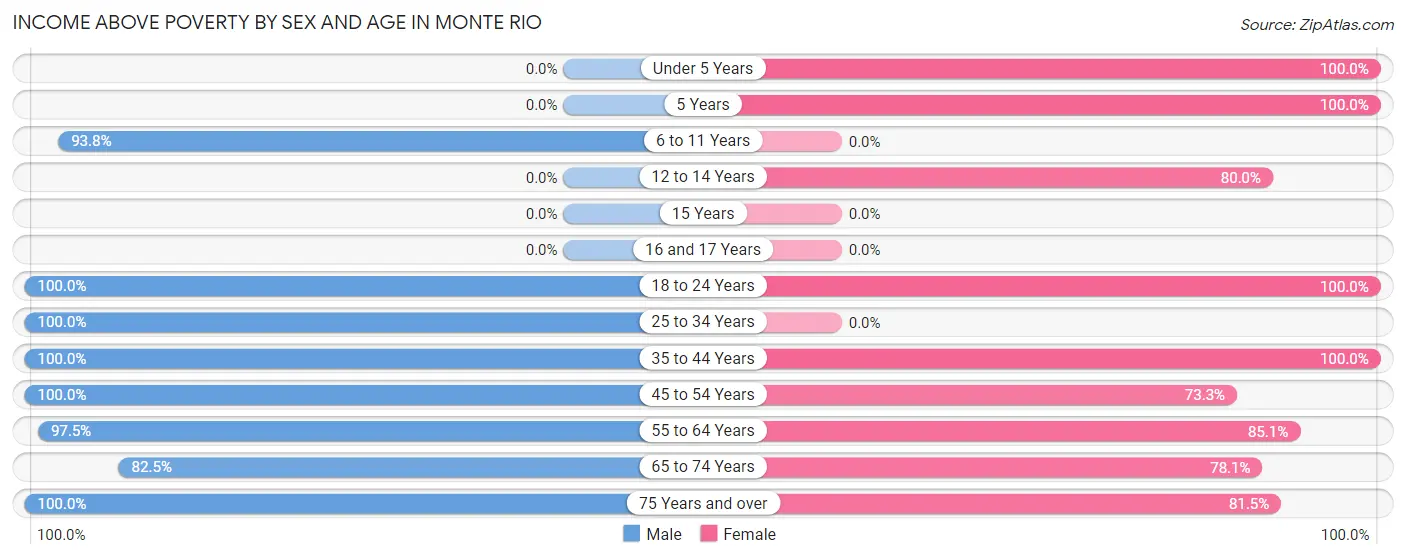
| Age Bracket | Male | Female |
| Under 5 Years | 0 (0.0%) | 2 (100.0%) |
| 5 Years | 0 (0.0%) | 1 (100.0%) |
| 6 to 11 Years | 15 (93.8%) | 0 (0.0%) |
| 12 to 14 Years | 0 (0.0%) | 16 (80.0%) |
| 15 Years | 0 (0.0%) | 0 (0.0%) |
| 16 and 17 Years | 0 (0.0%) | 0 (0.0%) |
| 18 to 24 Years | 35 (100.0%) | 11 (100.0%) |
| 25 to 34 Years | 19 (100.0%) | 0 (0.0%) |
| 35 to 44 Years | 27 (100.0%) | 50 (100.0%) |
| 45 to 54 Years | 46 (100.0%) | 11 (73.3%) |
| 55 to 64 Years | 157 (97.5%) | 74 (85.1%) |
| 65 to 74 Years | 104 (82.5%) | 64 (78.0%) |
| 75 Years and over | 6 (100.0%) | 53 (81.5%) |
| Total | 409 (93.8%) | 282 (84.2%) |
Income Below Poverty Among Married-Couple Families in Monte Rio
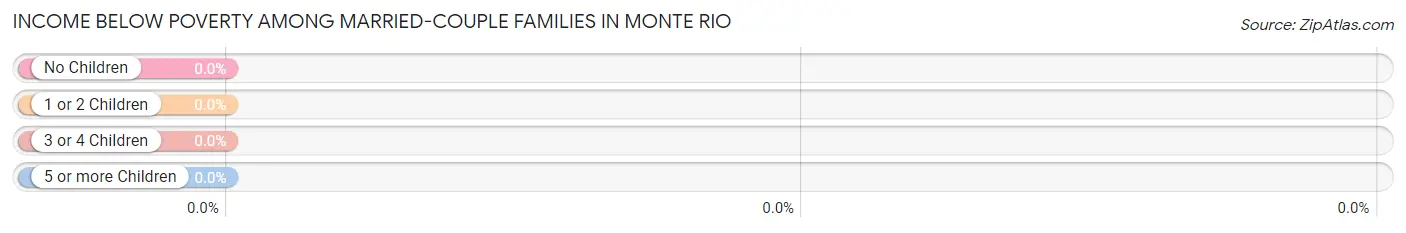
| Children | Above Poverty | Below Poverty |
| No Children | 147 (100.0%) | 0 (0.0%) |
| 1 or 2 Children | 16 (100.0%) | 0 (0.0%) |
| 3 or 4 Children | 0 (0.0%) | 0 (0.0%) |
| 5 or more Children | 0 (0.0%) | 0 (0.0%) |
| Total | 163 (100.0%) | 0 (0.0%) |
Income Below Poverty Among Single-Parent Households in Monte Rio
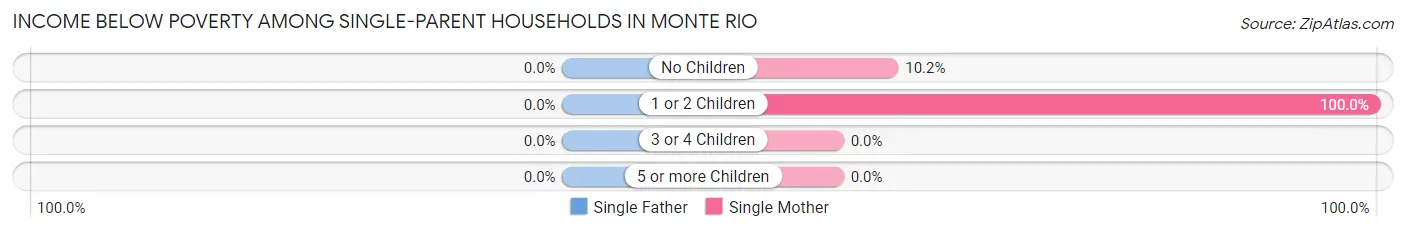
| Children | Single Father | Single Mother |
| No Children | 0 (0.0%) | 6 (10.2%) |
| 1 or 2 Children | 0 (0.0%) | 6 (100.0%) |
| 3 or 4 Children | 0 (0.0%) | 0 (0.0%) |
| 5 or more Children | 0 (0.0%) | 0 (0.0%) |
| Total | 0 (0.0%) | 12 (18.5%) |
Income Below Poverty Among Married-Couple vs Single-Parent Households in Monte Rio
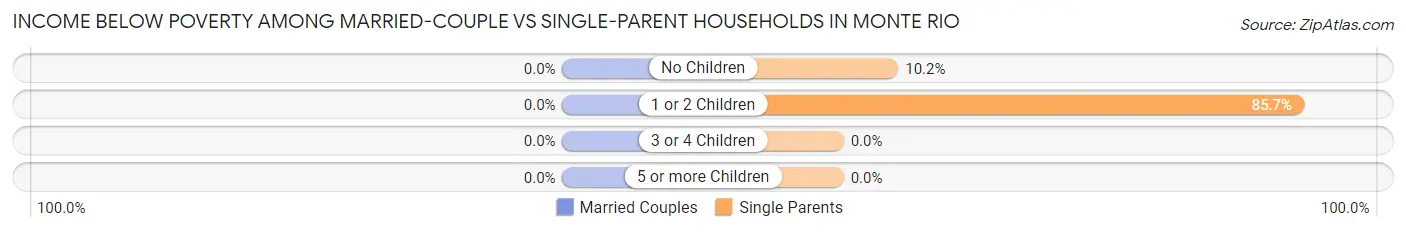
| Children | Married-Couple Families | Single-Parent Households |
| No Children | 0 (0.0%) | 6 (10.2%) |
| 1 or 2 Children | 0 (0.0%) | 6 (85.7%) |
| 3 or 4 Children | 0 (0.0%) | 0 (0.0%) |
| 5 or more Children | 0 (0.0%) | 0 (0.0%) |
| Total | 0 (0.0%) | 12 (18.2%) |
Race in Monte Rio
The most populous races in Monte Rio are White / Caucasian (736 | 95.5%), Hispanic or Latino (65 | 8.4%), and Some other Race (13 | 1.7%).
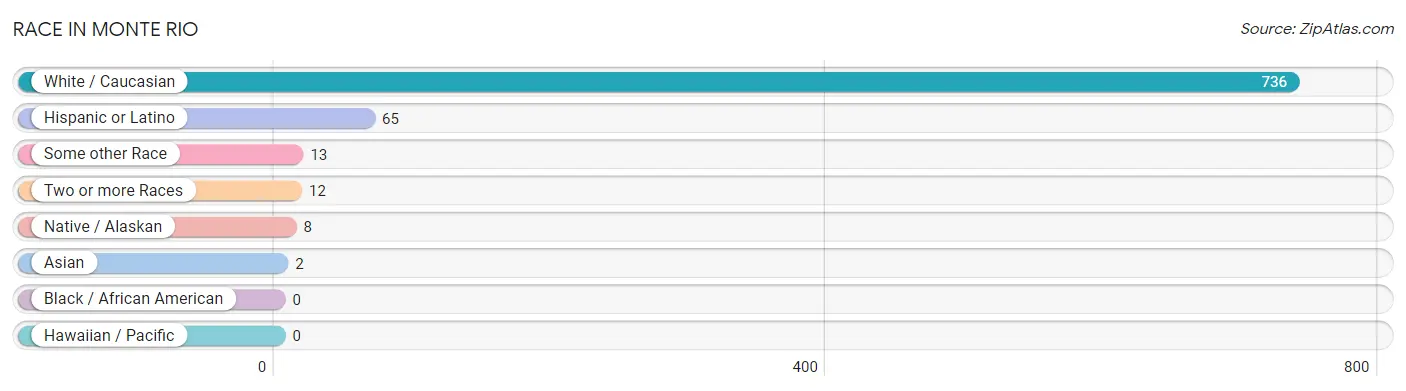
| Race | # Population | % Population |
| Asian | 2 | 0.3% |
| Black / African American | 0 | 0.0% |
| Hawaiian / Pacific | 0 | 0.0% |
| Hispanic or Latino | 65 | 8.4% |
| Native / Alaskan | 8 | 1.0% |
| White / Caucasian | 736 | 95.5% |
| Two or more Races | 12 | 1.6% |
| Some other Race | 13 | 1.7% |
| Total | 771 | 100.0% |
Ancestry in Monte Rio
The most populous ancestries reported in Monte Rio are Irish (181 | 23.5%), German (142 | 18.4%), American (51 | 6.6%), English (50 | 6.5%), and Latvian (47 | 6.1%), together accounting for 61.1% of all Monte Rio residents.
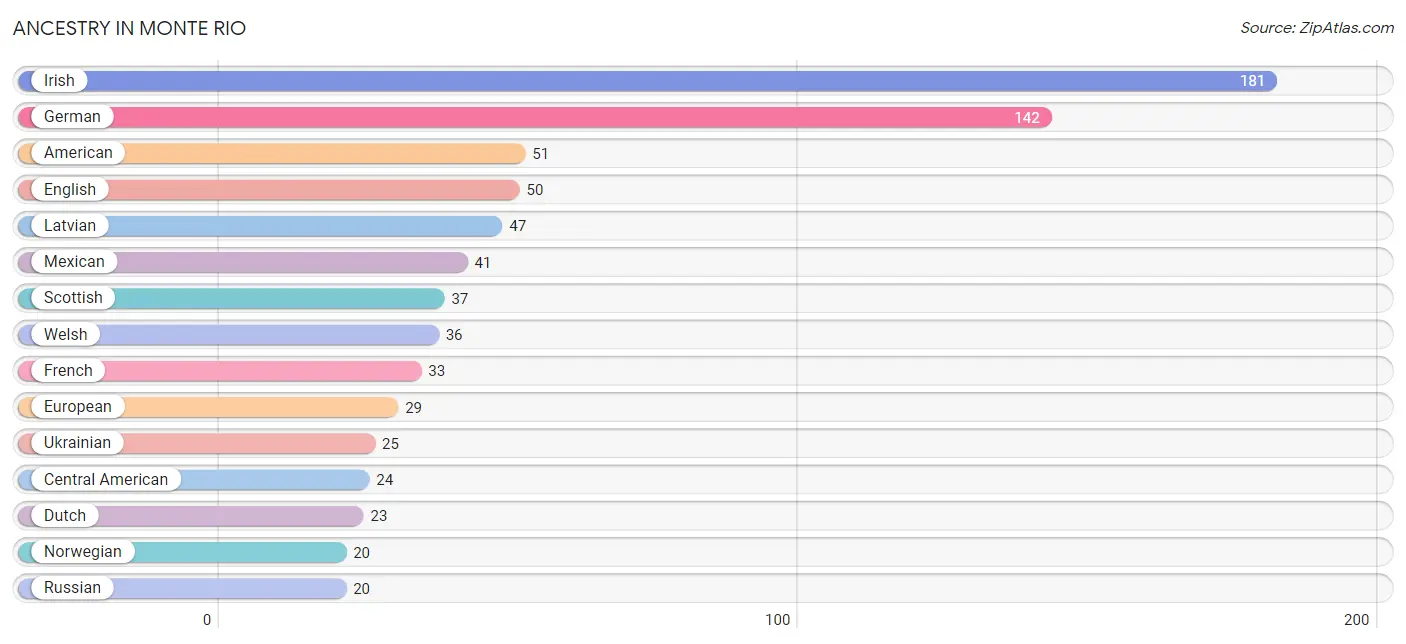
| Ancestry | # Population | % Population |
| American | 51 | 6.6% |
| Austrian | 4 | 0.5% |
| British | 4 | 0.5% |
| Canadian | 18 | 2.3% |
| Celtic | 10 | 1.3% |
| Central American | 24 | 3.1% |
| Danish | 17 | 2.2% |
| Dutch | 23 | 3.0% |
| English | 50 | 6.5% |
| European | 29 | 3.8% |
| French | 33 | 4.3% |
| German | 142 | 18.4% |
| Honduran | 7 | 0.9% |
| Hungarian | 6 | 0.8% |
| Irish | 181 | 23.5% |
| Italian | 10 | 1.3% |
| Latvian | 47 | 6.1% |
| Mexican | 41 | 5.3% |
| Norwegian | 20 | 2.6% |
| Pakistani | 2 | 0.3% |
| Polish | 5 | 0.6% |
| Russian | 20 | 2.6% |
| Salvadoran | 17 | 2.2% |
| Scandinavian | 5 | 0.6% |
| Scottish | 37 | 4.8% |
| Swedish | 10 | 1.3% |
| Ukrainian | 25 | 3.2% |
| Welsh | 36 | 4.7% | View All 28 Rows |
Immigrants in Monte Rio
The most numerous immigrant groups reported in Monte Rio came from Europe (54 | 7.0%), Northern Europe (20 | 2.6%), Netherlands (18 | 2.3%), Western Europe (18 | 2.3%), and Central America (17 | 2.2%), together accounting for 16.5% of all Monte Rio residents.
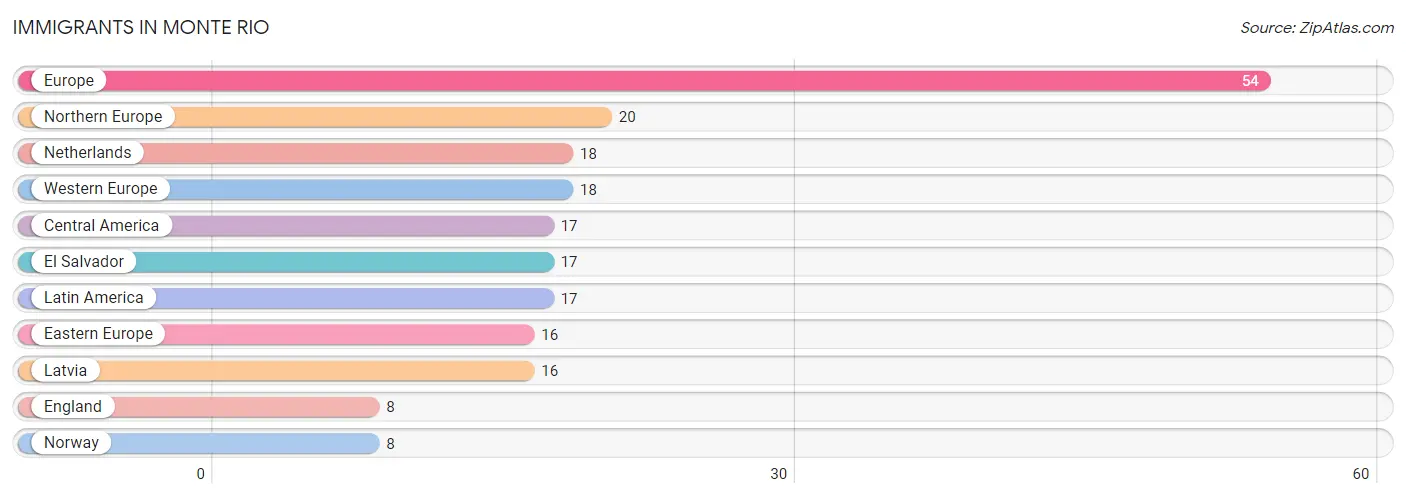
| Immigration Origin | # Population | % Population |
| Central America | 17 | 2.2% |
| Eastern Europe | 16 | 2.1% |
| El Salvador | 17 | 2.2% |
| England | 8 | 1.0% |
| Europe | 54 | 7.0% |
| Latin America | 17 | 2.2% |
| Latvia | 16 | 2.1% |
| Netherlands | 18 | 2.3% |
| Northern Europe | 20 | 2.6% |
| Norway | 8 | 1.0% |
| Western Europe | 18 | 2.3% | View All 11 Rows |
Sex and Age in Monte Rio
Sex and Age in Monte Rio
The most populous age groups in Monte Rio are 65 to 69 Years (111 | 25.5%) for men and 85 Years and over (65 | 19.4%) for women.
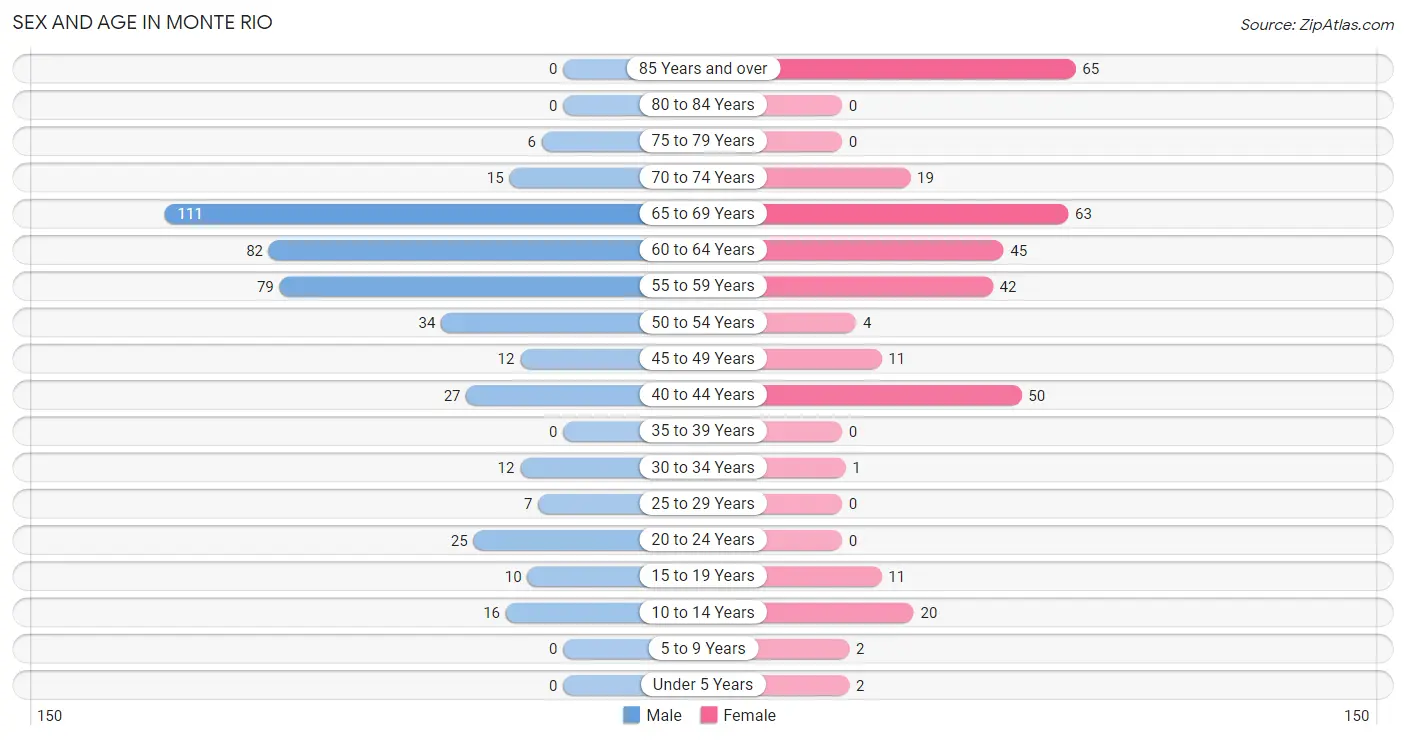
| Age Bracket | Male | Female |
| Under 5 Years | 0 (0.0%) | 2 (0.6%) |
| 5 to 9 Years | 0 (0.0%) | 2 (0.6%) |
| 10 to 14 Years | 16 (3.7%) | 20 (6.0%) |
| 15 to 19 Years | 10 (2.3%) | 11 (3.3%) |
| 20 to 24 Years | 25 (5.7%) | 0 (0.0%) |
| 25 to 29 Years | 7 (1.6%) | 0 (0.0%) |
| 30 to 34 Years | 12 (2.8%) | 1 (0.3%) |
| 35 to 39 Years | 0 (0.0%) | 0 (0.0%) |
| 40 to 44 Years | 27 (6.2%) | 50 (14.9%) |
| 45 to 49 Years | 12 (2.8%) | 11 (3.3%) |
| 50 to 54 Years | 34 (7.8%) | 4 (1.2%) |
| 55 to 59 Years | 79 (18.1%) | 42 (12.5%) |
| 60 to 64 Years | 82 (18.8%) | 45 (13.4%) |
| 65 to 69 Years | 111 (25.5%) | 63 (18.8%) |
| 70 to 74 Years | 15 (3.4%) | 19 (5.7%) |
| 75 to 79 Years | 6 (1.4%) | 0 (0.0%) |
| 80 to 84 Years | 0 (0.0%) | 0 (0.0%) |
| 85 Years and over | 0 (0.0%) | 65 (19.4%) |
| Total | 436 (100.0%) | 335 (100.0%) |
Families and Households in Monte Rio
Median Family Size in Monte Rio
The median family size in Monte Rio is 2.27 persons per family, with single male/father families (1 | 0.4%) accounting for the largest median family size of 5 persons per family. On the other hand, single female/mother families (65 | 28.4%) represent the smallest median family size with 1.89 persons per family.
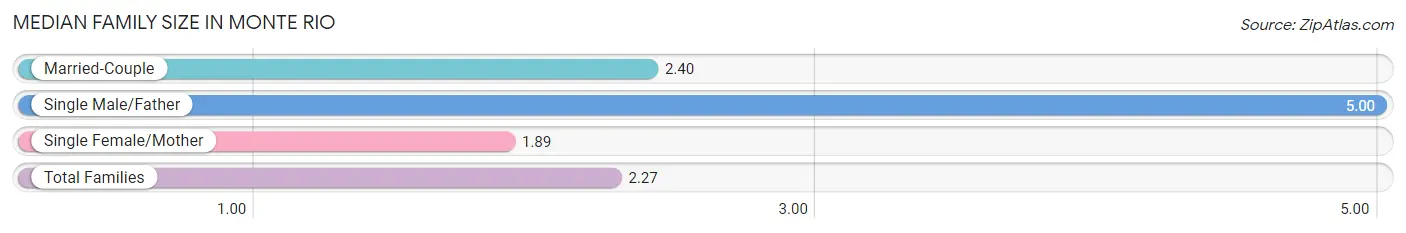
| Family Type | # Families | Family Size |
| Married-Couple | 163 (71.2%) | 2.40 |
| Single Male/Father | 1 (0.4%) | 5.00 |
| Single Female/Mother | 65 (28.4%) | 1.89 |
| Total Families | 229 (100.0%) | 2.27 |
Median Household Size in Monte Rio
The median household size in Monte Rio is 1.81 persons per household, with single male/father households (1 | 0.2%) accounting for the largest median household size of 5 persons per household. non-family households (198 | 46.4%) represent the smallest median household size with 1.15 persons per household.
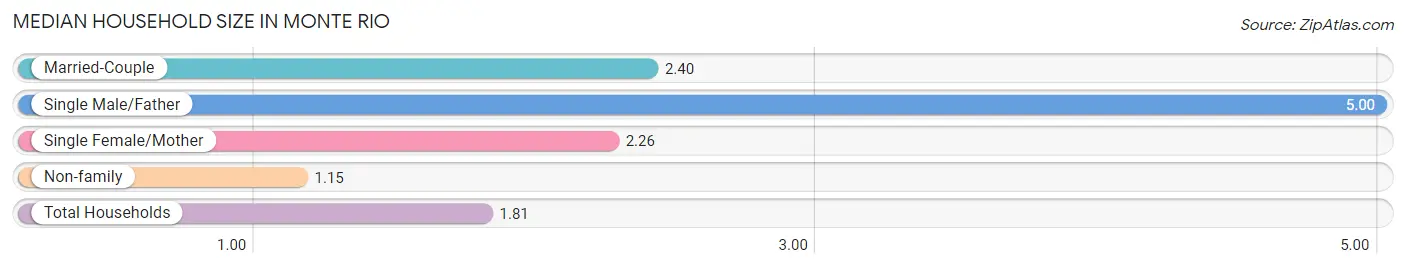
| Household Type | # Households | Household Size |
| Married-Couple | 163 (38.2%) | 2.40 |
| Single Male/Father | 1 (0.2%) | 5.00 |
| Single Female/Mother | 65 (15.2%) | 2.26 |
| Non-family | 198 (46.4%) | 1.15 |
| Total Households | 427 (100.0%) | 1.81 |
Household Size by Marriage Status in Monte Rio
Out of a total of 427 households in Monte Rio, 229 (53.6%) are family households, while 198 (46.4%) are nonfamily households. The most numerous type of family households are 2-person households, comprising 185, and the most common type of nonfamily households are 1-person households, comprising 168.
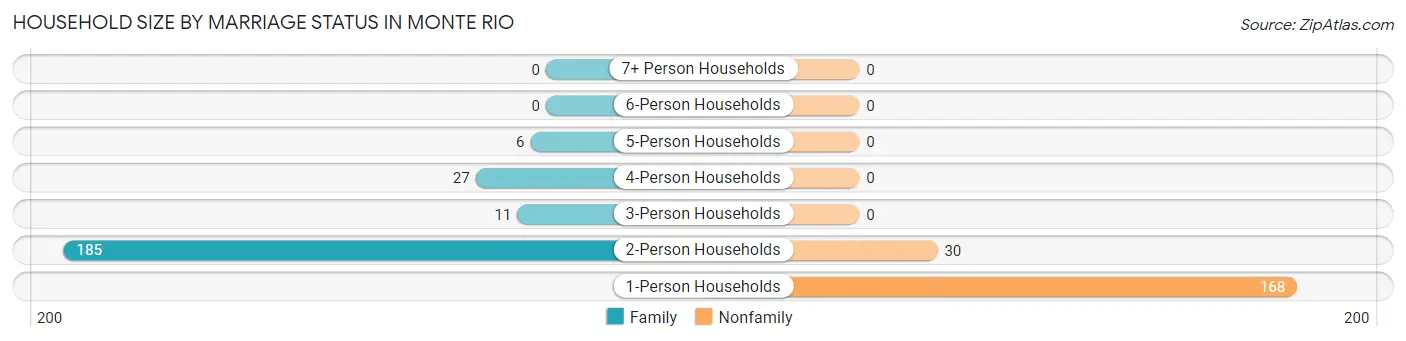
| Household Size | Family Households | Nonfamily Households |
| 1-Person Households | - | 168 (39.3%) |
| 2-Person Households | 185 (43.3%) | 30 (7.0%) |
| 3-Person Households | 11 (2.6%) | 0 (0.0%) |
| 4-Person Households | 27 (6.3%) | 0 (0.0%) |
| 5-Person Households | 6 (1.4%) | 0 (0.0%) |
| 6-Person Households | 0 (0.0%) | 0 (0.0%) |
| 7+ Person Households | 0 (0.0%) | 0 (0.0%) |
| Total | 229 (53.6%) | 198 (46.4%) |
Female Fertility in Monte Rio
Fertility by Age in Monte Rio
| Age Bracket | Women with Births | Births / 1,000 Women |
| 15 to 19 years | 0 (0.0%) | 0.0 |
| 20 to 34 years | 0 (0.0%) | 0.0 |
| 35 to 50 years | 0 (0.0%) | 0.0 |
| Total | 0 (0.0%) | 0.0 |
Fertility by Age by Marriage Status in Monte Rio
| Age Bracket | Married | Unmarried |
| 15 to 19 years | 0 (0.0%) | 0 (0.0%) |
| 20 to 34 years | 0 (0.0%) | 0 (0.0%) |
| 35 to 50 years | 0 (0.0%) | 0 (0.0%) |
| Total | 0 (0.0%) | 0 (0.0%) |
Fertility by Education in Monte Rio
| Educational Attainment | Women with Births | Births / 1,000 Women |
| Less than High School | 0 (0.0%) | 0.0 |
| High School Diploma | 0 (0.0%) | 0.0 |
| College or Associate's Degree | 0 (0.0%) | 0.0 |
| Bachelor's Degree | 0 (0.0%) | 0.0 |
| Graduate Degree | 0 (0.0%) | 0.0 |
| Total | 0 (0.0%) | 0.0 |
Fertility by Education by Marriage Status in Monte Rio
| Educational Attainment | Married | Unmarried |
| Less than High School | 0 (0.0%) | 0 (0.0%) |
| High School Diploma | 0 (0.0%) | 0 (0.0%) |
| College or Associate's Degree | 0 (0.0%) | 0 (0.0%) |
| Bachelor's Degree | 0 (0.0%) | 0 (0.0%) |
| Graduate Degree | 0 (0.0%) | 0 (0.0%) |
| Total | 0 (0.0%) | 0 (0.0%) |
Employment Characteristics in Monte Rio
Employment by Class of Employer in Monte Rio
Among the 383 employed individuals in Monte Rio, private company employees (218 | 56.9%), not-for-profit organizations (65 | 17.0%), and self-employed (not incorporated) (52 | 13.6%) make up the most common classes of employment.
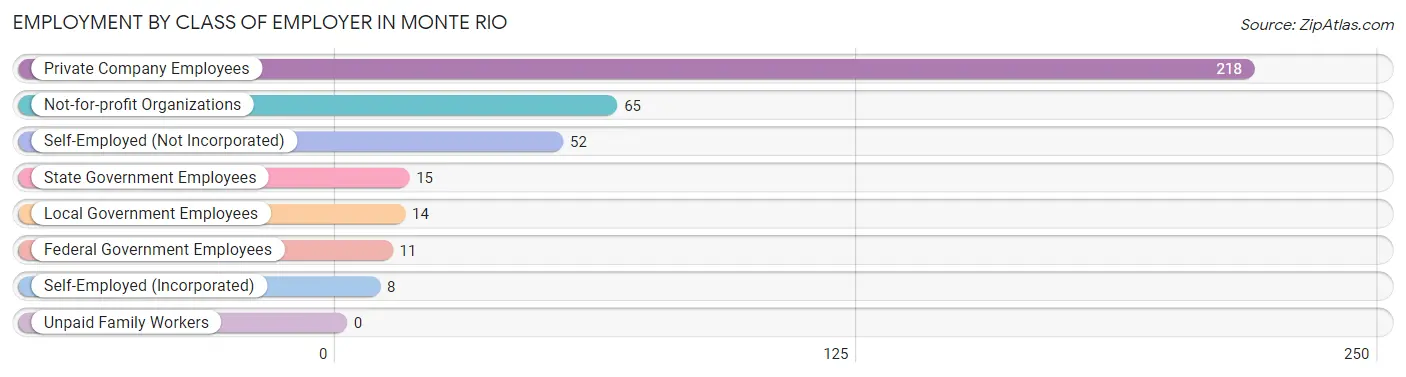
| Employer Class | # Employees | % Employees |
| Private Company Employees | 218 | 56.9% |
| Self-Employed (Incorporated) | 8 | 2.1% |
| Self-Employed (Not Incorporated) | 52 | 13.6% |
| Not-for-profit Organizations | 65 | 17.0% |
| Local Government Employees | 14 | 3.7% |
| State Government Employees | 15 | 3.9% |
| Federal Government Employees | 11 | 2.9% |
| Unpaid Family Workers | 0 | 0.0% |
| Total | 383 | 100.0% |
Employment Status by Age in Monte Rio
According to the labor force statistics for Monte Rio, out of the total population over 16 years of age (731), 56.5% or 413 individuals are in the labor force, with 7.3% or 30 of them unemployed. The age group with the highest labor force participation rate is 16 to 19 years, with 100.0% or 21 individuals in the labor force. Within the labor force, the 30 to 34 years age range has the highest percentage of unemployed individuals, with 100.0% or 13 of them being unemployed.
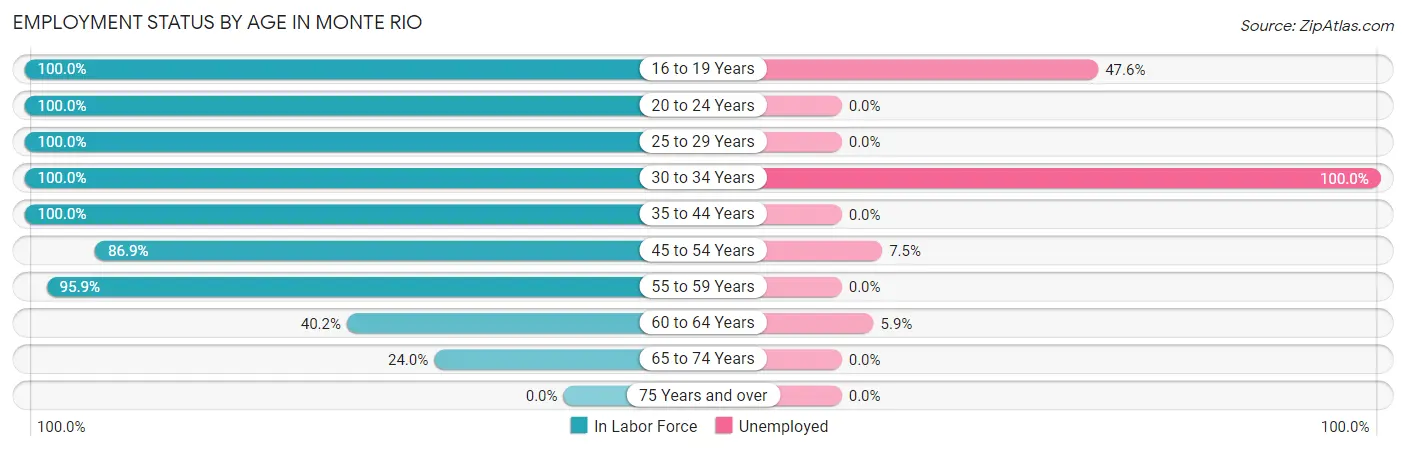
| Age Bracket | In Labor Force | Unemployed |
| 16 to 19 Years | 21 (100.0%) | 10 (47.6%) |
| 20 to 24 Years | 25 (100.0%) | 0 (0.0%) |
| 25 to 29 Years | 7 (100.0%) | 0 (0.0%) |
| 30 to 34 Years | 13 (100.0%) | 13 (100.0%) |
| 35 to 44 Years | 77 (100.0%) | 0 (0.0%) |
| 45 to 54 Years | 53 (86.9%) | 4 (7.5%) |
| 55 to 59 Years | 116 (95.9%) | 0 (0.0%) |
| 60 to 64 Years | 51 (40.2%) | 3 (5.9%) |
| 65 to 74 Years | 50 (24.0%) | 0 (0.0%) |
| 75 Years and over | 0 (0.0%) | 0 (0.0%) |
| Total | 413 (56.5%) | 30 (7.3%) |
Employment Status by Educational Attainment in Monte Rio
According to labor force statistics for Monte Rio, 78.1% of individuals (317) out of the total population between 25 and 64 years of age (406) are in the labor force, with 6.3% or 20 of them being unemployed. The group with the highest labor force participation rate are those with the educational attainment of bachelor's degree or higher, with 96.7% or 146 individuals in the labor force. Within the labor force, individuals with less than high school education have the highest percentage of unemployment, with 100.0% or 3 of them being unemployed.
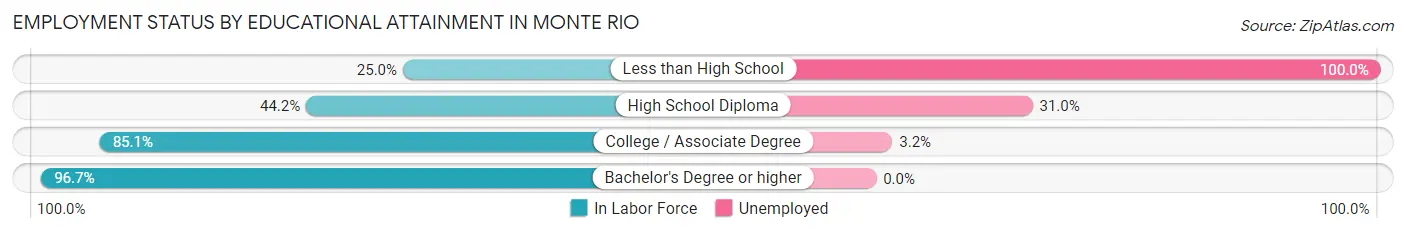
| Educational Attainment | In Labor Force | Unemployed |
| Less than High School | 3 (25.0%) | 12 (100.0%) |
| High School Diploma | 42 (44.2%) | 29 (31.0%) |
| College / Associate Degree | 126 (85.1%) | 5 (3.2%) |
| Bachelor's Degree or higher | 146 (96.7%) | 0 (0.0%) |
| Total | 317 (78.1%) | 26 (6.3%) |
Employment Occupations by Sex in Monte Rio
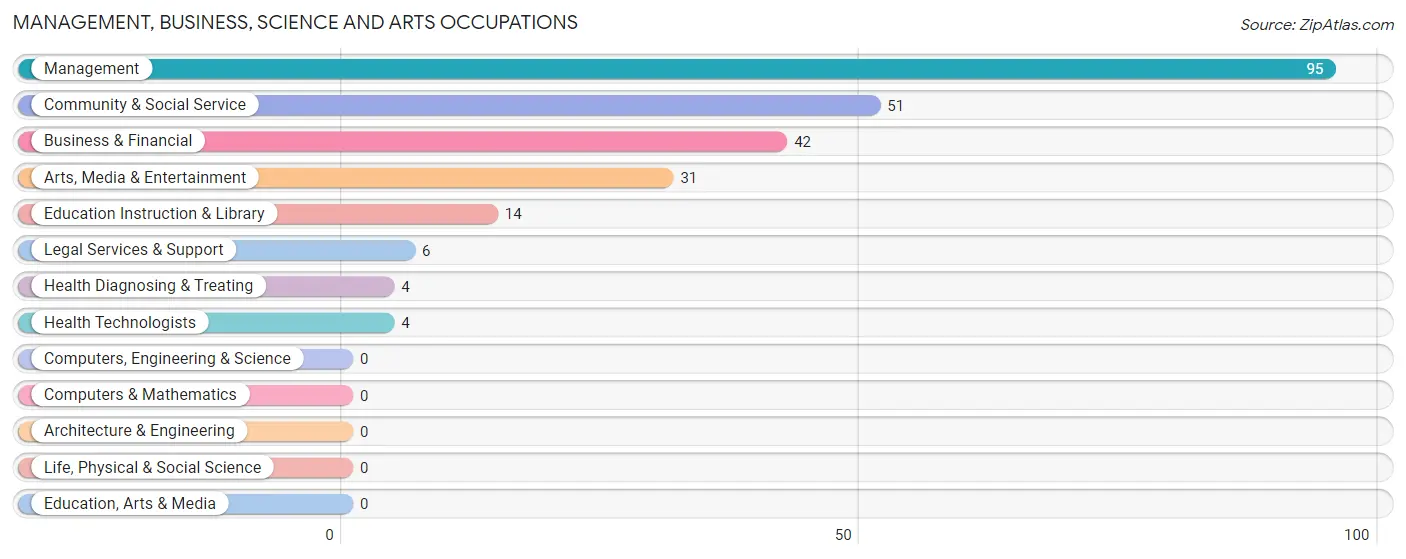
Management, Business, Science and Arts Occupations
The most common Management, Business, Science and Arts occupations in Monte Rio are Management (95 | 24.8%), Community & Social Service (51 | 13.3%), Business & Financial (42 | 11.0%), Arts, Media & Entertainment (31 | 8.1%), and Education Instruction & Library (14 | 3.7%).
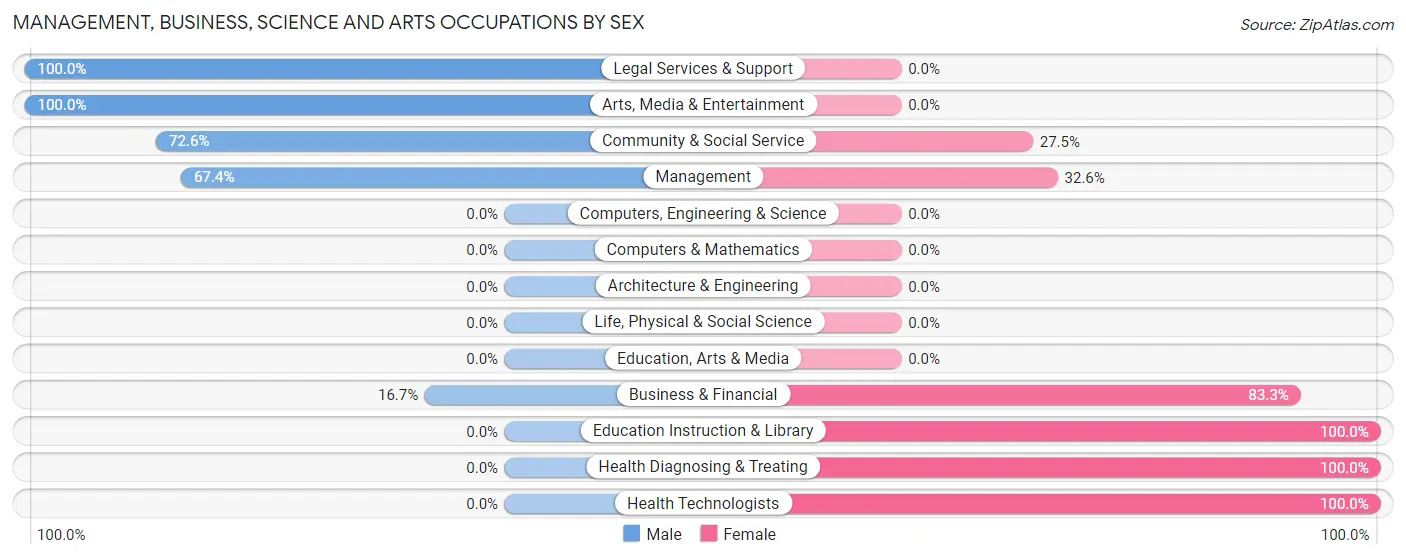
Management, Business, Science and Arts Occupations by Sex
Within the Management, Business, Science and Arts occupations in Monte Rio, the most male-oriented occupations are Legal Services & Support (100.0%), Arts, Media & Entertainment (100.0%), and Community & Social Service (72.6%), while the most female-oriented occupations are Education Instruction & Library (100.0%), Health Diagnosing & Treating (100.0%), and Health Technologists (100.0%).
| Occupation | Male | Female |
| Management | 64 (67.4%) | 31 (32.6%) |
| Business & Financial | 7 (16.7%) | 35 (83.3%) |
| Computers, Engineering & Science | 0 (0.0%) | 0 (0.0%) |
| Computers & Mathematics | 0 (0.0%) | 0 (0.0%) |
| Architecture & Engineering | 0 (0.0%) | 0 (0.0%) |
| Life, Physical & Social Science | 0 (0.0%) | 0 (0.0%) |
| Community & Social Service | 37 (72.6%) | 14 (27.5%) |
| Education, Arts & Media | 0 (0.0%) | 0 (0.0%) |
| Legal Services & Support | 6 (100.0%) | 0 (0.0%) |
| Education Instruction & Library | 0 (0.0%) | 14 (100.0%) |
| Arts, Media & Entertainment | 31 (100.0%) | 0 (0.0%) |
| Health Diagnosing & Treating | 0 (0.0%) | 4 (100.0%) |
| Health Technologists | 0 (0.0%) | 4 (100.0%) |
| Total (Category) | 108 (56.2%) | 84 (43.8%) |
| Total (Overall) | 234 (61.1%) | 149 (38.9%) |
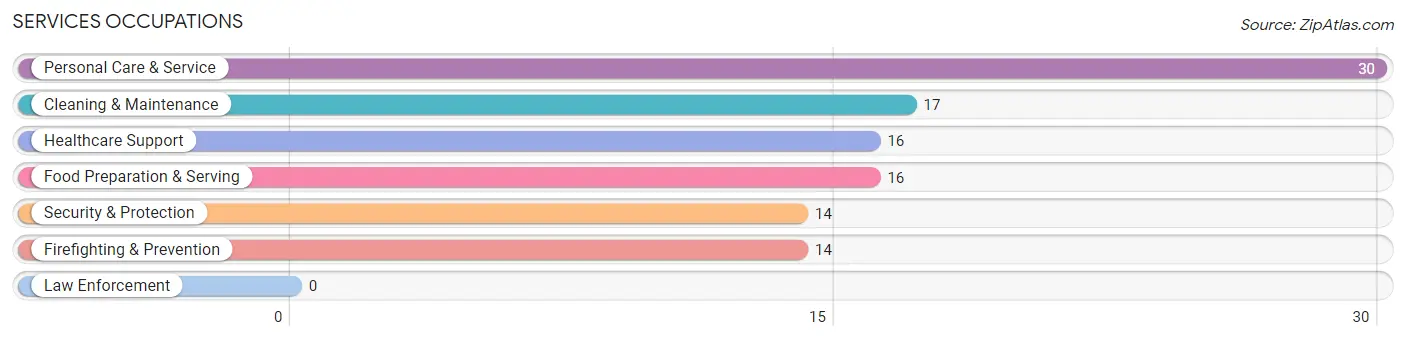
Services Occupations
The most common Services occupations in Monte Rio are Personal Care & Service (30 | 7.8%), Cleaning & Maintenance (17 | 4.4%), Healthcare Support (16 | 4.2%), Food Preparation & Serving (16 | 4.2%), and Security & Protection (14 | 3.7%).
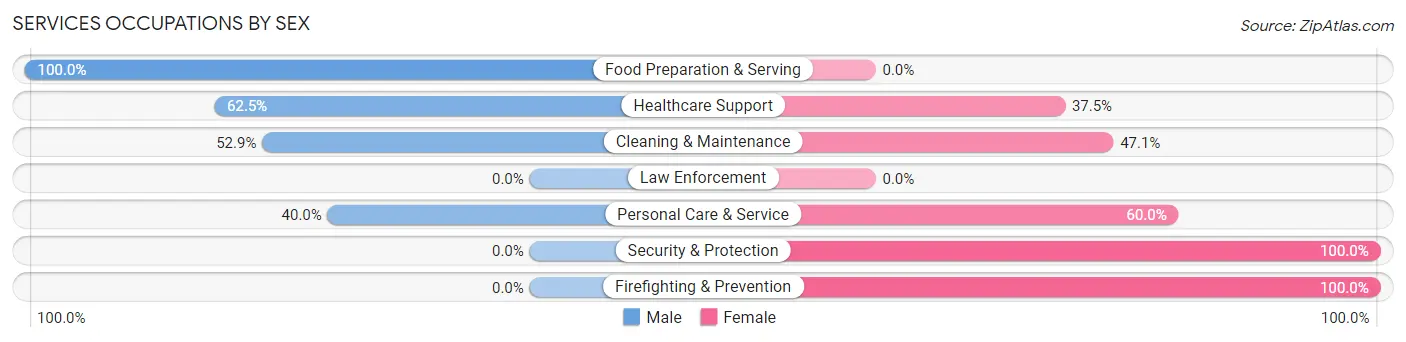
Services Occupations by Sex
Within the Services occupations in Monte Rio, the most male-oriented occupations are Food Preparation & Serving (100.0%), Healthcare Support (62.5%), and Cleaning & Maintenance (52.9%), while the most female-oriented occupations are Security & Protection (100.0%), Firefighting & Prevention (100.0%), and Personal Care & Service (60.0%).
| Occupation | Male | Female |
| Healthcare Support | 10 (62.5%) | 6 (37.5%) |
| Security & Protection | 0 (0.0%) | 14 (100.0%) |
| Firefighting & Prevention | 0 (0.0%) | 14 (100.0%) |
| Law Enforcement | 0 (0.0%) | 0 (0.0%) |
| Food Preparation & Serving | 16 (100.0%) | 0 (0.0%) |
| Cleaning & Maintenance | 9 (52.9%) | 8 (47.1%) |
| Personal Care & Service | 12 (40.0%) | 18 (60.0%) |
| Total (Category) | 47 (50.5%) | 46 (49.5%) |
| Total (Overall) | 234 (61.1%) | 149 (38.9%) |
Sales and Office Occupations
The most common Sales and Office occupations in Monte Rio are Office & Administration (25 | 6.5%), and Sales & Related (11 | 2.9%).
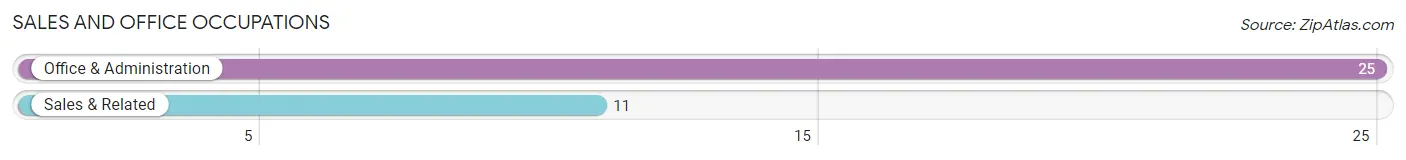
Sales and Office Occupations by Sex
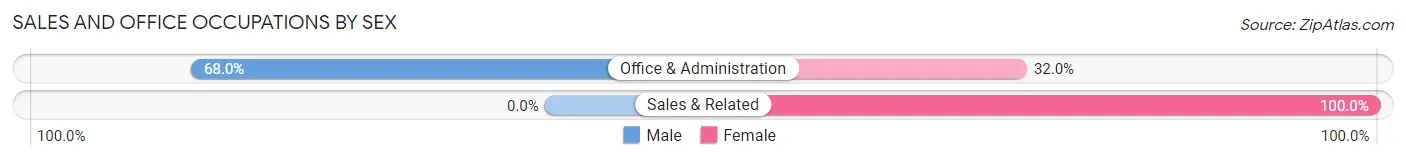
| Occupation | Male | Female |
| Sales & Related | 0 (0.0%) | 11 (100.0%) |
| Office & Administration | 17 (68.0%) | 8 (32.0%) |
| Total (Category) | 17 (47.2%) | 19 (52.8%) |
| Total (Overall) | 234 (61.1%) | 149 (38.9%) |
Natural Resources, Construction and Maintenance Occupations
The most common Natural Resources, Construction and Maintenance occupations in Monte Rio are Installation, Maintenance & Repair (15 | 3.9%), and Construction & Extraction (12 | 3.1%).
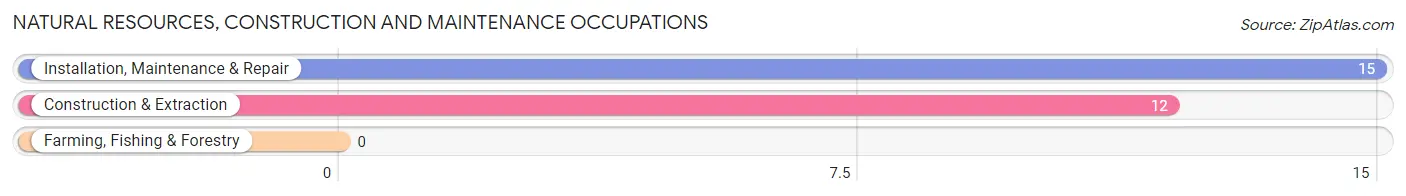
Natural Resources, Construction and Maintenance Occupations by Sex
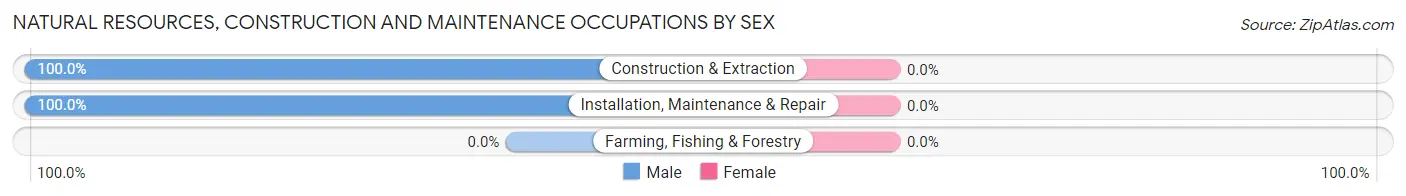
| Occupation | Male | Female |
| Farming, Fishing & Forestry | 0 (0.0%) | 0 (0.0%) |
| Construction & Extraction | 12 (100.0%) | 0 (0.0%) |
| Installation, Maintenance & Repair | 15 (100.0%) | 0 (0.0%) |
| Total (Category) | 27 (100.0%) | 0 (0.0%) |
| Total (Overall) | 234 (61.1%) | 149 (38.9%) |
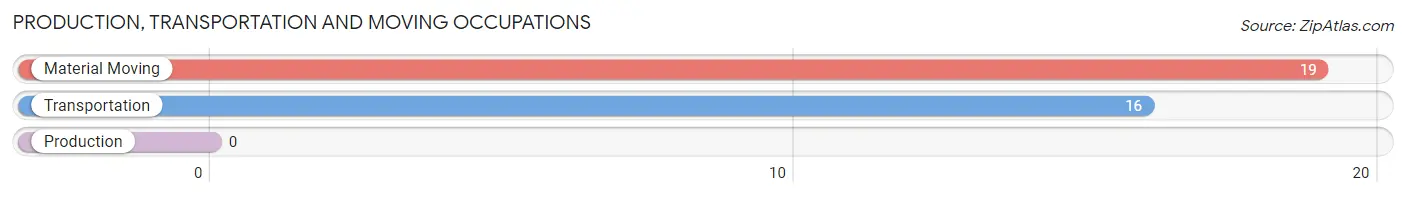
Production, Transportation and Moving Occupations
The most common Production, Transportation and Moving occupations in Monte Rio are Material Moving (19 | 5.0%), and Transportation (16 | 4.2%).
Production, Transportation and Moving Occupations by Sex
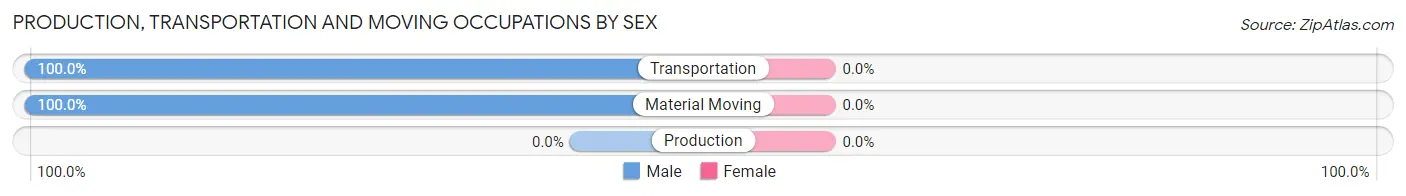
| Occupation | Male | Female |
| Production | 0 (0.0%) | 0 (0.0%) |
| Transportation | 16 (100.0%) | 0 (0.0%) |
| Material Moving | 19 (100.0%) | 0 (0.0%) |
| Total (Category) | 35 (100.0%) | 0 (0.0%) |
| Total (Overall) | 234 (61.1%) | 149 (38.9%) |
Employment Industries by Sex in Monte Rio
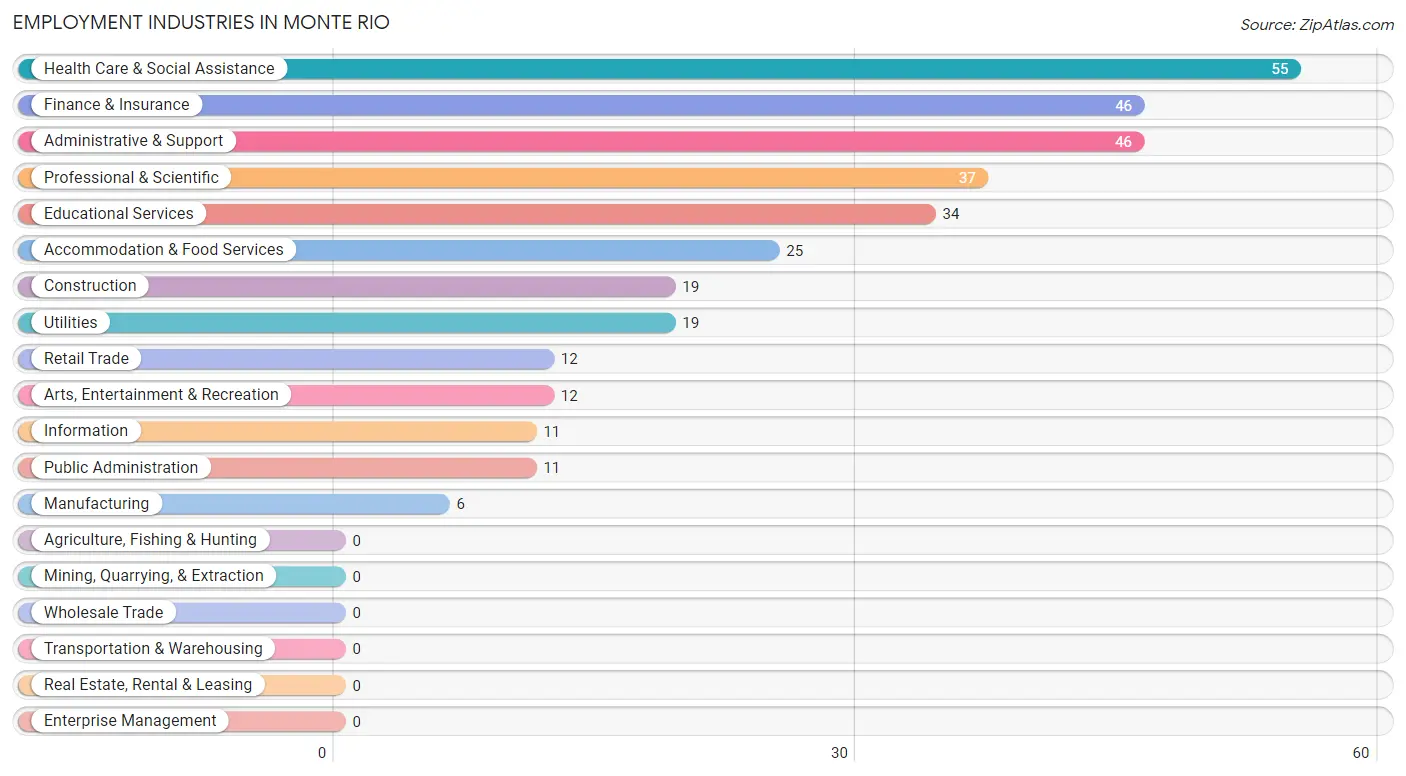
Employment Industries in Monte Rio
The major employment industries in Monte Rio include Health Care & Social Assistance (55 | 14.4%), Finance & Insurance (46 | 12.0%), Administrative & Support (46 | 12.0%), Professional & Scientific (37 | 9.7%), and Educational Services (34 | 8.9%).
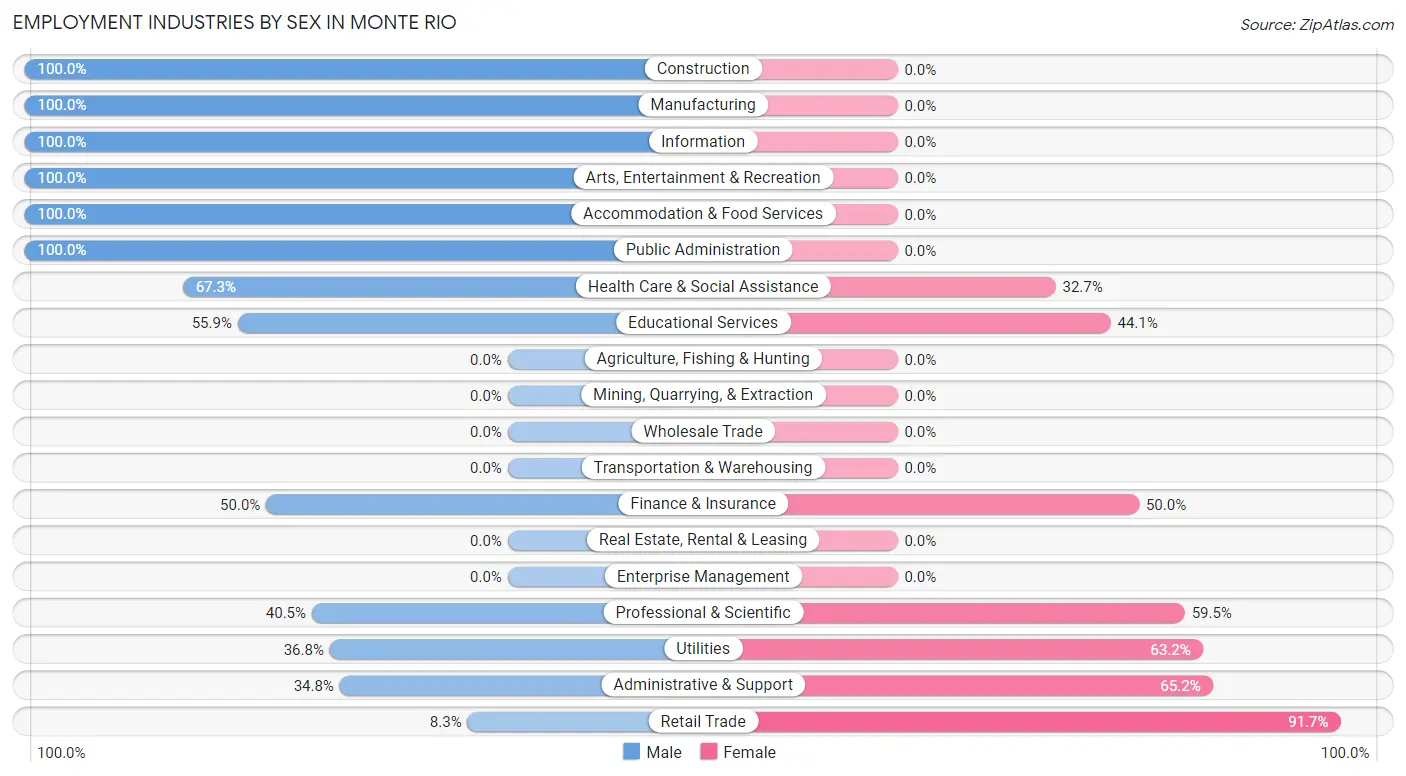
Employment Industries by Sex in Monte Rio
The Monte Rio industries that see more men than women are Construction (100.0%), Manufacturing (100.0%), and Information (100.0%), whereas the industries that tend to have a higher number of women are Retail Trade (91.7%), Administrative & Support (65.2%), and Utilities (63.2%).
| Industry | Male | Female |
| Agriculture, Fishing & Hunting | 0 (0.0%) | 0 (0.0%) |
| Mining, Quarrying, & Extraction | 0 (0.0%) | 0 (0.0%) |
| Construction | 19 (100.0%) | 0 (0.0%) |
| Manufacturing | 6 (100.0%) | 0 (0.0%) |
| Wholesale Trade | 0 (0.0%) | 0 (0.0%) |
| Retail Trade | 1 (8.3%) | 11 (91.7%) |
| Transportation & Warehousing | 0 (0.0%) | 0 (0.0%) |
| Utilities | 7 (36.8%) | 12 (63.2%) |
| Information | 11 (100.0%) | 0 (0.0%) |
| Finance & Insurance | 23 (50.0%) | 23 (50.0%) |
| Real Estate, Rental & Leasing | 0 (0.0%) | 0 (0.0%) |
| Professional & Scientific | 15 (40.5%) | 22 (59.5%) |
| Enterprise Management | 0 (0.0%) | 0 (0.0%) |
| Administrative & Support | 16 (34.8%) | 30 (65.2%) |
| Educational Services | 19 (55.9%) | 15 (44.1%) |
| Health Care & Social Assistance | 37 (67.3%) | 18 (32.7%) |
| Arts, Entertainment & Recreation | 12 (100.0%) | 0 (0.0%) |
| Accommodation & Food Services | 25 (100.0%) | 0 (0.0%) |
| Public Administration | 11 (100.0%) | 0 (0.0%) |
| Total | 234 (61.1%) | 149 (38.9%) |
Education in Monte Rio
School Enrollment in Monte Rio
The most common levels of schooling among the 63 students in Monte Rio are middle school (21 | 33.3%), college / undergraduate (17 | 27.0%), and elementary school (16 | 25.4%).
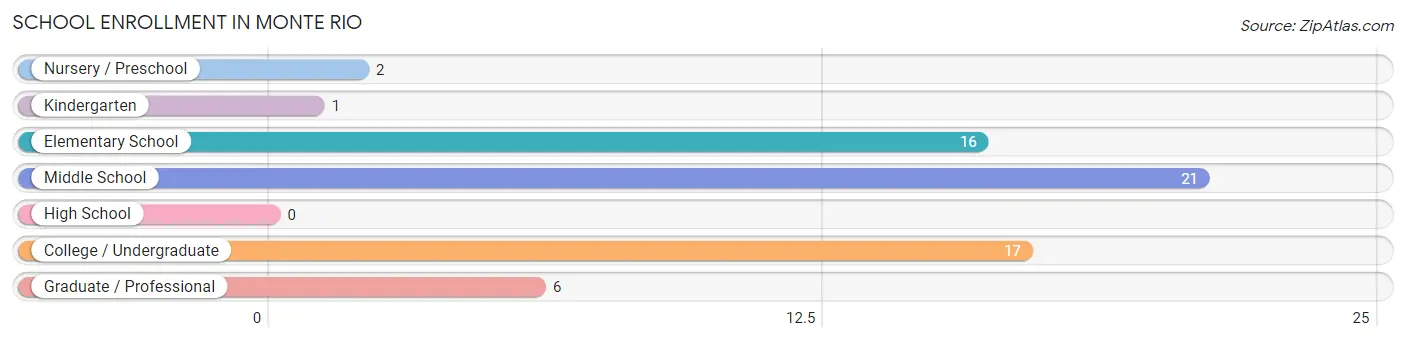
| School Level | # Students | % Students |
| Nursery / Preschool | 2 | 3.2% |
| Kindergarten | 1 | 1.6% |
| Elementary School | 16 | 25.4% |
| Middle School | 21 | 33.3% |
| High School | 0 | 0.0% |
| College / Undergraduate | 17 | 27.0% |
| Graduate / Professional | 6 | 9.5% |
| Total | 63 | 100.0% |
School Enrollment by Age by Funding Source in Monte Rio
Out of a total of 63 students who are enrolled in schools in Monte Rio, 39 (61.9%) attend a private institution, while the remaining 24 (38.1%) are enrolled in public schools. The age group of 3 to 4 year olds has the highest likelihood of being enrolled in private schools, with 2 (100.0% in the age bracket) enrolled. Conversely, the age group of 5 to 9 year old has the lowest likelihood of being enrolled in a private school, with 2 (100.0% in the age bracket) attending a public institution.
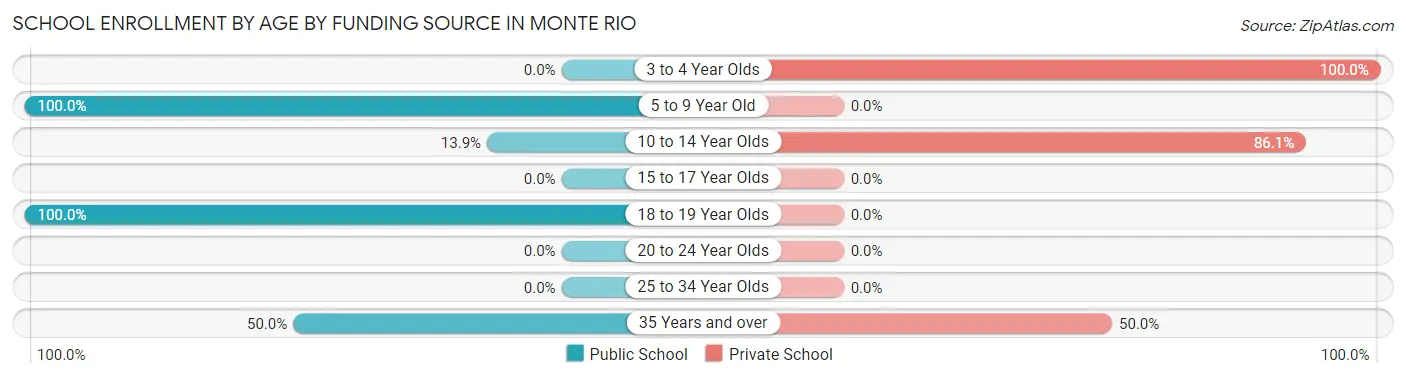
| Age Bracket | Public School | Private School |
| 3 to 4 Year Olds | 0 (0.0%) | 2 (100.0%) |
| 5 to 9 Year Old | 2 (100.0%) | 0 (0.0%) |
| 10 to 14 Year Olds | 5 (13.9%) | 31 (86.1%) |
| 15 to 17 Year Olds | 0 (0.0%) | 0 (0.0%) |
| 18 to 19 Year Olds | 11 (100.0%) | 0 (0.0%) |
| 20 to 24 Year Olds | 0 (0.0%) | 0 (0.0%) |
| 25 to 34 Year Olds | 0 (0.0%) | 0 (0.0%) |
| 35 Years and over | 6 (50.0%) | 6 (50.0%) |
| Total | 24 (38.1%) | 39 (61.9%) |
Educational Attainment by Field of Study in Monte Rio
Liberal arts & history (53 | 17.4%), social sciences (47 | 15.5%), business (43 | 14.1%), visual & performing arts (38 | 12.5%), and psychology (31 | 10.2%) are the most common fields of study among 304 individuals in Monte Rio who have obtained a bachelor's degree or higher.
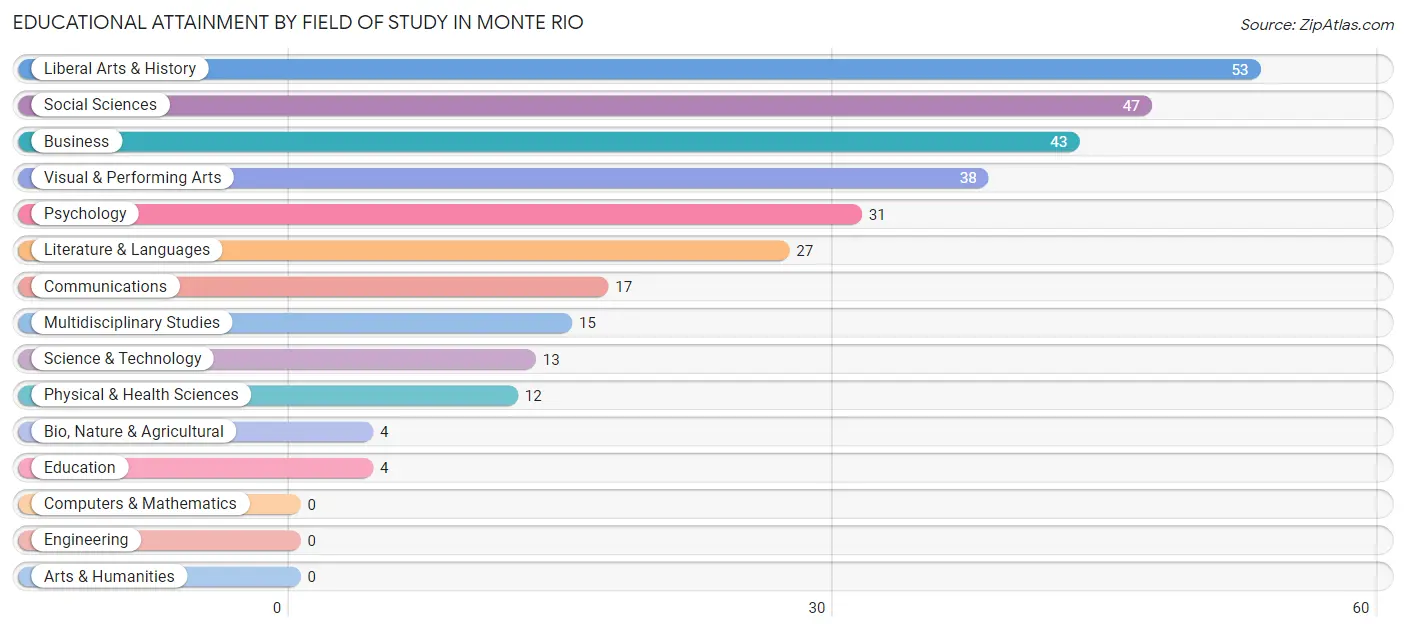
| Field of Study | # Graduates | % Graduates |
| Computers & Mathematics | 0 | 0.0% |
| Bio, Nature & Agricultural | 4 | 1.3% |
| Physical & Health Sciences | 12 | 4.0% |
| Psychology | 31 | 10.2% |
| Social Sciences | 47 | 15.5% |
| Engineering | 0 | 0.0% |
| Multidisciplinary Studies | 15 | 4.9% |
| Science & Technology | 13 | 4.3% |
| Business | 43 | 14.1% |
| Education | 4 | 1.3% |
| Literature & Languages | 27 | 8.9% |
| Liberal Arts & History | 53 | 17.4% |
| Visual & Performing Arts | 38 | 12.5% |
| Communications | 17 | 5.6% |
| Arts & Humanities | 0 | 0.0% |
| Total | 304 | 100.0% |
Transportation & Commute in Monte Rio
Vehicle Availability by Sex in Monte Rio
The most prevalent vehicle ownership categories in Monte Rio are males with 2 vehicles (97, accounting for 41.4%) and females with 2 vehicles (73, making up 65.1%).
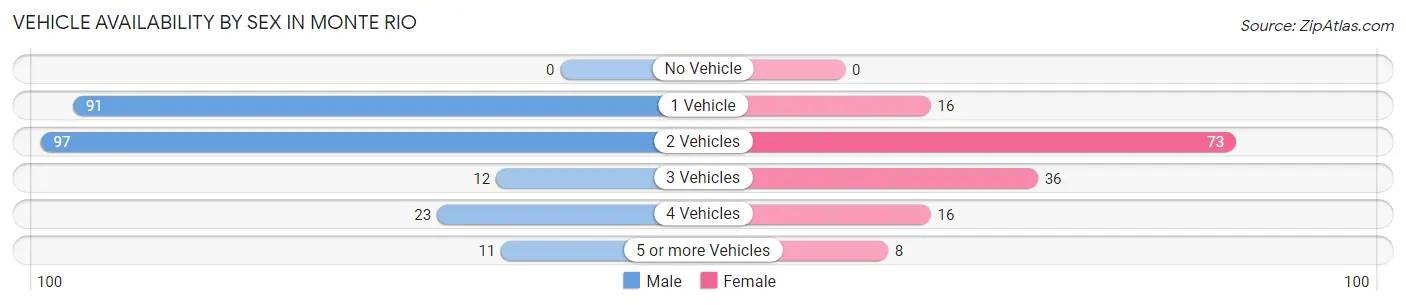
| Vehicles Available | Male | Female |
| No Vehicle | 0 (0.0%) | 0 (0.0%) |
| 1 Vehicle | 91 (38.9%) | 16 (10.7%) |
| 2 Vehicles | 97 (41.4%) | 73 (49.0%) |
| 3 Vehicles | 12 (5.1%) | 36 (24.2%) |
| 4 Vehicles | 23 (9.8%) | 16 (10.7%) |
| 5 or more Vehicles | 11 (4.7%) | 8 (5.4%) |
| Total | 234 (100.0%) | 149 (100.0%) |
Commute Time in Monte Rio
The most frequently occuring commute durations in Monte Rio are 10 to 14 minutes (49 commuters, 16.1%), 5 to 9 minutes (41 commuters, 13.4%), and less than 5 minutes (37 commuters, 12.1%).
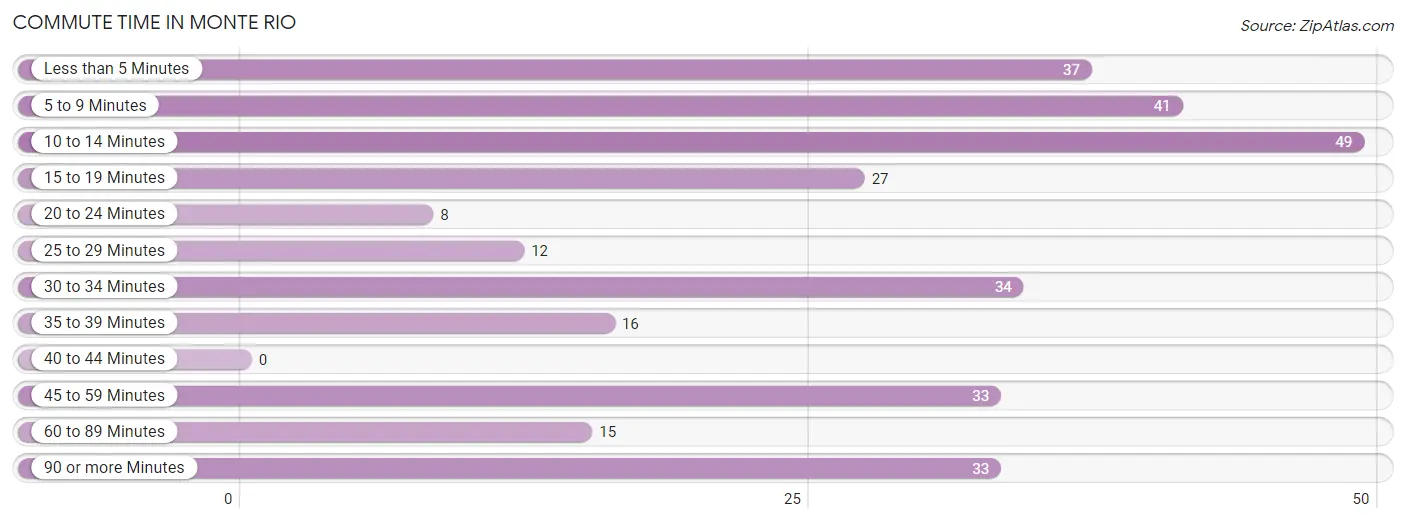
| Commute Time | # Commuters | % Commuters |
| Less than 5 Minutes | 37 | 12.1% |
| 5 to 9 Minutes | 41 | 13.4% |
| 10 to 14 Minutes | 49 | 16.1% |
| 15 to 19 Minutes | 27 | 8.8% |
| 20 to 24 Minutes | 8 | 2.6% |
| 25 to 29 Minutes | 12 | 3.9% |
| 30 to 34 Minutes | 34 | 11.2% |
| 35 to 39 Minutes | 16 | 5.2% |
| 40 to 44 Minutes | 0 | 0.0% |
| 45 to 59 Minutes | 33 | 10.8% |
| 60 to 89 Minutes | 15 | 4.9% |
| 90 or more Minutes | 33 | 10.8% |
Commute Time by Sex in Monte Rio
The most common commute times in Monte Rio are less than 5 minutes (37 commuters, 19.4%) for males and 10 to 14 minutes (40 commuters, 35.1%) for females.
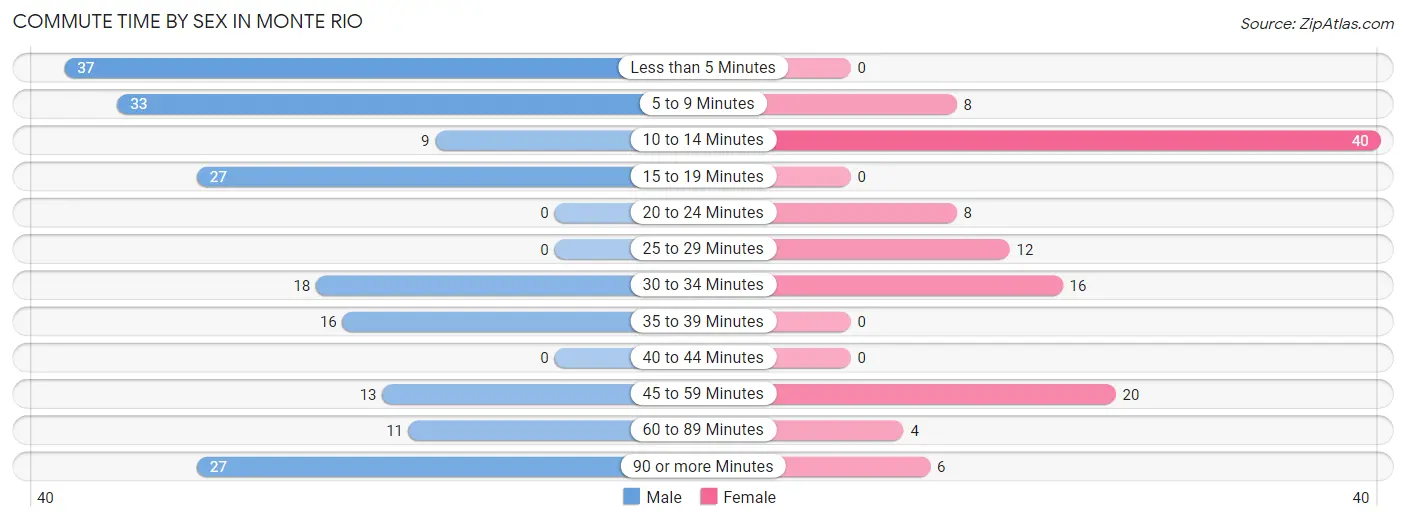
| Commute Time | Male | Female |
| Less than 5 Minutes | 37 (19.4%) | 0 (0.0%) |
| 5 to 9 Minutes | 33 (17.3%) | 8 (7.0%) |
| 10 to 14 Minutes | 9 (4.7%) | 40 (35.1%) |
| 15 to 19 Minutes | 27 (14.1%) | 0 (0.0%) |
| 20 to 24 Minutes | 0 (0.0%) | 8 (7.0%) |
| 25 to 29 Minutes | 0 (0.0%) | 12 (10.5%) |
| 30 to 34 Minutes | 18 (9.4%) | 16 (14.0%) |
| 35 to 39 Minutes | 16 (8.4%) | 0 (0.0%) |
| 40 to 44 Minutes | 0 (0.0%) | 0 (0.0%) |
| 45 to 59 Minutes | 13 (6.8%) | 20 (17.5%) |
| 60 to 89 Minutes | 11 (5.8%) | 4 (3.5%) |
| 90 or more Minutes | 27 (14.1%) | 6 (5.3%) |
Time of Departure to Work by Sex in Monte Rio
The most frequent times of departure to work in Monte Rio are 7:30 AM to 7:59 AM (44, 23.0%) for males and 6:00 AM to 6:29 AM (20, 17.5%) for females.
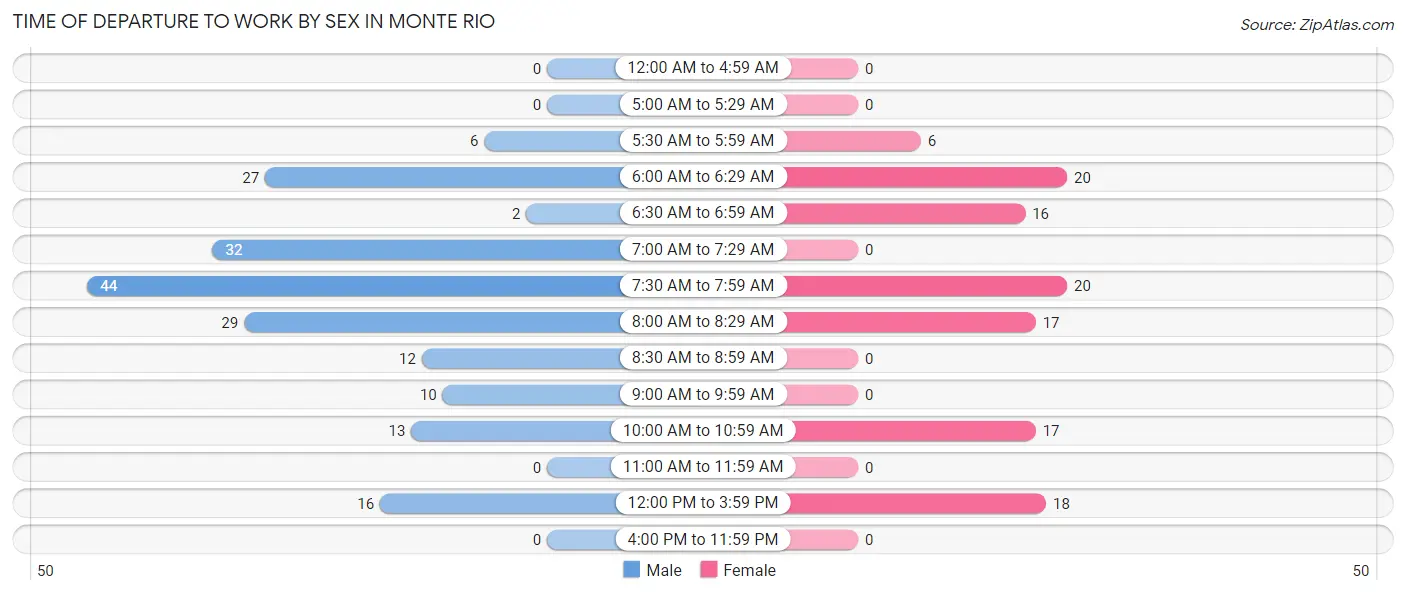
| Time of Departure | Male | Female |
| 12:00 AM to 4:59 AM | 0 (0.0%) | 0 (0.0%) |
| 5:00 AM to 5:29 AM | 0 (0.0%) | 0 (0.0%) |
| 5:30 AM to 5:59 AM | 6 (3.1%) | 6 (5.3%) |
| 6:00 AM to 6:29 AM | 27 (14.1%) | 20 (17.5%) |
| 6:30 AM to 6:59 AM | 2 (1.1%) | 16 (14.0%) |
| 7:00 AM to 7:29 AM | 32 (16.8%) | 0 (0.0%) |
| 7:30 AM to 7:59 AM | 44 (23.0%) | 20 (17.5%) |
| 8:00 AM to 8:29 AM | 29 (15.2%) | 17 (14.9%) |
| 8:30 AM to 8:59 AM | 12 (6.3%) | 0 (0.0%) |
| 9:00 AM to 9:59 AM | 10 (5.2%) | 0 (0.0%) |
| 10:00 AM to 10:59 AM | 13 (6.8%) | 17 (14.9%) |
| 11:00 AM to 11:59 AM | 0 (0.0%) | 0 (0.0%) |
| 12:00 PM to 3:59 PM | 16 (8.4%) | 18 (15.8%) |
| 4:00 PM to 11:59 PM | 0 (0.0%) | 0 (0.0%) |
| Total | 191 (100.0%) | 114 (100.0%) |
Housing Occupancy in Monte Rio
Occupancy by Ownership in Monte Rio
Of the total 427 dwellings in Monte Rio, owner-occupied units account for 295 (69.1%), while renter-occupied units make up 132 (30.9%).
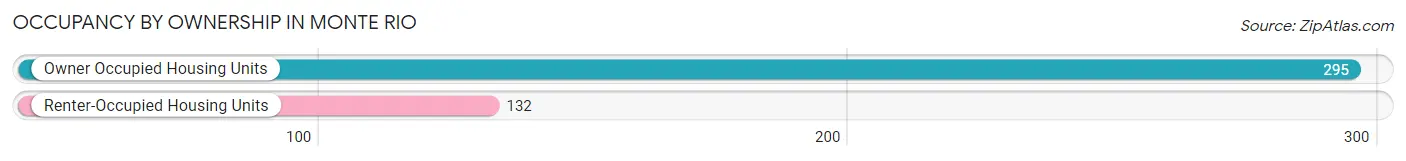
| Occupancy | # Housing Units | % Housing Units |
| Owner Occupied Housing Units | 295 | 69.1% |
| Renter-Occupied Housing Units | 132 | 30.9% |
| Total Occupied Housing Units | 427 | 100.0% |
Occupancy by Household Size in Monte Rio
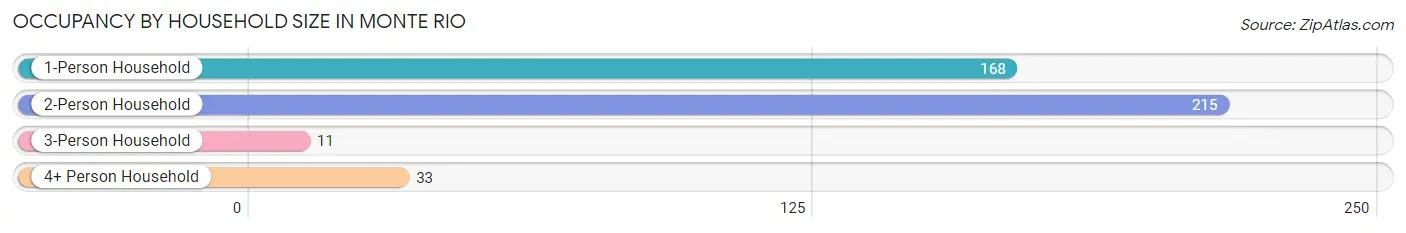
| Household Size | # Housing Units | % Housing Units |
| 1-Person Household | 168 | 39.3% |
| 2-Person Household | 215 | 50.3% |
| 3-Person Household | 11 | 2.6% |
| 4+ Person Household | 33 | 7.7% |
| Total Housing Units | 427 | 100.0% |
Occupancy by Ownership by Household Size in Monte Rio
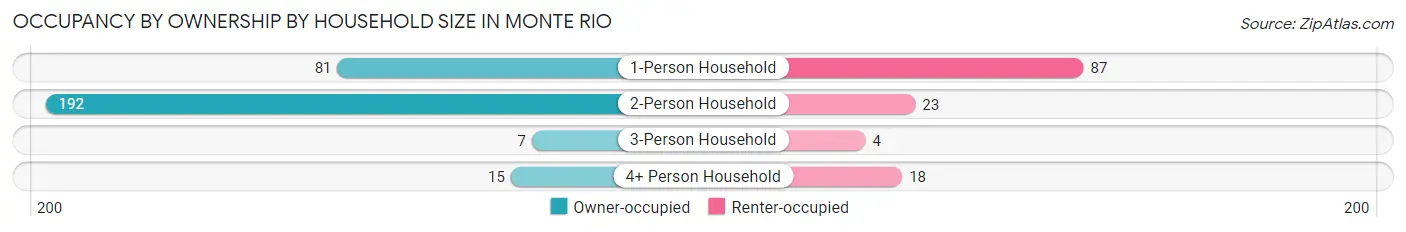
| Household Size | Owner-occupied | Renter-occupied |
| 1-Person Household | 81 (48.2%) | 87 (51.8%) |
| 2-Person Household | 192 (89.3%) | 23 (10.7%) |
| 3-Person Household | 7 (63.6%) | 4 (36.4%) |
| 4+ Person Household | 15 (45.5%) | 18 (54.5%) |
| Total Housing Units | 295 (69.1%) | 132 (30.9%) |
Occupancy by Educational Attainment in Monte Rio
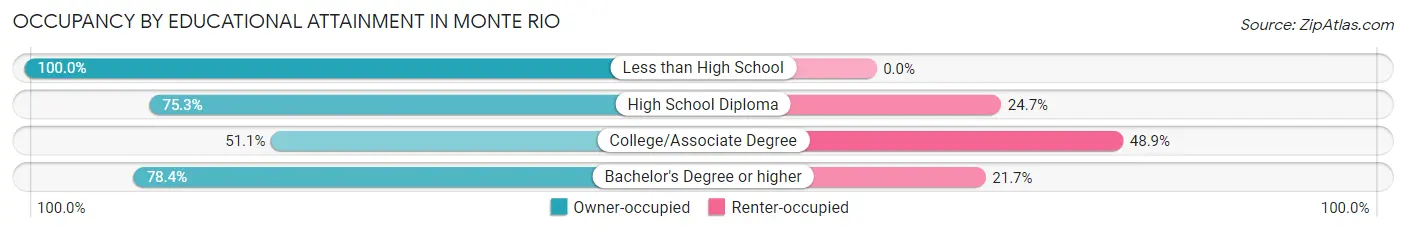
| Household Size | Owner-occupied | Renter-occupied |
| Less than High School | 3 (100.0%) | 0 (0.0%) |
| High School Diploma | 70 (75.3%) | 23 (24.7%) |
| College/Associate Degree | 70 (51.1%) | 67 (48.9%) |
| Bachelor's Degree or higher | 152 (78.3%) | 42 (21.6%) |
Occupancy by Age of Householder in Monte Rio
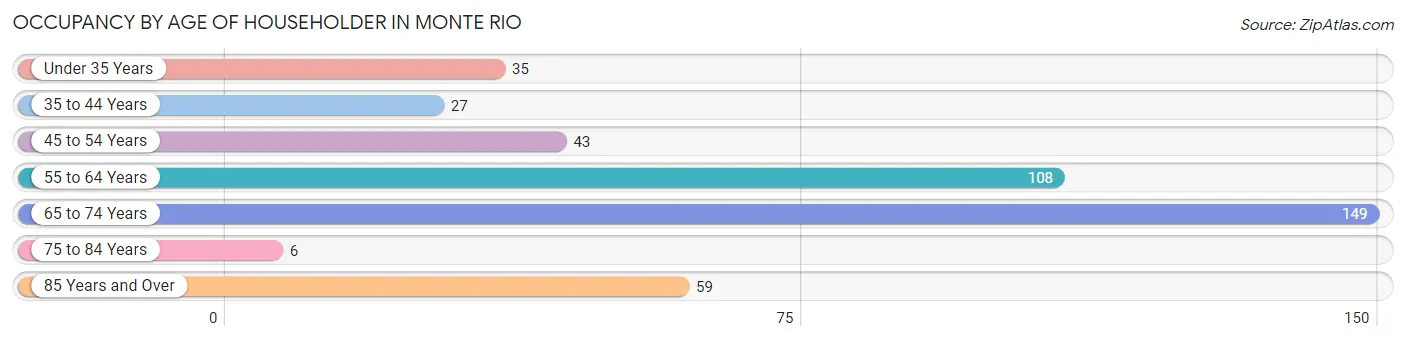
| Age Bracket | # Households | % Households |
| Under 35 Years | 35 | 8.2% |
| 35 to 44 Years | 27 | 6.3% |
| 45 to 54 Years | 43 | 10.1% |
| 55 to 64 Years | 108 | 25.3% |
| 65 to 74 Years | 149 | 34.9% |
| 75 to 84 Years | 6 | 1.4% |
| 85 Years and Over | 59 | 13.8% |
| Total | 427 | 100.0% |
Housing Finances in Monte Rio
Median Income by Occupancy in Monte Rio
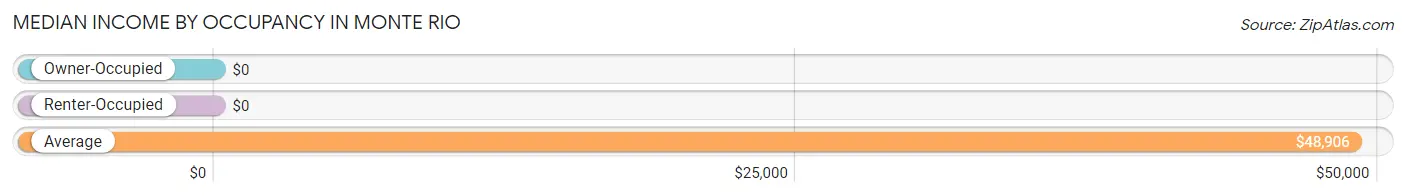
| Occupancy Type | # Households | Median Income |
| Owner-Occupied | 295 (69.1%) | $0 |
| Renter-Occupied | 132 (30.9%) | $0 |
| Average | 427 (100.0%) | $48,906 |
Occupancy by Householder Income Bracket in Monte Rio
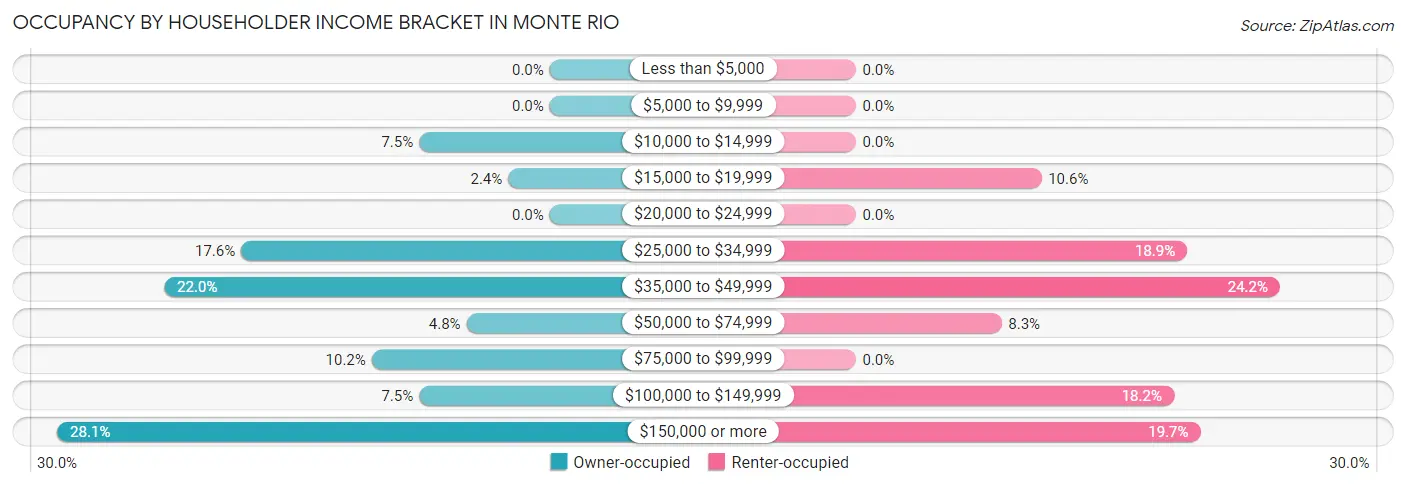
| Income Bracket | Owner-occupied | Renter-occupied |
| Less than $5,000 | 0 (0.0%) | 0 (0.0%) |
| $5,000 to $9,999 | 0 (0.0%) | 0 (0.0%) |
| $10,000 to $14,999 | 22 (7.5%) | 0 (0.0%) |
| $15,000 to $19,999 | 7 (2.4%) | 14 (10.6%) |
| $20,000 to $24,999 | 0 (0.0%) | 0 (0.0%) |
| $25,000 to $34,999 | 52 (17.6%) | 25 (18.9%) |
| $35,000 to $49,999 | 65 (22.0%) | 32 (24.2%) |
| $50,000 to $74,999 | 14 (4.8%) | 11 (8.3%) |
| $75,000 to $99,999 | 30 (10.2%) | 0 (0.0%) |
| $100,000 to $149,999 | 22 (7.5%) | 24 (18.2%) |
| $150,000 or more | 83 (28.1%) | 26 (19.7%) |
| Total | 295 (100.0%) | 132 (100.0%) |
Monthly Housing Cost Tiers in Monte Rio
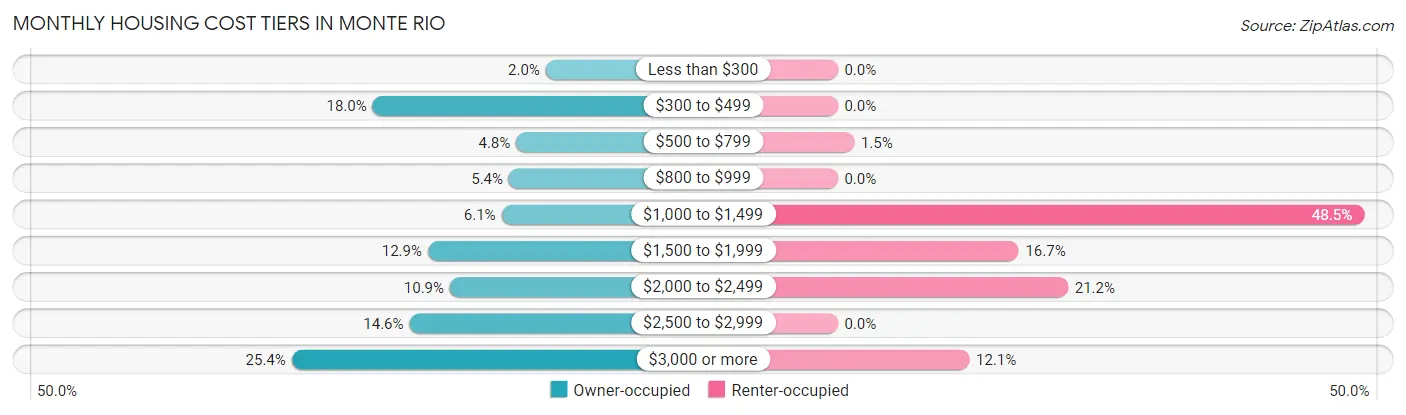
| Monthly Cost | Owner-occupied | Renter-occupied |
| Less than $300 | 6 (2.0%) | 0 (0.0%) |
| $300 to $499 | 53 (18.0%) | 0 (0.0%) |
| $500 to $799 | 14 (4.8%) | 2 (1.5%) |
| $800 to $999 | 16 (5.4%) | 0 (0.0%) |
| $1,000 to $1,499 | 18 (6.1%) | 64 (48.5%) |
| $1,500 to $1,999 | 38 (12.9%) | 22 (16.7%) |
| $2,000 to $2,499 | 32 (10.8%) | 28 (21.2%) |
| $2,500 to $2,999 | 43 (14.6%) | 0 (0.0%) |
| $3,000 or more | 75 (25.4%) | 16 (12.1%) |
| Total | 295 (100.0%) | 132 (100.0%) |
Physical Housing Characteristics in Monte Rio
Housing Structures in Monte Rio
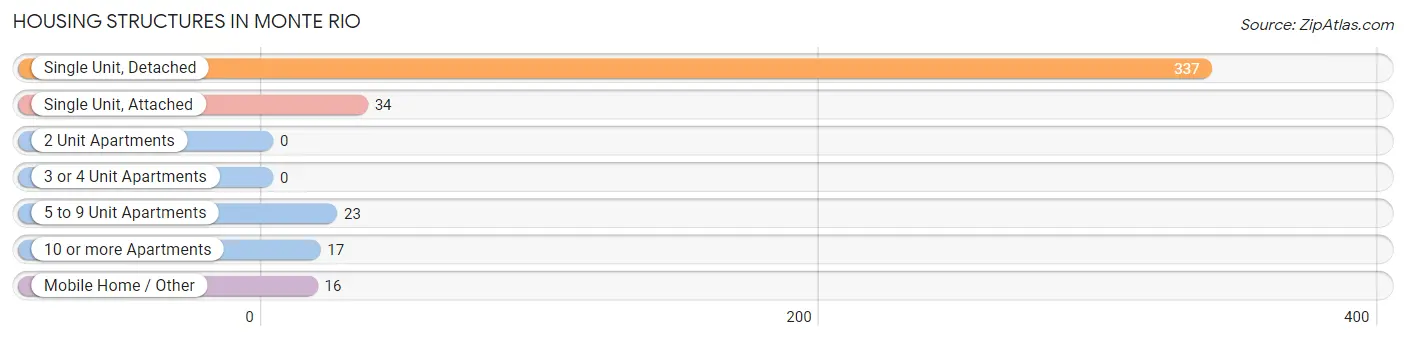
| Structure Type | # Housing Units | % Housing Units |
| Single Unit, Detached | 337 | 78.9% |
| Single Unit, Attached | 34 | 8.0% |
| 2 Unit Apartments | 0 | 0.0% |
| 3 or 4 Unit Apartments | 0 | 0.0% |
| 5 to 9 Unit Apartments | 23 | 5.4% |
| 10 or more Apartments | 17 | 4.0% |
| Mobile Home / Other | 16 | 3.7% |
| Total | 427 | 100.0% |
Housing Structures by Occupancy in Monte Rio
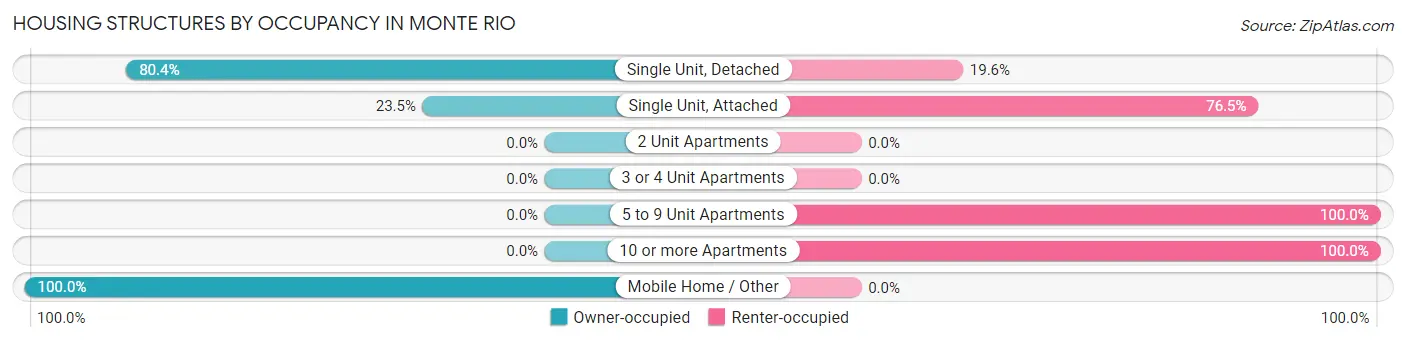
| Structure Type | Owner-occupied | Renter-occupied |
| Single Unit, Detached | 271 (80.4%) | 66 (19.6%) |
| Single Unit, Attached | 8 (23.5%) | 26 (76.5%) |
| 2 Unit Apartments | 0 (0.0%) | 0 (0.0%) |
| 3 or 4 Unit Apartments | 0 (0.0%) | 0 (0.0%) |
| 5 to 9 Unit Apartments | 0 (0.0%) | 23 (100.0%) |
| 10 or more Apartments | 0 (0.0%) | 17 (100.0%) |
| Mobile Home / Other | 16 (100.0%) | 0 (0.0%) |
| Total | 295 (69.1%) | 132 (30.9%) |
Housing Structures by Number of Rooms in Monte Rio
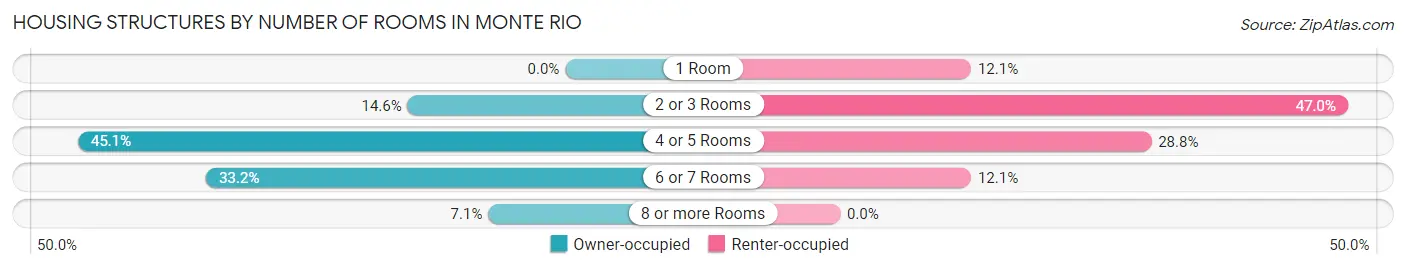
| Number of Rooms | Owner-occupied | Renter-occupied |
| 1 Room | 0 (0.0%) | 16 (12.1%) |
| 2 or 3 Rooms | 43 (14.6%) | 62 (47.0%) |
| 4 or 5 Rooms | 133 (45.1%) | 38 (28.8%) |
| 6 or 7 Rooms | 98 (33.2%) | 16 (12.1%) |
| 8 or more Rooms | 21 (7.1%) | 0 (0.0%) |
| Total | 295 (100.0%) | 132 (100.0%) |
Housing Structure by Heating Type in Monte Rio
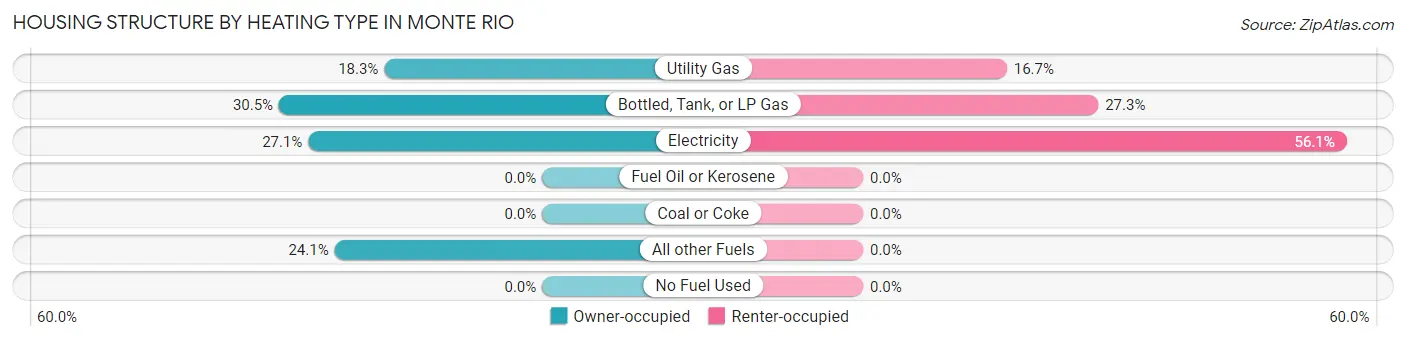
| Heating Type | Owner-occupied | Renter-occupied |
| Utility Gas | 54 (18.3%) | 22 (16.7%) |
| Bottled, Tank, or LP Gas | 90 (30.5%) | 36 (27.3%) |
| Electricity | 80 (27.1%) | 74 (56.1%) |
| Fuel Oil or Kerosene | 0 (0.0%) | 0 (0.0%) |
| Coal or Coke | 0 (0.0%) | 0 (0.0%) |
| All other Fuels | 71 (24.1%) | 0 (0.0%) |
| No Fuel Used | 0 (0.0%) | 0 (0.0%) |
| Total | 295 (100.0%) | 132 (100.0%) |
Household Vehicle Usage in Monte Rio
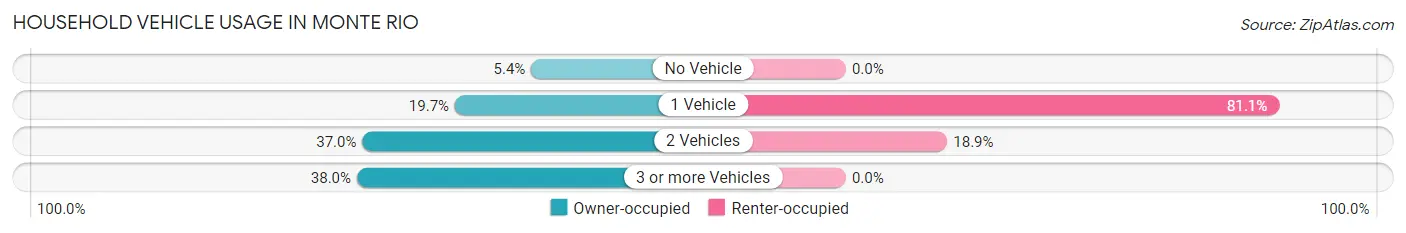
| Vehicles per Household | Owner-occupied | Renter-occupied |
| No Vehicle | 16 (5.4%) | 0 (0.0%) |
| 1 Vehicle | 58 (19.7%) | 107 (81.1%) |
| 2 Vehicles | 109 (36.9%) | 25 (18.9%) |
| 3 or more Vehicles | 112 (38.0%) | 0 (0.0%) |
| Total | 295 (100.0%) | 132 (100.0%) |
Real Estate & Mortgages in Monte Rio
Real Estate and Mortgage Overview in Monte Rio
| Characteristic | Without Mortgage | With Mortgage |
| Housing Units | 89 | 206 |
| Median Property Value | $809,000 | $633,900 |
| Median Household Income | $45,873 | $83 |
| Monthly Housing Costs | $473 | $75 |
| Real Estate Taxes | $1,241 | $0 |
Property Value by Mortgage Status in Monte Rio
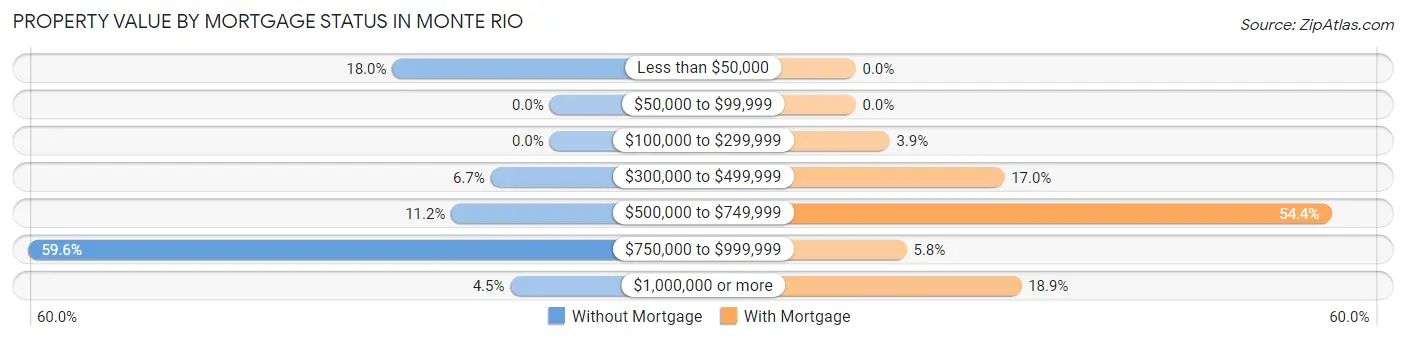
| Property Value | Without Mortgage | With Mortgage |
| Less than $50,000 | 16 (18.0%) | 0 (0.0%) |
| $50,000 to $99,999 | 0 (0.0%) | 0 (0.0%) |
| $100,000 to $299,999 | 0 (0.0%) | 8 (3.9%) |
| $300,000 to $499,999 | 6 (6.7%) | 35 (17.0%) |
| $500,000 to $749,999 | 10 (11.2%) | 112 (54.4%) |
| $750,000 to $999,999 | 53 (59.6%) | 12 (5.8%) |
| $1,000,000 or more | 4 (4.5%) | 39 (18.9%) |
| Total | 89 (100.0%) | 206 (100.0%) |
Household Income by Mortgage Status in Monte Rio
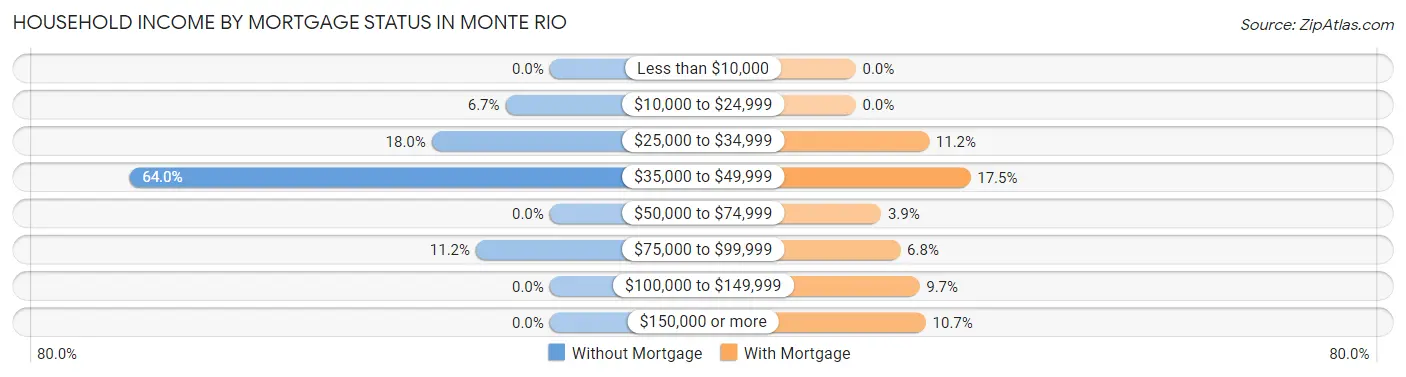
| Household Income | Without Mortgage | With Mortgage |
| Less than $10,000 | 0 (0.0%) | 0 (0.0%) |
| $10,000 to $24,999 | 6 (6.7%) | 0 (0.0%) |
| $25,000 to $34,999 | 16 (18.0%) | 23 (11.2%) |
| $35,000 to $49,999 | 57 (64.0%) | 36 (17.5%) |
| $50,000 to $74,999 | 0 (0.0%) | 8 (3.9%) |
| $75,000 to $99,999 | 10 (11.2%) | 14 (6.8%) |
| $100,000 to $149,999 | 0 (0.0%) | 20 (9.7%) |
| $150,000 or more | 0 (0.0%) | 22 (10.7%) |
| Total | 89 (100.0%) | 206 (100.0%) |
Property Value to Household Income Ratio in Monte Rio
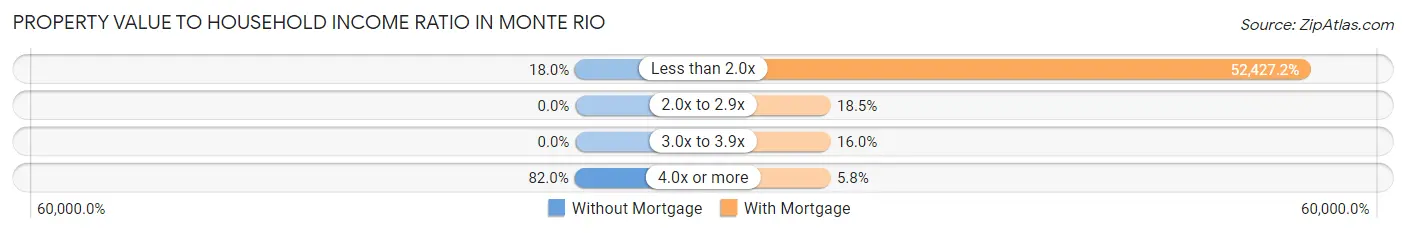
| Value-to-Income Ratio | Without Mortgage | With Mortgage |
| Less than 2.0x | 16 (18.0%) | 108,000 (52,427.2%) |
| 2.0x to 2.9x | 0 (0.0%) | 38 (18.4%) |
| 3.0x to 3.9x | 0 (0.0%) | 33 (16.0%) |
| 4.0x or more | 73 (82.0%) | 12 (5.8%) |
| Total | 89 (100.0%) | 206 (100.0%) |
Real Estate Taxes by Mortgage Status in Monte Rio
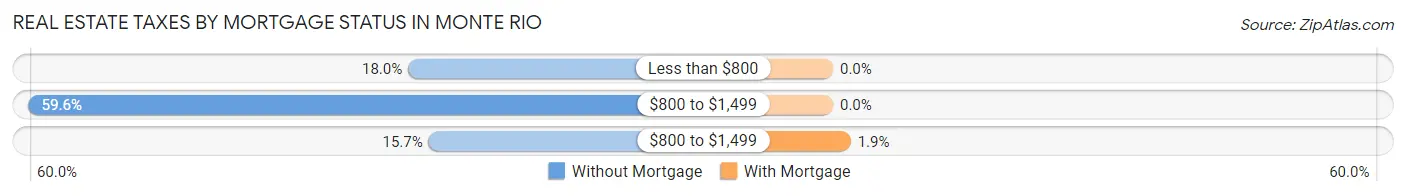
| Property Taxes | Without Mortgage | With Mortgage |
| Less than $800 | 16 (18.0%) | 0 (0.0%) |
| $800 to $1,499 | 53 (59.6%) | 0 (0.0%) |
| $800 to $1,499 | 14 (15.7%) | 4 (1.9%) |
| Total | 89 (100.0%) | 206 (100.0%) |
Health & Disability in Monte Rio
Health Insurance Coverage by Age in Monte Rio
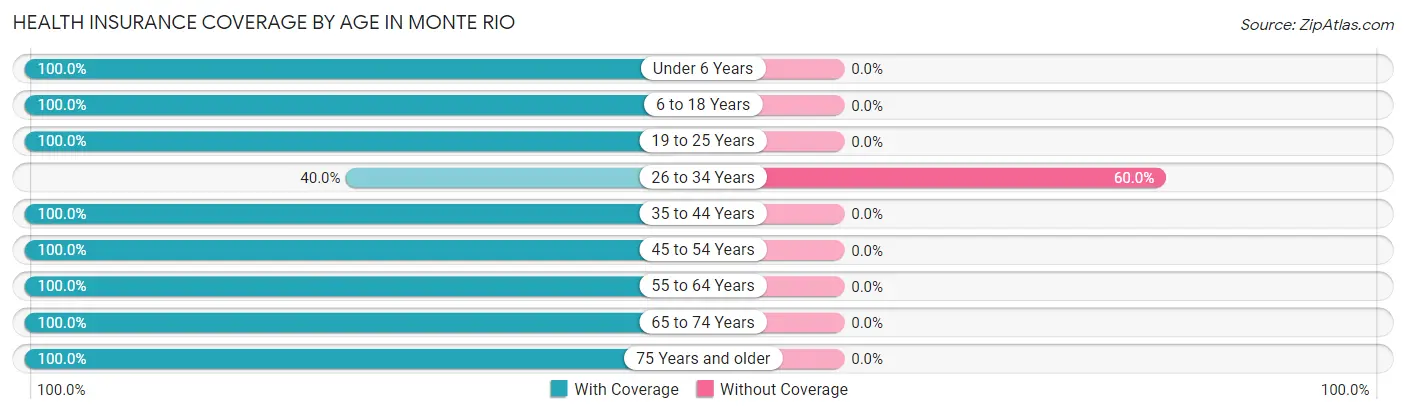
| Age Bracket | With Coverage | Without Coverage |
| Under 6 Years | 3 (100.0%) | 0 (0.0%) |
| 6 to 18 Years | 37 (100.0%) | 0 (0.0%) |
| 19 to 25 Years | 46 (100.0%) | 0 (0.0%) |
| 26 to 34 Years | 8 (40.0%) | 12 (60.0%) |
| 35 to 44 Years | 77 (100.0%) | 0 (0.0%) |
| 45 to 54 Years | 61 (100.0%) | 0 (0.0%) |
| 55 to 64 Years | 248 (100.0%) | 0 (0.0%) |
| 65 to 74 Years | 208 (100.0%) | 0 (0.0%) |
| 75 Years and older | 71 (100.0%) | 0 (0.0%) |
| Total | 759 (98.4%) | 12 (1.6%) |
Health Insurance Coverage by Citizenship Status in Monte Rio
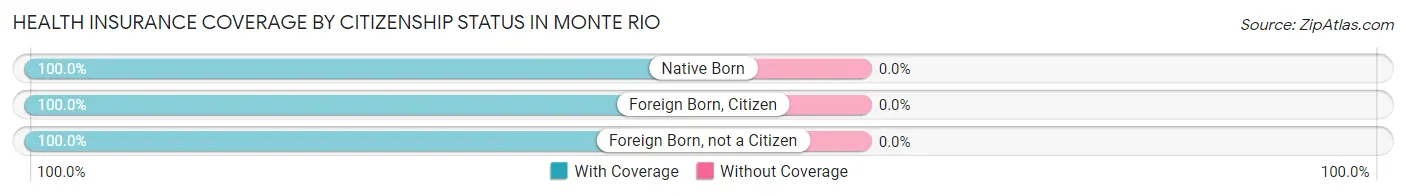
| Citizenship Status | With Coverage | Without Coverage |
| Native Born | 3 (100.0%) | 0 (0.0%) |
| Foreign Born, Citizen | 37 (100.0%) | 0 (0.0%) |
| Foreign Born, not a Citizen | 46 (100.0%) | 0 (0.0%) |
Health Insurance Coverage by Household Income in Monte Rio
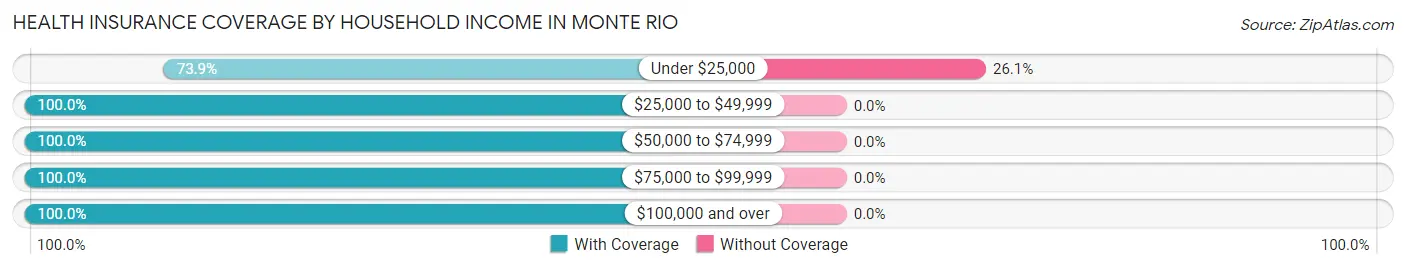
| Household Income | With Coverage | Without Coverage |
| Under $25,000 | 34 (73.9%) | 12 (26.1%) |
| $25,000 to $49,999 | 303 (100.0%) | 0 (0.0%) |
| $50,000 to $74,999 | 25 (100.0%) | 0 (0.0%) |
| $75,000 to $99,999 | 76 (100.0%) | 0 (0.0%) |
| $100,000 and over | 321 (100.0%) | 0 (0.0%) |
Public vs Private Health Insurance Coverage by Age in Monte Rio
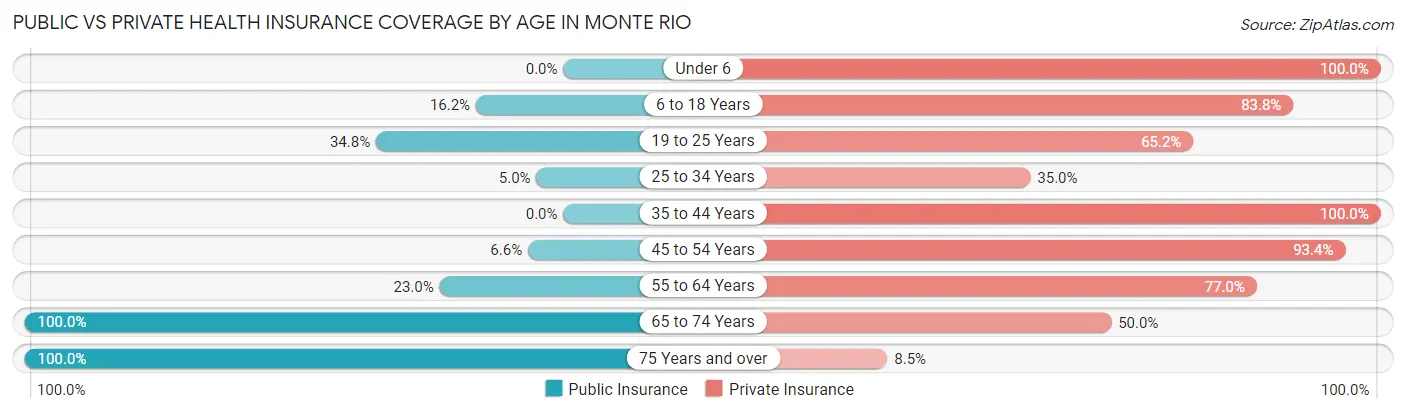
| Age Bracket | Public Insurance | Private Insurance |
| Under 6 | 0 (0.0%) | 3 (100.0%) |
| 6 to 18 Years | 6 (16.2%) | 31 (83.8%) |
| 19 to 25 Years | 16 (34.8%) | 30 (65.2%) |
| 25 to 34 Years | 1 (5.0%) | 7 (35.0%) |
| 35 to 44 Years | 0 (0.0%) | 77 (100.0%) |
| 45 to 54 Years | 4 (6.6%) | 57 (93.4%) |
| 55 to 64 Years | 57 (23.0%) | 191 (77.0%) |
| 65 to 74 Years | 208 (100.0%) | 104 (50.0%) |
| 75 Years and over | 71 (100.0%) | 6 (8.5%) |
| Total | 363 (47.1%) | 506 (65.6%) |
Disability Status by Sex by Age in Monte Rio
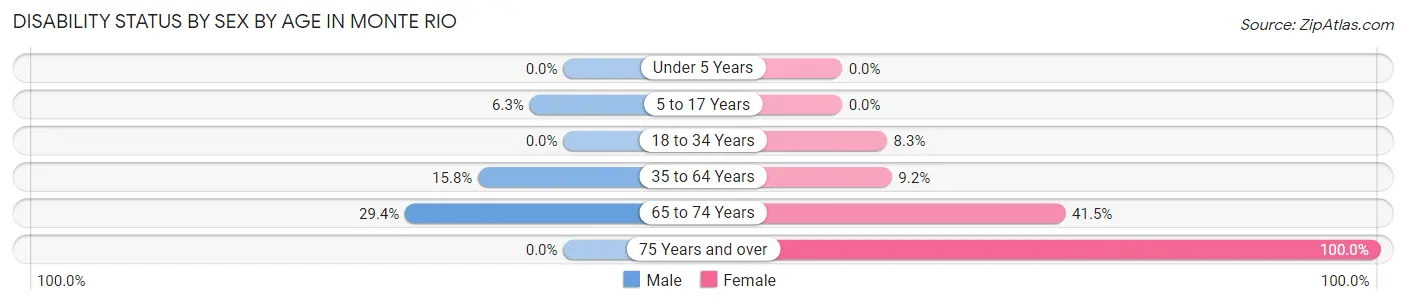
| Age Bracket | Male | Female |
| Under 5 Years | 0 (0.0%) | 0 (0.0%) |
| 5 to 17 Years | 1 (6.2%) | 0 (0.0%) |
| 18 to 34 Years | 0 (0.0%) | 1 (8.3%) |
| 35 to 64 Years | 37 (15.8%) | 14 (9.2%) |
| 65 to 74 Years | 37 (29.4%) | 34 (41.5%) |
| 75 Years and over | 0 (0.0%) | 65 (100.0%) |
Disability Class by Sex by Age in Monte Rio
Disability Class: Hearing Difficulty
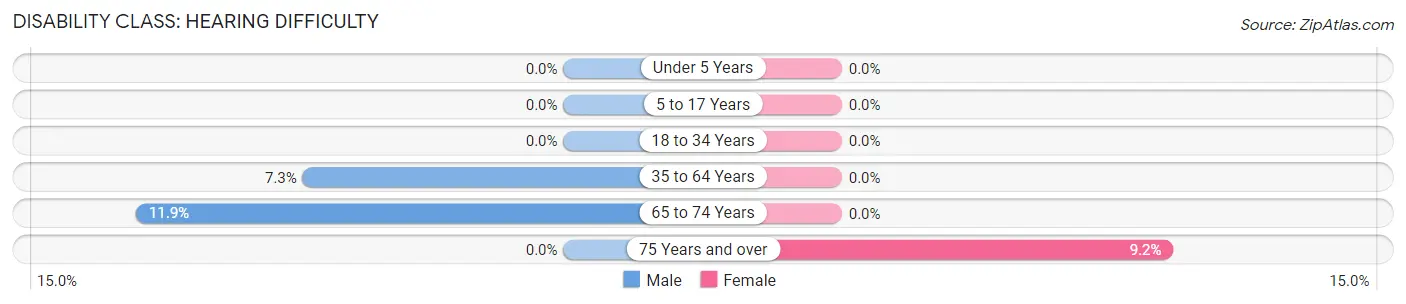
| Age Bracket | Male | Female |
| Under 5 Years | 0 (0.0%) | 0 (0.0%) |
| 5 to 17 Years | 0 (0.0%) | 0 (0.0%) |
| 18 to 34 Years | 0 (0.0%) | 0 (0.0%) |
| 35 to 64 Years | 17 (7.3%) | 0 (0.0%) |
| 65 to 74 Years | 15 (11.9%) | 0 (0.0%) |
| 75 Years and over | 0 (0.0%) | 6 (9.2%) |
Disability Class: Vision Difficulty
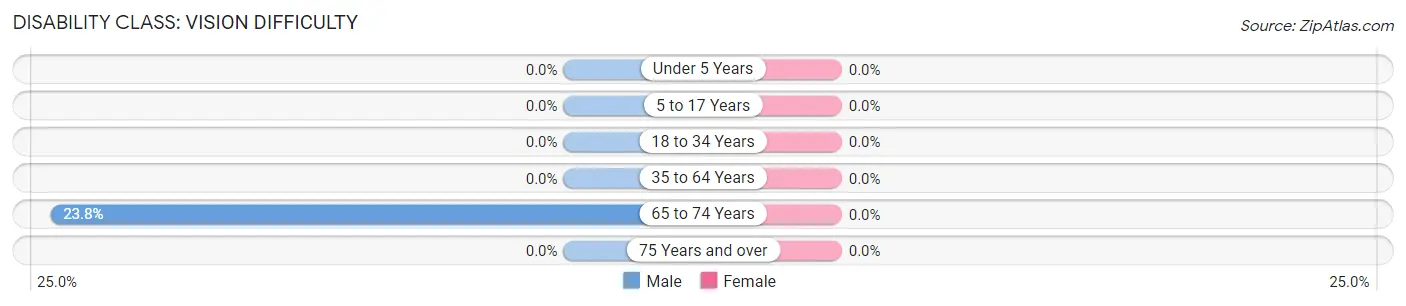
| Age Bracket | Male | Female |
| Under 5 Years | 0 (0.0%) | 0 (0.0%) |
| 5 to 17 Years | 0 (0.0%) | 0 (0.0%) |
| 18 to 34 Years | 0 (0.0%) | 0 (0.0%) |
| 35 to 64 Years | 0 (0.0%) | 0 (0.0%) |
| 65 to 74 Years | 30 (23.8%) | 0 (0.0%) |
| 75 Years and over | 0 (0.0%) | 0 (0.0%) |
Disability Class: Cognitive Difficulty
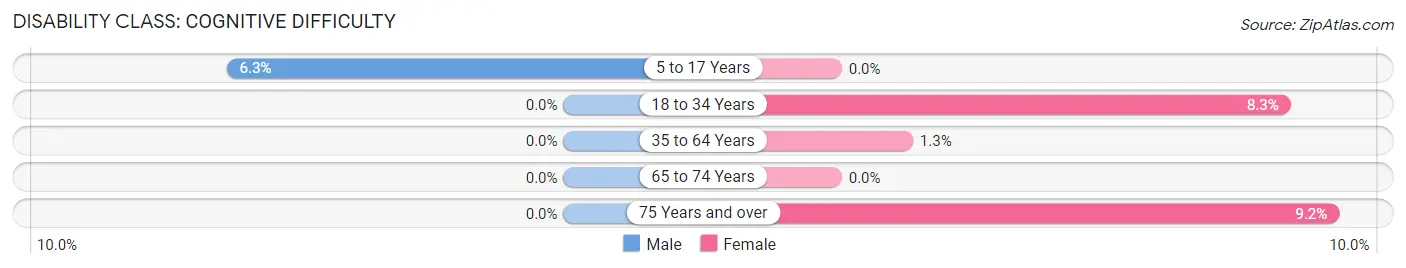
| Age Bracket | Male | Female |
| 5 to 17 Years | 1 (6.2%) | 0 (0.0%) |
| 18 to 34 Years | 0 (0.0%) | 1 (8.3%) |
| 35 to 64 Years | 0 (0.0%) | 2 (1.3%) |
| 65 to 74 Years | 0 (0.0%) | 0 (0.0%) |
| 75 Years and over | 0 (0.0%) | 6 (9.2%) |
Disability Class: Ambulatory Difficulty
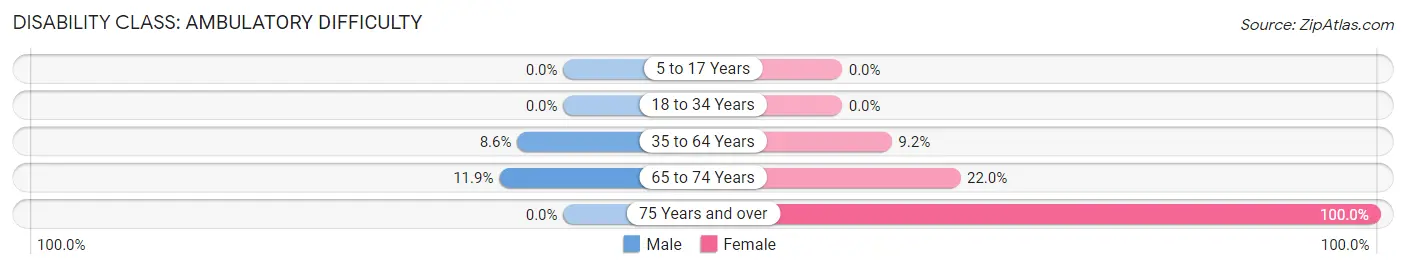
| Age Bracket | Male | Female |
| 5 to 17 Years | 0 (0.0%) | 0 (0.0%) |
| 18 to 34 Years | 0 (0.0%) | 0 (0.0%) |
| 35 to 64 Years | 20 (8.6%) | 14 (9.2%) |
| 65 to 74 Years | 15 (11.9%) | 18 (22.0%) |
| 75 Years and over | 0 (0.0%) | 65 (100.0%) |
Disability Class: Self-Care Difficulty
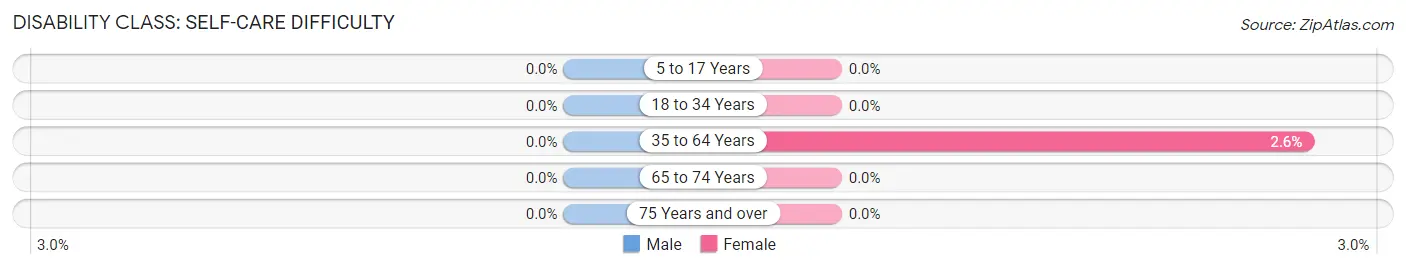
| Age Bracket | Male | Female |
| 5 to 17 Years | 0 (0.0%) | 0 (0.0%) |
| 18 to 34 Years | 0 (0.0%) | 0 (0.0%) |
| 35 to 64 Years | 0 (0.0%) | 4 (2.6%) |
| 65 to 74 Years | 0 (0.0%) | 0 (0.0%) |
| 75 Years and over | 0 (0.0%) | 0 (0.0%) |
Technology Access in Monte Rio
Computing Device Access in Monte Rio
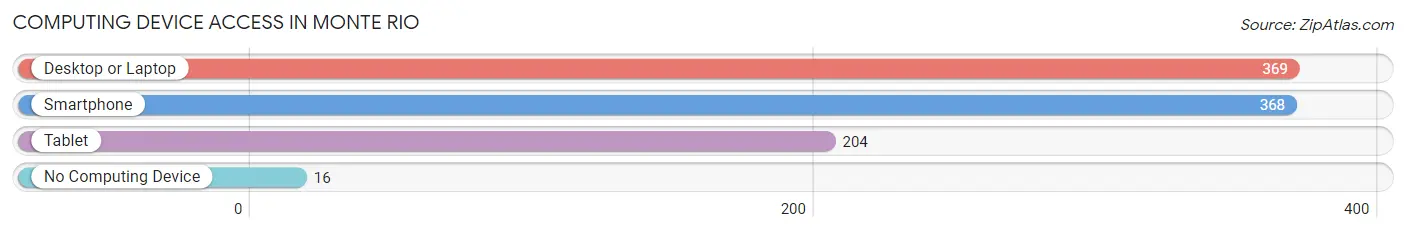
| Device Type | # Households | % Households |
| Desktop or Laptop | 369 | 86.4% |
| Smartphone | 368 | 86.2% |
| Tablet | 204 | 47.8% |
| No Computing Device | 16 | 3.7% |
| Total | 427 | 100.0% |
Internet Access in Monte Rio
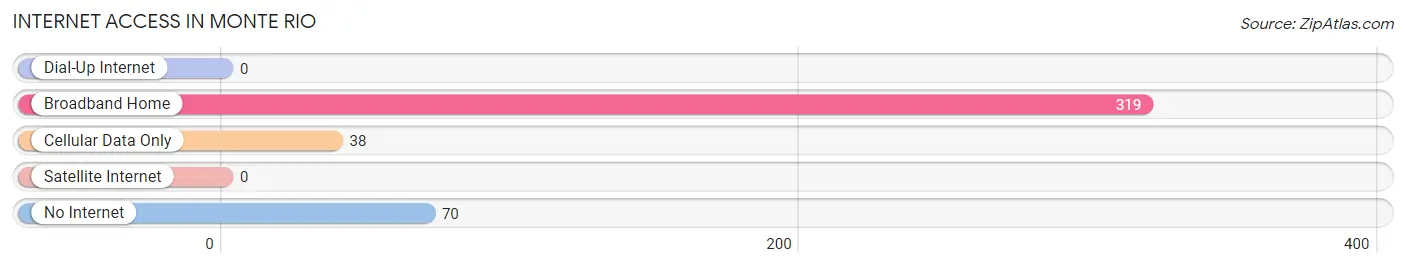
| Internet Type | # Households | % Households |
| Dial-Up Internet | 0 | 0.0% |
| Broadband Home | 319 | 74.7% |
| Cellular Data Only | 38 | 8.9% |
| Satellite Internet | 0 | 0.0% |
| No Internet | 70 | 16.4% |
| Total | 427 | 100.0% |
Monte Rio Summary
Monte Rio is a small unincorporated community located in Sonoma County, California, United States. It is situated on the Russian River, approximately 60 miles north of San Francisco. The population was 1,152 at the 2010 census.
History
Monte Rio was originally inhabited by the Pomo people, who lived in the area for thousands of years before the arrival of Europeans. The first Europeans to settle in the area were Russian fur traders, who established a trading post in the area in 1812. The town was later founded in the 1850s by Italian immigrants, who named it Monte Rio, meaning “mountain river” in Italian.
The town was a popular destination for vacationers in the late 19th and early 20th centuries, and was home to several resorts and summer homes. The town was also home to a number of movie stars, including Charlie Chaplin, who owned a summer home in Monte Rio.
Geography
Monte Rio is located in the Russian River Valley, approximately 60 miles north of San Francisco. The town is situated on the banks of the Russian River, and is surrounded by rolling hills and redwood forests. The town is located at an elevation of approximately 200 feet above sea level.
Economy
The economy of Monte Rio is largely based on tourism. The town is home to several resorts and vacation homes, and is a popular destination for visitors from the San Francisco Bay Area. The town is also home to a number of small businesses, including restaurants, shops, and galleries.
Demographics
As of the 2010 census, the population of Monte Rio was 1,152. The racial makeup of the town was 87.3% White, 0.7% African American, 0.7% Native American, 0.7% Asian, 0.2% Pacific Islander, 8.2% from other races, and 2.1% from two or more races. Hispanic or Latino of any race were 16.2% of the population.
The median income for a household in Monte Rio was $45,000, and the median income for a family was $50,000. The per capita income for the town was $22,000. About 10.3% of families and 13.2% of the population were below the poverty line, including 17.2% of those under age 18 and 8.3% of those age 65 or over.
Common Questions
What is Per Capita Income in Monte Rio?
Per Capita income in Monte Rio is $63,325.
What is the Median Household income in Monte Rio?
Median Household Income in Monte Rio is $48,906.
What is Family Income Deficit in Monte Rio?
Family Income Deficit in Monte Rio is $5,217.
Families that are below poverty line in Monte Rio earn $5,217 less on average than the poverty threshold level.
What is Inequality or Gini Index in Monte Rio?
Inequality or Gini Index in Monte Rio is 0.53.
What is the Total Population of Monte Rio?
Total Population of Monte Rio is 771.
What is the Total Male Population of Monte Rio?
Total Male Population of Monte Rio is 436.
What is the Total Female Population of Monte Rio?
Total Female Population of Monte Rio is 335.
What is the Ratio of Males per 100 Females in Monte Rio?
There are 130.15 Males per 100 Females in Monte Rio.
What is the Ratio of Females per 100 Males in Monte Rio?
There are 76.83 Females per 100 Males in Monte Rio.
What is the Median Population Age in Monte Rio?
Median Population Age in Monte Rio is 61.2 Years.
What is the Average Family Size in Monte Rio
Average Family Size in Monte Rio is 2.3 People.
What is the Average Household Size in Monte Rio
Average Household Size in Monte Rio is 1.8 People.
How Large is the Labor Force in Monte Rio?
There are 413 People in the Labor Forcein in Monte Rio.
What is the Percentage of People in the Labor Force in Monte Rio?
56.5% of People are in the Labor Force in Monte Rio.
What is the Unemployment Rate in Monte Rio?
Unemployment Rate in Monte Rio is 7.3%.