Middletown, CA Map & Demographics
Middletown Map
Middletown Overview
$44,188
PER CAPITA INCOME
$138,585
AVG FAMILY INCOME
$163,247
AVG HOUSEHOLD INCOME
0.33
INEQUALITY / GINI INDEX
1,748
TOTAL POPULATION
814
MALE POPULATION
934
FEMALE POPULATION
87.15
MALES / 100 FEMALES
114.74
FEMALES / 100 MALES
30.9
MEDIAN AGE
3.2
AVG FAMILY SIZE
3.0
AVG HOUSEHOLD SIZE
876
LABOR FORCE [ PEOPLE ]
69.0%
PERCENT IN LABOR FORCE
10.7%
UNEMPLOYMENT RATE
Middletown Zip Codes
Middletown Area Codes
Income in Middletown
Income Overview in Middletown
Per Capita Income in Middletown is $44,188, while median incomes of families and households are $138,585 and $163,247 respectively.
| Characteristic | Number | Measure |
| Per Capita Income | 1,748 | $44,188 |
| Median Family Income | 455 | $138,585 |
| Mean Family Income | 455 | $153,822 |
| Median Household Income | 579 | $163,247 |
| Mean Household Income | 579 | $144,643 |
| Income Deficit | 455 | $0 |
| Wage / Income Gap (%) | 1,748 | 0.00% |
| Wage / Income Gap ($) | 1,748 | 100.00¢ per $1 |
| Gini / Inequality Index | 1,748 | 0.33 |
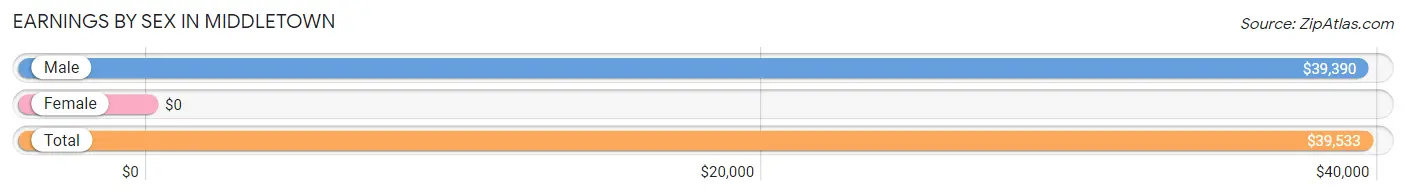
Earnings by Sex in Middletown
| Sex | Number | Average Earnings |
| Male | 467 (52.8%) | $39,390 |
| Female | 417 (47.2%) | $0 |
| Total | 884 (100.0%) | $39,533 |
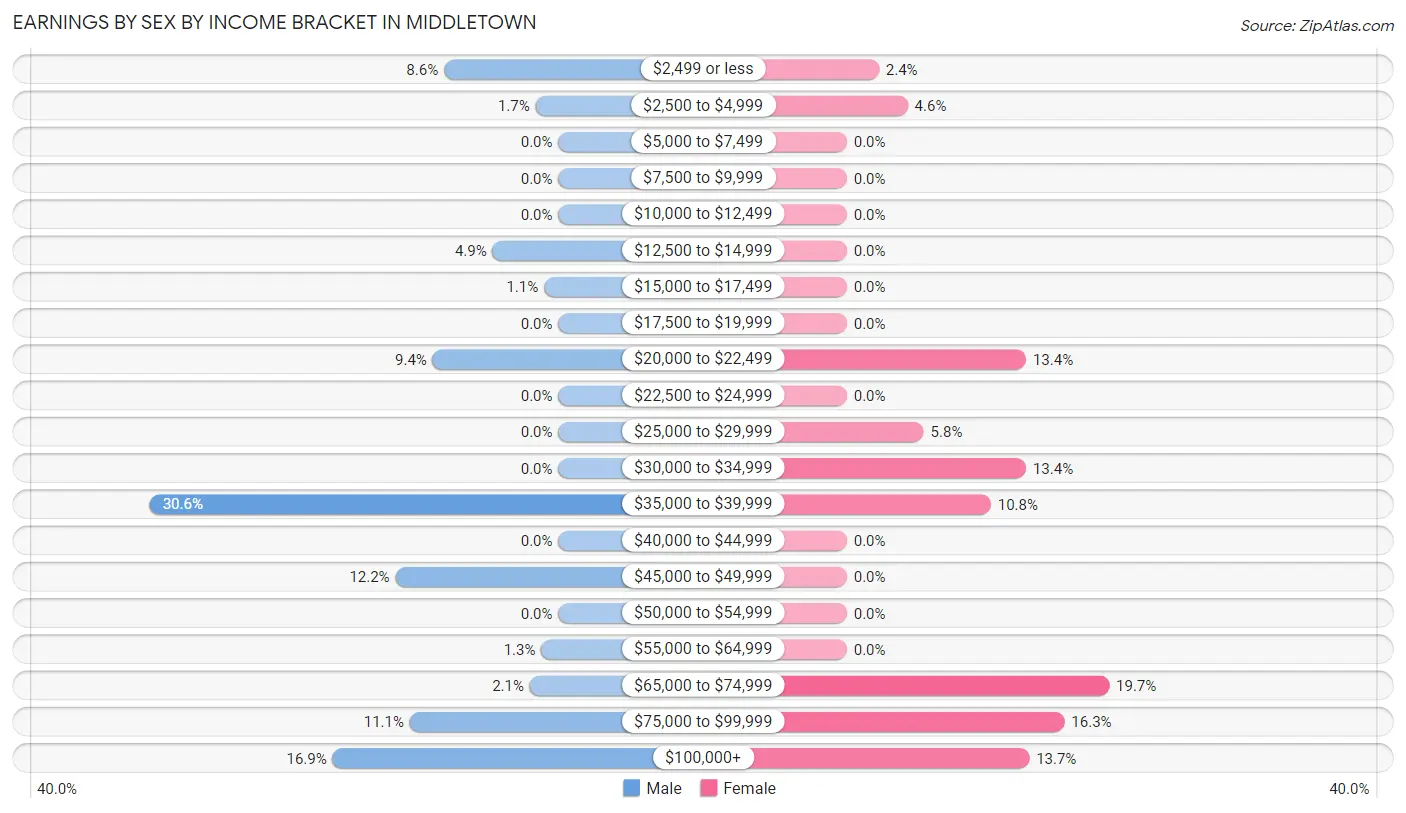
Earnings by Sex by Income Bracket in Middletown
The most common earnings brackets in Middletown are $35,000 to $39,999 for men (143 | 30.6%) and $65,000 to $74,999 for women (82 | 19.7%).
| Income | Male | Female |
| $2,499 or less | 40 (8.6%) | 10 (2.4%) |
| $2,500 to $4,999 | 8 (1.7%) | 19 (4.6%) |
| $5,000 to $7,499 | 0 (0.0%) | 0 (0.0%) |
| $7,500 to $9,999 | 0 (0.0%) | 0 (0.0%) |
| $10,000 to $12,499 | 0 (0.0%) | 0 (0.0%) |
| $12,500 to $14,999 | 23 (4.9%) | 0 (0.0%) |
| $15,000 to $17,499 | 5 (1.1%) | 0 (0.0%) |
| $17,500 to $19,999 | 0 (0.0%) | 0 (0.0%) |
| $20,000 to $22,499 | 44 (9.4%) | 56 (13.4%) |
| $22,500 to $24,999 | 0 (0.0%) | 0 (0.0%) |
| $25,000 to $29,999 | 0 (0.0%) | 24 (5.8%) |
| $30,000 to $34,999 | 0 (0.0%) | 56 (13.4%) |
| $35,000 to $39,999 | 143 (30.6%) | 45 (10.8%) |
| $40,000 to $44,999 | 0 (0.0%) | 0 (0.0%) |
| $45,000 to $49,999 | 57 (12.2%) | 0 (0.0%) |
| $50,000 to $54,999 | 0 (0.0%) | 0 (0.0%) |
| $55,000 to $64,999 | 6 (1.3%) | 0 (0.0%) |
| $65,000 to $74,999 | 10 (2.1%) | 82 (19.7%) |
| $75,000 to $99,999 | 52 (11.1%) | 68 (16.3%) |
| $100,000+ | 79 (16.9%) | 57 (13.7%) |
| Total | 467 (100.0%) | 417 (100.0%) |
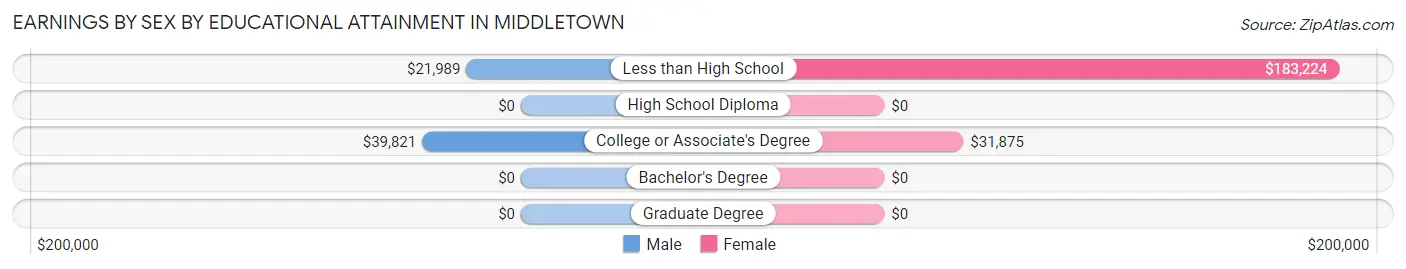
Earnings by Sex by Educational Attainment in Middletown
| Educational Attainment | Male Income | Female Income |
| Less than High School | $21,989 | $183,224 |
| High School Diploma | - | - |
| College or Associate's Degree | $39,821 | $31,875 |
| Bachelor's Degree | - | - |
| Graduate Degree | - | - |
| Total | $46,413 | $0 |
Family Income in Middletown
Family Income Brackets in Middletown
According to the Middletown family income data, there are 152 families falling into the $100,000 to $149,999 income range, which is the most common income bracket and makes up 33.4% of all families.
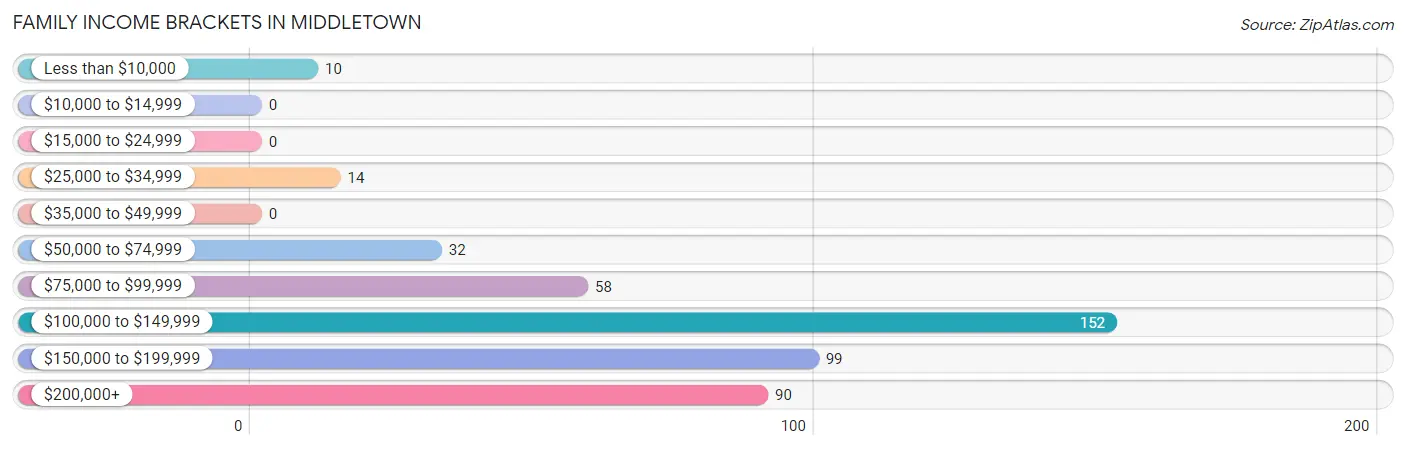
| Income Bracket | # Families | % Families |
| Less than $10,000 | 10 | 2.2% |
| $10,000 to $14,999 | 0 | 0.0% |
| $15,000 to $24,999 | 0 | 0.0% |
| $25,000 to $34,999 | 14 | 3.1% |
| $35,000 to $49,999 | 0 | 0.0% |
| $50,000 to $74,999 | 32 | 7.0% |
| $75,000 to $99,999 | 58 | 12.7% |
| $100,000 to $149,999 | 152 | 33.4% |
| $150,000 to $199,999 | 99 | 21.8% |
| $200,000+ | 90 | 19.8% |
Family Income by Famaliy Size in Middletown
3-person families (123 | 27.0%) account for the highest median family income in Middletown with $163,125 per family, while 2-person families (140 | 30.8%) have the highest median income of $67,188 per family member.
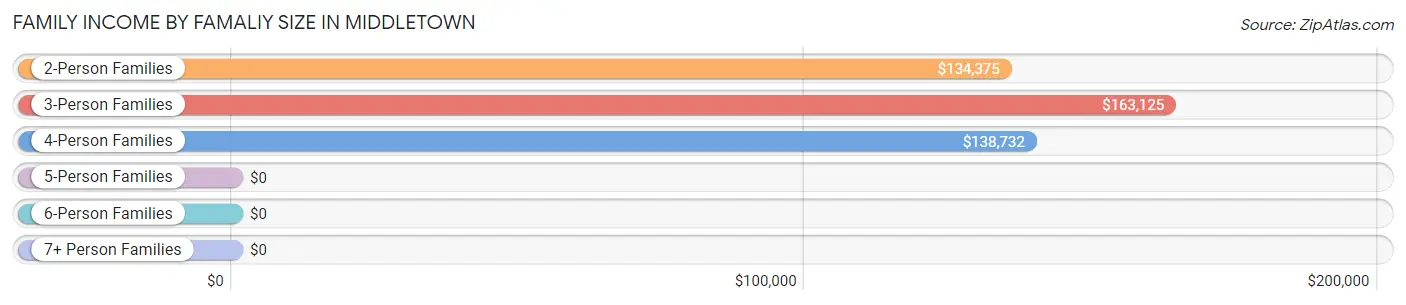
| Income Bracket | # Families | Median Income |
| 2-Person Families | 140 (30.8%) | $134,375 |
| 3-Person Families | 123 (27.0%) | $163,125 |
| 4-Person Families | 157 (34.5%) | $138,732 |
| 5-Person Families | 6 (1.3%) | $0 |
| 6-Person Families | 22 (4.8%) | $0 |
| 7+ Person Families | 7 (1.5%) | $0 |
| Total | 455 (100.0%) | $138,585 |
Family Income by Number of Earners in Middletown
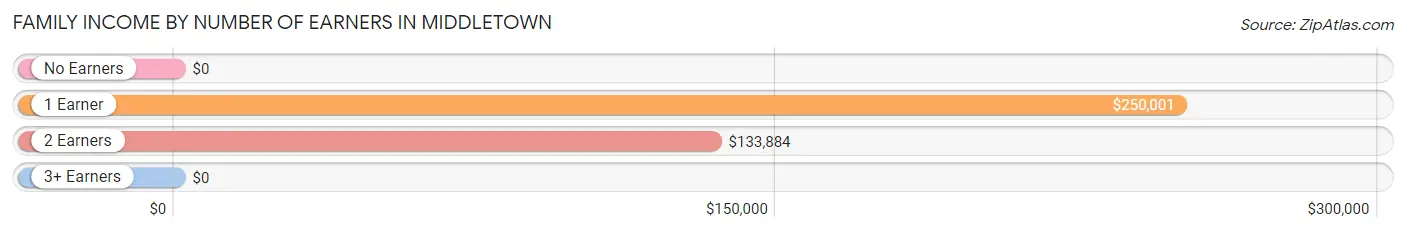
| Number of Earners | # Families | Median Income |
| No Earners | 24 (5.3%) | $0 |
| 1 Earner | 122 (26.8%) | $250,001 |
| 2 Earners | 234 (51.4%) | $133,884 |
| 3+ Earners | 75 (16.5%) | $0 |
| Total | 455 (100.0%) | $138,585 |
Household Income in Middletown
Household Income Brackets in Middletown
With 224 households falling in the category, the $150,000 to $199,999 income range is the most frequent in Middletown, accounting for 38.7% of all households.
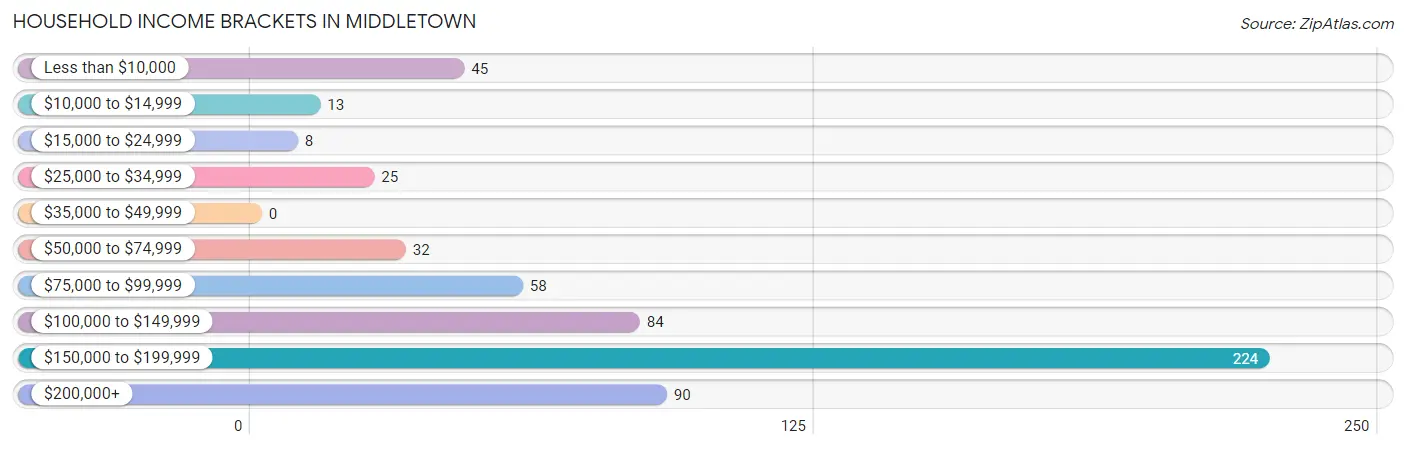
| Income Bracket | # Households | % Households |
| Less than $10,000 | 45 | 7.8% |
| $10,000 to $14,999 | 13 | 2.2% |
| $15,000 to $24,999 | 8 | 1.4% |
| $25,000 to $34,999 | 25 | 4.3% |
| $35,000 to $49,999 | 0 | 0.0% |
| $50,000 to $74,999 | 32 | 5.5% |
| $75,000 to $99,999 | 58 | 10.0% |
| $100,000 to $149,999 | 84 | 14.5% |
| $150,000 to $199,999 | 224 | 38.7% |
| $200,000+ | 90 | 15.5% |
Household Income by Householder Age in Middletown
The median household income in Middletown is $163,247, with the highest median household income of $176,324 found in the 45 to 64 years age bracket for the primary householder. A total of 266 households (45.9%) fall into this category.
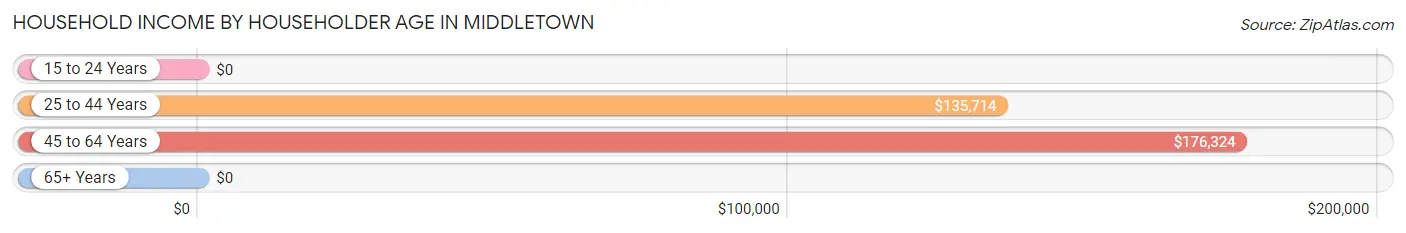
| Income Bracket | # Households | Median Income |
| 15 to 24 Years | 0 (0.0%) | $0 |
| 25 to 44 Years | 204 (35.2%) | $135,714 |
| 45 to 64 Years | 266 (45.9%) | $176,324 |
| 65+ Years | 109 (18.8%) | $0 |
| Total | 579 (100.0%) | $163,247 |
Poverty in Middletown
Income Below Poverty by Sex and Age in Middletown
With 3.8% poverty level for males and 5.6% for females among the residents of Middletown, 55 to 64 year old males and 65 to 74 year old females are the most vulnerable to poverty, with 23 males (21.7%) and 35 females (36.5%) in their respective age groups living below the poverty level.
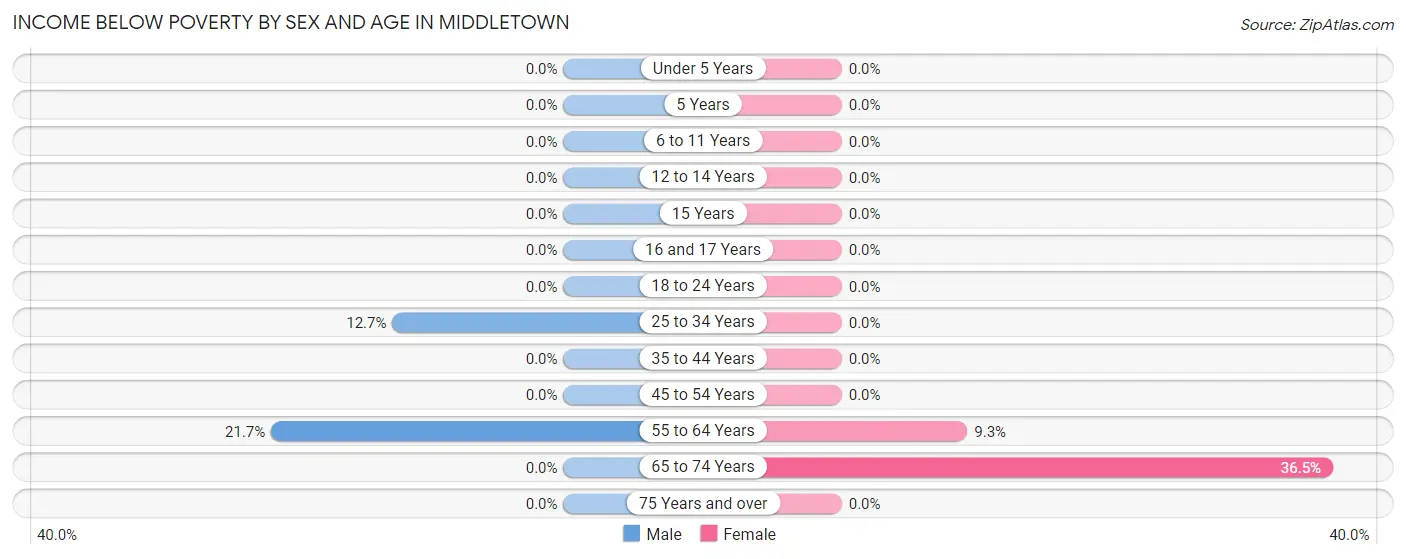
| Age Bracket | Male | Female |
| Under 5 Years | 0 (0.0%) | 0 (0.0%) |
| 5 Years | 0 (0.0%) | 0 (0.0%) |
| 6 to 11 Years | 0 (0.0%) | 0 (0.0%) |
| 12 to 14 Years | 0 (0.0%) | 0 (0.0%) |
| 15 Years | 0 (0.0%) | 0 (0.0%) |
| 16 and 17 Years | 0 (0.0%) | 0 (0.0%) |
| 18 to 24 Years | 0 (0.0%) | 0 (0.0%) |
| 25 to 34 Years | 8 (12.7%) | 0 (0.0%) |
| 35 to 44 Years | 0 (0.0%) | 0 (0.0%) |
| 45 to 54 Years | 0 (0.0%) | 0 (0.0%) |
| 55 to 64 Years | 23 (21.7%) | 11 (9.3%) |
| 65 to 74 Years | 0 (0.0%) | 35 (36.5%) |
| 75 Years and over | 0 (0.0%) | 0 (0.0%) |
| Total | 31 (3.8%) | 46 (5.6%) |
Income Above Poverty by Sex and Age in Middletown
According to the poverty statistics in Middletown, males aged under 5 years and females aged under 5 years are the age groups that are most secure financially, with 100.0% of males and 100.0% of females in these age groups living above the poverty line.
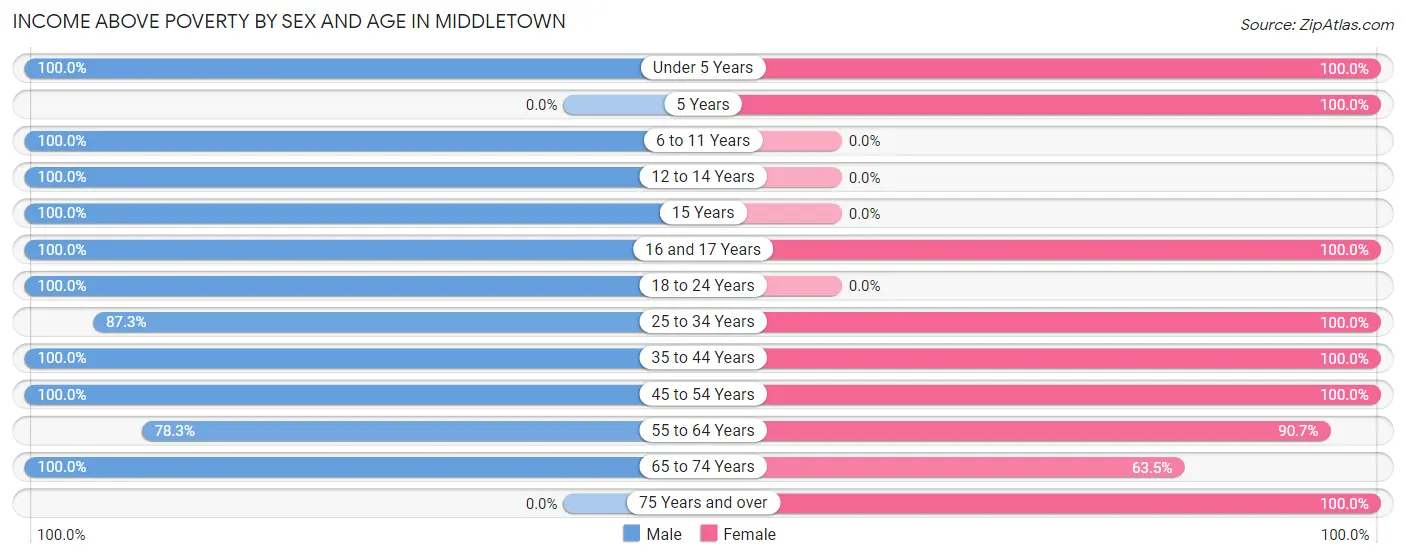
| Age Bracket | Male | Female |
| Under 5 Years | 53 (100.0%) | 92 (100.0%) |
| 5 Years | 0 (0.0%) | 17 (100.0%) |
| 6 to 11 Years | 76 (100.0%) | 0 (0.0%) |
| 12 to 14 Years | 80 (100.0%) | 0 (0.0%) |
| 15 Years | 46 (100.0%) | 0 (0.0%) |
| 16 and 17 Years | 40 (100.0%) | 65 (100.0%) |
| 18 to 24 Years | 100 (100.0%) | 0 (0.0%) |
| 25 to 34 Years | 55 (87.3%) | 165 (100.0%) |
| 35 to 44 Years | 60 (100.0%) | 46 (100.0%) |
| 45 to 54 Years | 94 (100.0%) | 217 (100.0%) |
| 55 to 64 Years | 83 (78.3%) | 107 (90.7%) |
| 65 to 74 Years | 96 (100.0%) | 61 (63.5%) |
| 75 Years and over | 0 (0.0%) | 4 (100.0%) |
| Total | 783 (96.2%) | 774 (94.4%) |
Income Below Poverty Among Married-Couple Families in Middletown
The poverty statistics for married-couple families in Middletown show that 3.5% or 10 of the total 287 families live below the poverty line. Families with no children have the highest poverty rate of 8.2%, comprising of 10 families. On the other hand, families with 1 or 2 children have the lowest poverty rate of 0.0%, which includes 0 families.
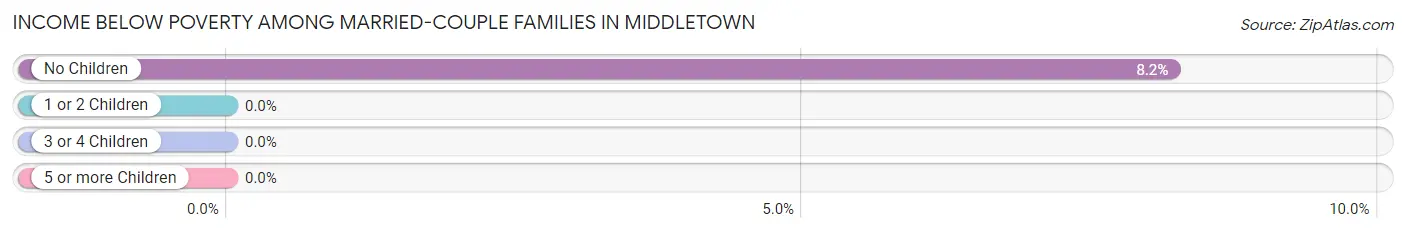
| Children | Above Poverty | Below Poverty |
| No Children | 112 (91.8%) | 10 (8.2%) |
| 1 or 2 Children | 158 (100.0%) | 0 (0.0%) |
| 3 or 4 Children | 7 (100.0%) | 0 (0.0%) |
| 5 or more Children | 0 (0.0%) | 0 (0.0%) |
| Total | 277 (96.5%) | 10 (3.5%) |
Income Below Poverty Among Single-Parent Households in Middletown
| Children | Single Father | Single Mother |
| No Children | 0 (0.0%) | 0 (0.0%) |
| 1 or 2 Children | 0 (0.0%) | 0 (0.0%) |
| 3 or 4 Children | 0 (0.0%) | 0 (0.0%) |
| 5 or more Children | 0 (0.0%) | 0 (0.0%) |
| Total | 0 (0.0%) | 0 (0.0%) |
Income Below Poverty Among Married-Couple vs Single-Parent Households in Middletown
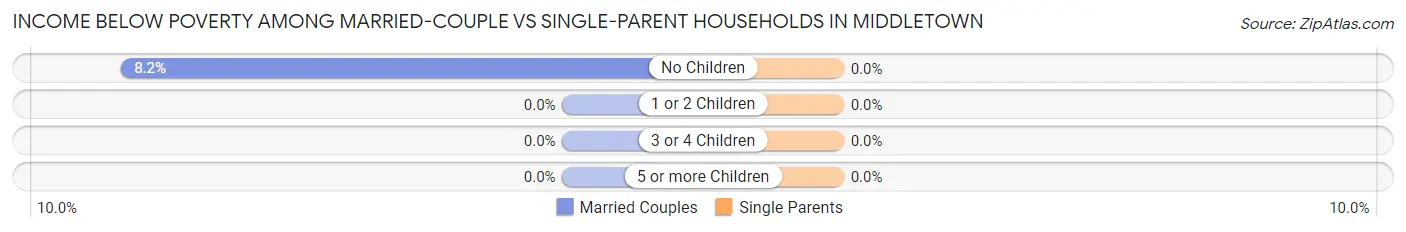
| Children | Married-Couple Families | Single-Parent Households |
| No Children | 10 (8.2%) | 0 (0.0%) |
| 1 or 2 Children | 0 (0.0%) | 0 (0.0%) |
| 3 or 4 Children | 0 (0.0%) | 0 (0.0%) |
| 5 or more Children | 0 (0.0%) | 0 (0.0%) |
| Total | 10 (3.5%) | 0 (0.0%) |
Race in Middletown
The most populous races in Middletown are White / Caucasian (1,261 | 72.1%), Hispanic or Latino (606 | 34.7%), and Two or more Races (279 | 16.0%).
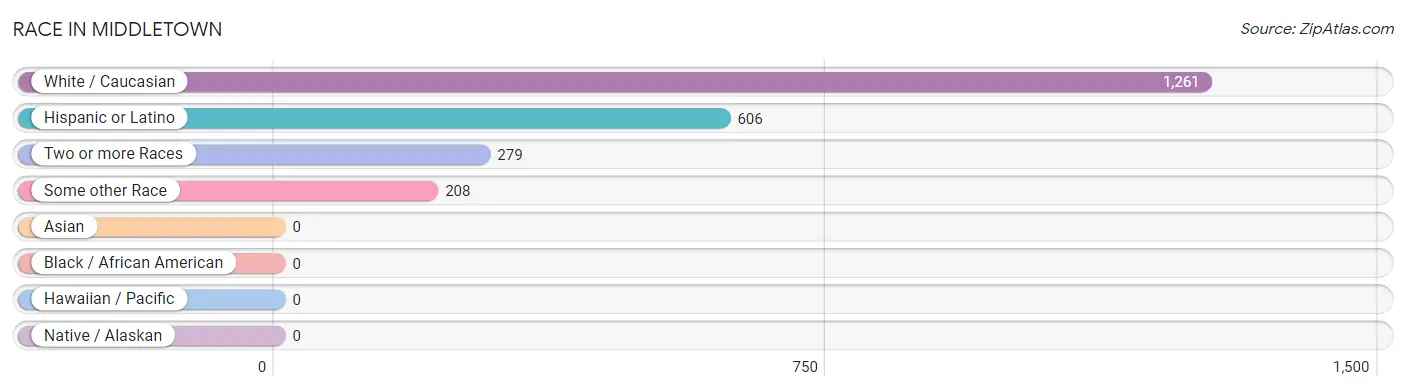
| Race | # Population | % Population |
| Asian | 0 | 0.0% |
| Black / African American | 0 | 0.0% |
| Hawaiian / Pacific | 0 | 0.0% |
| Hispanic or Latino | 606 | 34.7% |
| Native / Alaskan | 0 | 0.0% |
| White / Caucasian | 1,261 | 72.1% |
| Two or more Races | 279 | 16.0% |
| Some other Race | 208 | 11.9% |
| Total | 1,748 | 100.0% |
Ancestry in Middletown
The most populous ancestries reported in Middletown are Mexican (502 | 28.7%), German (284 | 16.3%), American (241 | 13.8%), English (98 | 5.6%), and Puerto Rican (65 | 3.7%), together accounting for 68.1% of all Middletown residents.
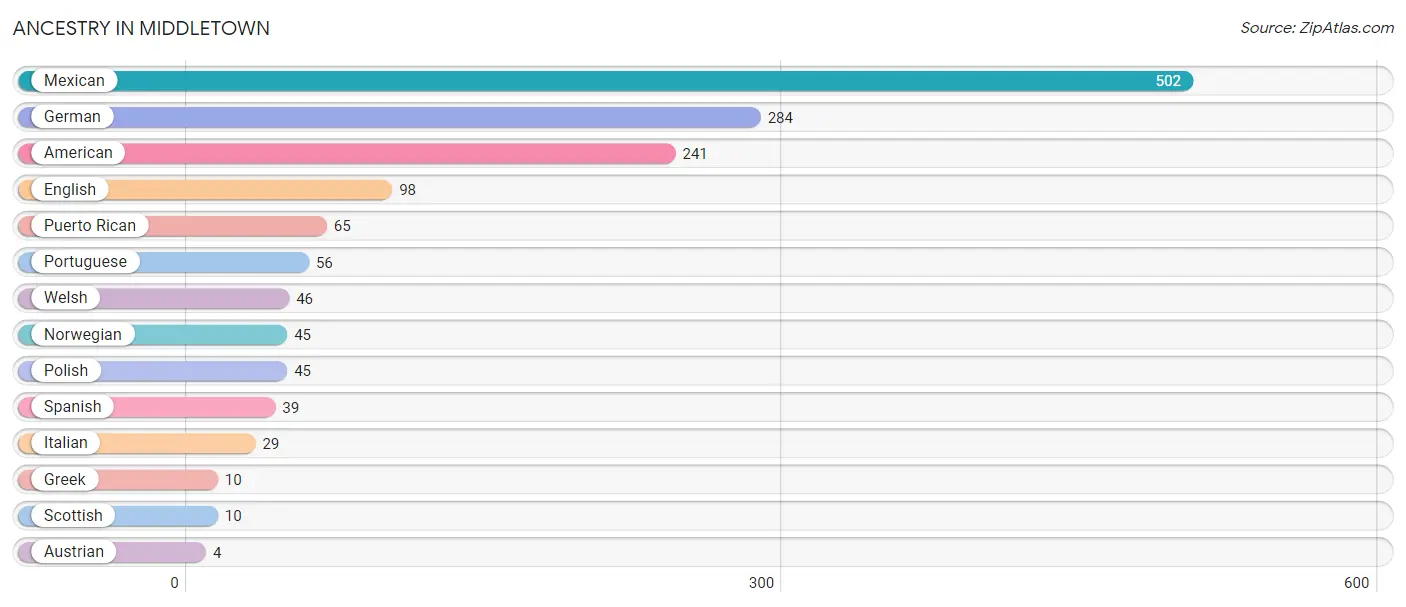
| Ancestry | # Population | % Population |
| American | 241 | 13.8% |
| Austrian | 4 | 0.2% |
| English | 98 | 5.6% |
| German | 284 | 16.3% |
| Greek | 10 | 0.6% |
| Italian | 29 | 1.7% |
| Mexican | 502 | 28.7% |
| Norwegian | 45 | 2.6% |
| Polish | 45 | 2.6% |
| Portuguese | 56 | 3.2% |
| Puerto Rican | 65 | 3.7% |
| Scottish | 10 | 0.6% |
| Spanish | 39 | 2.2% |
| Welsh | 46 | 2.6% | View All 14 Rows |
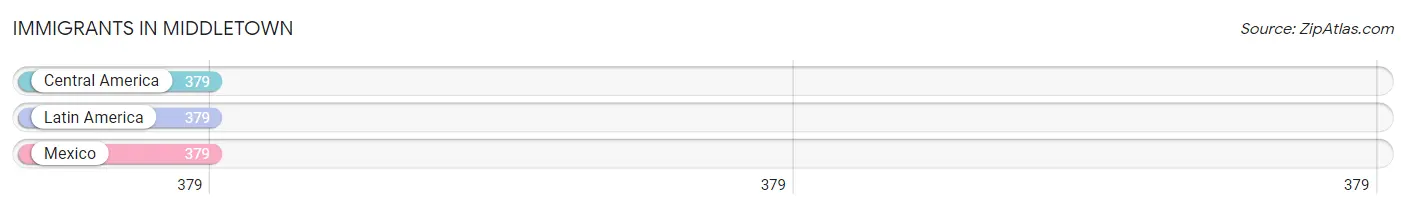
Immigrants in Middletown
The most numerous immigrant groups reported in Middletown came from Central America (379 | 21.7%), Latin America (379 | 21.7%), and Mexico (379 | 21.7%), together accounting for 65.0% of all Middletown residents.
| Immigration Origin | # Population | % Population |
| Central America | 379 | 21.7% |
| Latin America | 379 | 21.7% |
| Mexico | 379 | 21.7% | View All 3 Rows |
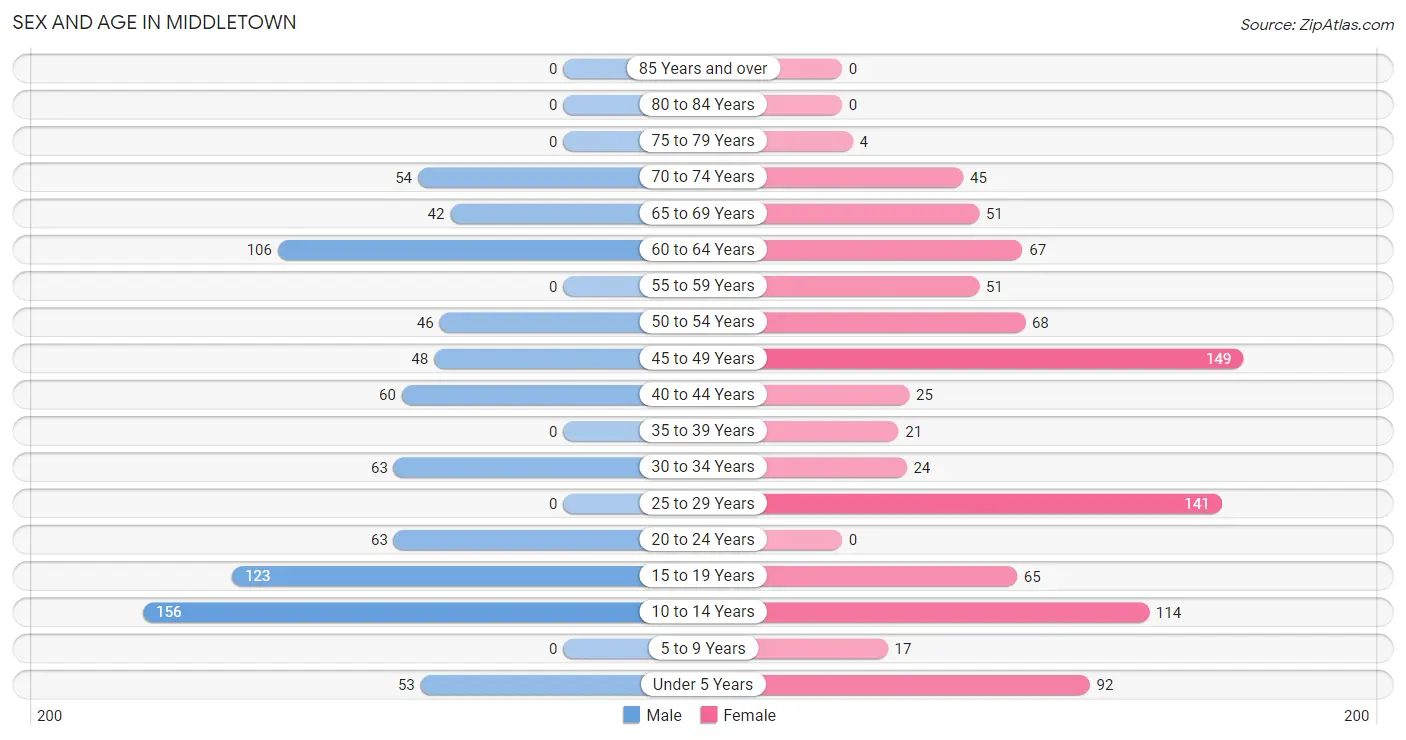
Sex and Age in Middletown
Sex and Age in Middletown
The most populous age groups in Middletown are 10 to 14 Years (156 | 19.2%) for men and 45 to 49 Years (149 | 16.0%) for women.
| Age Bracket | Male | Female |
| Under 5 Years | 53 (6.5%) | 92 (9.9%) |
| 5 to 9 Years | 0 (0.0%) | 17 (1.8%) |
| 10 to 14 Years | 156 (19.2%) | 114 (12.2%) |
| 15 to 19 Years | 123 (15.1%) | 65 (7.0%) |
| 20 to 24 Years | 63 (7.7%) | 0 (0.0%) |
| 25 to 29 Years | 0 (0.0%) | 141 (15.1%) |
| 30 to 34 Years | 63 (7.7%) | 24 (2.6%) |
| 35 to 39 Years | 0 (0.0%) | 21 (2.2%) |
| 40 to 44 Years | 60 (7.4%) | 25 (2.7%) |
| 45 to 49 Years | 48 (5.9%) | 149 (16.0%) |
| 50 to 54 Years | 46 (5.7%) | 68 (7.3%) |
| 55 to 59 Years | 0 (0.0%) | 51 (5.5%) |
| 60 to 64 Years | 106 (13.0%) | 67 (7.2%) |
| 65 to 69 Years | 42 (5.2%) | 51 (5.5%) |
| 70 to 74 Years | 54 (6.6%) | 45 (4.8%) |
| 75 to 79 Years | 0 (0.0%) | 4 (0.4%) |
| 80 to 84 Years | 0 (0.0%) | 0 (0.0%) |
| 85 Years and over | 0 (0.0%) | 0 (0.0%) |
| Total | 814 (100.0%) | 934 (100.0%) |
Families and Households in Middletown
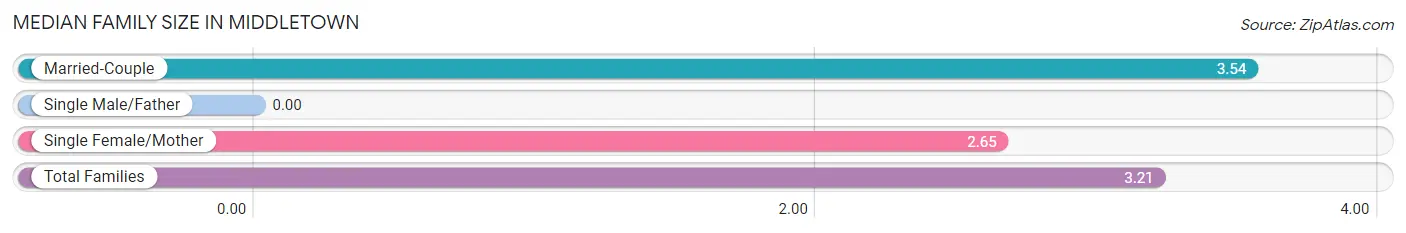
Median Family Size in Middletown
| Family Type | # Families | Family Size |
| Married-Couple | 287 (63.1%) | 3.54 |
| Single Male/Father | 0 (0.0%) | - |
| Single Female/Mother | 168 (36.9%) | 2.65 |
| Total Families | 455 (100.0%) | 3.21 |
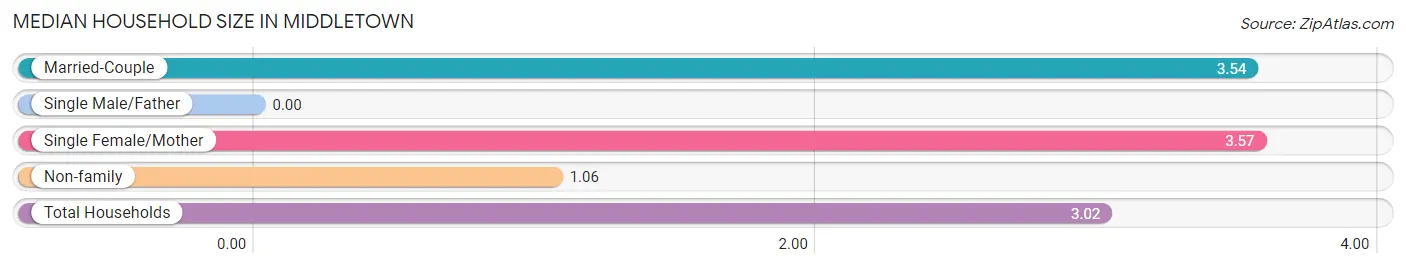
Median Household Size in Middletown
| Household Type | # Households | Household Size |
| Married-Couple | 287 (49.6%) | 3.54 |
| Single Male/Father | 0 (0.0%) | - |
| Single Female/Mother | 168 (29.0%) | 3.57 |
| Non-family | 124 (21.4%) | 1.06 |
| Total Households | 579 (100.0%) | 3.02 |
Household Size by Marriage Status in Middletown
Out of a total of 579 households in Middletown, 455 (78.6%) are family households, while 124 (21.4%) are nonfamily households. The most numerous type of family households are 4-person households, comprising 171, and the most common type of nonfamily households are 1-person households, comprising 113.
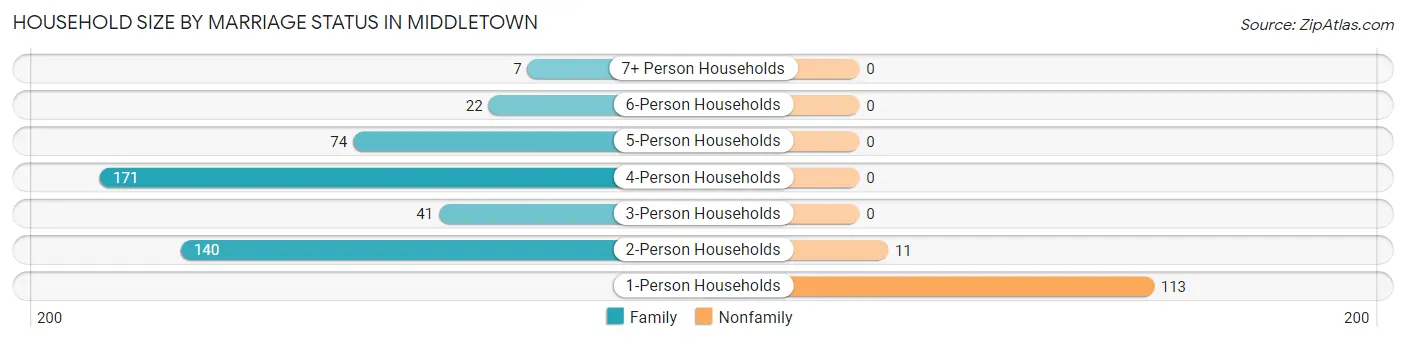
| Household Size | Family Households | Nonfamily Households |
| 1-Person Households | - | 113 (19.5%) |
| 2-Person Households | 140 (24.2%) | 11 (1.9%) |
| 3-Person Households | 41 (7.1%) | 0 (0.0%) |
| 4-Person Households | 171 (29.5%) | 0 (0.0%) |
| 5-Person Households | 74 (12.8%) | 0 (0.0%) |
| 6-Person Households | 22 (3.8%) | 0 (0.0%) |
| 7+ Person Households | 7 (1.2%) | 0 (0.0%) |
| Total | 455 (78.6%) | 124 (21.4%) |
Female Fertility in Middletown
Fertility by Age in Middletown
Average fertility rate in Middletown is 106.0 births per 1,000 women. Women in the age bracket of 20 to 34 years have the highest fertility rate with 273.0 births per 1,000 women. Women in the age bracket of 20 to 34 years acount for 100.0% of all women with births.
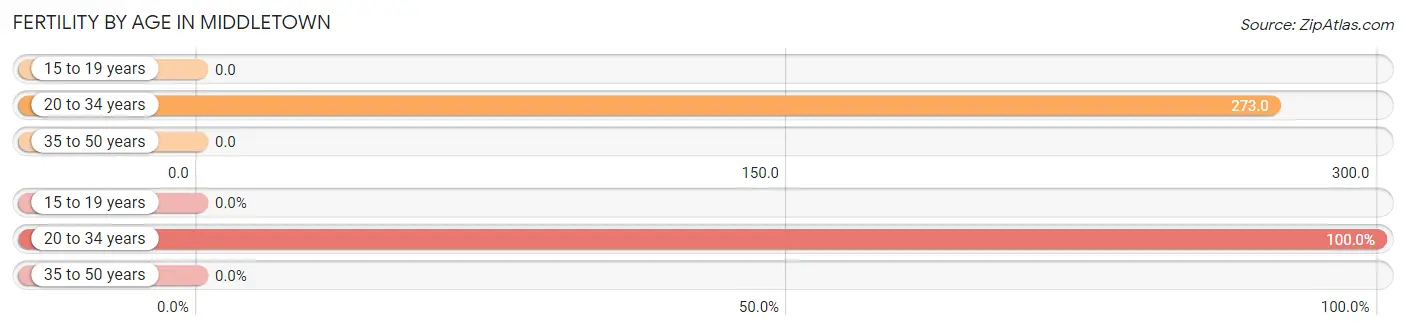
| Age Bracket | Women with Births | Births / 1,000 Women |
| 15 to 19 years | 0 (0.0%) | 0.0 |
| 20 to 34 years | 45 (100.0%) | 273.0 |
| 35 to 50 years | 0 (0.0%) | 0.0 |
| Total | 45 (100.0%) | 106.0 |
Fertility by Age by Marriage Status in Middletown
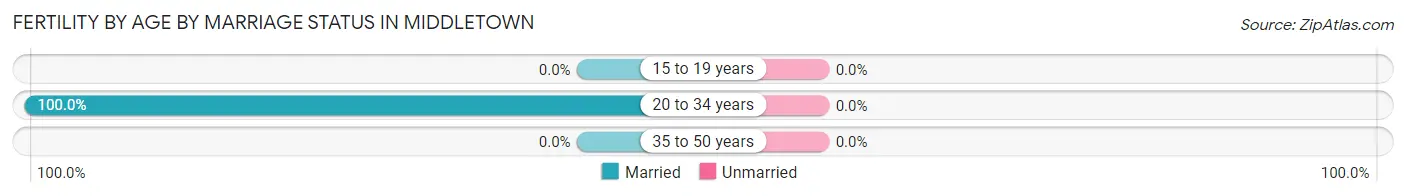
| Age Bracket | Married | Unmarried |
| 15 to 19 years | 0 (0.0%) | 0 (0.0%) |
| 20 to 34 years | 45 (100.0%) | 0 (0.0%) |
| 35 to 50 years | 0 (0.0%) | 0 (0.0%) |
| Total | 45 (100.0%) | 0 (0.0%) |
Fertility by Education in Middletown
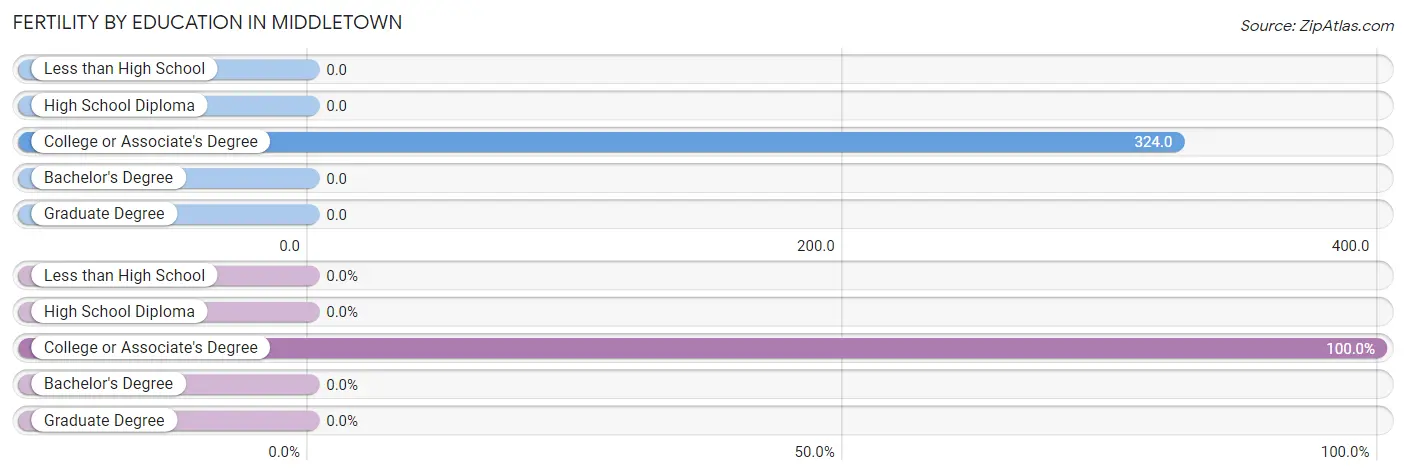
| Educational Attainment | Women with Births | Births / 1,000 Women |
| Less than High School | 0 (0.0%) | 0.0 |
| High School Diploma | 0 (0.0%) | 0.0 |
| College or Associate's Degree | 45 (100.0%) | 324.0 |
| Bachelor's Degree | 0 (0.0%) | 0.0 |
| Graduate Degree | 0 (0.0%) | 0.0 |
| Total | 45 (100.0%) | 106.0 |
Fertility by Education by Marriage Status in Middletown
| Educational Attainment | Married | Unmarried |
| Less than High School | 0 (0.0%) | 0 (0.0%) |
| High School Diploma | 0 (0.0%) | 0 (0.0%) |
| College or Associate's Degree | 45 (100.0%) | 0 (0.0%) |
| Bachelor's Degree | 0 (0.0%) | 0 (0.0%) |
| Graduate Degree | 0 (0.0%) | 0 (0.0%) |
| Total | 45 (100.0%) | 0 (0.0%) |
Employment Characteristics in Middletown
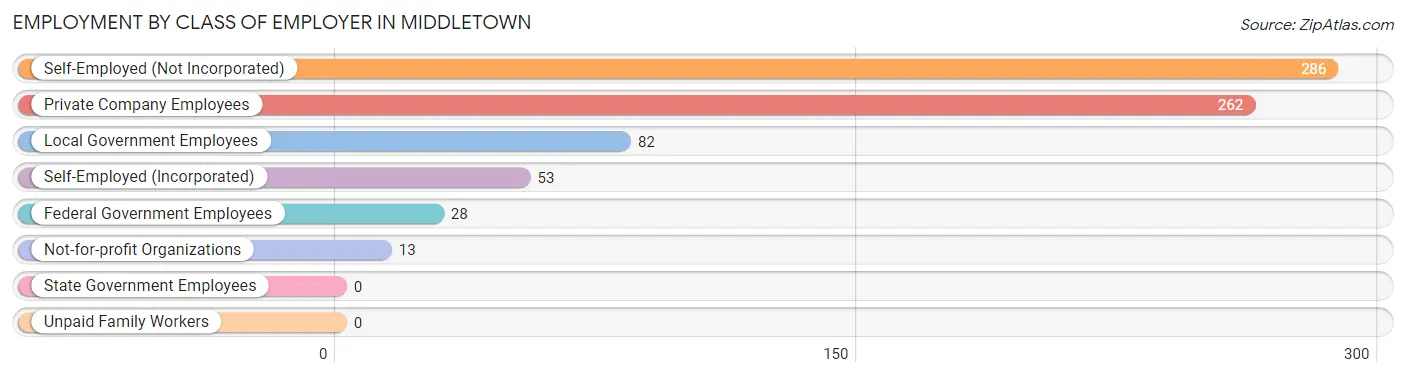
Employment by Class of Employer in Middletown
Among the 724 employed individuals in Middletown, self-employed (not incorporated) (286 | 39.5%), private company employees (262 | 36.2%), and local government employees (82 | 11.3%) make up the most common classes of employment.
| Employer Class | # Employees | % Employees |
| Private Company Employees | 262 | 36.2% |
| Self-Employed (Incorporated) | 53 | 7.3% |
| Self-Employed (Not Incorporated) | 286 | 39.5% |
| Not-for-profit Organizations | 13 | 1.8% |
| Local Government Employees | 82 | 11.3% |
| State Government Employees | 0 | 0.0% |
| Federal Government Employees | 28 | 3.9% |
| Unpaid Family Workers | 0 | 0.0% |
| Total | 724 | 100.0% |
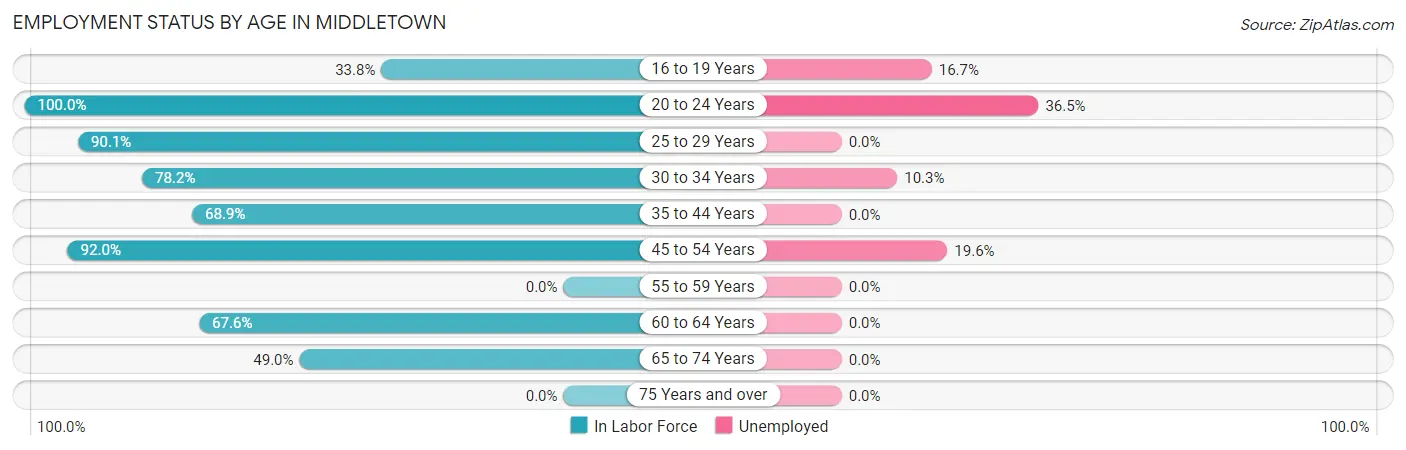
Employment Status by Age in Middletown
According to the labor force statistics for Middletown, out of the total population over 16 years of age (1,270), 69.0% or 876 individuals are in the labor force, with 10.7% or 94 of them unemployed. The age group with the highest labor force participation rate is 20 to 24 years, with 100.0% or 63 individuals in the labor force. Within the labor force, the 20 to 24 years age range has the highest percentage of unemployed individuals, with 36.5% or 23 of them being unemployed.
| Age Bracket | In Labor Force | Unemployed |
| 16 to 19 Years | 48 (33.8%) | 8 (16.7%) |
| 20 to 24 Years | 63 (100.0%) | 23 (36.5%) |
| 25 to 29 Years | 127 (90.1%) | 0 (0.0%) |
| 30 to 34 Years | 68 (78.2%) | 7 (10.3%) |
| 35 to 44 Years | 73 (68.9%) | 0 (0.0%) |
| 45 to 54 Years | 286 (92.0%) | 56 (19.6%) |
| 55 to 59 Years | 0 (0.0%) | 0 (0.0%) |
| 60 to 64 Years | 117 (67.6%) | 0 (0.0%) |
| 65 to 74 Years | 94 (49.0%) | 0 (0.0%) |
| 75 Years and over | 0 (0.0%) | 0 (0.0%) |
| Total | 876 (69.0%) | 94 (10.7%) |
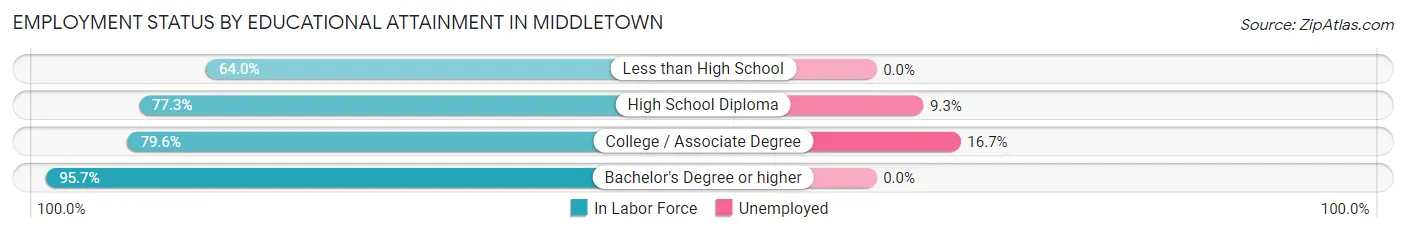
Employment Status by Educational Attainment in Middletown
According to labor force statistics for Middletown, 77.2% of individuals (671) out of the total population between 25 and 64 years of age (869) are in the labor force, with 9.4% or 63 of them being unemployed. The group with the highest labor force participation rate are those with the educational attainment of bachelor's degree or higher, with 95.7% or 110 individuals in the labor force. Within the labor force, individuals with college / associate degree education have the highest percentage of unemployment, with 16.7% or 56 of them being unemployed.
| Educational Attainment | In Labor Force | Unemployed |
| Less than High School | 151 (64.0%) | 0 (0.0%) |
| High School Diploma | 75 (77.3%) | 9 (9.3%) |
| College / Associate Degree | 335 (79.6%) | 70 (16.7%) |
| Bachelor's Degree or higher | 110 (95.7%) | 0 (0.0%) |
| Total | 671 (77.2%) | 82 (9.4%) |
Employment Occupations by Sex in Middletown
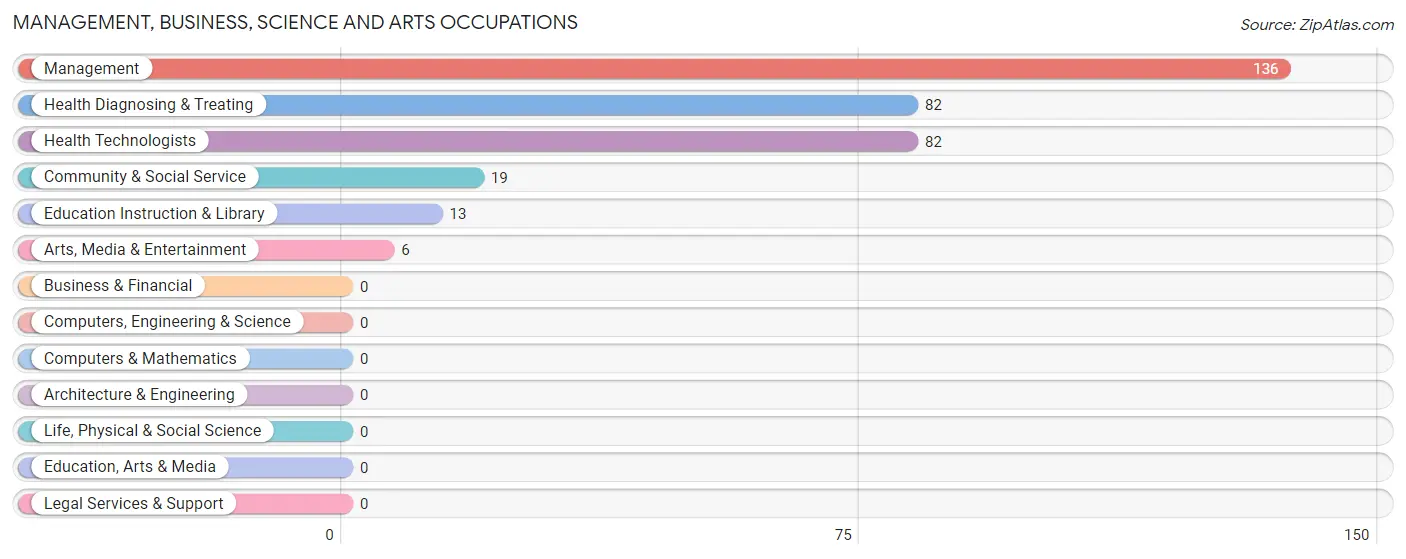
Management, Business, Science and Arts Occupations
The most common Management, Business, Science and Arts occupations in Middletown are Management (136 | 17.4%), Health Diagnosing & Treating (82 | 10.5%), Health Technologists (82 | 10.5%), Community & Social Service (19 | 2.4%), and Education Instruction & Library (13 | 1.7%).
Management, Business, Science and Arts Occupations by Sex
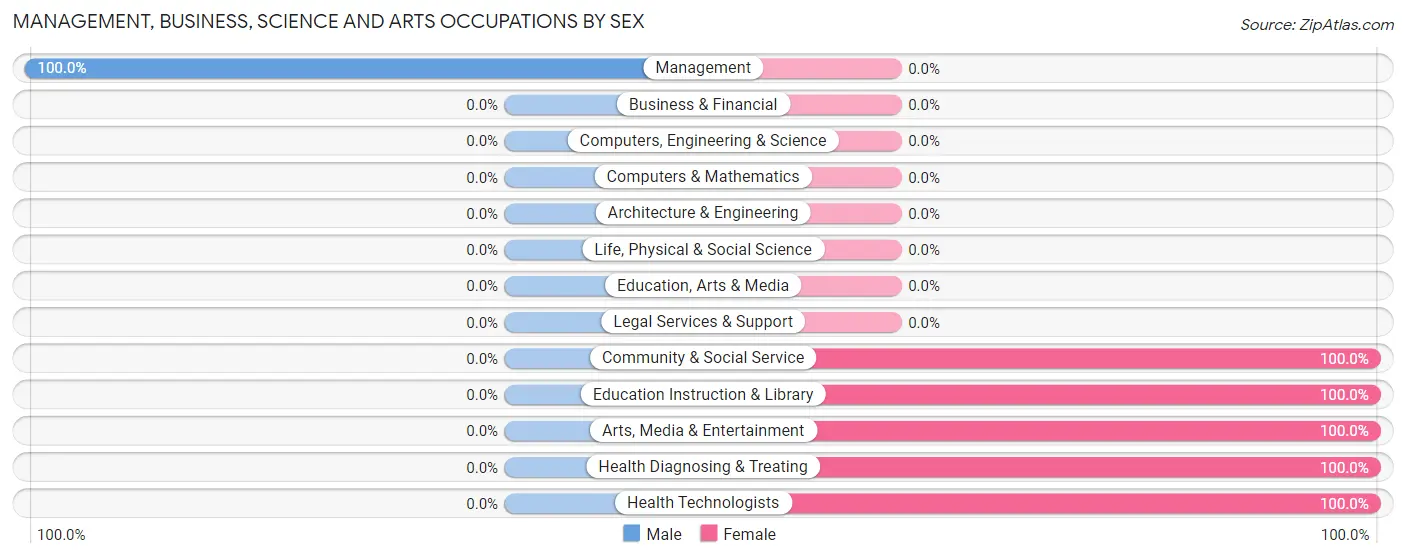
| Occupation | Male | Female |
| Management | 136 (100.0%) | 0 (0.0%) |
| Business & Financial | 0 (0.0%) | 0 (0.0%) |
| Computers, Engineering & Science | 0 (0.0%) | 0 (0.0%) |
| Computers & Mathematics | 0 (0.0%) | 0 (0.0%) |
| Architecture & Engineering | 0 (0.0%) | 0 (0.0%) |
| Life, Physical & Social Science | 0 (0.0%) | 0 (0.0%) |
| Community & Social Service | 0 (0.0%) | 19 (100.0%) |
| Education, Arts & Media | 0 (0.0%) | 0 (0.0%) |
| Legal Services & Support | 0 (0.0%) | 0 (0.0%) |
| Education Instruction & Library | 0 (0.0%) | 13 (100.0%) |
| Arts, Media & Entertainment | 0 (0.0%) | 6 (100.0%) |
| Health Diagnosing & Treating | 0 (0.0%) | 82 (100.0%) |
| Health Technologists | 0 (0.0%) | 82 (100.0%) |
| Total (Category) | 136 (57.4%) | 101 (42.6%) |
| Total (Overall) | 431 (55.1%) | 351 (44.9%) |
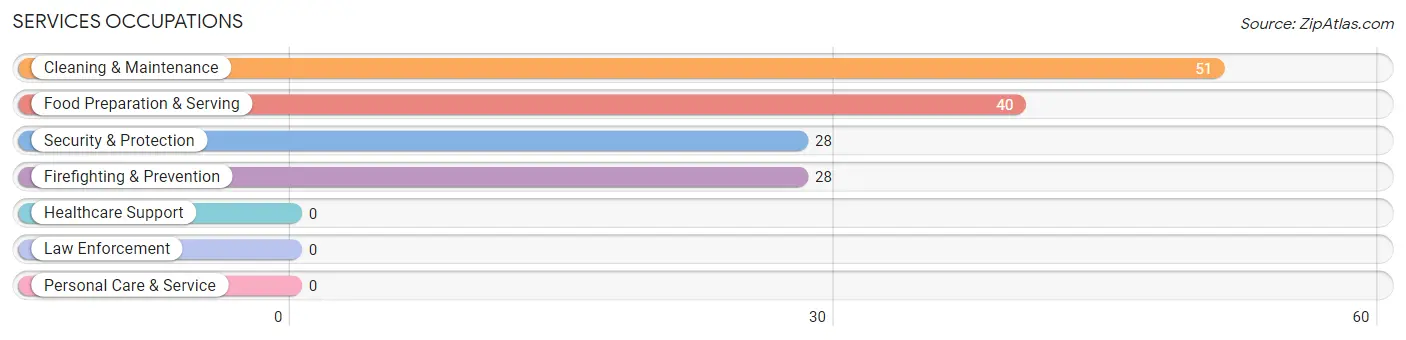
Services Occupations
The most common Services occupations in Middletown are Cleaning & Maintenance (51 | 6.5%), Food Preparation & Serving (40 | 5.1%), Security & Protection (28 | 3.6%), and Firefighting & Prevention (28 | 3.6%).
Services Occupations by Sex
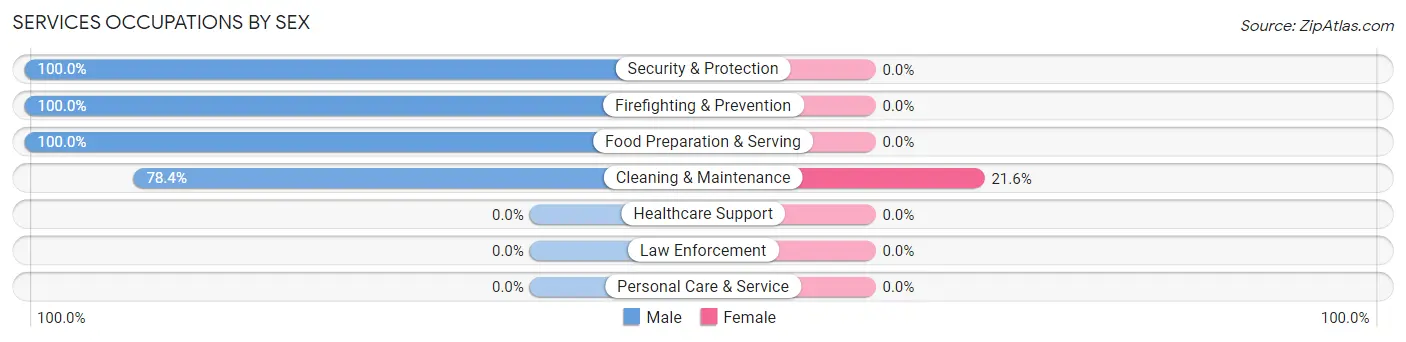
| Occupation | Male | Female |
| Healthcare Support | 0 (0.0%) | 0 (0.0%) |
| Security & Protection | 28 (100.0%) | 0 (0.0%) |
| Firefighting & Prevention | 28 (100.0%) | 0 (0.0%) |
| Law Enforcement | 0 (0.0%) | 0 (0.0%) |
| Food Preparation & Serving | 40 (100.0%) | 0 (0.0%) |
| Cleaning & Maintenance | 40 (78.4%) | 11 (21.6%) |
| Personal Care & Service | 0 (0.0%) | 0 (0.0%) |
| Total (Category) | 108 (90.8%) | 11 (9.2%) |
| Total (Overall) | 431 (55.1%) | 351 (44.9%) |
Sales and Office Occupations
The most common Sales and Office occupations in Middletown are Office & Administration (158 | 20.2%), and Sales & Related (81 | 10.4%).
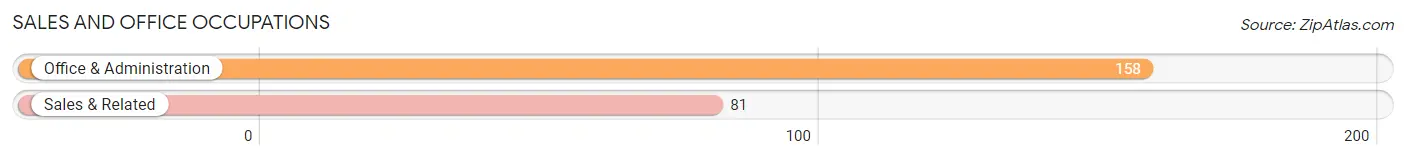
Sales and Office Occupations by Sex
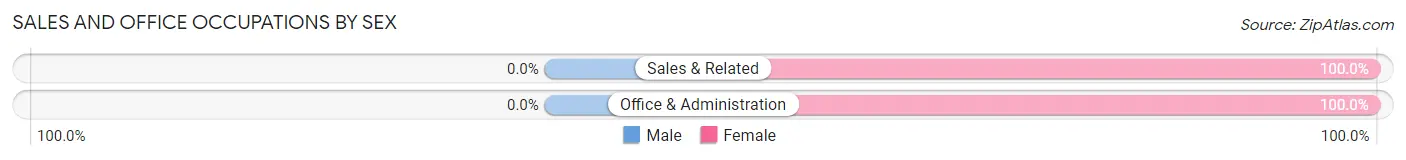
| Occupation | Male | Female |
| Sales & Related | 0 (0.0%) | 81 (100.0%) |
| Office & Administration | 0 (0.0%) | 158 (100.0%) |
| Total (Category) | 0 (0.0%) | 239 (100.0%) |
| Total (Overall) | 431 (55.1%) | 351 (44.9%) |
Natural Resources, Construction and Maintenance Occupations
The most common Natural Resources, Construction and Maintenance occupations in Middletown are Construction & Extraction (28 | 3.6%), and Installation, Maintenance & Repair (23 | 2.9%).
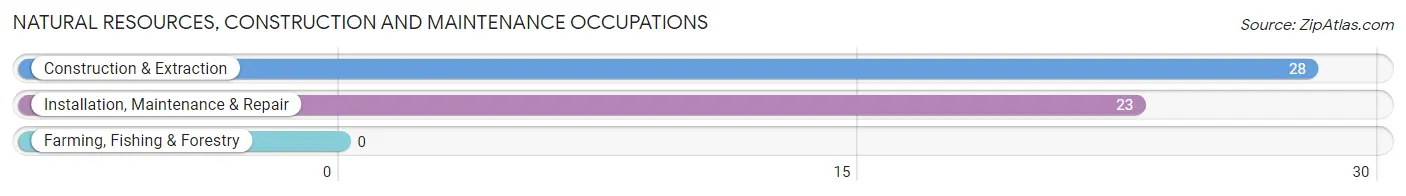
Natural Resources, Construction and Maintenance Occupations by Sex
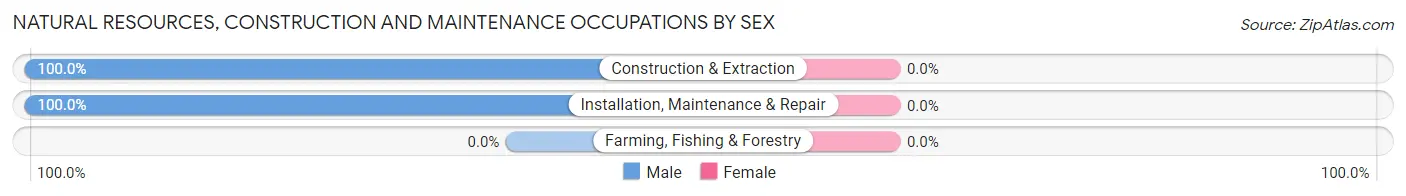
| Occupation | Male | Female |
| Farming, Fishing & Forestry | 0 (0.0%) | 0 (0.0%) |
| Construction & Extraction | 28 (100.0%) | 0 (0.0%) |
| Installation, Maintenance & Repair | 23 (100.0%) | 0 (0.0%) |
| Total (Category) | 51 (100.0%) | 0 (0.0%) |
| Total (Overall) | 431 (55.1%) | 351 (44.9%) |
Production, Transportation and Moving Occupations
The most common Production, Transportation and Moving occupations in Middletown are Material Moving (84 | 10.7%), and Transportation (52 | 6.7%).
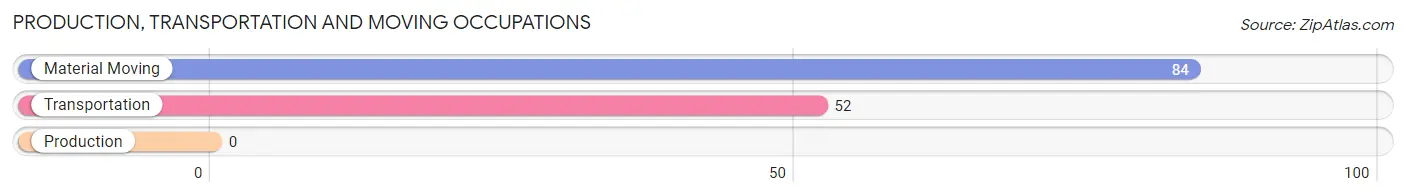
Production, Transportation and Moving Occupations by Sex
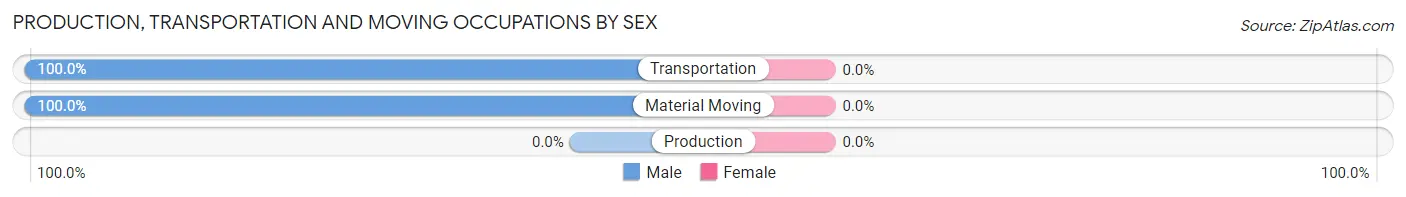
| Occupation | Male | Female |
| Production | 0 (0.0%) | 0 (0.0%) |
| Transportation | 52 (100.0%) | 0 (0.0%) |
| Material Moving | 84 (100.0%) | 0 (0.0%) |
| Total (Category) | 136 (100.0%) | 0 (0.0%) |
| Total (Overall) | 431 (55.1%) | 351 (44.9%) |
Employment Industries by Sex in Middletown
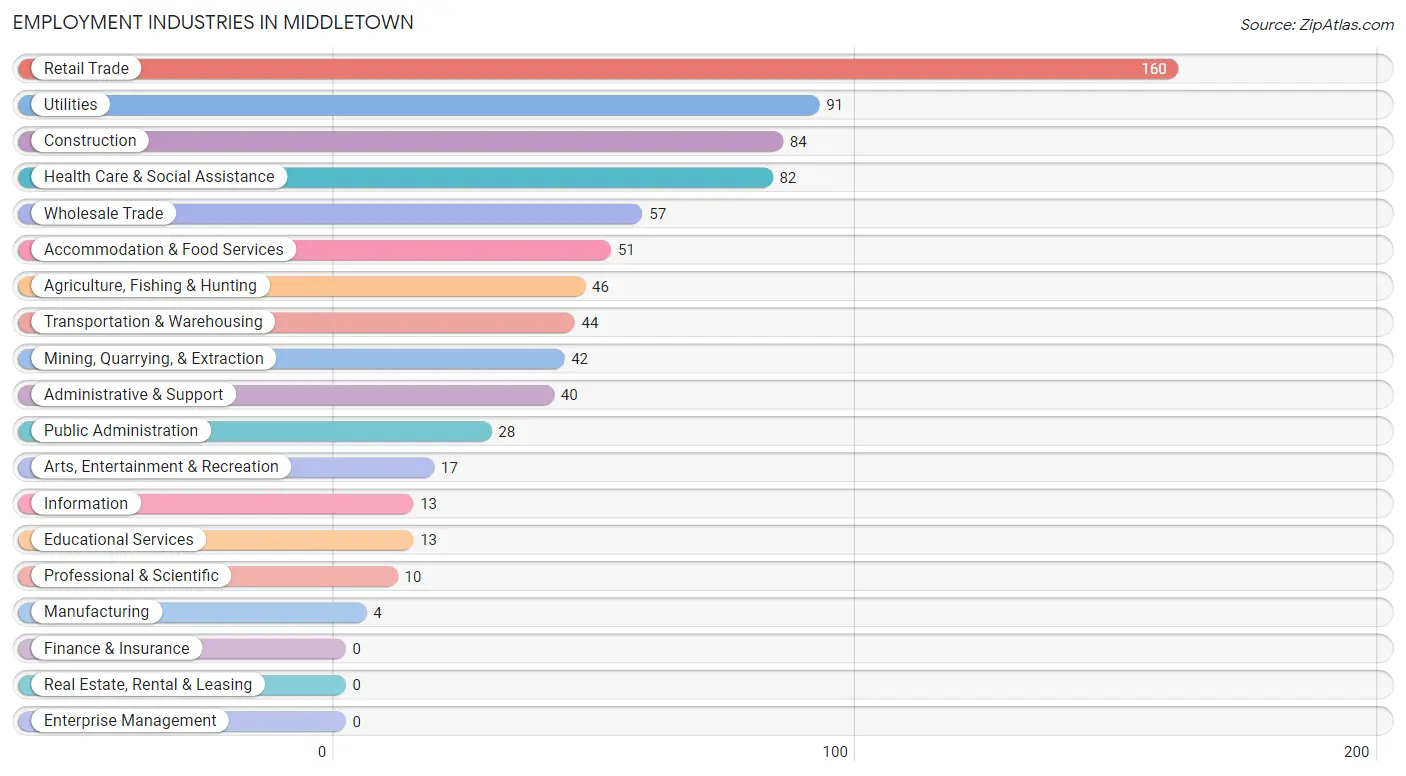
Employment Industries in Middletown
The major employment industries in Middletown include Retail Trade (160 | 20.5%), Utilities (91 | 11.6%), Construction (84 | 10.7%), Health Care & Social Assistance (82 | 10.5%), and Wholesale Trade (57 | 7.3%).
Employment Industries by Sex in Middletown
The Middletown industries that see more men than women are Agriculture, Fishing & Hunting (100.0%), Mining, Quarrying, & Extraction (100.0%), and Manufacturing (100.0%), whereas the industries that tend to have a higher number of women are Wholesale Trade (100.0%), Information (100.0%), and Educational Services (100.0%).
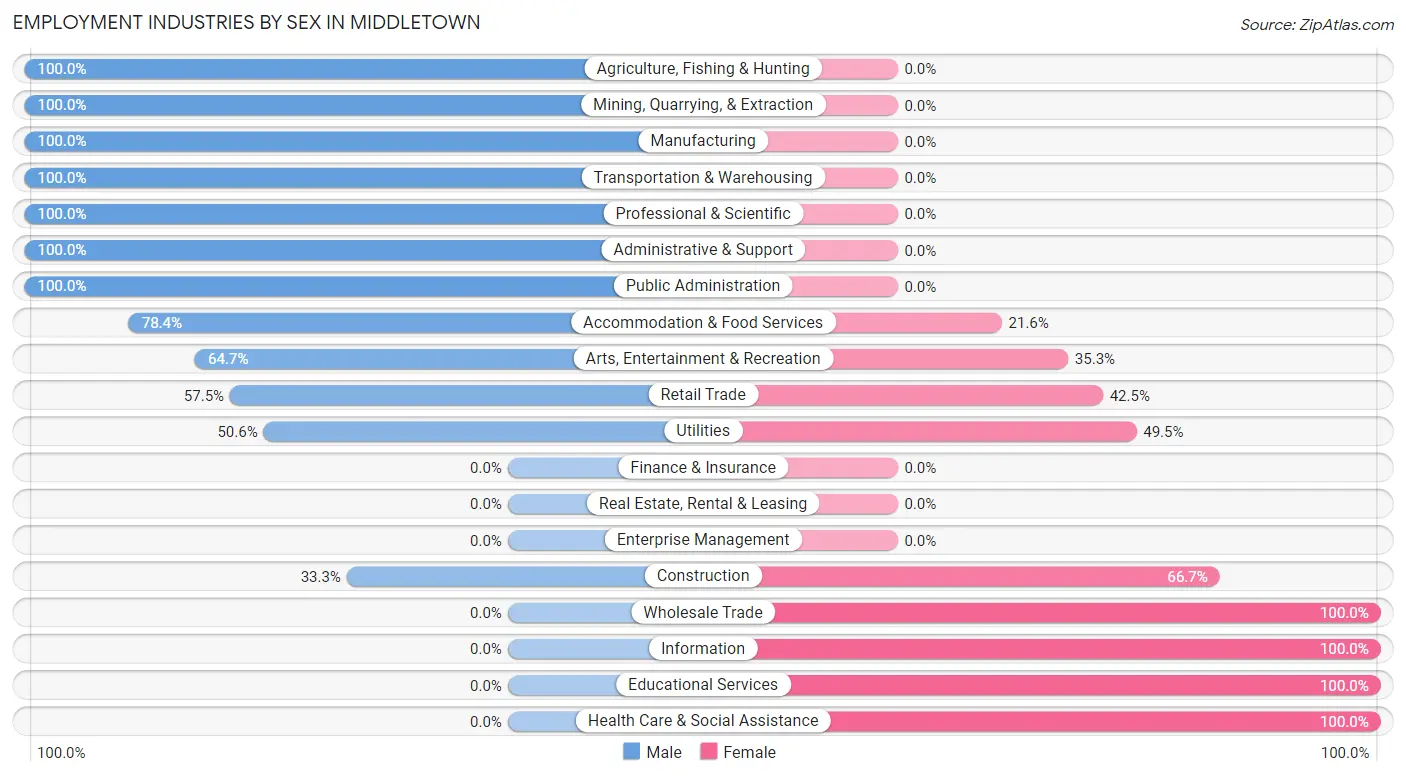
| Industry | Male | Female |
| Agriculture, Fishing & Hunting | 46 (100.0%) | 0 (0.0%) |
| Mining, Quarrying, & Extraction | 42 (100.0%) | 0 (0.0%) |
| Construction | 28 (33.3%) | 56 (66.7%) |
| Manufacturing | 4 (100.0%) | 0 (0.0%) |
| Wholesale Trade | 0 (0.0%) | 57 (100.0%) |
| Retail Trade | 92 (57.5%) | 68 (42.5%) |
| Transportation & Warehousing | 44 (100.0%) | 0 (0.0%) |
| Utilities | 46 (50.5%) | 45 (49.4%) |
| Information | 0 (0.0%) | 13 (100.0%) |
| Finance & Insurance | 0 (0.0%) | 0 (0.0%) |
| Real Estate, Rental & Leasing | 0 (0.0%) | 0 (0.0%) |
| Professional & Scientific | 10 (100.0%) | 0 (0.0%) |
| Enterprise Management | 0 (0.0%) | 0 (0.0%) |
| Administrative & Support | 40 (100.0%) | 0 (0.0%) |
| Educational Services | 0 (0.0%) | 13 (100.0%) |
| Health Care & Social Assistance | 0 (0.0%) | 82 (100.0%) |
| Arts, Entertainment & Recreation | 11 (64.7%) | 6 (35.3%) |
| Accommodation & Food Services | 40 (78.4%) | 11 (21.6%) |
| Public Administration | 28 (100.0%) | 0 (0.0%) |
| Total | 431 (55.1%) | 351 (44.9%) |
Education in Middletown
School Enrollment in Middletown
The most common levels of schooling among the 355 students in Middletown are high school (182 | 51.3%), middle school (156 | 43.9%), and kindergarten (17 | 4.8%).
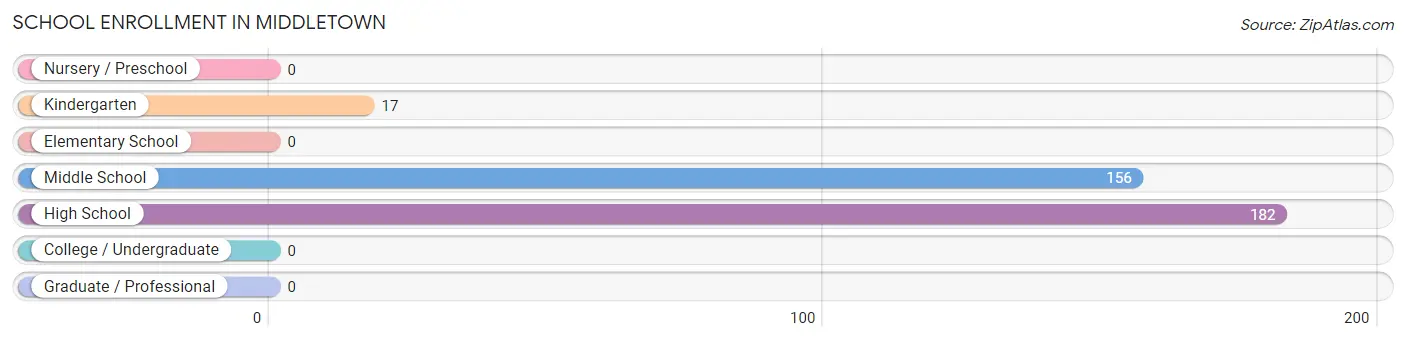
| School Level | # Students | % Students |
| Nursery / Preschool | 0 | 0.0% |
| Kindergarten | 17 | 4.8% |
| Elementary School | 0 | 0.0% |
| Middle School | 156 | 43.9% |
| High School | 182 | 51.3% |
| College / Undergraduate | 0 | 0.0% |
| Graduate / Professional | 0 | 0.0% |
| Total | 355 | 100.0% |
School Enrollment by Age by Funding Source in Middletown
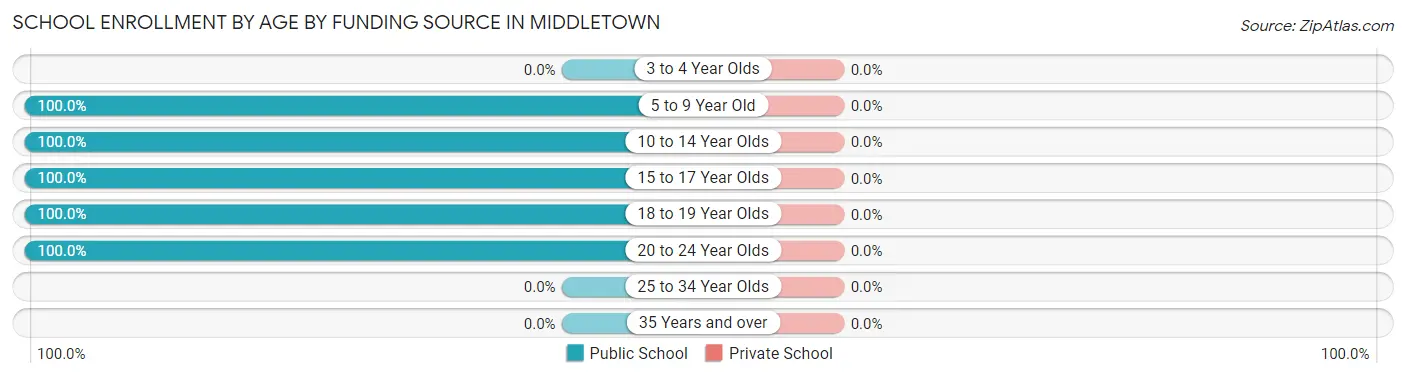
| Age Bracket | Public School | Private School |
| 3 to 4 Year Olds | 0 (0.0%) | 0 (0.0%) |
| 5 to 9 Year Old | 17 (100.0%) | 0 (0.0%) |
| 10 to 14 Year Olds | 156 (100.0%) | 0 (0.0%) |
| 15 to 17 Year Olds | 151 (100.0%) | 0 (0.0%) |
| 18 to 19 Year Olds | 8 (100.0%) | 0 (0.0%) |
| 20 to 24 Year Olds | 23 (100.0%) | 0 (0.0%) |
| 25 to 34 Year Olds | 0 (0.0%) | 0 (0.0%) |
| 35 Years and over | 0 (0.0%) | 0 (0.0%) |
| Total | 355 (100.0%) | 0 (0.0%) |
Educational Attainment by Field of Study in Middletown
Science & technology (82 | 62.6%), social sciences (36 | 27.5%), business (8 | 6.1%), and liberal arts & history (5 | 3.8%) are the most common fields of study among 131 individuals in Middletown who have obtained a bachelor's degree or higher.
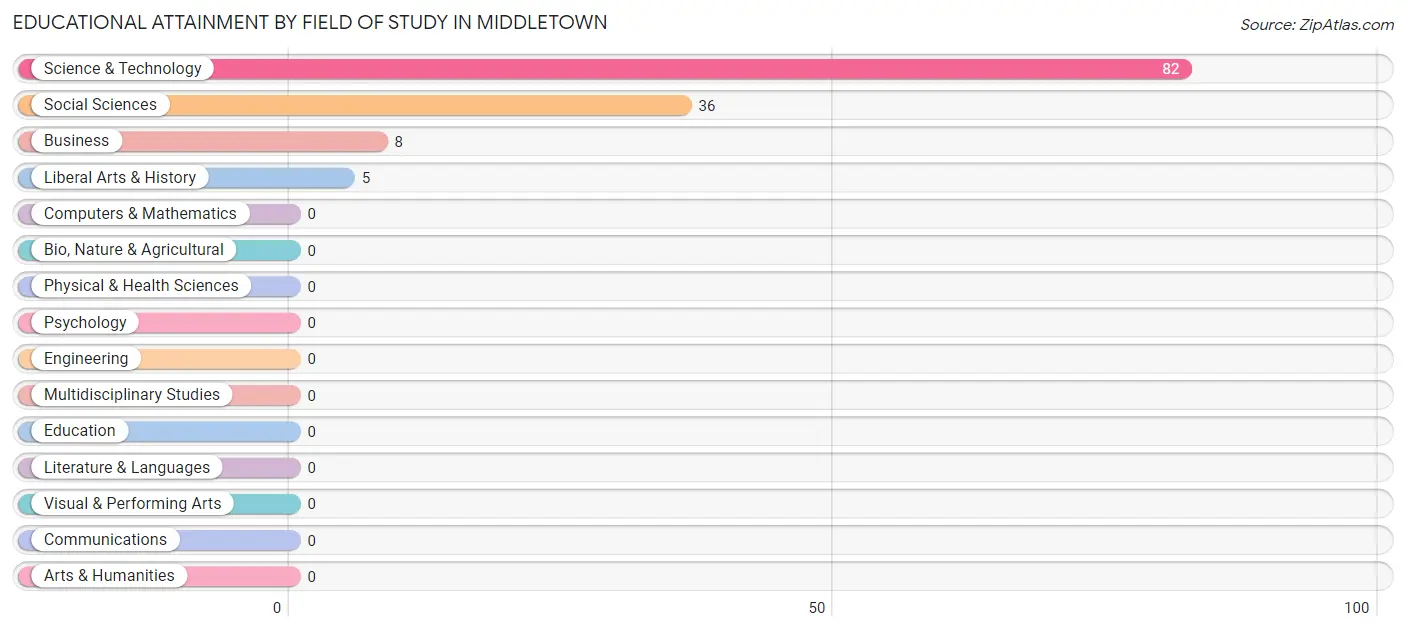
| Field of Study | # Graduates | % Graduates |
| Computers & Mathematics | 0 | 0.0% |
| Bio, Nature & Agricultural | 0 | 0.0% |
| Physical & Health Sciences | 0 | 0.0% |
| Psychology | 0 | 0.0% |
| Social Sciences | 36 | 27.5% |
| Engineering | 0 | 0.0% |
| Multidisciplinary Studies | 0 | 0.0% |
| Science & Technology | 82 | 62.6% |
| Business | 8 | 6.1% |
| Education | 0 | 0.0% |
| Literature & Languages | 0 | 0.0% |
| Liberal Arts & History | 5 | 3.8% |
| Visual & Performing Arts | 0 | 0.0% |
| Communications | 0 | 0.0% |
| Arts & Humanities | 0 | 0.0% |
| Total | 131 | 100.0% |
Transportation & Commute in Middletown
Vehicle Availability by Sex in Middletown
The most prevalent vehicle ownership categories in Middletown are males with 3 vehicles (244, accounting for 65.4%) and females with 3 vehicles (126, making up 69.5%).
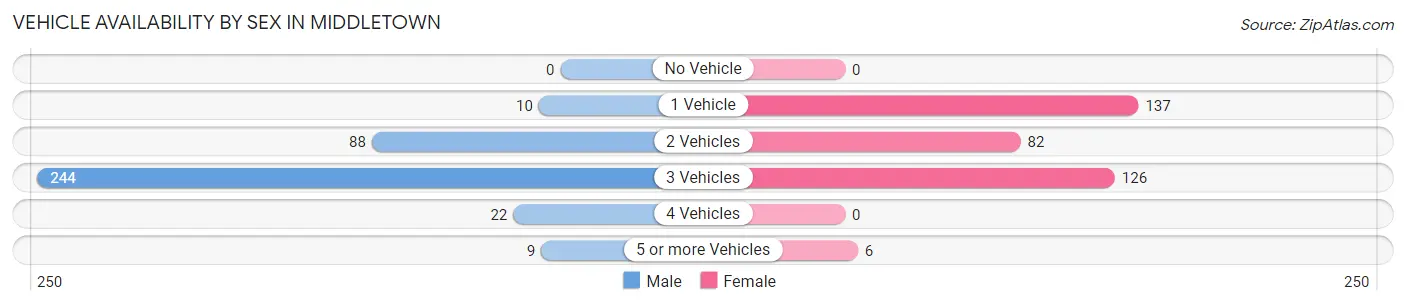
| Vehicles Available | Male | Female |
| No Vehicle | 0 (0.0%) | 0 (0.0%) |
| 1 Vehicle | 10 (2.7%) | 137 (39.0%) |
| 2 Vehicles | 88 (23.6%) | 82 (23.4%) |
| 3 Vehicles | 244 (65.4%) | 126 (35.9%) |
| 4 Vehicles | 22 (5.9%) | 0 (0.0%) |
| 5 or more Vehicles | 9 (2.4%) | 6 (1.7%) |
| Total | 373 (100.0%) | 351 (100.0%) |
Commute Time in Middletown
The most frequently occuring commute durations in Middletown are 30 to 34 minutes (158 commuters, 25.6%), 10 to 14 minutes (113 commuters, 18.3%), and less than 5 minutes (95 commuters, 15.4%).
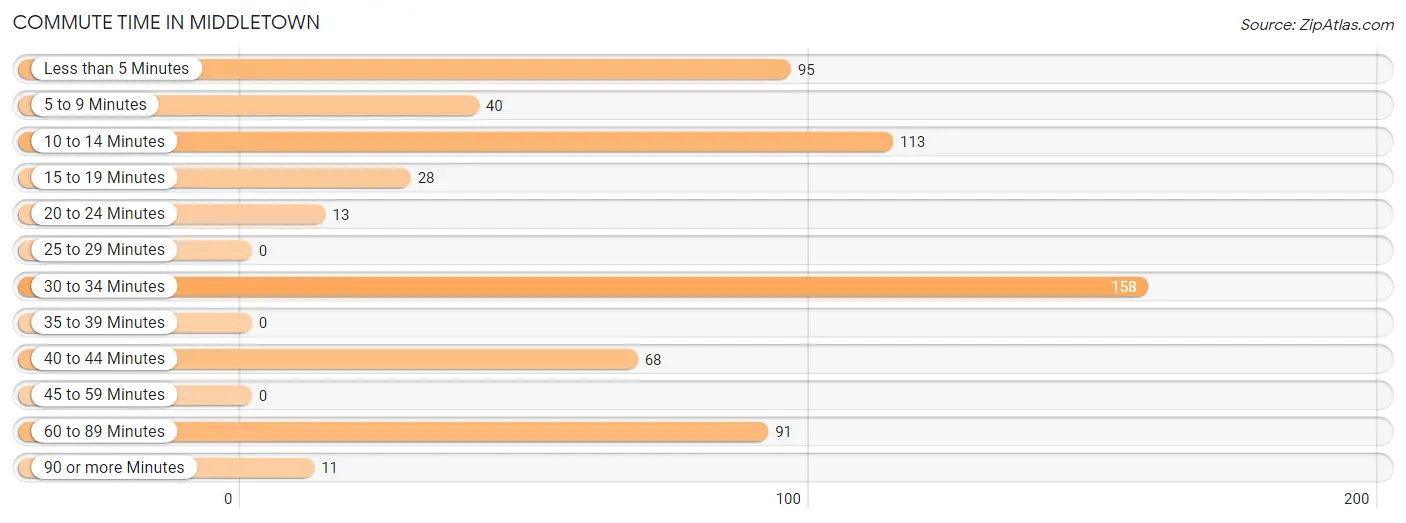
| Commute Time | # Commuters | % Commuters |
| Less than 5 Minutes | 95 | 15.4% |
| 5 to 9 Minutes | 40 | 6.5% |
| 10 to 14 Minutes | 113 | 18.3% |
| 15 to 19 Minutes | 28 | 4.5% |
| 20 to 24 Minutes | 13 | 2.1% |
| 25 to 29 Minutes | 0 | 0.0% |
| 30 to 34 Minutes | 158 | 25.6% |
| 35 to 39 Minutes | 0 | 0.0% |
| 40 to 44 Minutes | 68 | 11.0% |
| 45 to 59 Minutes | 0 | 0.0% |
| 60 to 89 Minutes | 91 | 14.7% |
| 90 or more Minutes | 11 | 1.8% |
Commute Time by Sex in Middletown
The most common commute times in Middletown are 60 to 89 minutes (80 commuters, 28.1%) for males and 10 to 14 minutes (113 commuters, 34.0%) for females.
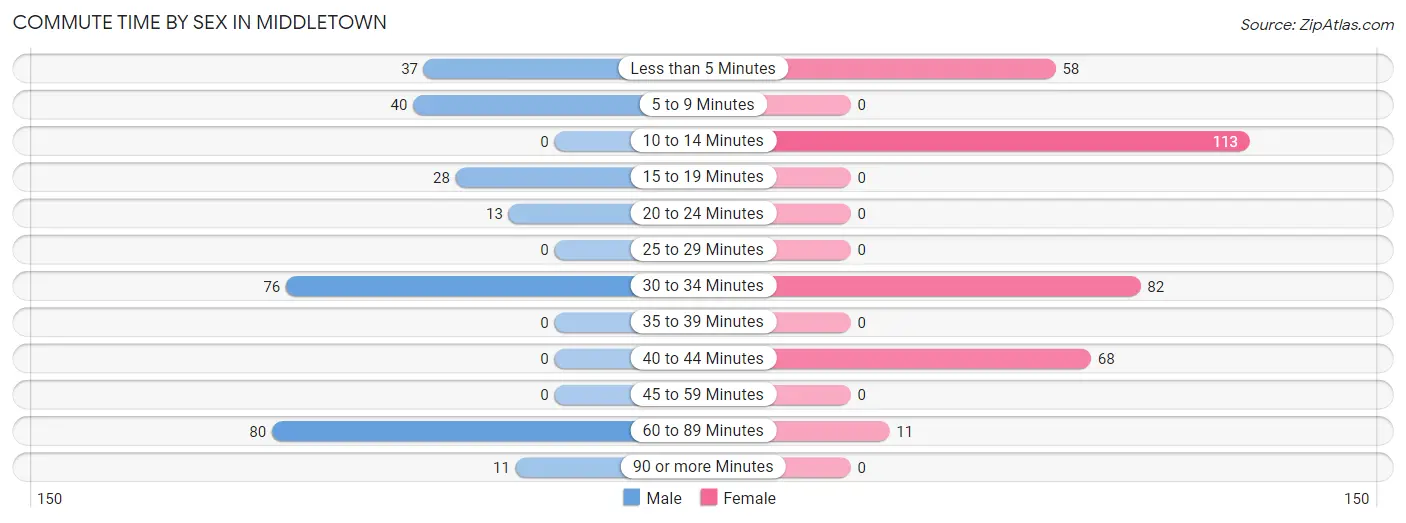
| Commute Time | Male | Female |
| Less than 5 Minutes | 37 (13.0%) | 58 (17.5%) |
| 5 to 9 Minutes | 40 (14.0%) | 0 (0.0%) |
| 10 to 14 Minutes | 0 (0.0%) | 113 (34.0%) |
| 15 to 19 Minutes | 28 (9.8%) | 0 (0.0%) |
| 20 to 24 Minutes | 13 (4.6%) | 0 (0.0%) |
| 25 to 29 Minutes | 0 (0.0%) | 0 (0.0%) |
| 30 to 34 Minutes | 76 (26.7%) | 82 (24.7%) |
| 35 to 39 Minutes | 0 (0.0%) | 0 (0.0%) |
| 40 to 44 Minutes | 0 (0.0%) | 68 (20.5%) |
| 45 to 59 Minutes | 0 (0.0%) | 0 (0.0%) |
| 60 to 89 Minutes | 80 (28.1%) | 11 (3.3%) |
| 90 or more Minutes | 11 (3.9%) | 0 (0.0%) |
Time of Departure to Work by Sex in Middletown
The most frequent times of departure to work in Middletown are 12:00 AM to 4:59 AM (120, 42.1%) for males and 10:00 AM to 10:59 AM (150, 45.2%) for females.
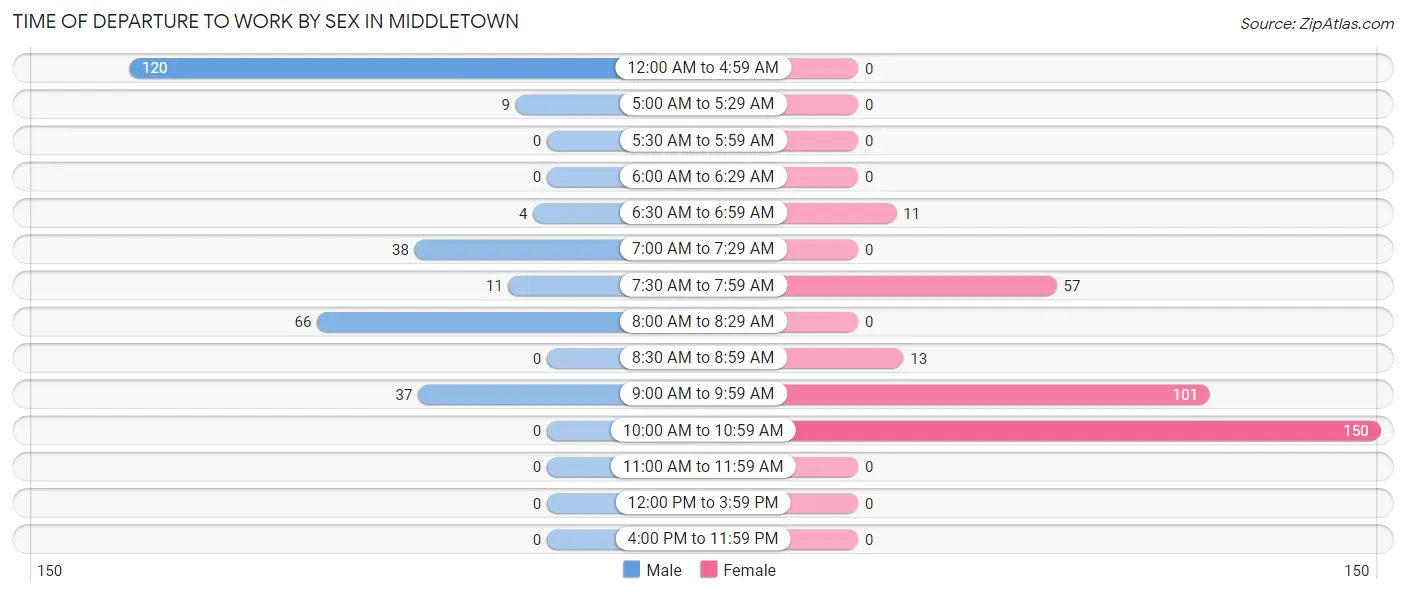
| Time of Departure | Male | Female |
| 12:00 AM to 4:59 AM | 120 (42.1%) | 0 (0.0%) |
| 5:00 AM to 5:29 AM | 9 (3.2%) | 0 (0.0%) |
| 5:30 AM to 5:59 AM | 0 (0.0%) | 0 (0.0%) |
| 6:00 AM to 6:29 AM | 0 (0.0%) | 0 (0.0%) |
| 6:30 AM to 6:59 AM | 4 (1.4%) | 11 (3.3%) |
| 7:00 AM to 7:29 AM | 38 (13.3%) | 0 (0.0%) |
| 7:30 AM to 7:59 AM | 11 (3.9%) | 57 (17.2%) |
| 8:00 AM to 8:29 AM | 66 (23.2%) | 0 (0.0%) |
| 8:30 AM to 8:59 AM | 0 (0.0%) | 13 (3.9%) |
| 9:00 AM to 9:59 AM | 37 (13.0%) | 101 (30.4%) |
| 10:00 AM to 10:59 AM | 0 (0.0%) | 150 (45.2%) |
| 11:00 AM to 11:59 AM | 0 (0.0%) | 0 (0.0%) |
| 12:00 PM to 3:59 PM | 0 (0.0%) | 0 (0.0%) |
| 4:00 PM to 11:59 PM | 0 (0.0%) | 0 (0.0%) |
| Total | 285 (100.0%) | 332 (100.0%) |
Housing Occupancy in Middletown
Occupancy by Ownership in Middletown
Of the total 579 dwellings in Middletown, owner-occupied units account for 367 (63.4%), while renter-occupied units make up 212 (36.6%).
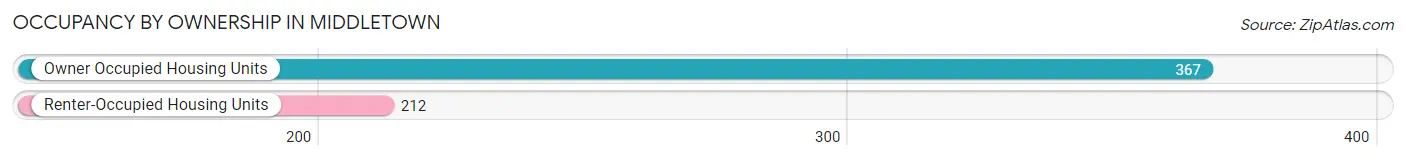
| Occupancy | # Housing Units | % Housing Units |
| Owner Occupied Housing Units | 367 | 63.4% |
| Renter-Occupied Housing Units | 212 | 36.6% |
| Total Occupied Housing Units | 579 | 100.0% |
Occupancy by Household Size in Middletown
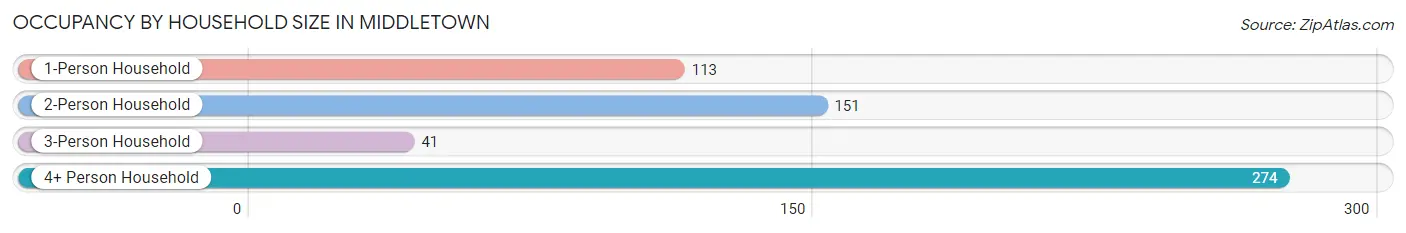
| Household Size | # Housing Units | % Housing Units |
| 1-Person Household | 113 | 19.5% |
| 2-Person Household | 151 | 26.1% |
| 3-Person Household | 41 | 7.1% |
| 4+ Person Household | 274 | 47.3% |
| Total Housing Units | 579 | 100.0% |
Occupancy by Ownership by Household Size in Middletown
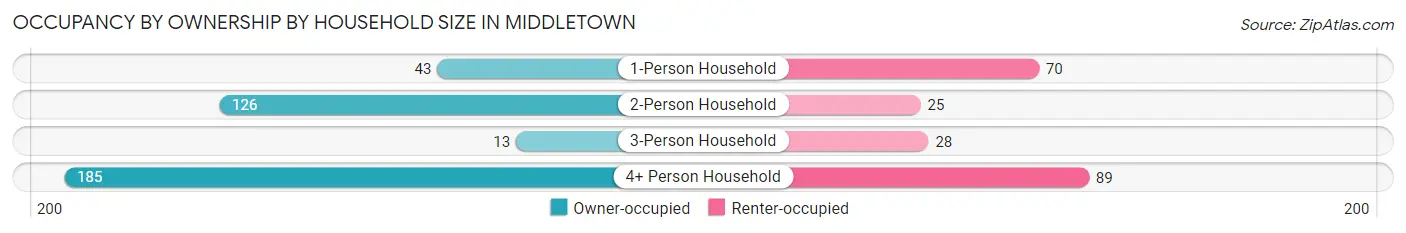
| Household Size | Owner-occupied | Renter-occupied |
| 1-Person Household | 43 (38.1%) | 70 (62.0%) |
| 2-Person Household | 126 (83.4%) | 25 (16.6%) |
| 3-Person Household | 13 (31.7%) | 28 (68.3%) |
| 4+ Person Household | 185 (67.5%) | 89 (32.5%) |
| Total Housing Units | 367 (63.4%) | 212 (36.6%) |
Occupancy by Educational Attainment in Middletown
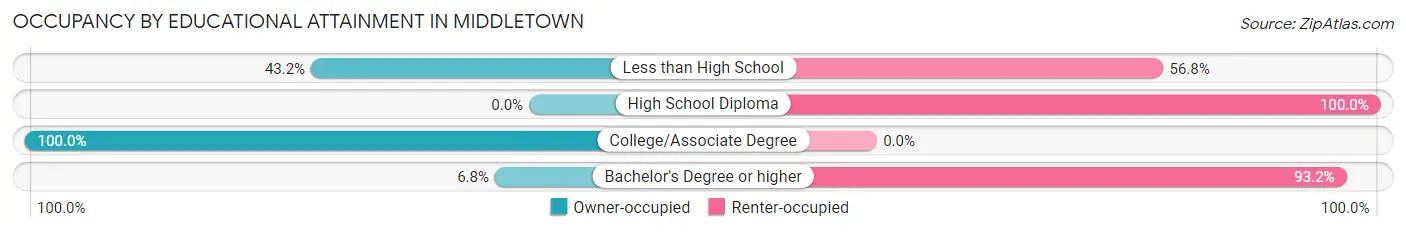
| Household Size | Owner-occupied | Renter-occupied |
| Less than High School | 67 (43.2%) | 88 (56.8%) |
| High School Diploma | 0 (0.0%) | 14 (100.0%) |
| College/Associate Degree | 292 (100.0%) | 0 (0.0%) |
| Bachelor's Degree or higher | 8 (6.8%) | 110 (93.2%) |
Occupancy by Age of Householder in Middletown
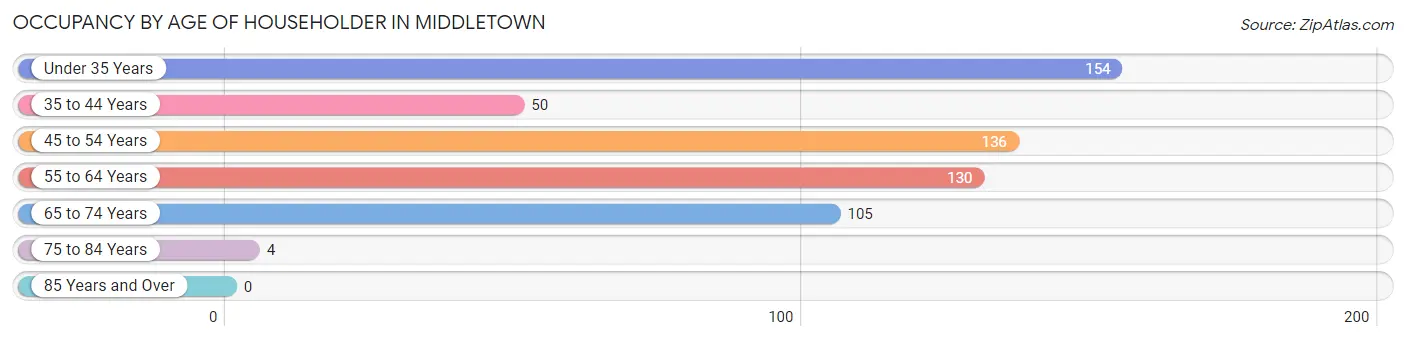
| Age Bracket | # Households | % Households |
| Under 35 Years | 154 | 26.6% |
| 35 to 44 Years | 50 | 8.6% |
| 45 to 54 Years | 136 | 23.5% |
| 55 to 64 Years | 130 | 22.5% |
| 65 to 74 Years | 105 | 18.1% |
| 75 to 84 Years | 4 | 0.7% |
| 85 Years and Over | 0 | 0.0% |
| Total | 579 | 100.0% |
Housing Finances in Middletown
Median Income by Occupancy in Middletown
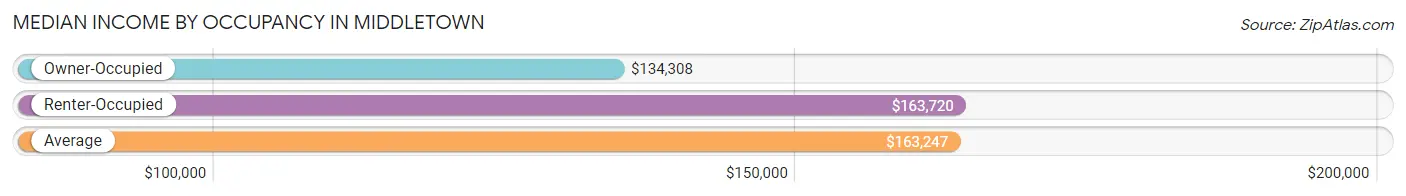
| Occupancy Type | # Households | Median Income |
| Owner-Occupied | 367 (63.4%) | $134,308 |
| Renter-Occupied | 212 (36.6%) | $163,720 |
| Average | 579 (100.0%) | $163,247 |
Occupancy by Householder Income Bracket in Middletown
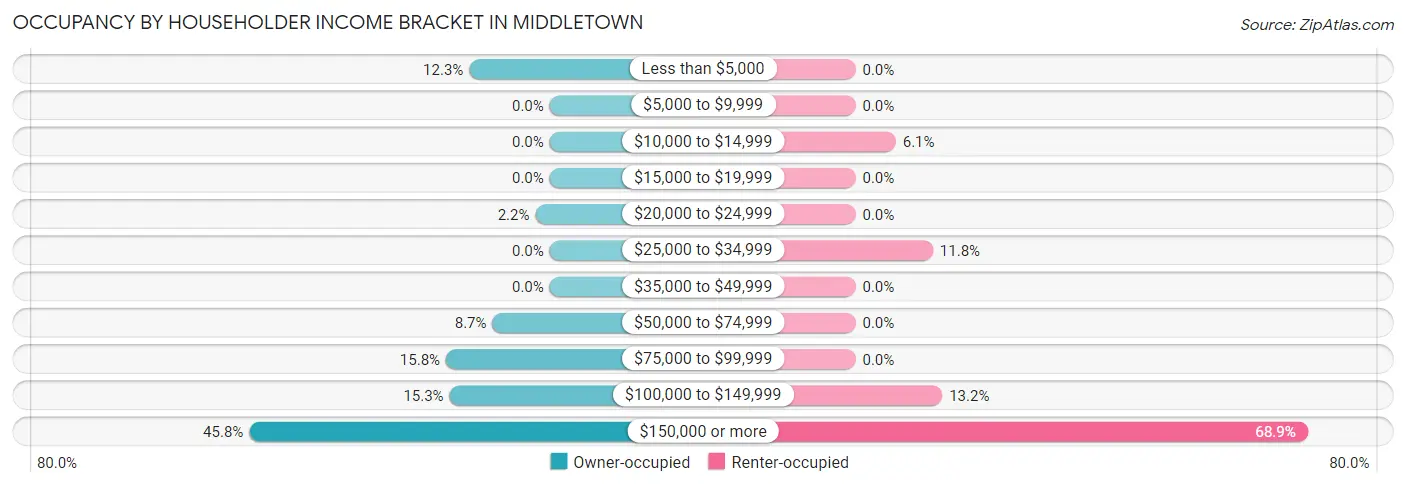
| Income Bracket | Owner-occupied | Renter-occupied |
| Less than $5,000 | 45 (12.3%) | 0 (0.0%) |
| $5,000 to $9,999 | 0 (0.0%) | 0 (0.0%) |
| $10,000 to $14,999 | 0 (0.0%) | 13 (6.1%) |
| $15,000 to $19,999 | 0 (0.0%) | 0 (0.0%) |
| $20,000 to $24,999 | 8 (2.2%) | 0 (0.0%) |
| $25,000 to $34,999 | 0 (0.0%) | 25 (11.8%) |
| $35,000 to $49,999 | 0 (0.0%) | 0 (0.0%) |
| $50,000 to $74,999 | 32 (8.7%) | 0 (0.0%) |
| $75,000 to $99,999 | 58 (15.8%) | 0 (0.0%) |
| $100,000 to $149,999 | 56 (15.3%) | 28 (13.2%) |
| $150,000 or more | 168 (45.8%) | 146 (68.9%) |
| Total | 367 (100.0%) | 212 (100.0%) |
Monthly Housing Cost Tiers in Middletown
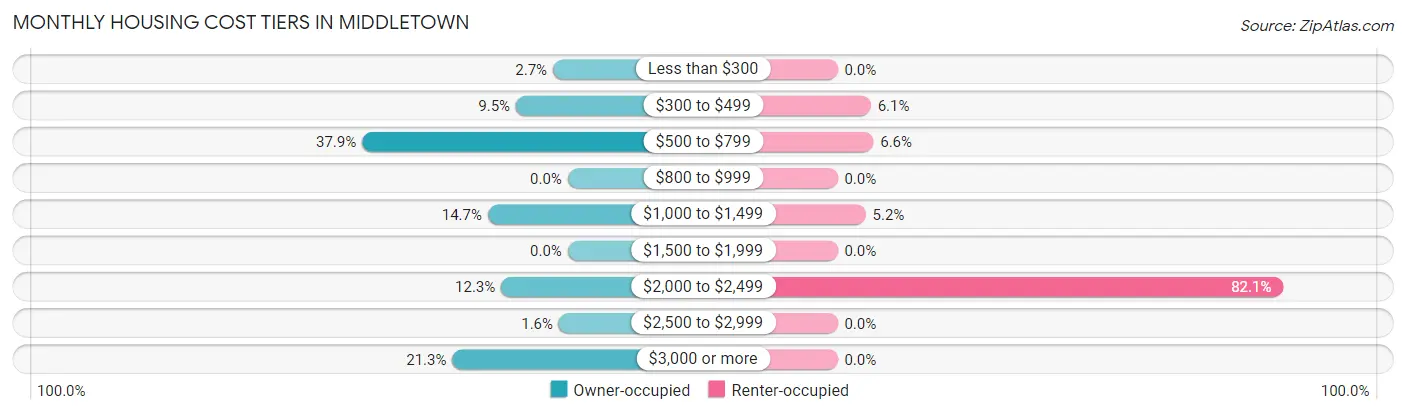
| Monthly Cost | Owner-occupied | Renter-occupied |
| Less than $300 | 10 (2.7%) | 0 (0.0%) |
| $300 to $499 | 35 (9.5%) | 13 (6.1%) |
| $500 to $799 | 139 (37.9%) | 14 (6.6%) |
| $800 to $999 | 0 (0.0%) | 0 (0.0%) |
| $1,000 to $1,499 | 54 (14.7%) | 11 (5.2%) |
| $1,500 to $1,999 | 0 (0.0%) | 0 (0.0%) |
| $2,000 to $2,499 | 45 (12.3%) | 174 (82.1%) |
| $2,500 to $2,999 | 6 (1.6%) | 0 (0.0%) |
| $3,000 or more | 78 (21.2%) | 0 (0.0%) |
| Total | 367 (100.0%) | 212 (100.0%) |
Physical Housing Characteristics in Middletown
Housing Structures in Middletown
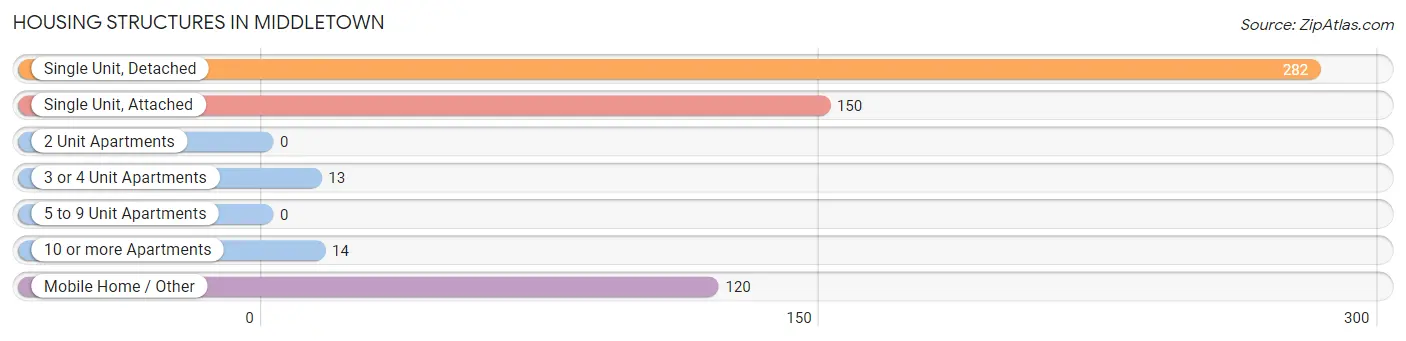
| Structure Type | # Housing Units | % Housing Units |
| Single Unit, Detached | 282 | 48.7% |
| Single Unit, Attached | 150 | 25.9% |
| 2 Unit Apartments | 0 | 0.0% |
| 3 or 4 Unit Apartments | 13 | 2.2% |
| 5 to 9 Unit Apartments | 0 | 0.0% |
| 10 or more Apartments | 14 | 2.4% |
| Mobile Home / Other | 120 | 20.7% |
| Total | 579 | 100.0% |
Housing Structures by Occupancy in Middletown
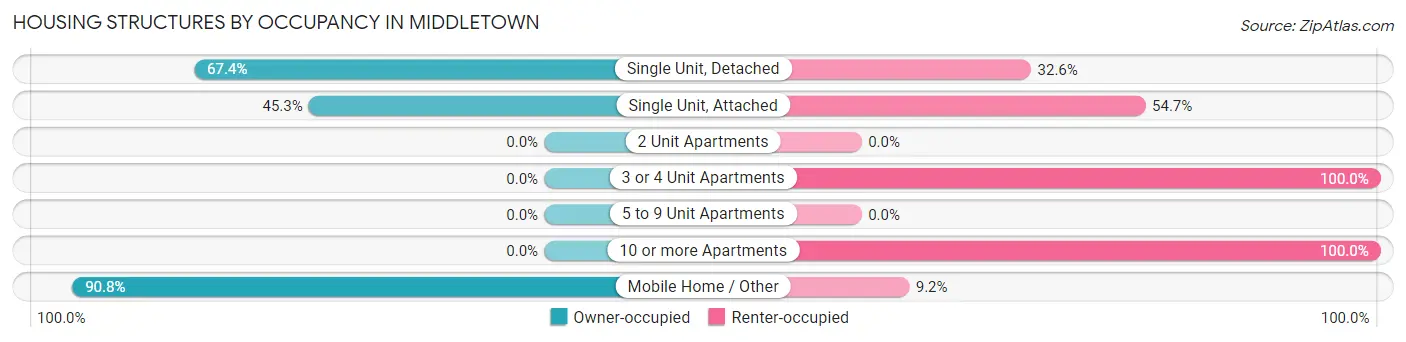
| Structure Type | Owner-occupied | Renter-occupied |
| Single Unit, Detached | 190 (67.4%) | 92 (32.6%) |
| Single Unit, Attached | 68 (45.3%) | 82 (54.7%) |
| 2 Unit Apartments | 0 (0.0%) | 0 (0.0%) |
| 3 or 4 Unit Apartments | 0 (0.0%) | 13 (100.0%) |
| 5 to 9 Unit Apartments | 0 (0.0%) | 0 (0.0%) |
| 10 or more Apartments | 0 (0.0%) | 14 (100.0%) |
| Mobile Home / Other | 109 (90.8%) | 11 (9.2%) |
| Total | 367 (63.4%) | 212 (36.6%) |
Housing Structures by Number of Rooms in Middletown
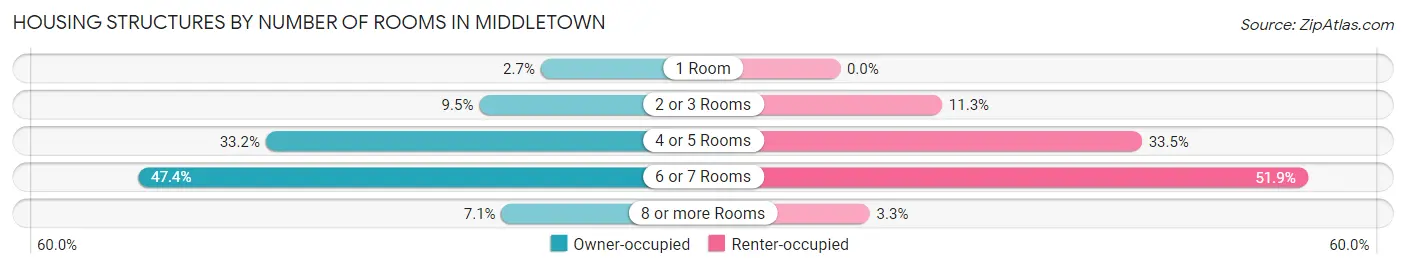
| Number of Rooms | Owner-occupied | Renter-occupied |
| 1 Room | 10 (2.7%) | 0 (0.0%) |
| 2 or 3 Rooms | 35 (9.5%) | 24 (11.3%) |
| 4 or 5 Rooms | 122 (33.2%) | 71 (33.5%) |
| 6 or 7 Rooms | 174 (47.4%) | 110 (51.9%) |
| 8 or more Rooms | 26 (7.1%) | 7 (3.3%) |
| Total | 367 (100.0%) | 212 (100.0%) |
Housing Structure by Heating Type in Middletown
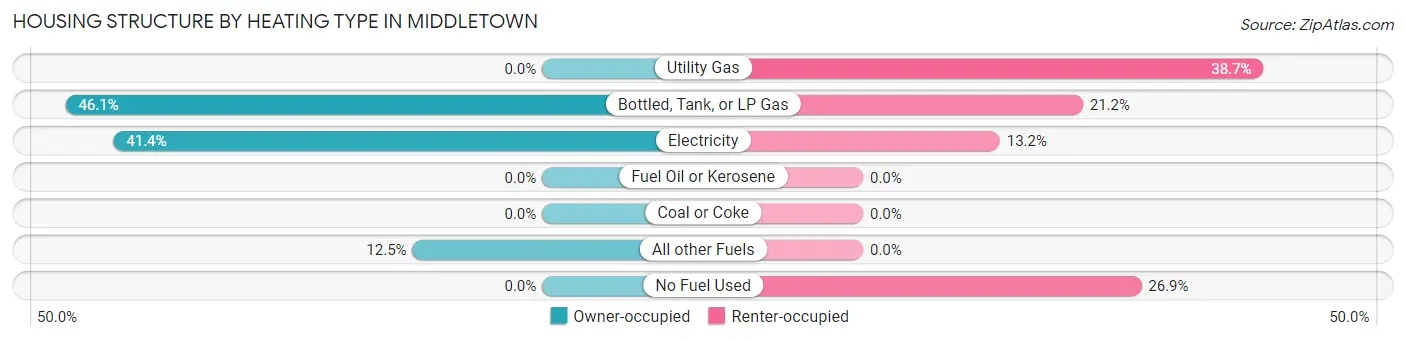
| Heating Type | Owner-occupied | Renter-occupied |
| Utility Gas | 0 (0.0%) | 82 (38.7%) |
| Bottled, Tank, or LP Gas | 169 (46.1%) | 45 (21.2%) |
| Electricity | 152 (41.4%) | 28 (13.2%) |
| Fuel Oil or Kerosene | 0 (0.0%) | 0 (0.0%) |
| Coal or Coke | 0 (0.0%) | 0 (0.0%) |
| All other Fuels | 46 (12.5%) | 0 (0.0%) |
| No Fuel Used | 0 (0.0%) | 57 (26.9%) |
| Total | 367 (100.0%) | 212 (100.0%) |
Household Vehicle Usage in Middletown
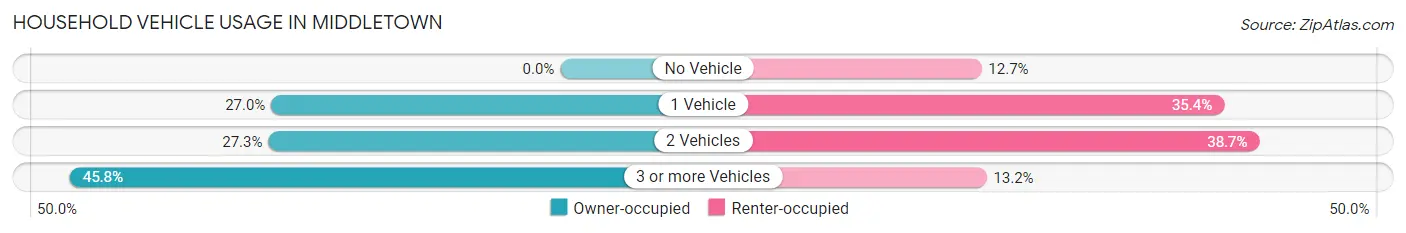
| Vehicles per Household | Owner-occupied | Renter-occupied |
| No Vehicle | 0 (0.0%) | 27 (12.7%) |
| 1 Vehicle | 99 (27.0%) | 75 (35.4%) |
| 2 Vehicles | 100 (27.3%) | 82 (38.7%) |
| 3 or more Vehicles | 168 (45.8%) | 28 (13.2%) |
| Total | 367 (100.0%) | 212 (100.0%) |
Real Estate & Mortgages in Middletown
Real Estate and Mortgage Overview in Middletown
| Characteristic | Without Mortgage | With Mortgage |
| Housing Units | 226 | 141 |
| Median Property Value | $456,000 | $0 |
| Median Household Income | - | - |
| Monthly Housing Costs | $733 | $78 |
| Real Estate Taxes | $1,800 | $0 |
Property Value by Mortgage Status in Middletown
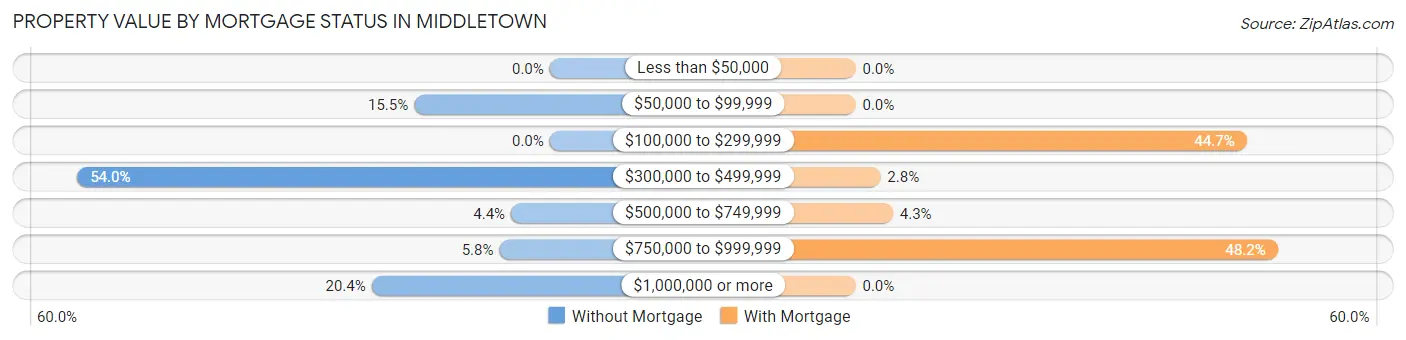
| Property Value | Without Mortgage | With Mortgage |
| Less than $50,000 | 0 (0.0%) | 0 (0.0%) |
| $50,000 to $99,999 | 35 (15.5%) | 0 (0.0%) |
| $100,000 to $299,999 | 0 (0.0%) | 63 (44.7%) |
| $300,000 to $499,999 | 122 (54.0%) | 4 (2.8%) |
| $500,000 to $749,999 | 10 (4.4%) | 6 (4.3%) |
| $750,000 to $999,999 | 13 (5.8%) | 68 (48.2%) |
| $1,000,000 or more | 46 (20.3%) | 0 (0.0%) |
| Total | 226 (100.0%) | 141 (100.0%) |
Household Income by Mortgage Status in Middletown
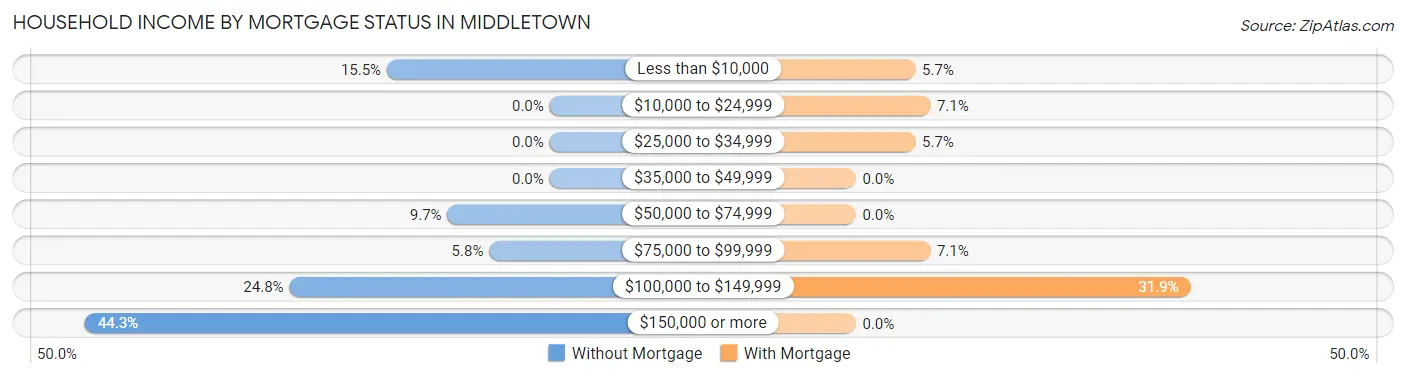
| Household Income | Without Mortgage | With Mortgage |
| Less than $10,000 | 35 (15.5%) | 8 (5.7%) |
| $10,000 to $24,999 | 0 (0.0%) | 10 (7.1%) |
| $25,000 to $34,999 | 0 (0.0%) | 8 (5.7%) |
| $35,000 to $49,999 | 0 (0.0%) | 0 (0.0%) |
| $50,000 to $74,999 | 22 (9.7%) | 0 (0.0%) |
| $75,000 to $99,999 | 13 (5.8%) | 10 (7.1%) |
| $100,000 to $149,999 | 56 (24.8%) | 45 (31.9%) |
| $150,000 or more | 100 (44.3%) | 0 (0.0%) |
| Total | 226 (100.0%) | 141 (100.0%) |
Property Value to Household Income Ratio in Middletown
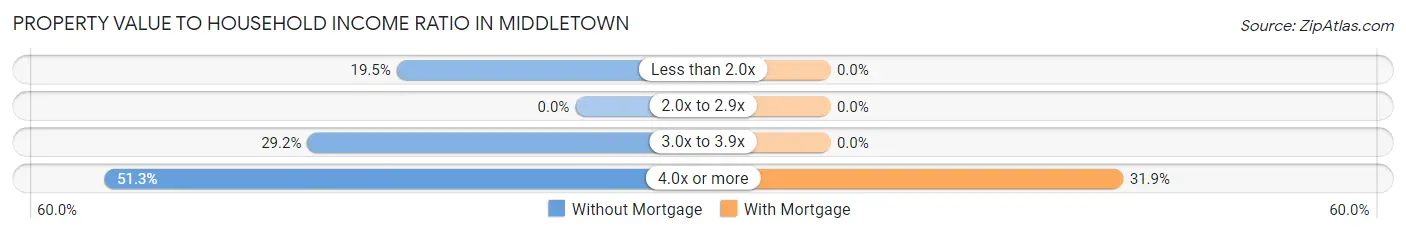
| Value-to-Income Ratio | Without Mortgage | With Mortgage |
| Less than 2.0x | 44 (19.5%) | 0 (0.0%) |
| 2.0x to 2.9x | 0 (0.0%) | 0 (0.0%) |
| 3.0x to 3.9x | 66 (29.2%) | 0 (0.0%) |
| 4.0x or more | 116 (51.3%) | 45 (31.9%) |
| Total | 226 (100.0%) | 141 (100.0%) |
Real Estate Taxes by Mortgage Status in Middletown
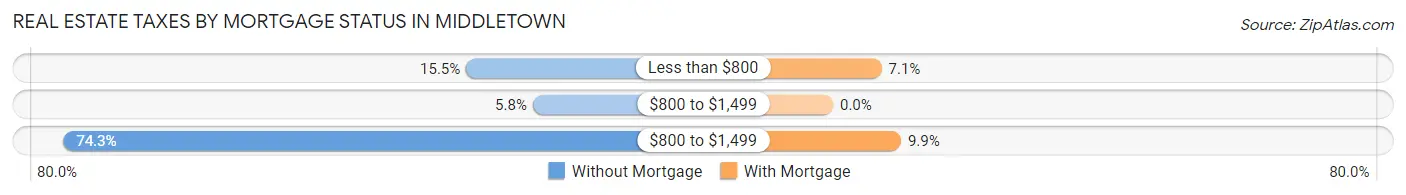
| Property Taxes | Without Mortgage | With Mortgage |
| Less than $800 | 35 (15.5%) | 10 (7.1%) |
| $800 to $1,499 | 13 (5.8%) | 0 (0.0%) |
| $800 to $1,499 | 168 (74.3%) | 14 (9.9%) |
| Total | 226 (100.0%) | 141 (100.0%) |
Health & Disability in Middletown
Health Insurance Coverage by Age in Middletown
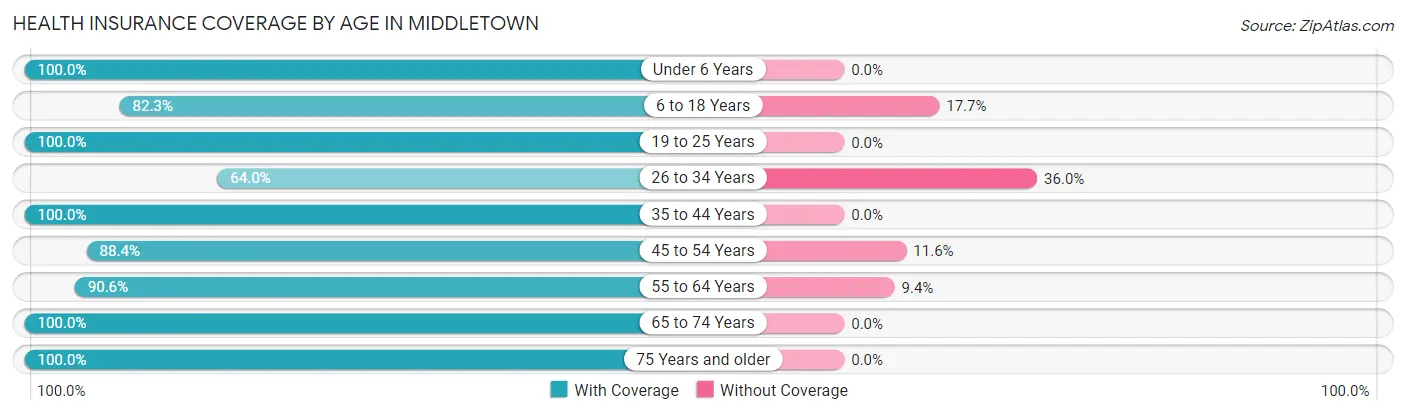
| Age Bracket | With Coverage | Without Coverage |
| Under 6 Years | 162 (100.0%) | 0 (0.0%) |
| 6 to 18 Years | 353 (82.3%) | 76 (17.7%) |
| 19 to 25 Years | 92 (100.0%) | 0 (0.0%) |
| 26 to 34 Years | 146 (64.0%) | 82 (36.0%) |
| 35 to 44 Years | 106 (100.0%) | 0 (0.0%) |
| 45 to 54 Years | 275 (88.4%) | 36 (11.6%) |
| 55 to 64 Years | 203 (90.6%) | 21 (9.4%) |
| 65 to 74 Years | 192 (100.0%) | 0 (0.0%) |
| 75 Years and older | 4 (100.0%) | 0 (0.0%) |
| Total | 1,533 (87.7%) | 215 (12.3%) |
Health Insurance Coverage by Citizenship Status in Middletown
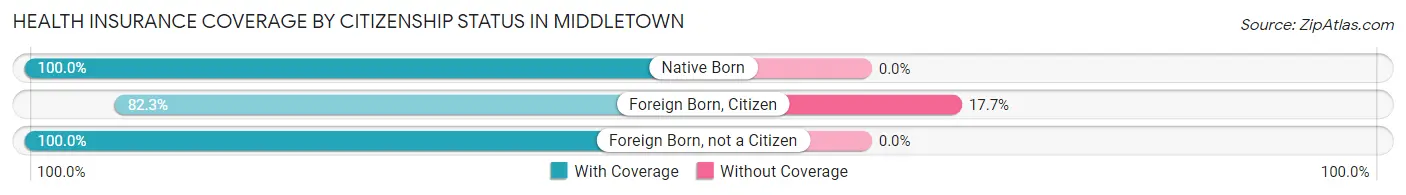
| Citizenship Status | With Coverage | Without Coverage |
| Native Born | 162 (100.0%) | 0 (0.0%) |
| Foreign Born, Citizen | 353 (82.3%) | 76 (17.7%) |
| Foreign Born, not a Citizen | 92 (100.0%) | 0 (0.0%) |
Health Insurance Coverage by Household Income in Middletown
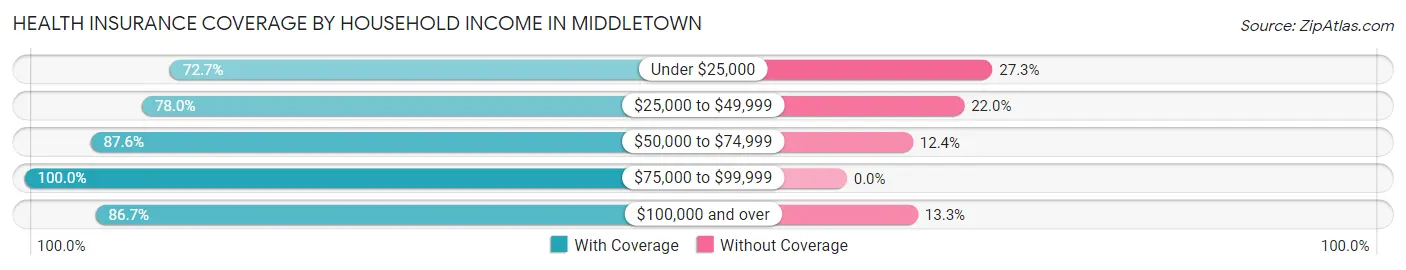
| Household Income | With Coverage | Without Coverage |
| Under $25,000 | 56 (72.7%) | 21 (27.3%) |
| $25,000 to $49,999 | 39 (78.0%) | 11 (22.0%) |
| $50,000 to $74,999 | 177 (87.6%) | 25 (12.4%) |
| $75,000 to $99,999 | 233 (100.0%) | 0 (0.0%) |
| $100,000 and over | 1,028 (86.7%) | 158 (13.3%) |
Public vs Private Health Insurance Coverage by Age in Middletown
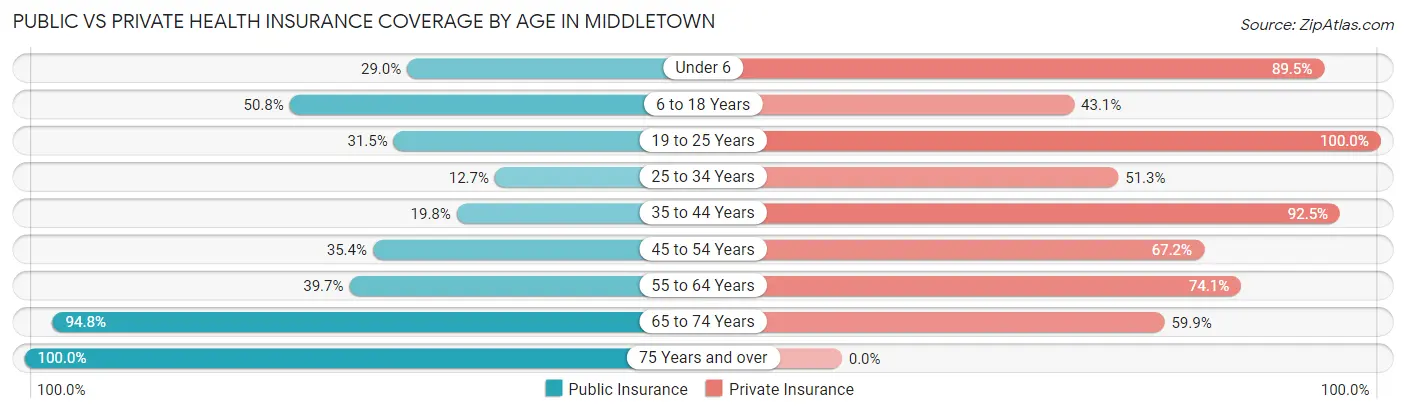
| Age Bracket | Public Insurance | Private Insurance |
| Under 6 | 47 (29.0%) | 145 (89.5%) |
| 6 to 18 Years | 218 (50.8%) | 185 (43.1%) |
| 19 to 25 Years | 29 (31.5%) | 92 (100.0%) |
| 25 to 34 Years | 29 (12.7%) | 117 (51.3%) |
| 35 to 44 Years | 21 (19.8%) | 98 (92.4%) |
| 45 to 54 Years | 110 (35.4%) | 209 (67.2%) |
| 55 to 64 Years | 89 (39.7%) | 166 (74.1%) |
| 65 to 74 Years | 182 (94.8%) | 115 (59.9%) |
| 75 Years and over | 4 (100.0%) | 0 (0.0%) |
| Total | 729 (41.7%) | 1,127 (64.5%) |
Disability Status by Sex by Age in Middletown
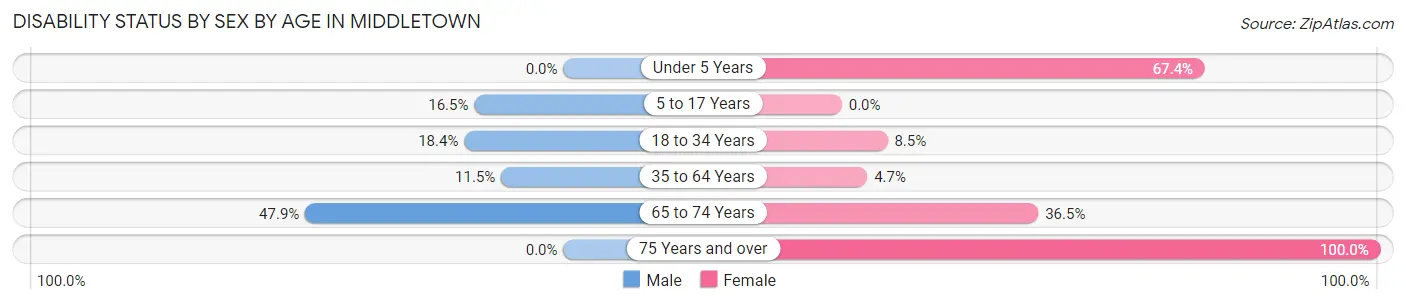
| Age Bracket | Male | Female |
| Under 5 Years | 0 (0.0%) | 62 (67.4%) |
| 5 to 17 Years | 40 (16.5%) | 0 (0.0%) |
| 18 to 34 Years | 30 (18.4%) | 14 (8.5%) |
| 35 to 64 Years | 30 (11.5%) | 18 (4.7%) |
| 65 to 74 Years | 46 (47.9%) | 35 (36.5%) |
| 75 Years and over | 0 (0.0%) | 4 (100.0%) |
Disability Class by Sex by Age in Middletown
Disability Class: Hearing Difficulty
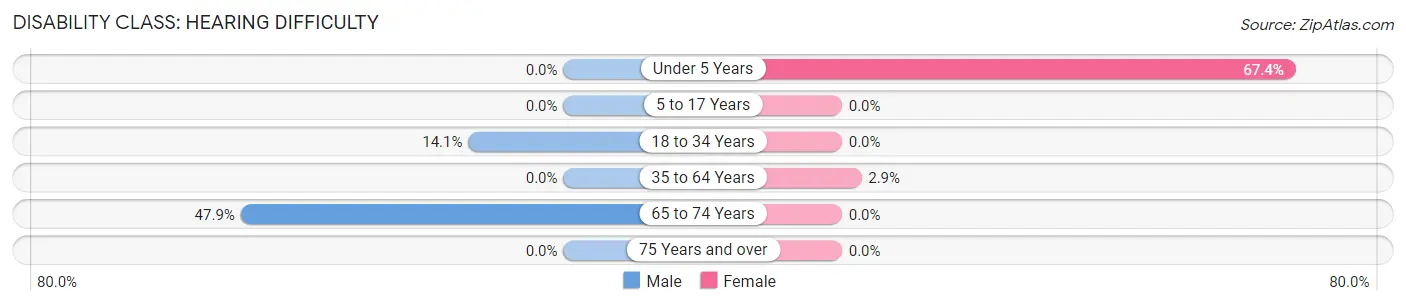
| Age Bracket | Male | Female |
| Under 5 Years | 0 (0.0%) | 62 (67.4%) |
| 5 to 17 Years | 0 (0.0%) | 0 (0.0%) |
| 18 to 34 Years | 23 (14.1%) | 0 (0.0%) |
| 35 to 64 Years | 0 (0.0%) | 11 (2.9%) |
| 65 to 74 Years | 46 (47.9%) | 0 (0.0%) |
| 75 Years and over | 0 (0.0%) | 0 (0.0%) |
Disability Class: Vision Difficulty
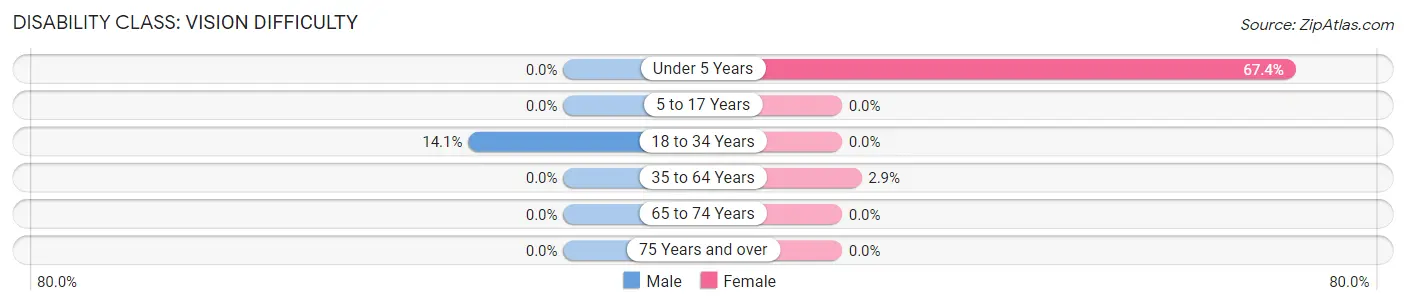
| Age Bracket | Male | Female |
| Under 5 Years | 0 (0.0%) | 62 (67.4%) |
| 5 to 17 Years | 0 (0.0%) | 0 (0.0%) |
| 18 to 34 Years | 23 (14.1%) | 0 (0.0%) |
| 35 to 64 Years | 0 (0.0%) | 11 (2.9%) |
| 65 to 74 Years | 0 (0.0%) | 0 (0.0%) |
| 75 Years and over | 0 (0.0%) | 0 (0.0%) |
Disability Class: Cognitive Difficulty
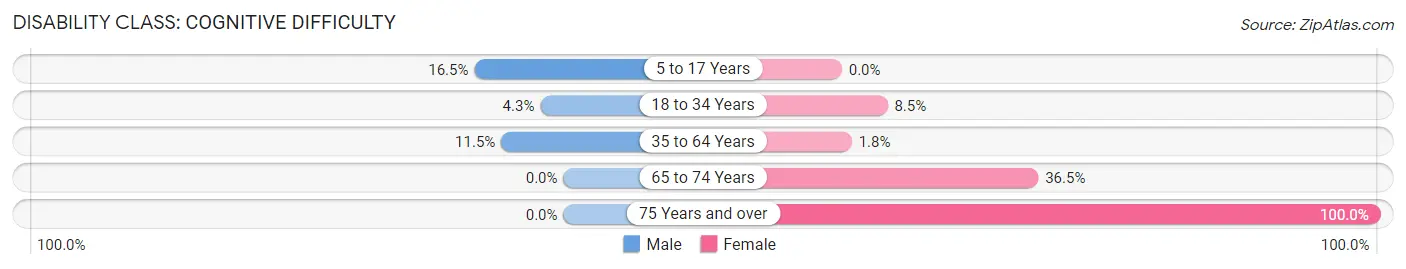
| Age Bracket | Male | Female |
| 5 to 17 Years | 40 (16.5%) | 0 (0.0%) |
| 18 to 34 Years | 7 (4.3%) | 14 (8.5%) |
| 35 to 64 Years | 30 (11.5%) | 7 (1.8%) |
| 65 to 74 Years | 0 (0.0%) | 35 (36.5%) |
| 75 Years and over | 0 (0.0%) | 4 (100.0%) |
Disability Class: Ambulatory Difficulty
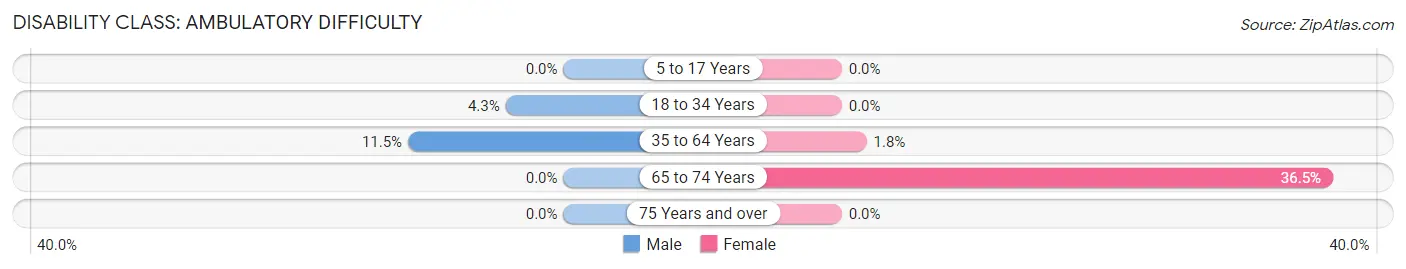
| Age Bracket | Male | Female |
| 5 to 17 Years | 0 (0.0%) | 0 (0.0%) |
| 18 to 34 Years | 7 (4.3%) | 0 (0.0%) |
| 35 to 64 Years | 30 (11.5%) | 7 (1.8%) |
| 65 to 74 Years | 0 (0.0%) | 35 (36.5%) |
| 75 Years and over | 0 (0.0%) | 0 (0.0%) |
Disability Class: Self-Care Difficulty
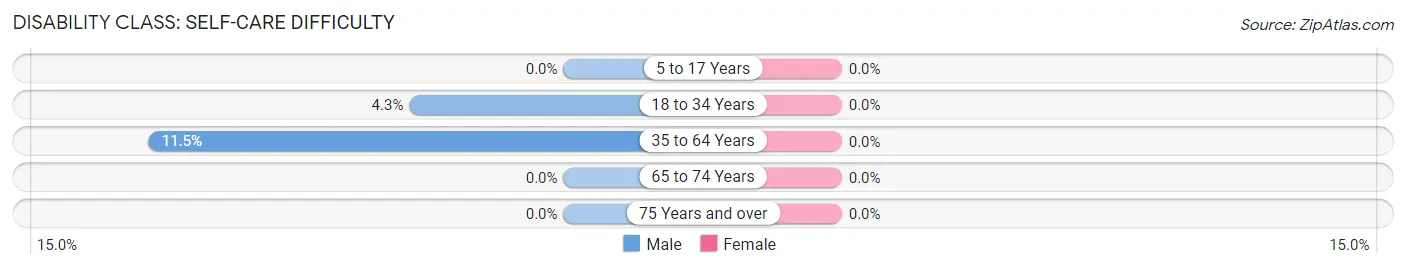
| Age Bracket | Male | Female |
| 5 to 17 Years | 0 (0.0%) | 0 (0.0%) |
| 18 to 34 Years | 7 (4.3%) | 0 (0.0%) |
| 35 to 64 Years | 30 (11.5%) | 0 (0.0%) |
| 65 to 74 Years | 0 (0.0%) | 0 (0.0%) |
| 75 Years and over | 0 (0.0%) | 0 (0.0%) |
Technology Access in Middletown
Computing Device Access in Middletown
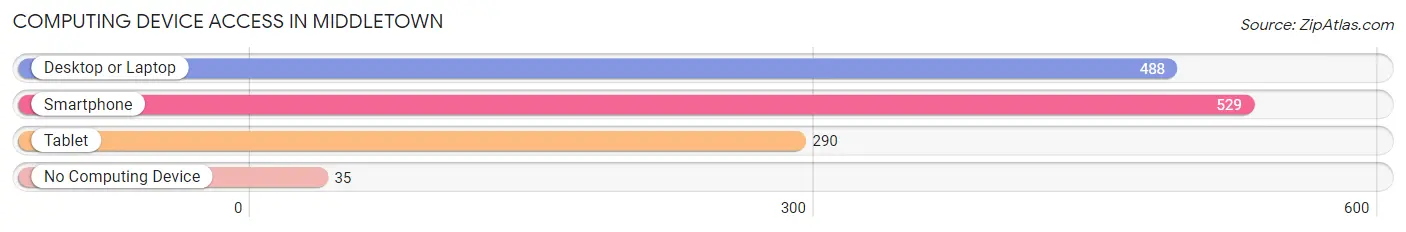
| Device Type | # Households | % Households |
| Desktop or Laptop | 488 | 84.3% |
| Smartphone | 529 | 91.4% |
| Tablet | 290 | 50.1% |
| No Computing Device | 35 | 6.0% |
| Total | 579 | 100.0% |
Internet Access in Middletown
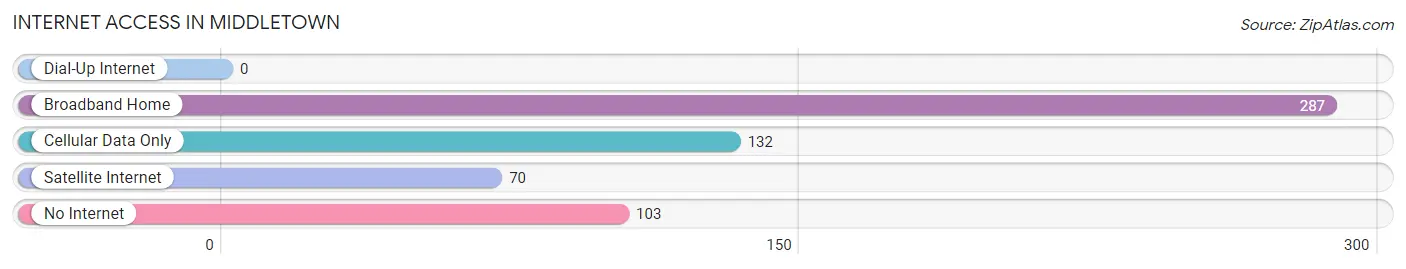
| Internet Type | # Households | % Households |
| Dial-Up Internet | 0 | 0.0% |
| Broadband Home | 287 | 49.6% |
| Cellular Data Only | 132 | 22.8% |
| Satellite Internet | 70 | 12.1% |
| No Internet | 103 | 17.8% |
| Total | 579 | 100.0% |
Middletown Summary
Middletown is a small town located in Lake County, California, United States. It is situated in the northern part of the state, about 90 miles north of San Francisco. The town has a population of about 1,300 people and is the county seat of Lake County.
History
Middletown was founded in 1859 by a group of settlers from the East Coast. The town was named after the middle of three towns that were established in the area. The other two towns were Lower Lake and Upper Lake. The town was originally a mining town, and the first post office was established in 1864.
The town grew rapidly in the late 19th century, and by the early 20th century, it had become a popular tourist destination. The town was known for its hot springs, which were believed to have healing properties. The town also had a thriving lumber industry, and the local economy was largely based on the timber industry.
In the 1950s, the town began to decline as the timber industry declined and the hot springs lost their popularity. The town was also affected by the construction of the Clear Lake Dam, which flooded much of the surrounding area. The town was eventually incorporated in 1965.
Geography
Middletown is located in the northern part of Lake County, California. It is situated in the Clear Lake Valley, about 90 miles north of San Francisco. The town is surrounded by rolling hills and is located at the base of Mount Konocti. The town is located at an elevation of 1,400 feet above sea level.
The climate in Middletown is Mediterranean, with hot, dry summers and mild, wet winters. The average annual temperature is around 60 degrees Fahrenheit. The town receives an average of 20 inches of rain per year.
Economy
The economy of Middletown is largely based on tourism and agriculture. The town is a popular tourist destination, and there are several wineries and vineyards in the area. The town is also home to several small businesses, including restaurants, shops, and galleries.
The town is also home to a number of agricultural operations, including cattle ranches, vineyards, and orchards. The local economy is also supported by the timber industry, which is still active in the area.
Demographics
As of the 2010 census, the population of Middletown was 1,323. The racial makeup of the town was 87.3% White, 0.8% African American, 0.7% Native American, 0.7% Asian, 0.2% Pacific Islander, 8.2% from other races, and 2.1% from two or more races. Hispanic or Latino of any race were 16.3% of the population.
The median household income in Middletown was $41,250, and the median family income was $48,750. The per capita income was $20,945. About 15.3% of the population was below the poverty line.
Conclusion
Middletown is a small town located in Lake County, California. It has a population of about 1,300 people and is the county seat of Lake County. The town was founded in 1859 and was originally a mining town. The local economy is largely based on tourism and agriculture, and the town is a popular tourist destination. The town has a Mediterranean climate, with hot, dry summers and mild, wet winters. The population of Middletown is mostly White, with a significant Hispanic or Latino population. The median household income in Middletown is $41,250, and the per capita income is $20,945.
Common Questions
What is Per Capita Income in Middletown?
Per Capita income in Middletown is $44,188.
What is the Median Family Income in Middletown?
Median Family Income in Middletown is $138,585.
What is the Median Household income in Middletown?
Median Household Income in Middletown is $163,247.
What is Inequality or Gini Index in Middletown?
Inequality or Gini Index in Middletown is 0.33.
What is the Total Population of Middletown?
Total Population of Middletown is 1,748.
What is the Total Male Population of Middletown?
Total Male Population of Middletown is 814.
What is the Total Female Population of Middletown?
Total Female Population of Middletown is 934.
What is the Ratio of Males per 100 Females in Middletown?
There are 87.15 Males per 100 Females in Middletown.
What is the Ratio of Females per 100 Males in Middletown?
There are 114.74 Females per 100 Males in Middletown.
What is the Median Population Age in Middletown?
Median Population Age in Middletown is 30.9 Years.
What is the Average Family Size in Middletown
Average Family Size in Middletown is 3.2 People.
What is the Average Household Size in Middletown
Average Household Size in Middletown is 3.0 People.
How Large is the Labor Force in Middletown?
There are 876 People in the Labor Forcein in Middletown.
What is the Percentage of People in the Labor Force in Middletown?
69.0% of People are in the Labor Force in Middletown.
What is the Unemployment Rate in Middletown?
Unemployment Rate in Middletown is 10.7%.