Lucerne, CA Map & Demographics
Lucerne Map
Lucerne Overview
$24,933
PER CAPITA INCOME
$47,192
AVG FAMILY INCOME
$46,026
AVG HOUSEHOLD INCOME
10.0%
WAGE / INCOME GAP [ % ]
90.0¢/ $1
WAGE / INCOME GAP [ $ ]
0.42
INEQUALITY / GINI INDEX
3,085
TOTAL POPULATION
1,564
MALE POPULATION
1,521
FEMALE POPULATION
102.83
MALES / 100 FEMALES
97.25
FEMALES / 100 MALES
37.0
MEDIAN AGE
3.0
AVG FAMILY SIZE
2.2
AVG HOUSEHOLD SIZE
1,423
LABOR FORCE [ PEOPLE ]
54.6%
PERCENT IN LABOR FORCE
9.1%
UNEMPLOYMENT RATE
Lucerne Zip Codes
Lucerne Area Codes
Income in Lucerne
Income Overview in Lucerne
Per Capita Income in Lucerne is $24,933, while median incomes of families and households are $47,192 and $46,026 respectively.
| Characteristic | Number | Measure |
| Per Capita Income | 3,085 | $24,933 |
| Median Family Income | 697 | $47,192 |
| Mean Family Income | 697 | $59,315 |
| Median Household Income | 1,397 | $46,026 |
| Mean Household Income | 1,397 | $51,693 |
| Income Deficit | 697 | $0 |
| Wage / Income Gap (%) | 3,085 | 9.99% |
| Wage / Income Gap ($) | 3,085 | 90.01¢ per $1 |
| Gini / Inequality Index | 3,085 | 0.42 |
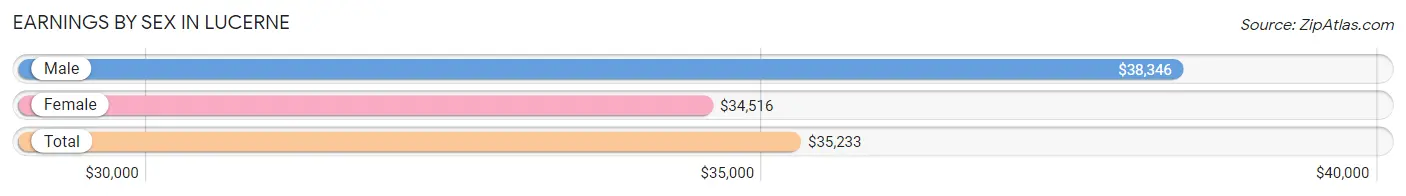
Earnings by Sex in Lucerne
Average Earnings in Lucerne are $35,233, $38,346 for men and $34,516 for women, a difference of 10.0%.
| Sex | Number | Average Earnings |
| Male | 773 (51.8%) | $38,346 |
| Female | 718 (48.2%) | $34,516 |
| Total | 1,491 (100.0%) | $35,233 |
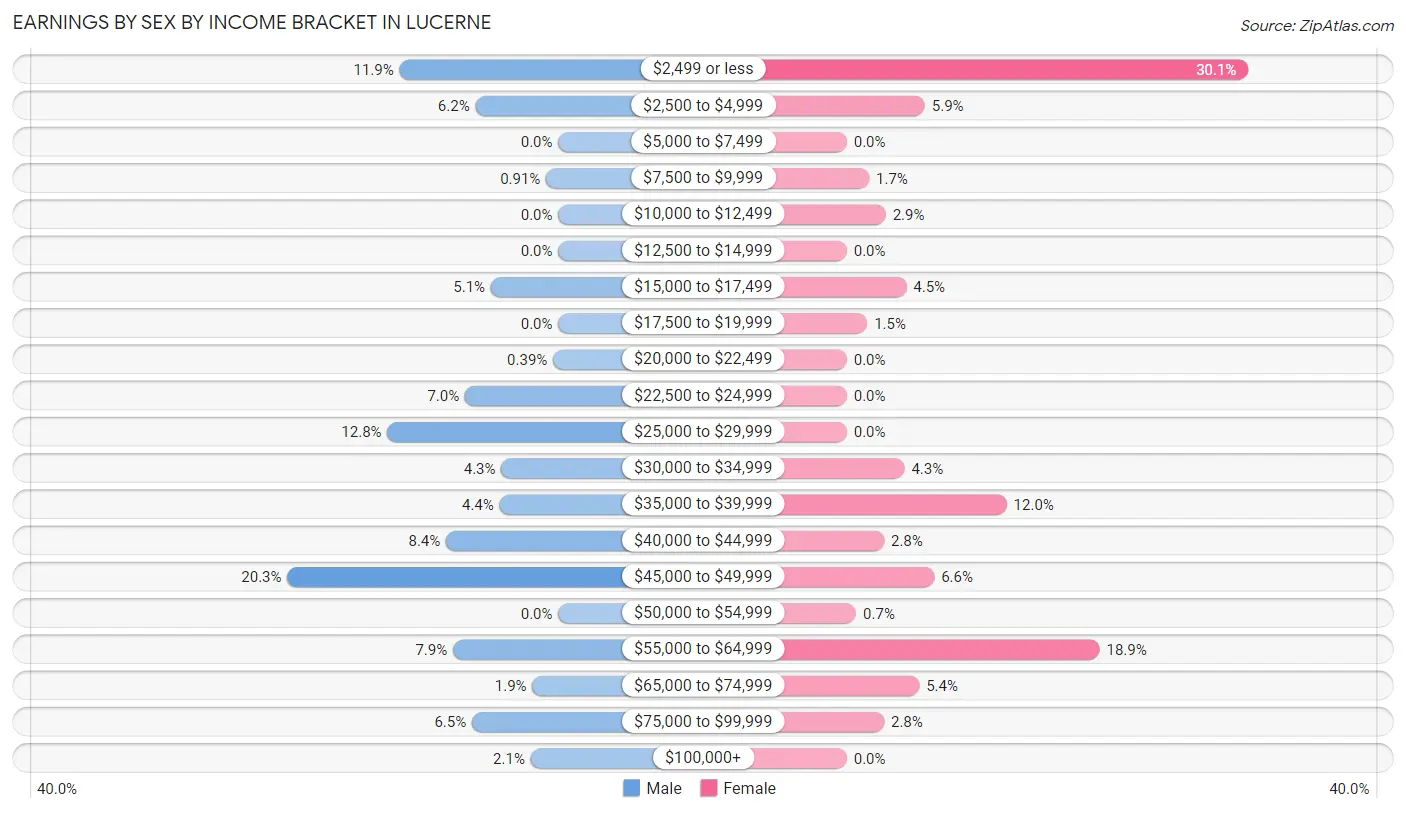
Earnings by Sex by Income Bracket in Lucerne
The most common earnings brackets in Lucerne are $45,000 to $49,999 for men (157 | 20.3%) and $2,499 or less for women (216 | 30.1%).
| Income | Male | Female |
| $2,499 or less | 92 (11.9%) | 216 (30.1%) |
| $2,500 to $4,999 | 48 (6.2%) | 42 (5.9%) |
| $5,000 to $7,499 | 0 (0.0%) | 0 (0.0%) |
| $7,500 to $9,999 | 7 (0.9%) | 12 (1.7%) |
| $10,000 to $12,499 | 0 (0.0%) | 21 (2.9%) |
| $12,500 to $14,999 | 0 (0.0%) | 0 (0.0%) |
| $15,000 to $17,499 | 39 (5.1%) | 32 (4.5%) |
| $17,500 to $19,999 | 0 (0.0%) | 11 (1.5%) |
| $20,000 to $22,499 | 3 (0.4%) | 0 (0.0%) |
| $22,500 to $24,999 | 54 (7.0%) | 0 (0.0%) |
| $25,000 to $29,999 | 99 (12.8%) | 0 (0.0%) |
| $30,000 to $34,999 | 33 (4.3%) | 31 (4.3%) |
| $35,000 to $39,999 | 34 (4.4%) | 86 (12.0%) |
| $40,000 to $44,999 | 65 (8.4%) | 20 (2.8%) |
| $45,000 to $49,999 | 157 (20.3%) | 47 (6.6%) |
| $50,000 to $54,999 | 0 (0.0%) | 5 (0.7%) |
| $55,000 to $64,999 | 61 (7.9%) | 136 (18.9%) |
| $65,000 to $74,999 | 15 (1.9%) | 39 (5.4%) |
| $75,000 to $99,999 | 50 (6.5%) | 20 (2.8%) |
| $100,000+ | 16 (2.1%) | 0 (0.0%) |
| Total | 773 (100.0%) | 718 (100.0%) |
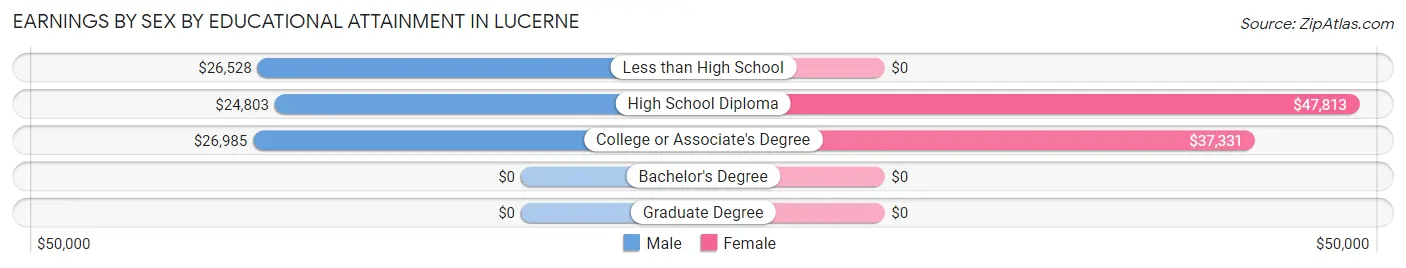
Earnings by Sex by Educational Attainment in Lucerne
Average earnings in Lucerne are $28,750 for men and $45,263 for women, a difference of 36.5%. Men with an educational attainment of college or associate's degree enjoy the highest average annual earnings of $26,985, while those with high school diploma education earn the least with $24,803. Women with an educational attainment of high school diploma earn the most with the average annual earnings of $47,813, while those with college or associate's degree education have the smallest earnings of $37,331.
| Educational Attainment | Male Income | Female Income |
| Less than High School | $26,528 | $0 |
| High School Diploma | $24,803 | $47,813 |
| College or Associate's Degree | $26,985 | $37,331 |
| Bachelor's Degree | - | - |
| Graduate Degree | - | - |
| Total | $28,750 | $45,263 |
Family Income in Lucerne
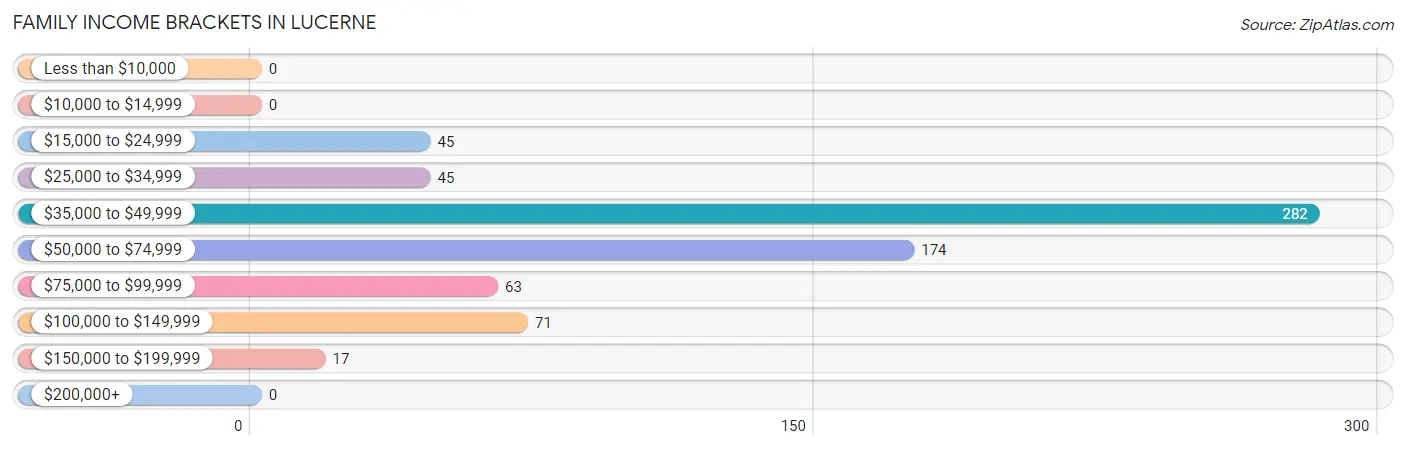
Family Income Brackets in Lucerne
According to the Lucerne family income data, there are 282 families falling into the $35,000 to $49,999 income range, which is the most common income bracket and makes up 40.5% of all families.
| Income Bracket | # Families | % Families |
| Less than $10,000 | 0 | 0.0% |
| $10,000 to $14,999 | 0 | 0.0% |
| $15,000 to $24,999 | 45 | 6.5% |
| $25,000 to $34,999 | 45 | 6.5% |
| $35,000 to $49,999 | 282 | 40.5% |
| $50,000 to $74,999 | 174 | 25.0% |
| $75,000 to $99,999 | 63 | 9.0% |
| $100,000 to $149,999 | 71 | 10.2% |
| $150,000 to $199,999 | 17 | 2.4% |
| $200,000+ | 0 | 0.0% |
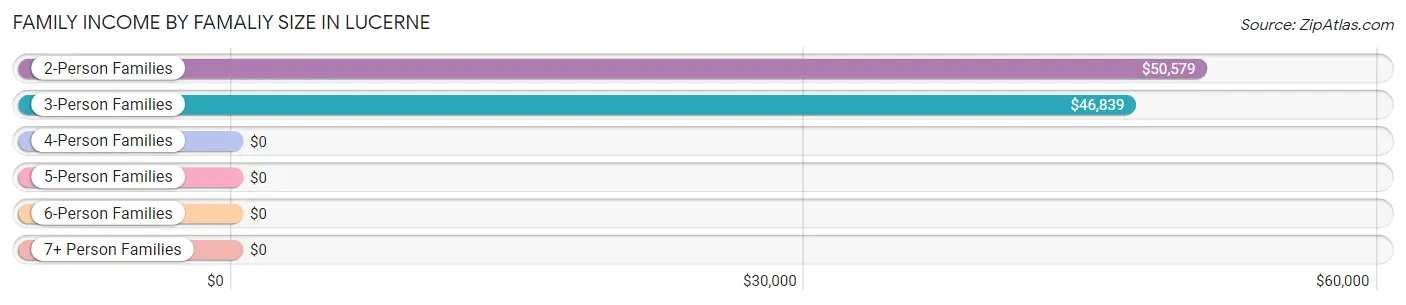
Family Income by Famaliy Size in Lucerne
2-person families (351 | 50.4%) account for the highest median family income in Lucerne with $50,579 per family, while 2-person families (351 | 50.4%) have the highest median income of $25,290 per family member.
| Income Bracket | # Families | Median Income |
| 2-Person Families | 351 (50.4%) | $50,579 |
| 3-Person Families | 265 (38.0%) | $46,839 |
| 4-Person Families | 69 (9.9%) | $0 |
| 5-Person Families | 0 (0.0%) | $0 |
| 6-Person Families | 0 (0.0%) | $0 |
| 7+ Person Families | 12 (1.7%) | $0 |
| Total | 697 (100.0%) | $47,192 |
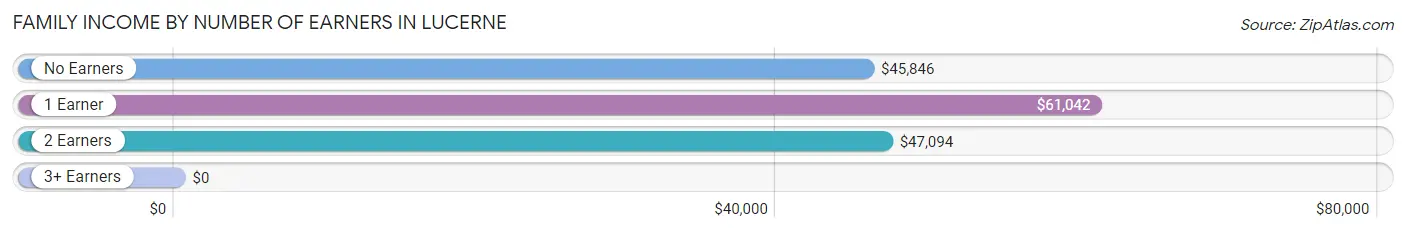
Family Income by Number of Earners in Lucerne
| Number of Earners | # Families | Median Income |
| No Earners | 119 (17.1%) | $45,846 |
| 1 Earner | 217 (31.1%) | $61,042 |
| 2 Earners | 349 (50.1%) | $47,094 |
| 3+ Earners | 12 (1.7%) | $0 |
| Total | 697 (100.0%) | $47,192 |
Household Income in Lucerne
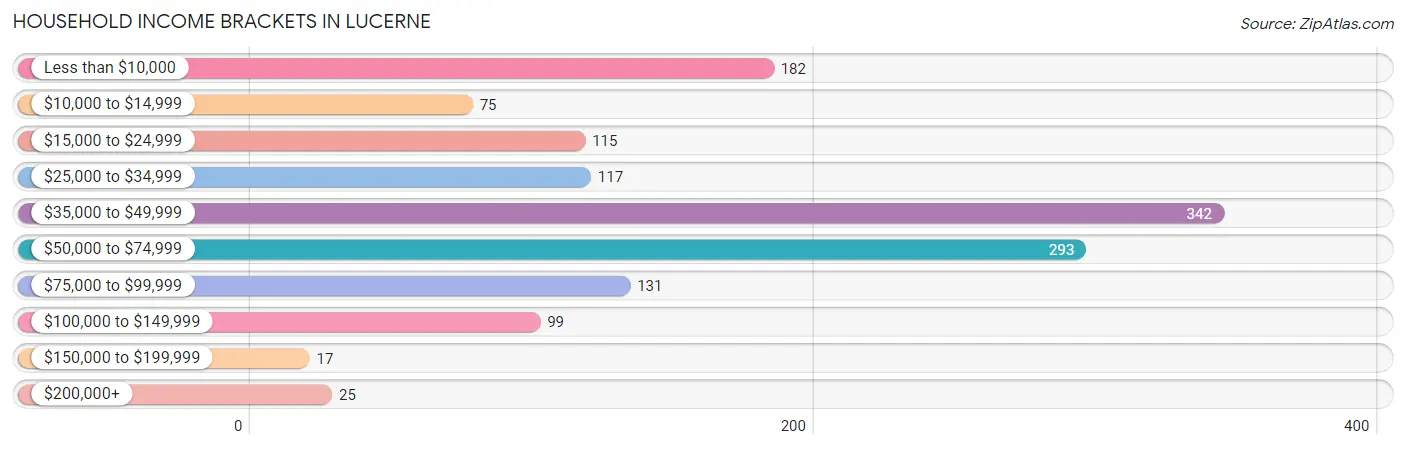
Household Income Brackets in Lucerne
With 342 households falling in the category, the $35,000 to $49,999 income range is the most frequent in Lucerne, accounting for 24.5% of all households. In contrast, only 17 households (1.2%) fall into the $150,000 to $199,999 income bracket, making it the least populous group.
| Income Bracket | # Households | % Households |
| Less than $10,000 | 182 | 13.0% |
| $10,000 to $14,999 | 75 | 5.4% |
| $15,000 to $24,999 | 115 | 8.2% |
| $25,000 to $34,999 | 117 | 8.4% |
| $35,000 to $49,999 | 342 | 24.5% |
| $50,000 to $74,999 | 293 | 21.0% |
| $75,000 to $99,999 | 131 | 9.4% |
| $100,000 to $149,999 | 99 | 7.1% |
| $150,000 to $199,999 | 17 | 1.2% |
| $200,000+ | 25 | 1.8% |
Household Income by Householder Age in Lucerne
The median household income in Lucerne is $46,026, with the highest median household income of $56,445 found in the 45 to 64 years age bracket for the primary householder. A total of 489 households (35.0%) fall into this category. Meanwhile, the 15 to 24 years age bracket for the primary householder has the lowest median household income of $0, with 244 households (17.5%) in this group.
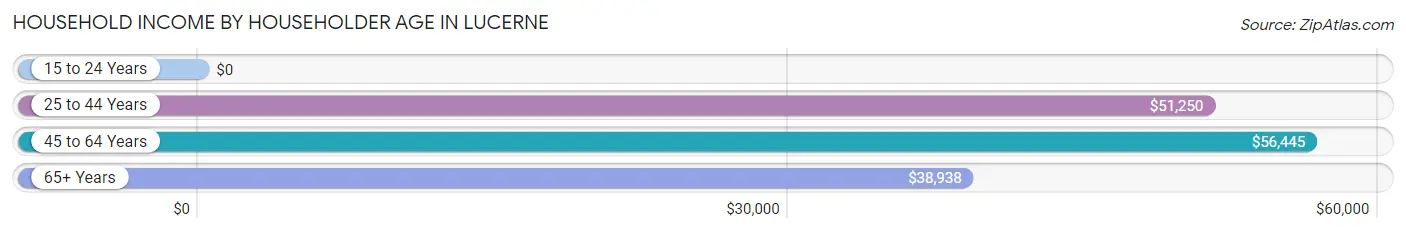
| Income Bracket | # Households | Median Income |
| 15 to 24 Years | 244 (17.5%) | $0 |
| 25 to 44 Years | 275 (19.7%) | $51,250 |
| 45 to 64 Years | 489 (35.0%) | $56,445 |
| 65+ Years | 389 (27.9%) | $38,938 |
| Total | 1,397 (100.0%) | $46,026 |
Poverty in Lucerne
Income Below Poverty by Sex and Age in Lucerne
With 18.0% poverty level for males and 15.1% for females among the residents of Lucerne, 18 to 24 year old males and 35 to 44 year old females are the most vulnerable to poverty, with 111 males (36.4%) and 43 females (49.4%) in their respective age groups living below the poverty level.
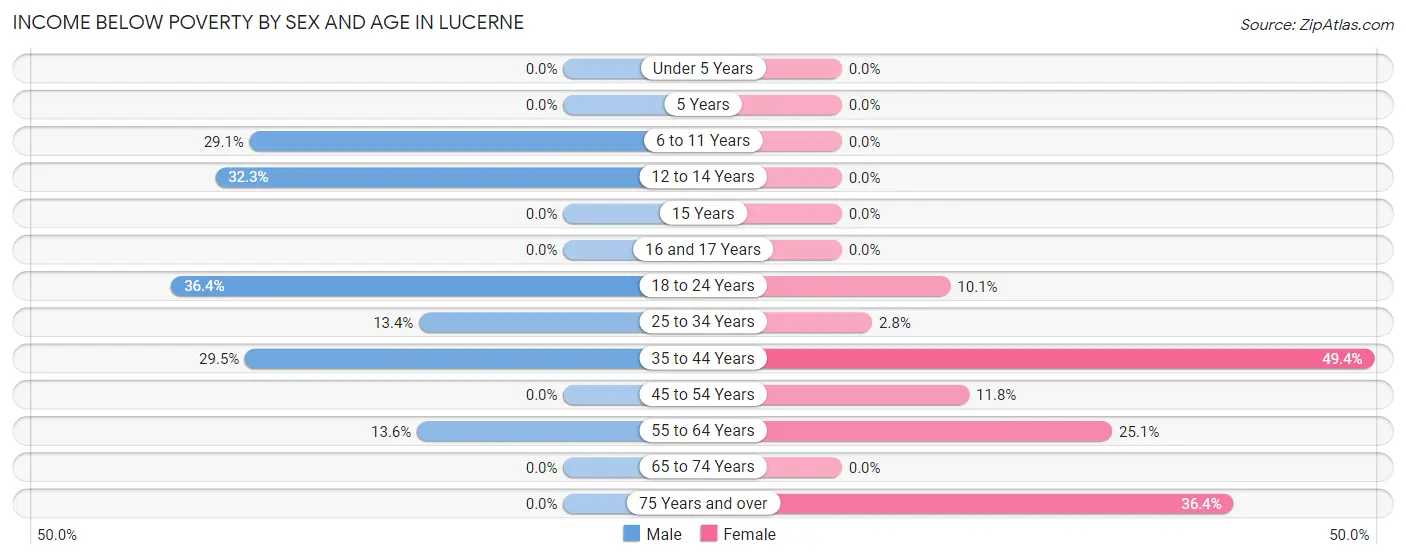
| Age Bracket | Male | Female |
| Under 5 Years | 0 (0.0%) | 0 (0.0%) |
| 5 Years | 0 (0.0%) | 0 (0.0%) |
| 6 to 11 Years | 23 (29.1%) | 0 (0.0%) |
| 12 to 14 Years | 21 (32.3%) | 0 (0.0%) |
| 15 Years | 0 (0.0%) | 0 (0.0%) |
| 16 and 17 Years | 0 (0.0%) | 0 (0.0%) |
| 18 to 24 Years | 111 (36.4%) | 24 (10.1%) |
| 25 to 34 Years | 40 (13.4%) | 5 (2.8%) |
| 35 to 44 Years | 57 (29.5%) | 43 (49.4%) |
| 45 to 54 Years | 0 (0.0%) | 13 (11.8%) |
| 55 to 64 Years | 30 (13.6%) | 83 (25.1%) |
| 65 to 74 Years | 0 (0.0%) | 0 (0.0%) |
| 75 Years and over | 0 (0.0%) | 56 (36.4%) |
| Total | 282 (18.0%) | 224 (15.1%) |
Income Above Poverty by Sex and Age in Lucerne
According to the poverty statistics in Lucerne, males aged under 5 years and females aged 5 years are the age groups that are most secure financially, with 100.0% of males and 100.0% of females in these age groups living above the poverty line.
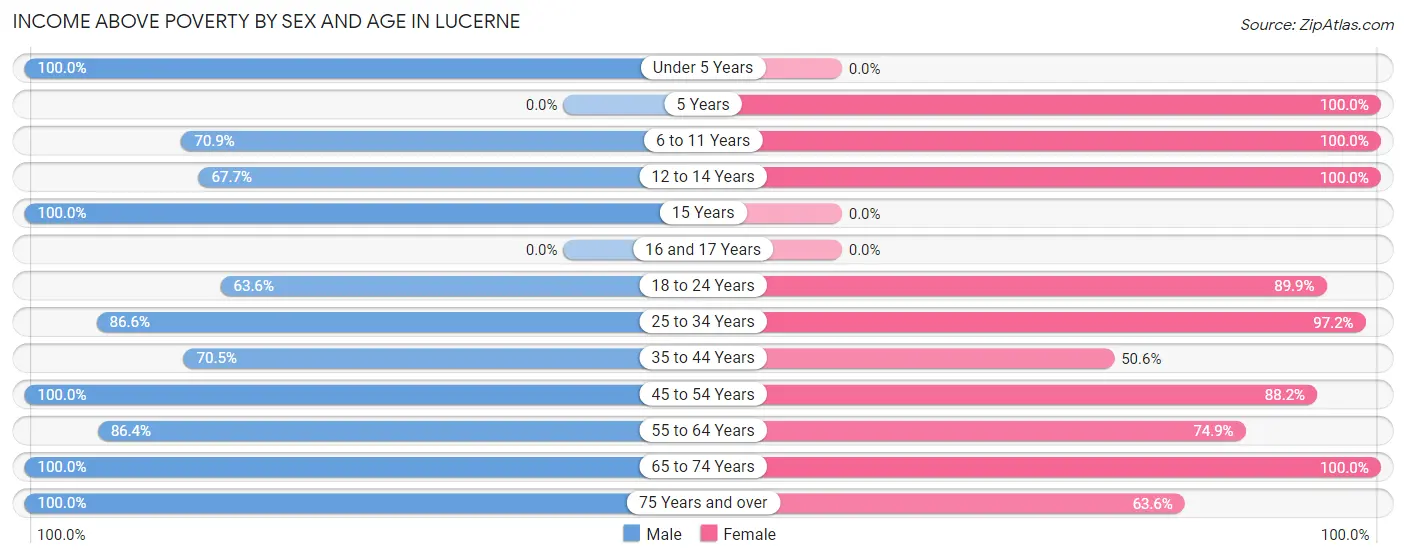
| Age Bracket | Male | Female |
| Under 5 Years | 79 (100.0%) | 0 (0.0%) |
| 5 Years | 0 (0.0%) | 17 (100.0%) |
| 6 to 11 Years | 56 (70.9%) | 170 (100.0%) |
| 12 to 14 Years | 44 (67.7%) | 18 (100.0%) |
| 15 Years | 16 (100.0%) | 0 (0.0%) |
| 16 and 17 Years | 0 (0.0%) | 0 (0.0%) |
| 18 to 24 Years | 194 (63.6%) | 214 (89.9%) |
| 25 to 34 Years | 259 (86.6%) | 172 (97.2%) |
| 35 to 44 Years | 136 (70.5%) | 44 (50.6%) |
| 45 to 54 Years | 9 (100.0%) | 97 (88.2%) |
| 55 to 64 Years | 191 (86.4%) | 248 (74.9%) |
| 65 to 74 Years | 146 (100.0%) | 184 (100.0%) |
| 75 Years and over | 152 (100.0%) | 98 (63.6%) |
| Total | 1,282 (82.0%) | 1,262 (84.9%) |
Income Below Poverty Among Married-Couple Families in Lucerne
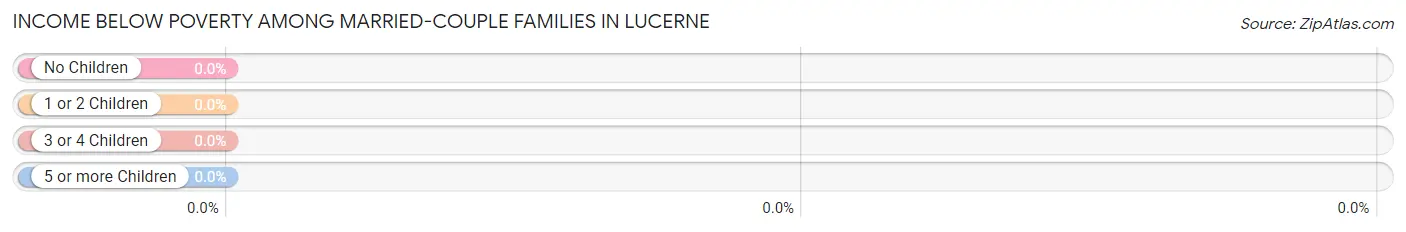
| Children | Above Poverty | Below Poverty |
| No Children | 294 (100.0%) | 0 (0.0%) |
| 1 or 2 Children | 202 (100.0%) | 0 (0.0%) |
| 3 or 4 Children | 12 (100.0%) | 0 (0.0%) |
| 5 or more Children | 0 (0.0%) | 0 (0.0%) |
| Total | 508 (100.0%) | 0 (0.0%) |
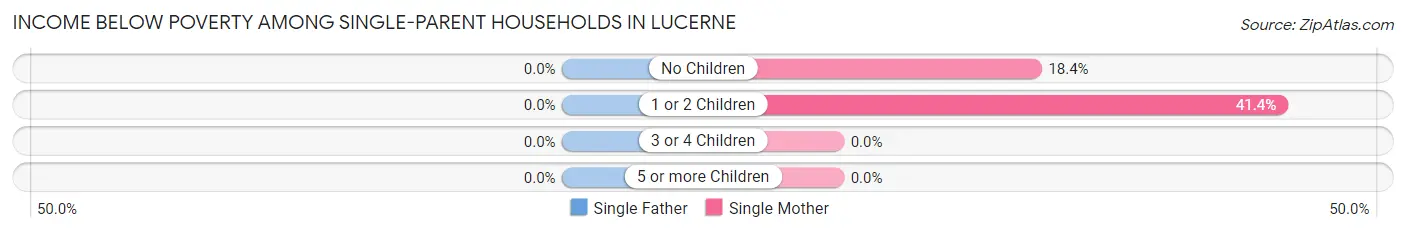
Income Below Poverty Among Single-Parent Households in Lucerne
| Children | Single Father | Single Mother |
| No Children | 0 (0.0%) | 21 (18.4%) |
| 1 or 2 Children | 0 (0.0%) | 24 (41.4%) |
| 3 or 4 Children | 0 (0.0%) | 0 (0.0%) |
| 5 or more Children | 0 (0.0%) | 0 (0.0%) |
| Total | 0 (0.0%) | 45 (26.2%) |
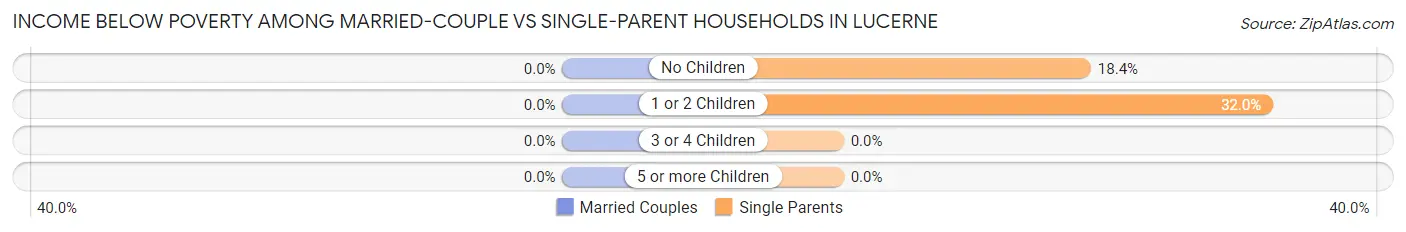
Income Below Poverty Among Married-Couple vs Single-Parent Households in Lucerne
| Children | Married-Couple Families | Single-Parent Households |
| No Children | 0 (0.0%) | 21 (18.4%) |
| 1 or 2 Children | 0 (0.0%) | 24 (32.0%) |
| 3 or 4 Children | 0 (0.0%) | 0 (0.0%) |
| 5 or more Children | 0 (0.0%) | 0 (0.0%) |
| Total | 0 (0.0%) | 45 (23.8%) |
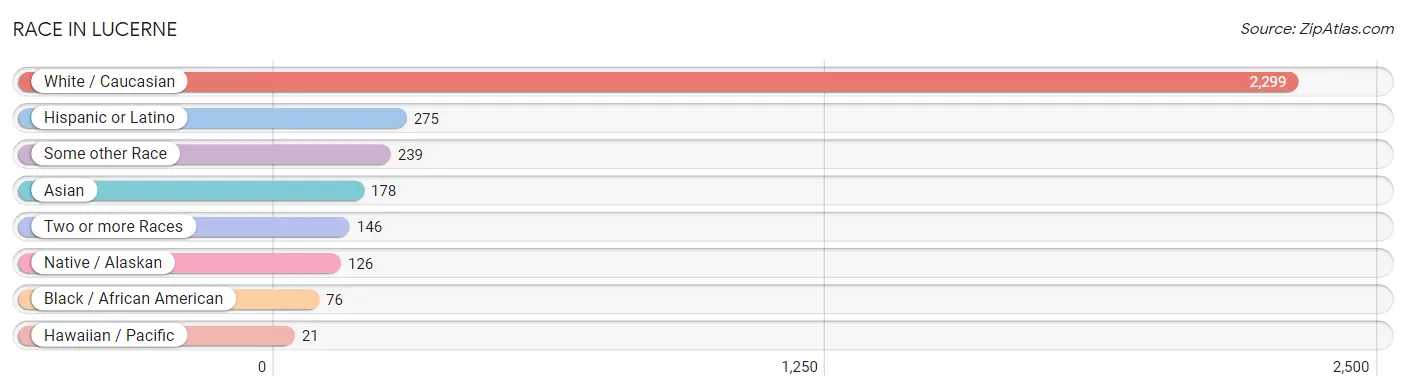
Race in Lucerne
The most populous races in Lucerne are White / Caucasian (2,299 | 74.5%), Hispanic or Latino (275 | 8.9%), and Some other Race (239 | 7.7%).
| Race | # Population | % Population |
| Asian | 178 | 5.8% |
| Black / African American | 76 | 2.5% |
| Hawaiian / Pacific | 21 | 0.7% |
| Hispanic or Latino | 275 | 8.9% |
| Native / Alaskan | 126 | 4.1% |
| White / Caucasian | 2,299 | 74.5% |
| Two or more Races | 146 | 4.7% |
| Some other Race | 239 | 7.7% |
| Total | 3,085 | 100.0% |
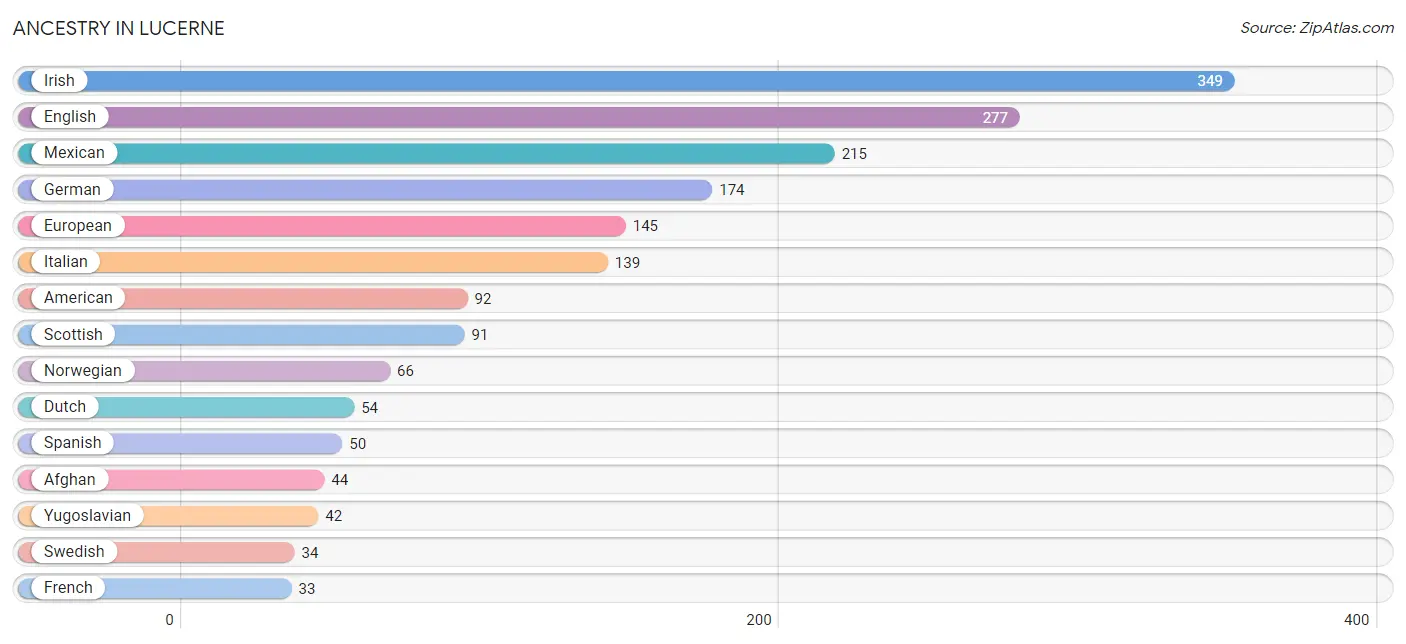
Ancestry in Lucerne
The most populous ancestries reported in Lucerne are Irish (349 | 11.3%), English (277 | 9.0%), Mexican (215 | 7.0%), German (174 | 5.6%), and European (145 | 4.7%), together accounting for 37.6% of all Lucerne residents.
| Ancestry | # Population | % Population |
| Afghan | 44 | 1.4% |
| American | 92 | 3.0% |
| Australian | 8 | 0.3% |
| Burmese | 24 | 0.8% |
| Cambodian | 24 | 0.8% |
| Cherokee | 22 | 0.7% |
| Dutch | 54 | 1.8% |
| English | 277 | 9.0% |
| European | 145 | 4.7% |
| French | 33 | 1.1% |
| German | 174 | 5.6% |
| Irish | 349 | 11.3% |
| Italian | 139 | 4.5% |
| Mexican | 215 | 7.0% |
| Northern European | 26 | 0.8% |
| Norwegian | 66 | 2.1% |
| Polish | 5 | 0.2% |
| Portuguese | 30 | 1.0% |
| Russian | 15 | 0.5% |
| Scotch-Irish | 18 | 0.6% |
| Scottish | 91 | 2.9% |
| Spaniard | 5 | 0.2% |
| Spanish | 50 | 1.6% |
| Swedish | 34 | 1.1% |
| Yugoslavian | 42 | 1.4% | View All 25 Rows |
Immigrants in Lucerne
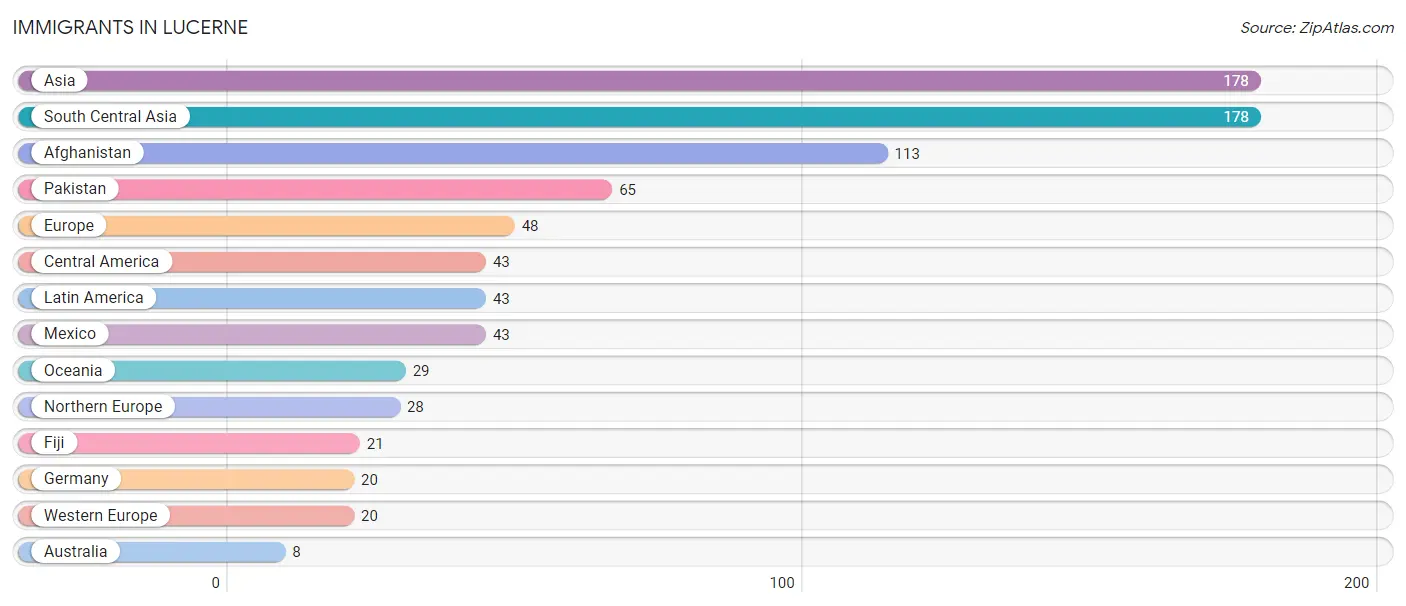
The most numerous immigrant groups reported in Lucerne came from Asia (178 | 5.8%), South Central Asia (178 | 5.8%), Afghanistan (113 | 3.7%), Pakistan (65 | 2.1%), and Europe (48 | 1.6%), together accounting for 18.9% of all Lucerne residents.
| Immigration Origin | # Population | % Population |
| Afghanistan | 113 | 3.7% |
| Asia | 178 | 5.8% |
| Australia | 8 | 0.3% |
| Central America | 43 | 1.4% |
| Europe | 48 | 1.6% |
| Fiji | 21 | 0.7% |
| Germany | 20 | 0.6% |
| Latin America | 43 | 1.4% |
| Mexico | 43 | 1.4% |
| Northern Europe | 28 | 0.9% |
| Oceania | 29 | 0.9% |
| Pakistan | 65 | 2.1% |
| South Central Asia | 178 | 5.8% |
| Western Europe | 20 | 0.6% | View All 14 Rows |
Sex and Age in Lucerne
Sex and Age in Lucerne
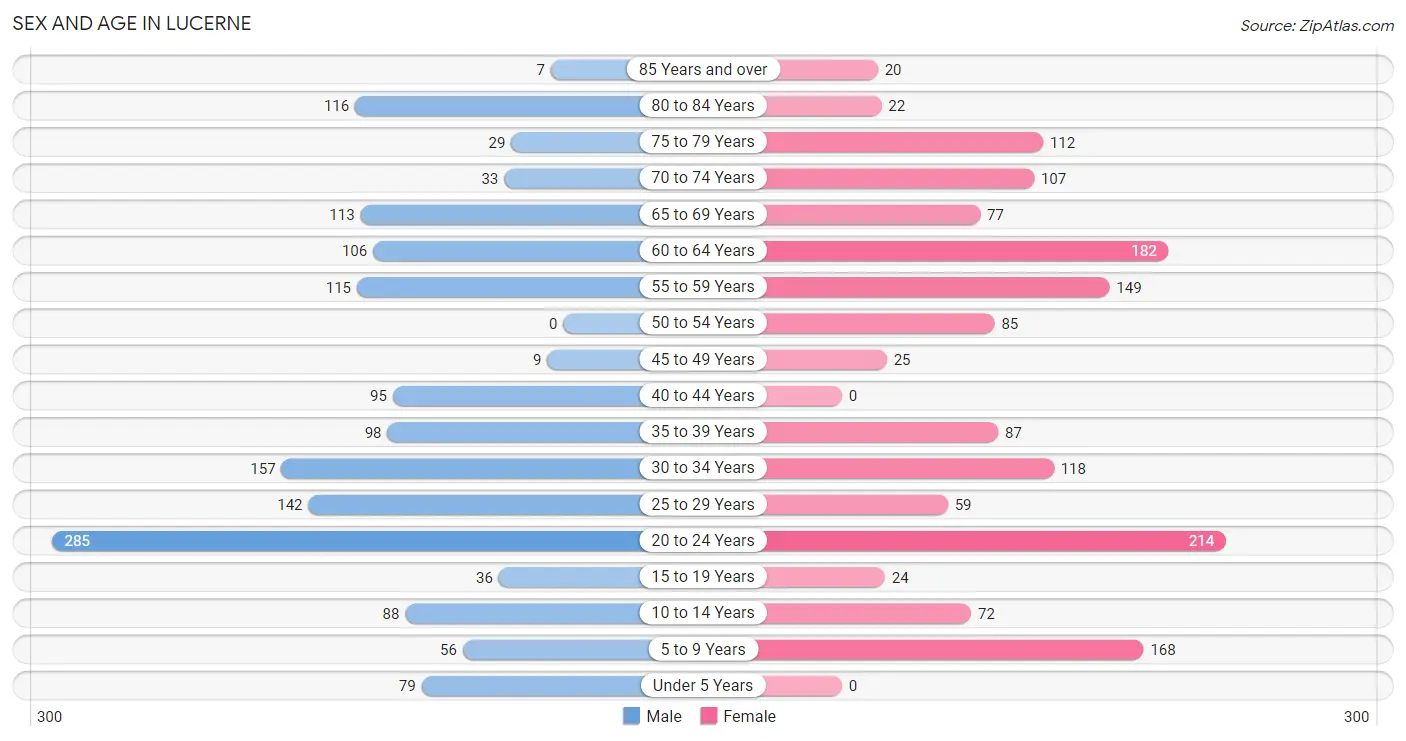
The most populous age groups in Lucerne are 20 to 24 Years (285 | 18.2%) for men and 20 to 24 Years (214 | 14.1%) for women.
| Age Bracket | Male | Female |
| Under 5 Years | 79 (5.1%) | 0 (0.0%) |
| 5 to 9 Years | 56 (3.6%) | 168 (11.1%) |
| 10 to 14 Years | 88 (5.6%) | 72 (4.7%) |
| 15 to 19 Years | 36 (2.3%) | 24 (1.6%) |
| 20 to 24 Years | 285 (18.2%) | 214 (14.1%) |
| 25 to 29 Years | 142 (9.1%) | 59 (3.9%) |
| 30 to 34 Years | 157 (10.0%) | 118 (7.8%) |
| 35 to 39 Years | 98 (6.3%) | 87 (5.7%) |
| 40 to 44 Years | 95 (6.1%) | 0 (0.0%) |
| 45 to 49 Years | 9 (0.6%) | 25 (1.6%) |
| 50 to 54 Years | 0 (0.0%) | 85 (5.6%) |
| 55 to 59 Years | 115 (7.3%) | 149 (9.8%) |
| 60 to 64 Years | 106 (6.8%) | 182 (12.0%) |
| 65 to 69 Years | 113 (7.2%) | 77 (5.1%) |
| 70 to 74 Years | 33 (2.1%) | 107 (7.0%) |
| 75 to 79 Years | 29 (1.8%) | 112 (7.4%) |
| 80 to 84 Years | 116 (7.4%) | 22 (1.5%) |
| 85 Years and over | 7 (0.4%) | 20 (1.3%) |
| Total | 1,564 (100.0%) | 1,521 (100.0%) |
Families and Households in Lucerne
Median Family Size in Lucerne
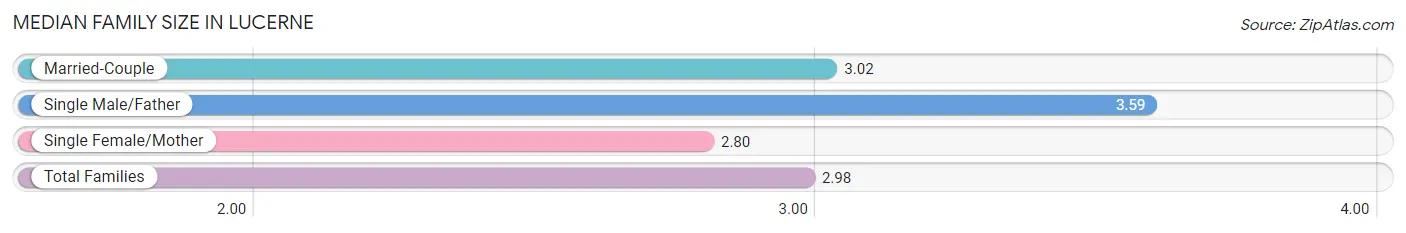
The median family size in Lucerne is 2.98 persons per family, with single male/father families (17 | 2.4%) accounting for the largest median family size of 3.59 persons per family. On the other hand, single female/mother families (172 | 24.7%) represent the smallest median family size with 2.80 persons per family.
| Family Type | # Families | Family Size |
| Married-Couple | 508 (72.9%) | 3.02 |
| Single Male/Father | 17 (2.4%) | 3.59 |
| Single Female/Mother | 172 (24.7%) | 2.80 |
| Total Families | 697 (100.0%) | 2.98 |
Median Household Size in Lucerne
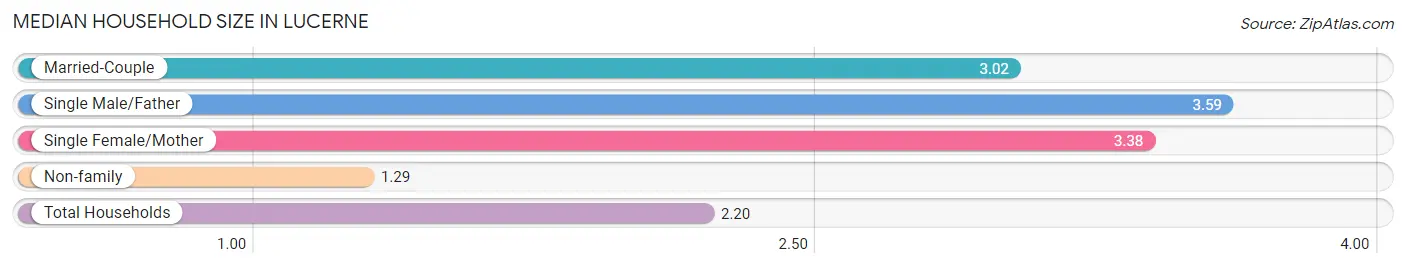
The median household size in Lucerne is 2.20 persons per household, with single male/father households (17 | 1.2%) accounting for the largest median household size of 3.59 persons per household. non-family households (700 | 50.1%) represent the smallest median household size with 1.29 persons per household.
| Household Type | # Households | Household Size |
| Married-Couple | 508 (36.4%) | 3.02 |
| Single Male/Father | 17 (1.2%) | 3.59 |
| Single Female/Mother | 172 (12.3%) | 3.38 |
| Non-family | 700 (50.1%) | 1.29 |
| Total Households | 1,397 (100.0%) | 2.20 |
Household Size by Marriage Status in Lucerne
Out of a total of 1,397 households in Lucerne, 697 (49.9%) are family households, while 700 (50.1%) are nonfamily households. The most numerous type of family households are 2-person households, comprising 333, and the most common type of nonfamily households are 1-person households, comprising 570.
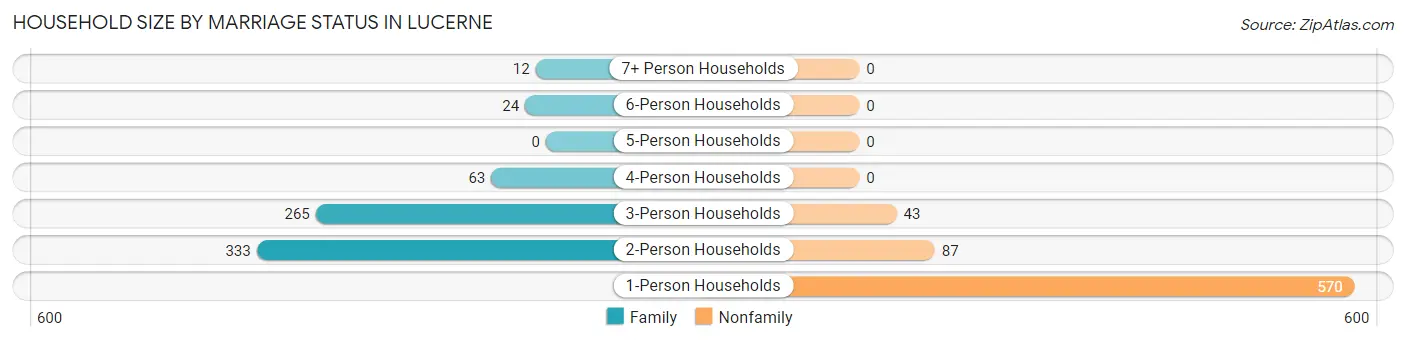
| Household Size | Family Households | Nonfamily Households |
| 1-Person Households | - | 570 (40.8%) |
| 2-Person Households | 333 (23.8%) | 87 (6.2%) |
| 3-Person Households | 265 (19.0%) | 43 (3.1%) |
| 4-Person Households | 63 (4.5%) | 0 (0.0%) |
| 5-Person Households | 0 (0.0%) | 0 (0.0%) |
| 6-Person Households | 24 (1.7%) | 0 (0.0%) |
| 7+ Person Households | 12 (0.9%) | 0 (0.0%) |
| Total | 697 (49.9%) | 700 (50.1%) |
Female Fertility in Lucerne
Fertility by Age in Lucerne
| Age Bracket | Women with Births | Births / 1,000 Women |
| 15 to 19 years | 0 (0.0%) | 0.0 |
| 20 to 34 years | 0 (0.0%) | 0.0 |
| 35 to 50 years | 0 (0.0%) | 0.0 |
| Total | 0 (0.0%) | 0.0 |
Fertility by Age by Marriage Status in Lucerne
| Age Bracket | Married | Unmarried |
| 15 to 19 years | 0 (0.0%) | 0 (0.0%) |
| 20 to 34 years | 0 (0.0%) | 0 (0.0%) |
| 35 to 50 years | 0 (0.0%) | 0 (0.0%) |
| Total | 0 (0.0%) | 0 (0.0%) |
Fertility by Education in Lucerne
| Educational Attainment | Women with Births | Births / 1,000 Women |
| Less than High School | 0 (0.0%) | 0.0 |
| High School Diploma | 0 (0.0%) | 0.0 |
| College or Associate's Degree | 0 (0.0%) | 0.0 |
| Bachelor's Degree | 0 (0.0%) | 0.0 |
| Graduate Degree | 0 (0.0%) | 0.0 |
| Total | 0 (0.0%) | 0.0 |
Fertility by Education by Marriage Status in Lucerne
| Educational Attainment | Married | Unmarried |
| Less than High School | 0 (0.0%) | 0 (0.0%) |
| High School Diploma | 0 (0.0%) | 0 (0.0%) |
| College or Associate's Degree | 0 (0.0%) | 0 (0.0%) |
| Bachelor's Degree | 0 (0.0%) | 0 (0.0%) |
| Graduate Degree | 0 (0.0%) | 0 (0.0%) |
| Total | 0 (0.0%) | 0 (0.0%) |
Employment Characteristics in Lucerne
Employment by Class of Employer in Lucerne
Among the 1,222 employed individuals in Lucerne, private company employees (763 | 62.4%), not-for-profit organizations (253 | 20.7%), and local government employees (112 | 9.2%) make up the most common classes of employment.
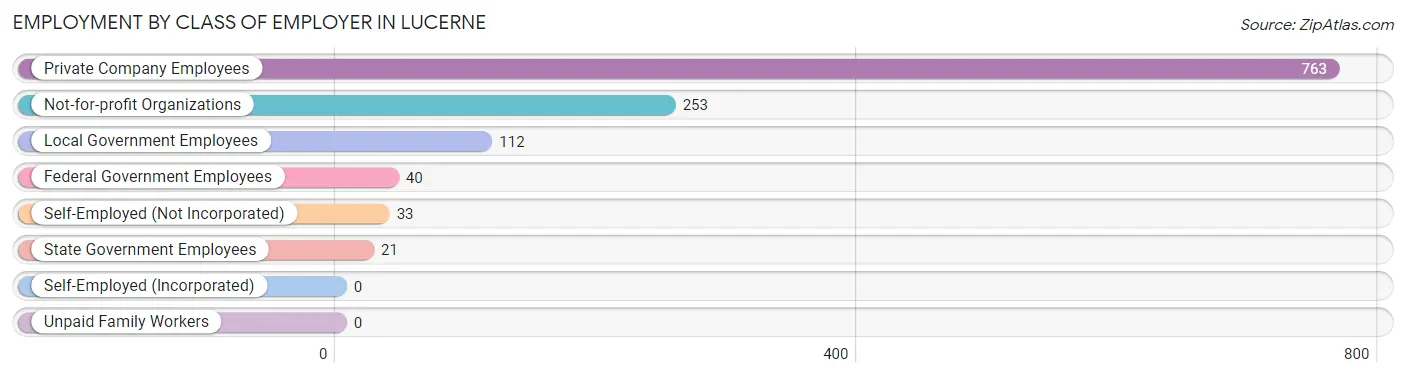
| Employer Class | # Employees | % Employees |
| Private Company Employees | 763 | 62.4% |
| Self-Employed (Incorporated) | 0 | 0.0% |
| Self-Employed (Not Incorporated) | 33 | 2.7% |
| Not-for-profit Organizations | 253 | 20.7% |
| Local Government Employees | 112 | 9.2% |
| State Government Employees | 21 | 1.7% |
| Federal Government Employees | 40 | 3.3% |
| Unpaid Family Workers | 0 | 0.0% |
| Total | 1,222 | 100.0% |
Employment Status by Age in Lucerne
According to the labor force statistics for Lucerne, out of the total population over 16 years of age (2,606), 54.6% or 1,423 individuals are in the labor force, with 9.1% or 129 of them unemployed. The age group with the highest labor force participation rate is 45 to 54 years, with 89.1% or 106 individuals in the labor force. Within the labor force, the 25 to 29 years age range has the highest percentage of unemployed individuals, with 35.8% or 62 of them being unemployed.
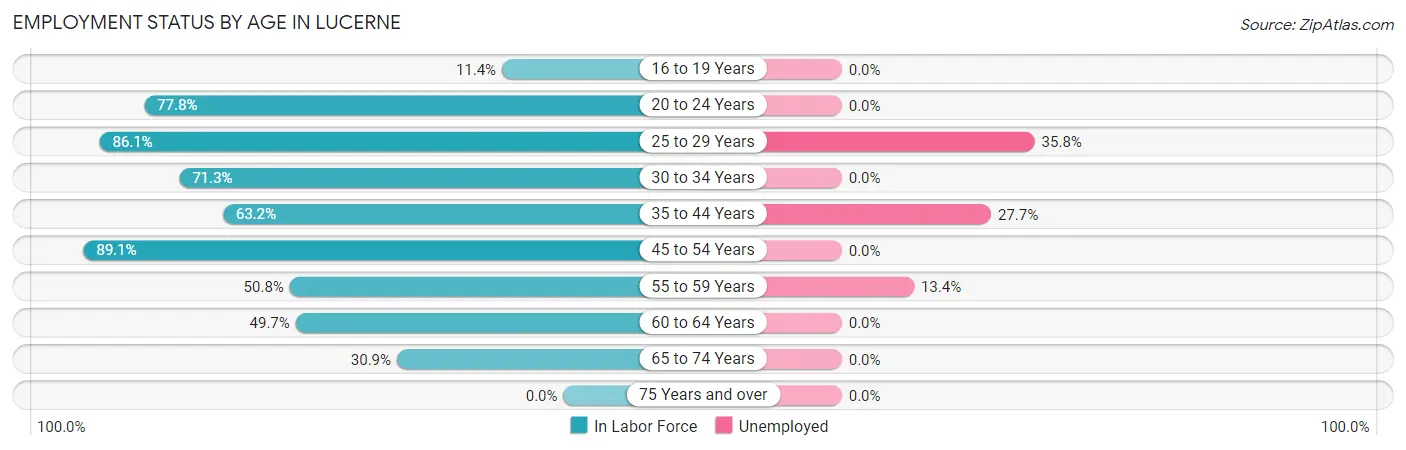
| Age Bracket | In Labor Force | Unemployed |
| 16 to 19 Years | 5 (11.4%) | 0 (0.0%) |
| 20 to 24 Years | 388 (77.8%) | 0 (0.0%) |
| 25 to 29 Years | 173 (86.1%) | 62 (35.8%) |
| 30 to 34 Years | 196 (71.3%) | 0 (0.0%) |
| 35 to 44 Years | 177 (63.2%) | 49 (27.7%) |
| 45 to 54 Years | 106 (89.1%) | 0 (0.0%) |
| 55 to 59 Years | 134 (50.8%) | 18 (13.4%) |
| 60 to 64 Years | 143 (49.7%) | 0 (0.0%) |
| 65 to 74 Years | 102 (30.9%) | 0 (0.0%) |
| 75 Years and over | 0 (0.0%) | 0 (0.0%) |
| Total | 1,423 (54.6%) | 129 (9.1%) |
Employment Status by Educational Attainment in Lucerne
According to labor force statistics for Lucerne, 65.1% of individuals (929) out of the total population between 25 and 64 years of age (1,427) are in the labor force, with 13.9% or 129 of them being unemployed. The group with the highest labor force participation rate are those with the educational attainment of college / associate degree, with 85.3% or 474 individuals in the labor force. Within the labor force, individuals with less than high school education have the highest percentage of unemployment, with 48.2% or 27 of them being unemployed.
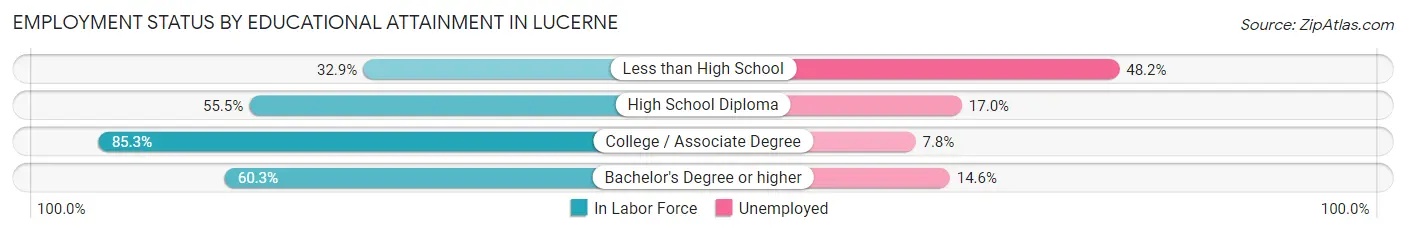
| Educational Attainment | In Labor Force | Unemployed |
| Less than High School | 56 (32.9%) | 82 (48.2%) |
| High School Diploma | 276 (55.5%) | 84 (17.0%) |
| College / Associate Degree | 474 (85.3%) | 43 (7.8%) |
| Bachelor's Degree or higher | 123 (60.3%) | 30 (14.6%) |
| Total | 929 (65.1%) | 198 (13.9%) |
Employment Occupations by Sex in Lucerne
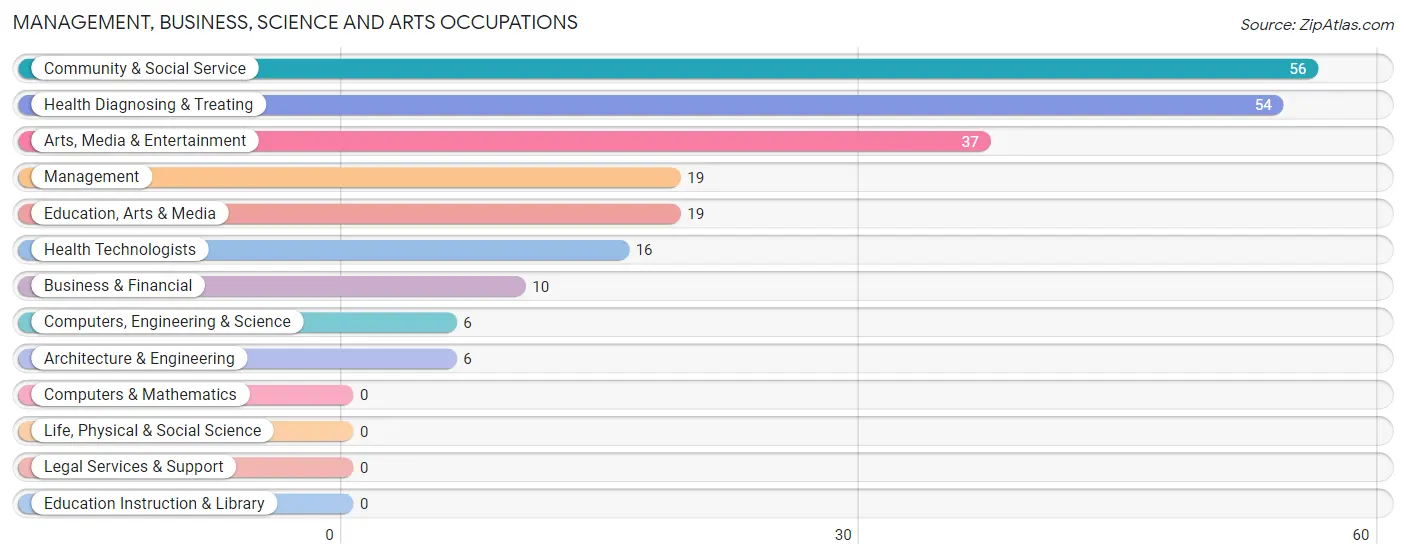
Management, Business, Science and Arts Occupations
The most common Management, Business, Science and Arts occupations in Lucerne are Community & Social Service (56 | 4.3%), Health Diagnosing & Treating (54 | 4.2%), Arts, Media & Entertainment (37 | 2.9%), Management (19 | 1.5%), and Education, Arts & Media (19 | 1.5%).
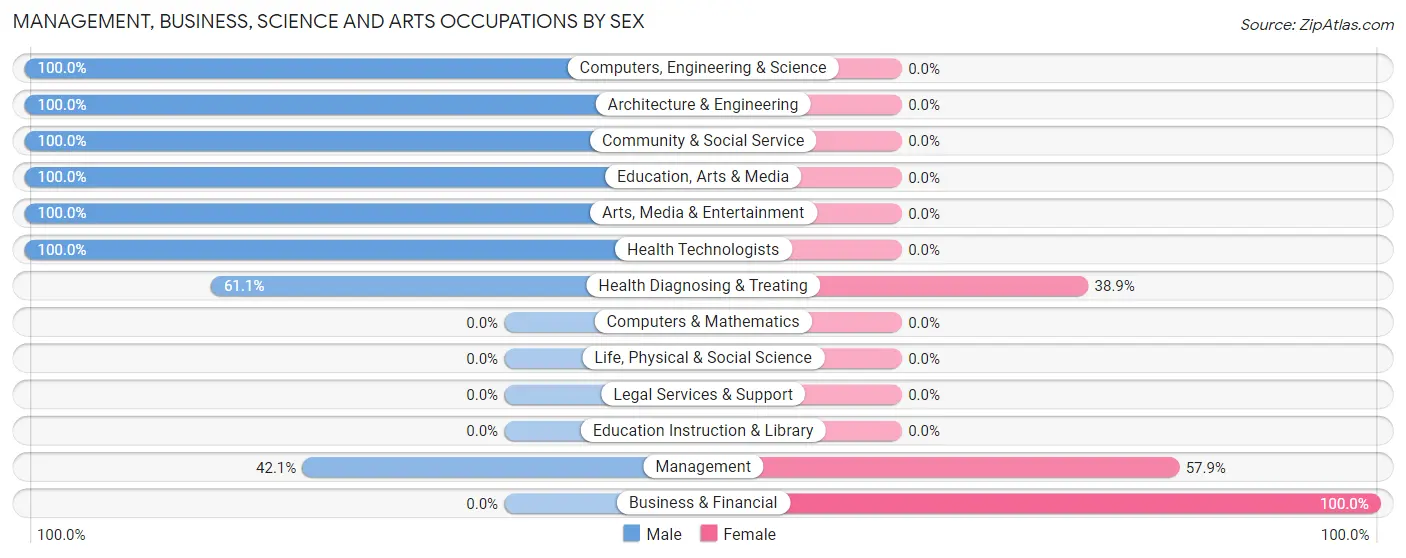
Management, Business, Science and Arts Occupations by Sex
Within the Management, Business, Science and Arts occupations in Lucerne, the most male-oriented occupations are Computers, Engineering & Science (100.0%), Architecture & Engineering (100.0%), and Community & Social Service (100.0%), while the most female-oriented occupations are Business & Financial (100.0%), Management (57.9%), and Health Diagnosing & Treating (38.9%).
| Occupation | Male | Female |
| Management | 8 (42.1%) | 11 (57.9%) |
| Business & Financial | 0 (0.0%) | 10 (100.0%) |
| Computers, Engineering & Science | 6 (100.0%) | 0 (0.0%) |
| Computers & Mathematics | 0 (0.0%) | 0 (0.0%) |
| Architecture & Engineering | 6 (100.0%) | 0 (0.0%) |
| Life, Physical & Social Science | 0 (0.0%) | 0 (0.0%) |
| Community & Social Service | 56 (100.0%) | 0 (0.0%) |
| Education, Arts & Media | 19 (100.0%) | 0 (0.0%) |
| Legal Services & Support | 0 (0.0%) | 0 (0.0%) |
| Education Instruction & Library | 0 (0.0%) | 0 (0.0%) |
| Arts, Media & Entertainment | 37 (100.0%) | 0 (0.0%) |
| Health Diagnosing & Treating | 33 (61.1%) | 21 (38.9%) |
| Health Technologists | 16 (100.0%) | 0 (0.0%) |
| Total (Category) | 103 (71.0%) | 42 (29.0%) |
| Total (Overall) | 645 (49.8%) | 650 (50.2%) |
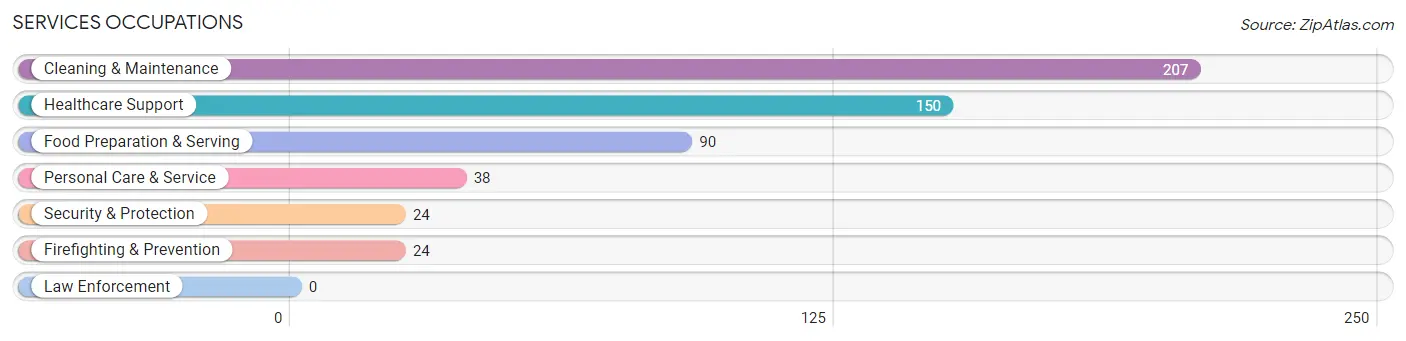
Services Occupations
The most common Services occupations in Lucerne are Cleaning & Maintenance (207 | 16.0%), Healthcare Support (150 | 11.6%), Food Preparation & Serving (90 | 7.0%), Personal Care & Service (38 | 2.9%), and Security & Protection (24 | 1.8%).
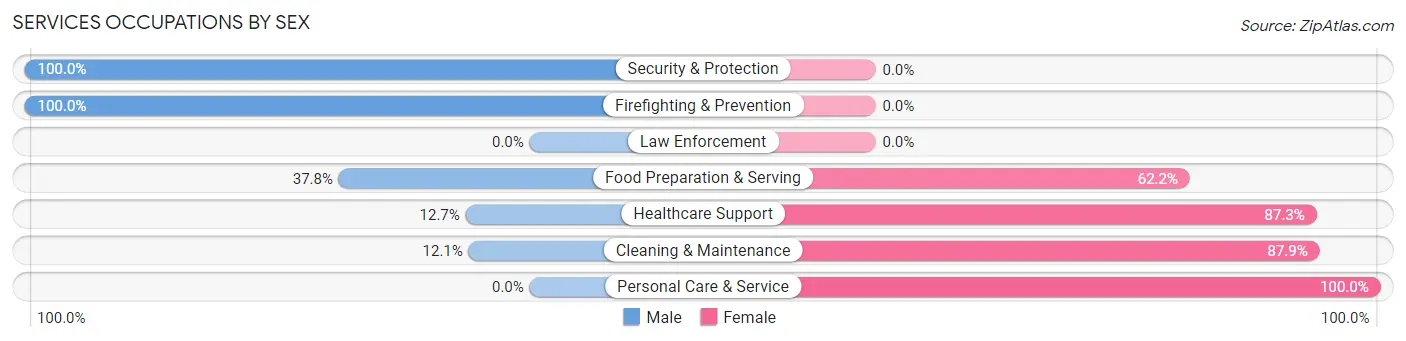
Services Occupations by Sex
Within the Services occupations in Lucerne, the most male-oriented occupations are Security & Protection (100.0%), Firefighting & Prevention (100.0%), and Food Preparation & Serving (37.8%), while the most female-oriented occupations are Personal Care & Service (100.0%), Cleaning & Maintenance (87.9%), and Healthcare Support (87.3%).
| Occupation | Male | Female |
| Healthcare Support | 19 (12.7%) | 131 (87.3%) |
| Security & Protection | 24 (100.0%) | 0 (0.0%) |
| Firefighting & Prevention | 24 (100.0%) | 0 (0.0%) |
| Law Enforcement | 0 (0.0%) | 0 (0.0%) |
| Food Preparation & Serving | 34 (37.8%) | 56 (62.2%) |
| Cleaning & Maintenance | 25 (12.1%) | 182 (87.9%) |
| Personal Care & Service | 0 (0.0%) | 38 (100.0%) |
| Total (Category) | 102 (20.0%) | 407 (80.0%) |
| Total (Overall) | 645 (49.8%) | 650 (50.2%) |
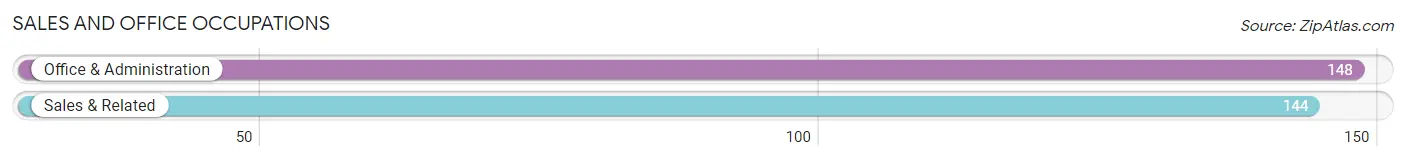
Sales and Office Occupations
The most common Sales and Office occupations in Lucerne are Office & Administration (148 | 11.4%), and Sales & Related (144 | 11.1%).
Sales and Office Occupations by Sex
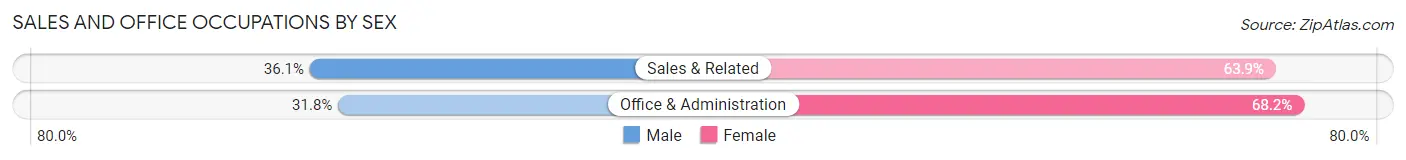
| Occupation | Male | Female |
| Sales & Related | 52 (36.1%) | 92 (63.9%) |
| Office & Administration | 47 (31.8%) | 101 (68.2%) |
| Total (Category) | 99 (33.9%) | 193 (66.1%) |
| Total (Overall) | 645 (49.8%) | 650 (50.2%) |
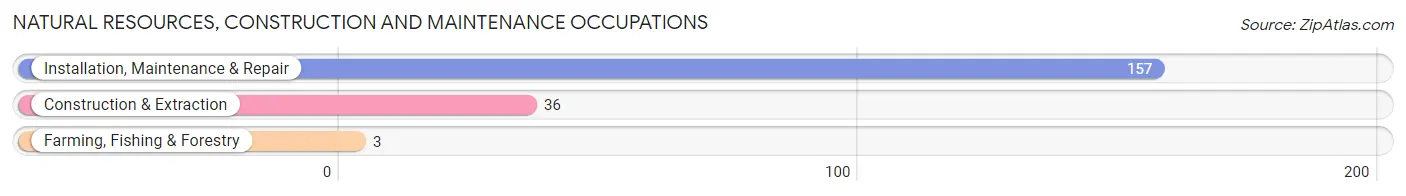
Natural Resources, Construction and Maintenance Occupations
The most common Natural Resources, Construction and Maintenance occupations in Lucerne are Installation, Maintenance & Repair (157 | 12.1%), Construction & Extraction (36 | 2.8%), and Farming, Fishing & Forestry (3 | 0.2%).
Natural Resources, Construction and Maintenance Occupations by Sex
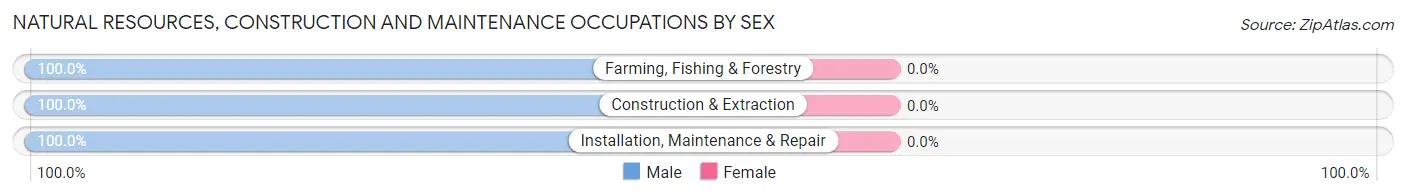
| Occupation | Male | Female |
| Farming, Fishing & Forestry | 3 (100.0%) | 0 (0.0%) |
| Construction & Extraction | 36 (100.0%) | 0 (0.0%) |
| Installation, Maintenance & Repair | 157 (100.0%) | 0 (0.0%) |
| Total (Category) | 196 (100.0%) | 0 (0.0%) |
| Total (Overall) | 645 (49.8%) | 650 (50.2%) |
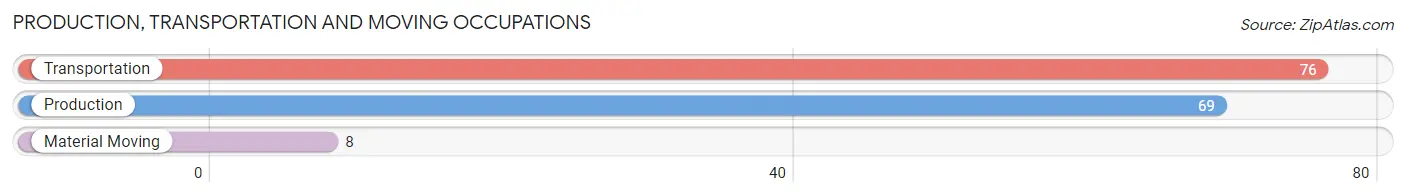
Production, Transportation and Moving Occupations
The most common Production, Transportation and Moving occupations in Lucerne are Transportation (76 | 5.9%), Production (69 | 5.3%), and Material Moving (8 | 0.6%).
Production, Transportation and Moving Occupations by Sex
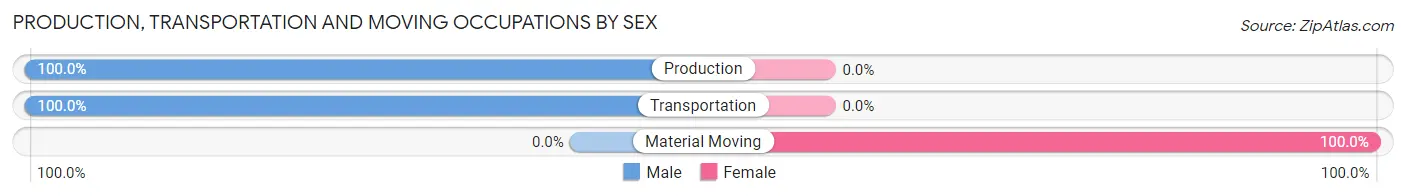
| Occupation | Male | Female |
| Production | 69 (100.0%) | 0 (0.0%) |
| Transportation | 76 (100.0%) | 0 (0.0%) |
| Material Moving | 0 (0.0%) | 8 (100.0%) |
| Total (Category) | 145 (94.8%) | 8 (5.2%) |
| Total (Overall) | 645 (49.8%) | 650 (50.2%) |
Employment Industries by Sex in Lucerne
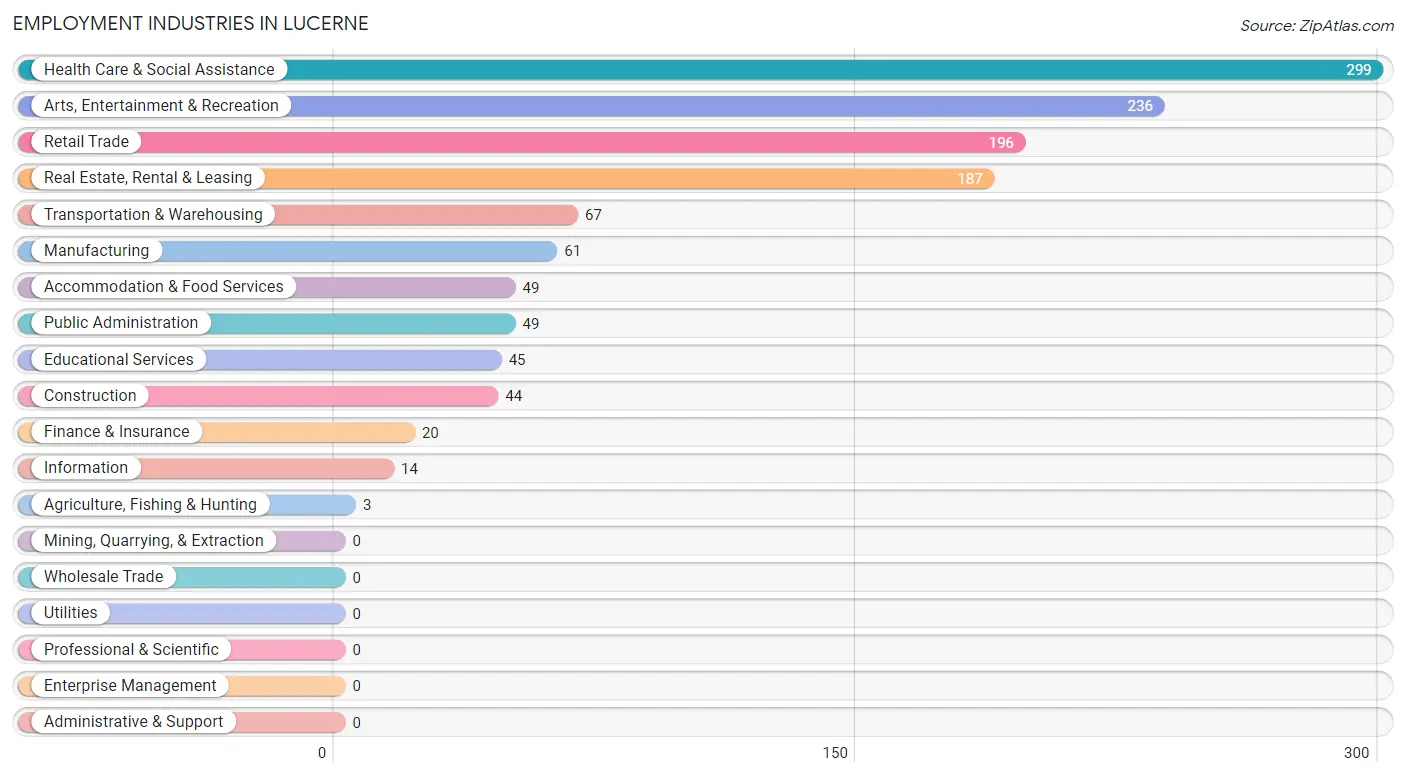
Employment Industries in Lucerne
The major employment industries in Lucerne include Health Care & Social Assistance (299 | 23.1%), Arts, Entertainment & Recreation (236 | 18.2%), Retail Trade (196 | 15.1%), Real Estate, Rental & Leasing (187 | 14.4%), and Transportation & Warehousing (67 | 5.2%).
Employment Industries by Sex in Lucerne
The Lucerne industries that see more men than women are Agriculture, Fishing & Hunting (100.0%), Manufacturing (100.0%), and Transportation & Warehousing (100.0%), whereas the industries that tend to have a higher number of women are Finance & Insurance (100.0%), Arts, Entertainment & Recreation (83.5%), and Health Care & Social Assistance (82.6%).
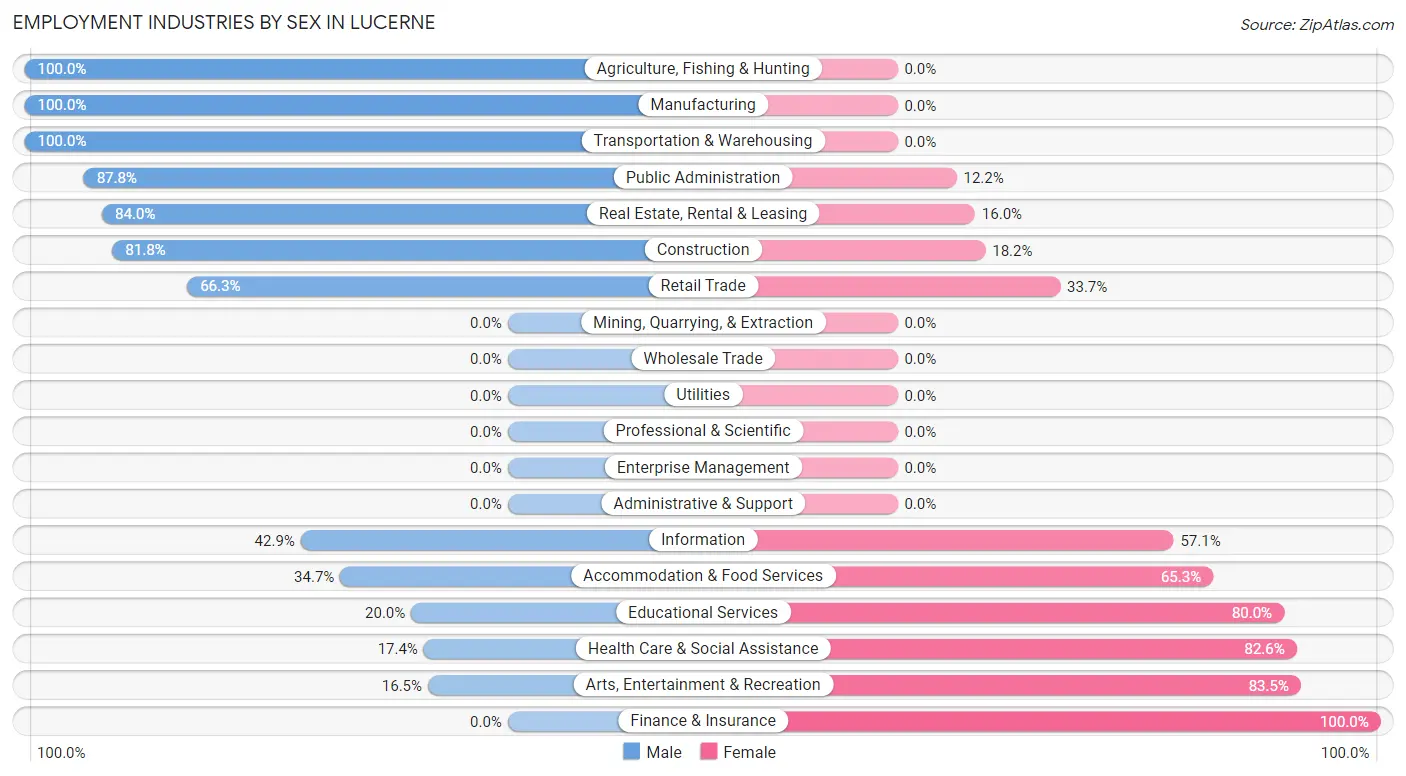
| Industry | Male | Female |
| Agriculture, Fishing & Hunting | 3 (100.0%) | 0 (0.0%) |
| Mining, Quarrying, & Extraction | 0 (0.0%) | 0 (0.0%) |
| Construction | 36 (81.8%) | 8 (18.2%) |
| Manufacturing | 61 (100.0%) | 0 (0.0%) |
| Wholesale Trade | 0 (0.0%) | 0 (0.0%) |
| Retail Trade | 130 (66.3%) | 66 (33.7%) |
| Transportation & Warehousing | 67 (100.0%) | 0 (0.0%) |
| Utilities | 0 (0.0%) | 0 (0.0%) |
| Information | 6 (42.9%) | 8 (57.1%) |
| Finance & Insurance | 0 (0.0%) | 20 (100.0%) |
| Real Estate, Rental & Leasing | 157 (84.0%) | 30 (16.0%) |
| Professional & Scientific | 0 (0.0%) | 0 (0.0%) |
| Enterprise Management | 0 (0.0%) | 0 (0.0%) |
| Administrative & Support | 0 (0.0%) | 0 (0.0%) |
| Educational Services | 9 (20.0%) | 36 (80.0%) |
| Health Care & Social Assistance | 52 (17.4%) | 247 (82.6%) |
| Arts, Entertainment & Recreation | 39 (16.5%) | 197 (83.5%) |
| Accommodation & Food Services | 17 (34.7%) | 32 (65.3%) |
| Public Administration | 43 (87.8%) | 6 (12.2%) |
| Total | 645 (49.8%) | 650 (50.2%) |
Education in Lucerne
School Enrollment in Lucerne
The most common levels of schooling among the 738 students in Lucerne are college / undergraduate (263 | 35.6%), middle school (184 | 24.9%), and kindergarten (168 | 22.8%).
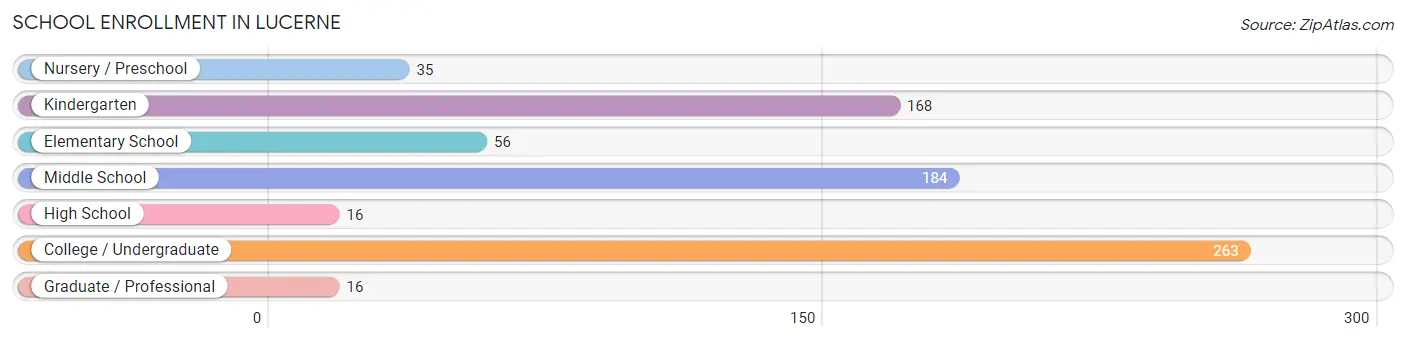
| School Level | # Students | % Students |
| Nursery / Preschool | 35 | 4.7% |
| Kindergarten | 168 | 22.8% |
| Elementary School | 56 | 7.6% |
| Middle School | 184 | 24.9% |
| High School | 16 | 2.2% |
| College / Undergraduate | 263 | 35.6% |
| Graduate / Professional | 16 | 2.2% |
| Total | 738 | 100.0% |
School Enrollment by Age by Funding Source in Lucerne
Out of a total of 738 students who are enrolled in schools in Lucerne, 93 (12.6%) attend a private institution, while the remaining 645 (87.4%) are enrolled in public schools. The age group of 3 to 4 year olds has the highest likelihood of being enrolled in private schools, with 35 (100.0% in the age bracket) enrolled. Conversely, the age group of 10 to 14 year olds has the lowest likelihood of being enrolled in a private school, with 160 (100.0% in the age bracket) attending a public institution.
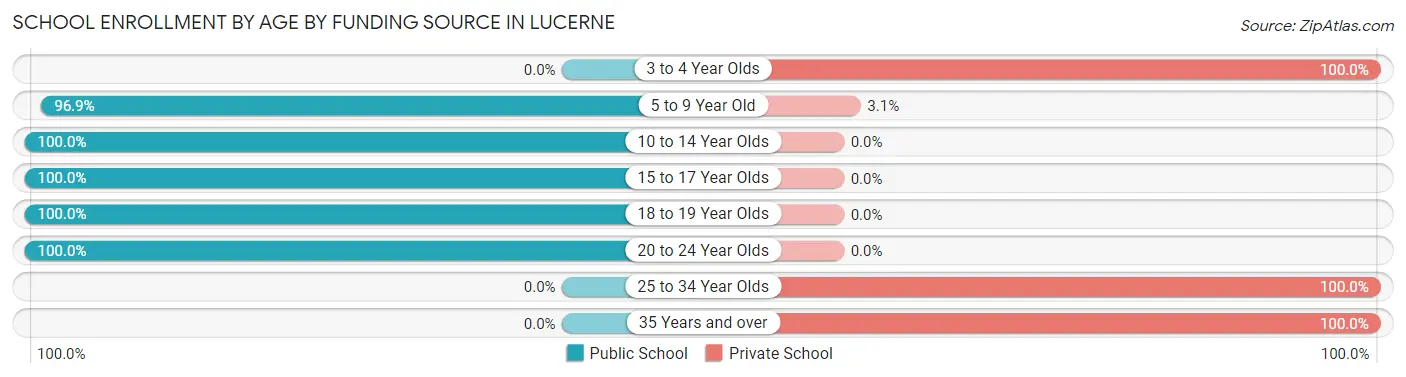
| Age Bracket | Public School | Private School |
| 3 to 4 Year Olds | 0 (0.0%) | 35 (100.0%) |
| 5 to 9 Year Old | 217 (96.9%) | 7 (3.1%) |
| 10 to 14 Year Olds | 160 (100.0%) | 0 (0.0%) |
| 15 to 17 Year Olds | 16 (100.0%) | 0 (0.0%) |
| 18 to 19 Year Olds | 14 (100.0%) | 0 (0.0%) |
| 20 to 24 Year Olds | 238 (100.0%) | 0 (0.0%) |
| 25 to 34 Year Olds | 0 (0.0%) | 35 (100.0%) |
| 35 Years and over | 0 (0.0%) | 16 (100.0%) |
| Total | 645 (87.4%) | 93 (12.6%) |
Educational Attainment by Field of Study in Lucerne
Engineering (82 | 25.0%), science & technology (54 | 16.5%), social sciences (46 | 14.0%), business (37 | 11.3%), and liberal arts & history (27 | 8.2%) are the most common fields of study among 328 individuals in Lucerne who have obtained a bachelor's degree or higher.
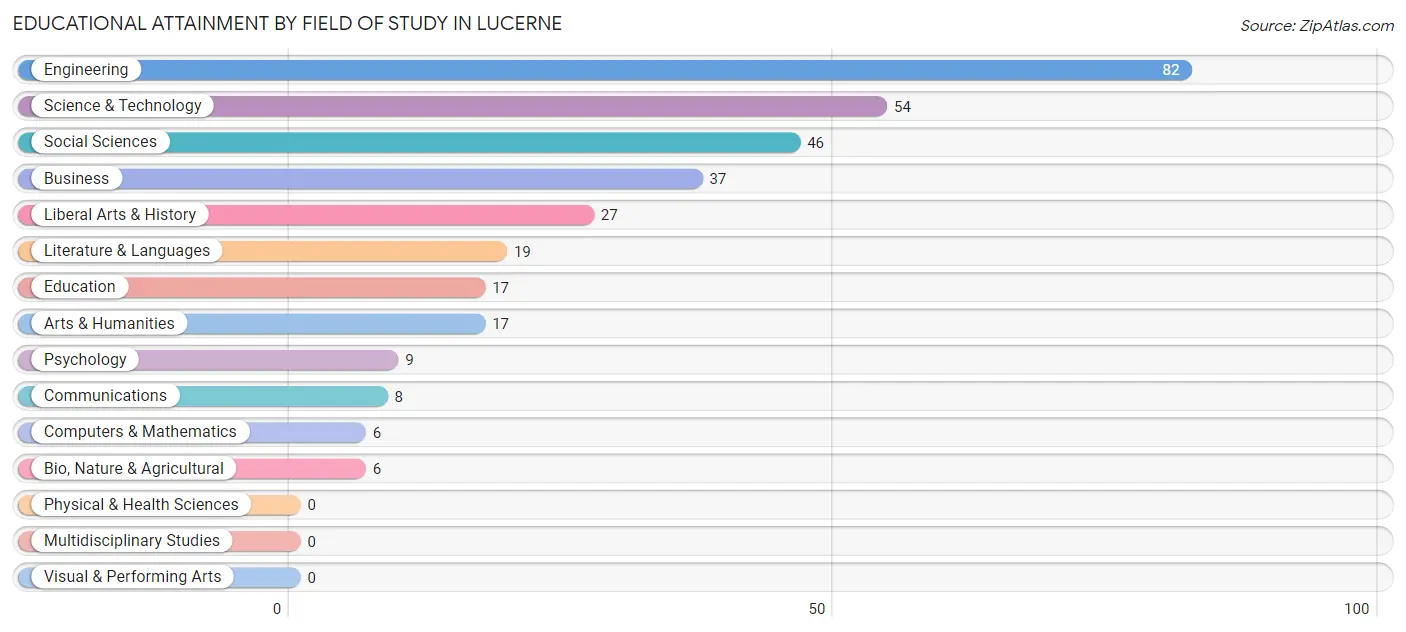
| Field of Study | # Graduates | % Graduates |
| Computers & Mathematics | 6 | 1.8% |
| Bio, Nature & Agricultural | 6 | 1.8% |
| Physical & Health Sciences | 0 | 0.0% |
| Psychology | 9 | 2.7% |
| Social Sciences | 46 | 14.0% |
| Engineering | 82 | 25.0% |
| Multidisciplinary Studies | 0 | 0.0% |
| Science & Technology | 54 | 16.5% |
| Business | 37 | 11.3% |
| Education | 17 | 5.2% |
| Literature & Languages | 19 | 5.8% |
| Liberal Arts & History | 27 | 8.2% |
| Visual & Performing Arts | 0 | 0.0% |
| Communications | 8 | 2.4% |
| Arts & Humanities | 17 | 5.2% |
| Total | 328 | 100.0% |
Transportation & Commute in Lucerne
Vehicle Availability by Sex in Lucerne
The most prevalent vehicle ownership categories in Lucerne are males with 3 vehicles (208, accounting for 35.5%) and females with 3 vehicles (233, making up 33.0%).
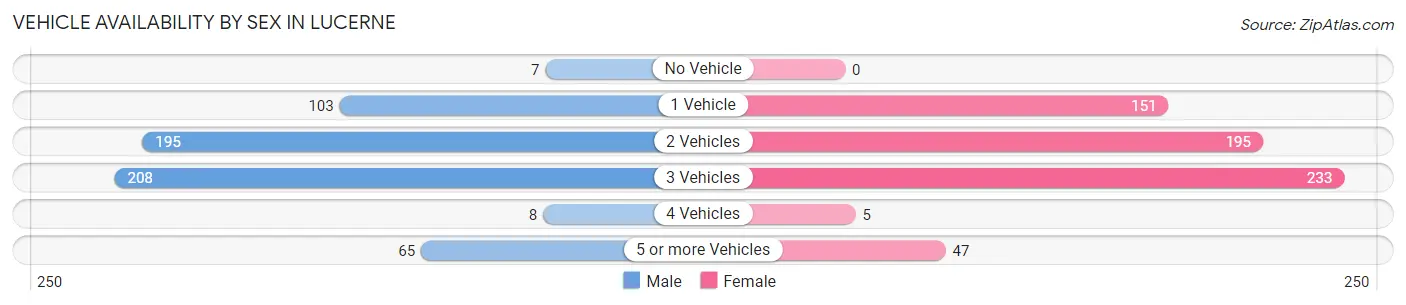
| Vehicles Available | Male | Female |
| No Vehicle | 7 (1.2%) | 0 (0.0%) |
| 1 Vehicle | 103 (17.6%) | 151 (23.9%) |
| 2 Vehicles | 195 (33.3%) | 195 (30.9%) |
| 3 Vehicles | 208 (35.5%) | 233 (36.9%) |
| 4 Vehicles | 8 (1.4%) | 5 (0.8%) |
| 5 or more Vehicles | 65 (11.1%) | 47 (7.4%) |
| Total | 586 (100.0%) | 631 (100.0%) |
Commute Time in Lucerne
The most frequently occuring commute durations in Lucerne are 5 to 9 minutes (248 commuters, 24.3%), 20 to 24 minutes (179 commuters, 17.6%), and 30 to 34 minutes (155 commuters, 15.2%).
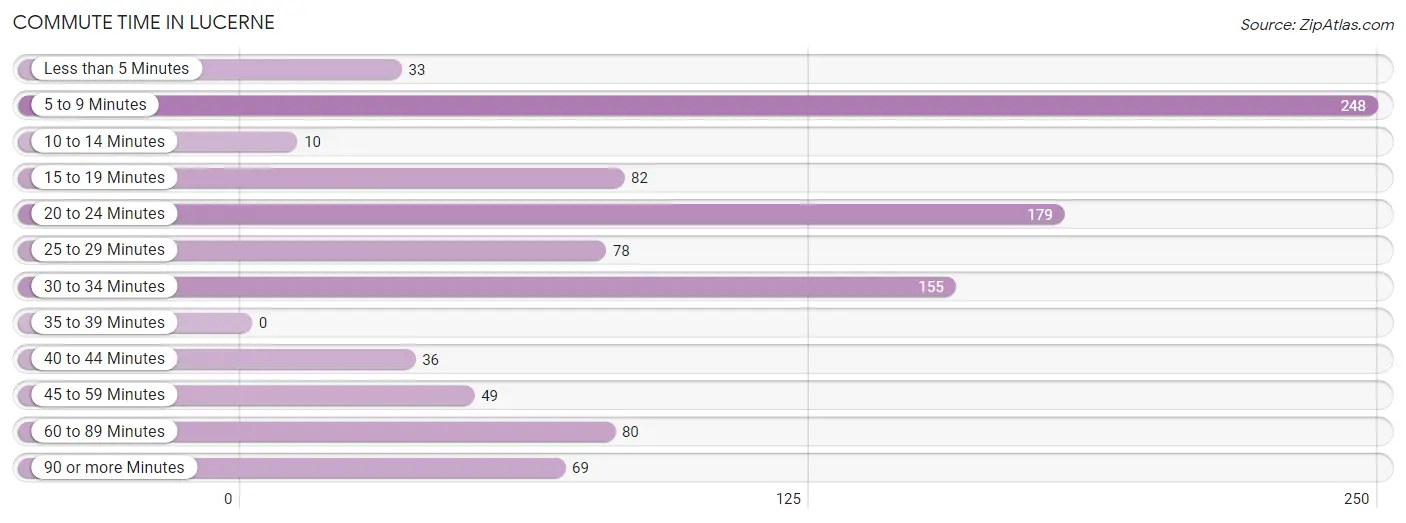
| Commute Time | # Commuters | % Commuters |
| Less than 5 Minutes | 33 | 3.2% |
| 5 to 9 Minutes | 248 | 24.3% |
| 10 to 14 Minutes | 10 | 1.0% |
| 15 to 19 Minutes | 82 | 8.1% |
| 20 to 24 Minutes | 179 | 17.6% |
| 25 to 29 Minutes | 78 | 7.6% |
| 30 to 34 Minutes | 155 | 15.2% |
| 35 to 39 Minutes | 0 | 0.0% |
| 40 to 44 Minutes | 36 | 3.5% |
| 45 to 59 Minutes | 49 | 4.8% |
| 60 to 89 Minutes | 80 | 7.9% |
| 90 or more Minutes | 69 | 6.8% |
Commute Time by Sex in Lucerne
The most common commute times in Lucerne are 30 to 34 minutes (119 commuters, 29.3%) for males and 5 to 9 minutes (193 commuters, 31.5%) for females.
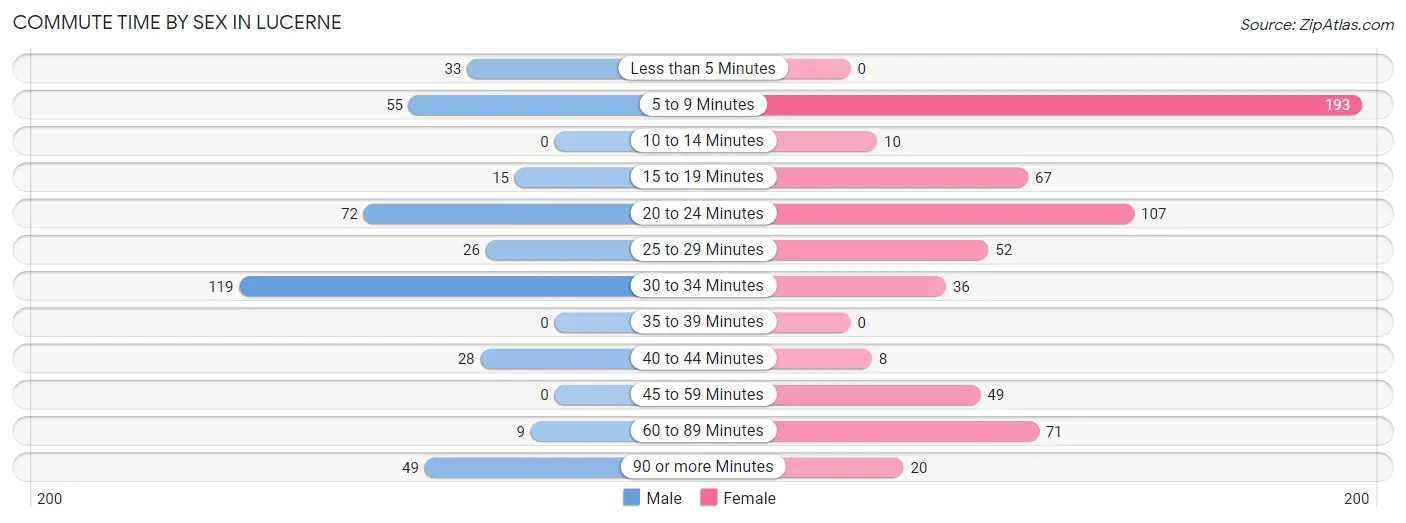
| Commute Time | Male | Female |
| Less than 5 Minutes | 33 (8.1%) | 0 (0.0%) |
| 5 to 9 Minutes | 55 (13.6%) | 193 (31.5%) |
| 10 to 14 Minutes | 0 (0.0%) | 10 (1.6%) |
| 15 to 19 Minutes | 15 (3.7%) | 67 (10.9%) |
| 20 to 24 Minutes | 72 (17.7%) | 107 (17.5%) |
| 25 to 29 Minutes | 26 (6.4%) | 52 (8.5%) |
| 30 to 34 Minutes | 119 (29.3%) | 36 (5.9%) |
| 35 to 39 Minutes | 0 (0.0%) | 0 (0.0%) |
| 40 to 44 Minutes | 28 (6.9%) | 8 (1.3%) |
| 45 to 59 Minutes | 0 (0.0%) | 49 (8.0%) |
| 60 to 89 Minutes | 9 (2.2%) | 71 (11.6%) |
| 90 or more Minutes | 49 (12.1%) | 20 (3.3%) |
Time of Departure to Work by Sex in Lucerne
The most frequent times of departure to work in Lucerne are 7:00 AM to 7:29 AM (80, 19.7%) for males and 7:00 AM to 7:29 AM (219, 35.7%) for females.
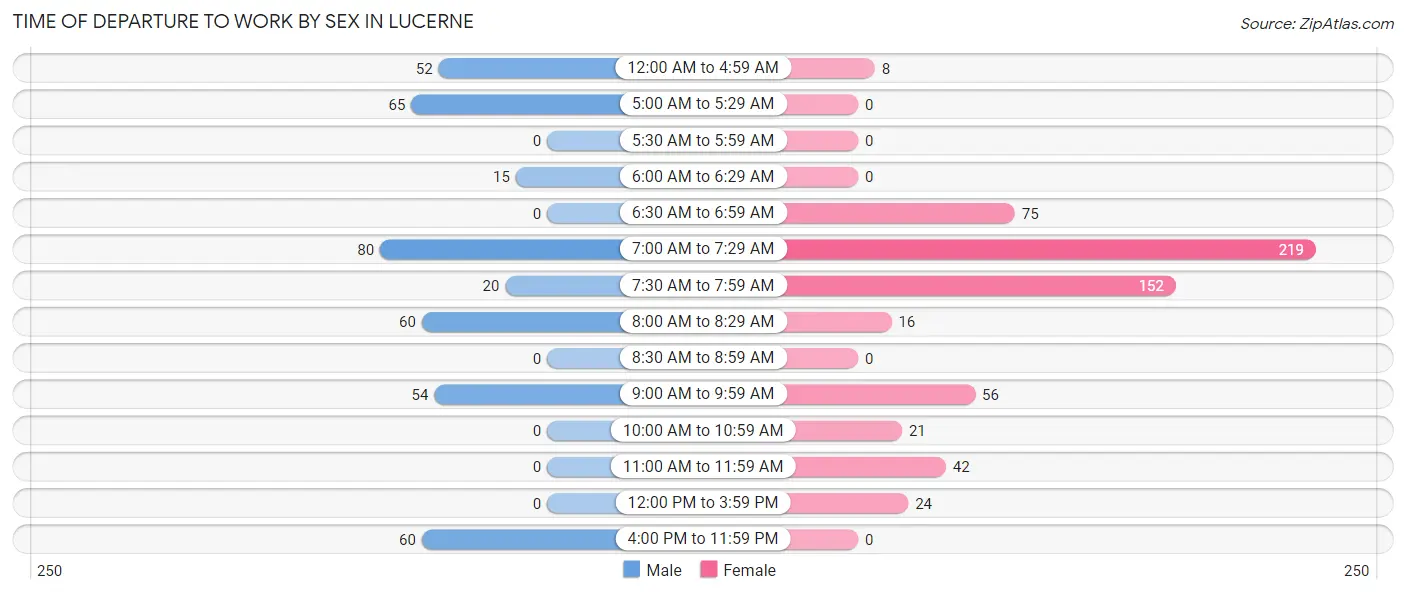
| Time of Departure | Male | Female |
| 12:00 AM to 4:59 AM | 52 (12.8%) | 8 (1.3%) |
| 5:00 AM to 5:29 AM | 65 (16.0%) | 0 (0.0%) |
| 5:30 AM to 5:59 AM | 0 (0.0%) | 0 (0.0%) |
| 6:00 AM to 6:29 AM | 15 (3.7%) | 0 (0.0%) |
| 6:30 AM to 6:59 AM | 0 (0.0%) | 75 (12.2%) |
| 7:00 AM to 7:29 AM | 80 (19.7%) | 219 (35.7%) |
| 7:30 AM to 7:59 AM | 20 (4.9%) | 152 (24.8%) |
| 8:00 AM to 8:29 AM | 60 (14.8%) | 16 (2.6%) |
| 8:30 AM to 8:59 AM | 0 (0.0%) | 0 (0.0%) |
| 9:00 AM to 9:59 AM | 54 (13.3%) | 56 (9.1%) |
| 10:00 AM to 10:59 AM | 0 (0.0%) | 21 (3.4%) |
| 11:00 AM to 11:59 AM | 0 (0.0%) | 42 (6.9%) |
| 12:00 PM to 3:59 PM | 0 (0.0%) | 24 (3.9%) |
| 4:00 PM to 11:59 PM | 60 (14.8%) | 0 (0.0%) |
| Total | 406 (100.0%) | 613 (100.0%) |
Housing Occupancy in Lucerne
Occupancy by Ownership in Lucerne
Of the total 1,397 dwellings in Lucerne, owner-occupied units account for 874 (62.6%), while renter-occupied units make up 523 (37.4%).
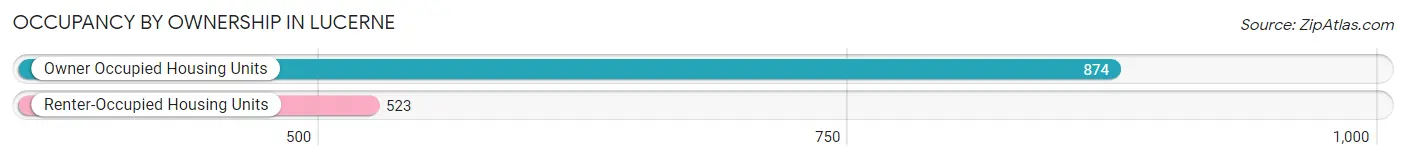
| Occupancy | # Housing Units | % Housing Units |
| Owner Occupied Housing Units | 874 | 62.6% |
| Renter-Occupied Housing Units | 523 | 37.4% |
| Total Occupied Housing Units | 1,397 | 100.0% |
Occupancy by Household Size in Lucerne
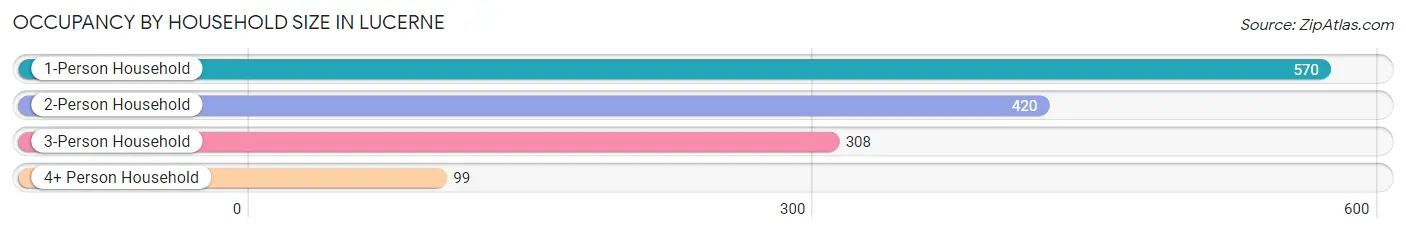
| Household Size | # Housing Units | % Housing Units |
| 1-Person Household | 570 | 40.8% |
| 2-Person Household | 420 | 30.1% |
| 3-Person Household | 308 | 22.1% |
| 4+ Person Household | 99 | 7.1% |
| Total Housing Units | 1,397 | 100.0% |
Occupancy by Ownership by Household Size in Lucerne
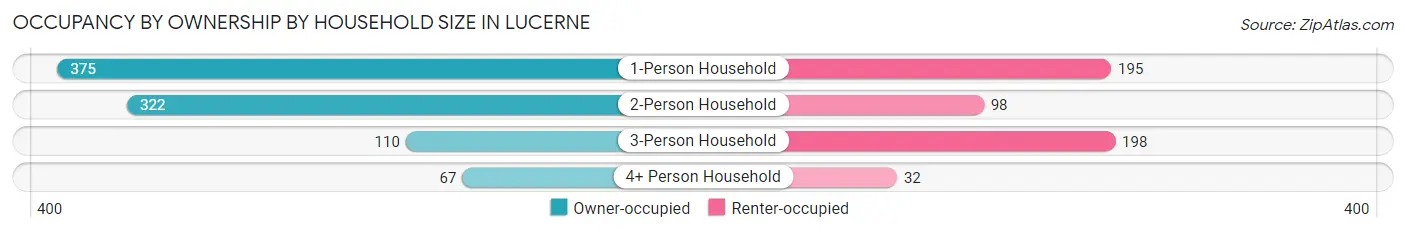
| Household Size | Owner-occupied | Renter-occupied |
| 1-Person Household | 375 (65.8%) | 195 (34.2%) |
| 2-Person Household | 322 (76.7%) | 98 (23.3%) |
| 3-Person Household | 110 (35.7%) | 198 (64.3%) |
| 4+ Person Household | 67 (67.7%) | 32 (32.3%) |
| Total Housing Units | 874 (62.6%) | 523 (37.4%) |
Occupancy by Educational Attainment in Lucerne
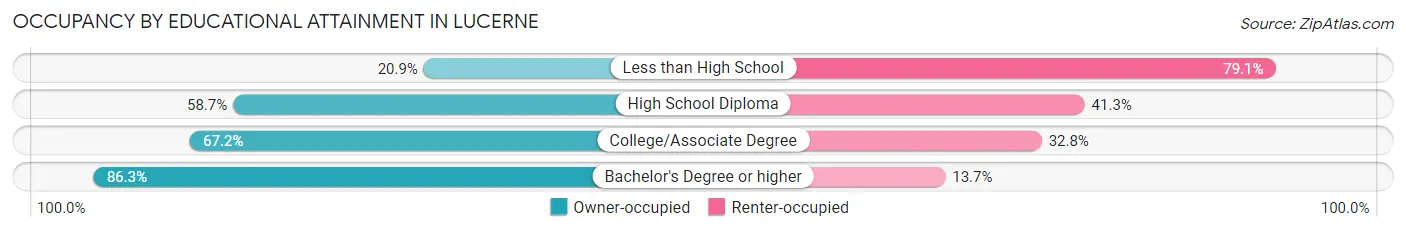
| Household Size | Owner-occupied | Renter-occupied |
| Less than High School | 24 (20.9%) | 91 (79.1%) |
| High School Diploma | 308 (58.7%) | 217 (41.3%) |
| College/Associate Degree | 391 (67.2%) | 191 (32.8%) |
| Bachelor's Degree or higher | 151 (86.3%) | 24 (13.7%) |
Occupancy by Age of Householder in Lucerne
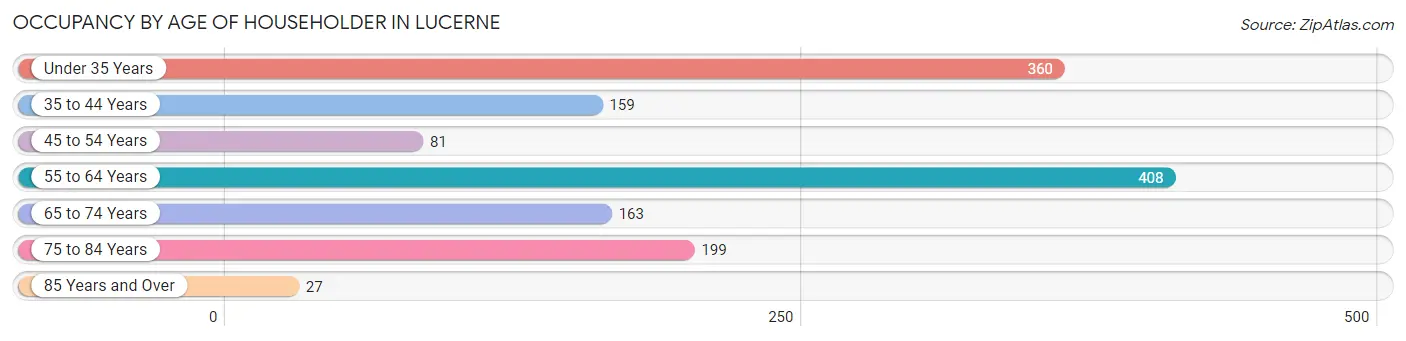
| Age Bracket | # Households | % Households |
| Under 35 Years | 360 | 25.8% |
| 35 to 44 Years | 159 | 11.4% |
| 45 to 54 Years | 81 | 5.8% |
| 55 to 64 Years | 408 | 29.2% |
| 65 to 74 Years | 163 | 11.7% |
| 75 to 84 Years | 199 | 14.2% |
| 85 Years and Over | 27 | 1.9% |
| Total | 1,397 | 100.0% |
Housing Finances in Lucerne
Median Income by Occupancy in Lucerne
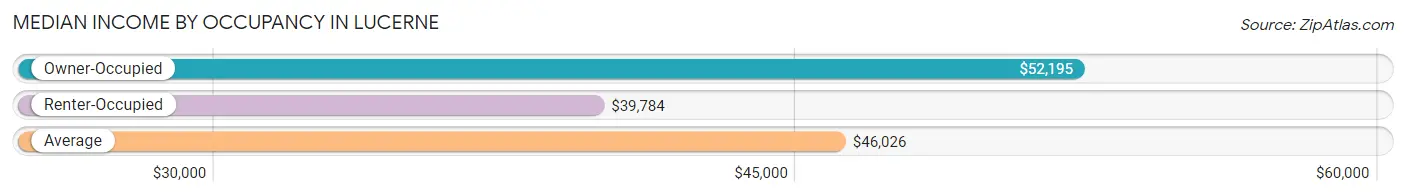
| Occupancy Type | # Households | Median Income |
| Owner-Occupied | 874 (62.6%) | $52,195 |
| Renter-Occupied | 523 (37.4%) | $39,784 |
| Average | 1,397 (100.0%) | $46,026 |
Occupancy by Householder Income Bracket in Lucerne
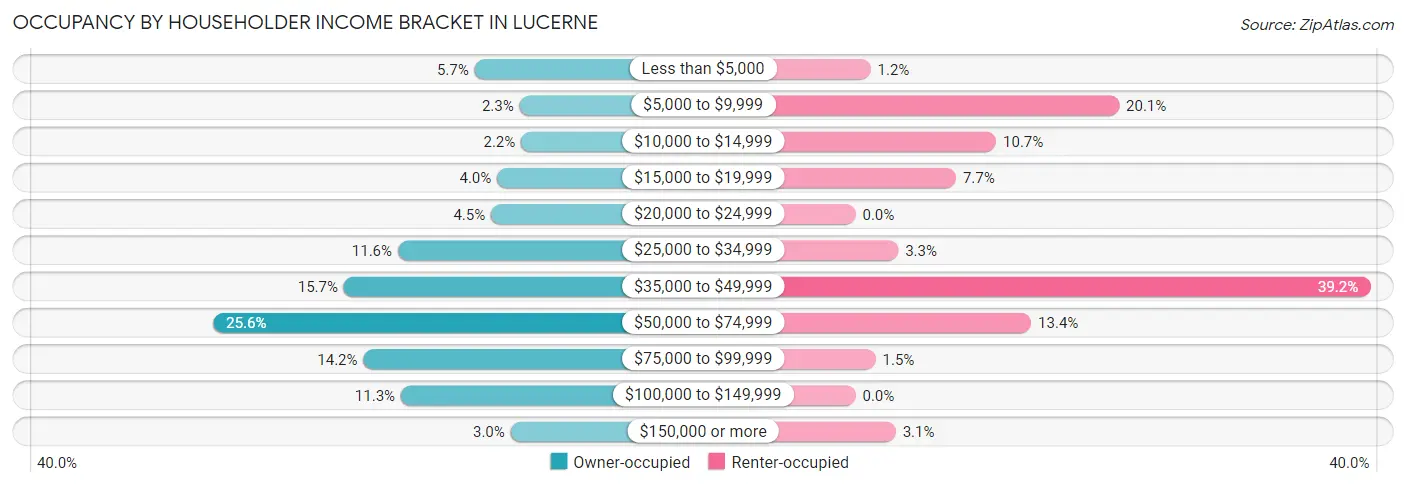
| Income Bracket | Owner-occupied | Renter-occupied |
| Less than $5,000 | 50 (5.7%) | 6 (1.1%) |
| $5,000 to $9,999 | 20 (2.3%) | 105 (20.1%) |
| $10,000 to $14,999 | 19 (2.2%) | 56 (10.7%) |
| $15,000 to $19,999 | 35 (4.0%) | 40 (7.6%) |
| $20,000 to $24,999 | 39 (4.5%) | 0 (0.0%) |
| $25,000 to $34,999 | 101 (11.6%) | 17 (3.3%) |
| $35,000 to $49,999 | 137 (15.7%) | 205 (39.2%) |
| $50,000 to $74,999 | 224 (25.6%) | 70 (13.4%) |
| $75,000 to $99,999 | 124 (14.2%) | 8 (1.5%) |
| $100,000 to $149,999 | 99 (11.3%) | 0 (0.0%) |
| $150,000 or more | 26 (3.0%) | 16 (3.1%) |
| Total | 874 (100.0%) | 523 (100.0%) |
Monthly Housing Cost Tiers in Lucerne
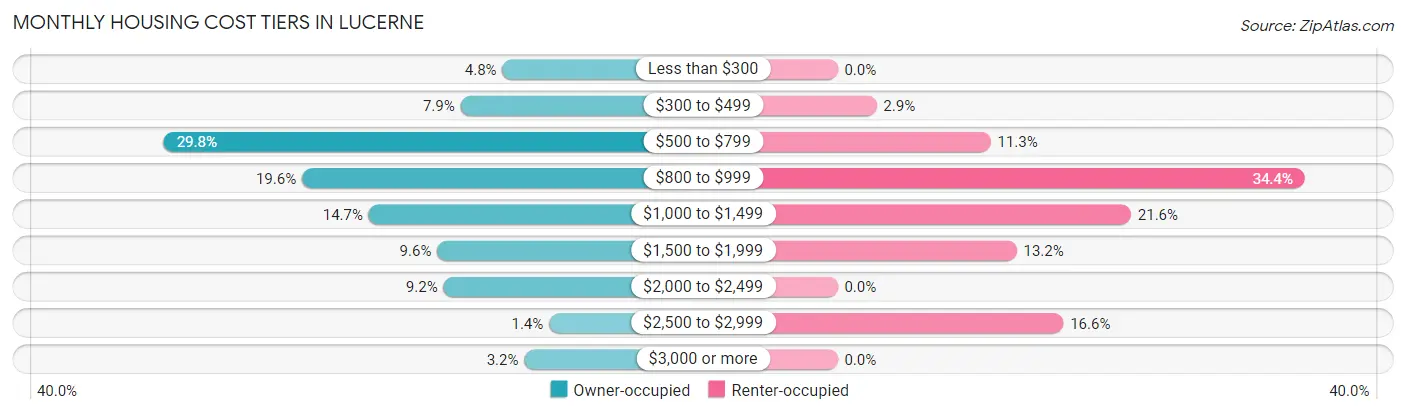
| Monthly Cost | Owner-occupied | Renter-occupied |
| Less than $300 | 42 (4.8%) | 0 (0.0%) |
| $300 to $499 | 69 (7.9%) | 15 (2.9%) |
| $500 to $799 | 260 (29.7%) | 59 (11.3%) |
| $800 to $999 | 171 (19.6%) | 180 (34.4%) |
| $1,000 to $1,499 | 128 (14.6%) | 113 (21.6%) |
| $1,500 to $1,999 | 84 (9.6%) | 69 (13.2%) |
| $2,000 to $2,499 | 80 (9.1%) | 0 (0.0%) |
| $2,500 to $2,999 | 12 (1.4%) | 87 (16.6%) |
| $3,000 or more | 28 (3.2%) | 0 (0.0%) |
| Total | 874 (100.0%) | 523 (100.0%) |
Physical Housing Characteristics in Lucerne
Housing Structures in Lucerne
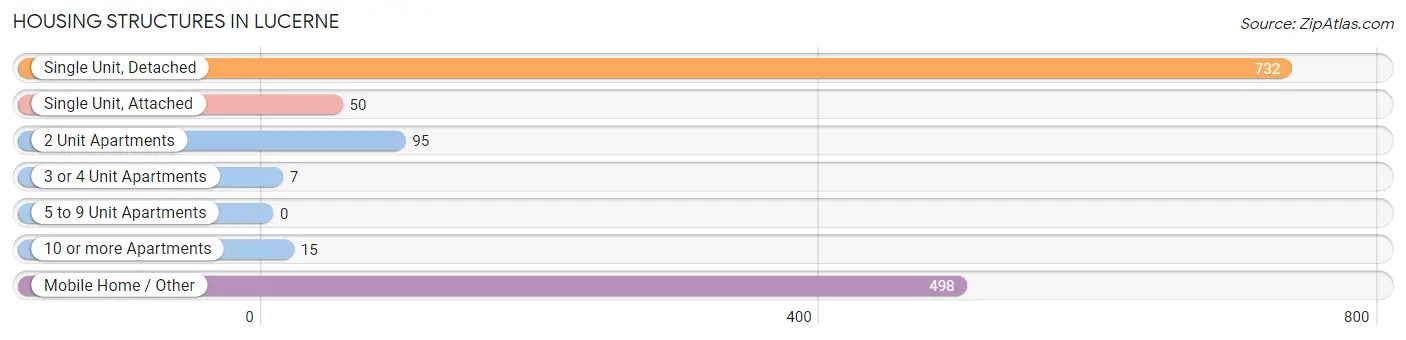
| Structure Type | # Housing Units | % Housing Units |
| Single Unit, Detached | 732 | 52.4% |
| Single Unit, Attached | 50 | 3.6% |
| 2 Unit Apartments | 95 | 6.8% |
| 3 or 4 Unit Apartments | 7 | 0.5% |
| 5 to 9 Unit Apartments | 0 | 0.0% |
| 10 or more Apartments | 15 | 1.1% |
| Mobile Home / Other | 498 | 35.6% |
| Total | 1,397 | 100.0% |
Housing Structures by Occupancy in Lucerne
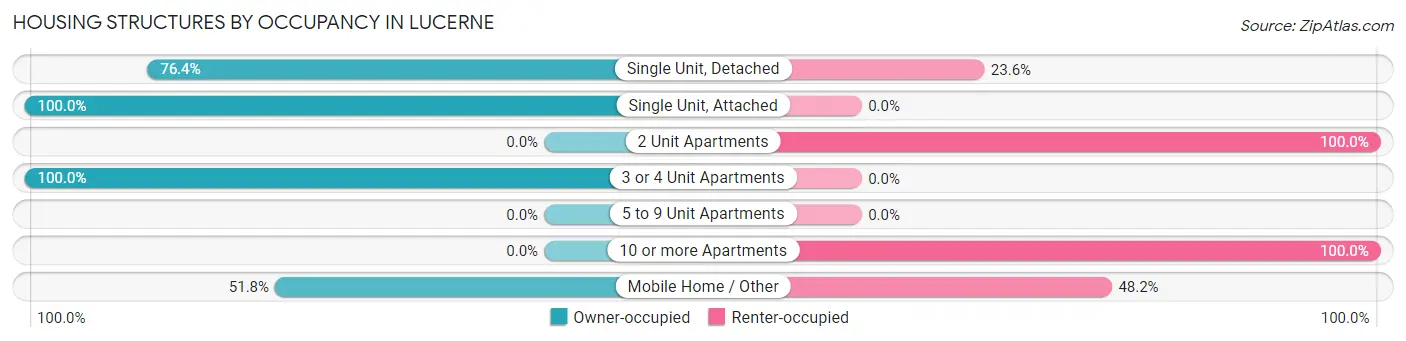
| Structure Type | Owner-occupied | Renter-occupied |
| Single Unit, Detached | 559 (76.4%) | 173 (23.6%) |
| Single Unit, Attached | 50 (100.0%) | 0 (0.0%) |
| 2 Unit Apartments | 0 (0.0%) | 95 (100.0%) |
| 3 or 4 Unit Apartments | 7 (100.0%) | 0 (0.0%) |
| 5 to 9 Unit Apartments | 0 (0.0%) | 0 (0.0%) |
| 10 or more Apartments | 0 (0.0%) | 15 (100.0%) |
| Mobile Home / Other | 258 (51.8%) | 240 (48.2%) |
| Total | 874 (62.6%) | 523 (37.4%) |
Housing Structures by Number of Rooms in Lucerne
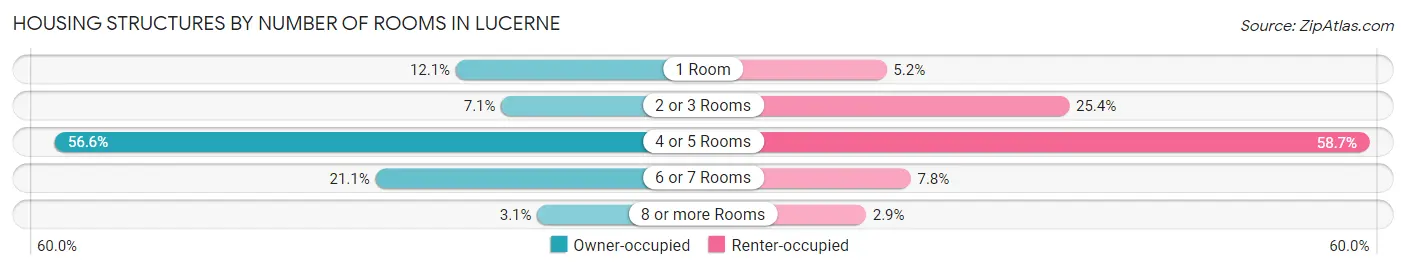
| Number of Rooms | Owner-occupied | Renter-occupied |
| 1 Room | 106 (12.1%) | 27 (5.2%) |
| 2 or 3 Rooms | 62 (7.1%) | 133 (25.4%) |
| 4 or 5 Rooms | 495 (56.6%) | 307 (58.7%) |
| 6 or 7 Rooms | 184 (21.0%) | 41 (7.8%) |
| 8 or more Rooms | 27 (3.1%) | 15 (2.9%) |
| Total | 874 (100.0%) | 523 (100.0%) |
Housing Structure by Heating Type in Lucerne
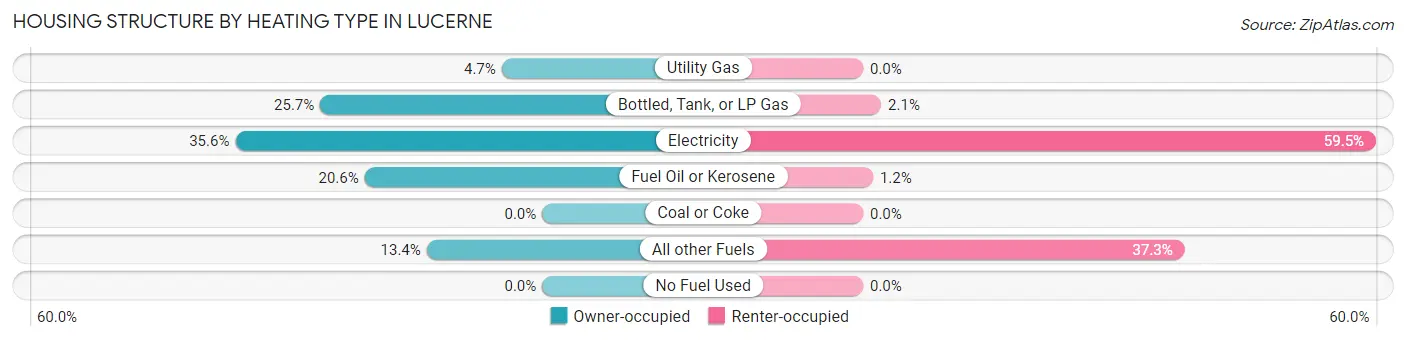
| Heating Type | Owner-occupied | Renter-occupied |
| Utility Gas | 41 (4.7%) | 0 (0.0%) |
| Bottled, Tank, or LP Gas | 225 (25.7%) | 11 (2.1%) |
| Electricity | 311 (35.6%) | 311 (59.5%) |
| Fuel Oil or Kerosene | 180 (20.6%) | 6 (1.1%) |
| Coal or Coke | 0 (0.0%) | 0 (0.0%) |
| All other Fuels | 117 (13.4%) | 195 (37.3%) |
| No Fuel Used | 0 (0.0%) | 0 (0.0%) |
| Total | 874 (100.0%) | 523 (100.0%) |
Household Vehicle Usage in Lucerne
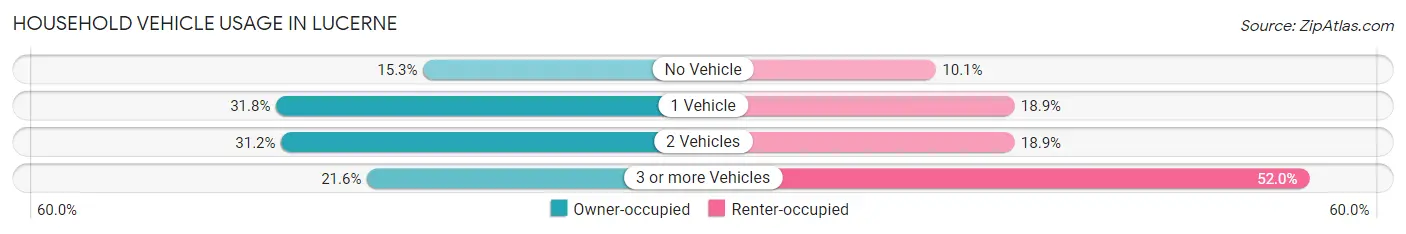
| Vehicles per Household | Owner-occupied | Renter-occupied |
| No Vehicle | 134 (15.3%) | 53 (10.1%) |
| 1 Vehicle | 278 (31.8%) | 99 (18.9%) |
| 2 Vehicles | 273 (31.2%) | 99 (18.9%) |
| 3 or more Vehicles | 189 (21.6%) | 272 (52.0%) |
| Total | 874 (100.0%) | 523 (100.0%) |
Real Estate & Mortgages in Lucerne
Real Estate and Mortgage Overview in Lucerne
| Characteristic | Without Mortgage | With Mortgage |
| Housing Units | 401 | 473 |
| Median Property Value | $221,800 | $243,900 |
| Median Household Income | $50,213 | $0 |
| Monthly Housing Costs | $644 | $28 |
| Real Estate Taxes | $1,728 | $88 |
Property Value by Mortgage Status in Lucerne
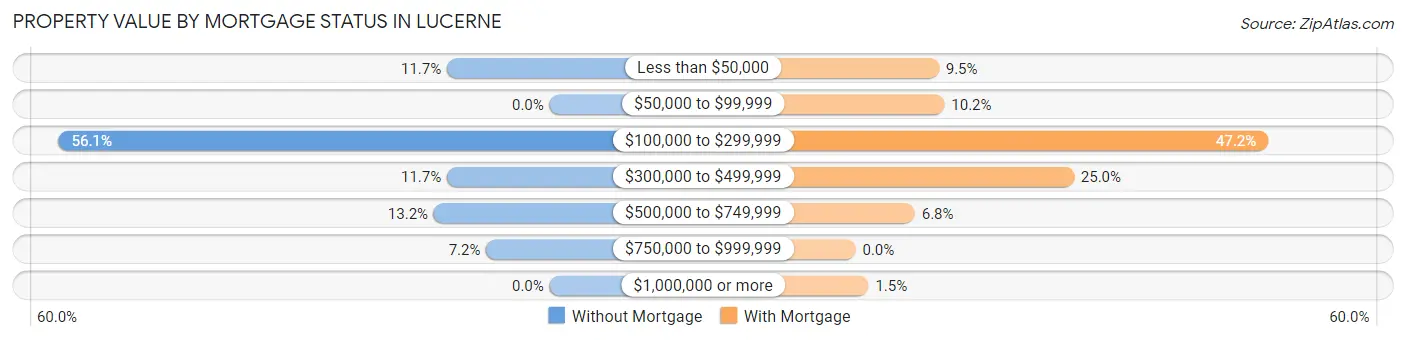
| Property Value | Without Mortgage | With Mortgage |
| Less than $50,000 | 47 (11.7%) | 45 (9.5%) |
| $50,000 to $99,999 | 0 (0.0%) | 48 (10.2%) |
| $100,000 to $299,999 | 225 (56.1%) | 223 (47.1%) |
| $300,000 to $499,999 | 47 (11.7%) | 118 (24.9%) |
| $500,000 to $749,999 | 53 (13.2%) | 32 (6.8%) |
| $750,000 to $999,999 | 29 (7.2%) | 0 (0.0%) |
| $1,000,000 or more | 0 (0.0%) | 7 (1.5%) |
| Total | 401 (100.0%) | 473 (100.0%) |
Household Income by Mortgage Status in Lucerne
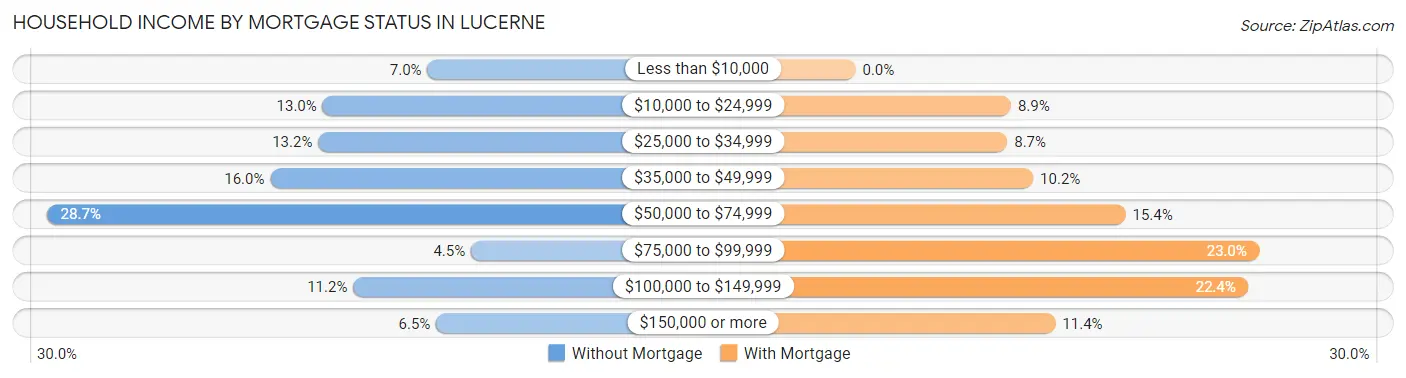
| Household Income | Without Mortgage | With Mortgage |
| Less than $10,000 | 28 (7.0%) | 0 (0.0%) |
| $10,000 to $24,999 | 52 (13.0%) | 42 (8.9%) |
| $25,000 to $34,999 | 53 (13.2%) | 41 (8.7%) |
| $35,000 to $49,999 | 64 (16.0%) | 48 (10.2%) |
| $50,000 to $74,999 | 115 (28.7%) | 73 (15.4%) |
| $75,000 to $99,999 | 18 (4.5%) | 109 (23.0%) |
| $100,000 to $149,999 | 45 (11.2%) | 106 (22.4%) |
| $150,000 or more | 26 (6.5%) | 54 (11.4%) |
| Total | 401 (100.0%) | 473 (100.0%) |
Property Value to Household Income Ratio in Lucerne
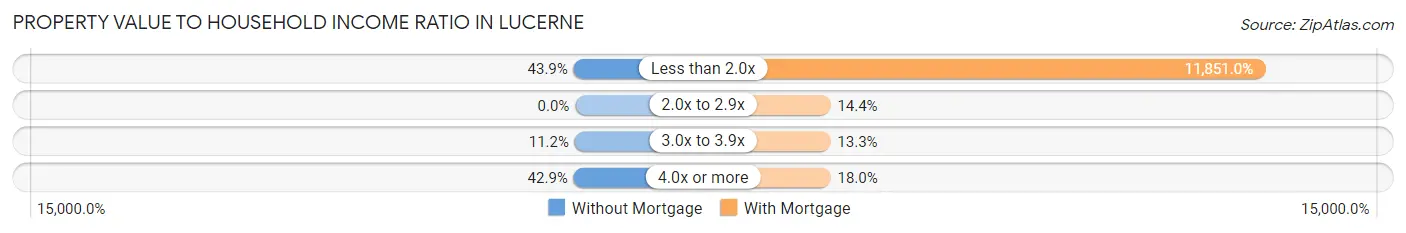
| Value-to-Income Ratio | Without Mortgage | With Mortgage |
| Less than 2.0x | 176 (43.9%) | 56,055 (11,851.0%) |
| 2.0x to 2.9x | 0 (0.0%) | 68 (14.4%) |
| 3.0x to 3.9x | 45 (11.2%) | 63 (13.3%) |
| 4.0x or more | 172 (42.9%) | 85 (18.0%) |
| Total | 401 (100.0%) | 473 (100.0%) |
Real Estate Taxes by Mortgage Status in Lucerne
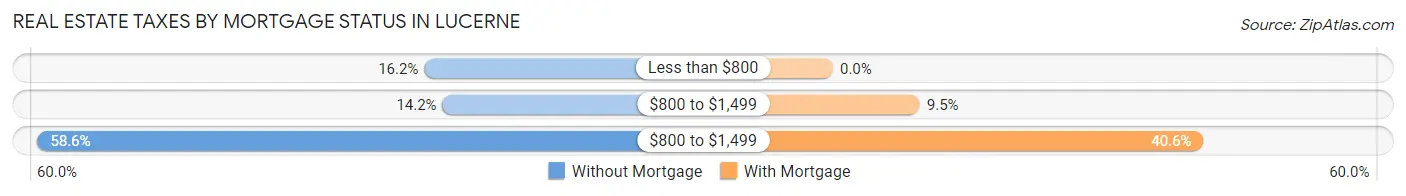
| Property Taxes | Without Mortgage | With Mortgage |
| Less than $800 | 65 (16.2%) | 0 (0.0%) |
| $800 to $1,499 | 57 (14.2%) | 45 (9.5%) |
| $800 to $1,499 | 235 (58.6%) | 192 (40.6%) |
| Total | 401 (100.0%) | 473 (100.0%) |
Health & Disability in Lucerne
Health Insurance Coverage by Age in Lucerne
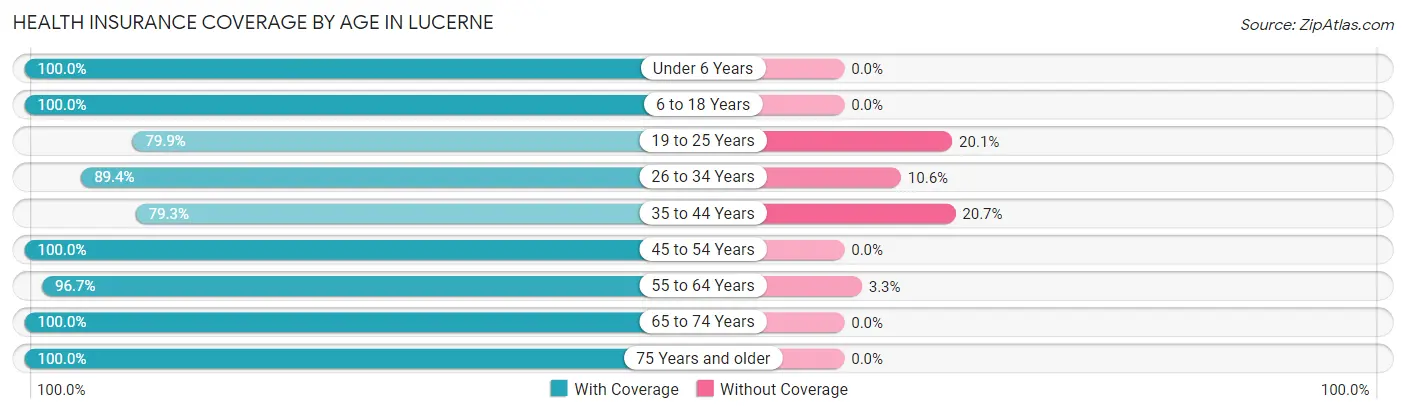
| Age Bracket | With Coverage | Without Coverage |
| Under 6 Years | 96 (100.0%) | 0 (0.0%) |
| 6 to 18 Years | 410 (100.0%) | 0 (0.0%) |
| 19 to 25 Years | 437 (79.9%) | 110 (20.1%) |
| 26 to 34 Years | 398 (89.4%) | 47 (10.6%) |
| 35 to 44 Years | 222 (79.3%) | 58 (20.7%) |
| 45 to 54 Years | 119 (100.0%) | 0 (0.0%) |
| 55 to 64 Years | 534 (96.7%) | 18 (3.3%) |
| 65 to 74 Years | 330 (100.0%) | 0 (0.0%) |
| 75 Years and older | 306 (100.0%) | 0 (0.0%) |
| Total | 2,852 (92.4%) | 233 (7.5%) |
Health Insurance Coverage by Citizenship Status in Lucerne
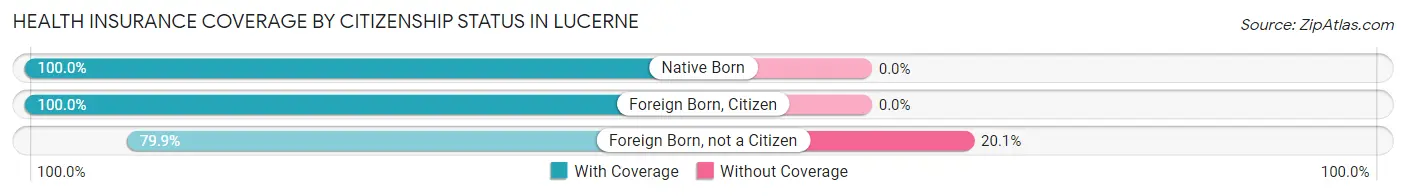
| Citizenship Status | With Coverage | Without Coverage |
| Native Born | 96 (100.0%) | 0 (0.0%) |
| Foreign Born, Citizen | 410 (100.0%) | 0 (0.0%) |
| Foreign Born, not a Citizen | 437 (79.9%) | 110 (20.1%) |
Health Insurance Coverage by Household Income in Lucerne
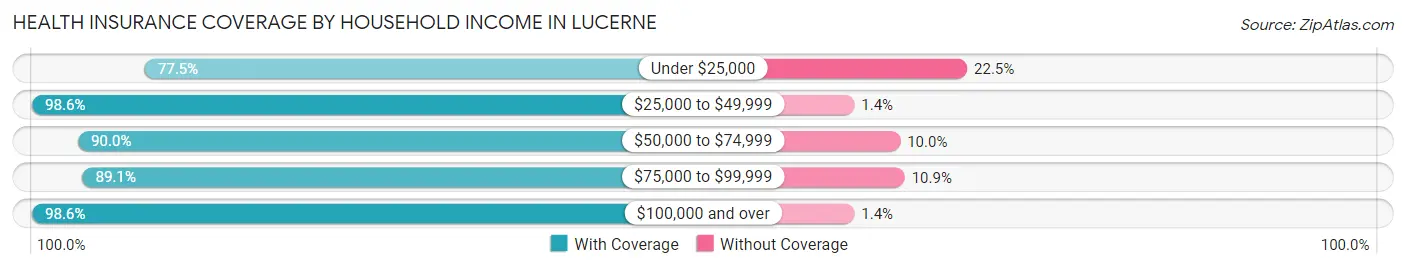
| Household Income | With Coverage | Without Coverage |
| Under $25,000 | 299 (77.5%) | 87 (22.5%) |
| $25,000 to $49,999 | 1,038 (98.6%) | 15 (1.4%) |
| $50,000 to $74,999 | 737 (90.0%) | 82 (10.0%) |
| $75,000 to $99,999 | 353 (89.1%) | 43 (10.9%) |
| $100,000 and over | 420 (98.6%) | 6 (1.4%) |
Public vs Private Health Insurance Coverage by Age in Lucerne
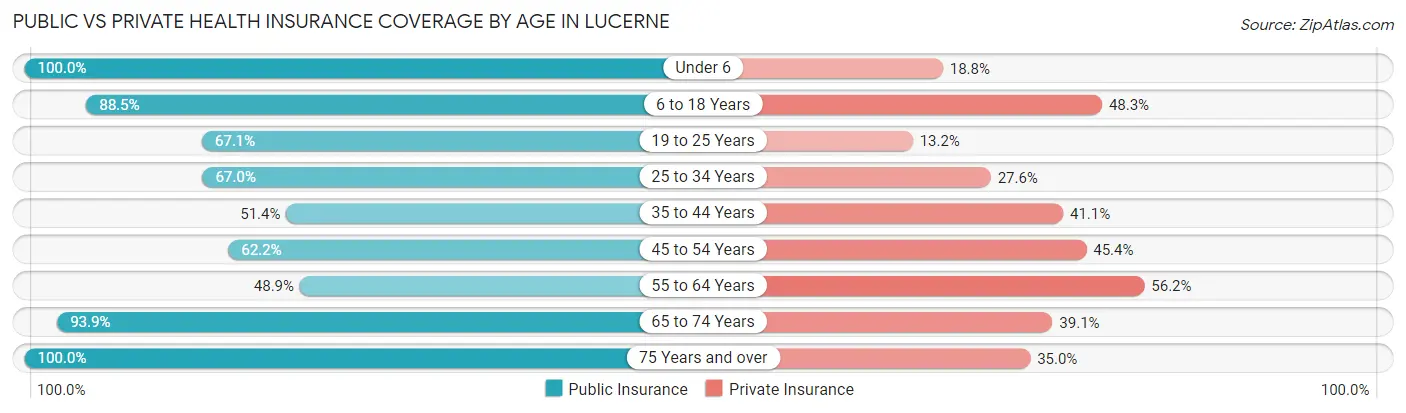
| Age Bracket | Public Insurance | Private Insurance |
| Under 6 | 96 (100.0%) | 18 (18.8%) |
| 6 to 18 Years | 363 (88.5%) | 198 (48.3%) |
| 19 to 25 Years | 367 (67.1%) | 72 (13.2%) |
| 25 to 34 Years | 298 (67.0%) | 123 (27.6%) |
| 35 to 44 Years | 144 (51.4%) | 115 (41.1%) |
| 45 to 54 Years | 74 (62.2%) | 54 (45.4%) |
| 55 to 64 Years | 270 (48.9%) | 310 (56.2%) |
| 65 to 74 Years | 310 (93.9%) | 129 (39.1%) |
| 75 Years and over | 306 (100.0%) | 107 (35.0%) |
| Total | 2,228 (72.2%) | 1,126 (36.5%) |
Disability Status by Sex by Age in Lucerne
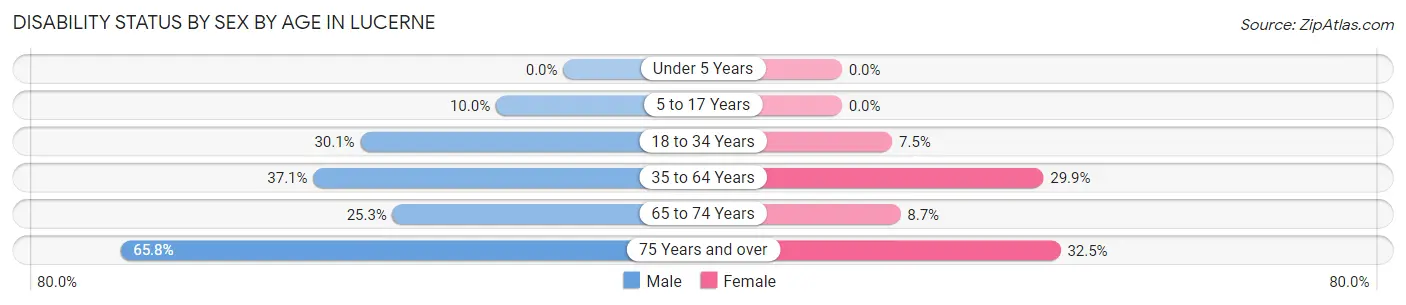
| Age Bracket | Male | Female |
| Under 5 Years | 0 (0.0%) | 0 (0.0%) |
| 5 to 17 Years | 16 (10.0%) | 0 (0.0%) |
| 18 to 34 Years | 182 (30.1%) | 31 (7.5%) |
| 35 to 64 Years | 157 (37.1%) | 158 (29.9%) |
| 65 to 74 Years | 37 (25.3%) | 16 (8.7%) |
| 75 Years and over | 100 (65.8%) | 50 (32.5%) |
Disability Class by Sex by Age in Lucerne
Disability Class: Hearing Difficulty
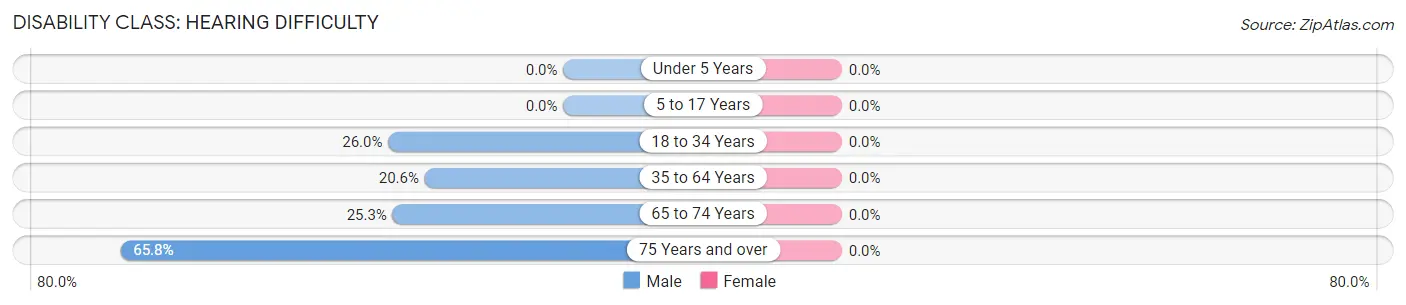
| Age Bracket | Male | Female |
| Under 5 Years | 0 (0.0%) | 0 (0.0%) |
| 5 to 17 Years | 0 (0.0%) | 0 (0.0%) |
| 18 to 34 Years | 157 (26.0%) | 0 (0.0%) |
| 35 to 64 Years | 87 (20.6%) | 0 (0.0%) |
| 65 to 74 Years | 37 (25.3%) | 0 (0.0%) |
| 75 Years and over | 100 (65.8%) | 0 (0.0%) |
Disability Class: Vision Difficulty
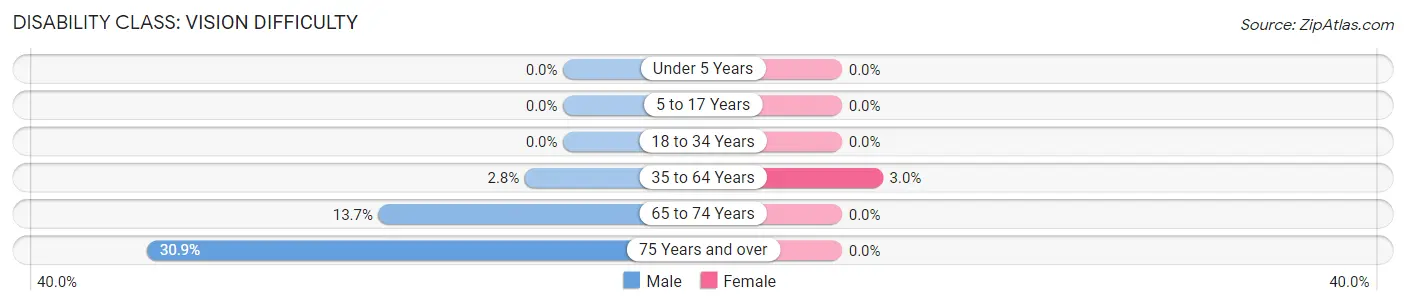
| Age Bracket | Male | Female |
| Under 5 Years | 0 (0.0%) | 0 (0.0%) |
| 5 to 17 Years | 0 (0.0%) | 0 (0.0%) |
| 18 to 34 Years | 0 (0.0%) | 0 (0.0%) |
| 35 to 64 Years | 12 (2.8%) | 16 (3.0%) |
| 65 to 74 Years | 20 (13.7%) | 0 (0.0%) |
| 75 Years and over | 47 (30.9%) | 0 (0.0%) |
Disability Class: Cognitive Difficulty
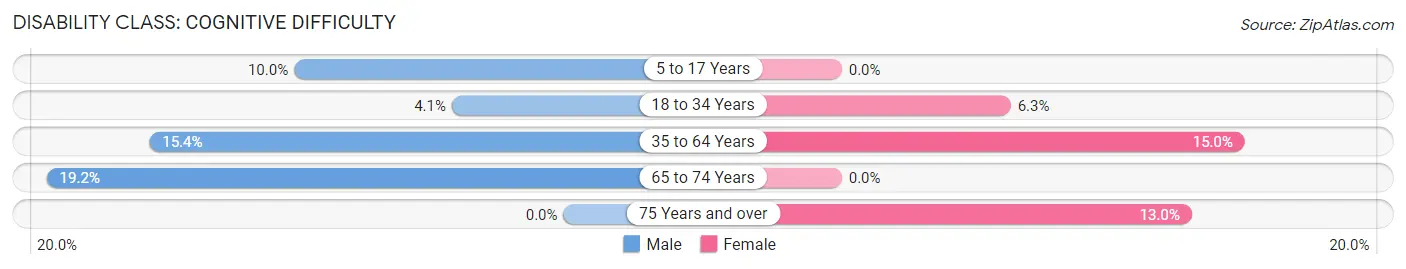
| Age Bracket | Male | Female |
| 5 to 17 Years | 16 (10.0%) | 0 (0.0%) |
| 18 to 34 Years | 25 (4.1%) | 26 (6.3%) |
| 35 to 64 Years | 65 (15.4%) | 79 (15.0%) |
| 65 to 74 Years | 28 (19.2%) | 0 (0.0%) |
| 75 Years and over | 0 (0.0%) | 20 (13.0%) |
Disability Class: Ambulatory Difficulty
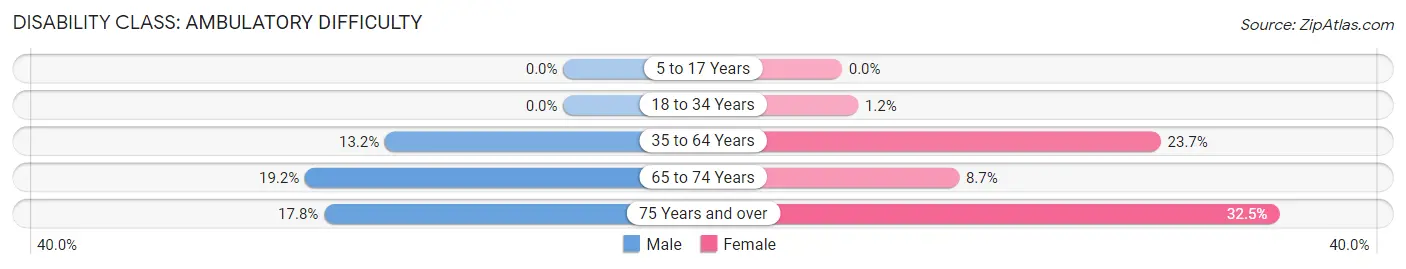
| Age Bracket | Male | Female |
| 5 to 17 Years | 0 (0.0%) | 0 (0.0%) |
| 18 to 34 Years | 0 (0.0%) | 5 (1.2%) |
| 35 to 64 Years | 56 (13.2%) | 125 (23.7%) |
| 65 to 74 Years | 28 (19.2%) | 16 (8.7%) |
| 75 Years and over | 27 (17.8%) | 50 (32.5%) |
Disability Class: Self-Care Difficulty
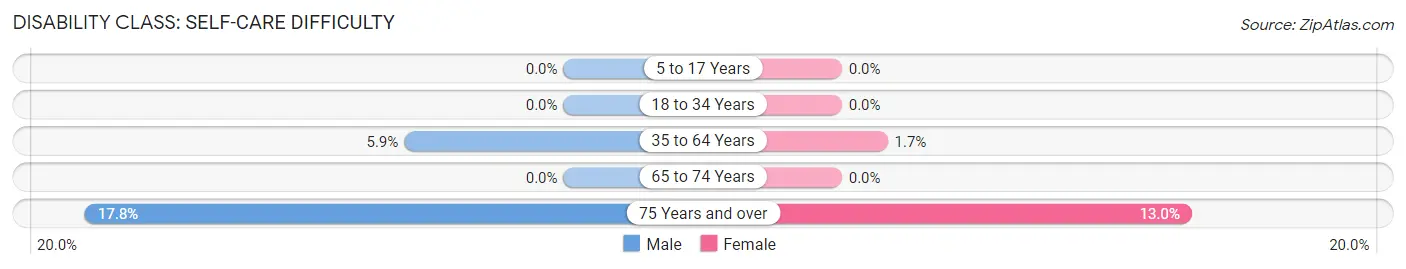
| Age Bracket | Male | Female |
| 5 to 17 Years | 0 (0.0%) | 0 (0.0%) |
| 18 to 34 Years | 0 (0.0%) | 0 (0.0%) |
| 35 to 64 Years | 25 (5.9%) | 9 (1.7%) |
| 65 to 74 Years | 0 (0.0%) | 0 (0.0%) |
| 75 Years and over | 27 (17.8%) | 20 (13.0%) |
Technology Access in Lucerne
Computing Device Access in Lucerne
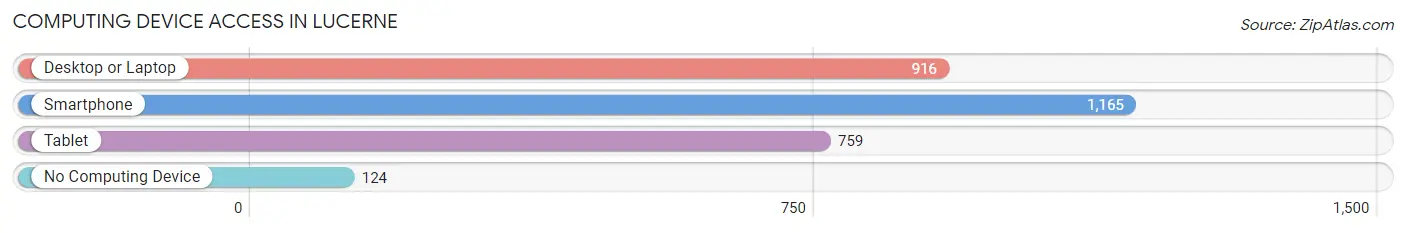
| Device Type | # Households | % Households |
| Desktop or Laptop | 916 | 65.6% |
| Smartphone | 1,165 | 83.4% |
| Tablet | 759 | 54.3% |
| No Computing Device | 124 | 8.9% |
| Total | 1,397 | 100.0% |
Internet Access in Lucerne
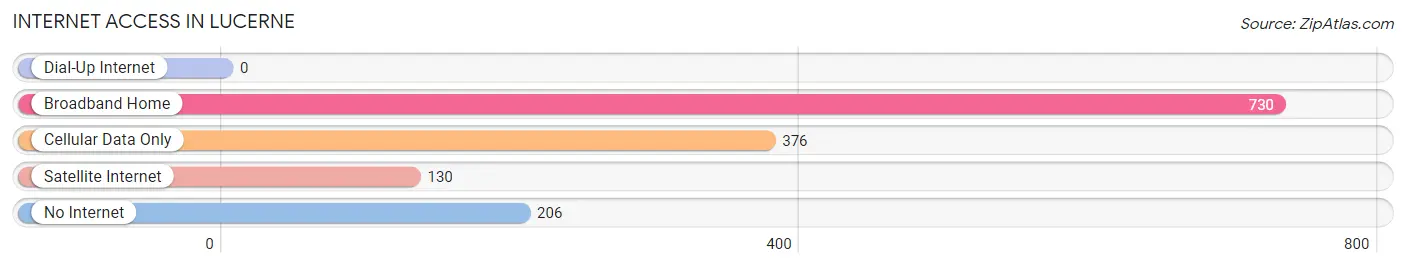
| Internet Type | # Households | % Households |
| Dial-Up Internet | 0 | 0.0% |
| Broadband Home | 730 | 52.2% |
| Cellular Data Only | 376 | 26.9% |
| Satellite Internet | 130 | 9.3% |
| No Internet | 206 | 14.7% |
| Total | 1,397 | 100.0% |
Lucerne Summary
Lucerne is a small unincorporated community located in Lake County, California. It is situated on the western shore of Clear Lake, the largest natural freshwater lake in California. Lucerne is located about 10 miles north of Lakeport, the county seat, and about 90 miles north of San Francisco. The population of Lucerne was 1,845 at the 2010 census.
History
Lucerne was originally inhabited by the Pomo people, who lived in the area for thousands of years before the arrival of Europeans. The first Europeans to settle in the area were the Spanish, who established a mission in nearby Clearlake in 1823. The area was later settled by American pioneers in the 1850s, and the town of Lucerne was established in 1858. The town was named after the city of Lucerne in Switzerland, and was originally a logging and farming community.
Geography
Lucerne is located at 39°10'25"N 122°51'45"W (39.173611, -122.862500). It is situated on the western shore of Clear Lake, at an elevation of 1,400 feet (427 m). The town is surrounded by rolling hills and is located in the Clear Lake Valley.
Climate
Lucerne has a Mediterranean climate, with hot, dry summers and mild, wet winters. The average annual temperature is 61°F (16°C), and the average annual precipitation is 28 inches (71 cm).
Economy
The economy of Lucerne is largely based on tourism and recreation. The town is a popular destination for boating, fishing, and other outdoor activities. The area is also home to several wineries, and the Clear Lake State Park is located nearby.
Demographics
As of the 2010 census, there were 1,845 people, 745 households, and 486 families residing in Lucerne. The population density was 1,092.3 people per square mile (421.9/km2). The racial makeup of Lucerne was 87.2% White, 0.7% African American, 2.2% Native American, 0.7% Asian, 0.1% Pacific Islander, 6.2% from other races, and 3.0% from two or more races. Hispanic or Latino of any race were 14.2% of the population.
The median income for a household in Lucerne was $37,917, and the median income for a family was $45,000. Males had a median income of $35,000 versus $25,000 for females. The per capita income for the town was $18,945. About 11.2% of families and 14.2% of the population were below the poverty line, including 19.2% of those under age 18 and 8.3% of those age 65 or over.
Common Questions
What is Per Capita Income in Lucerne?
Per Capita income in Lucerne is $24,933.
What is the Median Family Income in Lucerne?
Median Family Income in Lucerne is $47,192.
What is the Median Household income in Lucerne?
Median Household Income in Lucerne is $46,026.
What is Income or Wage Gap in Lucerne?
Income or Wage Gap in Lucerne is 10.0%.
Women in Lucerne earn 90.0 cents for every dollar earned by a man.
What is Inequality or Gini Index in Lucerne?
Inequality or Gini Index in Lucerne is 0.42.
What is the Total Population of Lucerne?
Total Population of Lucerne is 3,085.
What is the Total Male Population of Lucerne?
Total Male Population of Lucerne is 1,564.
What is the Total Female Population of Lucerne?
Total Female Population of Lucerne is 1,521.
What is the Ratio of Males per 100 Females in Lucerne?
There are 102.83 Males per 100 Females in Lucerne.
What is the Ratio of Females per 100 Males in Lucerne?
There are 97.25 Females per 100 Males in Lucerne.
What is the Median Population Age in Lucerne?
Median Population Age in Lucerne is 37.0 Years.
What is the Average Family Size in Lucerne
Average Family Size in Lucerne is 3.0 People.
What is the Average Household Size in Lucerne
Average Household Size in Lucerne is 2.2 People.
How Large is the Labor Force in Lucerne?
There are 1,423 People in the Labor Forcein in Lucerne.
What is the Percentage of People in the Labor Force in Lucerne?
54.6% of People are in the Labor Force in Lucerne.
What is the Unemployment Rate in Lucerne?
Unemployment Rate in Lucerne is 9.1%.