Zip Codes with the Highest Percentage of Population Employed in Transportation & Warehousing in Los Gatos, CA
RELATED REPORTS & OPTIONS
Transportation & Warehousing
Los Gatos
Compare Zip Codes
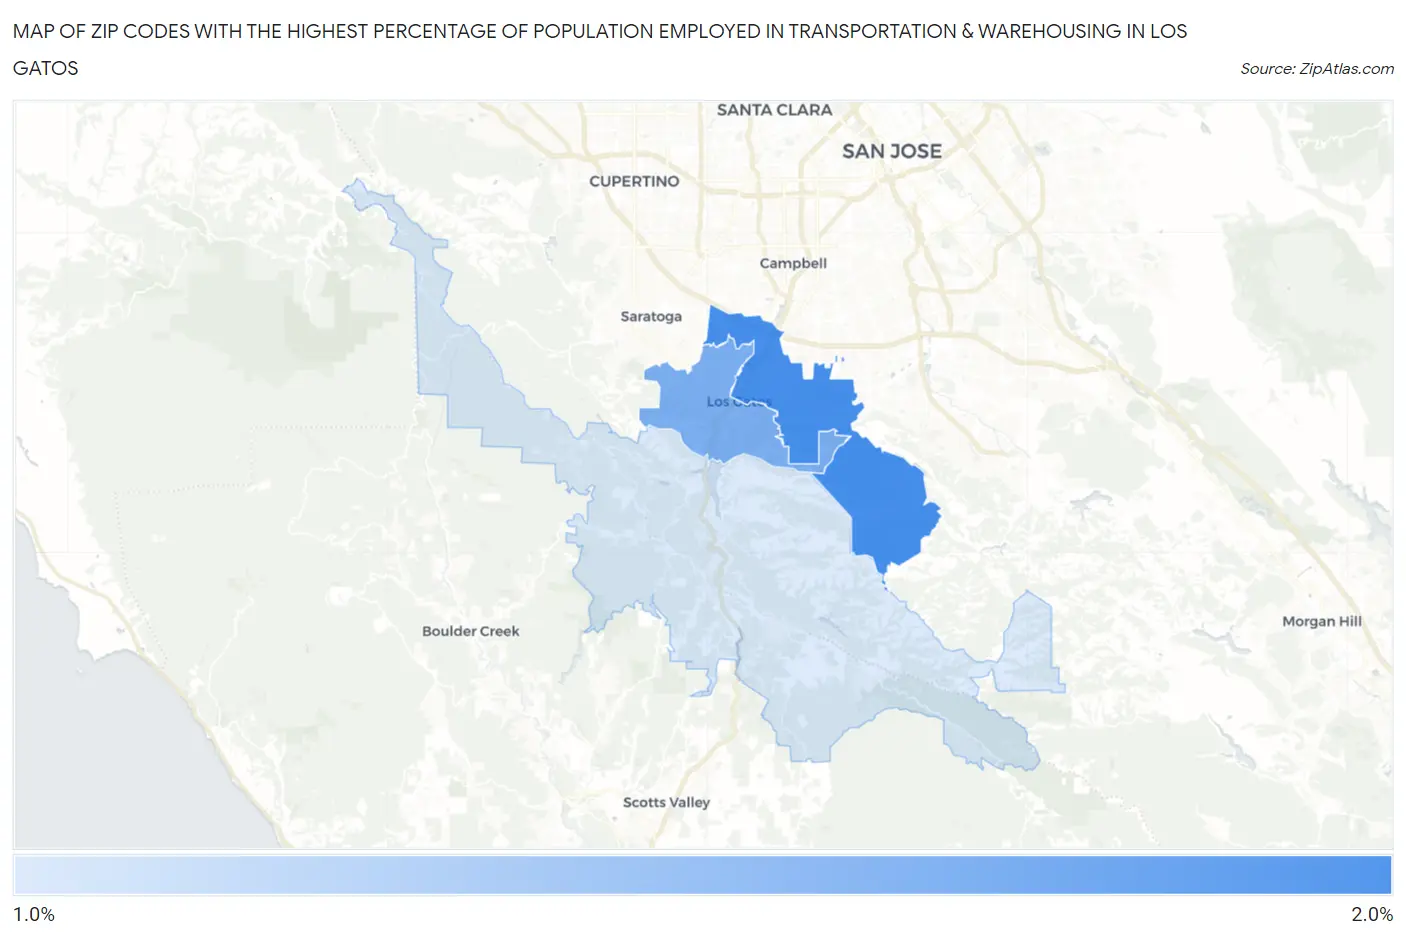
Map of Zip Codes with the Highest Percentage of Population Employed in Transportation & Warehousing in Los Gatos
0.0%
2.0%
Zip Codes with the Highest Percentage of Population Employed in Transportation & Warehousing in Los Gatos, CA
| Zip Code | % Employed | vs State | vs National | |
| 1. | 95032 | 1.8% | 5.1%(-3.33)#1,295 | 4.9%(-3.14)#24,927 |
| 2. | 95030 | 1.6% | 5.1%(-3.49)#1,326 | 4.9%(-3.31)#25,448 |
| 3. | 95033 | 1.3% | 5.1%(-3.78)#1,368 | 4.9%(-3.60)#26,255 |
1
Common Questions
What are the Top Zip Codes with the Highest Percentage of Population Employed in Transportation & Warehousing in Los Gatos, CA?
Top Zip Codes with the Highest Percentage of Population Employed in Transportation & Warehousing in Los Gatos, CA are:
What zip code has the Highest Percentage of Population Employed in Transportation & Warehousing in Los Gatos, CA?
95032 has the Highest Percentage of Population Employed in Transportation & Warehousing in Los Gatos, CA with 1.8%.
What is the Percentage of Population Employed in Transportation & Warehousing in Los Gatos, CA?
Percentage of Population Employed in Transportation & Warehousing in Los Gatos is 1.8%.
What is the Percentage of Population Employed in Transportation & Warehousing in California?
Percentage of Population Employed in Transportation & Warehousing in California is 5.1%.
What is the Percentage of Population Employed in Transportation & Warehousing in the United States?
Percentage of Population Employed in Transportation & Warehousing in the United States is 4.9%.