Loleta, CA Map & Demographics
Loleta Map
Loleta Overview
$30,575
PER CAPITA INCOME
$95,820
AVG FAMILY INCOME
$69,318
AVG HOUSEHOLD INCOME
0.38
INEQUALITY / GINI INDEX
532
TOTAL POPULATION
214
MALE POPULATION
318
FEMALE POPULATION
67.30
MALES / 100 FEMALES
148.60
FEMALES / 100 MALES
46.4
MEDIAN AGE
3.0
AVG FAMILY SIZE
2.2
AVG HOUSEHOLD SIZE
269
LABOR FORCE [ PEOPLE ]
57.8%
PERCENT IN LABOR FORCE
12.6%
UNEMPLOYMENT RATE
Loleta Zip Codes
Loleta Area Codes
Income in Loleta
Income Overview in Loleta
Per Capita Income in Loleta is $30,575, while median incomes of families and households are $95,820 and $69,318 respectively.
| Characteristic | Number | Measure |
| Per Capita Income | 532 | $30,575 |
| Median Family Income | 123 | $95,820 |
| Mean Family Income | 123 | $91,571 |
| Median Household Income | 236 | $69,318 |
| Mean Household Income | 236 | $66,531 |
| Income Deficit | 123 | $0 |
| Wage / Income Gap (%) | 532 | 0.00% |
| Wage / Income Gap ($) | 532 | 100.00¢ per $1 |
| Gini / Inequality Index | 532 | 0.38 |
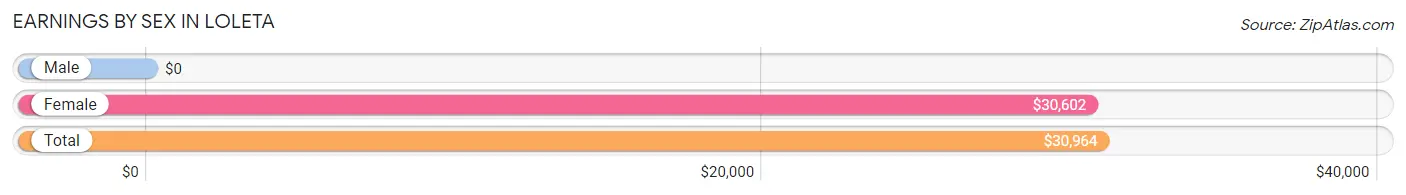
Earnings by Sex in Loleta
| Sex | Number | Average Earnings |
| Male | 110 (44.9%) | $0 |
| Female | 135 (55.1%) | $30,602 |
| Total | 245 (100.0%) | $30,964 |
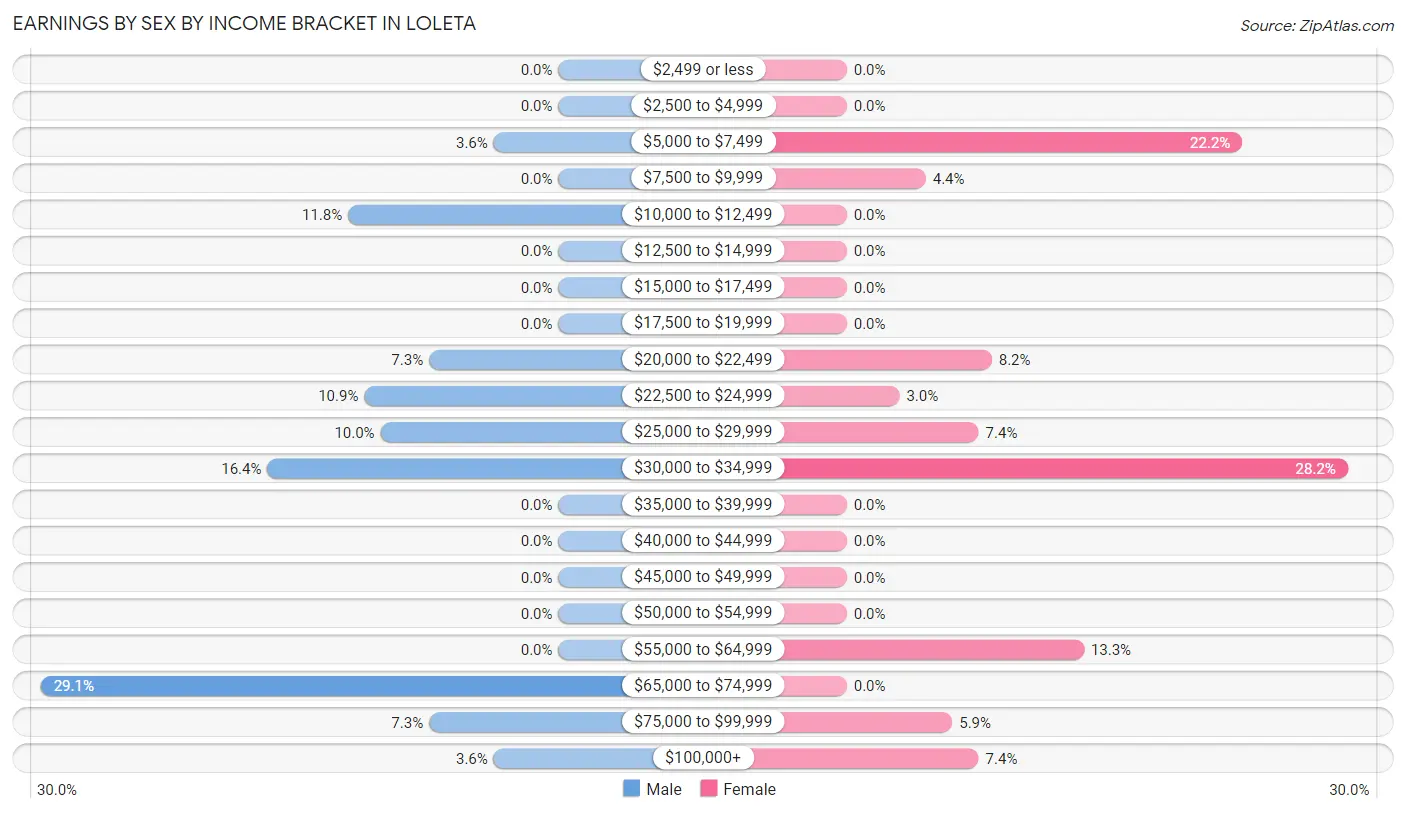
Earnings by Sex by Income Bracket in Loleta
The most common earnings brackets in Loleta are $65,000 to $74,999 for men (32 | 29.1%) and $30,000 to $34,999 for women (38 | 28.1%).
| Income | Male | Female |
| $2,499 or less | 0 (0.0%) | 0 (0.0%) |
| $2,500 to $4,999 | 0 (0.0%) | 0 (0.0%) |
| $5,000 to $7,499 | 4 (3.6%) | 30 (22.2%) |
| $7,500 to $9,999 | 0 (0.0%) | 6 (4.4%) |
| $10,000 to $12,499 | 13 (11.8%) | 0 (0.0%) |
| $12,500 to $14,999 | 0 (0.0%) | 0 (0.0%) |
| $15,000 to $17,499 | 0 (0.0%) | 0 (0.0%) |
| $17,500 to $19,999 | 0 (0.0%) | 0 (0.0%) |
| $20,000 to $22,499 | 8 (7.3%) | 11 (8.2%) |
| $22,500 to $24,999 | 12 (10.9%) | 4 (3.0%) |
| $25,000 to $29,999 | 11 (10.0%) | 10 (7.4%) |
| $30,000 to $34,999 | 18 (16.4%) | 38 (28.1%) |
| $35,000 to $39,999 | 0 (0.0%) | 0 (0.0%) |
| $40,000 to $44,999 | 0 (0.0%) | 0 (0.0%) |
| $45,000 to $49,999 | 0 (0.0%) | 0 (0.0%) |
| $50,000 to $54,999 | 0 (0.0%) | 0 (0.0%) |
| $55,000 to $64,999 | 0 (0.0%) | 18 (13.3%) |
| $65,000 to $74,999 | 32 (29.1%) | 0 (0.0%) |
| $75,000 to $99,999 | 8 (7.3%) | 8 (5.9%) |
| $100,000+ | 4 (3.6%) | 10 (7.4%) |
| Total | 110 (100.0%) | 135 (100.0%) |
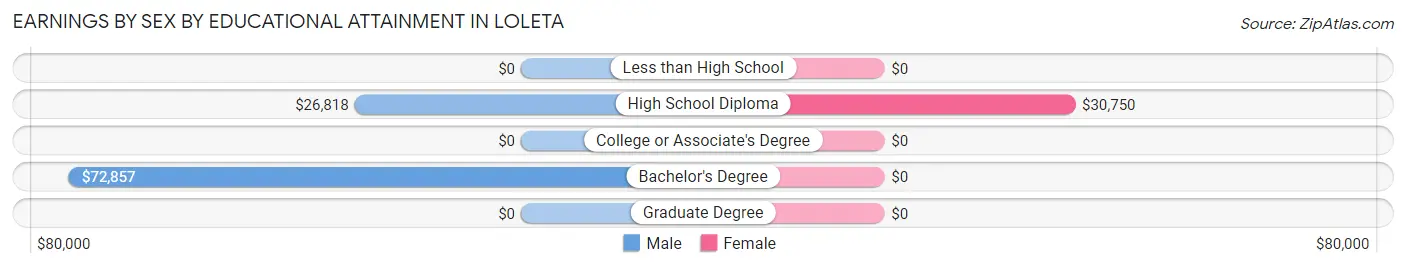
Earnings by Sex by Educational Attainment in Loleta
| Educational Attainment | Male Income | Female Income |
| Less than High School | - | - |
| High School Diploma | $26,818 | $30,750 |
| College or Associate's Degree | - | - |
| Bachelor's Degree | $72,857 | $0 |
| Graduate Degree | - | - |
| Total | - | - |
Family Income in Loleta
Family Income Brackets in Loleta
According to the Loleta family income data, there are 48 families falling into the $75,000 to $99,999 income range, which is the most common income bracket and makes up 39.0% of all families.
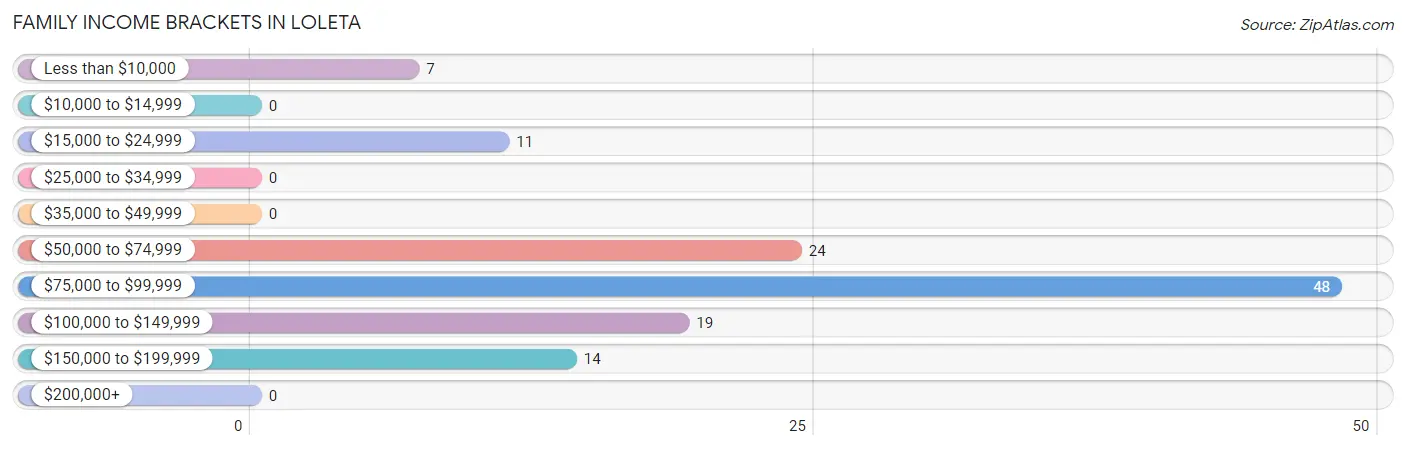
| Income Bracket | # Families | % Families |
| Less than $10,000 | 7 | 5.7% |
| $10,000 to $14,999 | 0 | 0.0% |
| $15,000 to $24,999 | 11 | 8.9% |
| $25,000 to $34,999 | 0 | 0.0% |
| $35,000 to $49,999 | 0 | 0.0% |
| $50,000 to $74,999 | 24 | 19.5% |
| $75,000 to $99,999 | 48 | 39.0% |
| $100,000 to $149,999 | 19 | 15.4% |
| $150,000 to $199,999 | 14 | 11.4% |
| $200,000+ | 0 | 0.0% |
Family Income by Famaliy Size in Loleta
3-person families (49 | 39.8%) account for the highest median family income in Loleta with $96,397 per family, while 2-person families (62 | 50.4%) have the highest median income of $47,834 per family member.
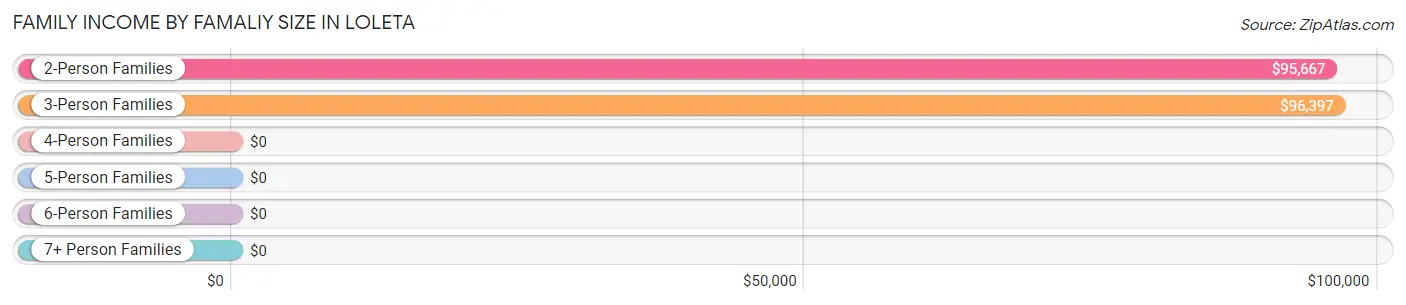
| Income Bracket | # Families | Median Income |
| 2-Person Families | 62 (50.4%) | $95,667 |
| 3-Person Families | 49 (39.8%) | $96,397 |
| 4-Person Families | 3 (2.4%) | $0 |
| 5-Person Families | 9 (7.3%) | $0 |
| 6-Person Families | 0 (0.0%) | $0 |
| 7+ Person Families | 0 (0.0%) | $0 |
| Total | 123 (100.0%) | $95,820 |
Family Income by Number of Earners in Loleta
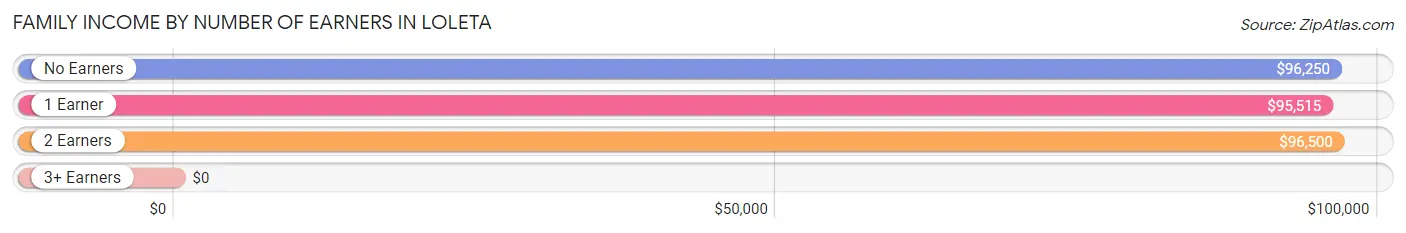
| Number of Earners | # Families | Median Income |
| No Earners | 32 (26.0%) | $96,250 |
| 1 Earner | 47 (38.2%) | $95,515 |
| 2 Earners | 40 (32.5%) | $96,500 |
| 3+ Earners | 4 (3.3%) | $0 |
| Total | 123 (100.0%) | $95,820 |
Household Income in Loleta
Household Income Brackets in Loleta
With 69 households falling in the category, the $75,000 to $99,999 income range is the most frequent in Loleta, accounting for 29.2% of all households.
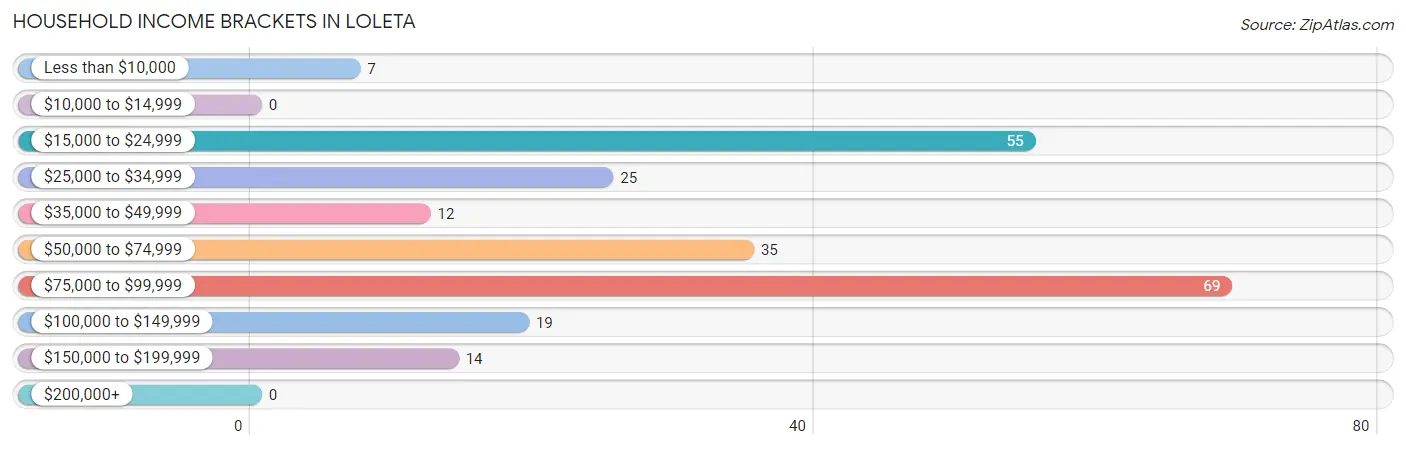
| Income Bracket | # Households | % Households |
| Less than $10,000 | 7 | 3.0% |
| $10,000 to $14,999 | 0 | 0.0% |
| $15,000 to $24,999 | 55 | 23.3% |
| $25,000 to $34,999 | 25 | 10.6% |
| $35,000 to $49,999 | 12 | 5.1% |
| $50,000 to $74,999 | 35 | 14.8% |
| $75,000 to $99,999 | 69 | 29.2% |
| $100,000 to $149,999 | 19 | 8.1% |
| $150,000 to $199,999 | 14 | 5.9% |
| $200,000+ | 0 | 0.0% |
Household Income by Householder Age in Loleta
The median household income in Loleta is $69,318, with the highest median household income of $71,389 found in the 25 to 44 years age bracket for the primary householder. A total of 32 households (13.6%) fall into this category. Meanwhile, the 15 to 24 years age bracket for the primary householder has the lowest median household income of $0, with 14 households (5.9%) in this group.
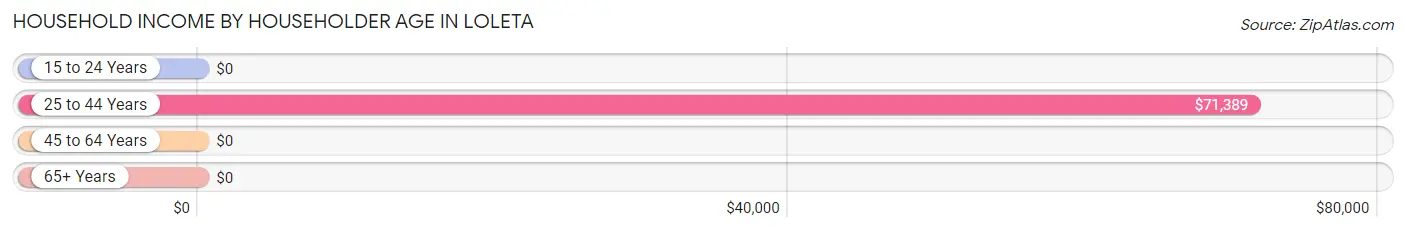
| Income Bracket | # Households | Median Income |
| 15 to 24 Years | 14 (5.9%) | $0 |
| 25 to 44 Years | 32 (13.6%) | $71,389 |
| 45 to 64 Years | 146 (61.9%) | $0 |
| 65+ Years | 44 (18.6%) | $0 |
| Total | 236 (100.0%) | $69,318 |
Poverty in Loleta
Income Below Poverty by Sex and Age in Loleta
With 2.4% poverty level for males and 9.4% for females among the residents of Loleta, 25 to 34 year old males and 25 to 34 year old females are the most vulnerable to poverty, with 5 males (33.3%) and 9 females (45.0%) in their respective age groups living below the poverty level.
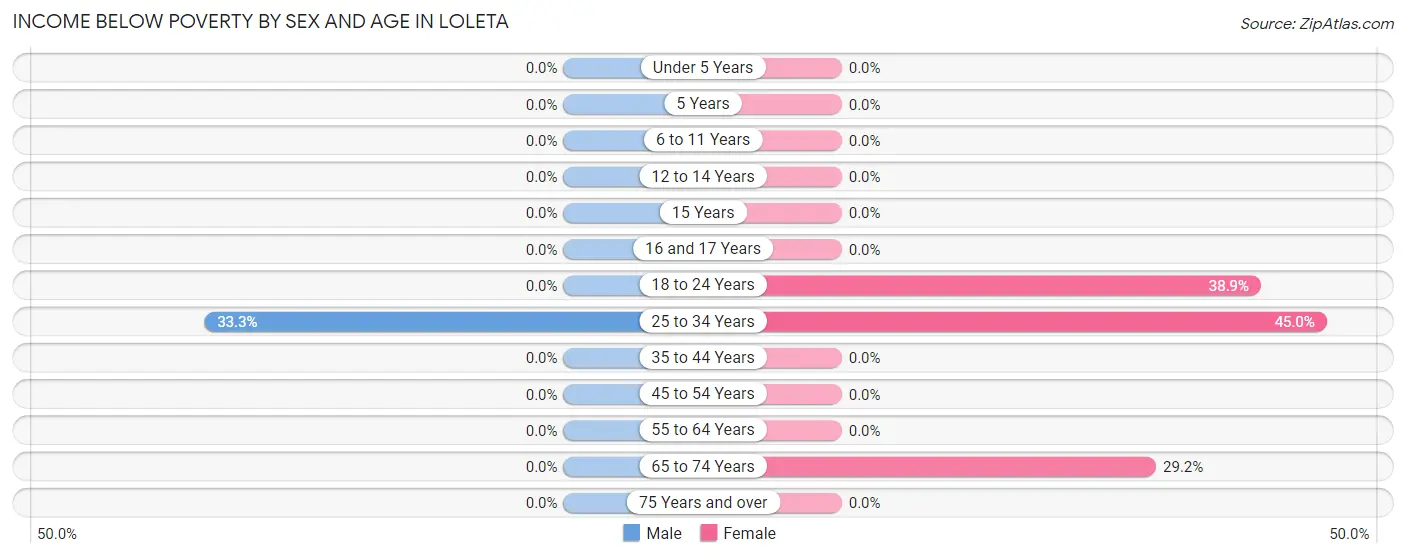
| Age Bracket | Male | Female |
| Under 5 Years | 0 (0.0%) | 0 (0.0%) |
| 5 Years | 0 (0.0%) | 0 (0.0%) |
| 6 to 11 Years | 0 (0.0%) | 0 (0.0%) |
| 12 to 14 Years | 0 (0.0%) | 0 (0.0%) |
| 15 Years | 0 (0.0%) | 0 (0.0%) |
| 16 and 17 Years | 0 (0.0%) | 0 (0.0%) |
| 18 to 24 Years | 0 (0.0%) | 14 (38.9%) |
| 25 to 34 Years | 5 (33.3%) | 9 (45.0%) |
| 35 to 44 Years | 0 (0.0%) | 0 (0.0%) |
| 45 to 54 Years | 0 (0.0%) | 0 (0.0%) |
| 55 to 64 Years | 0 (0.0%) | 0 (0.0%) |
| 65 to 74 Years | 0 (0.0%) | 7 (29.2%) |
| 75 Years and over | 0 (0.0%) | 0 (0.0%) |
| Total | 5 (2.4%) | 30 (9.4%) |
Income Above Poverty by Sex and Age in Loleta
According to the poverty statistics in Loleta, males aged 6 to 11 years and females aged 5 years are the age groups that are most secure financially, with 100.0% of males and 100.0% of females in these age groups living above the poverty line.
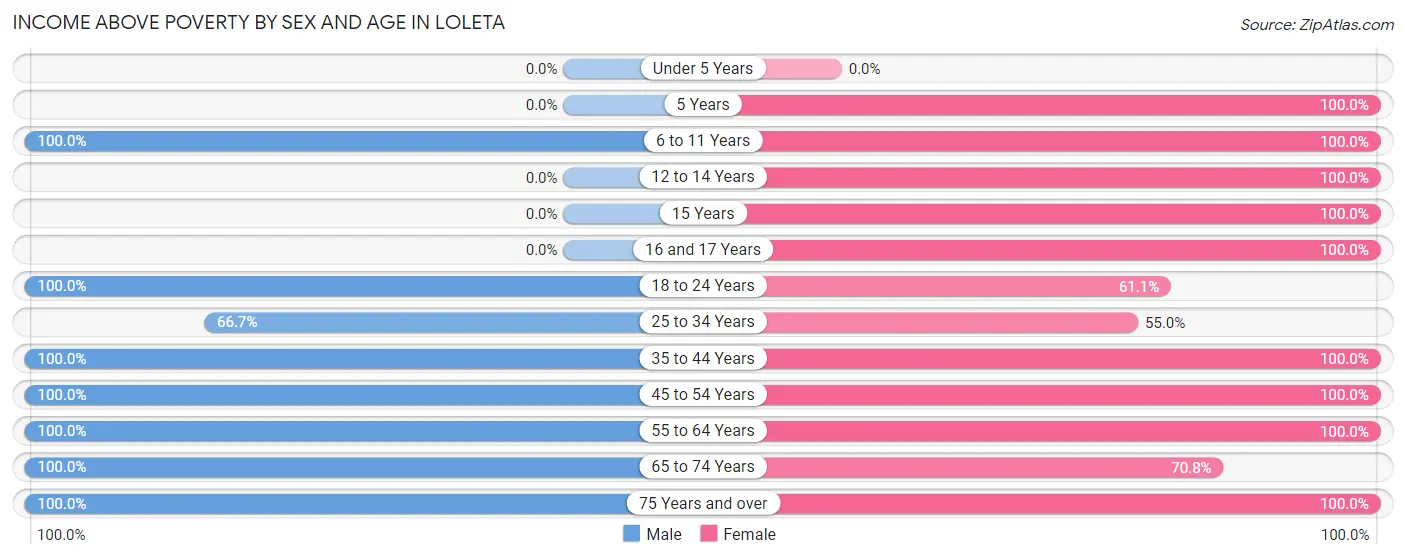
| Age Bracket | Male | Female |
| Under 5 Years | 0 (0.0%) | 0 (0.0%) |
| 5 Years | 0 (0.0%) | 9 (100.0%) |
| 6 to 11 Years | 8 (100.0%) | 16 (100.0%) |
| 12 to 14 Years | 0 (0.0%) | 12 (100.0%) |
| 15 Years | 0 (0.0%) | 16 (100.0%) |
| 16 and 17 Years | 0 (0.0%) | 18 (100.0%) |
| 18 to 24 Years | 52 (100.0%) | 22 (61.1%) |
| 25 to 34 Years | 10 (66.7%) | 11 (55.0%) |
| 35 to 44 Years | 16 (100.0%) | 28 (100.0%) |
| 45 to 54 Years | 57 (100.0%) | 41 (100.0%) |
| 55 to 64 Years | 27 (100.0%) | 86 (100.0%) |
| 65 to 74 Years | 23 (100.0%) | 17 (70.8%) |
| 75 Years and over | 10 (100.0%) | 12 (100.0%) |
| Total | 203 (97.6%) | 288 (90.6%) |
Income Below Poverty Among Married-Couple Families in Loleta
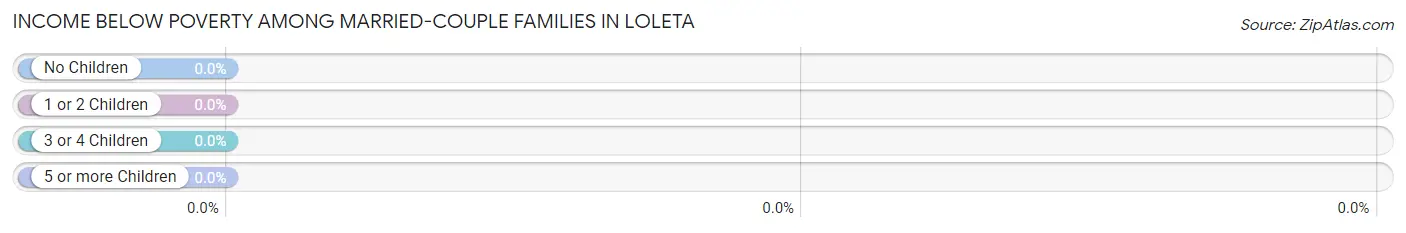
| Children | Above Poverty | Below Poverty |
| No Children | 54 (100.0%) | 0 (0.0%) |
| 1 or 2 Children | 28 (100.0%) | 0 (0.0%) |
| 3 or 4 Children | 9 (100.0%) | 0 (0.0%) |
| 5 or more Children | 0 (0.0%) | 0 (0.0%) |
| Total | 91 (100.0%) | 0 (0.0%) |
Income Below Poverty Among Single-Parent Households in Loleta
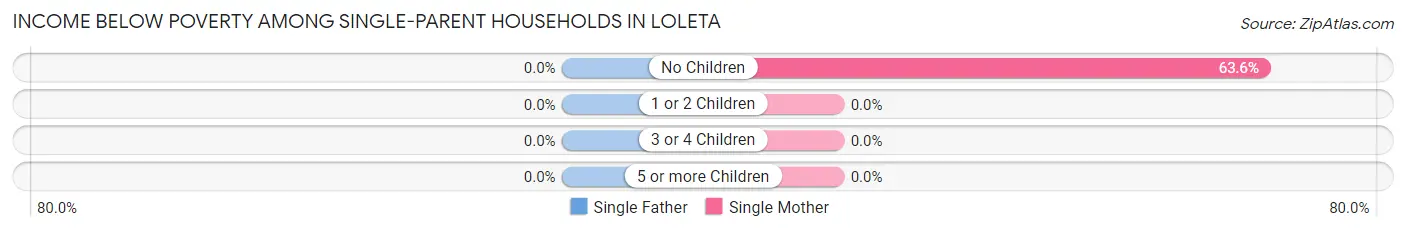
| Children | Single Father | Single Mother |
| No Children | 0 (0.0%) | 7 (63.6%) |
| 1 or 2 Children | 0 (0.0%) | 0 (0.0%) |
| 3 or 4 Children | 0 (0.0%) | 0 (0.0%) |
| 5 or more Children | 0 (0.0%) | 0 (0.0%) |
| Total | 0 (0.0%) | 7 (24.1%) |
Income Below Poverty Among Married-Couple vs Single-Parent Households in Loleta
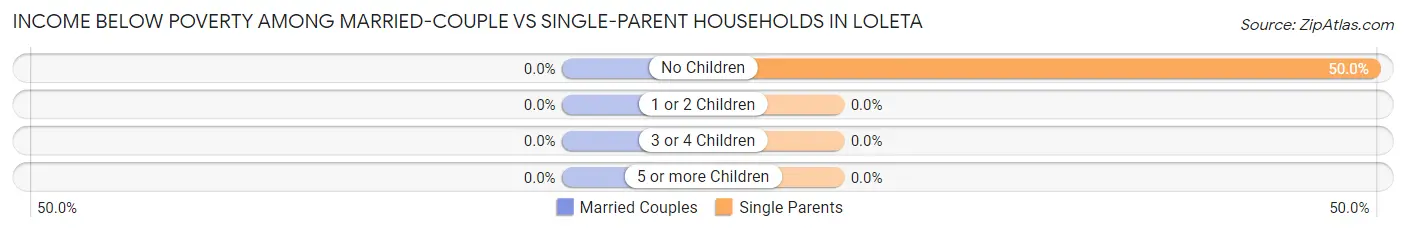
| Children | Married-Couple Families | Single-Parent Households |
| No Children | 0 (0.0%) | 7 (50.0%) |
| 1 or 2 Children | 0 (0.0%) | 0 (0.0%) |
| 3 or 4 Children | 0 (0.0%) | 0 (0.0%) |
| 5 or more Children | 0 (0.0%) | 0 (0.0%) |
| Total | 0 (0.0%) | 7 (21.9%) |
Race in Loleta
The most populous races in Loleta are White / Caucasian (449 | 84.4%), Black / African American (35 | 6.6%), and Two or more Races (29 | 5.4%).
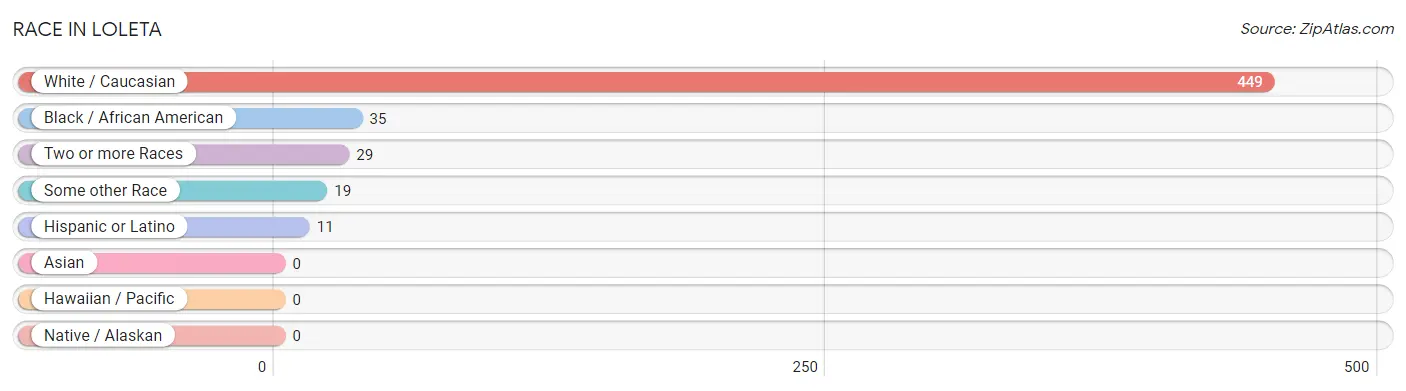
| Race | # Population | % Population |
| Asian | 0 | 0.0% |
| Black / African American | 35 | 6.6% |
| Hawaiian / Pacific | 0 | 0.0% |
| Hispanic or Latino | 11 | 2.1% |
| Native / Alaskan | 0 | 0.0% |
| White / Caucasian | 449 | 84.4% |
| Two or more Races | 29 | 5.4% |
| Some other Race | 19 | 3.6% |
| Total | 532 | 100.0% |
Ancestry in Loleta
The most populous ancestries reported in Loleta are German (99 | 18.6%), English (52 | 9.8%), European (44 | 8.3%), Swiss (31 | 5.8%), and Cherokee (29 | 5.4%), together accounting for 47.9% of all Loleta residents.
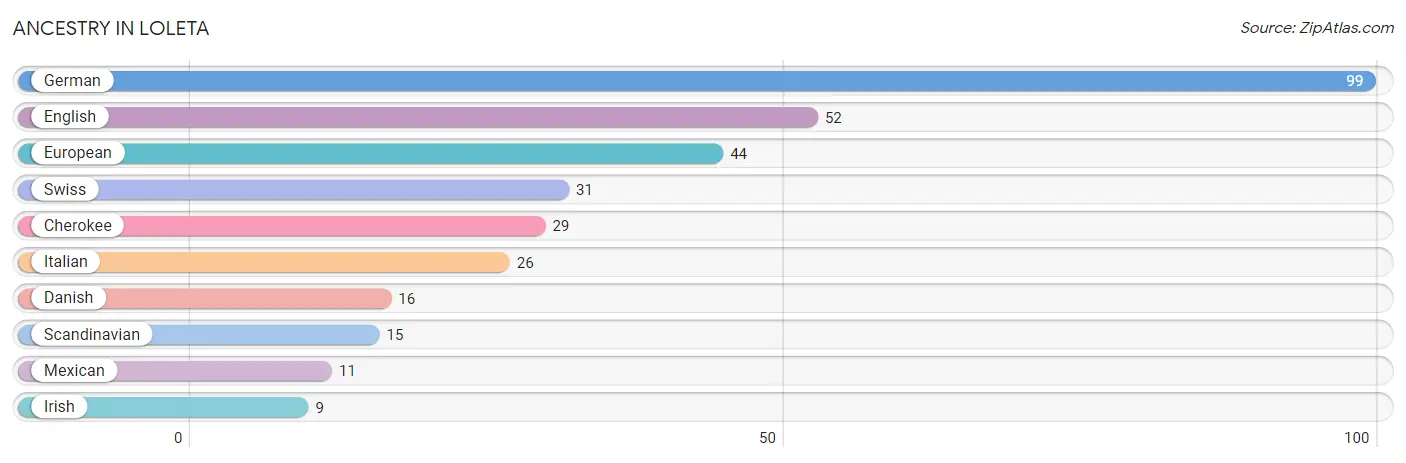
| Ancestry | # Population | % Population |
| Cherokee | 29 | 5.4% |
| Danish | 16 | 3.0% |
| English | 52 | 9.8% |
| European | 44 | 8.3% |
| German | 99 | 18.6% |
| Irish | 9 | 1.7% |
| Italian | 26 | 4.9% |
| Mexican | 11 | 2.1% |
| Scandinavian | 15 | 2.8% |
| Swiss | 31 | 5.8% | View All 10 Rows |
Immigrants in Loleta
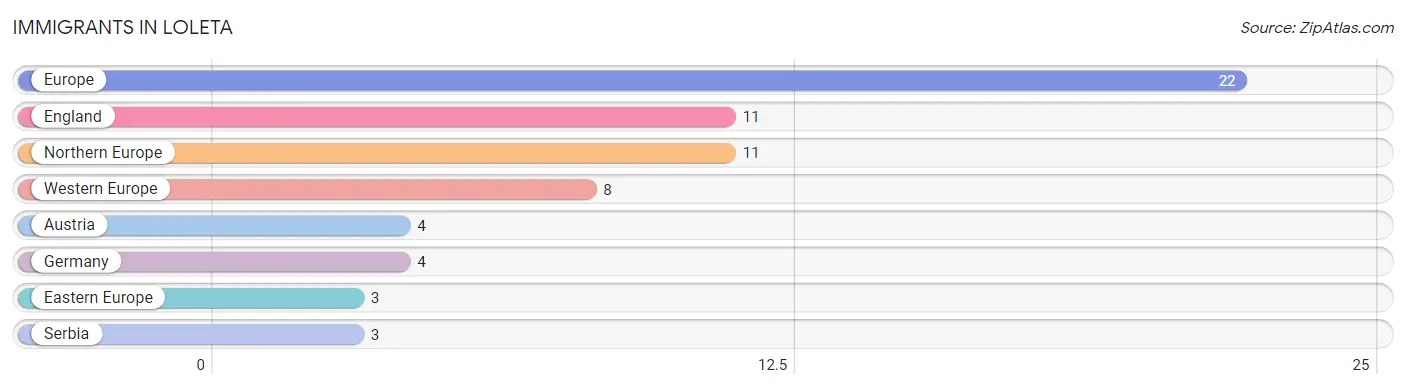
The most numerous immigrant groups reported in Loleta came from Europe (22 | 4.1%), England (11 | 2.1%), Northern Europe (11 | 2.1%), Western Europe (8 | 1.5%), and Austria (4 | 0.7%), together accounting for 10.5% of all Loleta residents.
| Immigration Origin | # Population | % Population |
| Austria | 4 | 0.7% |
| Eastern Europe | 3 | 0.6% |
| England | 11 | 2.1% |
| Europe | 22 | 4.1% |
| Germany | 4 | 0.7% |
| Northern Europe | 11 | 2.1% |
| Serbia | 3 | 0.6% |
| Western Europe | 8 | 1.5% | View All 8 Rows |
Sex and Age in Loleta
Sex and Age in Loleta
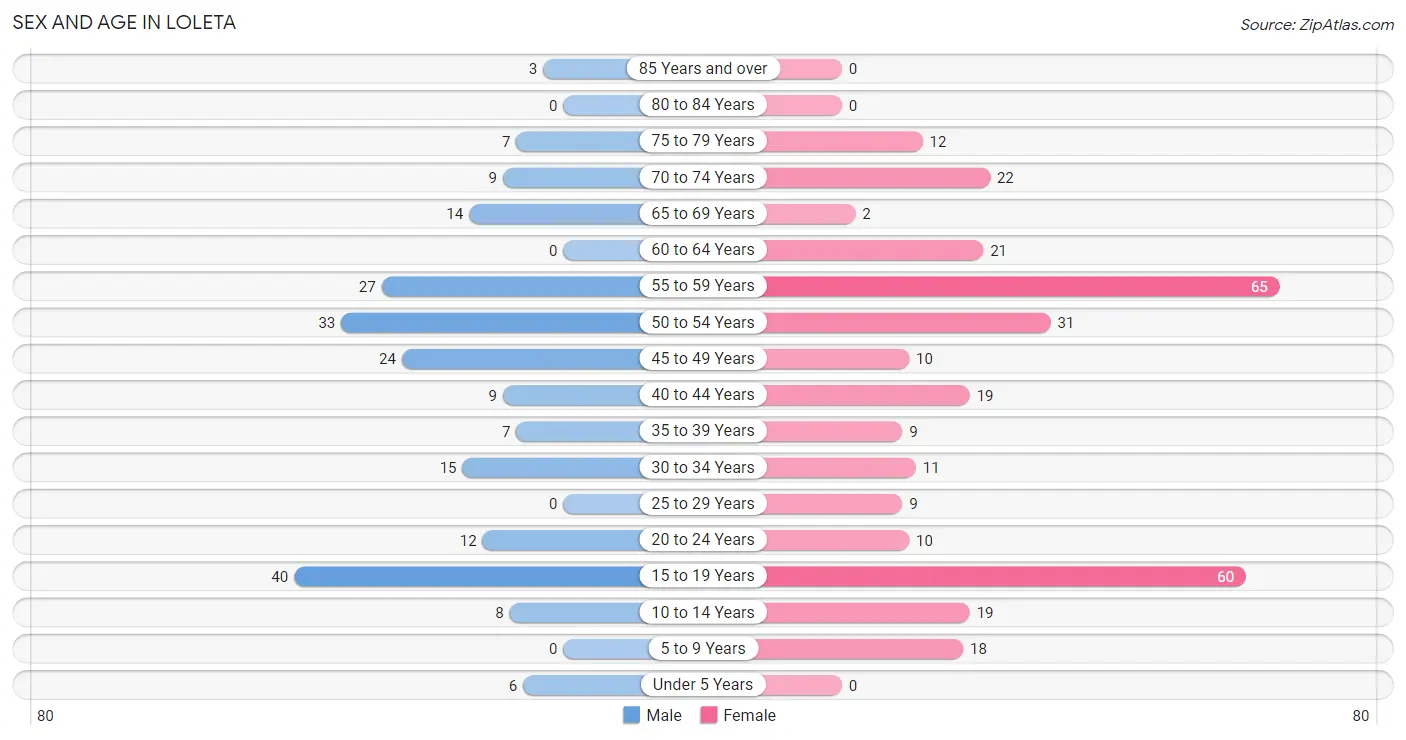
The most populous age groups in Loleta are 15 to 19 Years (40 | 18.7%) for men and 55 to 59 Years (65 | 20.4%) for women.
| Age Bracket | Male | Female |
| Under 5 Years | 6 (2.8%) | 0 (0.0%) |
| 5 to 9 Years | 0 (0.0%) | 18 (5.7%) |
| 10 to 14 Years | 8 (3.7%) | 19 (6.0%) |
| 15 to 19 Years | 40 (18.7%) | 60 (18.9%) |
| 20 to 24 Years | 12 (5.6%) | 10 (3.1%) |
| 25 to 29 Years | 0 (0.0%) | 9 (2.8%) |
| 30 to 34 Years | 15 (7.0%) | 11 (3.5%) |
| 35 to 39 Years | 7 (3.3%) | 9 (2.8%) |
| 40 to 44 Years | 9 (4.2%) | 19 (6.0%) |
| 45 to 49 Years | 24 (11.2%) | 10 (3.1%) |
| 50 to 54 Years | 33 (15.4%) | 31 (9.8%) |
| 55 to 59 Years | 27 (12.6%) | 65 (20.4%) |
| 60 to 64 Years | 0 (0.0%) | 21 (6.6%) |
| 65 to 69 Years | 14 (6.5%) | 2 (0.6%) |
| 70 to 74 Years | 9 (4.2%) | 22 (6.9%) |
| 75 to 79 Years | 7 (3.3%) | 12 (3.8%) |
| 80 to 84 Years | 0 (0.0%) | 0 (0.0%) |
| 85 Years and over | 3 (1.4%) | 0 (0.0%) |
| Total | 214 (100.0%) | 318 (100.0%) |
Families and Households in Loleta
Median Family Size in Loleta
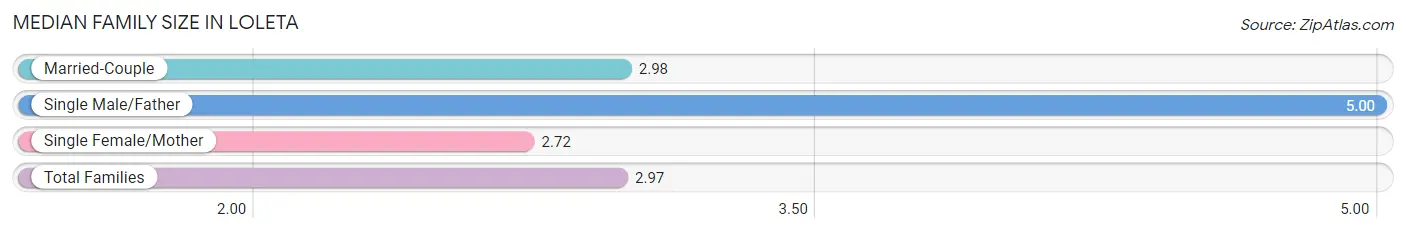
The median family size in Loleta is 2.97 persons per family, with single male/father families (3 | 2.4%) accounting for the largest median family size of 5 persons per family. On the other hand, single female/mother families (29 | 23.6%) represent the smallest median family size with 2.72 persons per family.
| Family Type | # Families | Family Size |
| Married-Couple | 91 (74.0%) | 2.98 |
| Single Male/Father | 3 (2.4%) | 5.00 |
| Single Female/Mother | 29 (23.6%) | 2.72 |
| Total Families | 123 (100.0%) | 2.97 |
Median Household Size in Loleta
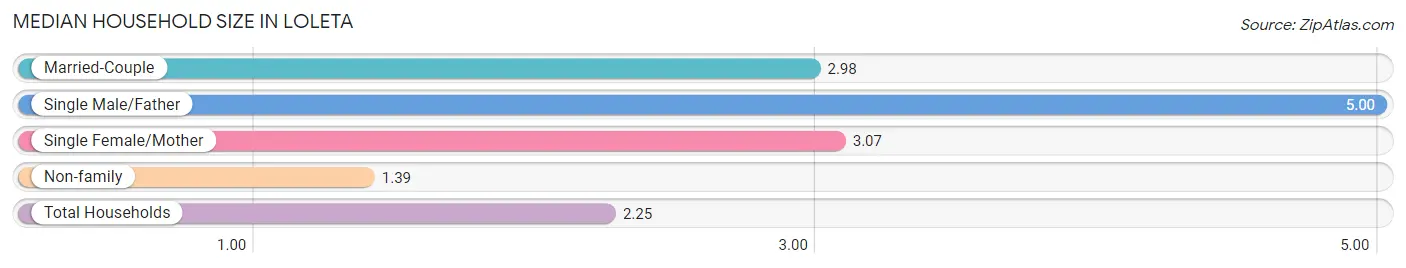
The median household size in Loleta is 2.25 persons per household, with single male/father households (3 | 1.3%) accounting for the largest median household size of 5 persons per household. non-family households (113 | 47.9%) represent the smallest median household size with 1.39 persons per household.
| Household Type | # Households | Household Size |
| Married-Couple | 91 (38.6%) | 2.98 |
| Single Male/Father | 3 (1.3%) | 5.00 |
| Single Female/Mother | 29 (12.3%) | 3.07 |
| Non-family | 113 (47.9%) | 1.39 |
| Total Households | 236 (100.0%) | 2.25 |
Household Size by Marriage Status in Loleta
Out of a total of 236 households in Loleta, 123 (52.1%) are family households, while 113 (47.9%) are nonfamily households. The most numerous type of family households are 3-person households, comprising 60, and the most common type of nonfamily households are 1-person households, comprising 94.
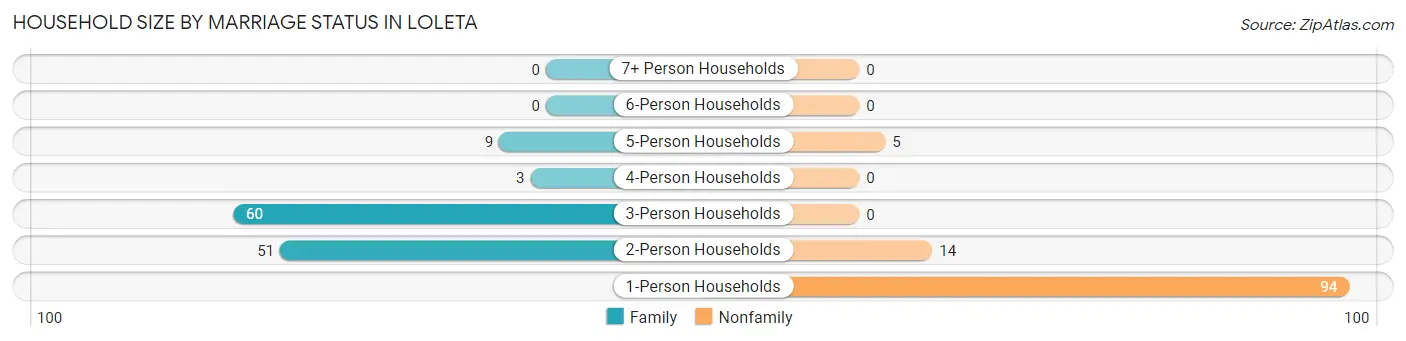
| Household Size | Family Households | Nonfamily Households |
| 1-Person Households | - | 94 (39.8%) |
| 2-Person Households | 51 (21.6%) | 14 (5.9%) |
| 3-Person Households | 60 (25.4%) | 0 (0.0%) |
| 4-Person Households | 3 (1.3%) | 0 (0.0%) |
| 5-Person Households | 9 (3.8%) | 5 (2.1%) |
| 6-Person Households | 0 (0.0%) | 0 (0.0%) |
| 7+ Person Households | 0 (0.0%) | 0 (0.0%) |
| Total | 123 (52.1%) | 113 (47.9%) |
Female Fertility in Loleta
Fertility by Age in Loleta
| Age Bracket | Women with Births | Births / 1,000 Women |
| 15 to 19 years | 0 (0.0%) | 0.0 |
| 20 to 34 years | 0 (0.0%) | 0.0 |
| 35 to 50 years | 0 (0.0%) | 0.0 |
| Total | 0 (0.0%) | 0.0 |
Fertility by Age by Marriage Status in Loleta
| Age Bracket | Married | Unmarried |
| 15 to 19 years | 0 (0.0%) | 0 (0.0%) |
| 20 to 34 years | 0 (0.0%) | 0 (0.0%) |
| 35 to 50 years | 0 (0.0%) | 0 (0.0%) |
| Total | 0 (0.0%) | 0 (0.0%) |
Fertility by Education in Loleta
| Educational Attainment | Women with Births | Births / 1,000 Women |
| Less than High School | 0 (0.0%) | 0.0 |
| High School Diploma | 0 (0.0%) | 0.0 |
| College or Associate's Degree | 0 (0.0%) | 0.0 |
| Bachelor's Degree | 0 (0.0%) | 0.0 |
| Graduate Degree | 0 (0.0%) | 0.0 |
| Total | 0 (0.0%) | 0.0 |
Fertility by Education by Marriage Status in Loleta
| Educational Attainment | Married | Unmarried |
| Less than High School | 0 (0.0%) | 0 (0.0%) |
| High School Diploma | 0 (0.0%) | 0 (0.0%) |
| College or Associate's Degree | 0 (0.0%) | 0 (0.0%) |
| Bachelor's Degree | 0 (0.0%) | 0 (0.0%) |
| Graduate Degree | 0 (0.0%) | 0 (0.0%) |
| Total | 0 (0.0%) | 0 (0.0%) |
Employment Characteristics in Loleta
Employment by Class of Employer in Loleta
Among the 235 employed individuals in Loleta, private company employees (91 | 38.7%), self-employed (not incorporated) (54 | 23.0%), and state government employees (38 | 16.2%) make up the most common classes of employment.
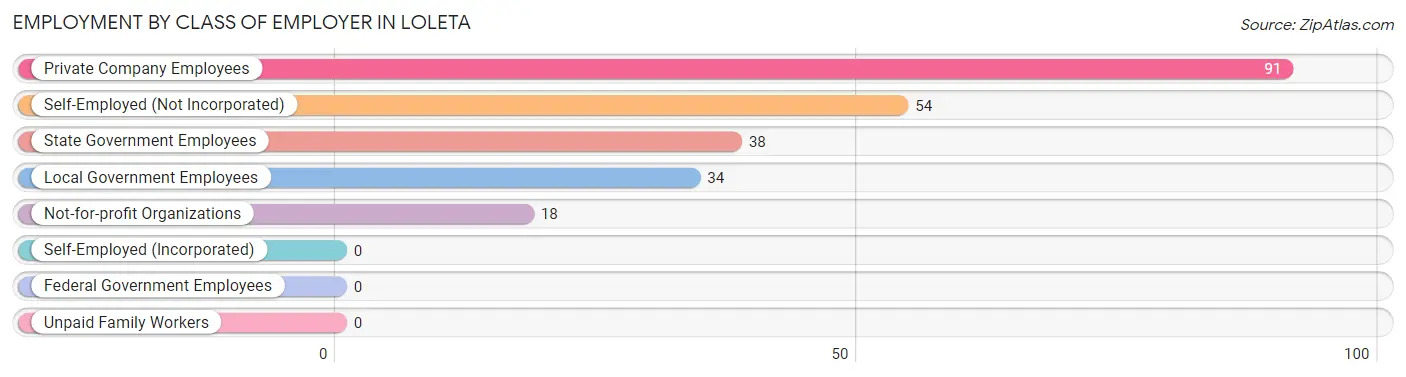
| Employer Class | # Employees | % Employees |
| Private Company Employees | 91 | 38.7% |
| Self-Employed (Incorporated) | 0 | 0.0% |
| Self-Employed (Not Incorporated) | 54 | 23.0% |
| Not-for-profit Organizations | 18 | 7.7% |
| Local Government Employees | 34 | 14.5% |
| State Government Employees | 38 | 16.2% |
| Federal Government Employees | 0 | 0.0% |
| Unpaid Family Workers | 0 | 0.0% |
| Total | 235 | 100.0% |
Employment Status by Age in Loleta
According to the labor force statistics for Loleta, out of the total population over 16 years of age (465), 57.8% or 269 individuals are in the labor force, with 12.6% or 34 of them unemployed. The age group with the highest labor force participation rate is 20 to 24 years, with 100.0% or 22 individuals in the labor force. Within the labor force, the 16 to 19 years age range has the highest percentage of unemployed individuals, with 45.2% or 28 of them being unemployed.
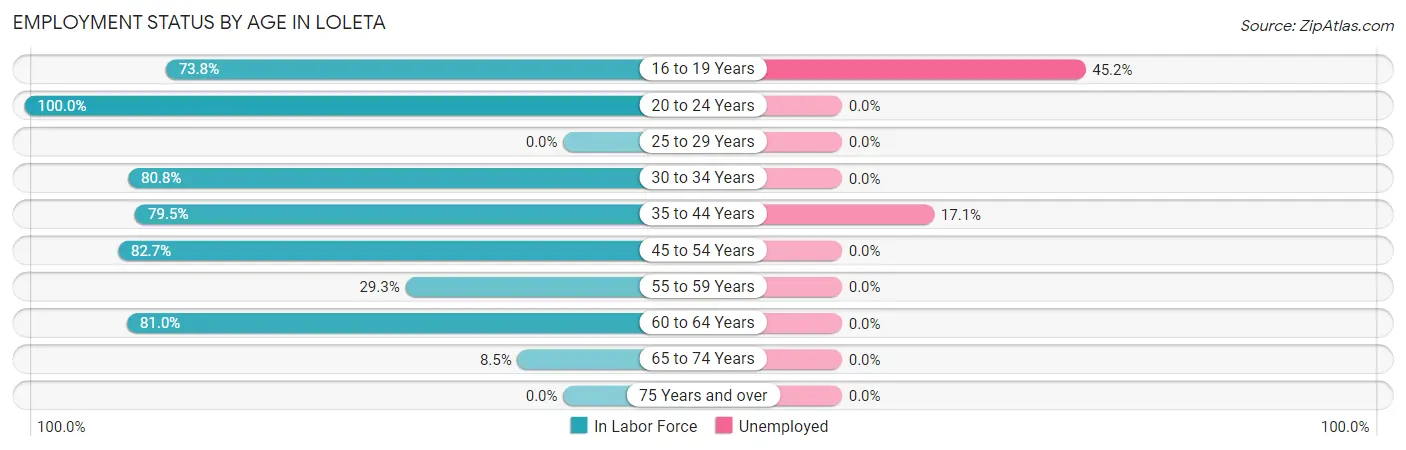
| Age Bracket | In Labor Force | Unemployed |
| 16 to 19 Years | 62 (73.8%) | 28 (45.2%) |
| 20 to 24 Years | 22 (100.0%) | 0 (0.0%) |
| 25 to 29 Years | 0 (0.0%) | 0 (0.0%) |
| 30 to 34 Years | 21 (80.8%) | 0 (0.0%) |
| 35 to 44 Years | 35 (79.5%) | 6 (17.1%) |
| 45 to 54 Years | 81 (82.7%) | 0 (0.0%) |
| 55 to 59 Years | 27 (29.3%) | 0 (0.0%) |
| 60 to 64 Years | 17 (81.0%) | 0 (0.0%) |
| 65 to 74 Years | 4 (8.5%) | 0 (0.0%) |
| 75 Years and over | 0 (0.0%) | 0 (0.0%) |
| Total | 269 (57.8%) | 34 (12.6%) |
Employment Status by Educational Attainment in Loleta
According to labor force statistics for Loleta, 62.4% of individuals (181) out of the total population between 25 and 64 years of age (290) are in the labor force, with 3.3% or 6 of them being unemployed. The group with the highest labor force participation rate are those with the educational attainment of high school diploma, with 87.8% or 101 individuals in the labor force. Within the labor force, individuals with high school diploma education have the highest percentage of unemployment, with 5.9% or 6 of them being unemployed.
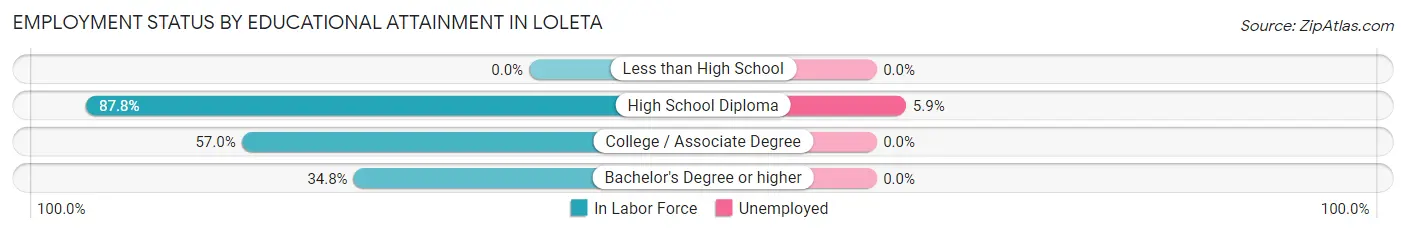
| Educational Attainment | In Labor Force | Unemployed |
| Less than High School | 0 (0.0%) | 0 (0.0%) |
| High School Diploma | 101 (87.8%) | 7 (5.9%) |
| College / Associate Degree | 49 (57.0%) | 0 (0.0%) |
| Bachelor's Degree or higher | 31 (34.8%) | 0 (0.0%) |
| Total | 181 (62.4%) | 10 (3.3%) |
Employment Occupations by Sex in Loleta
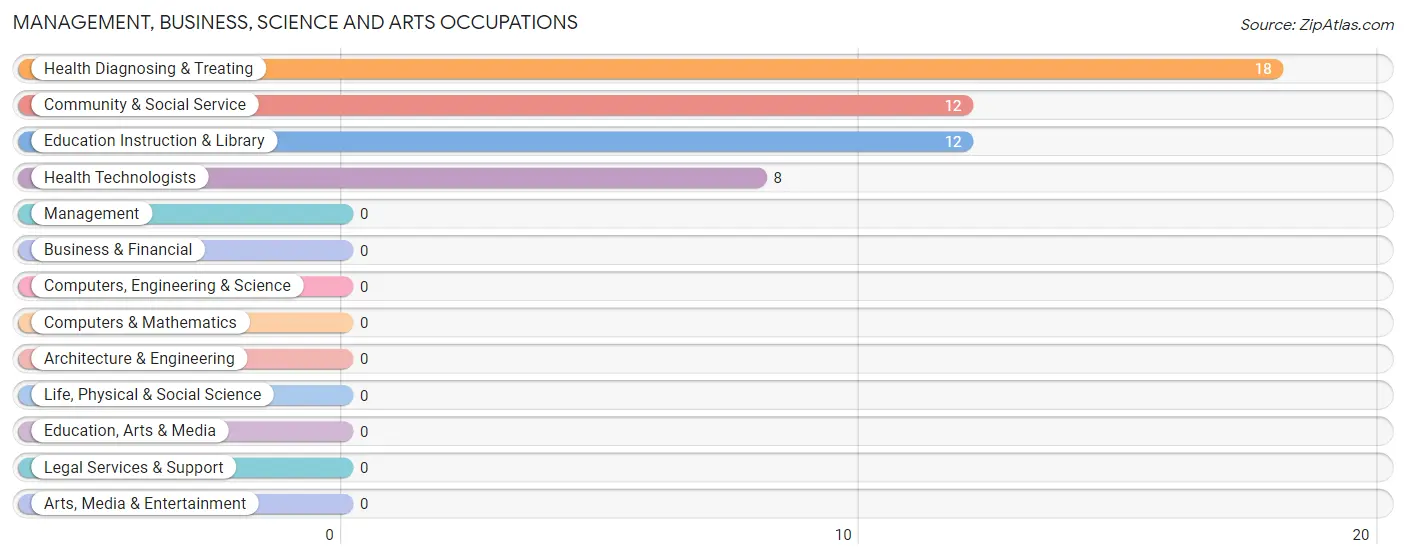
Management, Business, Science and Arts Occupations
The most common Management, Business, Science and Arts occupations in Loleta are Health Diagnosing & Treating (18 | 7.7%), Community & Social Service (12 | 5.1%), Education Instruction & Library (12 | 5.1%), and Health Technologists (8 | 3.4%).
Management, Business, Science and Arts Occupations by Sex
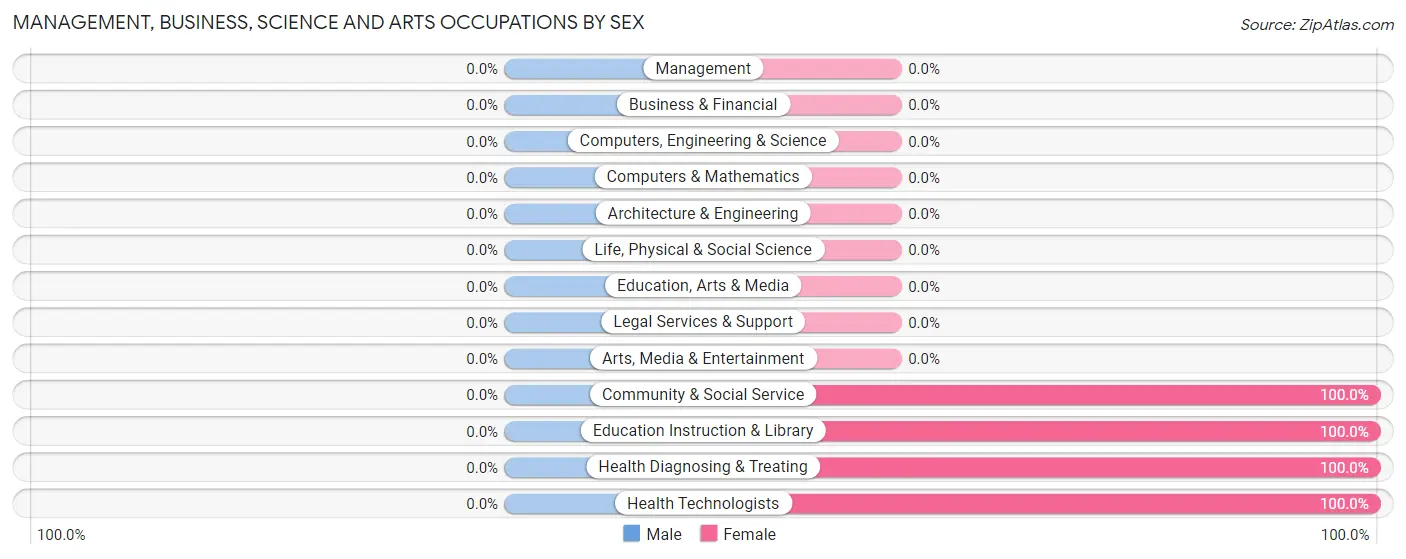
| Occupation | Male | Female |
| Management | 0 (0.0%) | 0 (0.0%) |
| Business & Financial | 0 (0.0%) | 0 (0.0%) |
| Computers, Engineering & Science | 0 (0.0%) | 0 (0.0%) |
| Computers & Mathematics | 0 (0.0%) | 0 (0.0%) |
| Architecture & Engineering | 0 (0.0%) | 0 (0.0%) |
| Life, Physical & Social Science | 0 (0.0%) | 0 (0.0%) |
| Community & Social Service | 0 (0.0%) | 12 (100.0%) |
| Education, Arts & Media | 0 (0.0%) | 0 (0.0%) |
| Legal Services & Support | 0 (0.0%) | 0 (0.0%) |
| Education Instruction & Library | 0 (0.0%) | 12 (100.0%) |
| Arts, Media & Entertainment | 0 (0.0%) | 0 (0.0%) |
| Health Diagnosing & Treating | 0 (0.0%) | 18 (100.0%) |
| Health Technologists | 0 (0.0%) | 8 (100.0%) |
| Total (Category) | 0 (0.0%) | 30 (100.0%) |
| Total (Overall) | 106 (45.1%) | 129 (54.9%) |
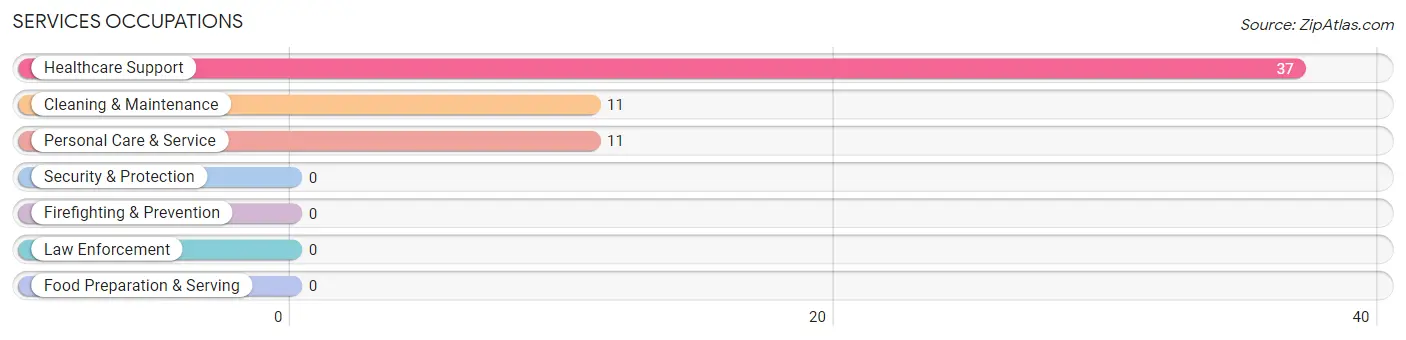
Services Occupations
The most common Services occupations in Loleta are Healthcare Support (37 | 15.7%), Cleaning & Maintenance (11 | 4.7%), and Personal Care & Service (11 | 4.7%).
Services Occupations by Sex
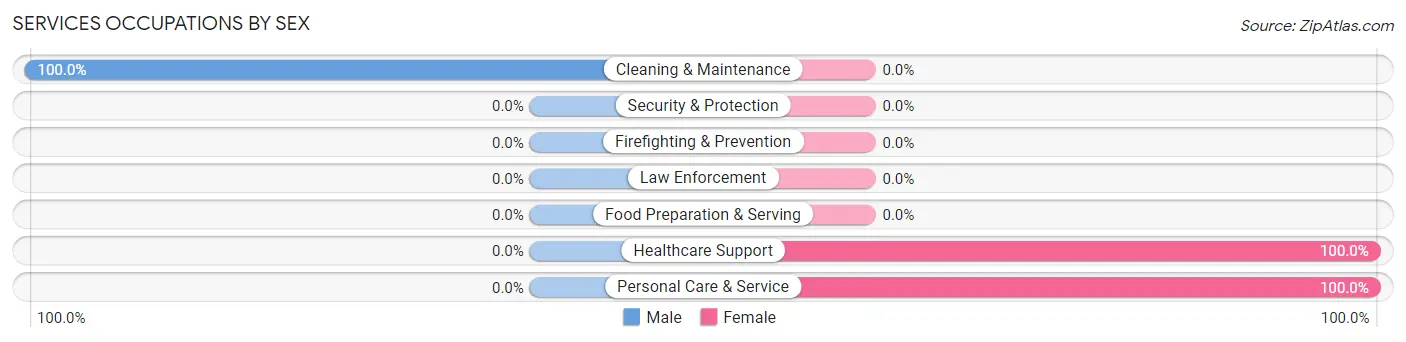
| Occupation | Male | Female |
| Healthcare Support | 0 (0.0%) | 37 (100.0%) |
| Security & Protection | 0 (0.0%) | 0 (0.0%) |
| Firefighting & Prevention | 0 (0.0%) | 0 (0.0%) |
| Law Enforcement | 0 (0.0%) | 0 (0.0%) |
| Food Preparation & Serving | 0 (0.0%) | 0 (0.0%) |
| Cleaning & Maintenance | 11 (100.0%) | 0 (0.0%) |
| Personal Care & Service | 0 (0.0%) | 11 (100.0%) |
| Total (Category) | 11 (18.6%) | 48 (81.4%) |
| Total (Overall) | 106 (45.1%) | 129 (54.9%) |
Sales and Office Occupations
The most common Sales and Office occupations in Loleta are Sales & Related (53 | 22.6%), and Office & Administration (29 | 12.3%).
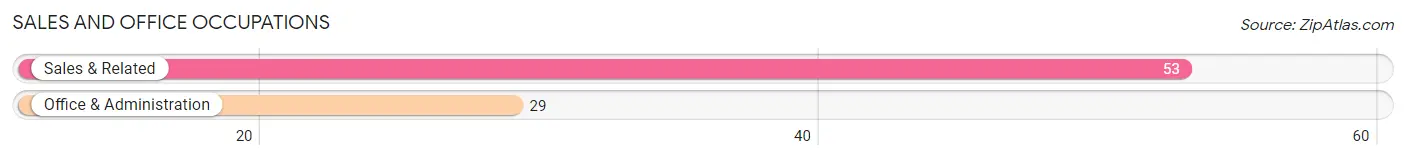
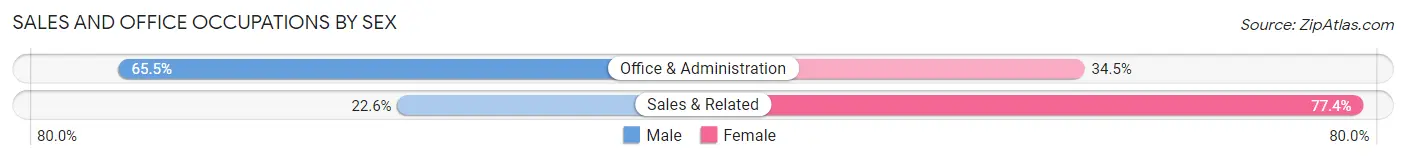
Sales and Office Occupations by Sex
| Occupation | Male | Female |
| Sales & Related | 12 (22.6%) | 41 (77.4%) |
| Office & Administration | 19 (65.5%) | 10 (34.5%) |
| Total (Category) | 31 (37.8%) | 51 (62.2%) |
| Total (Overall) | 106 (45.1%) | 129 (54.9%) |
Natural Resources, Construction and Maintenance Occupations
The most common Natural Resources, Construction and Maintenance occupations in Loleta are Construction & Extraction (36 | 15.3%), and Installation, Maintenance & Repair (8 | 3.4%).
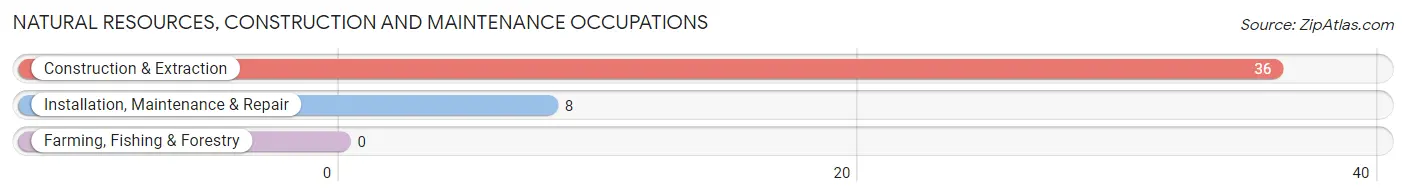
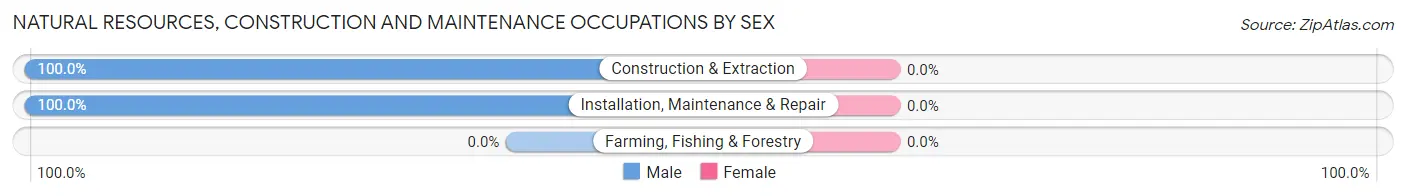
Natural Resources, Construction and Maintenance Occupations by Sex
| Occupation | Male | Female |
| Farming, Fishing & Forestry | 0 (0.0%) | 0 (0.0%) |
| Construction & Extraction | 36 (100.0%) | 0 (0.0%) |
| Installation, Maintenance & Repair | 8 (100.0%) | 0 (0.0%) |
| Total (Category) | 44 (100.0%) | 0 (0.0%) |
| Total (Overall) | 106 (45.1%) | 129 (54.9%) |
Production, Transportation and Moving Occupations
The most common Production, Transportation and Moving occupations in Loleta are Transportation (12 | 5.1%), and Material Moving (8 | 3.4%).
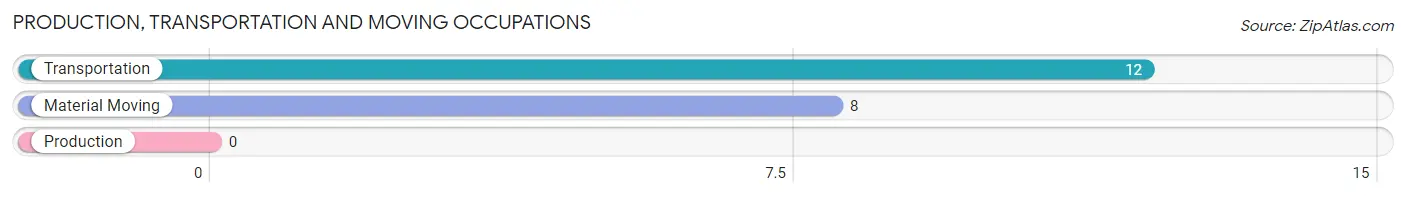
Production, Transportation and Moving Occupations by Sex
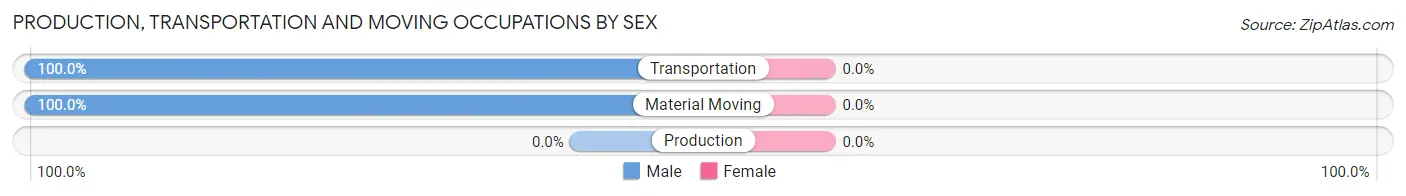
| Occupation | Male | Female |
| Production | 0 (0.0%) | 0 (0.0%) |
| Transportation | 12 (100.0%) | 0 (0.0%) |
| Material Moving | 8 (100.0%) | 0 (0.0%) |
| Total (Category) | 20 (100.0%) | 0 (0.0%) |
| Total (Overall) | 106 (45.1%) | 129 (54.9%) |
Employment Industries by Sex in Loleta
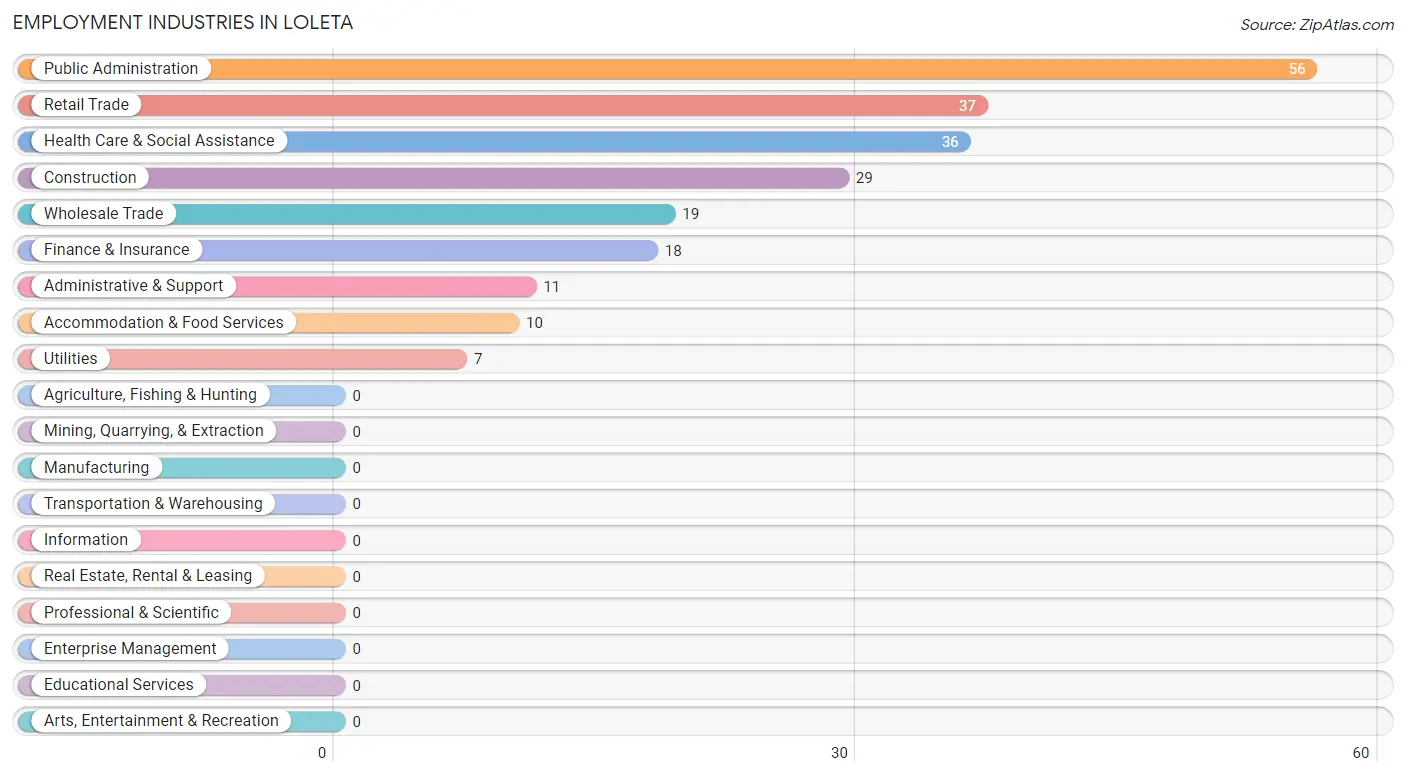
Employment Industries in Loleta
The major employment industries in Loleta include Public Administration (56 | 23.8%), Retail Trade (37 | 15.7%), Health Care & Social Assistance (36 | 15.3%), Construction (29 | 12.3%), and Wholesale Trade (19 | 8.1%).
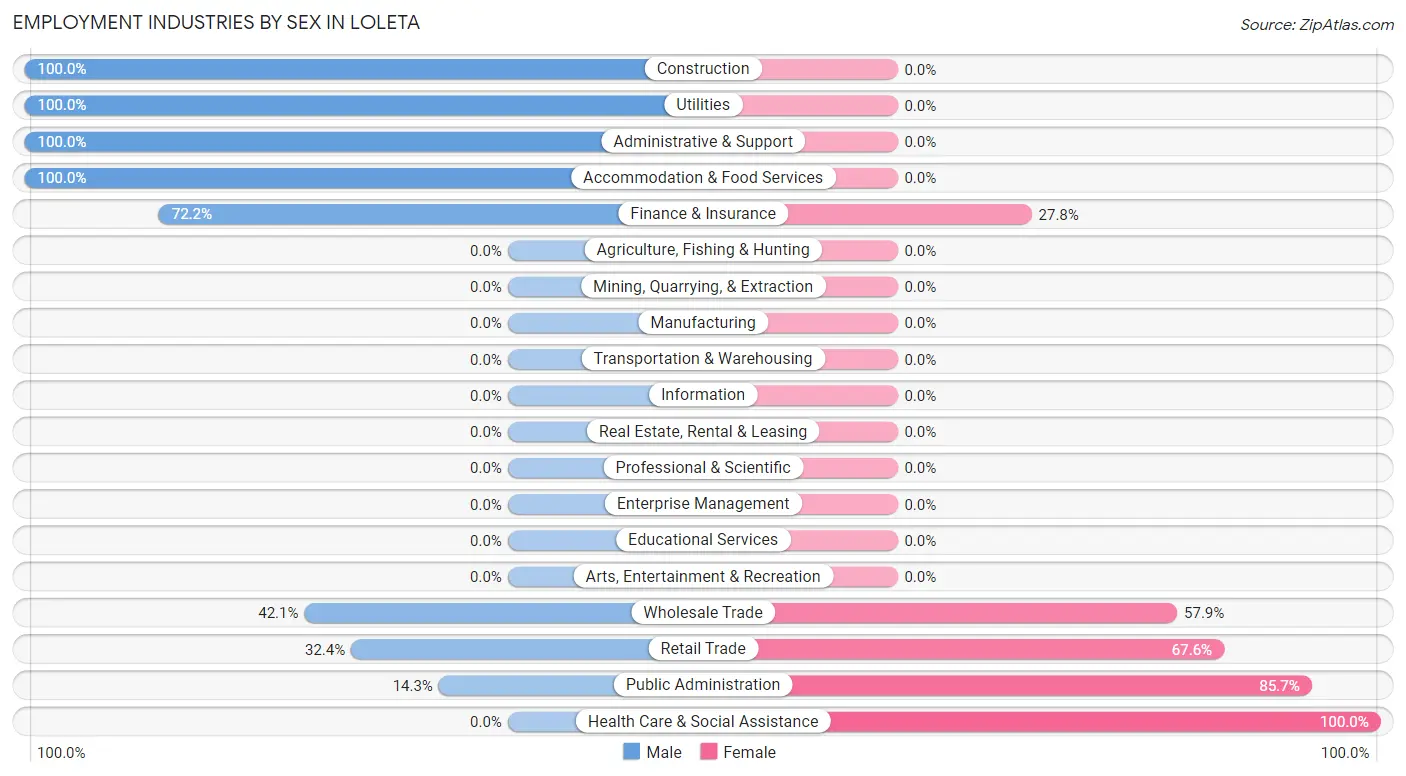
Employment Industries by Sex in Loleta
The Loleta industries that see more men than women are Construction (100.0%), Utilities (100.0%), and Administrative & Support (100.0%), whereas the industries that tend to have a higher number of women are Health Care & Social Assistance (100.0%), Public Administration (85.7%), and Retail Trade (67.6%).
| Industry | Male | Female |
| Agriculture, Fishing & Hunting | 0 (0.0%) | 0 (0.0%) |
| Mining, Quarrying, & Extraction | 0 (0.0%) | 0 (0.0%) |
| Construction | 29 (100.0%) | 0 (0.0%) |
| Manufacturing | 0 (0.0%) | 0 (0.0%) |
| Wholesale Trade | 8 (42.1%) | 11 (57.9%) |
| Retail Trade | 12 (32.4%) | 25 (67.6%) |
| Transportation & Warehousing | 0 (0.0%) | 0 (0.0%) |
| Utilities | 7 (100.0%) | 0 (0.0%) |
| Information | 0 (0.0%) | 0 (0.0%) |
| Finance & Insurance | 13 (72.2%) | 5 (27.8%) |
| Real Estate, Rental & Leasing | 0 (0.0%) | 0 (0.0%) |
| Professional & Scientific | 0 (0.0%) | 0 (0.0%) |
| Enterprise Management | 0 (0.0%) | 0 (0.0%) |
| Administrative & Support | 11 (100.0%) | 0 (0.0%) |
| Educational Services | 0 (0.0%) | 0 (0.0%) |
| Health Care & Social Assistance | 0 (0.0%) | 36 (100.0%) |
| Arts, Entertainment & Recreation | 0 (0.0%) | 0 (0.0%) |
| Accommodation & Food Services | 10 (100.0%) | 0 (0.0%) |
| Public Administration | 8 (14.3%) | 48 (85.7%) |
| Total | 106 (45.1%) | 129 (54.9%) |
Education in Loleta
School Enrollment in Loleta
The most common levels of schooling among the 116 students in Loleta are college / undergraduate (37 | 31.9%), high school (34 | 29.3%), and elementary school (24 | 20.7%).
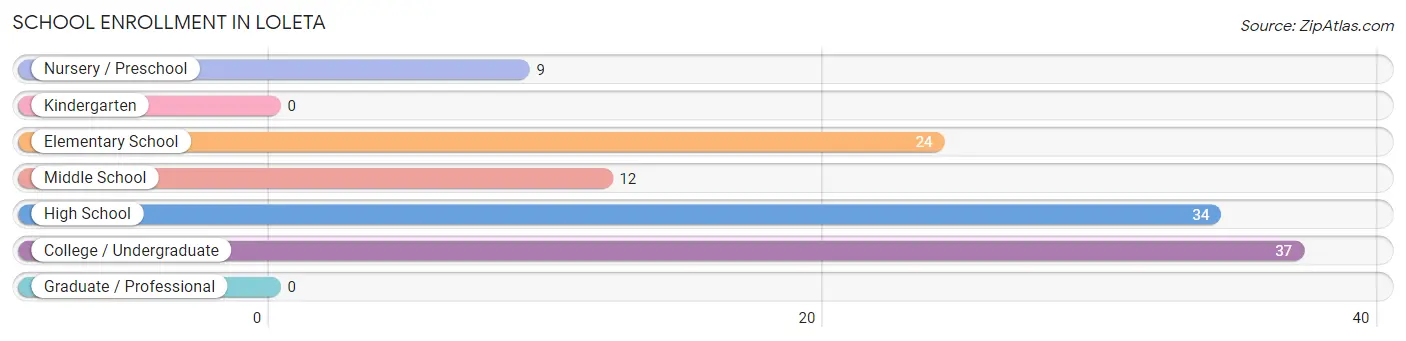
| School Level | # Students | % Students |
| Nursery / Preschool | 9 | 7.8% |
| Kindergarten | 0 | 0.0% |
| Elementary School | 24 | 20.7% |
| Middle School | 12 | 10.3% |
| High School | 34 | 29.3% |
| College / Undergraduate | 37 | 31.9% |
| Graduate / Professional | 0 | 0.0% |
| Total | 116 | 100.0% |
School Enrollment by Age by Funding Source in Loleta
Out of a total of 116 students who are enrolled in schools in Loleta, 9 (7.8%) attend a private institution, while the remaining 107 (92.2%) are enrolled in public schools. The age group of 5 to 9 year old has the highest likelihood of being enrolled in private schools, with 9 (50.0% in the age bracket) enrolled. Conversely, the age group of 10 to 14 year olds has the lowest likelihood of being enrolled in a private school, with 27 (100.0% in the age bracket) attending a public institution.
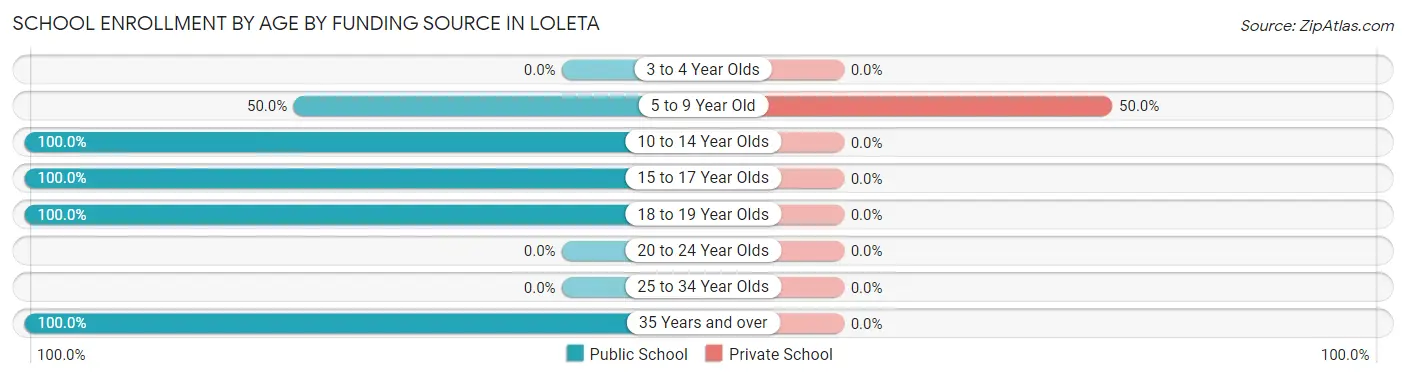
| Age Bracket | Public School | Private School |
| 3 to 4 Year Olds | 0 (0.0%) | 0 (0.0%) |
| 5 to 9 Year Old | 9 (50.0%) | 9 (50.0%) |
| 10 to 14 Year Olds | 27 (100.0%) | 0 (0.0%) |
| 15 to 17 Year Olds | 34 (100.0%) | 0 (0.0%) |
| 18 to 19 Year Olds | 4 (100.0%) | 0 (0.0%) |
| 20 to 24 Year Olds | 0 (0.0%) | 0 (0.0%) |
| 25 to 34 Year Olds | 0 (0.0%) | 0 (0.0%) |
| 35 Years and over | 33 (100.0%) | 0 (0.0%) |
| Total | 107 (92.2%) | 9 (7.8%) |
Educational Attainment by Field of Study in Loleta
Visual & performing arts (52 | 46.0%), business (14 | 12.4%), literature & languages (13 | 11.5%), bio, nature & agricultural (12 | 10.6%), and science & technology (6 | 5.3%) are the most common fields of study among 113 individuals in Loleta who have obtained a bachelor's degree or higher.
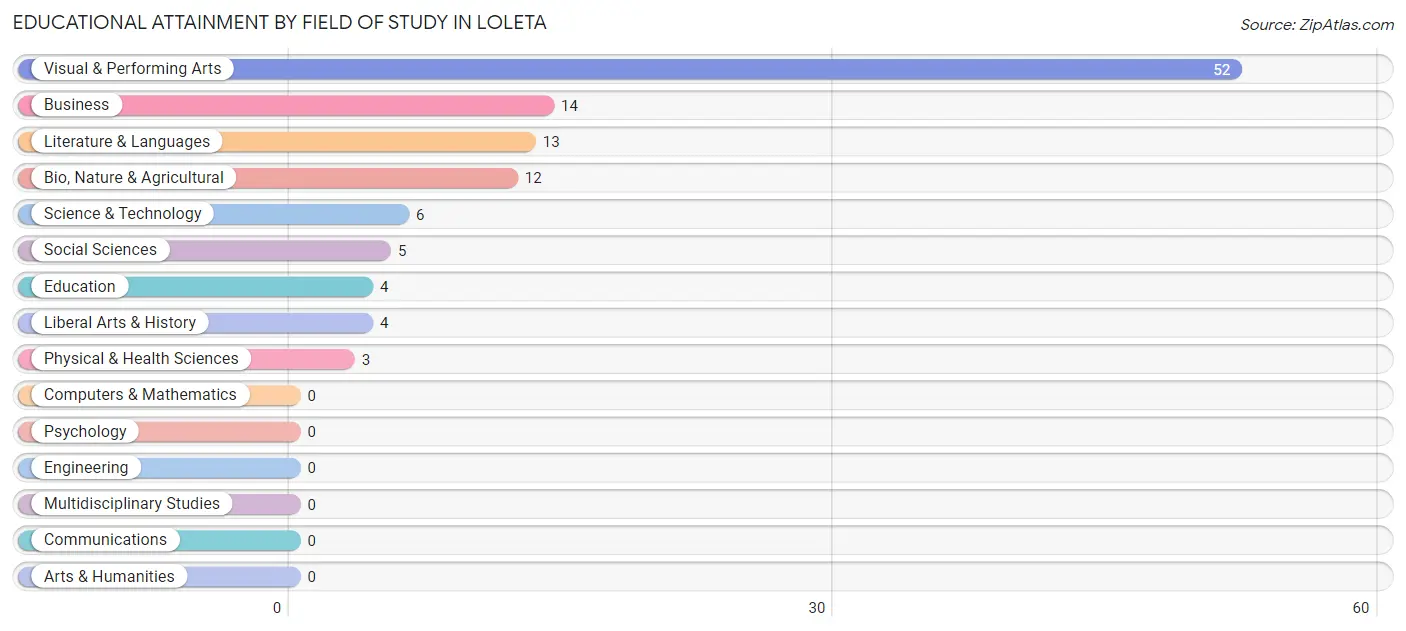
| Field of Study | # Graduates | % Graduates |
| Computers & Mathematics | 0 | 0.0% |
| Bio, Nature & Agricultural | 12 | 10.6% |
| Physical & Health Sciences | 3 | 2.6% |
| Psychology | 0 | 0.0% |
| Social Sciences | 5 | 4.4% |
| Engineering | 0 | 0.0% |
| Multidisciplinary Studies | 0 | 0.0% |
| Science & Technology | 6 | 5.3% |
| Business | 14 | 12.4% |
| Education | 4 | 3.5% |
| Literature & Languages | 13 | 11.5% |
| Liberal Arts & History | 4 | 3.5% |
| Visual & Performing Arts | 52 | 46.0% |
| Communications | 0 | 0.0% |
| Arts & Humanities | 0 | 0.0% |
| Total | 113 | 100.0% |
Transportation & Commute in Loleta
Vehicle Availability by Sex in Loleta
The most prevalent vehicle ownership categories in Loleta are males with 2 vehicles (42, accounting for 39.6%) and females with 2 vehicles (66, making up 32.6%).
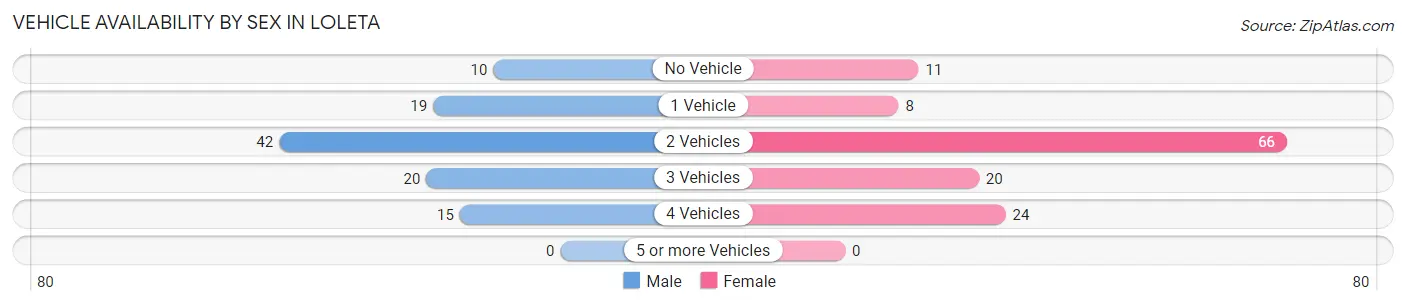
| Vehicles Available | Male | Female |
| No Vehicle | 10 (9.4%) | 11 (8.5%) |
| 1 Vehicle | 19 (17.9%) | 8 (6.2%) |
| 2 Vehicles | 42 (39.6%) | 66 (51.2%) |
| 3 Vehicles | 20 (18.9%) | 20 (15.5%) |
| 4 Vehicles | 15 (14.1%) | 24 (18.6%) |
| 5 or more Vehicles | 0 (0.0%) | 0 (0.0%) |
| Total | 106 (100.0%) | 129 (100.0%) |
Commute Time in Loleta
The most frequently occuring commute durations in Loleta are 20 to 24 minutes (75 commuters, 45.7%), 15 to 19 minutes (28 commuters, 17.1%), and 25 to 29 minutes (24 commuters, 14.6%).
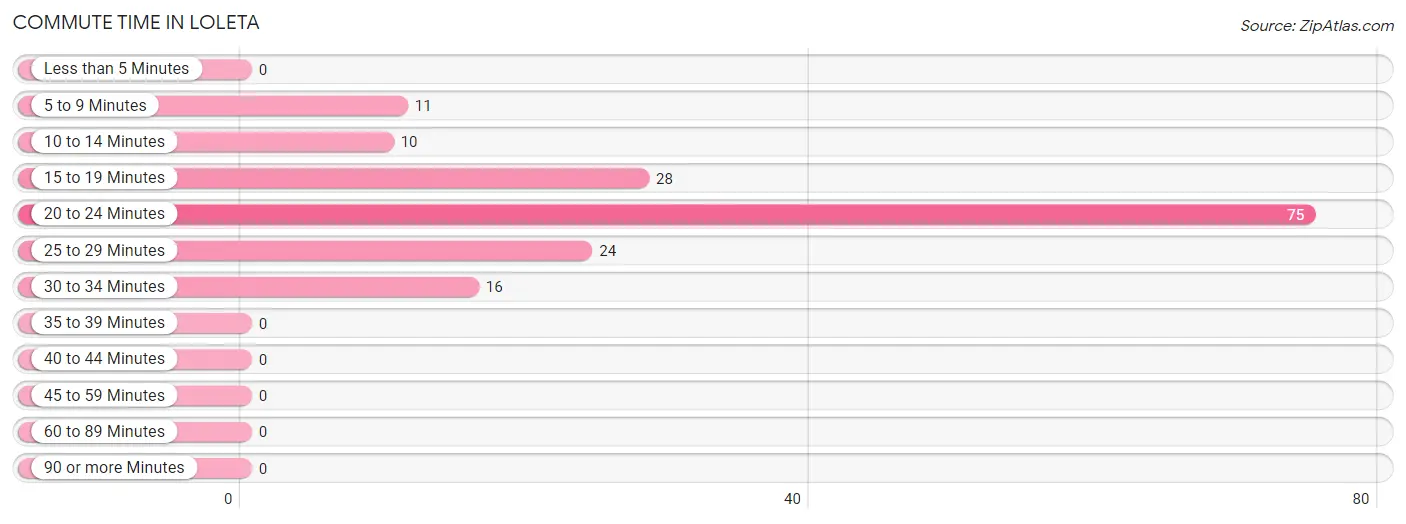
| Commute Time | # Commuters | % Commuters |
| Less than 5 Minutes | 0 | 0.0% |
| 5 to 9 Minutes | 11 | 6.7% |
| 10 to 14 Minutes | 10 | 6.1% |
| 15 to 19 Minutes | 28 | 17.1% |
| 20 to 24 Minutes | 75 | 45.7% |
| 25 to 29 Minutes | 24 | 14.6% |
| 30 to 34 Minutes | 16 | 9.8% |
| 35 to 39 Minutes | 0 | 0.0% |
| 40 to 44 Minutes | 0 | 0.0% |
| 45 to 59 Minutes | 0 | 0.0% |
| 60 to 89 Minutes | 0 | 0.0% |
| 90 or more Minutes | 0 | 0.0% |
Commute Time by Sex in Loleta
The most common commute times in Loleta are 20 to 24 minutes (28 commuters, 32.9%) for males and 20 to 24 minutes (47 commuters, 59.5%) for females.
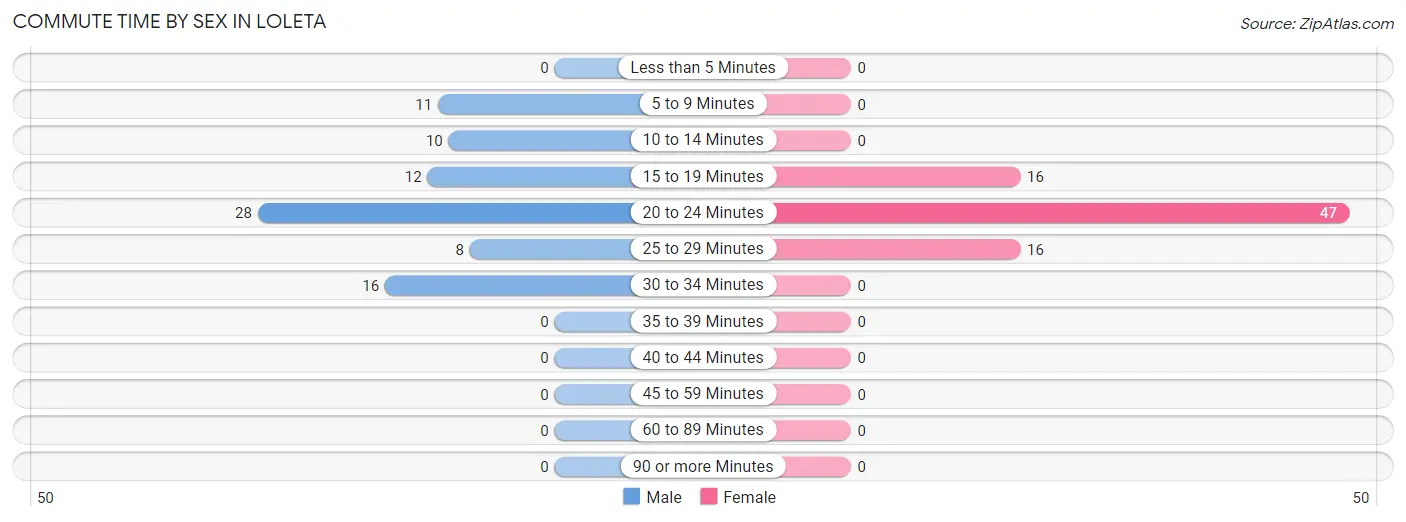
| Commute Time | Male | Female |
| Less than 5 Minutes | 0 (0.0%) | 0 (0.0%) |
| 5 to 9 Minutes | 11 (12.9%) | 0 (0.0%) |
| 10 to 14 Minutes | 10 (11.8%) | 0 (0.0%) |
| 15 to 19 Minutes | 12 (14.1%) | 16 (20.3%) |
| 20 to 24 Minutes | 28 (32.9%) | 47 (59.5%) |
| 25 to 29 Minutes | 8 (9.4%) | 16 (20.3%) |
| 30 to 34 Minutes | 16 (18.8%) | 0 (0.0%) |
| 35 to 39 Minutes | 0 (0.0%) | 0 (0.0%) |
| 40 to 44 Minutes | 0 (0.0%) | 0 (0.0%) |
| 45 to 59 Minutes | 0 (0.0%) | 0 (0.0%) |
| 60 to 89 Minutes | 0 (0.0%) | 0 (0.0%) |
| 90 or more Minutes | 0 (0.0%) | 0 (0.0%) |
Time of Departure to Work by Sex in Loleta
The most frequent times of departure to work in Loleta are 7:30 AM to 7:59 AM (45, 52.9%) for males and 7:30 AM to 7:59 AM (44, 55.7%) for females.
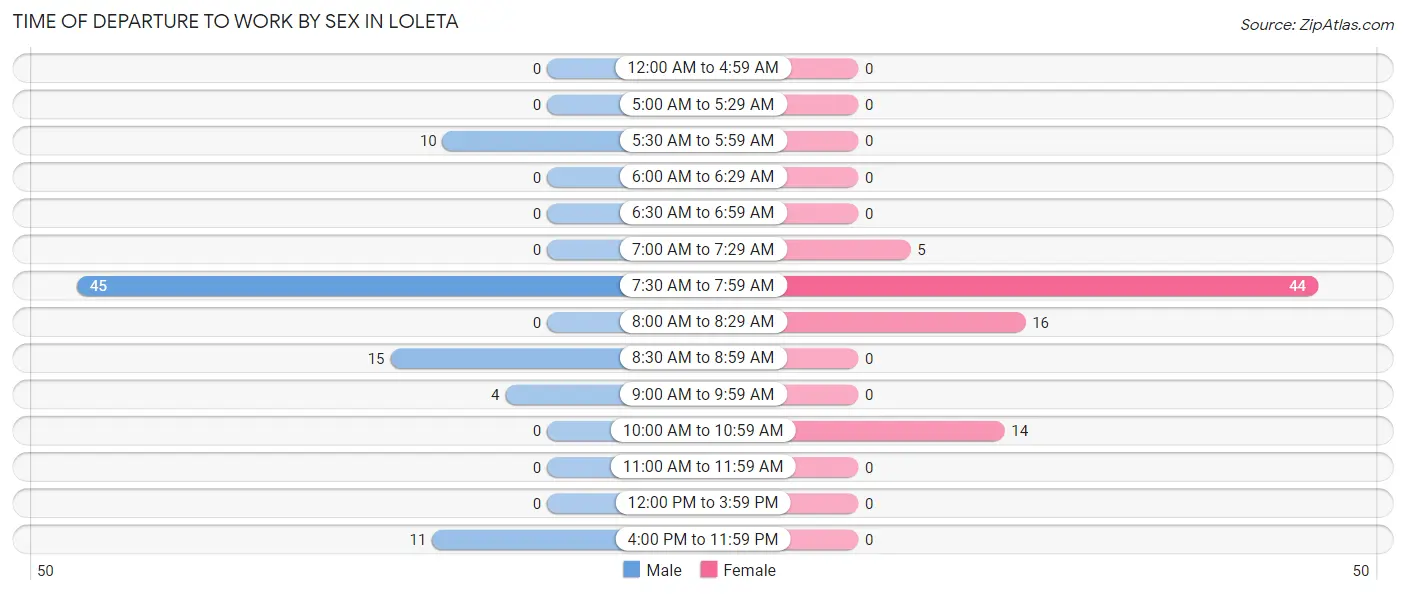
| Time of Departure | Male | Female |
| 12:00 AM to 4:59 AM | 0 (0.0%) | 0 (0.0%) |
| 5:00 AM to 5:29 AM | 0 (0.0%) | 0 (0.0%) |
| 5:30 AM to 5:59 AM | 10 (11.8%) | 0 (0.0%) |
| 6:00 AM to 6:29 AM | 0 (0.0%) | 0 (0.0%) |
| 6:30 AM to 6:59 AM | 0 (0.0%) | 0 (0.0%) |
| 7:00 AM to 7:29 AM | 0 (0.0%) | 5 (6.3%) |
| 7:30 AM to 7:59 AM | 45 (52.9%) | 44 (55.7%) |
| 8:00 AM to 8:29 AM | 0 (0.0%) | 16 (20.3%) |
| 8:30 AM to 8:59 AM | 15 (17.6%) | 0 (0.0%) |
| 9:00 AM to 9:59 AM | 4 (4.7%) | 0 (0.0%) |
| 10:00 AM to 10:59 AM | 0 (0.0%) | 14 (17.7%) |
| 11:00 AM to 11:59 AM | 0 (0.0%) | 0 (0.0%) |
| 12:00 PM to 3:59 PM | 0 (0.0%) | 0 (0.0%) |
| 4:00 PM to 11:59 PM | 11 (12.9%) | 0 (0.0%) |
| Total | 85 (100.0%) | 79 (100.0%) |
Housing Occupancy in Loleta
Occupancy by Ownership in Loleta
Of the total 236 dwellings in Loleta, owner-occupied units account for 120 (50.8%), while renter-occupied units make up 116 (49.1%).
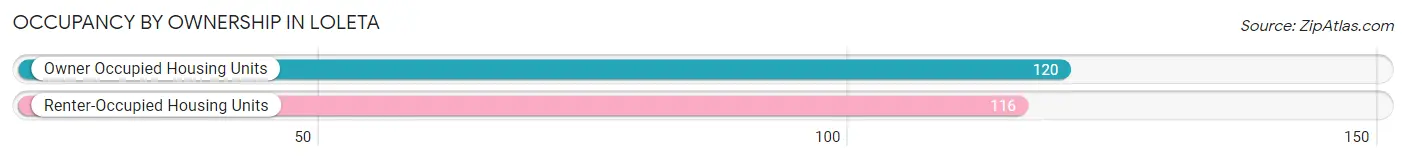
| Occupancy | # Housing Units | % Housing Units |
| Owner Occupied Housing Units | 120 | 50.8% |
| Renter-Occupied Housing Units | 116 | 49.1% |
| Total Occupied Housing Units | 236 | 100.0% |
Occupancy by Household Size in Loleta
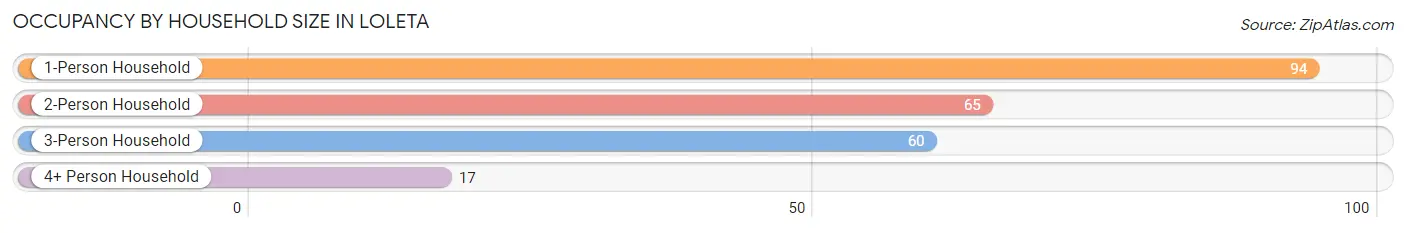
| Household Size | # Housing Units | % Housing Units |
| 1-Person Household | 94 | 39.8% |
| 2-Person Household | 65 | 27.5% |
| 3-Person Household | 60 | 25.4% |
| 4+ Person Household | 17 | 7.2% |
| Total Housing Units | 236 | 100.0% |
Occupancy by Ownership by Household Size in Loleta
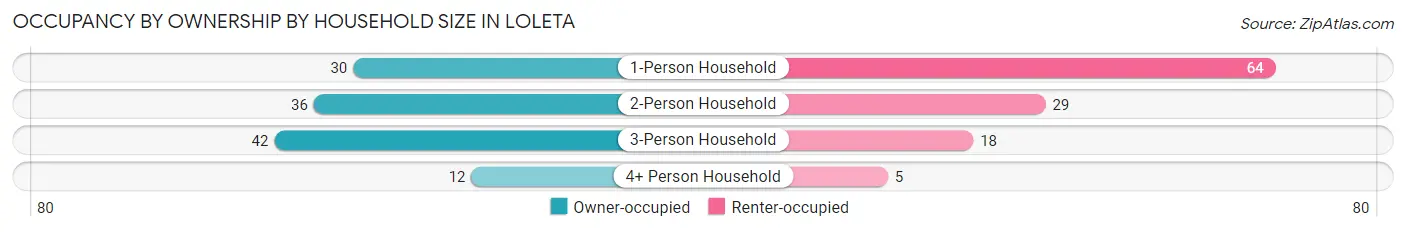
| Household Size | Owner-occupied | Renter-occupied |
| 1-Person Household | 30 (31.9%) | 64 (68.1%) |
| 2-Person Household | 36 (55.4%) | 29 (44.6%) |
| 3-Person Household | 42 (70.0%) | 18 (30.0%) |
| 4+ Person Household | 12 (70.6%) | 5 (29.4%) |
| Total Housing Units | 120 (50.8%) | 116 (49.1%) |
Occupancy by Educational Attainment in Loleta
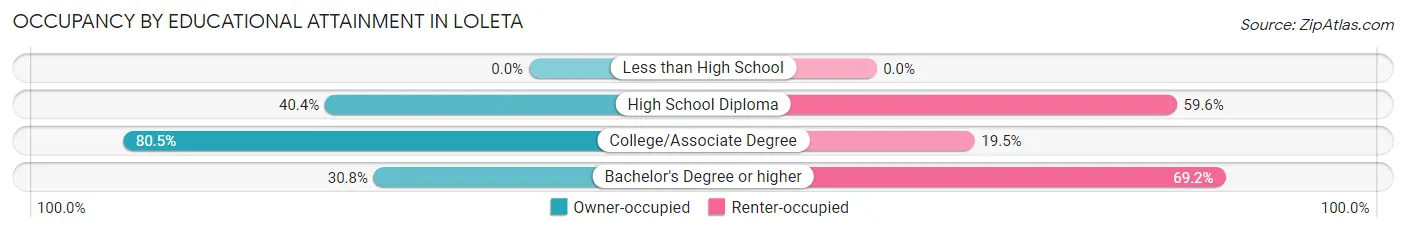
| Household Size | Owner-occupied | Renter-occupied |
| Less than High School | 0 (0.0%) | 0 (0.0%) |
| High School Diploma | 38 (40.4%) | 56 (59.6%) |
| College/Associate Degree | 62 (80.5%) | 15 (19.5%) |
| Bachelor's Degree or higher | 20 (30.8%) | 45 (69.2%) |
Occupancy by Age of Householder in Loleta
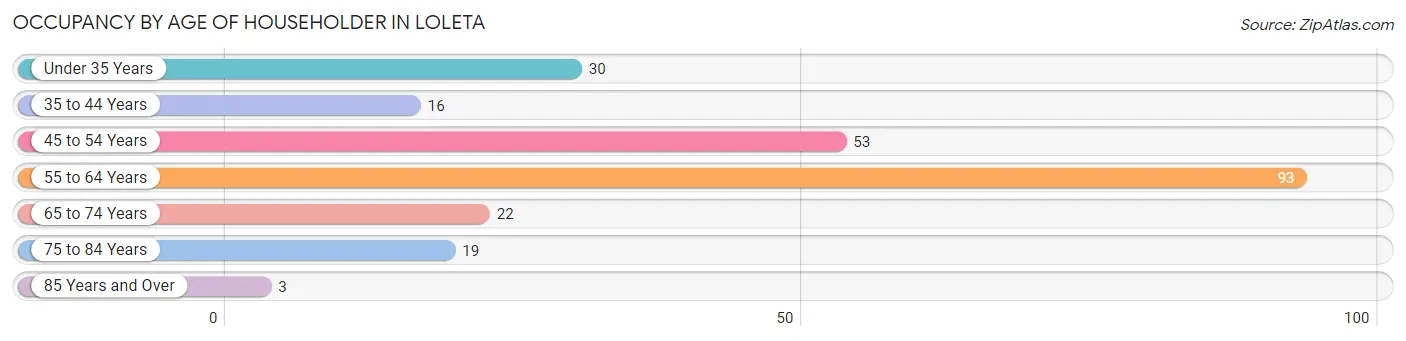
| Age Bracket | # Households | % Households |
| Under 35 Years | 30 | 12.7% |
| 35 to 44 Years | 16 | 6.8% |
| 45 to 54 Years | 53 | 22.5% |
| 55 to 64 Years | 93 | 39.4% |
| 65 to 74 Years | 22 | 9.3% |
| 75 to 84 Years | 19 | 8.1% |
| 85 Years and Over | 3 | 1.3% |
| Total | 236 | 100.0% |
Housing Finances in Loleta
Median Income by Occupancy in Loleta
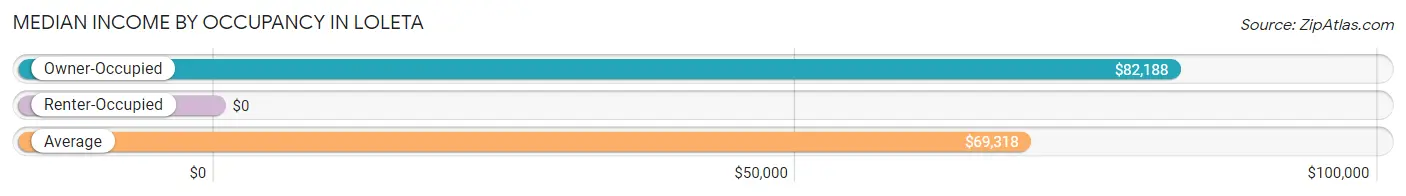
| Occupancy Type | # Households | Median Income |
| Owner-Occupied | 120 (50.8%) | $82,188 |
| Renter-Occupied | 116 (49.1%) | $0 |
| Average | 236 (100.0%) | $69,318 |
Occupancy by Householder Income Bracket in Loleta
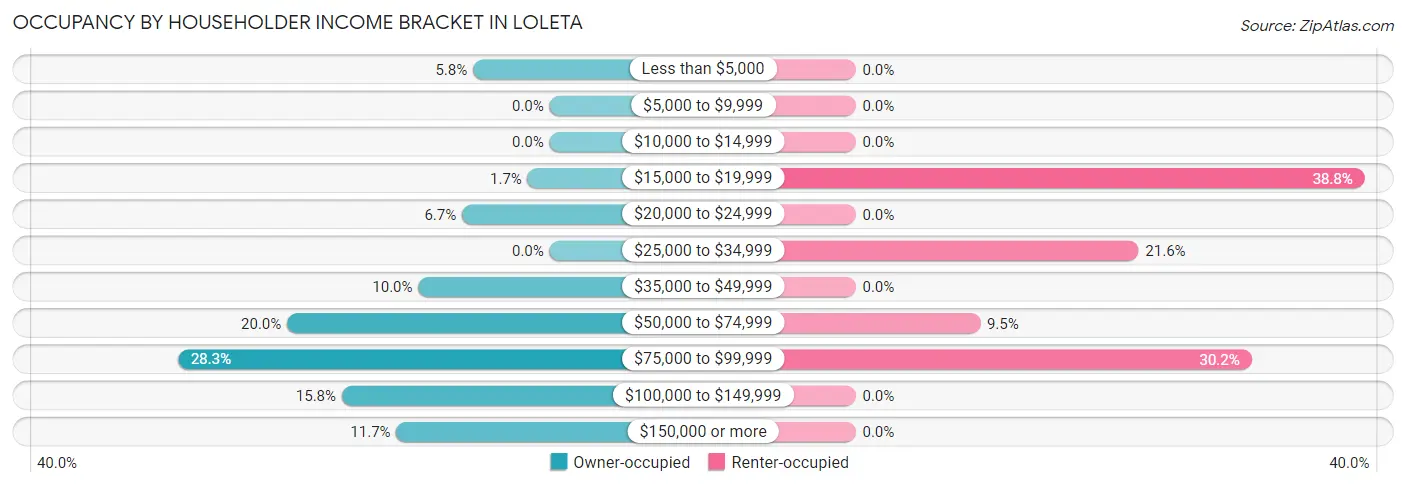
| Income Bracket | Owner-occupied | Renter-occupied |
| Less than $5,000 | 7 (5.8%) | 0 (0.0%) |
| $5,000 to $9,999 | 0 (0.0%) | 0 (0.0%) |
| $10,000 to $14,999 | 0 (0.0%) | 0 (0.0%) |
| $15,000 to $19,999 | 2 (1.7%) | 45 (38.8%) |
| $20,000 to $24,999 | 8 (6.7%) | 0 (0.0%) |
| $25,000 to $34,999 | 0 (0.0%) | 25 (21.5%) |
| $35,000 to $49,999 | 12 (10.0%) | 0 (0.0%) |
| $50,000 to $74,999 | 24 (20.0%) | 11 (9.5%) |
| $75,000 to $99,999 | 34 (28.3%) | 35 (30.2%) |
| $100,000 to $149,999 | 19 (15.8%) | 0 (0.0%) |
| $150,000 or more | 14 (11.7%) | 0 (0.0%) |
| Total | 120 (100.0%) | 116 (100.0%) |
Monthly Housing Cost Tiers in Loleta
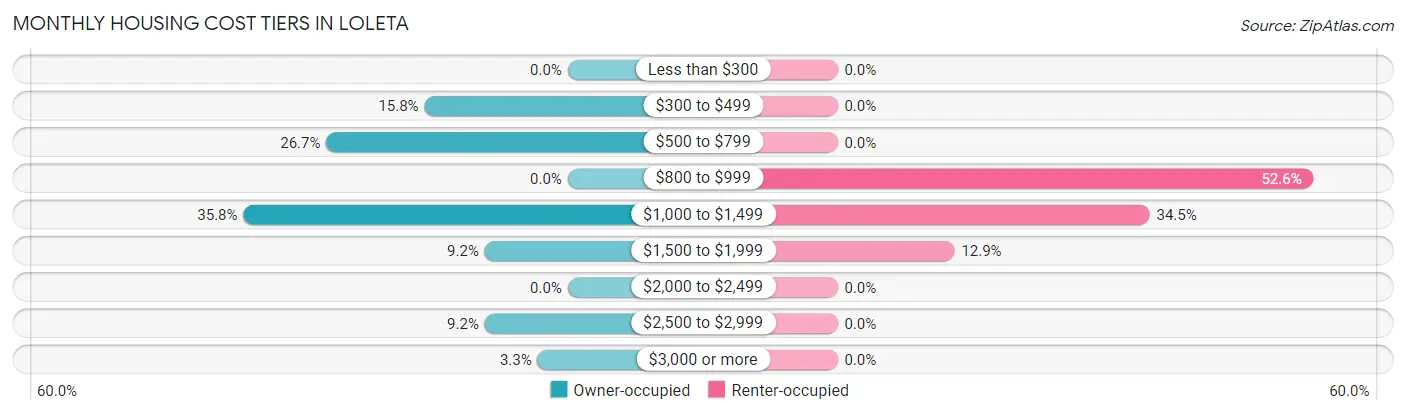
| Monthly Cost | Owner-occupied | Renter-occupied |
| Less than $300 | 0 (0.0%) | 0 (0.0%) |
| $300 to $499 | 19 (15.8%) | 0 (0.0%) |
| $500 to $799 | 32 (26.7%) | 0 (0.0%) |
| $800 to $999 | 0 (0.0%) | 61 (52.6%) |
| $1,000 to $1,499 | 43 (35.8%) | 40 (34.5%) |
| $1,500 to $1,999 | 11 (9.2%) | 15 (12.9%) |
| $2,000 to $2,499 | 0 (0.0%) | 0 (0.0%) |
| $2,500 to $2,999 | 11 (9.2%) | 0 (0.0%) |
| $3,000 or more | 4 (3.3%) | 0 (0.0%) |
| Total | 120 (100.0%) | 116 (100.0%) |
Physical Housing Characteristics in Loleta
Housing Structures in Loleta
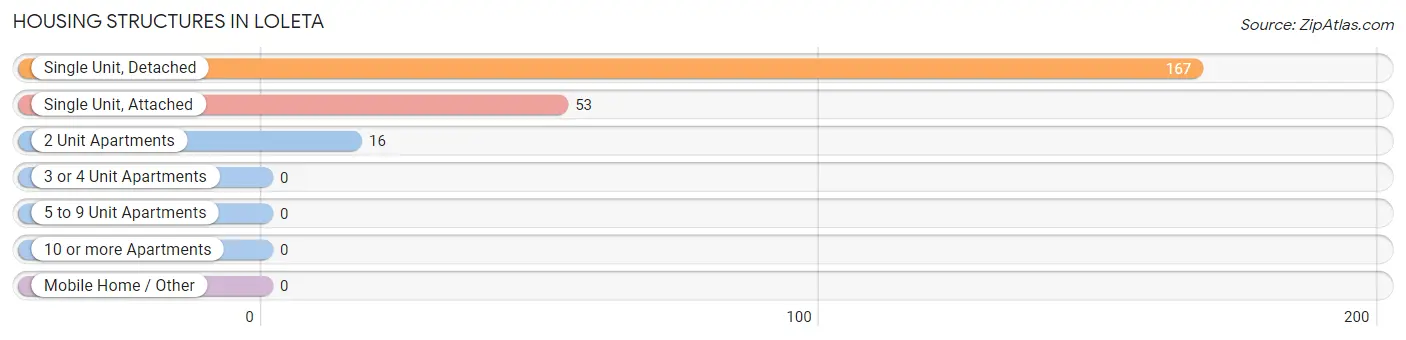
| Structure Type | # Housing Units | % Housing Units |
| Single Unit, Detached | 167 | 70.8% |
| Single Unit, Attached | 53 | 22.5% |
| 2 Unit Apartments | 16 | 6.8% |
| 3 or 4 Unit Apartments | 0 | 0.0% |
| 5 to 9 Unit Apartments | 0 | 0.0% |
| 10 or more Apartments | 0 | 0.0% |
| Mobile Home / Other | 0 | 0.0% |
| Total | 236 | 100.0% |
Housing Structures by Occupancy in Loleta
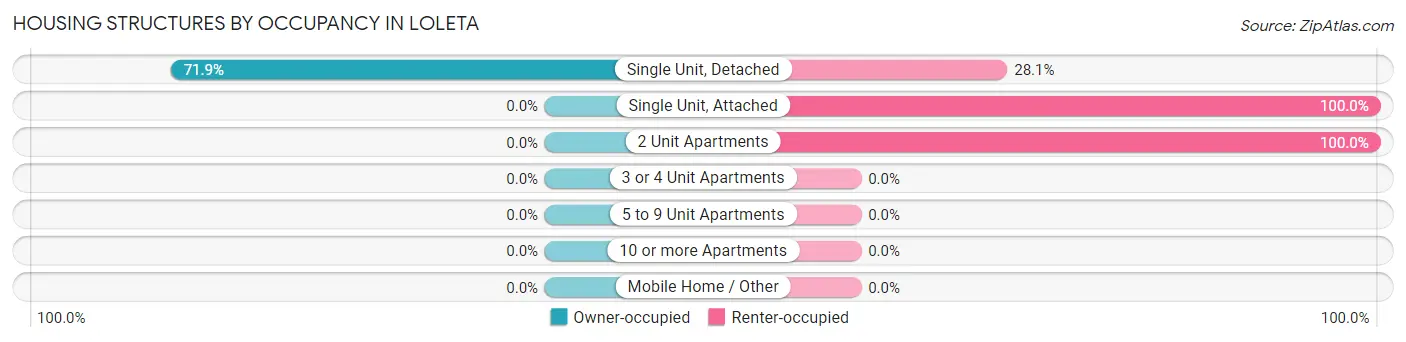
| Structure Type | Owner-occupied | Renter-occupied |
| Single Unit, Detached | 120 (71.9%) | 47 (28.1%) |
| Single Unit, Attached | 0 (0.0%) | 53 (100.0%) |
| 2 Unit Apartments | 0 (0.0%) | 16 (100.0%) |
| 3 or 4 Unit Apartments | 0 (0.0%) | 0 (0.0%) |
| 5 to 9 Unit Apartments | 0 (0.0%) | 0 (0.0%) |
| 10 or more Apartments | 0 (0.0%) | 0 (0.0%) |
| Mobile Home / Other | 0 (0.0%) | 0 (0.0%) |
| Total | 120 (50.8%) | 116 (49.1%) |
Housing Structures by Number of Rooms in Loleta
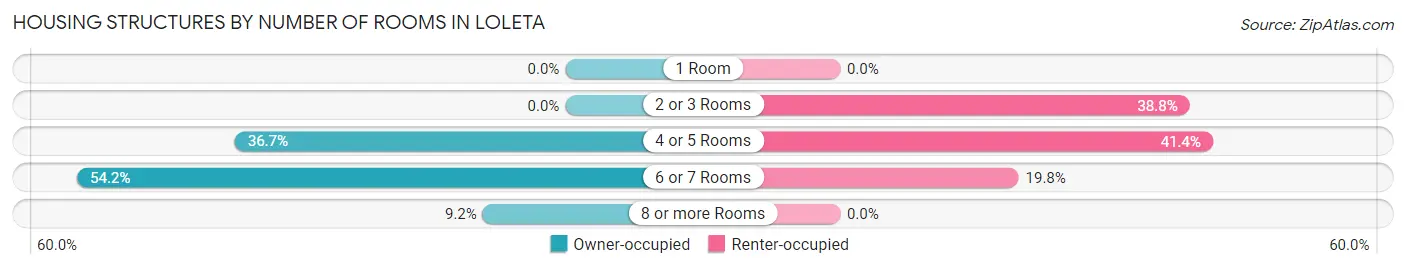
| Number of Rooms | Owner-occupied | Renter-occupied |
| 1 Room | 0 (0.0%) | 0 (0.0%) |
| 2 or 3 Rooms | 0 (0.0%) | 45 (38.8%) |
| 4 or 5 Rooms | 44 (36.7%) | 48 (41.4%) |
| 6 or 7 Rooms | 65 (54.2%) | 23 (19.8%) |
| 8 or more Rooms | 11 (9.2%) | 0 (0.0%) |
| Total | 120 (100.0%) | 116 (100.0%) |
Housing Structure by Heating Type in Loleta
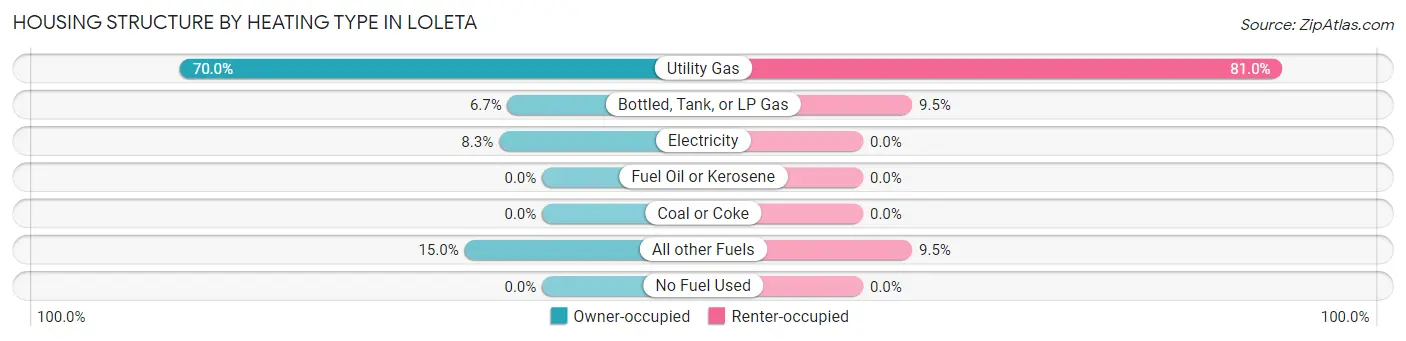
| Heating Type | Owner-occupied | Renter-occupied |
| Utility Gas | 84 (70.0%) | 94 (81.0%) |
| Bottled, Tank, or LP Gas | 8 (6.7%) | 11 (9.5%) |
| Electricity | 10 (8.3%) | 0 (0.0%) |
| Fuel Oil or Kerosene | 0 (0.0%) | 0 (0.0%) |
| Coal or Coke | 0 (0.0%) | 0 (0.0%) |
| All other Fuels | 18 (15.0%) | 11 (9.5%) |
| No Fuel Used | 0 (0.0%) | 0 (0.0%) |
| Total | 120 (100.0%) | 116 (100.0%) |
Household Vehicle Usage in Loleta
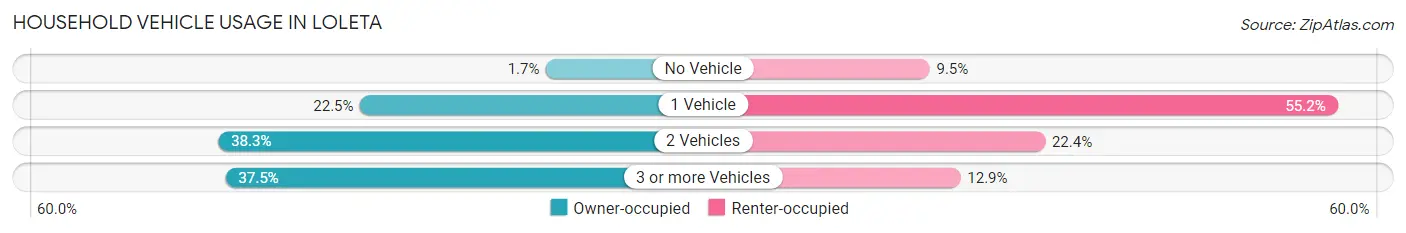
| Vehicles per Household | Owner-occupied | Renter-occupied |
| No Vehicle | 2 (1.7%) | 11 (9.5%) |
| 1 Vehicle | 27 (22.5%) | 64 (55.2%) |
| 2 Vehicles | 46 (38.3%) | 26 (22.4%) |
| 3 or more Vehicles | 45 (37.5%) | 15 (12.9%) |
| Total | 120 (100.0%) | 116 (100.0%) |
Real Estate & Mortgages in Loleta
Real Estate and Mortgage Overview in Loleta
| Characteristic | Without Mortgage | With Mortgage |
| Housing Units | 67 | 53 |
| Median Property Value | $348,300 | $440,900 |
| Median Household Income | $95,368 | $14 |
| Monthly Housing Costs | $631 | $4 |
| Real Estate Taxes | $2,173 | $0 |
Property Value by Mortgage Status in Loleta
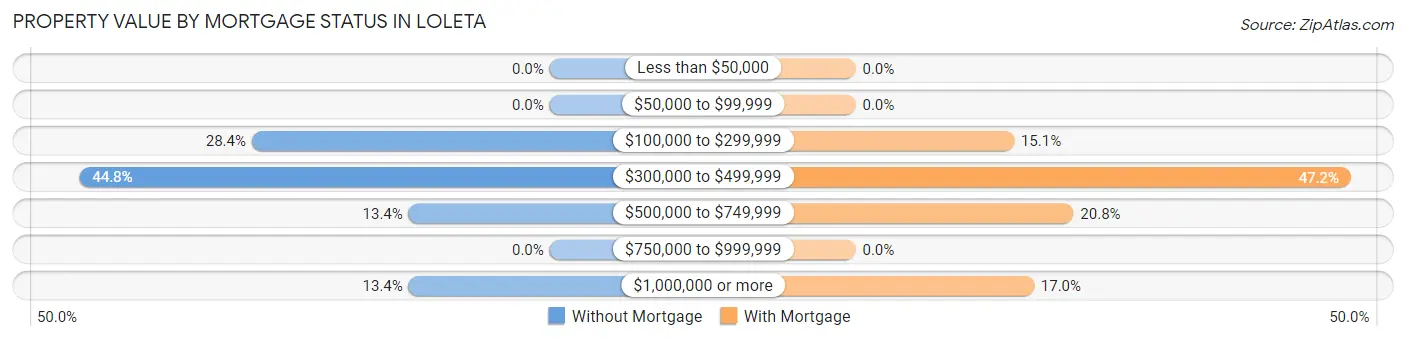
| Property Value | Without Mortgage | With Mortgage |
| Less than $50,000 | 0 (0.0%) | 0 (0.0%) |
| $50,000 to $99,999 | 0 (0.0%) | 0 (0.0%) |
| $100,000 to $299,999 | 19 (28.4%) | 8 (15.1%) |
| $300,000 to $499,999 | 30 (44.8%) | 25 (47.2%) |
| $500,000 to $749,999 | 9 (13.4%) | 11 (20.7%) |
| $750,000 to $999,999 | 0 (0.0%) | 0 (0.0%) |
| $1,000,000 or more | 9 (13.4%) | 9 (17.0%) |
| Total | 67 (100.0%) | 53 (100.0%) |
Household Income by Mortgage Status in Loleta
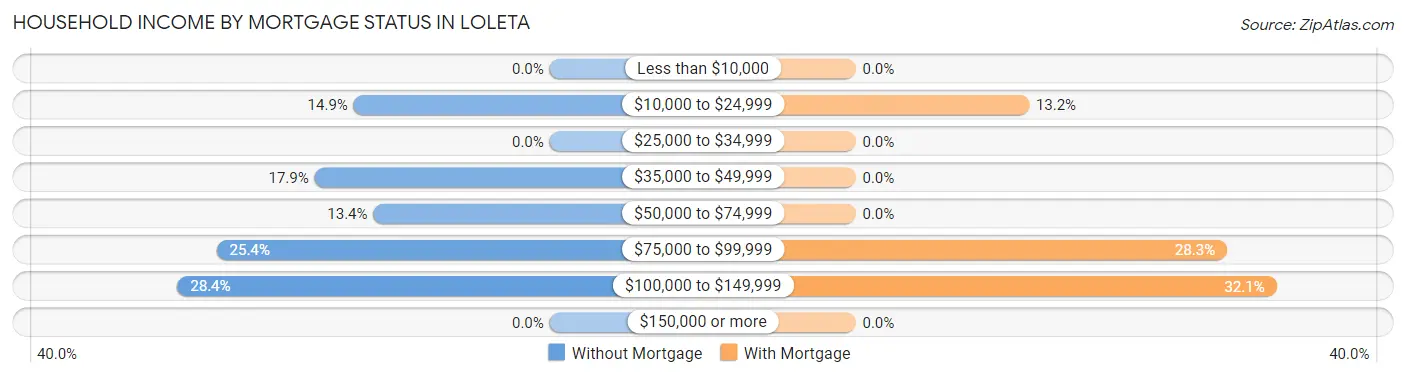
| Household Income | Without Mortgage | With Mortgage |
| Less than $10,000 | 0 (0.0%) | 0 (0.0%) |
| $10,000 to $24,999 | 10 (14.9%) | 7 (13.2%) |
| $25,000 to $34,999 | 0 (0.0%) | 0 (0.0%) |
| $35,000 to $49,999 | 12 (17.9%) | 0 (0.0%) |
| $50,000 to $74,999 | 9 (13.4%) | 0 (0.0%) |
| $75,000 to $99,999 | 17 (25.4%) | 15 (28.3%) |
| $100,000 to $149,999 | 19 (28.4%) | 17 (32.1%) |
| $150,000 or more | 0 (0.0%) | 0 (0.0%) |
| Total | 67 (100.0%) | 53 (100.0%) |
Property Value to Household Income Ratio in Loleta
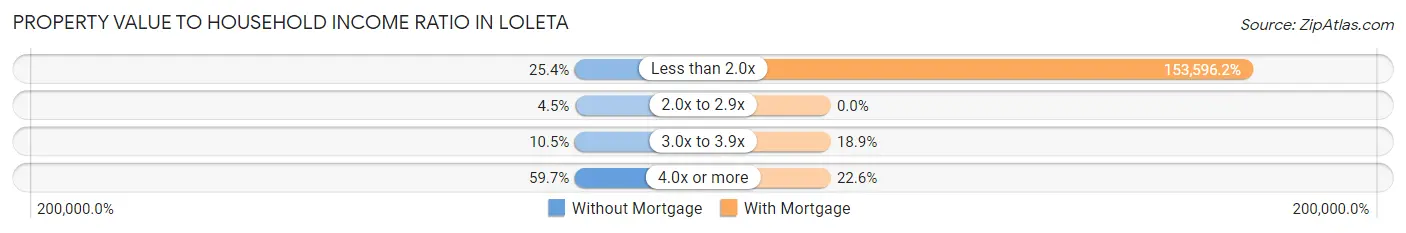
| Value-to-Income Ratio | Without Mortgage | With Mortgage |
| Less than 2.0x | 17 (25.4%) | 81,406 (153,596.2%) |
| 2.0x to 2.9x | 3 (4.5%) | 0 (0.0%) |
| 3.0x to 3.9x | 7 (10.4%) | 10 (18.9%) |
| 4.0x or more | 40 (59.7%) | 12 (22.6%) |
| Total | 67 (100.0%) | 53 (100.0%) |
Real Estate Taxes by Mortgage Status in Loleta
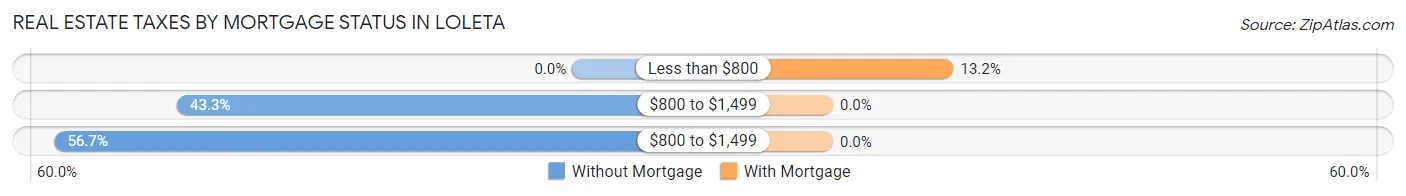
| Property Taxes | Without Mortgage | With Mortgage |
| Less than $800 | 0 (0.0%) | 7 (13.2%) |
| $800 to $1,499 | 29 (43.3%) | 0 (0.0%) |
| $800 to $1,499 | 38 (56.7%) | 0 (0.0%) |
| Total | 67 (100.0%) | 53 (100.0%) |
Health & Disability in Loleta
Health Insurance Coverage by Age in Loleta
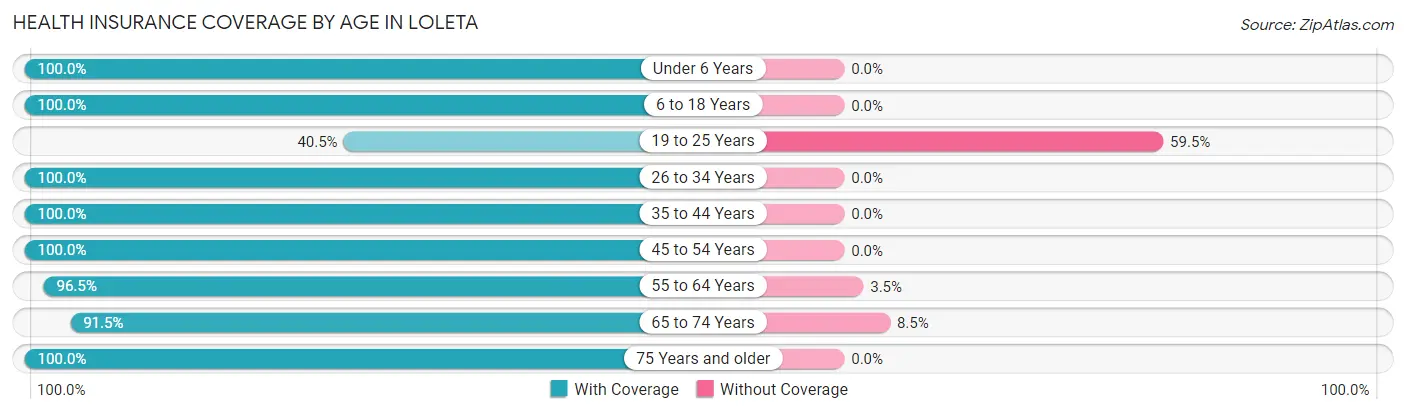
| Age Bracket | With Coverage | Without Coverage |
| Under 6 Years | 15 (100.0%) | 0 (0.0%) |
| 6 to 18 Years | 84 (100.0%) | 0 (0.0%) |
| 19 to 25 Years | 30 (40.5%) | 44 (59.5%) |
| 26 to 34 Years | 35 (100.0%) | 0 (0.0%) |
| 35 to 44 Years | 44 (100.0%) | 0 (0.0%) |
| 45 to 54 Years | 98 (100.0%) | 0 (0.0%) |
| 55 to 64 Years | 109 (96.5%) | 4 (3.5%) |
| 65 to 74 Years | 43 (91.5%) | 4 (8.5%) |
| 75 Years and older | 22 (100.0%) | 0 (0.0%) |
| Total | 480 (90.2%) | 52 (9.8%) |
Health Insurance Coverage by Citizenship Status in Loleta
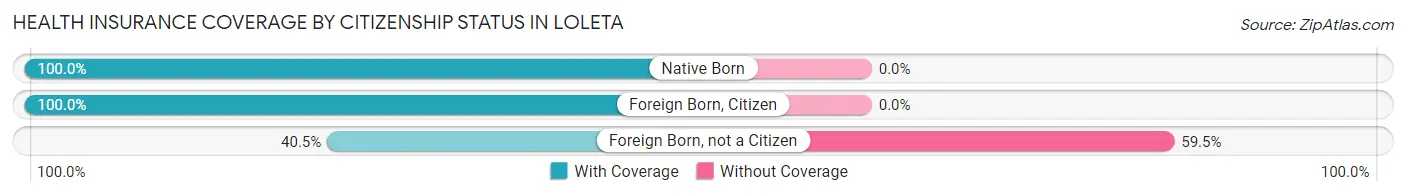
| Citizenship Status | With Coverage | Without Coverage |
| Native Born | 15 (100.0%) | 0 (0.0%) |
| Foreign Born, Citizen | 84 (100.0%) | 0 (0.0%) |
| Foreign Born, not a Citizen | 30 (40.5%) | 44 (59.5%) |
Health Insurance Coverage by Household Income in Loleta
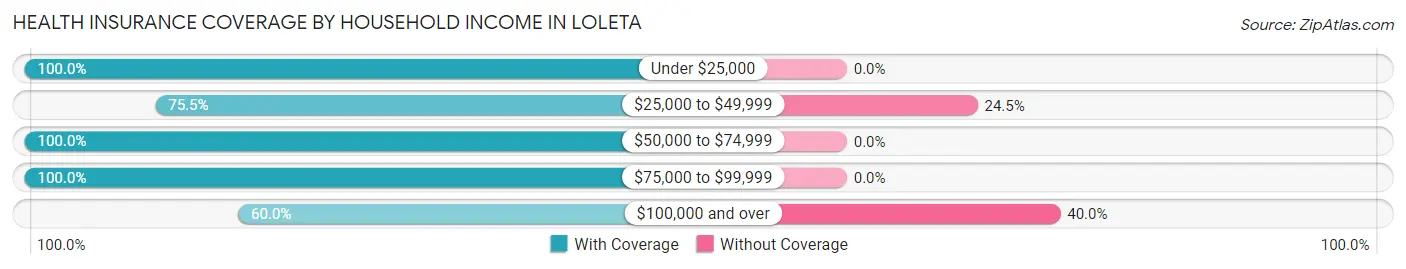
| Household Income | With Coverage | Without Coverage |
| Under $25,000 | 71 (100.0%) | 0 (0.0%) |
| $25,000 to $49,999 | 37 (75.5%) | 12 (24.5%) |
| $50,000 to $74,999 | 137 (100.0%) | 0 (0.0%) |
| $75,000 to $99,999 | 175 (100.0%) | 0 (0.0%) |
| $100,000 and over | 60 (60.0%) | 40 (40.0%) |
Public vs Private Health Insurance Coverage by Age in Loleta
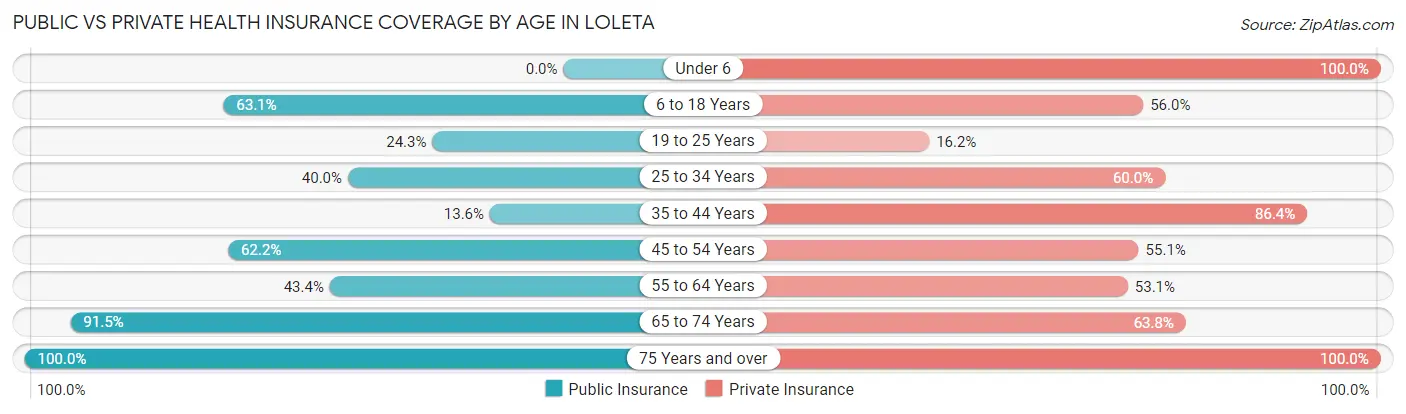
| Age Bracket | Public Insurance | Private Insurance |
| Under 6 | 0 (0.0%) | 15 (100.0%) |
| 6 to 18 Years | 53 (63.1%) | 47 (55.9%) |
| 19 to 25 Years | 18 (24.3%) | 12 (16.2%) |
| 25 to 34 Years | 14 (40.0%) | 21 (60.0%) |
| 35 to 44 Years | 6 (13.6%) | 38 (86.4%) |
| 45 to 54 Years | 61 (62.2%) | 54 (55.1%) |
| 55 to 64 Years | 49 (43.4%) | 60 (53.1%) |
| 65 to 74 Years | 43 (91.5%) | 30 (63.8%) |
| 75 Years and over | 22 (100.0%) | 22 (100.0%) |
| Total | 266 (50.0%) | 299 (56.2%) |
Disability Status by Sex by Age in Loleta
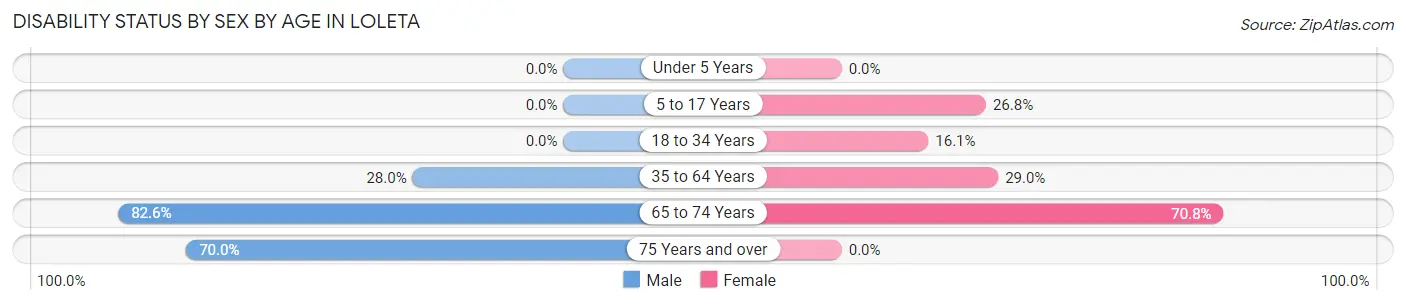
| Age Bracket | Male | Female |
| Under 5 Years | 0 (0.0%) | 0 (0.0%) |
| 5 to 17 Years | 0 (0.0%) | 19 (26.8%) |
| 18 to 34 Years | 0 (0.0%) | 9 (16.1%) |
| 35 to 64 Years | 28 (28.0%) | 45 (29.0%) |
| 65 to 74 Years | 19 (82.6%) | 17 (70.8%) |
| 75 Years and over | 7 (70.0%) | 0 (0.0%) |
Disability Class by Sex by Age in Loleta
Disability Class: Hearing Difficulty
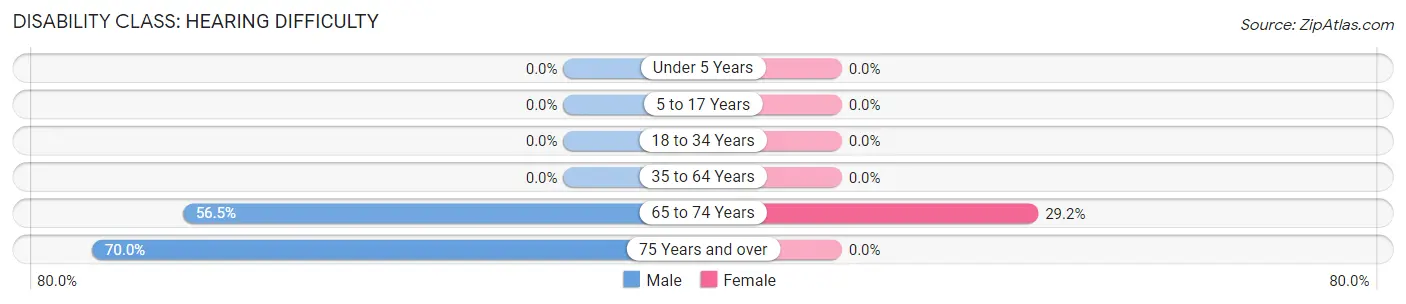
| Age Bracket | Male | Female |
| Under 5 Years | 0 (0.0%) | 0 (0.0%) |
| 5 to 17 Years | 0 (0.0%) | 0 (0.0%) |
| 18 to 34 Years | 0 (0.0%) | 0 (0.0%) |
| 35 to 64 Years | 0 (0.0%) | 0 (0.0%) |
| 65 to 74 Years | 13 (56.5%) | 7 (29.2%) |
| 75 Years and over | 7 (70.0%) | 0 (0.0%) |
Disability Class: Vision Difficulty
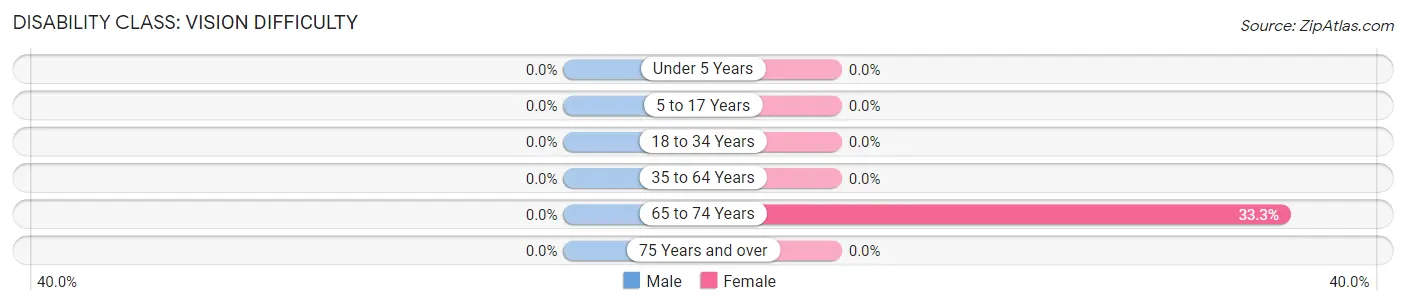
| Age Bracket | Male | Female |
| Under 5 Years | 0 (0.0%) | 0 (0.0%) |
| 5 to 17 Years | 0 (0.0%) | 0 (0.0%) |
| 18 to 34 Years | 0 (0.0%) | 0 (0.0%) |
| 35 to 64 Years | 0 (0.0%) | 0 (0.0%) |
| 65 to 74 Years | 0 (0.0%) | 8 (33.3%) |
| 75 Years and over | 0 (0.0%) | 0 (0.0%) |
Disability Class: Cognitive Difficulty
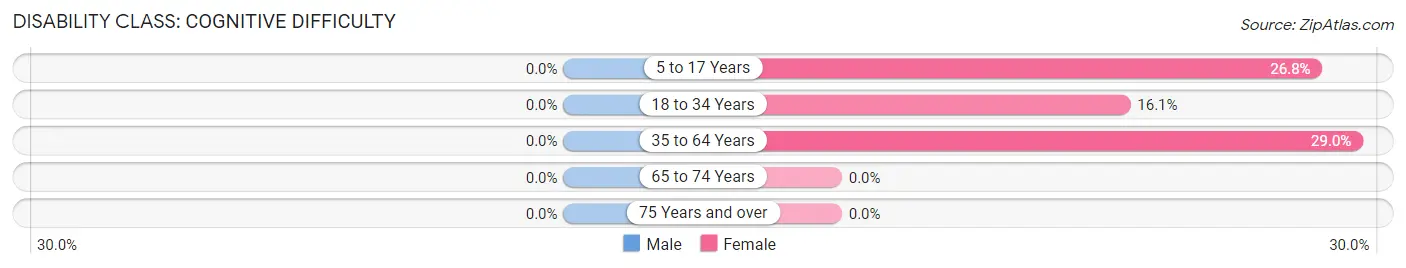
| Age Bracket | Male | Female |
| 5 to 17 Years | 0 (0.0%) | 19 (26.8%) |
| 18 to 34 Years | 0 (0.0%) | 9 (16.1%) |
| 35 to 64 Years | 0 (0.0%) | 45 (29.0%) |
| 65 to 74 Years | 0 (0.0%) | 0 (0.0%) |
| 75 Years and over | 0 (0.0%) | 0 (0.0%) |
Disability Class: Ambulatory Difficulty
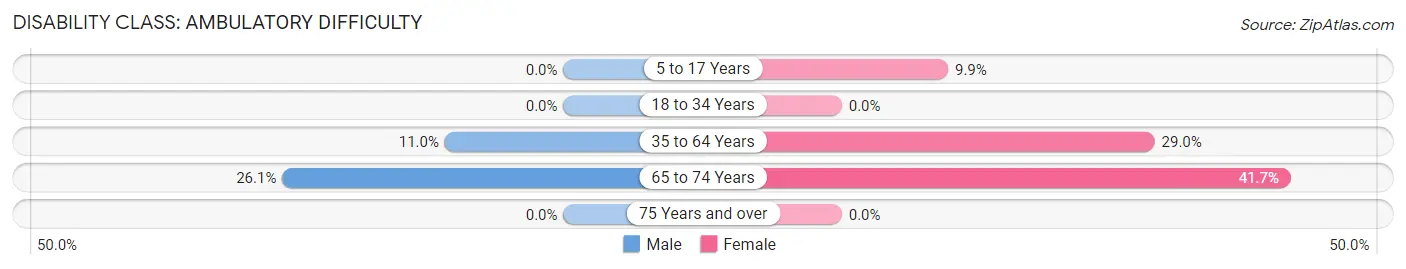
| Age Bracket | Male | Female |
| 5 to 17 Years | 0 (0.0%) | 7 (9.9%) |
| 18 to 34 Years | 0 (0.0%) | 0 (0.0%) |
| 35 to 64 Years | 11 (11.0%) | 45 (29.0%) |
| 65 to 74 Years | 6 (26.1%) | 10 (41.7%) |
| 75 Years and over | 0 (0.0%) | 0 (0.0%) |
Disability Class: Self-Care Difficulty
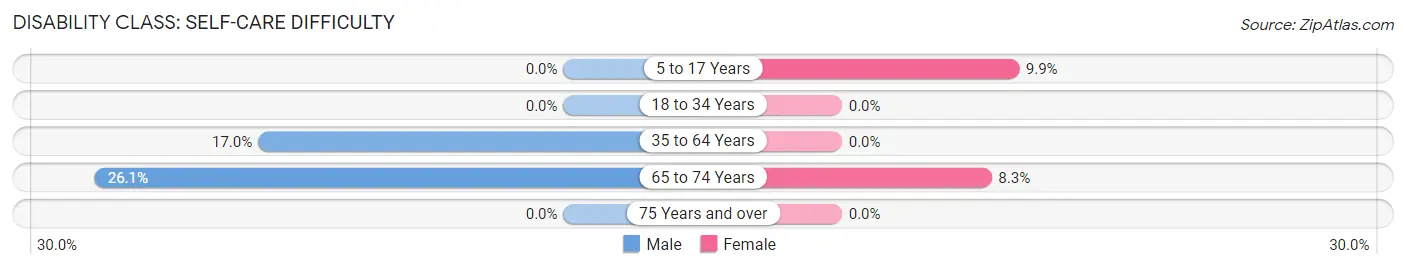
| Age Bracket | Male | Female |
| 5 to 17 Years | 0 (0.0%) | 7 (9.9%) |
| 18 to 34 Years | 0 (0.0%) | 0 (0.0%) |
| 35 to 64 Years | 17 (17.0%) | 0 (0.0%) |
| 65 to 74 Years | 6 (26.1%) | 2 (8.3%) |
| 75 Years and over | 0 (0.0%) | 0 (0.0%) |
Technology Access in Loleta
Computing Device Access in Loleta
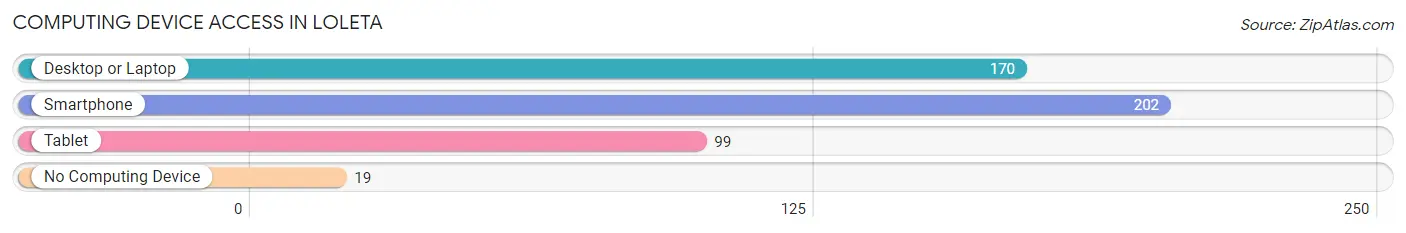
| Device Type | # Households | % Households |
| Desktop or Laptop | 170 | 72.0% |
| Smartphone | 202 | 85.6% |
| Tablet | 99 | 41.9% |
| No Computing Device | 19 | 8.1% |
| Total | 236 | 100.0% |
Internet Access in Loleta
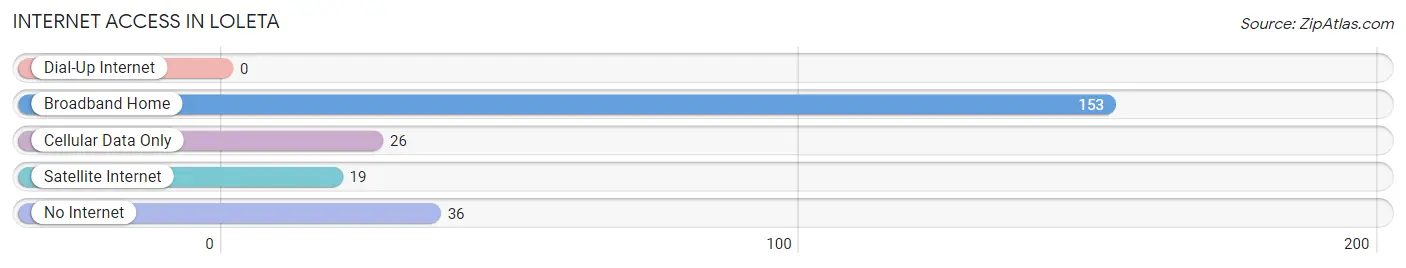
| Internet Type | # Households | % Households |
| Dial-Up Internet | 0 | 0.0% |
| Broadband Home | 153 | 64.8% |
| Cellular Data Only | 26 | 11.0% |
| Satellite Internet | 19 | 8.1% |
| No Internet | 36 | 15.2% |
| Total | 236 | 100.0% |
Loleta Summary
Loleta is a small unincorporated community located in Humboldt County, California. It is situated on the banks of the Eel River, approximately 10 miles south of Eureka. The population of Loleta was 1,402 as of the 2010 census.
History
The area now known as Loleta was originally inhabited by the Wiyot people, who lived in the area for thousands of years before the arrival of European settlers. The first European settlers arrived in the area in the 1850s, and the town was officially founded in 1875. The town was named after Loleta, the daughter of one of the first settlers, William Carson.
In the late 19th century, the town was a major center for the logging industry, and the Eel River was used to transport logs to the mills in Eureka. The town also had a thriving dairy industry, and the Loleta Cheese Factory was established in 1892. The factory was the first cheese factory in California, and it is still in operation today.
Geography
Loleta is located in Humboldt County, California, on the banks of the Eel River. The town is situated approximately 10 miles south of Eureka, and it is bordered by the towns of Fortuna and Ferndale. The town has a total area of 1.2 square miles, all of which is land.
The climate in Loleta is mild and temperate, with warm summers and cool winters. The average annual temperature is 54°F, and the average annual precipitation is 33 inches.
Economy
The economy of Loleta is largely based on agriculture and tourism. The town is home to several farms, including the Loleta Cheese Factory, which produces a variety of cheeses. The town is also a popular tourist destination, and it is home to several attractions, including the Loleta Drive-In Theater, the Loleta Winery, and the Loleta Historical Museum.
Demographics
As of the 2010 census, the population of Loleta was 1,402. The racial makeup of the town was 79.2% White, 0.7% African American, 1.3% Native American, 0.7% Asian, 0.1% Pacific Islander, 14.2% from other races, and 3.8% from two or more races. Hispanic or Latino of any race were 24.2% of the population.
The median household income in Loleta was $41,250, and the median family income was $45,938. The per capita income was $19,945. About 16.2% of the population was below the poverty line.
Common Questions
What is Per Capita Income in Loleta?
Per Capita income in Loleta is $30,575.
What is the Median Family Income in Loleta?
Median Family Income in Loleta is $95,820.
What is the Median Household income in Loleta?
Median Household Income in Loleta is $69,318.
What is Inequality or Gini Index in Loleta?
Inequality or Gini Index in Loleta is 0.38.
What is the Total Population of Loleta?
Total Population of Loleta is 532.
What is the Total Male Population of Loleta?
Total Male Population of Loleta is 214.
What is the Total Female Population of Loleta?
Total Female Population of Loleta is 318.
What is the Ratio of Males per 100 Females in Loleta?
There are 67.30 Males per 100 Females in Loleta.
What is the Ratio of Females per 100 Males in Loleta?
There are 148.60 Females per 100 Males in Loleta.
What is the Median Population Age in Loleta?
Median Population Age in Loleta is 46.4 Years.
What is the Average Family Size in Loleta
Average Family Size in Loleta is 3.0 People.
What is the Average Household Size in Loleta
Average Household Size in Loleta is 2.2 People.
How Large is the Labor Force in Loleta?
There are 269 People in the Labor Forcein in Loleta.
What is the Percentage of People in the Labor Force in Loleta?
57.8% of People are in the Labor Force in Loleta.
What is the Unemployment Rate in Loleta?
Unemployment Rate in Loleta is 12.6%.