Lakeport, CA Map & Demographics
Lakeport Map
Lakeport Overview
$41,608
PER CAPITA INCOME
$127,632
AVG FAMILY INCOME
$61,100
AVG HOUSEHOLD INCOME
67.7%
WAGE / INCOME GAP [ % ]
32.3¢/ $1
WAGE / INCOME GAP [ $ ]
0.49
INEQUALITY / GINI INDEX
5,014
TOTAL POPULATION
2,324
MALE POPULATION
2,690
FEMALE POPULATION
86.39
MALES / 100 FEMALES
115.75
FEMALES / 100 MALES
42.7
MEDIAN AGE
3.2
AVG FAMILY SIZE
2.3
AVG HOUSEHOLD SIZE
1,737
LABOR FORCE [ PEOPLE ]
42.0%
PERCENT IN LABOR FORCE
4.5%
UNEMPLOYMENT RATE
Lakeport Zip Codes
Lakeport Area Codes
Income in Lakeport
Income Overview in Lakeport
Per Capita Income in Lakeport is $41,608, while median incomes of families and households are $127,632 and $61,100 respectively.
| Characteristic | Number | Measure |
| Per Capita Income | 5,014 | $41,608 |
| Median Family Income | 1,188 | $127,632 |
| Mean Family Income | 1,188 | $143,786 |
| Median Household Income | 2,144 | $61,100 |
| Mean Household Income | 2,144 | $97,255 |
| Income Deficit | 1,188 | $0 |
| Wage / Income Gap (%) | 5,014 | 67.74% |
| Wage / Income Gap ($) | 5,014 | 32.26¢ per $1 |
| Gini / Inequality Index | 5,014 | 0.49 |
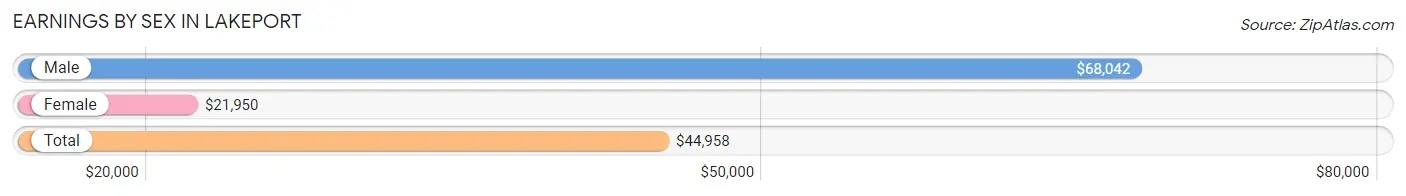
Earnings by Sex in Lakeport
Average Earnings in Lakeport are $44,958, $68,042 for men and $21,950 for women, a difference of 67.7%.
| Sex | Number | Average Earnings |
| Male | 1,163 (52.5%) | $68,042 |
| Female | 1,050 (47.4%) | $21,950 |
| Total | 2,213 (100.0%) | $44,958 |
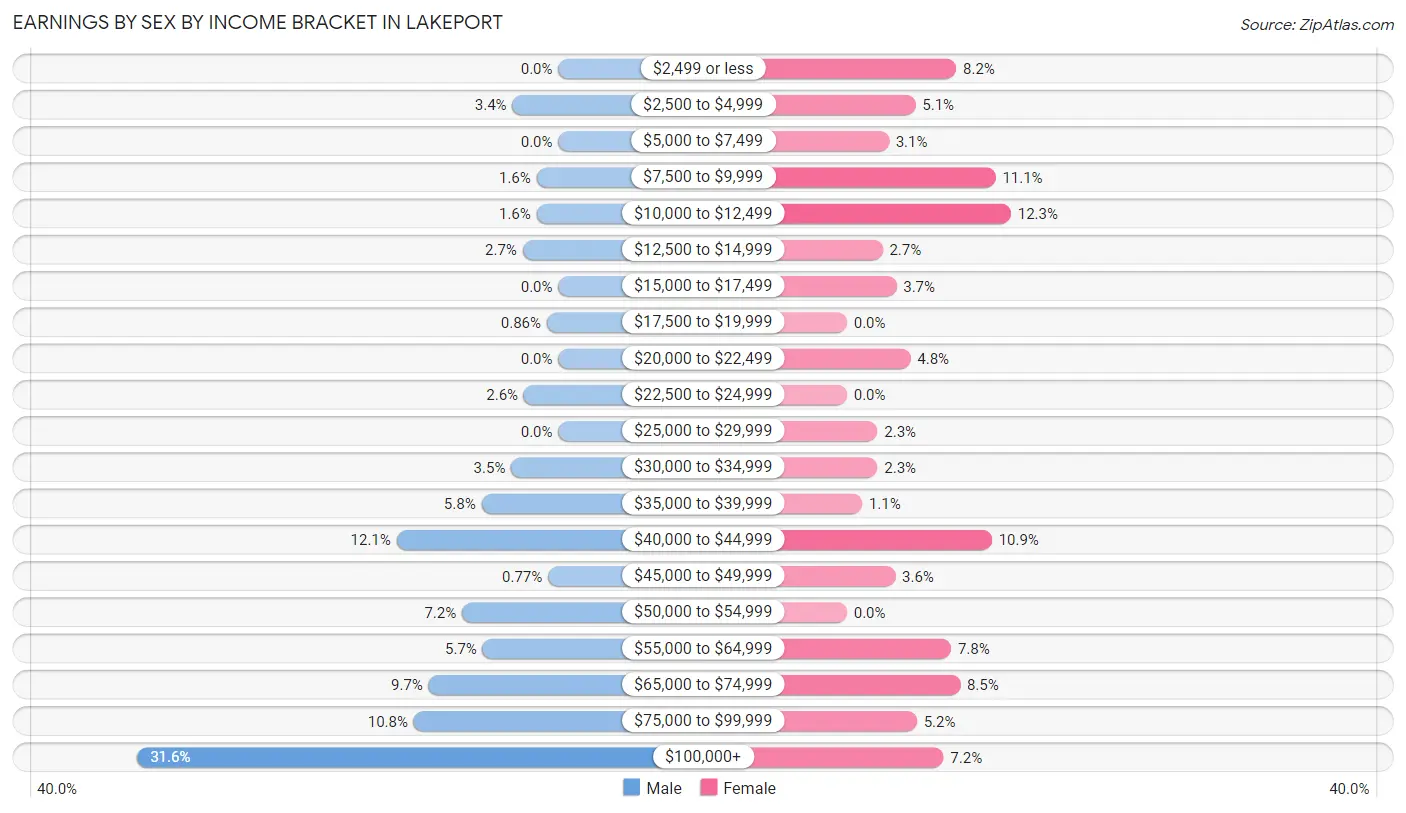
Earnings by Sex by Income Bracket in Lakeport
The most common earnings brackets in Lakeport are $100,000+ for men (367 | 31.6%) and $10,000 to $12,499 for women (129 | 12.3%).
| Income | Male | Female |
| $2,499 or less | 0 (0.0%) | 86 (8.2%) |
| $2,500 to $4,999 | 40 (3.4%) | 54 (5.1%) |
| $5,000 to $7,499 | 0 (0.0%) | 33 (3.1%) |
| $7,500 to $9,999 | 19 (1.6%) | 117 (11.1%) |
| $10,000 to $12,499 | 19 (1.6%) | 129 (12.3%) |
| $12,500 to $14,999 | 31 (2.7%) | 28 (2.7%) |
| $15,000 to $17,499 | 0 (0.0%) | 39 (3.7%) |
| $17,500 to $19,999 | 10 (0.9%) | 0 (0.0%) |
| $20,000 to $22,499 | 0 (0.0%) | 50 (4.8%) |
| $22,500 to $24,999 | 30 (2.6%) | 0 (0.0%) |
| $25,000 to $29,999 | 0 (0.0%) | 24 (2.3%) |
| $30,000 to $34,999 | 41 (3.5%) | 24 (2.3%) |
| $35,000 to $39,999 | 67 (5.8%) | 12 (1.1%) |
| $40,000 to $44,999 | 141 (12.1%) | 114 (10.9%) |
| $45,000 to $49,999 | 9 (0.8%) | 38 (3.6%) |
| $50,000 to $54,999 | 84 (7.2%) | 0 (0.0%) |
| $55,000 to $64,999 | 66 (5.7%) | 82 (7.8%) |
| $65,000 to $74,999 | 113 (9.7%) | 89 (8.5%) |
| $75,000 to $99,999 | 126 (10.8%) | 55 (5.2%) |
| $100,000+ | 367 (31.6%) | 76 (7.2%) |
| Total | 1,163 (100.0%) | 1,050 (100.0%) |
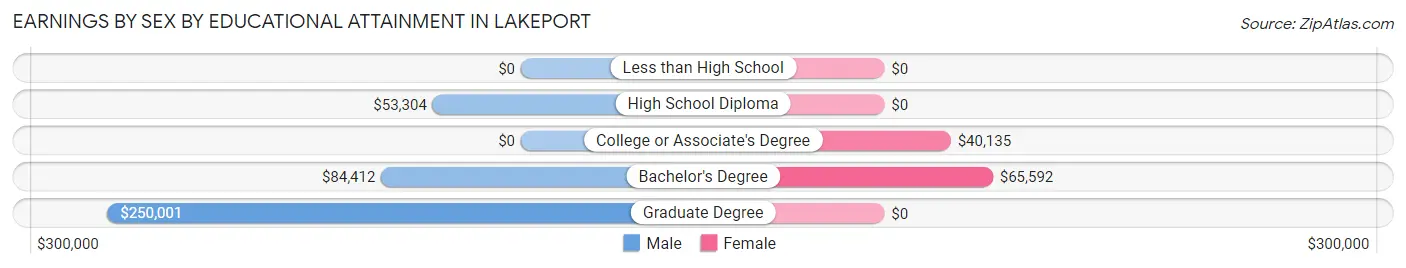
Earnings by Sex by Educational Attainment in Lakeport
Average earnings in Lakeport are $68,021 for men and $41,692 for women, a difference of 38.7%. Men with an educational attainment of graduate degree enjoy the highest average annual earnings of $250,001, while those with high school diploma education earn the least with $53,304. Women with an educational attainment of bachelor's degree earn the most with the average annual earnings of $65,592, while those with college or associate's degree education have the smallest earnings of $40,135.
| Educational Attainment | Male Income | Female Income |
| Less than High School | - | - |
| High School Diploma | $53,304 | $0 |
| College or Associate's Degree | - | - |
| Bachelor's Degree | $84,412 | $65,592 |
| Graduate Degree | $250,001 | $0 |
| Total | $68,021 | $41,692 |
Family Income in Lakeport
Family Income Brackets in Lakeport
According to the Lakeport family income data, there are 285 families falling into the $200,000+ income range, which is the most common income bracket and makes up 24.0% of all families. Conversely, the less than $10,000 income bracket is the least frequent group with only 10 families (0.8%) belonging to this category.
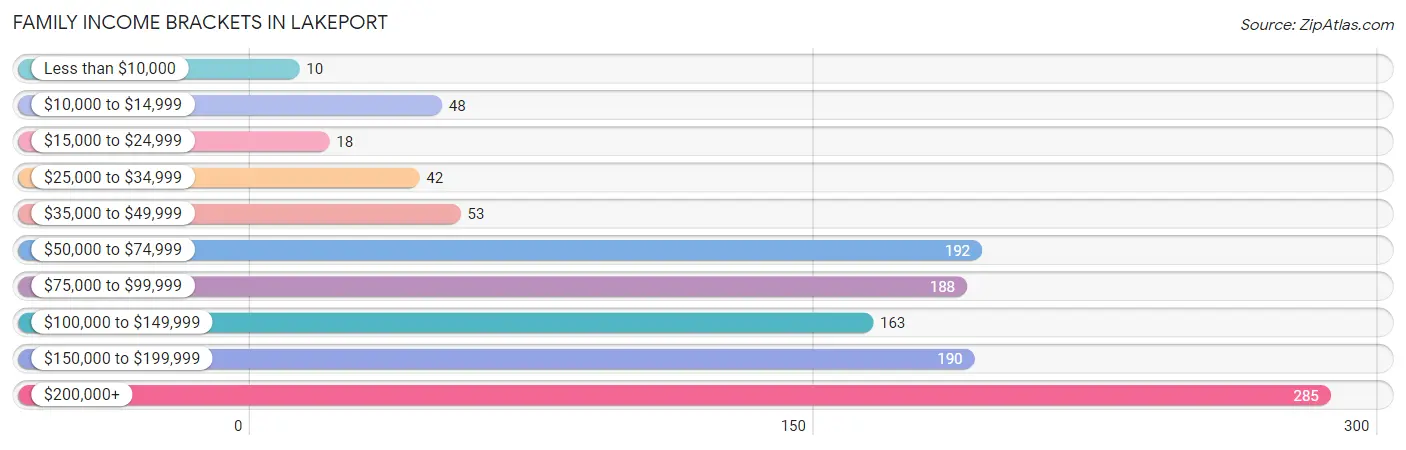
| Income Bracket | # Families | % Families |
| Less than $10,000 | 10 | 0.8% |
| $10,000 to $14,999 | 48 | 4.0% |
| $15,000 to $24,999 | 18 | 1.5% |
| $25,000 to $34,999 | 42 | 3.5% |
| $35,000 to $49,999 | 53 | 4.5% |
| $50,000 to $74,999 | 192 | 16.2% |
| $75,000 to $99,999 | 188 | 15.8% |
| $100,000 to $149,999 | 163 | 13.7% |
| $150,000 to $199,999 | 190 | 16.0% |
| $200,000+ | 285 | 24.0% |
Family Income by Famaliy Size in Lakeport
4-person families (337 | 28.4%) account for the highest median family income in Lakeport with $250,001 per family, while 3-person families (175 | 14.7%) have the highest median income of $63,495 per family member.
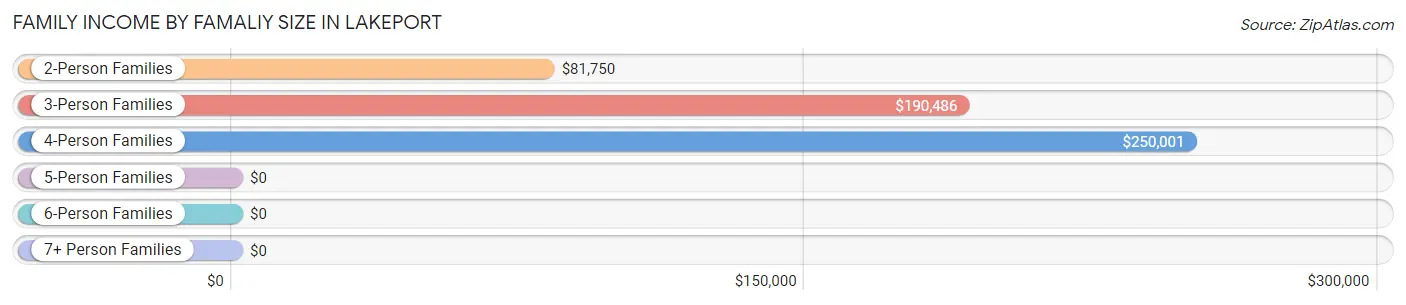
| Income Bracket | # Families | Median Income |
| 2-Person Families | 561 (47.2%) | $81,750 |
| 3-Person Families | 175 (14.7%) | $190,486 |
| 4-Person Families | 337 (28.4%) | $250,001 |
| 5-Person Families | 73 (6.1%) | $0 |
| 6-Person Families | 0 (0.0%) | $0 |
| 7+ Person Families | 42 (3.5%) | $0 |
| Total | 1,188 (100.0%) | $127,632 |
Family Income by Number of Earners in Lakeport
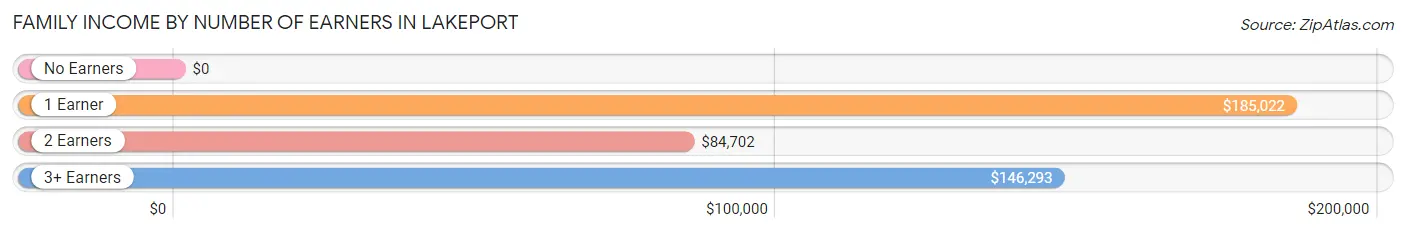
| Number of Earners | # Families | Median Income |
| No Earners | 122 (10.3%) | $0 |
| 1 Earner | 477 (40.2%) | $185,022 |
| 2 Earners | 499 (42.0%) | $84,702 |
| 3+ Earners | 90 (7.6%) | $146,293 |
| Total | 1,188 (100.0%) | $127,632 |
Household Income in Lakeport
Household Income Brackets in Lakeport
With 399 households falling in the category, the $50,000 to $74,999 income range is the most frequent in Lakeport, accounting for 18.6% of all households. In contrast, only 86 households (4.0%) fall into the less than $10,000 income bracket, making it the least populous group.
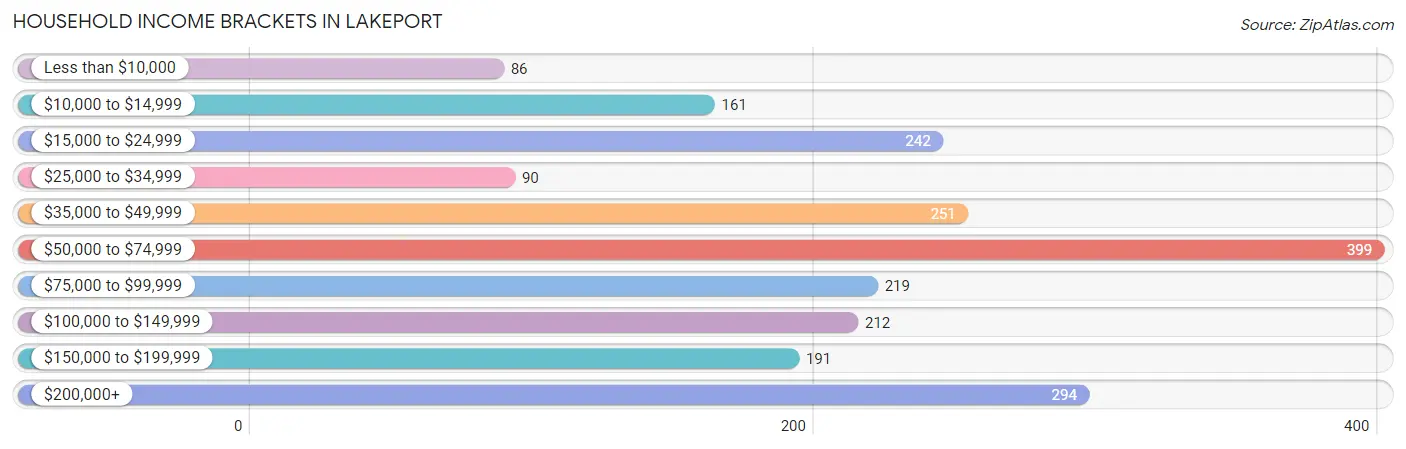
| Income Bracket | # Households | % Households |
| Less than $10,000 | 86 | 4.0% |
| $10,000 to $14,999 | 161 | 7.5% |
| $15,000 to $24,999 | 242 | 11.3% |
| $25,000 to $34,999 | 90 | 4.2% |
| $35,000 to $49,999 | 251 | 11.7% |
| $50,000 to $74,999 | 399 | 18.6% |
| $75,000 to $99,999 | 219 | 10.2% |
| $100,000 to $149,999 | 212 | 9.9% |
| $150,000 to $199,999 | 191 | 8.9% |
| $200,000+ | 294 | 13.7% |
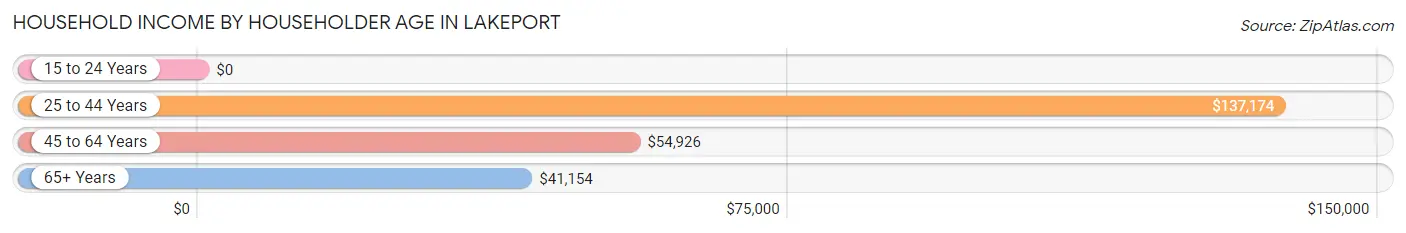
Household Income by Householder Age in Lakeport
The median household income in Lakeport is $61,100, with the highest median household income of $137,174 found in the 25 to 44 years age bracket for the primary householder. A total of 502 households (23.4%) fall into this category. Meanwhile, the 15 to 24 years age bracket for the primary householder has the lowest median household income of $0, with 89 households (4.2%) in this group.
| Income Bracket | # Households | Median Income |
| 15 to 24 Years | 89 (4.2%) | $0 |
| 25 to 44 Years | 502 (23.4%) | $137,174 |
| 45 to 64 Years | 803 (37.4%) | $54,926 |
| 65+ Years | 750 (35.0%) | $41,154 |
| Total | 2,144 (100.0%) | $61,100 |
Poverty in Lakeport
Income Below Poverty by Sex and Age in Lakeport
With 10.4% poverty level for males and 11.7% for females among the residents of Lakeport, 55 to 64 year old males and 55 to 64 year old females are the most vulnerable to poverty, with 98 males (21.3%) and 78 females (25.7%) in their respective age groups living below the poverty level.
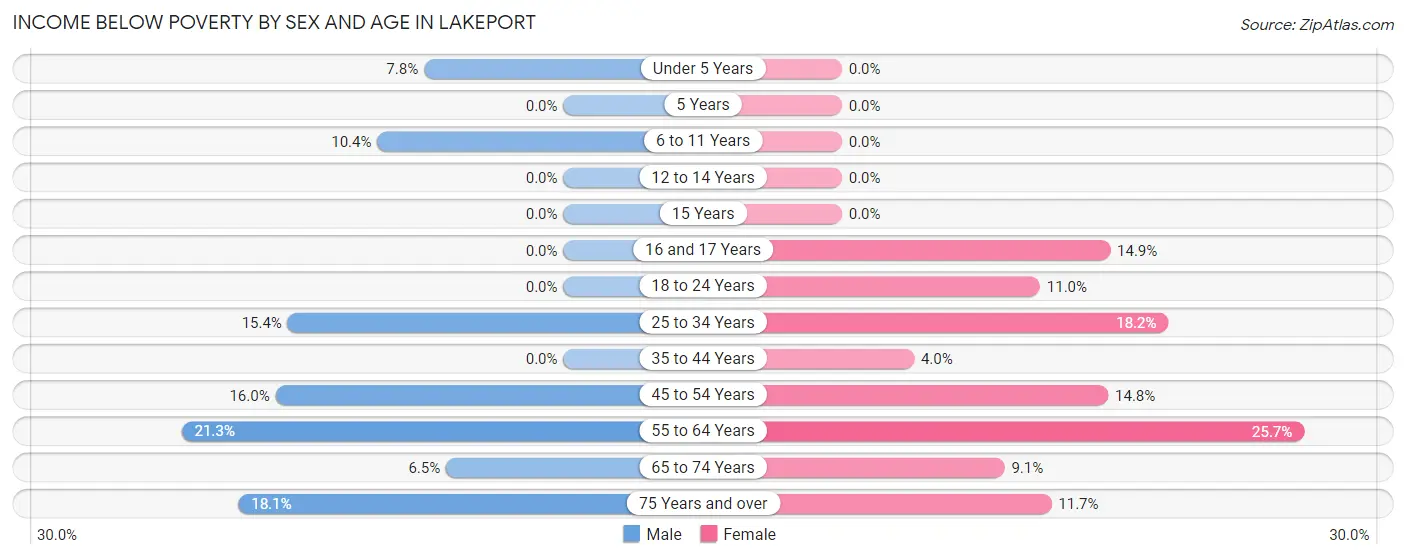
| Age Bracket | Male | Female |
| Under 5 Years | 18 (7.8%) | 0 (0.0%) |
| 5 Years | 0 (0.0%) | 0 (0.0%) |
| 6 to 11 Years | 23 (10.4%) | 0 (0.0%) |
| 12 to 14 Years | 0 (0.0%) | 0 (0.0%) |
| 15 Years | 0 (0.0%) | 0 (0.0%) |
| 16 and 17 Years | 0 (0.0%) | 26 (14.9%) |
| 18 to 24 Years | 0 (0.0%) | 30 (11.0%) |
| 25 to 34 Years | 31 (15.3%) | 42 (18.2%) |
| 35 to 44 Years | 0 (0.0%) | 14 (4.0%) |
| 45 to 54 Years | 38 (16.0%) | 39 (14.8%) |
| 55 to 64 Years | 98 (21.3%) | 78 (25.7%) |
| 65 to 74 Years | 13 (6.5%) | 29 (9.1%) |
| 75 Years and over | 19 (18.1%) | 44 (11.7%) |
| Total | 240 (10.4%) | 302 (11.7%) |
Income Above Poverty by Sex and Age in Lakeport
According to the poverty statistics in Lakeport, males aged 12 to 14 years and females aged under 5 years are the age groups that are most secure financially, with 100.0% of males and 100.0% of females in these age groups living above the poverty line.
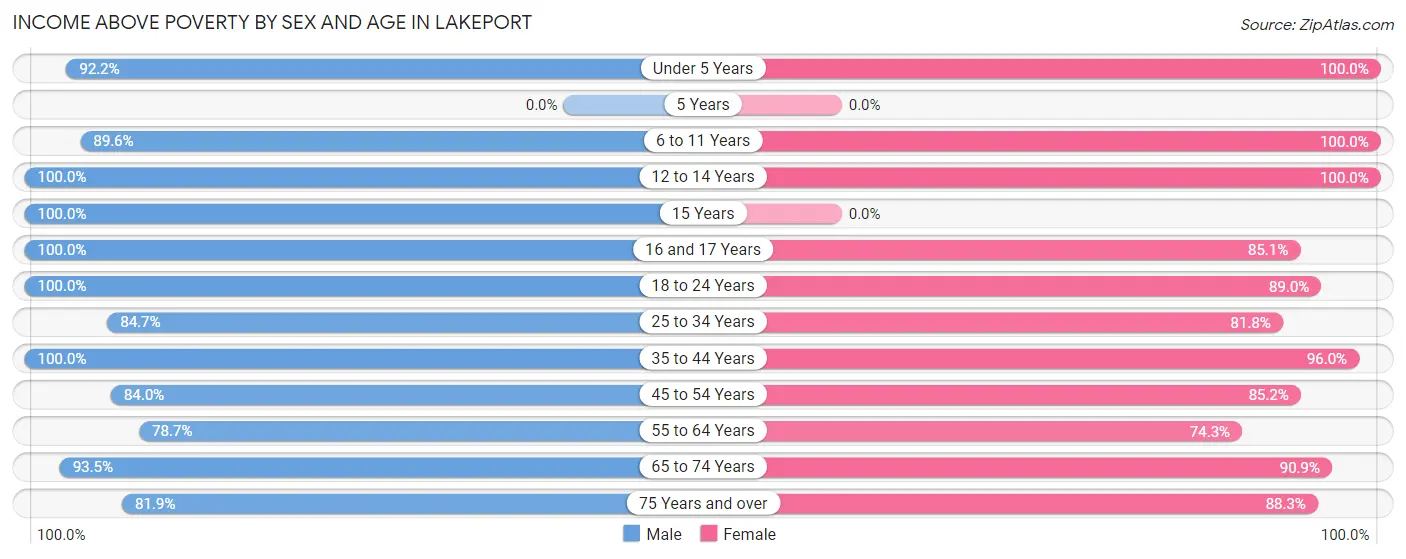
| Age Bracket | Male | Female |
| Under 5 Years | 214 (92.2%) | 213 (100.0%) |
| 5 Years | 0 (0.0%) | 0 (0.0%) |
| 6 to 11 Years | 199 (89.6%) | 17 (100.0%) |
| 12 to 14 Years | 89 (100.0%) | 63 (100.0%) |
| 15 Years | 42 (100.0%) | 0 (0.0%) |
| 16 and 17 Years | 13 (100.0%) | 148 (85.1%) |
| 18 to 24 Years | 153 (100.0%) | 242 (89.0%) |
| 25 to 34 Years | 171 (84.7%) | 189 (81.8%) |
| 35 to 44 Years | 341 (100.0%) | 334 (96.0%) |
| 45 to 54 Years | 199 (84.0%) | 224 (85.2%) |
| 55 to 64 Years | 363 (78.7%) | 225 (74.3%) |
| 65 to 74 Years | 186 (93.5%) | 291 (90.9%) |
| 75 Years and over | 86 (81.9%) | 333 (88.3%) |
| Total | 2,056 (89.5%) | 2,279 (88.3%) |
Income Below Poverty Among Married-Couple Families in Lakeport
The poverty statistics for married-couple families in Lakeport show that 6.7% or 59 of the total 883 families live below the poverty line. Families with 3 or 4 children have the highest poverty rate of 36.6%, comprising of 30 families. On the other hand, families with 1 or 2 children have the lowest poverty rate of 0.0%, which includes 0 families.
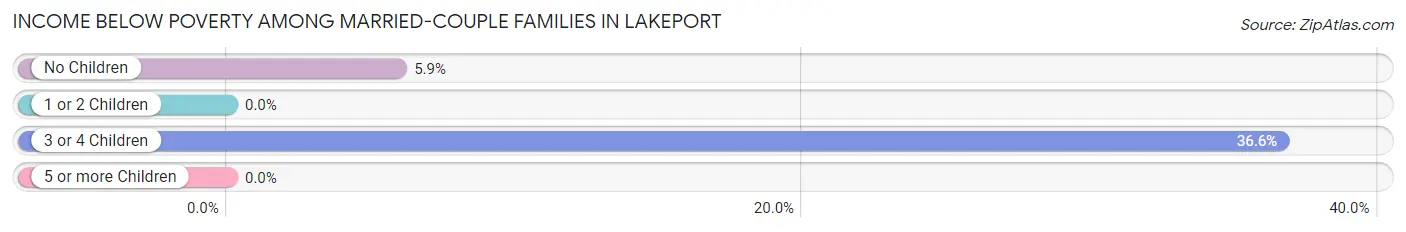
| Children | Above Poverty | Below Poverty |
| No Children | 463 (94.1%) | 29 (5.9%) |
| 1 or 2 Children | 309 (100.0%) | 0 (0.0%) |
| 3 or 4 Children | 52 (63.4%) | 30 (36.6%) |
| 5 or more Children | 0 (0.0%) | 0 (0.0%) |
| Total | 824 (93.3%) | 59 (6.7%) |
Income Below Poverty Among Single-Parent Households in Lakeport
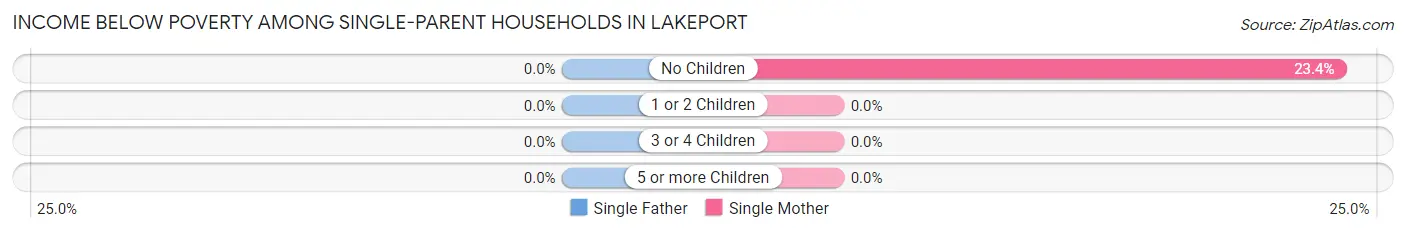
| Children | Single Father | Single Mother |
| No Children | 0 (0.0%) | 33 (23.4%) |
| 1 or 2 Children | 0 (0.0%) | 0 (0.0%) |
| 3 or 4 Children | 0 (0.0%) | 0 (0.0%) |
| 5 or more Children | 0 (0.0%) | 0 (0.0%) |
| Total | 0 (0.0%) | 33 (15.8%) |
Income Below Poverty Among Married-Couple vs Single-Parent Households in Lakeport
The poverty data for Lakeport shows that 59 of the married-couple family households (6.7%) and 33 of the single-parent households (10.8%) are living below the poverty level. Within the married-couple family households, those with 3 or 4 children have the highest poverty rate, with 30 households (36.6%) falling below the poverty line. Among the single-parent households, those with no children have the highest poverty rate, with 33 household (15.1%) living below poverty.
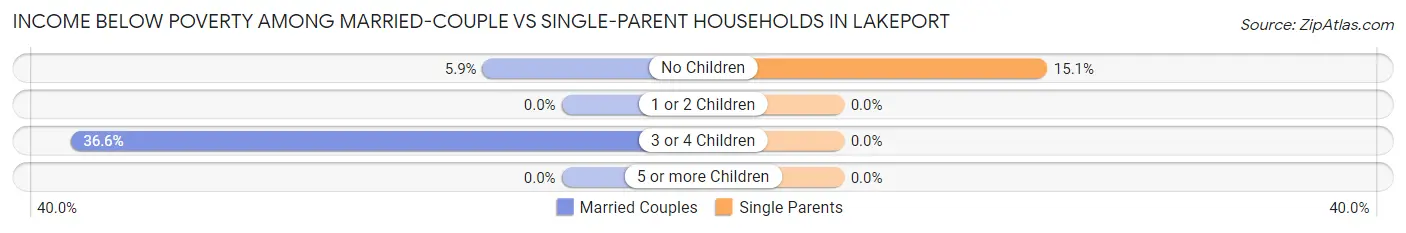
| Children | Married-Couple Families | Single-Parent Households |
| No Children | 29 (5.9%) | 33 (15.1%) |
| 1 or 2 Children | 0 (0.0%) | 0 (0.0%) |
| 3 or 4 Children | 30 (36.6%) | 0 (0.0%) |
| 5 or more Children | 0 (0.0%) | 0 (0.0%) |
| Total | 59 (6.7%) | 33 (10.8%) |
Race in Lakeport
The most populous races in Lakeport are White / Caucasian (4,200 | 83.8%), Hispanic or Latino (732 | 14.6%), and Some other Race (396 | 7.9%).
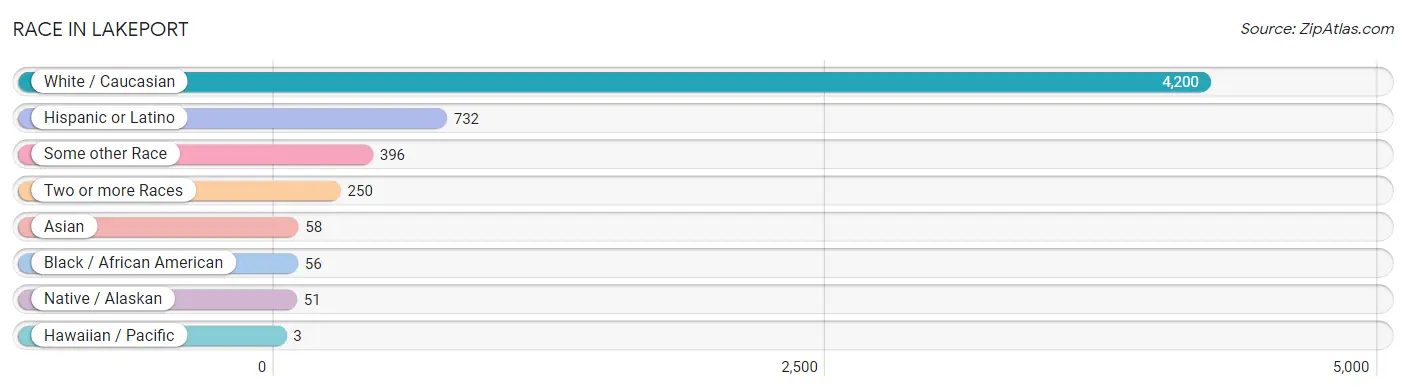
| Race | # Population | % Population |
| Asian | 58 | 1.2% |
| Black / African American | 56 | 1.1% |
| Hawaiian / Pacific | 3 | 0.1% |
| Hispanic or Latino | 732 | 14.6% |
| Native / Alaskan | 51 | 1.0% |
| White / Caucasian | 4,200 | 83.8% |
| Two or more Races | 250 | 5.0% |
| Some other Race | 396 | 7.9% |
| Total | 5,014 | 100.0% |
Ancestry in Lakeport
The most populous ancestries reported in Lakeport are English (1,076 | 21.5%), Mexican (545 | 10.9%), German (403 | 8.0%), Irish (398 | 7.9%), and European (280 | 5.6%), together accounting for 53.9% of all Lakeport residents.
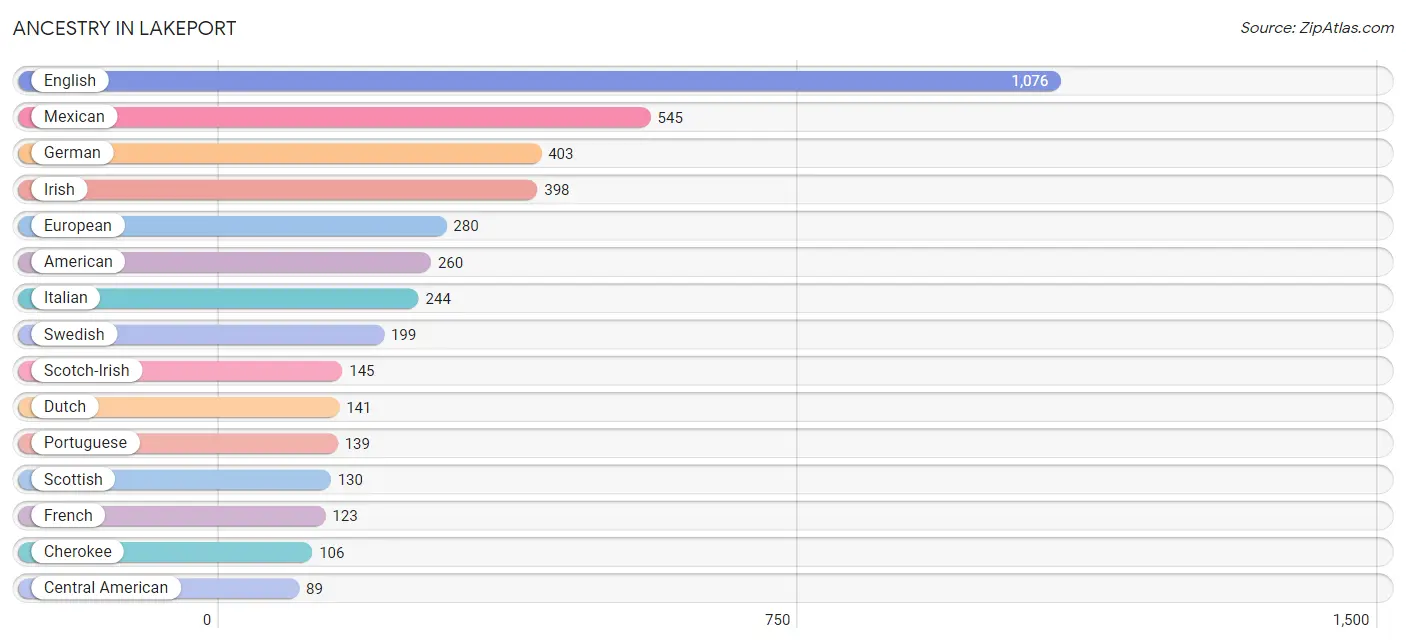
| Ancestry | # Population | % Population |
| American | 260 | 5.2% |
| Armenian | 13 | 0.3% |
| Austrian | 23 | 0.5% |
| Belgian | 19 | 0.4% |
| British | 22 | 0.4% |
| Burmese | 10 | 0.2% |
| Central American | 89 | 1.8% |
| Cherokee | 106 | 2.1% |
| Czech | 71 | 1.4% |
| Dutch | 141 | 2.8% |
| English | 1,076 | 21.5% |
| European | 280 | 5.6% |
| French | 123 | 2.5% |
| French Canadian | 24 | 0.5% |
| German | 403 | 8.0% |
| Greek | 50 | 1.0% |
| Honduran | 81 | 1.6% |
| Hungarian | 17 | 0.3% |
| Indian (Asian) | 18 | 0.4% |
| Irish | 398 | 7.9% |
| Italian | 244 | 4.9% |
| Japanese | 39 | 0.8% |
| Korean | 29 | 0.6% |
| Mexican | 545 | 10.9% |
| Northern European | 4 | 0.1% |
| Norwegian | 70 | 1.4% |
| Pakistani | 11 | 0.2% |
| Polish | 89 | 1.8% |
| Portuguese | 139 | 2.8% |
| Puerto Rican | 18 | 0.4% |
| Russian | 26 | 0.5% |
| Salvadoran | 8 | 0.2% |
| Scotch-Irish | 145 | 2.9% |
| Scottish | 130 | 2.6% |
| Spaniard | 38 | 0.8% |
| Spanish | 35 | 0.7% |
| Swedish | 199 | 4.0% |
| Swiss | 22 | 0.4% |
| Welsh | 27 | 0.5% | View All 39 Rows |
Immigrants in Lakeport
The most numerous immigrant groups reported in Lakeport came from Latin America (143 | 2.9%), Central America (116 | 2.3%), Mexico (94 | 1.9%), Asia (55 | 1.1%), and South Eastern Asia (30 | 0.6%), together accounting for 8.7% of all Lakeport residents.
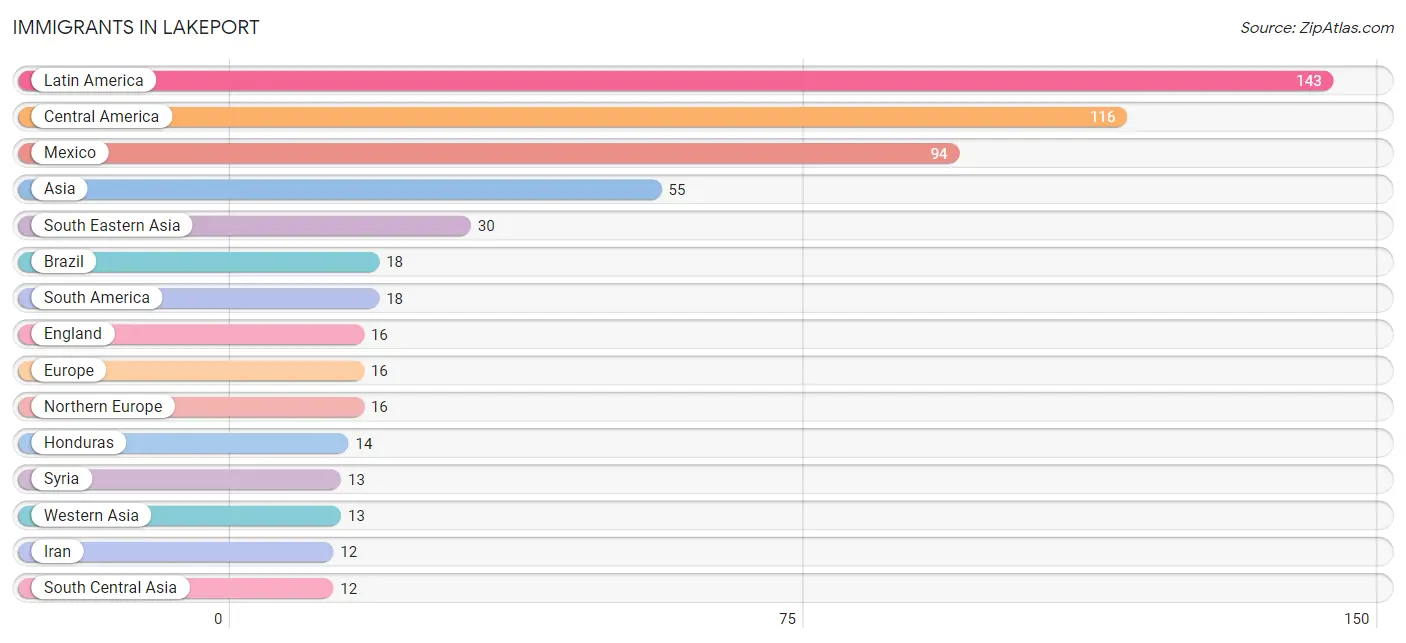
| Immigration Origin | # Population | % Population |
| Asia | 55 | 1.1% |
| Brazil | 18 | 0.4% |
| Cambodia | 8 | 0.2% |
| Caribbean | 9 | 0.2% |
| Central America | 116 | 2.3% |
| Cuba | 9 | 0.2% |
| El Salvador | 8 | 0.2% |
| England | 16 | 0.3% |
| Europe | 16 | 0.3% |
| Honduras | 14 | 0.3% |
| Iran | 12 | 0.2% |
| Latin America | 143 | 2.9% |
| Mexico | 94 | 1.9% |
| Northern Europe | 16 | 0.3% |
| Philippines | 11 | 0.2% |
| South America | 18 | 0.4% |
| South Central Asia | 12 | 0.2% |
| South Eastern Asia | 30 | 0.6% |
| Syria | 13 | 0.3% |
| Thailand | 11 | 0.2% |
| Western Asia | 13 | 0.3% | View All 21 Rows |
Sex and Age in Lakeport
Sex and Age in Lakeport
The most populous age groups in Lakeport are 60 to 64 Years (325 | 14.0%) for men and 15 to 19 Years (256 | 9.5%) for women.
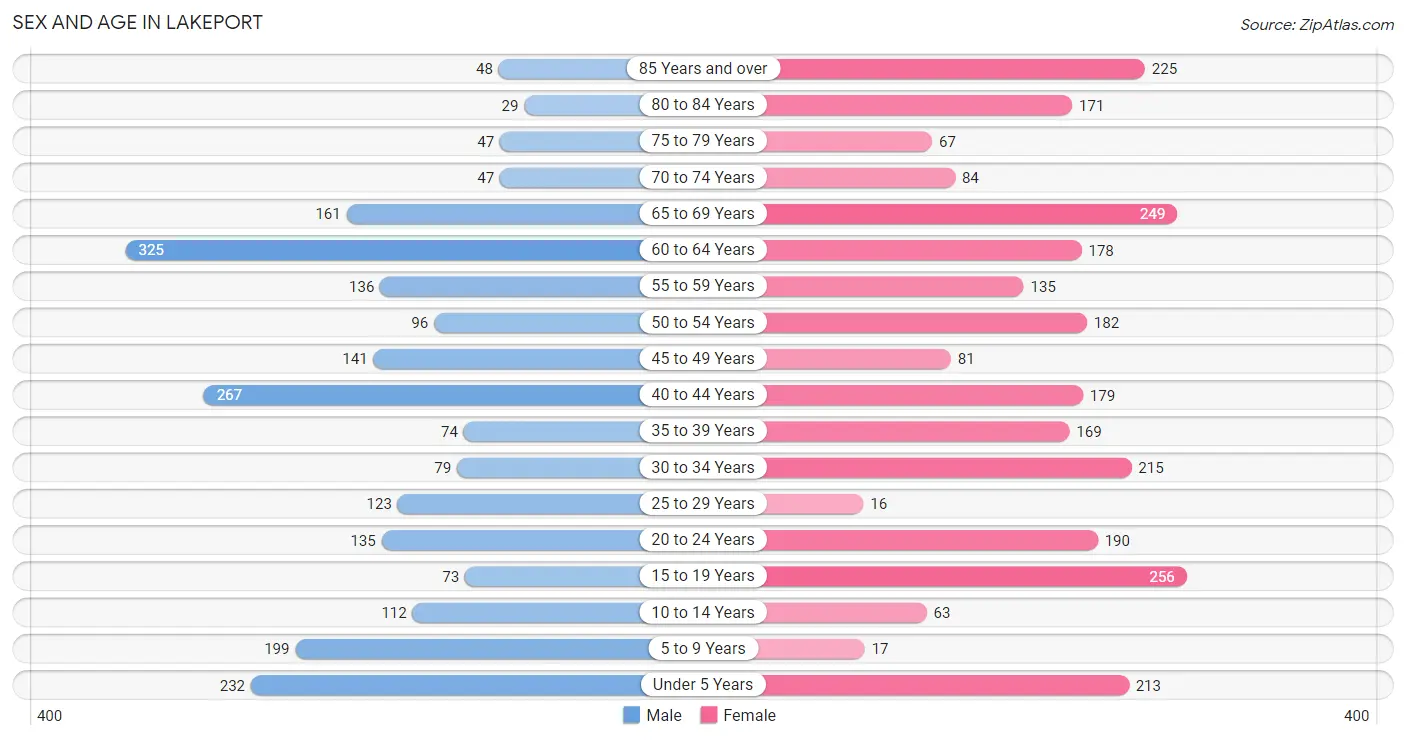
| Age Bracket | Male | Female |
| Under 5 Years | 232 (10.0%) | 213 (7.9%) |
| 5 to 9 Years | 199 (8.6%) | 17 (0.6%) |
| 10 to 14 Years | 112 (4.8%) | 63 (2.3%) |
| 15 to 19 Years | 73 (3.1%) | 256 (9.5%) |
| 20 to 24 Years | 135 (5.8%) | 190 (7.1%) |
| 25 to 29 Years | 123 (5.3%) | 16 (0.6%) |
| 30 to 34 Years | 79 (3.4%) | 215 (8.0%) |
| 35 to 39 Years | 74 (3.2%) | 169 (6.3%) |
| 40 to 44 Years | 267 (11.5%) | 179 (6.7%) |
| 45 to 49 Years | 141 (6.1%) | 81 (3.0%) |
| 50 to 54 Years | 96 (4.1%) | 182 (6.8%) |
| 55 to 59 Years | 136 (5.9%) | 135 (5.0%) |
| 60 to 64 Years | 325 (14.0%) | 178 (6.6%) |
| 65 to 69 Years | 161 (6.9%) | 249 (9.3%) |
| 70 to 74 Years | 47 (2.0%) | 84 (3.1%) |
| 75 to 79 Years | 47 (2.0%) | 67 (2.5%) |
| 80 to 84 Years | 29 (1.3%) | 171 (6.4%) |
| 85 Years and over | 48 (2.1%) | 225 (8.4%) |
| Total | 2,324 (100.0%) | 2,690 (100.0%) |
Families and Households in Lakeport
Median Family Size in Lakeport
The median family size in Lakeport is 3.19 persons per family, with single female/mother families (209 | 17.6%) accounting for the largest median family size of 3.34 persons per family. On the other hand, single male/father families (96 | 8.1%) represent the smallest median family size with 2.84 persons per family.
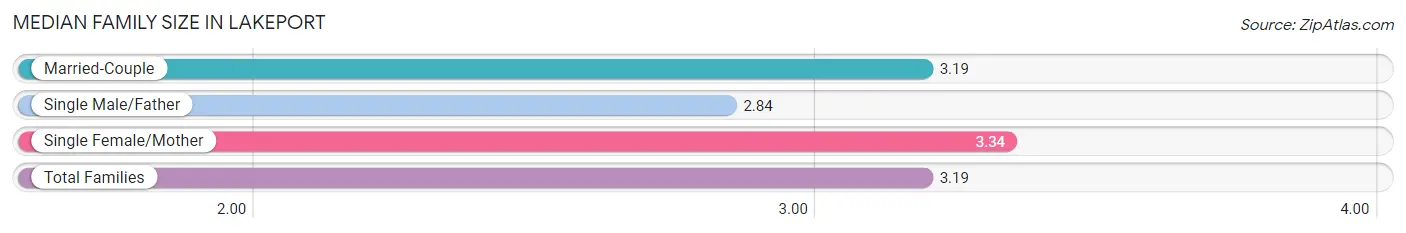
| Family Type | # Families | Family Size |
| Married-Couple | 883 (74.3%) | 3.19 |
| Single Male/Father | 96 (8.1%) | 2.84 |
| Single Female/Mother | 209 (17.6%) | 3.34 |
| Total Families | 1,188 (100.0%) | 3.19 |
Median Household Size in Lakeport
The median household size in Lakeport is 2.26 persons per household, with single female/mother households (209 | 9.8%) accounting for the largest median household size of 3.69 persons per household. non-family households (956 | 44.6%) represent the smallest median household size with 1.02 persons per household.
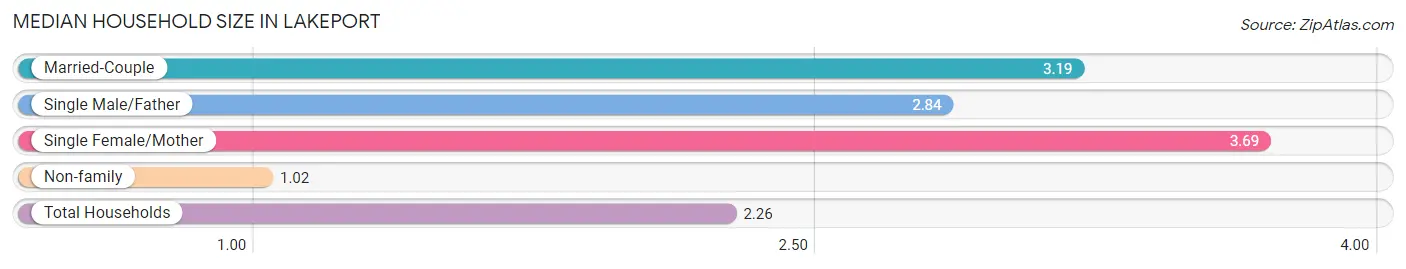
| Household Type | # Households | Household Size |
| Married-Couple | 883 (41.2%) | 3.19 |
| Single Male/Father | 96 (4.5%) | 2.84 |
| Single Female/Mother | 209 (9.8%) | 3.69 |
| Non-family | 956 (44.6%) | 1.02 |
| Total Households | 2,144 (100.0%) | 2.26 |
Household Size by Marriage Status in Lakeport
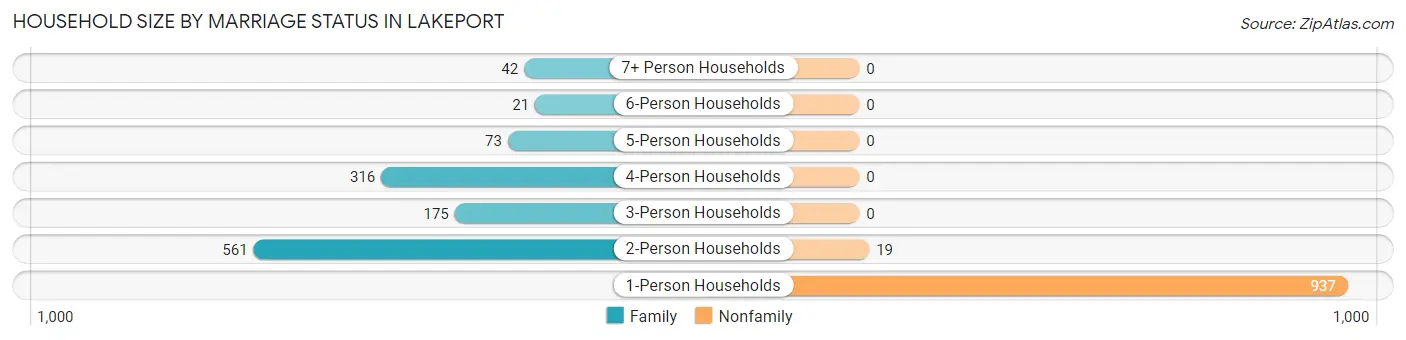
Out of a total of 2,144 households in Lakeport, 1,188 (55.4%) are family households, while 956 (44.6%) are nonfamily households. The most numerous type of family households are 2-person households, comprising 561, and the most common type of nonfamily households are 1-person households, comprising 937.
| Household Size | Family Households | Nonfamily Households |
| 1-Person Households | - | 937 (43.7%) |
| 2-Person Households | 561 (26.2%) | 19 (0.9%) |
| 3-Person Households | 175 (8.2%) | 0 (0.0%) |
| 4-Person Households | 316 (14.7%) | 0 (0.0%) |
| 5-Person Households | 73 (3.4%) | 0 (0.0%) |
| 6-Person Households | 21 (1.0%) | 0 (0.0%) |
| 7+ Person Households | 42 (2.0%) | 0 (0.0%) |
| Total | 1,188 (55.4%) | 956 (44.6%) |
Female Fertility in Lakeport
Fertility by Age in Lakeport
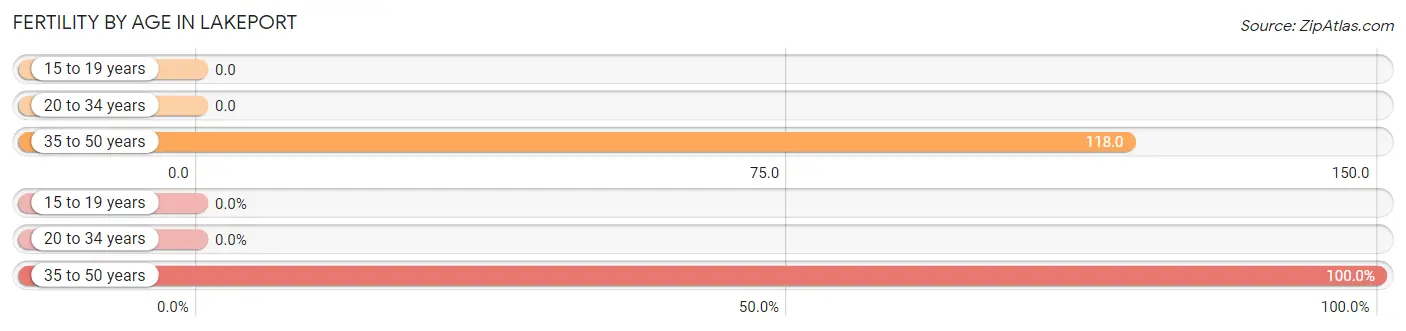
Average fertility rate in Lakeport is 48.0 births per 1,000 women. Women in the age bracket of 35 to 50 years have the highest fertility rate with 118.0 births per 1,000 women. Women in the age bracket of 35 to 50 years acount for 100.0% of all women with births.
| Age Bracket | Women with Births | Births / 1,000 Women |
| 15 to 19 years | 0 (0.0%) | 0.0 |
| 20 to 34 years | 0 (0.0%) | 0.0 |
| 35 to 50 years | 54 (100.0%) | 118.0 |
| Total | 54 (100.0%) | 48.0 |
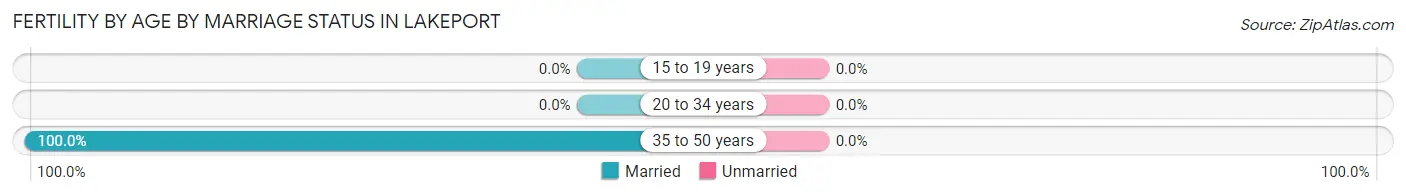
Fertility by Age by Marriage Status in Lakeport
| Age Bracket | Married | Unmarried |
| 15 to 19 years | 0 (0.0%) | 0 (0.0%) |
| 20 to 34 years | 0 (0.0%) | 0 (0.0%) |
| 35 to 50 years | 54 (100.0%) | 0 (0.0%) |
| Total | 54 (100.0%) | 0 (0.0%) |
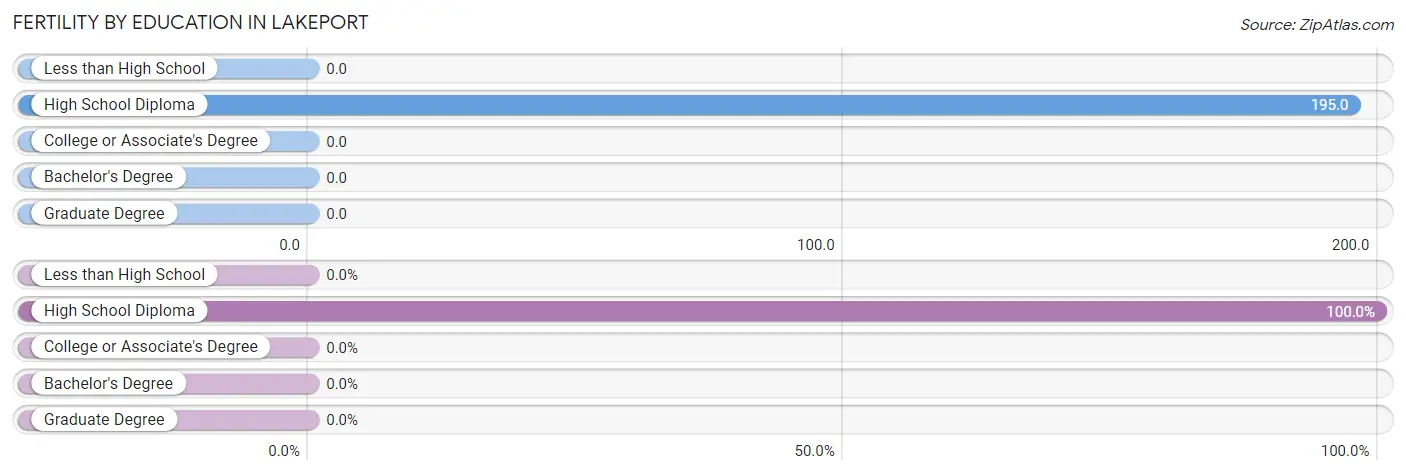
Fertility by Education in Lakeport
| Educational Attainment | Women with Births | Births / 1,000 Women |
| Less than High School | 0 (0.0%) | 0.0 |
| High School Diploma | 54 (100.0%) | 195.0 |
| College or Associate's Degree | 0 (0.0%) | 0.0 |
| Bachelor's Degree | 0 (0.0%) | 0.0 |
| Graduate Degree | 0 (0.0%) | 0.0 |
| Total | 54 (100.0%) | 48.0 |
Fertility by Education by Marriage Status in Lakeport
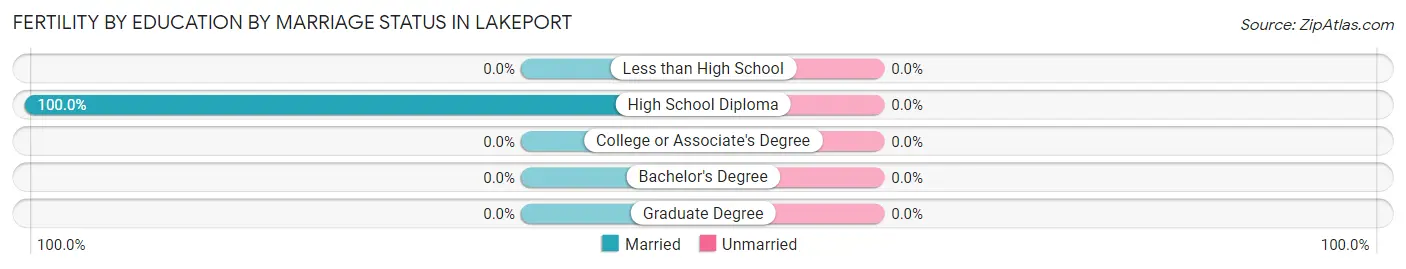
| Educational Attainment | Married | Unmarried |
| Less than High School | 0 (0.0%) | 0 (0.0%) |
| High School Diploma | 54 (100.0%) | 0 (0.0%) |
| College or Associate's Degree | 0 (0.0%) | 0 (0.0%) |
| Bachelor's Degree | 0 (0.0%) | 0 (0.0%) |
| Graduate Degree | 0 (0.0%) | 0 (0.0%) |
| Total | 54 (100.0%) | 0 (0.0%) |
Employment Characteristics in Lakeport
Employment by Class of Employer in Lakeport
Among the 1,566 employed individuals in Lakeport, private company employees (708 | 45.2%), local government employees (361 | 23.1%), and self-employed (incorporated) (256 | 16.4%) make up the most common classes of employment.
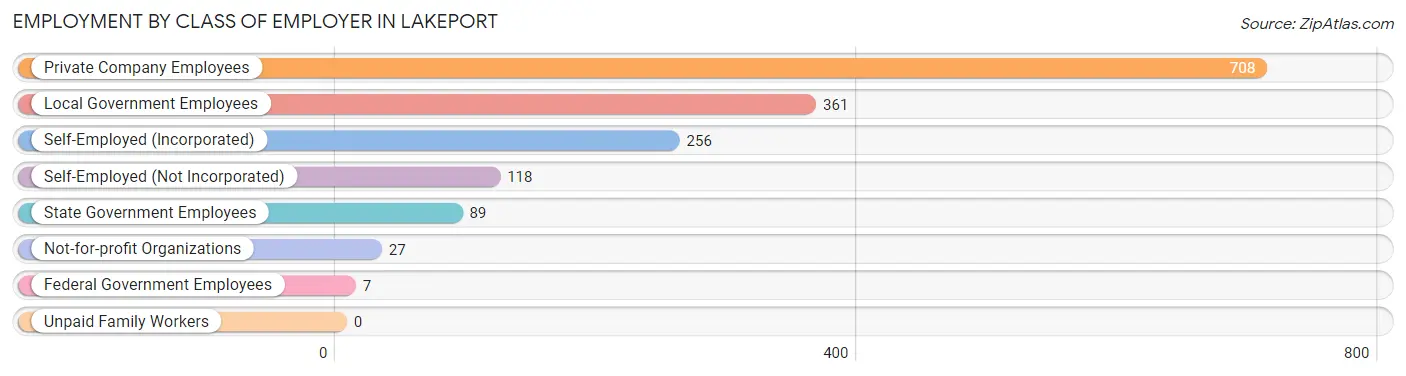
| Employer Class | # Employees | % Employees |
| Private Company Employees | 708 | 45.2% |
| Self-Employed (Incorporated) | 256 | 16.4% |
| Self-Employed (Not Incorporated) | 118 | 7.5% |
| Not-for-profit Organizations | 27 | 1.7% |
| Local Government Employees | 361 | 23.1% |
| State Government Employees | 89 | 5.7% |
| Federal Government Employees | 7 | 0.4% |
| Unpaid Family Workers | 0 | 0.0% |
| Total | 1,566 | 100.0% |
Employment Status by Age in Lakeport
According to the labor force statistics for Lakeport, out of the total population over 16 years of age (4,136), 42.0% or 1,737 individuals are in the labor force, with 4.5% or 78 of them unemployed. The age group with the highest labor force participation rate is 45 to 54 years, with 80.2% or 401 individuals in the labor force. Within the labor force, the 30 to 34 years age range has the highest percentage of unemployed individuals, with 28.2% or 59 of them being unemployed.
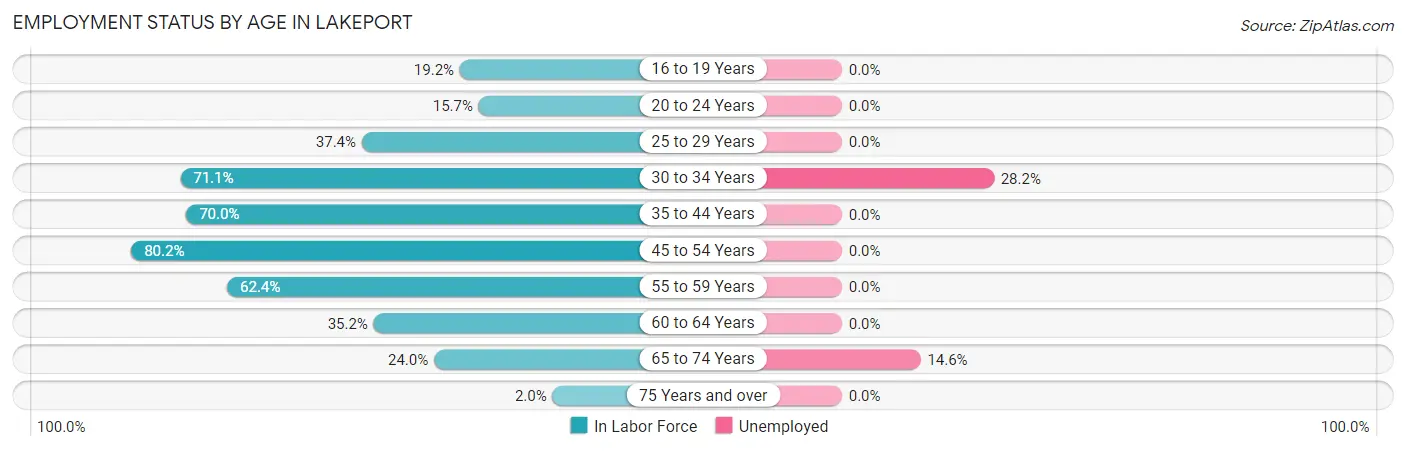
| Age Bracket | In Labor Force | Unemployed |
| 16 to 19 Years | 55 (19.2%) | 0 (0.0%) |
| 20 to 24 Years | 51 (15.7%) | 0 (0.0%) |
| 25 to 29 Years | 52 (37.4%) | 0 (0.0%) |
| 30 to 34 Years | 209 (71.1%) | 59 (28.2%) |
| 35 to 44 Years | 482 (70.0%) | 0 (0.0%) |
| 45 to 54 Years | 401 (80.2%) | 0 (0.0%) |
| 55 to 59 Years | 169 (62.4%) | 0 (0.0%) |
| 60 to 64 Years | 177 (35.2%) | 0 (0.0%) |
| 65 to 74 Years | 130 (24.0%) | 19 (14.6%) |
| 75 Years and over | 12 (2.0%) | 0 (0.0%) |
| Total | 1,737 (42.0%) | 78 (4.5%) |
Employment Status by Educational Attainment in Lakeport
According to labor force statistics for Lakeport, 62.2% of individuals (1,490) out of the total population between 25 and 64 years of age (2,396) are in the labor force, with 4.0% or 60 of them being unemployed. The group with the highest labor force participation rate are those with the educational attainment of bachelor's degree or higher, with 91.4% or 648 individuals in the labor force. Within the labor force, individuals with high school diploma education have the highest percentage of unemployment, with 8.2% or 31 of them being unemployed.
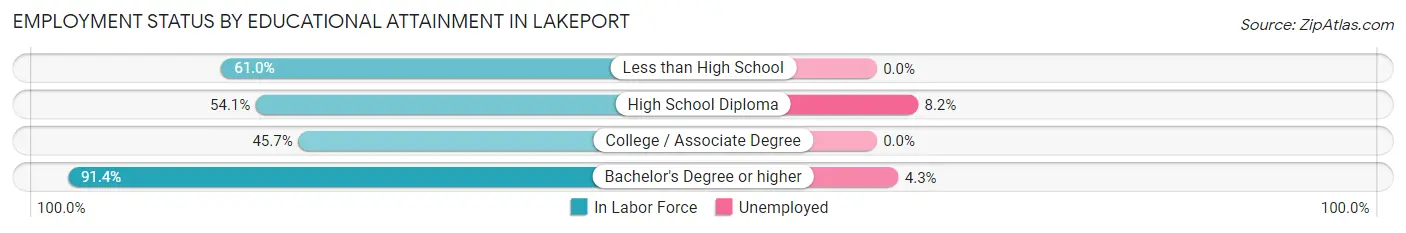
| Educational Attainment | In Labor Force | Unemployed |
| Less than High School | 50 (61.0%) | 0 (0.0%) |
| High School Diploma | 378 (54.1%) | 57 (8.2%) |
| College / Associate Degree | 414 (45.7%) | 0 (0.0%) |
| Bachelor's Degree or higher | 648 (91.4%) | 30 (4.3%) |
| Total | 1,490 (62.2%) | 96 (4.0%) |
Employment Occupations by Sex in Lakeport
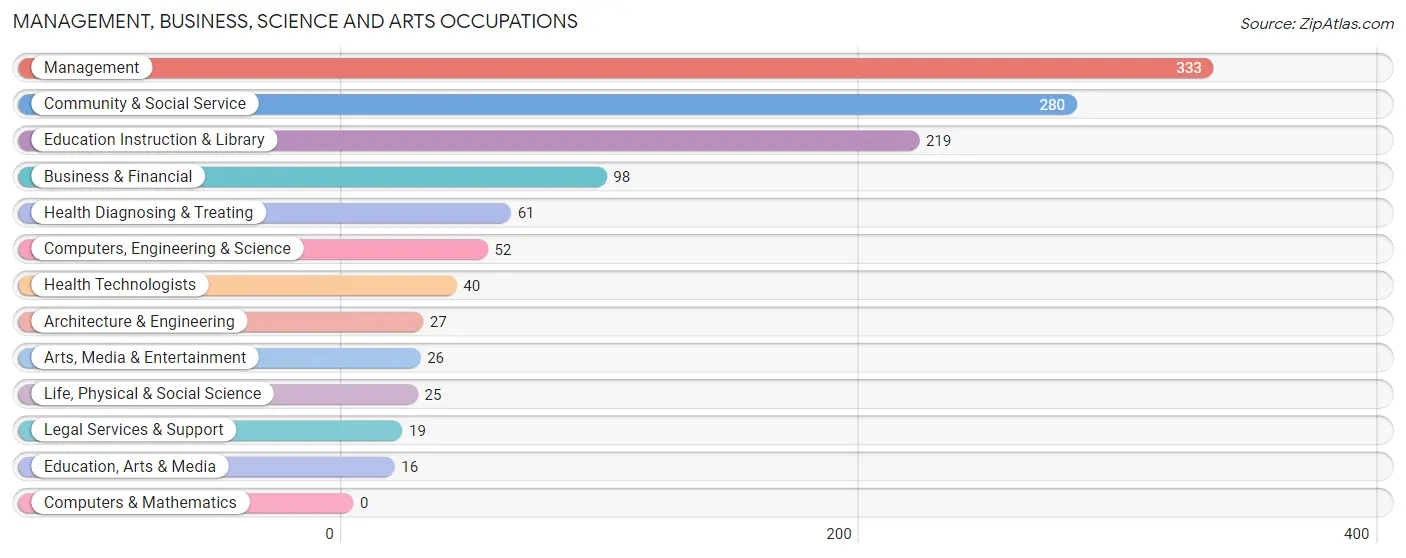
Management, Business, Science and Arts Occupations
The most common Management, Business, Science and Arts occupations in Lakeport are Management (333 | 20.1%), Community & Social Service (280 | 16.9%), Education Instruction & Library (219 | 13.2%), Business & Financial (98 | 5.9%), and Health Diagnosing & Treating (61 | 3.7%).
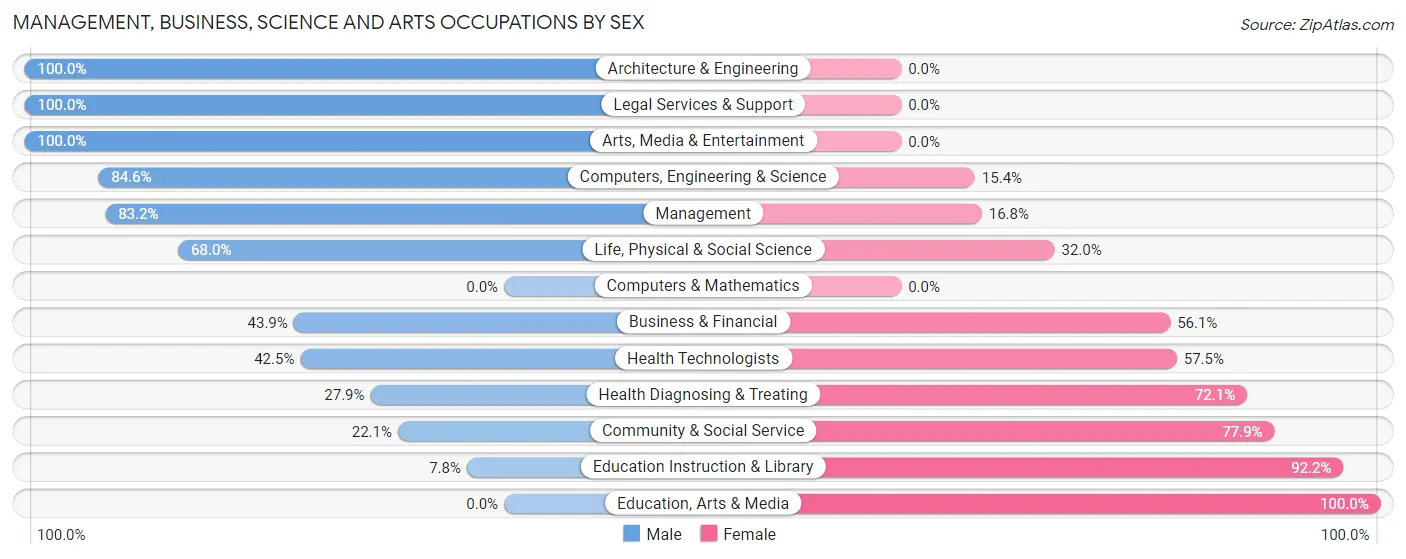
Management, Business, Science and Arts Occupations by Sex
Within the Management, Business, Science and Arts occupations in Lakeport, the most male-oriented occupations are Architecture & Engineering (100.0%), Legal Services & Support (100.0%), and Arts, Media & Entertainment (100.0%), while the most female-oriented occupations are Education, Arts & Media (100.0%), Education Instruction & Library (92.2%), and Community & Social Service (77.9%).
| Occupation | Male | Female |
| Management | 277 (83.2%) | 56 (16.8%) |
| Business & Financial | 43 (43.9%) | 55 (56.1%) |
| Computers, Engineering & Science | 44 (84.6%) | 8 (15.4%) |
| Computers & Mathematics | 0 (0.0%) | 0 (0.0%) |
| Architecture & Engineering | 27 (100.0%) | 0 (0.0%) |
| Life, Physical & Social Science | 17 (68.0%) | 8 (32.0%) |
| Community & Social Service | 62 (22.1%) | 218 (77.9%) |
| Education, Arts & Media | 0 (0.0%) | 16 (100.0%) |
| Legal Services & Support | 19 (100.0%) | 0 (0.0%) |
| Education Instruction & Library | 17 (7.8%) | 202 (92.2%) |
| Arts, Media & Entertainment | 26 (100.0%) | 0 (0.0%) |
| Health Diagnosing & Treating | 17 (27.9%) | 44 (72.1%) |
| Health Technologists | 17 (42.5%) | 23 (57.5%) |
| Total (Category) | 443 (53.8%) | 381 (46.2%) |
| Total (Overall) | 848 (51.1%) | 812 (48.9%) |
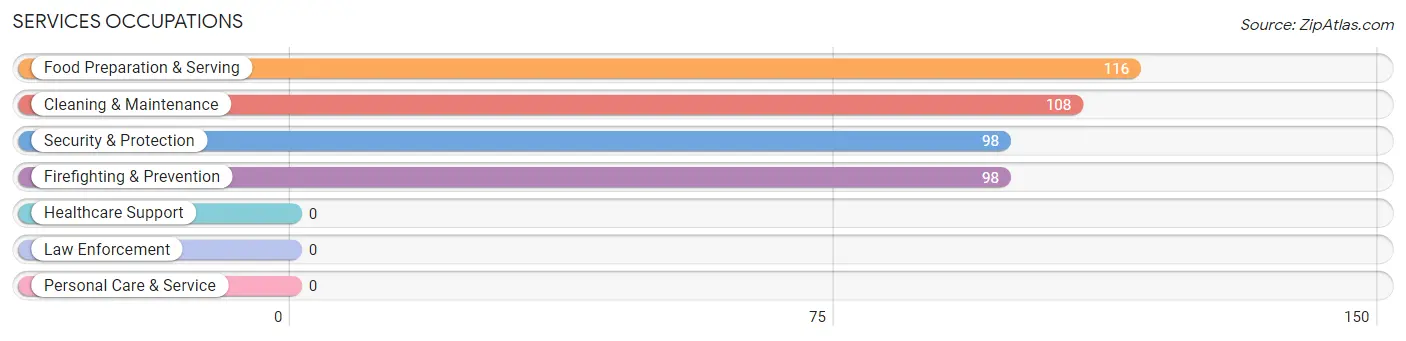
Services Occupations
The most common Services occupations in Lakeport are Food Preparation & Serving (116 | 7.0%), Cleaning & Maintenance (108 | 6.5%), Security & Protection (98 | 5.9%), and Firefighting & Prevention (98 | 5.9%).
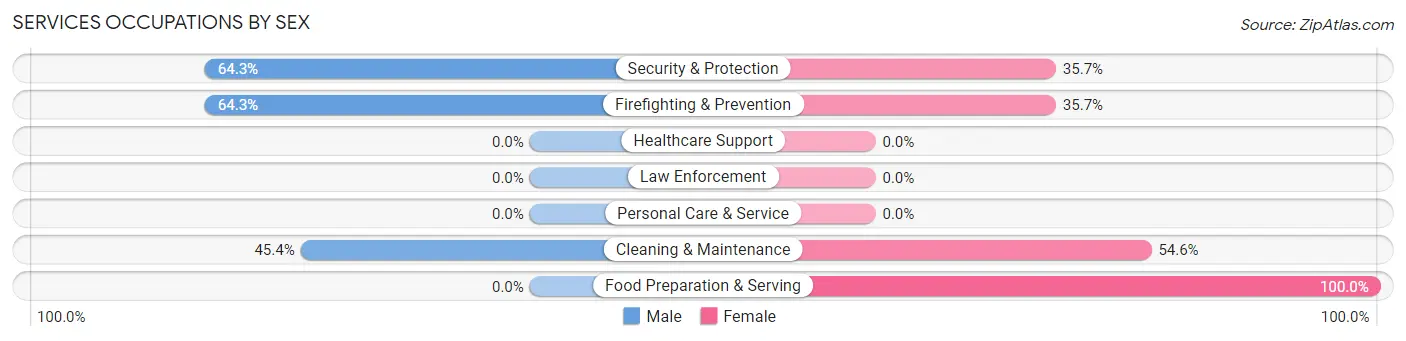
Services Occupations by Sex
Within the Services occupations in Lakeport, the most male-oriented occupations are Security & Protection (64.3%), Firefighting & Prevention (64.3%), and Cleaning & Maintenance (45.4%), while the most female-oriented occupations are Food Preparation & Serving (100.0%), Cleaning & Maintenance (54.6%), and Security & Protection (35.7%).
| Occupation | Male | Female |
| Healthcare Support | 0 (0.0%) | 0 (0.0%) |
| Security & Protection | 63 (64.3%) | 35 (35.7%) |
| Firefighting & Prevention | 63 (64.3%) | 35 (35.7%) |
| Law Enforcement | 0 (0.0%) | 0 (0.0%) |
| Food Preparation & Serving | 0 (0.0%) | 116 (100.0%) |
| Cleaning & Maintenance | 49 (45.4%) | 59 (54.6%) |
| Personal Care & Service | 0 (0.0%) | 0 (0.0%) |
| Total (Category) | 112 (34.8%) | 210 (65.2%) |
| Total (Overall) | 848 (51.1%) | 812 (48.9%) |
Sales and Office Occupations
The most common Sales and Office occupations in Lakeport are Office & Administration (155 | 9.3%), and Sales & Related (72 | 4.3%).
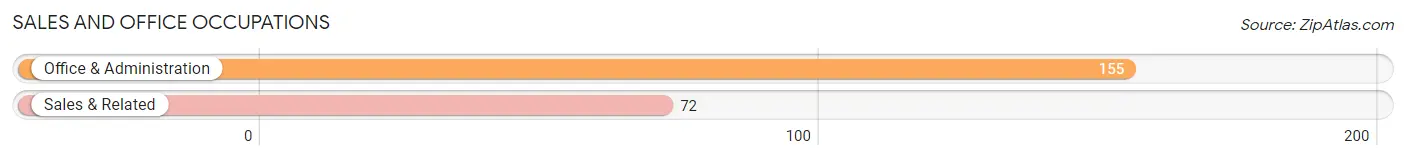
Sales and Office Occupations by Sex

| Occupation | Male | Female |
| Sales & Related | 60 (83.3%) | 12 (16.7%) |
| Office & Administration | 19 (12.3%) | 136 (87.7%) |
| Total (Category) | 79 (34.8%) | 148 (65.2%) |
| Total (Overall) | 848 (51.1%) | 812 (48.9%) |
Natural Resources, Construction and Maintenance Occupations
The most common Natural Resources, Construction and Maintenance occupations in Lakeport are Installation, Maintenance & Repair (57 | 3.4%), and Construction & Extraction (33 | 2.0%).
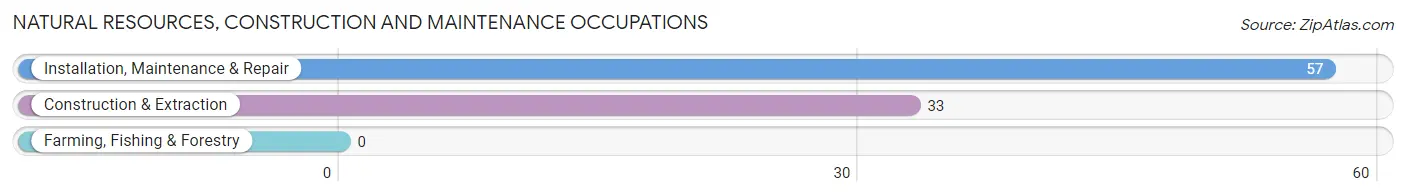
Natural Resources, Construction and Maintenance Occupations by Sex
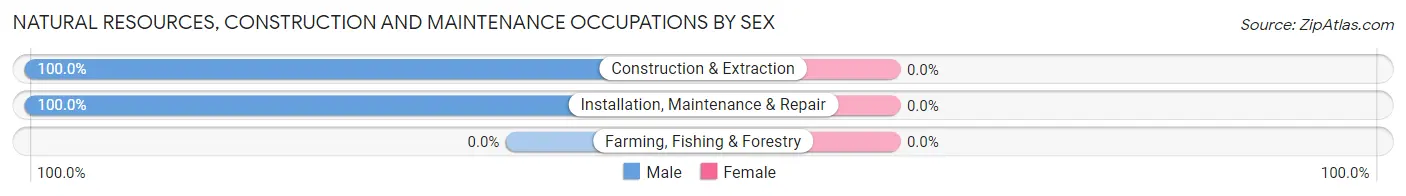
| Occupation | Male | Female |
| Farming, Fishing & Forestry | 0 (0.0%) | 0 (0.0%) |
| Construction & Extraction | 33 (100.0%) | 0 (0.0%) |
| Installation, Maintenance & Repair | 57 (100.0%) | 0 (0.0%) |
| Total (Category) | 90 (100.0%) | 0 (0.0%) |
| Total (Overall) | 848 (51.1%) | 812 (48.9%) |
Production, Transportation and Moving Occupations
The most common Production, Transportation and Moving occupations in Lakeport are Transportation (158 | 9.5%), Production (22 | 1.3%), and Material Moving (17 | 1.0%).
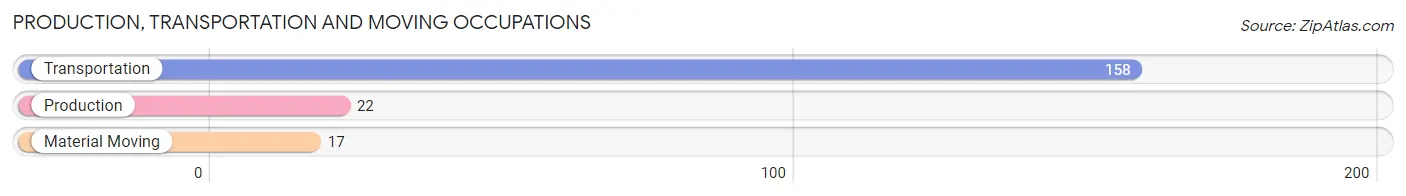
Production, Transportation and Moving Occupations by Sex
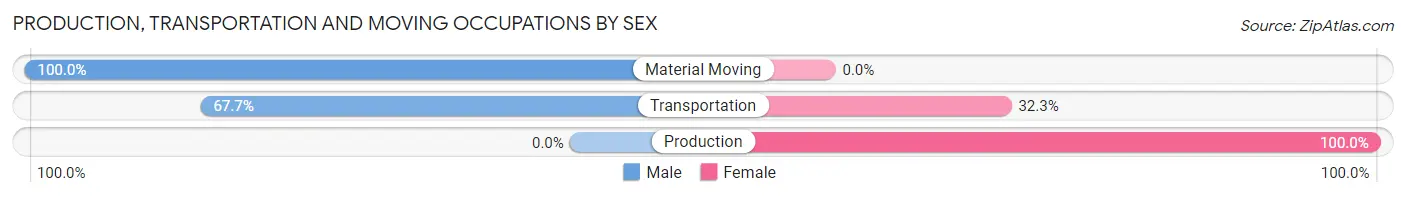
| Occupation | Male | Female |
| Production | 0 (0.0%) | 22 (100.0%) |
| Transportation | 107 (67.7%) | 51 (32.3%) |
| Material Moving | 17 (100.0%) | 0 (0.0%) |
| Total (Category) | 124 (62.9%) | 73 (37.1%) |
| Total (Overall) | 848 (51.1%) | 812 (48.9%) |
Employment Industries by Sex in Lakeport
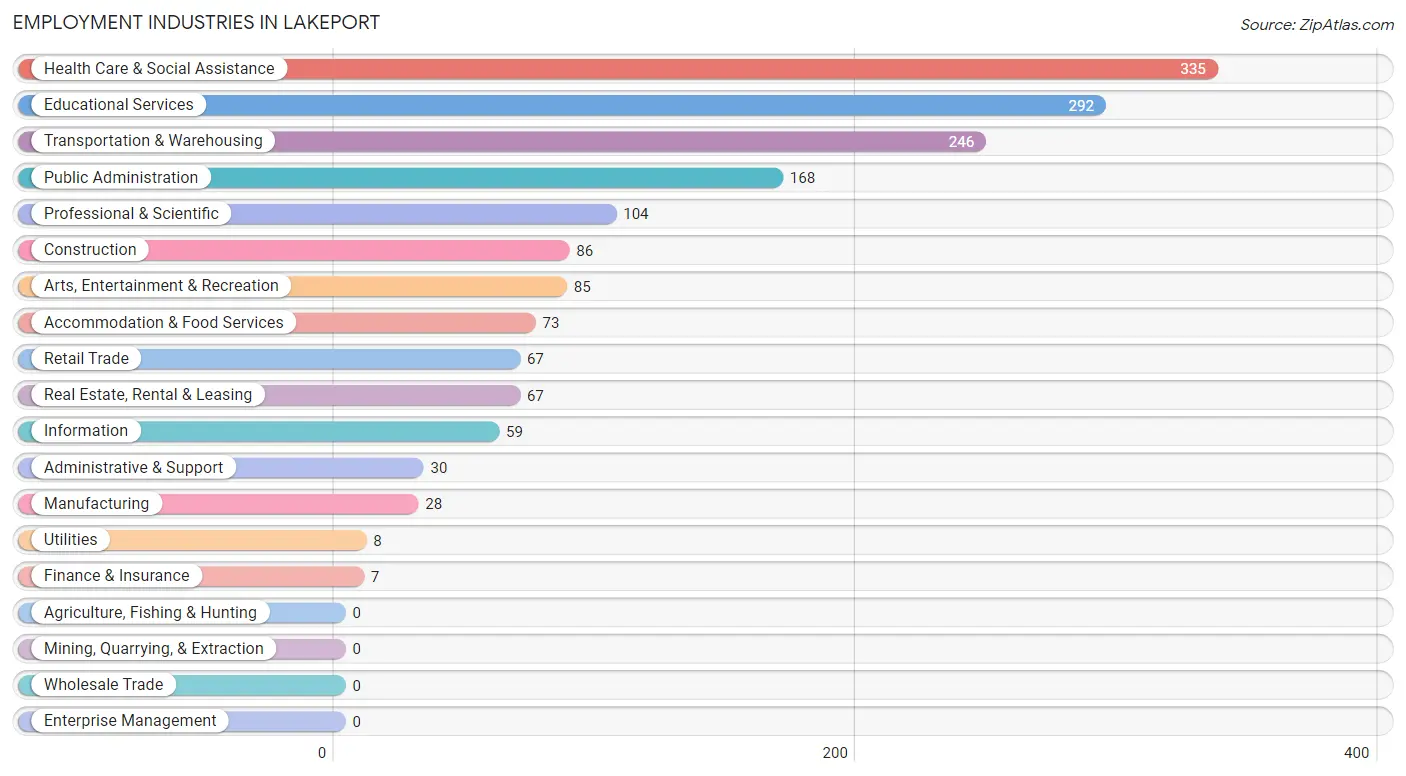
Employment Industries in Lakeport
The major employment industries in Lakeport include Health Care & Social Assistance (335 | 20.2%), Educational Services (292 | 17.6%), Transportation & Warehousing (246 | 14.8%), Public Administration (168 | 10.1%), and Professional & Scientific (104 | 6.3%).
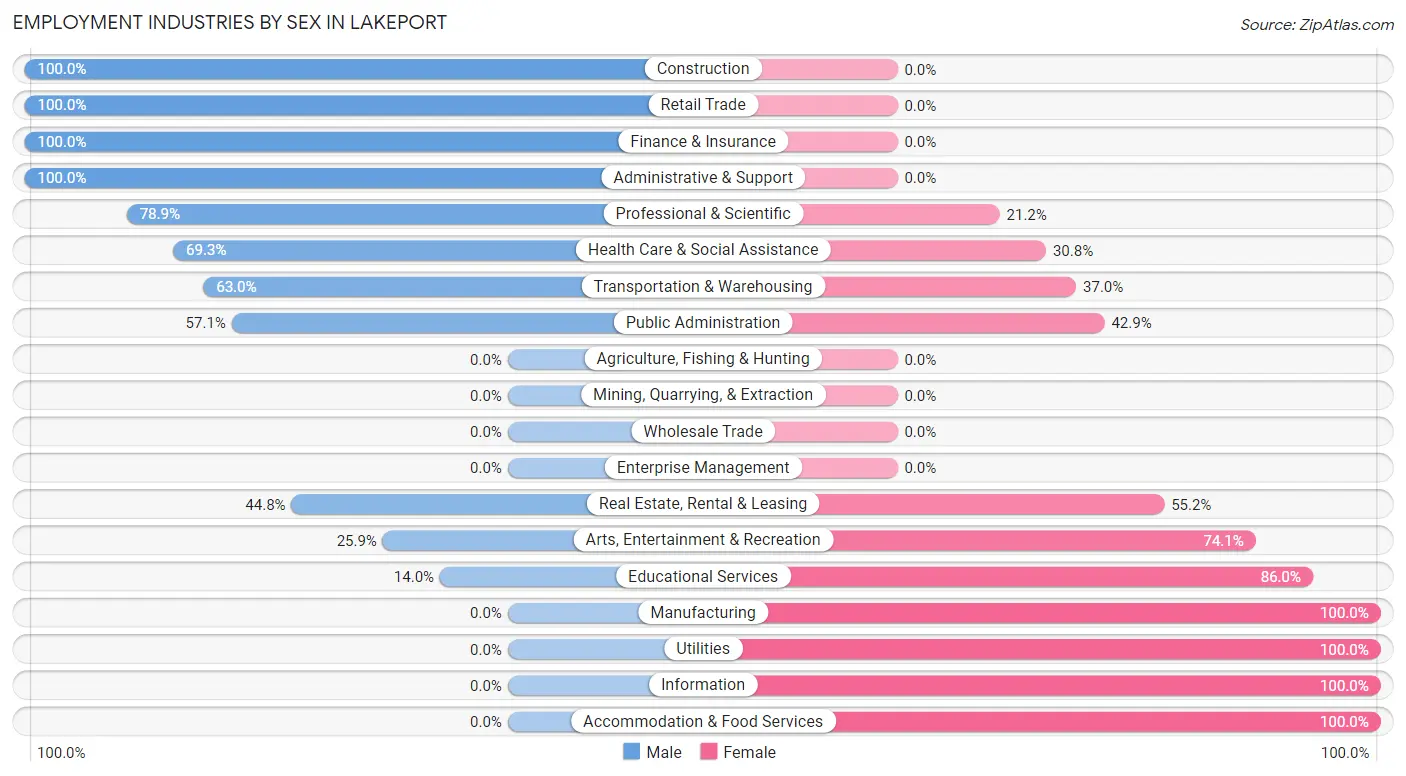
Employment Industries by Sex in Lakeport
The Lakeport industries that see more men than women are Construction (100.0%), Retail Trade (100.0%), and Finance & Insurance (100.0%), whereas the industries that tend to have a higher number of women are Manufacturing (100.0%), Utilities (100.0%), and Information (100.0%).
| Industry | Male | Female |
| Agriculture, Fishing & Hunting | 0 (0.0%) | 0 (0.0%) |
| Mining, Quarrying, & Extraction | 0 (0.0%) | 0 (0.0%) |
| Construction | 86 (100.0%) | 0 (0.0%) |
| Manufacturing | 0 (0.0%) | 28 (100.0%) |
| Wholesale Trade | 0 (0.0%) | 0 (0.0%) |
| Retail Trade | 67 (100.0%) | 0 (0.0%) |
| Transportation & Warehousing | 155 (63.0%) | 91 (37.0%) |
| Utilities | 0 (0.0%) | 8 (100.0%) |
| Information | 0 (0.0%) | 59 (100.0%) |
| Finance & Insurance | 7 (100.0%) | 0 (0.0%) |
| Real Estate, Rental & Leasing | 30 (44.8%) | 37 (55.2%) |
| Professional & Scientific | 82 (78.8%) | 22 (21.1%) |
| Enterprise Management | 0 (0.0%) | 0 (0.0%) |
| Administrative & Support | 30 (100.0%) | 0 (0.0%) |
| Educational Services | 41 (14.0%) | 251 (86.0%) |
| Health Care & Social Assistance | 232 (69.3%) | 103 (30.7%) |
| Arts, Entertainment & Recreation | 22 (25.9%) | 63 (74.1%) |
| Accommodation & Food Services | 0 (0.0%) | 73 (100.0%) |
| Public Administration | 96 (57.1%) | 72 (42.9%) |
| Total | 848 (51.1%) | 812 (48.9%) |
Education in Lakeport
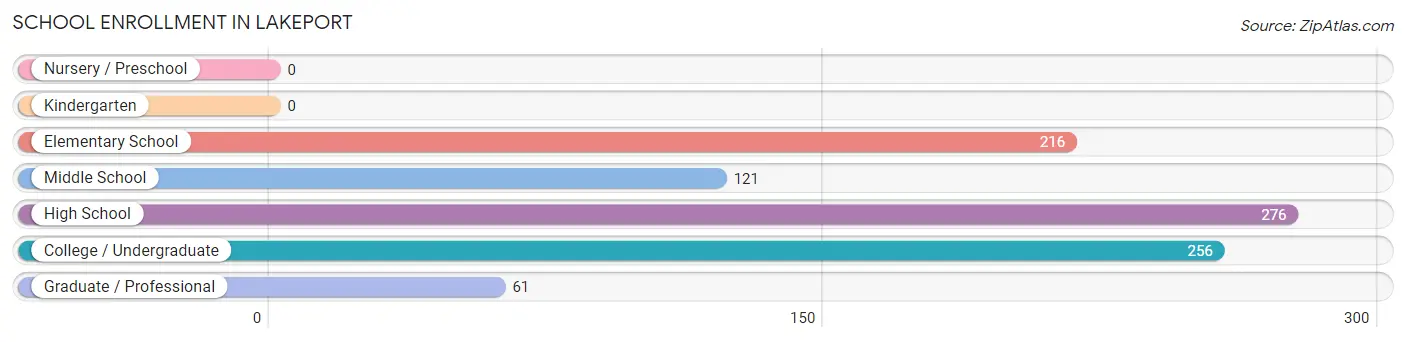
School Enrollment in Lakeport
The most common levels of schooling among the 930 students in Lakeport are high school (276 | 29.7%), college / undergraduate (256 | 27.5%), and elementary school (216 | 23.2%).
| School Level | # Students | % Students |
| Nursery / Preschool | 0 | 0.0% |
| Kindergarten | 0 | 0.0% |
| Elementary School | 216 | 23.2% |
| Middle School | 121 | 13.0% |
| High School | 276 | 29.7% |
| College / Undergraduate | 256 | 27.5% |
| Graduate / Professional | 61 | 6.6% |
| Total | 930 | 100.0% |
School Enrollment by Age by Funding Source in Lakeport
Out of a total of 930 students who are enrolled in schools in Lakeport, 130 (14.0%) attend a private institution, while the remaining 800 (86.0%) are enrolled in public schools. The age group of 35 years and over has the highest likelihood of being enrolled in private schools, with 11 (68.8% in the age bracket) enrolled. Conversely, the age group of 15 to 17 year olds has the lowest likelihood of being enrolled in a private school, with 229 (100.0% in the age bracket) attending a public institution.
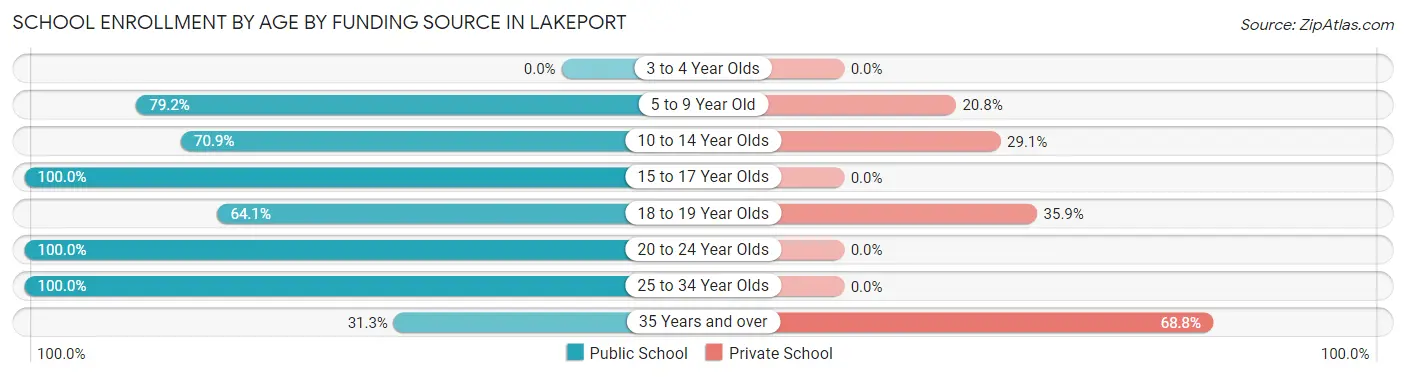
| Age Bracket | Public School | Private School |
| 3 to 4 Year Olds | 0 (0.0%) | 0 (0.0%) |
| 5 to 9 Year Old | 171 (79.2%) | 45 (20.8%) |
| 10 to 14 Year Olds | 124 (70.9%) | 51 (29.1%) |
| 15 to 17 Year Olds | 229 (100.0%) | 0 (0.0%) |
| 18 to 19 Year Olds | 41 (64.1%) | 23 (35.9%) |
| 20 to 24 Year Olds | 169 (100.0%) | 0 (0.0%) |
| 25 to 34 Year Olds | 61 (100.0%) | 0 (0.0%) |
| 35 Years and over | 5 (31.2%) | 11 (68.8%) |
| Total | 800 (86.0%) | 130 (14.0%) |
Educational Attainment by Field of Study in Lakeport
Liberal arts & history (234 | 23.5%), education (165 | 16.6%), business (136 | 13.7%), psychology (105 | 10.6%), and science & technology (83 | 8.4%) are the most common fields of study among 994 individuals in Lakeport who have obtained a bachelor's degree or higher.
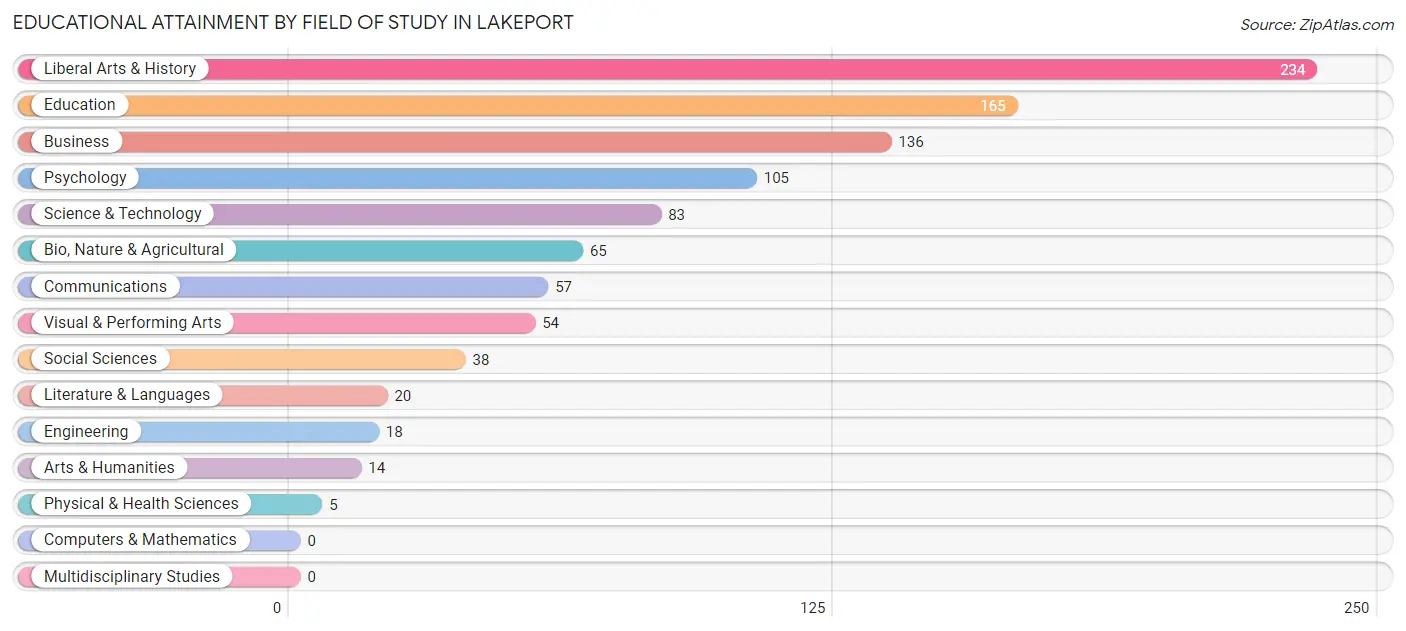
| Field of Study | # Graduates | % Graduates |
| Computers & Mathematics | 0 | 0.0% |
| Bio, Nature & Agricultural | 65 | 6.5% |
| Physical & Health Sciences | 5 | 0.5% |
| Psychology | 105 | 10.6% |
| Social Sciences | 38 | 3.8% |
| Engineering | 18 | 1.8% |
| Multidisciplinary Studies | 0 | 0.0% |
| Science & Technology | 83 | 8.4% |
| Business | 136 | 13.7% |
| Education | 165 | 16.6% |
| Literature & Languages | 20 | 2.0% |
| Liberal Arts & History | 234 | 23.5% |
| Visual & Performing Arts | 54 | 5.4% |
| Communications | 57 | 5.7% |
| Arts & Humanities | 14 | 1.4% |
| Total | 994 | 100.0% |
Transportation & Commute in Lakeport
Vehicle Availability by Sex in Lakeport
The most prevalent vehicle ownership categories in Lakeport are males with 2 vehicles (440, accounting for 53.1%) and females with 2 vehicles (226, making up 60.2%).
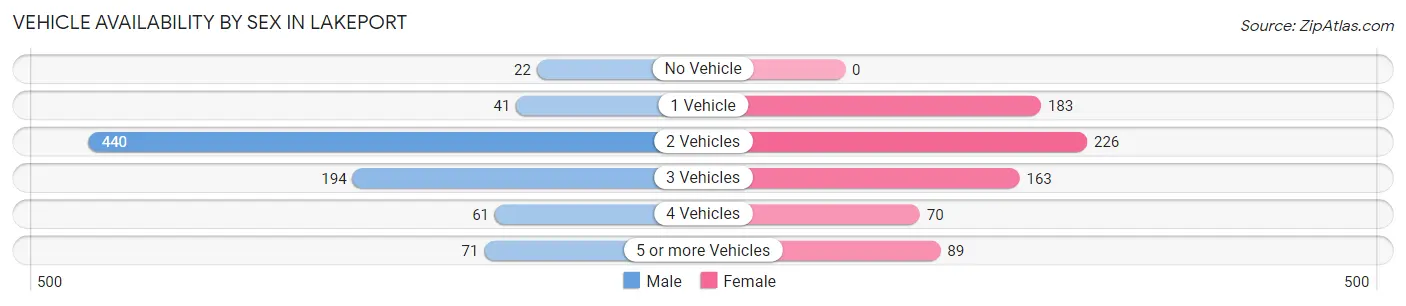
| Vehicles Available | Male | Female |
| No Vehicle | 22 (2.6%) | 0 (0.0%) |
| 1 Vehicle | 41 (5.0%) | 183 (25.0%) |
| 2 Vehicles | 440 (53.1%) | 226 (30.9%) |
| 3 Vehicles | 194 (23.4%) | 163 (22.3%) |
| 4 Vehicles | 61 (7.4%) | 70 (9.6%) |
| 5 or more Vehicles | 71 (8.6%) | 89 (12.2%) |
| Total | 829 (100.0%) | 731 (100.0%) |
Commute Time in Lakeport
The most frequently occuring commute durations in Lakeport are 5 to 9 minutes (507 commuters, 41.0%), 15 to 19 minutes (249 commuters, 20.2%), and 10 to 14 minutes (134 commuters, 10.8%).
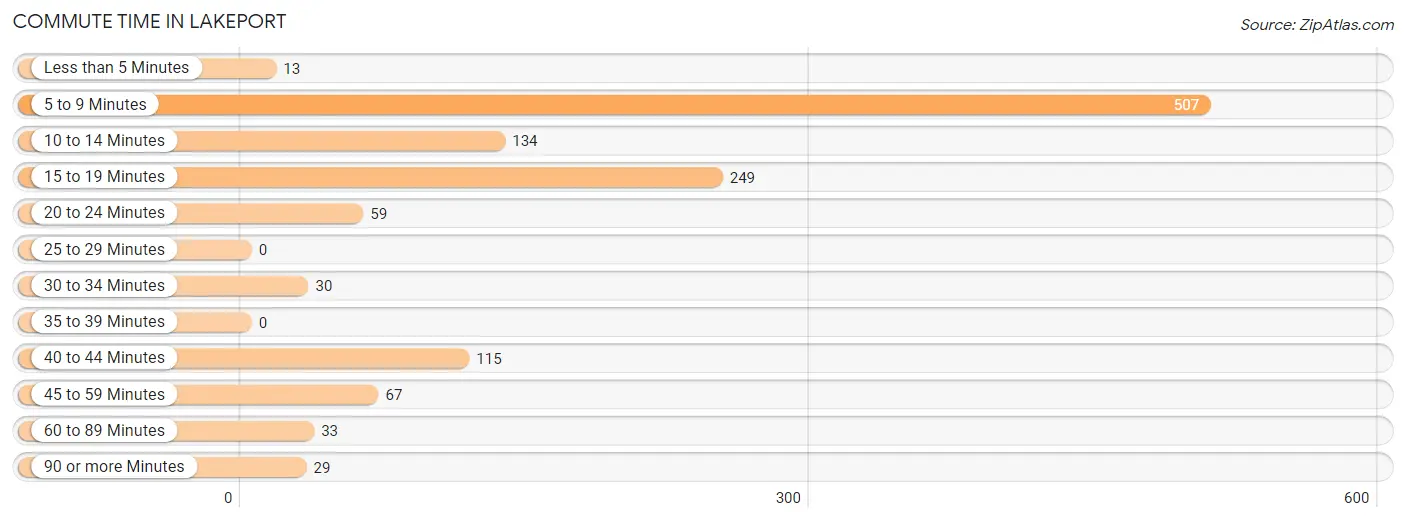
| Commute Time | # Commuters | % Commuters |
| Less than 5 Minutes | 13 | 1.1% |
| 5 to 9 Minutes | 507 | 41.0% |
| 10 to 14 Minutes | 134 | 10.8% |
| 15 to 19 Minutes | 249 | 20.2% |
| 20 to 24 Minutes | 59 | 4.8% |
| 25 to 29 Minutes | 0 | 0.0% |
| 30 to 34 Minutes | 30 | 2.4% |
| 35 to 39 Minutes | 0 | 0.0% |
| 40 to 44 Minutes | 115 | 9.3% |
| 45 to 59 Minutes | 67 | 5.4% |
| 60 to 89 Minutes | 33 | 2.7% |
| 90 or more Minutes | 29 | 2.4% |
Commute Time by Sex in Lakeport
The most common commute times in Lakeport are 5 to 9 minutes (256 commuters, 44.6%) for males and 5 to 9 minutes (251 commuters, 37.9%) for females.
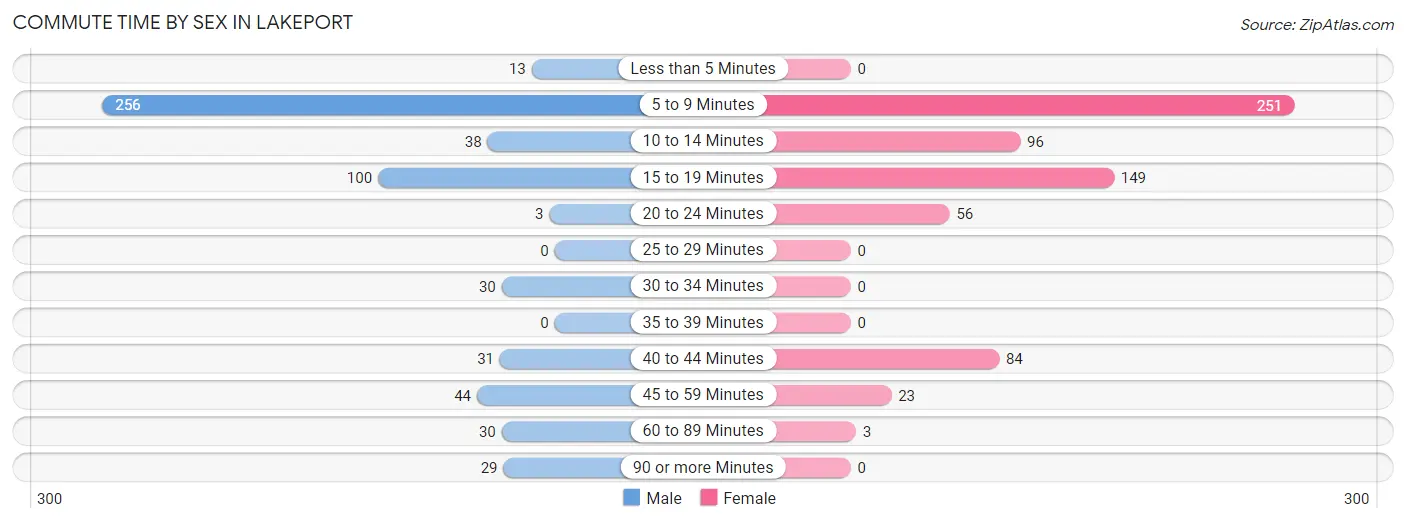
| Commute Time | Male | Female |
| Less than 5 Minutes | 13 (2.3%) | 0 (0.0%) |
| 5 to 9 Minutes | 256 (44.6%) | 251 (37.9%) |
| 10 to 14 Minutes | 38 (6.6%) | 96 (14.5%) |
| 15 to 19 Minutes | 100 (17.4%) | 149 (22.5%) |
| 20 to 24 Minutes | 3 (0.5%) | 56 (8.5%) |
| 25 to 29 Minutes | 0 (0.0%) | 0 (0.0%) |
| 30 to 34 Minutes | 30 (5.2%) | 0 (0.0%) |
| 35 to 39 Minutes | 0 (0.0%) | 0 (0.0%) |
| 40 to 44 Minutes | 31 (5.4%) | 84 (12.7%) |
| 45 to 59 Minutes | 44 (7.7%) | 23 (3.5%) |
| 60 to 89 Minutes | 30 (5.2%) | 3 (0.4%) |
| 90 or more Minutes | 29 (5.1%) | 0 (0.0%) |
Time of Departure to Work by Sex in Lakeport
The most frequent times of departure to work in Lakeport are 7:00 AM to 7:29 AM (102, 17.8%) for males and 7:30 AM to 7:59 AM (205, 31.0%) for females.
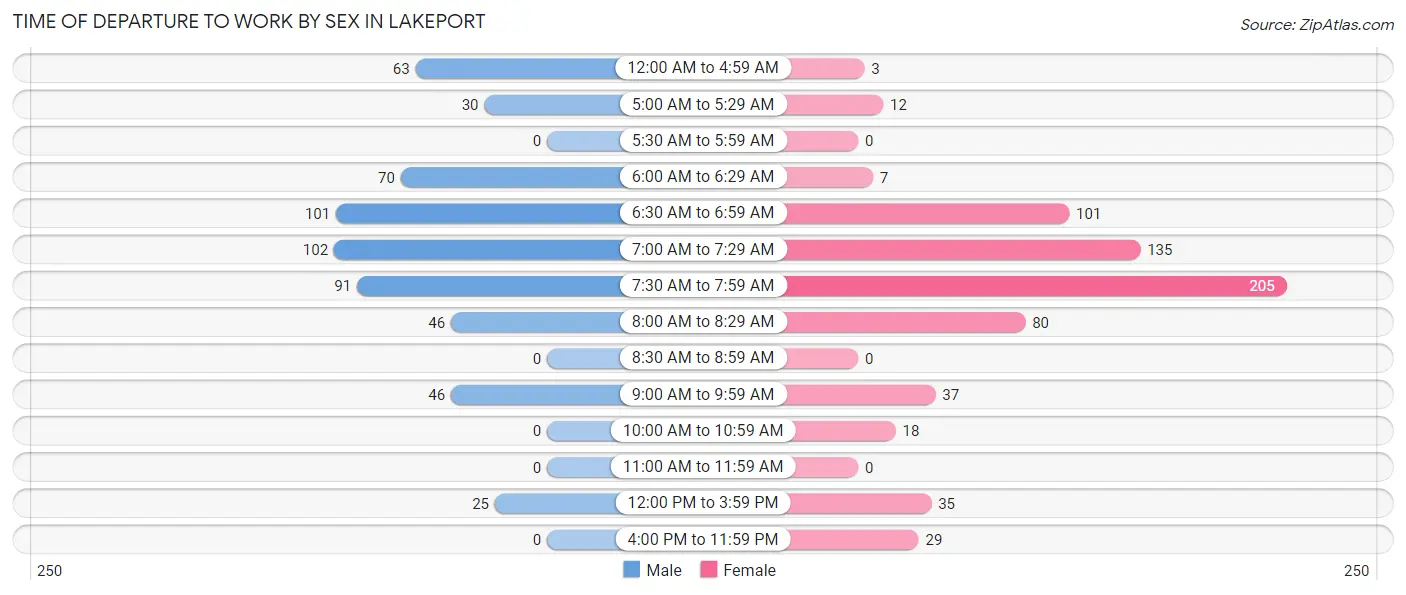
| Time of Departure | Male | Female |
| 12:00 AM to 4:59 AM | 63 (11.0%) | 3 (0.4%) |
| 5:00 AM to 5:29 AM | 30 (5.2%) | 12 (1.8%) |
| 5:30 AM to 5:59 AM | 0 (0.0%) | 0 (0.0%) |
| 6:00 AM to 6:29 AM | 70 (12.2%) | 7 (1.1%) |
| 6:30 AM to 6:59 AM | 101 (17.6%) | 101 (15.3%) |
| 7:00 AM to 7:29 AM | 102 (17.8%) | 135 (20.4%) |
| 7:30 AM to 7:59 AM | 91 (15.9%) | 205 (31.0%) |
| 8:00 AM to 8:29 AM | 46 (8.0%) | 80 (12.1%) |
| 8:30 AM to 8:59 AM | 0 (0.0%) | 0 (0.0%) |
| 9:00 AM to 9:59 AM | 46 (8.0%) | 37 (5.6%) |
| 10:00 AM to 10:59 AM | 0 (0.0%) | 18 (2.7%) |
| 11:00 AM to 11:59 AM | 0 (0.0%) | 0 (0.0%) |
| 12:00 PM to 3:59 PM | 25 (4.4%) | 35 (5.3%) |
| 4:00 PM to 11:59 PM | 0 (0.0%) | 29 (4.4%) |
| Total | 574 (100.0%) | 662 (100.0%) |
Housing Occupancy in Lakeport
Occupancy by Ownership in Lakeport
Of the total 2,144 dwellings in Lakeport, owner-occupied units account for 1,563 (72.9%), while renter-occupied units make up 581 (27.1%).
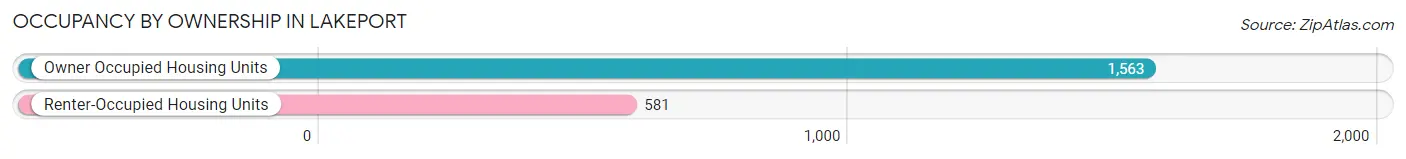
| Occupancy | # Housing Units | % Housing Units |
| Owner Occupied Housing Units | 1,563 | 72.9% |
| Renter-Occupied Housing Units | 581 | 27.1% |
| Total Occupied Housing Units | 2,144 | 100.0% |
Occupancy by Household Size in Lakeport
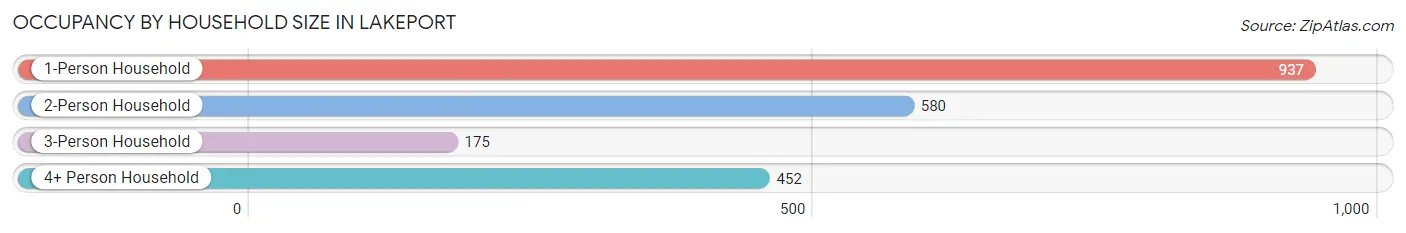
| Household Size | # Housing Units | % Housing Units |
| 1-Person Household | 937 | 43.7% |
| 2-Person Household | 580 | 27.1% |
| 3-Person Household | 175 | 8.2% |
| 4+ Person Household | 452 | 21.1% |
| Total Housing Units | 2,144 | 100.0% |
Occupancy by Ownership by Household Size in Lakeport
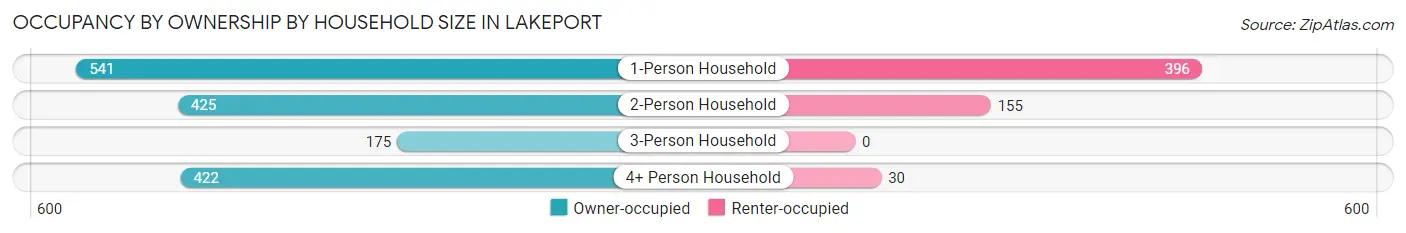
| Household Size | Owner-occupied | Renter-occupied |
| 1-Person Household | 541 (57.7%) | 396 (42.3%) |
| 2-Person Household | 425 (73.3%) | 155 (26.7%) |
| 3-Person Household | 175 (100.0%) | 0 (0.0%) |
| 4+ Person Household | 422 (93.4%) | 30 (6.6%) |
| Total Housing Units | 1,563 (72.9%) | 581 (27.1%) |
Occupancy by Educational Attainment in Lakeport
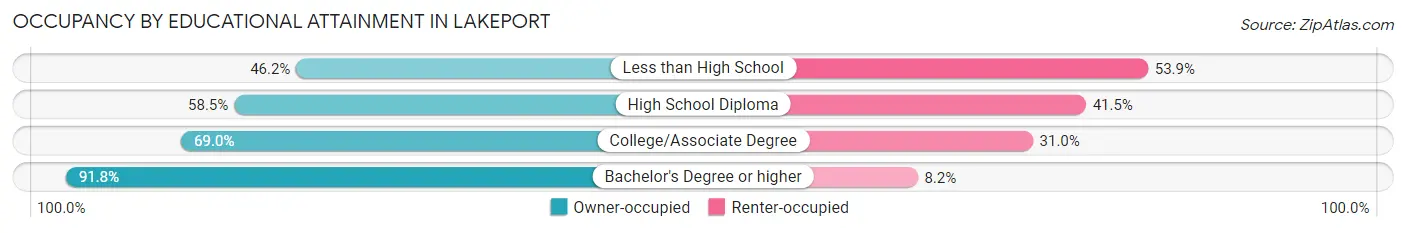
| Household Size | Owner-occupied | Renter-occupied |
| Less than High School | 36 (46.2%) | 42 (53.8%) |
| High School Diploma | 304 (58.5%) | 216 (41.5%) |
| College/Associate Degree | 594 (69.0%) | 267 (31.0%) |
| Bachelor's Degree or higher | 629 (91.8%) | 56 (8.2%) |
Occupancy by Age of Householder in Lakeport
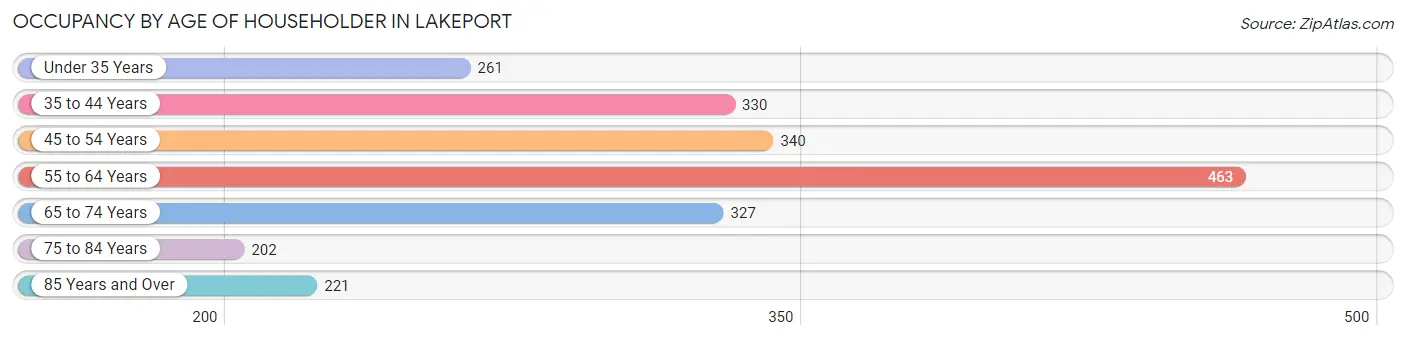
| Age Bracket | # Households | % Households |
| Under 35 Years | 261 | 12.2% |
| 35 to 44 Years | 330 | 15.4% |
| 45 to 54 Years | 340 | 15.9% |
| 55 to 64 Years | 463 | 21.6% |
| 65 to 74 Years | 327 | 15.2% |
| 75 to 84 Years | 202 | 9.4% |
| 85 Years and Over | 221 | 10.3% |
| Total | 2,144 | 100.0% |
Housing Finances in Lakeport
Median Income by Occupancy in Lakeport
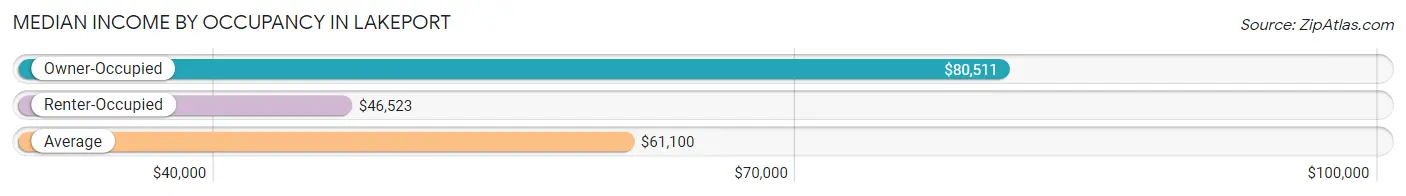
| Occupancy Type | # Households | Median Income |
| Owner-Occupied | 1,563 (72.9%) | $80,511 |
| Renter-Occupied | 581 (27.1%) | $46,523 |
| Average | 2,144 (100.0%) | $61,100 |
Occupancy by Householder Income Bracket in Lakeport
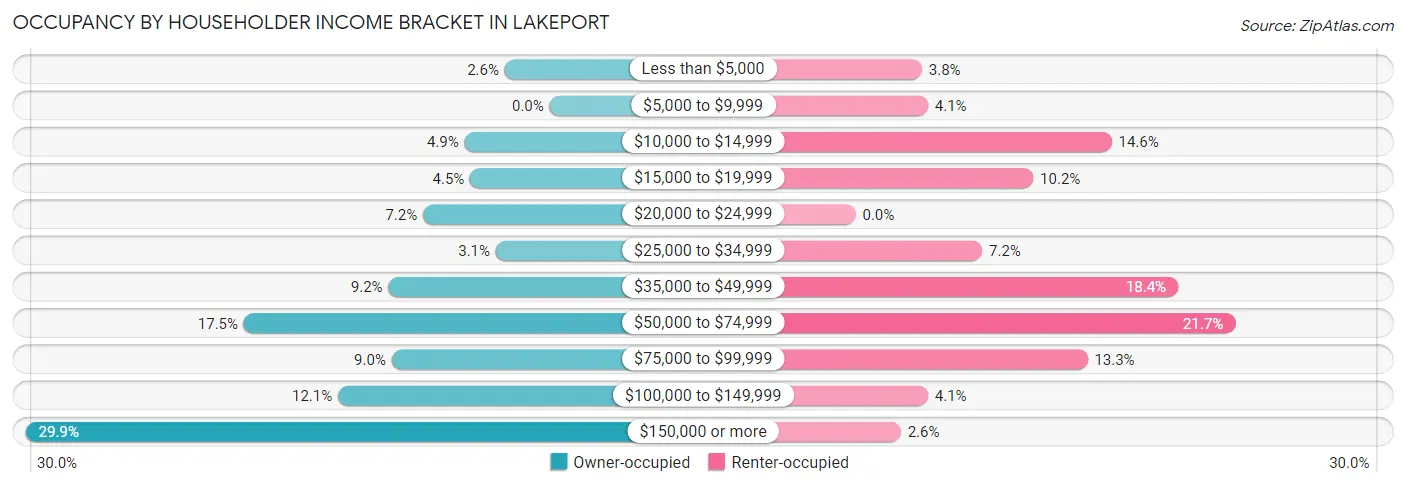
| Income Bracket | Owner-occupied | Renter-occupied |
| Less than $5,000 | 40 (2.6%) | 22 (3.8%) |
| $5,000 to $9,999 | 0 (0.0%) | 24 (4.1%) |
| $10,000 to $14,999 | 76 (4.9%) | 85 (14.6%) |
| $15,000 to $19,999 | 71 (4.5%) | 59 (10.2%) |
| $20,000 to $24,999 | 113 (7.2%) | 0 (0.0%) |
| $25,000 to $34,999 | 48 (3.1%) | 42 (7.2%) |
| $35,000 to $49,999 | 144 (9.2%) | 107 (18.4%) |
| $50,000 to $74,999 | 273 (17.5%) | 126 (21.7%) |
| $75,000 to $99,999 | 141 (9.0%) | 77 (13.3%) |
| $100,000 to $149,999 | 189 (12.1%) | 24 (4.1%) |
| $150,000 or more | 468 (29.9%) | 15 (2.6%) |
| Total | 1,563 (100.0%) | 581 (100.0%) |
Monthly Housing Cost Tiers in Lakeport
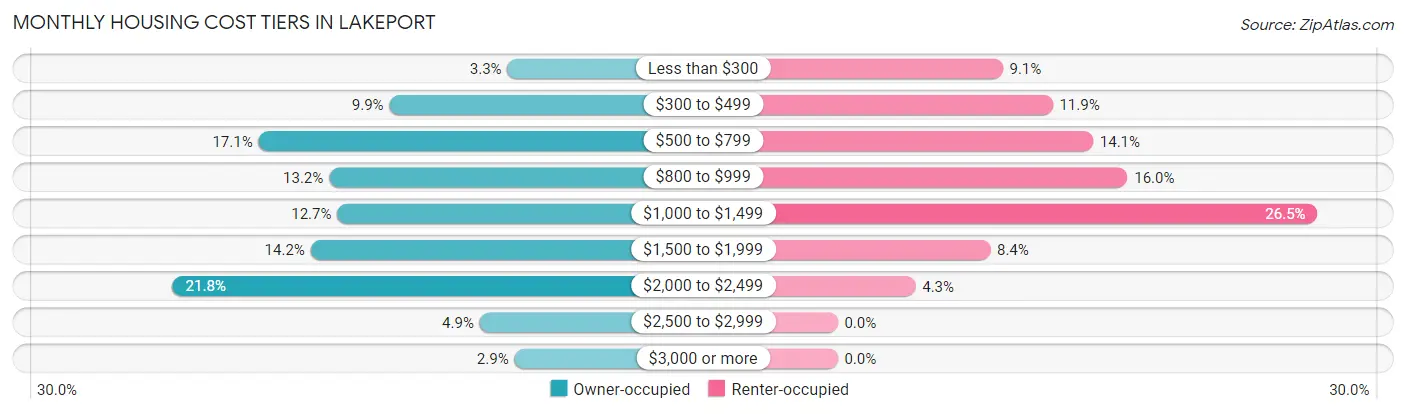
| Monthly Cost | Owner-occupied | Renter-occupied |
| Less than $300 | 52 (3.3%) | 53 (9.1%) |
| $300 to $499 | 154 (9.9%) | 69 (11.9%) |
| $500 to $799 | 267 (17.1%) | 82 (14.1%) |
| $800 to $999 | 206 (13.2%) | 93 (16.0%) |
| $1,000 to $1,499 | 199 (12.7%) | 154 (26.5%) |
| $1,500 to $1,999 | 222 (14.2%) | 49 (8.4%) |
| $2,000 to $2,499 | 341 (21.8%) | 25 (4.3%) |
| $2,500 to $2,999 | 76 (4.9%) | 0 (0.0%) |
| $3,000 or more | 46 (2.9%) | 0 (0.0%) |
| Total | 1,563 (100.0%) | 581 (100.0%) |
Physical Housing Characteristics in Lakeport
Housing Structures in Lakeport
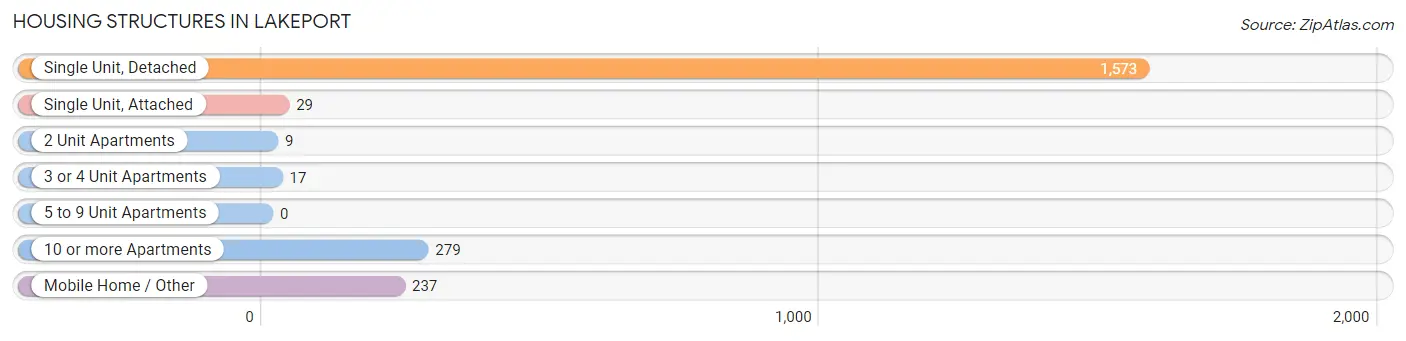
| Structure Type | # Housing Units | % Housing Units |
| Single Unit, Detached | 1,573 | 73.4% |
| Single Unit, Attached | 29 | 1.3% |
| 2 Unit Apartments | 9 | 0.4% |
| 3 or 4 Unit Apartments | 17 | 0.8% |
| 5 to 9 Unit Apartments | 0 | 0.0% |
| 10 or more Apartments | 279 | 13.0% |
| Mobile Home / Other | 237 | 11.1% |
| Total | 2,144 | 100.0% |
Housing Structures by Occupancy in Lakeport
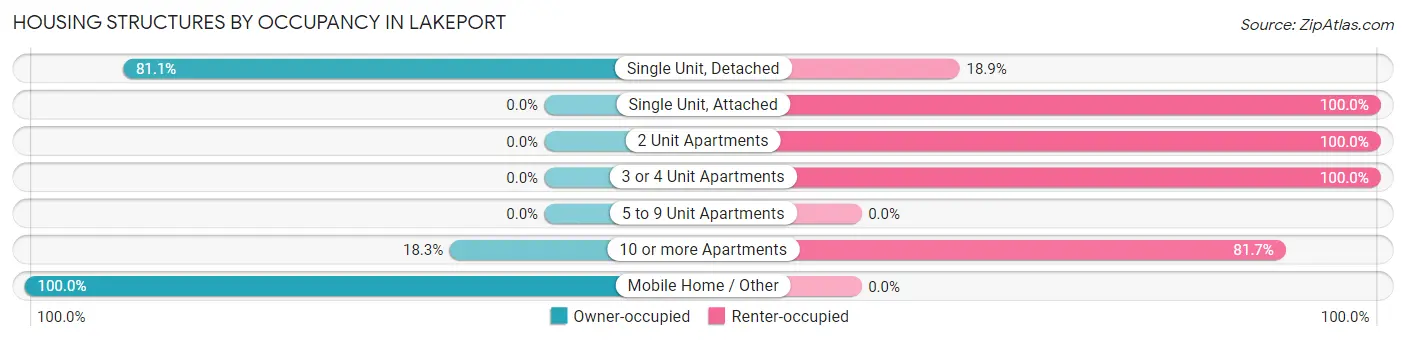
| Structure Type | Owner-occupied | Renter-occupied |
| Single Unit, Detached | 1,275 (81.1%) | 298 (18.9%) |
| Single Unit, Attached | 0 (0.0%) | 29 (100.0%) |
| 2 Unit Apartments | 0 (0.0%) | 9 (100.0%) |
| 3 or 4 Unit Apartments | 0 (0.0%) | 17 (100.0%) |
| 5 to 9 Unit Apartments | 0 (0.0%) | 0 (0.0%) |
| 10 or more Apartments | 51 (18.3%) | 228 (81.7%) |
| Mobile Home / Other | 237 (100.0%) | 0 (0.0%) |
| Total | 1,563 (72.9%) | 581 (27.1%) |
Housing Structures by Number of Rooms in Lakeport
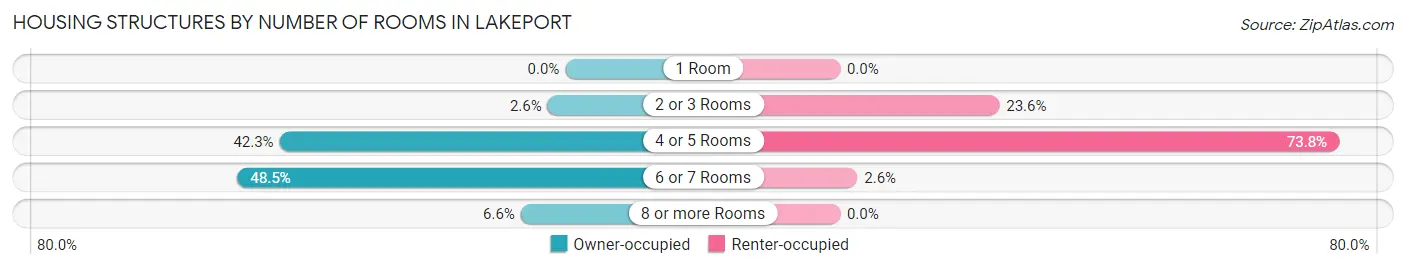
| Number of Rooms | Owner-occupied | Renter-occupied |
| 1 Room | 0 (0.0%) | 0 (0.0%) |
| 2 or 3 Rooms | 41 (2.6%) | 137 (23.6%) |
| 4 or 5 Rooms | 661 (42.3%) | 429 (73.8%) |
| 6 or 7 Rooms | 758 (48.5%) | 15 (2.6%) |
| 8 or more Rooms | 103 (6.6%) | 0 (0.0%) |
| Total | 1,563 (100.0%) | 581 (100.0%) |
Housing Structure by Heating Type in Lakeport
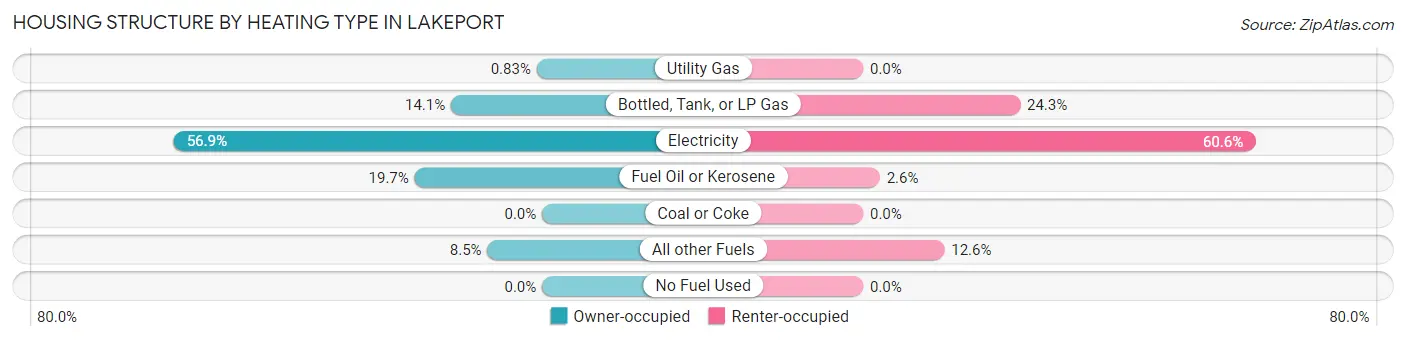
| Heating Type | Owner-occupied | Renter-occupied |
| Utility Gas | 13 (0.8%) | 0 (0.0%) |
| Bottled, Tank, or LP Gas | 220 (14.1%) | 141 (24.3%) |
| Electricity | 890 (56.9%) | 352 (60.6%) |
| Fuel Oil or Kerosene | 308 (19.7%) | 15 (2.6%) |
| Coal or Coke | 0 (0.0%) | 0 (0.0%) |
| All other Fuels | 132 (8.5%) | 73 (12.6%) |
| No Fuel Used | 0 (0.0%) | 0 (0.0%) |
| Total | 1,563 (100.0%) | 581 (100.0%) |
Household Vehicle Usage in Lakeport
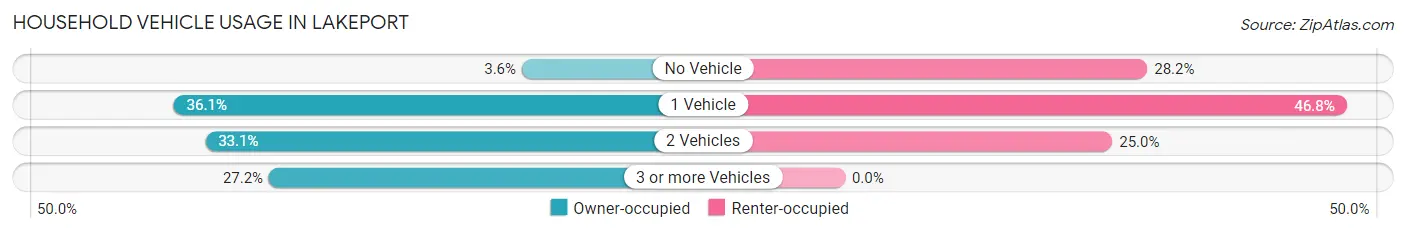
| Vehicles per Household | Owner-occupied | Renter-occupied |
| No Vehicle | 56 (3.6%) | 164 (28.2%) |
| 1 Vehicle | 564 (36.1%) | 272 (46.8%) |
| 2 Vehicles | 518 (33.1%) | 145 (25.0%) |
| 3 or more Vehicles | 425 (27.2%) | 0 (0.0%) |
| Total | 1,563 (100.0%) | 581 (100.0%) |
Real Estate & Mortgages in Lakeport
Real Estate and Mortgage Overview in Lakeport
| Characteristic | Without Mortgage | With Mortgage |
| Housing Units | 723 | 840 |
| Median Property Value | $287,300 | $352,800 |
| Median Household Income | $44,063 | $413 |
| Monthly Housing Costs | $598 | $46 |
| Real Estate Taxes | $2,395 | $51 |
Property Value by Mortgage Status in Lakeport
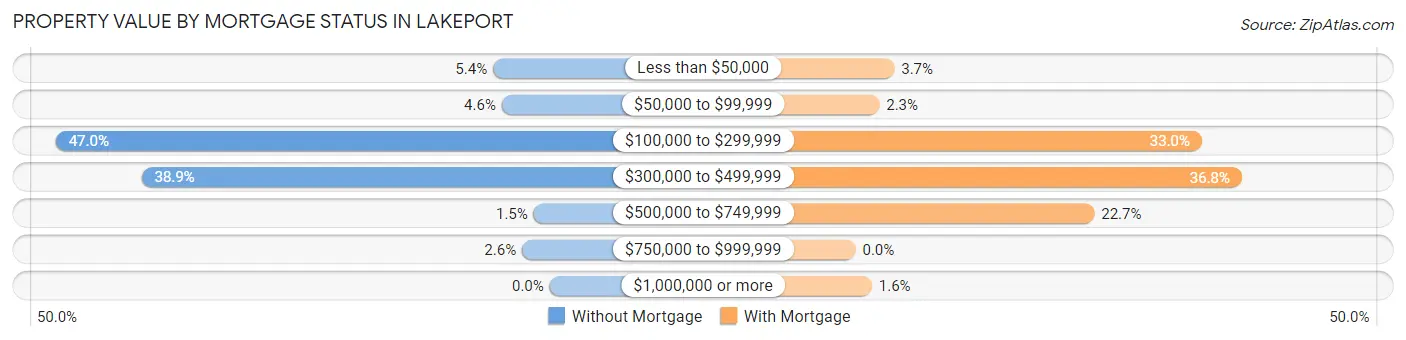
| Property Value | Without Mortgage | With Mortgage |
| Less than $50,000 | 39 (5.4%) | 31 (3.7%) |
| $50,000 to $99,999 | 33 (4.6%) | 19 (2.3%) |
| $100,000 to $299,999 | 340 (47.0%) | 277 (33.0%) |
| $300,000 to $499,999 | 281 (38.9%) | 309 (36.8%) |
| $500,000 to $749,999 | 11 (1.5%) | 191 (22.7%) |
| $750,000 to $999,999 | 19 (2.6%) | 0 (0.0%) |
| $1,000,000 or more | 0 (0.0%) | 13 (1.5%) |
| Total | 723 (100.0%) | 840 (100.0%) |
Household Income by Mortgage Status in Lakeport
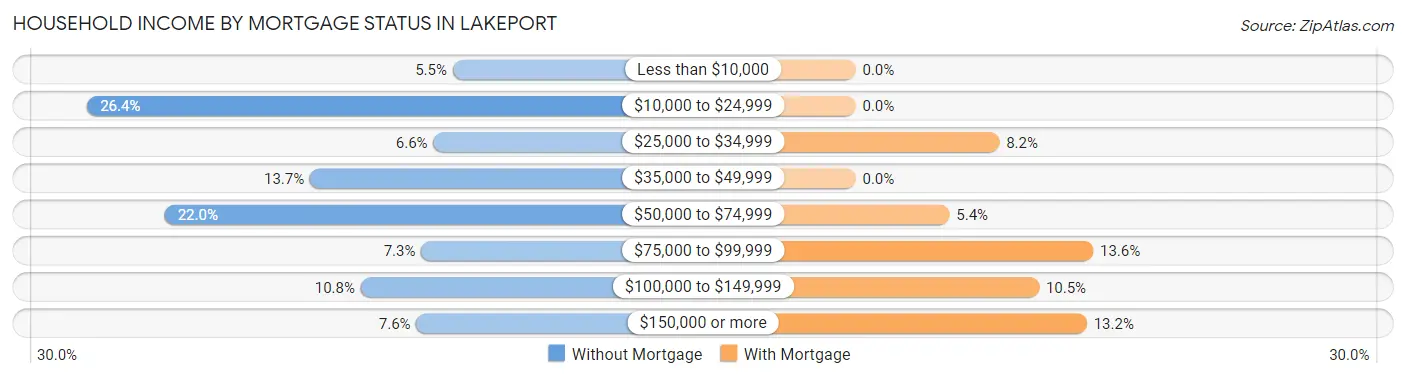
| Household Income | Without Mortgage | With Mortgage |
| Less than $10,000 | 40 (5.5%) | 0 (0.0%) |
| $10,000 to $24,999 | 191 (26.4%) | 0 (0.0%) |
| $25,000 to $34,999 | 48 (6.6%) | 69 (8.2%) |
| $35,000 to $49,999 | 99 (13.7%) | 0 (0.0%) |
| $50,000 to $74,999 | 159 (22.0%) | 45 (5.4%) |
| $75,000 to $99,999 | 53 (7.3%) | 114 (13.6%) |
| $100,000 to $149,999 | 78 (10.8%) | 88 (10.5%) |
| $150,000 or more | 55 (7.6%) | 111 (13.2%) |
| Total | 723 (100.0%) | 840 (100.0%) |
Property Value to Household Income Ratio in Lakeport
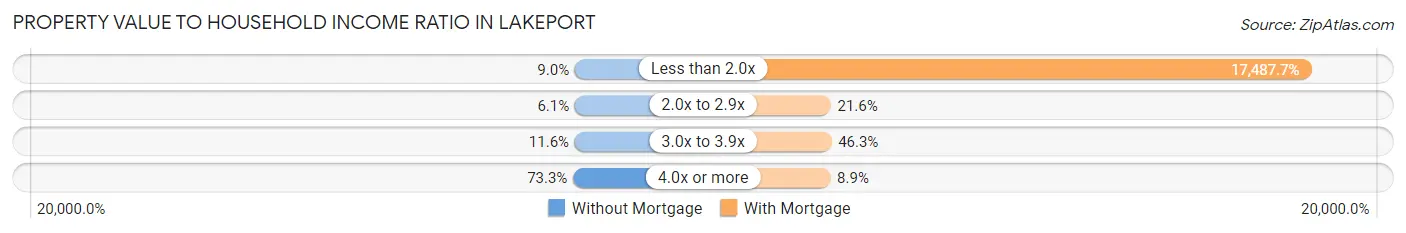
| Value-to-Income Ratio | Without Mortgage | With Mortgage |
| Less than 2.0x | 65 (9.0%) | 146,897 (17,487.7%) |
| 2.0x to 2.9x | 44 (6.1%) | 181 (21.5%) |
| 3.0x to 3.9x | 84 (11.6%) | 389 (46.3%) |
| 4.0x or more | 530 (73.3%) | 75 (8.9%) |
| Total | 723 (100.0%) | 840 (100.0%) |
Real Estate Taxes by Mortgage Status in Lakeport
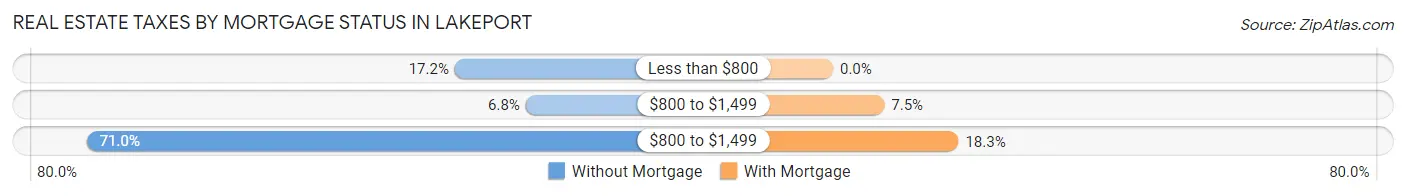
| Property Taxes | Without Mortgage | With Mortgage |
| Less than $800 | 124 (17.2%) | 0 (0.0%) |
| $800 to $1,499 | 49 (6.8%) | 63 (7.5%) |
| $800 to $1,499 | 513 (71.0%) | 154 (18.3%) |
| Total | 723 (100.0%) | 840 (100.0%) |
Health & Disability in Lakeport
Health Insurance Coverage by Age in Lakeport
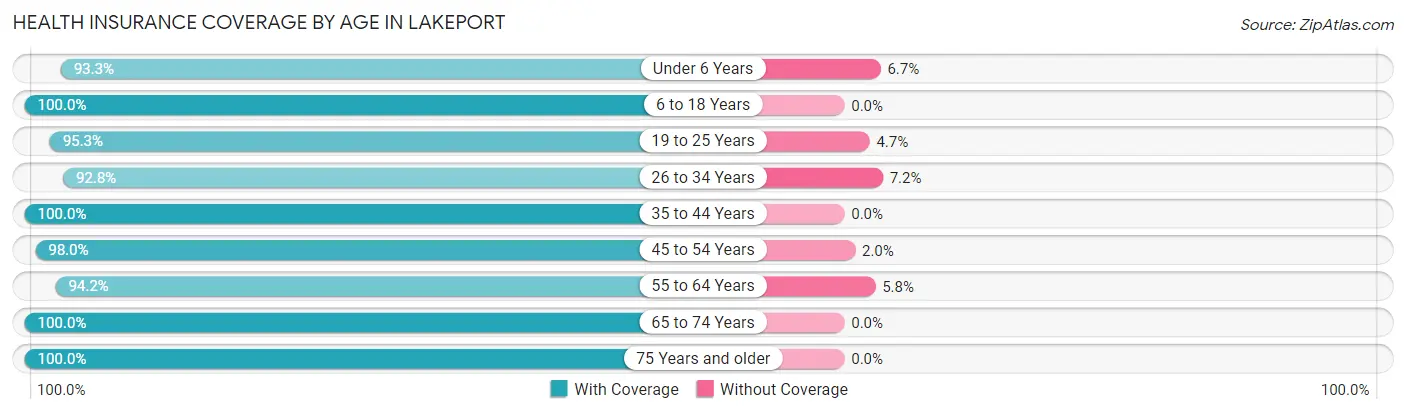
| Age Bracket | With Coverage | Without Coverage |
| Under 6 Years | 415 (93.3%) | 30 (6.7%) |
| 6 to 18 Years | 661 (100.0%) | 0 (0.0%) |
| 19 to 25 Years | 366 (95.3%) | 18 (4.7%) |
| 26 to 34 Years | 402 (92.8%) | 31 (7.2%) |
| 35 to 44 Years | 689 (100.0%) | 0 (0.0%) |
| 45 to 54 Years | 490 (98.0%) | 10 (2.0%) |
| 55 to 64 Years | 720 (94.2%) | 44 (5.8%) |
| 65 to 74 Years | 519 (100.0%) | 0 (0.0%) |
| 75 Years and older | 482 (100.0%) | 0 (0.0%) |
| Total | 4,744 (97.3%) | 133 (2.7%) |
Health Insurance Coverage by Citizenship Status in Lakeport
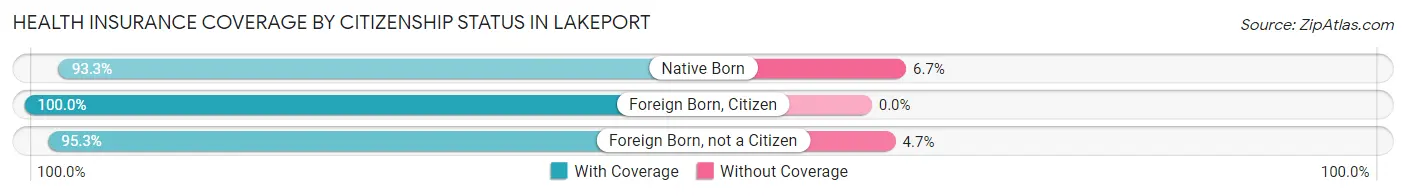
| Citizenship Status | With Coverage | Without Coverage |
| Native Born | 415 (93.3%) | 30 (6.7%) |
| Foreign Born, Citizen | 661 (100.0%) | 0 (0.0%) |
| Foreign Born, not a Citizen | 366 (95.3%) | 18 (4.7%) |
Health Insurance Coverage by Household Income in Lakeport
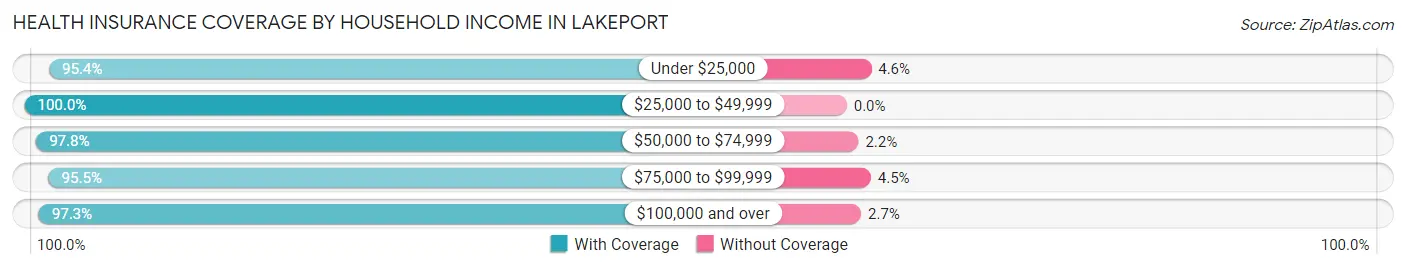
| Household Income | With Coverage | Without Coverage |
| Under $25,000 | 561 (95.4%) | 27 (4.6%) |
| $25,000 to $49,999 | 619 (100.0%) | 0 (0.0%) |
| $50,000 to $74,999 | 758 (97.8%) | 17 (2.2%) |
| $75,000 to $99,999 | 657 (95.5%) | 31 (4.5%) |
| $100,000 and over | 2,110 (97.3%) | 58 (2.7%) |
Public vs Private Health Insurance Coverage by Age in Lakeport
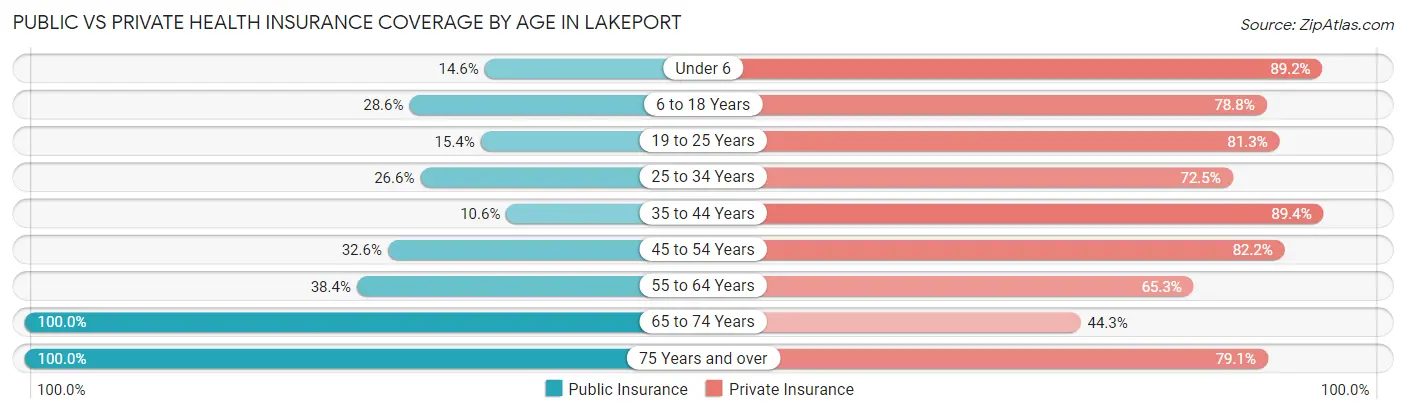
| Age Bracket | Public Insurance | Private Insurance |
| Under 6 | 65 (14.6%) | 397 (89.2%) |
| 6 to 18 Years | 189 (28.6%) | 521 (78.8%) |
| 19 to 25 Years | 59 (15.4%) | 312 (81.2%) |
| 25 to 34 Years | 115 (26.6%) | 314 (72.5%) |
| 35 to 44 Years | 73 (10.6%) | 616 (89.4%) |
| 45 to 54 Years | 163 (32.6%) | 411 (82.2%) |
| 55 to 64 Years | 293 (38.4%) | 499 (65.3%) |
| 65 to 74 Years | 519 (100.0%) | 230 (44.3%) |
| 75 Years and over | 482 (100.0%) | 381 (79.0%) |
| Total | 1,958 (40.2%) | 3,681 (75.5%) |
Disability Status by Sex by Age in Lakeport
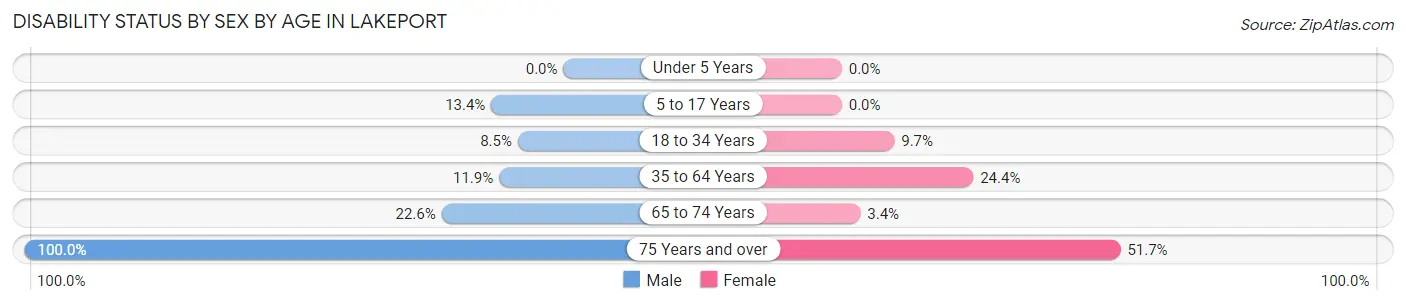
| Age Bracket | Male | Female |
| Under 5 Years | 0 (0.0%) | 0 (0.0%) |
| 5 to 17 Years | 49 (13.4%) | 0 (0.0%) |
| 18 to 34 Years | 30 (8.5%) | 49 (9.7%) |
| 35 to 64 Years | 124 (11.9%) | 223 (24.4%) |
| 65 to 74 Years | 45 (22.6%) | 11 (3.4%) |
| 75 Years and over | 105 (100.0%) | 195 (51.7%) |
Disability Class by Sex by Age in Lakeport
Disability Class: Hearing Difficulty
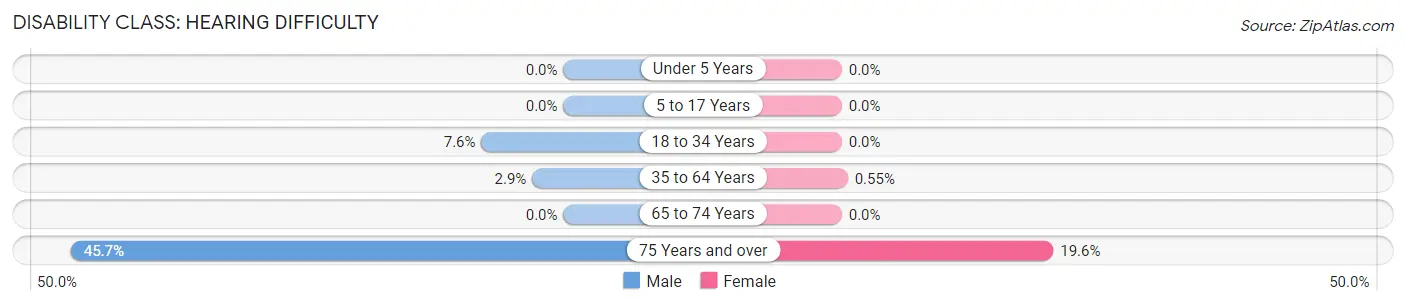
| Age Bracket | Male | Female |
| Under 5 Years | 0 (0.0%) | 0 (0.0%) |
| 5 to 17 Years | 0 (0.0%) | 0 (0.0%) |
| 18 to 34 Years | 27 (7.6%) | 0 (0.0%) |
| 35 to 64 Years | 30 (2.9%) | 5 (0.5%) |
| 65 to 74 Years | 0 (0.0%) | 0 (0.0%) |
| 75 Years and over | 48 (45.7%) | 74 (19.6%) |
Disability Class: Vision Difficulty
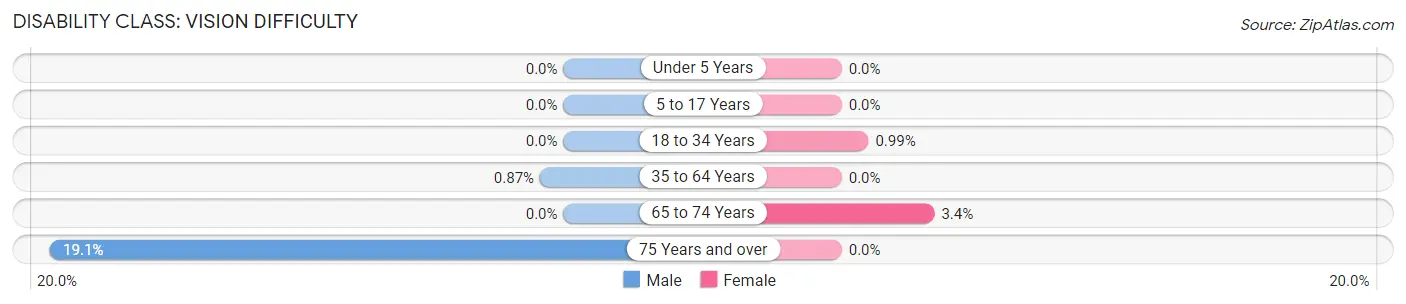
| Age Bracket | Male | Female |
| Under 5 Years | 0 (0.0%) | 0 (0.0%) |
| 5 to 17 Years | 0 (0.0%) | 0 (0.0%) |
| 18 to 34 Years | 0 (0.0%) | 5 (1.0%) |
| 35 to 64 Years | 9 (0.9%) | 0 (0.0%) |
| 65 to 74 Years | 0 (0.0%) | 11 (3.4%) |
| 75 Years and over | 20 (19.1%) | 0 (0.0%) |
Disability Class: Cognitive Difficulty
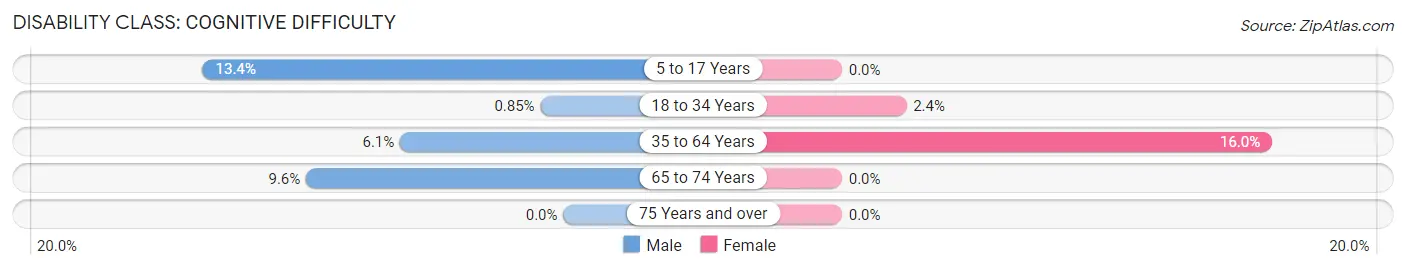
| Age Bracket | Male | Female |
| 5 to 17 Years | 49 (13.4%) | 0 (0.0%) |
| 18 to 34 Years | 3 (0.9%) | 12 (2.4%) |
| 35 to 64 Years | 63 (6.1%) | 146 (16.0%) |
| 65 to 74 Years | 19 (9.6%) | 0 (0.0%) |
| 75 Years and over | 0 (0.0%) | 0 (0.0%) |
Disability Class: Ambulatory Difficulty
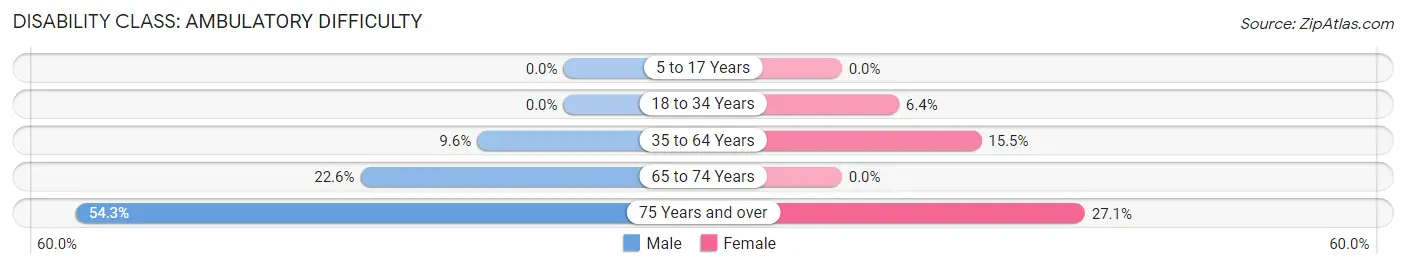
| Age Bracket | Male | Female |
| 5 to 17 Years | 0 (0.0%) | 0 (0.0%) |
| 18 to 34 Years | 0 (0.0%) | 32 (6.4%) |
| 35 to 64 Years | 100 (9.6%) | 142 (15.5%) |
| 65 to 74 Years | 45 (22.6%) | 0 (0.0%) |
| 75 Years and over | 57 (54.3%) | 102 (27.1%) |
Disability Class: Self-Care Difficulty
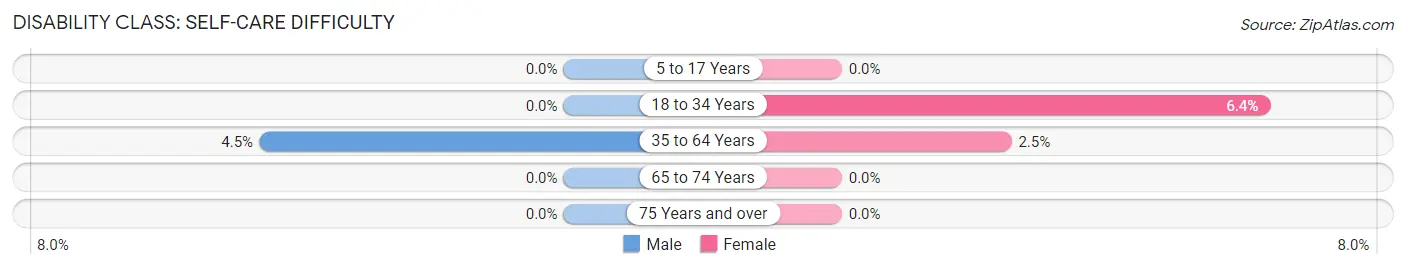
| Age Bracket | Male | Female |
| 5 to 17 Years | 0 (0.0%) | 0 (0.0%) |
| 18 to 34 Years | 0 (0.0%) | 32 (6.4%) |
| 35 to 64 Years | 47 (4.5%) | 23 (2.5%) |
| 65 to 74 Years | 0 (0.0%) | 0 (0.0%) |
| 75 Years and over | 0 (0.0%) | 0 (0.0%) |
Technology Access in Lakeport
Computing Device Access in Lakeport
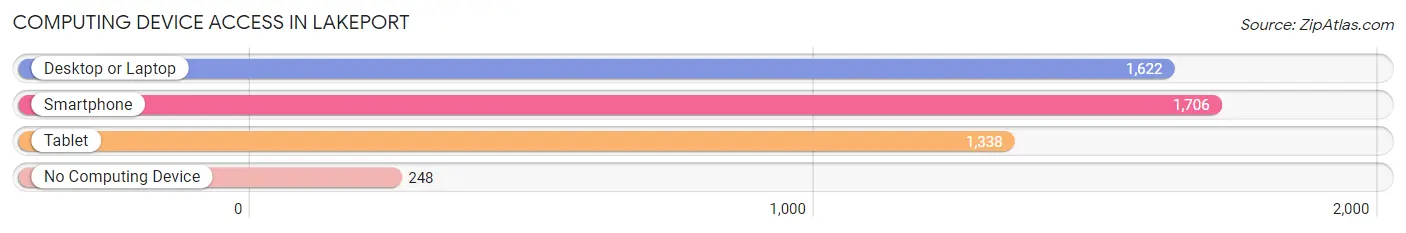
| Device Type | # Households | % Households |
| Desktop or Laptop | 1,622 | 75.6% |
| Smartphone | 1,706 | 79.6% |
| Tablet | 1,338 | 62.4% |
| No Computing Device | 248 | 11.6% |
| Total | 2,144 | 100.0% |
Internet Access in Lakeport
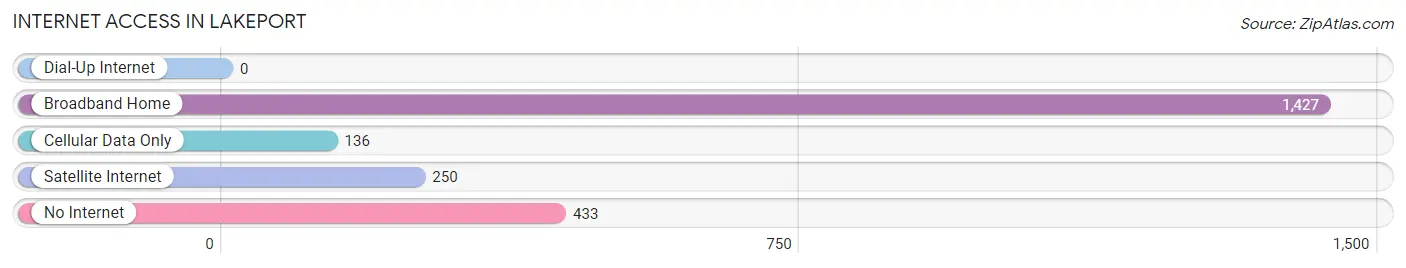
| Internet Type | # Households | % Households |
| Dial-Up Internet | 0 | 0.0% |
| Broadband Home | 1,427 | 66.6% |
| Cellular Data Only | 136 | 6.3% |
| Satellite Internet | 250 | 11.7% |
| No Internet | 433 | 20.2% |
| Total | 2,144 | 100.0% |
Lakeport Summary
Lakeport is a city located in Lake County, California, United States. It is situated on the west shore of Clear Lake, the largest natural freshwater lake entirely within California. The population was 4,753 at the 2010 census, down from 4,820 at the 2000 census. The city of Lakeport is located in the Clear Lake Basin, surrounded by the Mayacamas Mountains to the east and the Mendocino Range to the north.
Geography
Lakeport is located at 39°N 122°W, at an elevation of 1355 feet (413 m). According to the United States Census Bureau, the city has a total area of 2.4 square miles (6.2 km2), of which, 2.3 square miles (6.0 km2) of it is land and 0.1 square miles (0.2 km2) of it (3.45%) is water.
The city is on the north shore of Clear Lake, and is the only incorporated city on the lake. The population of Lakeport is concentrated in the southern and eastern parts of the city, while the western and northern parts are mostly rural.
History
The area around Lakeport was originally inhabited by the Pomo people, who lived in villages along the shore of Clear Lake. The first European settlers arrived in the area in the 1850s, and the town of Lakeport was founded in 1858. The town was named after the lake, which was named by early settlers for its clear water.
The town grew rapidly in the late 19th century, and by the early 20th century it was a popular resort destination. The town was incorporated in 1888, and the first mayor was elected in 1890.
Economy
The economy of Lakeport is largely based on tourism and recreation. The city is home to several resorts, marinas, and campgrounds, as well as a variety of restaurants and shops. The city is also home to several wineries, and is a popular destination for wine tasting.
The city is also home to several manufacturing and industrial businesses, including a lumber mill, a boat manufacturing plant, and a food processing plant.
Demographics
As of the census of 2000, there were 4,820 people, 1,945 households, and 1,258 families residing in the city. The population density was 2,068.2 people per square mile (798.7/km2). There were 2,093 housing units at an average density of 890.3 per square mile (344.2/km2). The racial makeup of the city was 79.2% White, 0.6% African American, 3.3% Native American, 1.3% Asian, 0.2% Pacific Islander, 11.2% from other races, and 4.3% from two or more races. Hispanic or Latino of any race were 20.2% of the population.
There were 1,945 households, out of which 28.2% had children under the age of 18 living with them, 48.2% were married couples living together, 11.7% had a female householder with no husband present, and 35.3% were non-families. 29.2% of all households were made up of individuals, and 13.2% had someone living alone who was 65 years of age or older. The average household size was 2.48 and the average family size was 3.05.
In the city, the population was spread out, with 25.2% under the age of 18, 7.2% from 18 to 24, 25.2% from 25 to 44, 24.2% from 45 to 64, and 18.2% who were 65 years of age or older. The median age was 40 years. For every 100 females, there were 93.3 males. For every 100 females age 18 and over, there were 89.9 males.
The median income for a household in the city was $32,813, and the median income for a family was $39,167. Males had a median income of $31,250 versus $22,500 for females. The per capita income for the city was $17,890. About 11.2% of families and 14.2% of the population were below the poverty line, including 19.2% of those under age 18 and 8.2% of those age 65 or over.
Common Questions
What is Per Capita Income in Lakeport?
Per Capita income in Lakeport is $41,608.
What is the Median Family Income in Lakeport?
Median Family Income in Lakeport is $127,632.
What is the Median Household income in Lakeport?
Median Household Income in Lakeport is $61,100.
What is Income or Wage Gap in Lakeport?
Income or Wage Gap in Lakeport is 67.7%.
Women in Lakeport earn 32.3 cents for every dollar earned by a man.
What is Inequality or Gini Index in Lakeport?
Inequality or Gini Index in Lakeport is 0.49.
What is the Total Population of Lakeport?
Total Population of Lakeport is 5,014.
What is the Total Male Population of Lakeport?
Total Male Population of Lakeport is 2,324.
What is the Total Female Population of Lakeport?
Total Female Population of Lakeport is 2,690.
What is the Ratio of Males per 100 Females in Lakeport?
There are 86.39 Males per 100 Females in Lakeport.
What is the Ratio of Females per 100 Males in Lakeport?
There are 115.75 Females per 100 Males in Lakeport.
What is the Median Population Age in Lakeport?
Median Population Age in Lakeport is 42.7 Years.
What is the Average Family Size in Lakeport
Average Family Size in Lakeport is 3.2 People.
What is the Average Household Size in Lakeport
Average Household Size in Lakeport is 2.3 People.
How Large is the Labor Force in Lakeport?
There are 1,737 People in the Labor Forcein in Lakeport.
What is the Percentage of People in the Labor Force in Lakeport?
42.0% of People are in the Labor Force in Lakeport.
What is the Unemployment Rate in Lakeport?
Unemployment Rate in Lakeport is 4.5%.