Laguna Beach, CA Map & Demographics
Laguna Beach Map
Laguna Beach Overview
$107,044
PER CAPITA INCOME
$191,426
AVG FAMILY INCOME
$141,875
AVG HOUSEHOLD INCOME
45.9%
WAGE / INCOME GAP [ % ]
54.1¢/ $1
WAGE / INCOME GAP [ $ ]
0.53
INEQUALITY / GINI INDEX
22,943
TOTAL POPULATION
11,953
MALE POPULATION
10,990
FEMALE POPULATION
108.76
MALES / 100 FEMALES
91.94
FEMALES / 100 MALES
53.7
MEDIAN AGE
2.7
AVG FAMILY SIZE
2.1
AVG HOUSEHOLD SIZE
12,143
LABOR FORCE [ PEOPLE ]
60.6%
PERCENT IN LABOR FORCE
6.8%
UNEMPLOYMENT RATE
Laguna Beach Zip Codes
Income in Laguna Beach
Income Overview in Laguna Beach
Per Capita Income in Laguna Beach is $107,044, while median incomes of families and households are $191,426 and $141,875 respectively.
| Characteristic | Number | Measure |
| Per Capita Income | 22,943 | $107,044 |
| Median Family Income | 6,241 | $191,426 |
| Mean Family Income | 6,241 | $288,727 |
| Median Household Income | 10,618 | $141,875 |
| Mean Household Income | 10,618 | $231,367 |
| Income Deficit | 6,241 | $0 |
| Wage / Income Gap (%) | 22,943 | 45.92% |
| Wage / Income Gap ($) | 22,943 | 54.08¢ per $1 |
| Gini / Inequality Index | 22,943 | 0.53 |
Earnings by Sex in Laguna Beach
Average Earnings in Laguna Beach are $78,390, $96,113 for men and $51,975 for women, a difference of 45.9%.
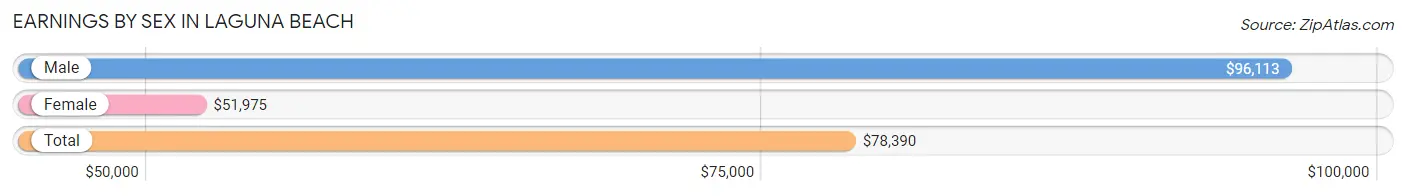
| Sex | Number | Average Earnings |
| Male | 7,611 (60.2%) | $96,113 |
| Female | 5,025 (39.8%) | $51,975 |
| Total | 12,636 (100.0%) | $78,390 |
Earnings by Sex by Income Bracket in Laguna Beach
The most common earnings brackets in Laguna Beach are $100,000+ for men (3,726 | 49.0%) and $100,000+ for women (1,354 | 27.0%).
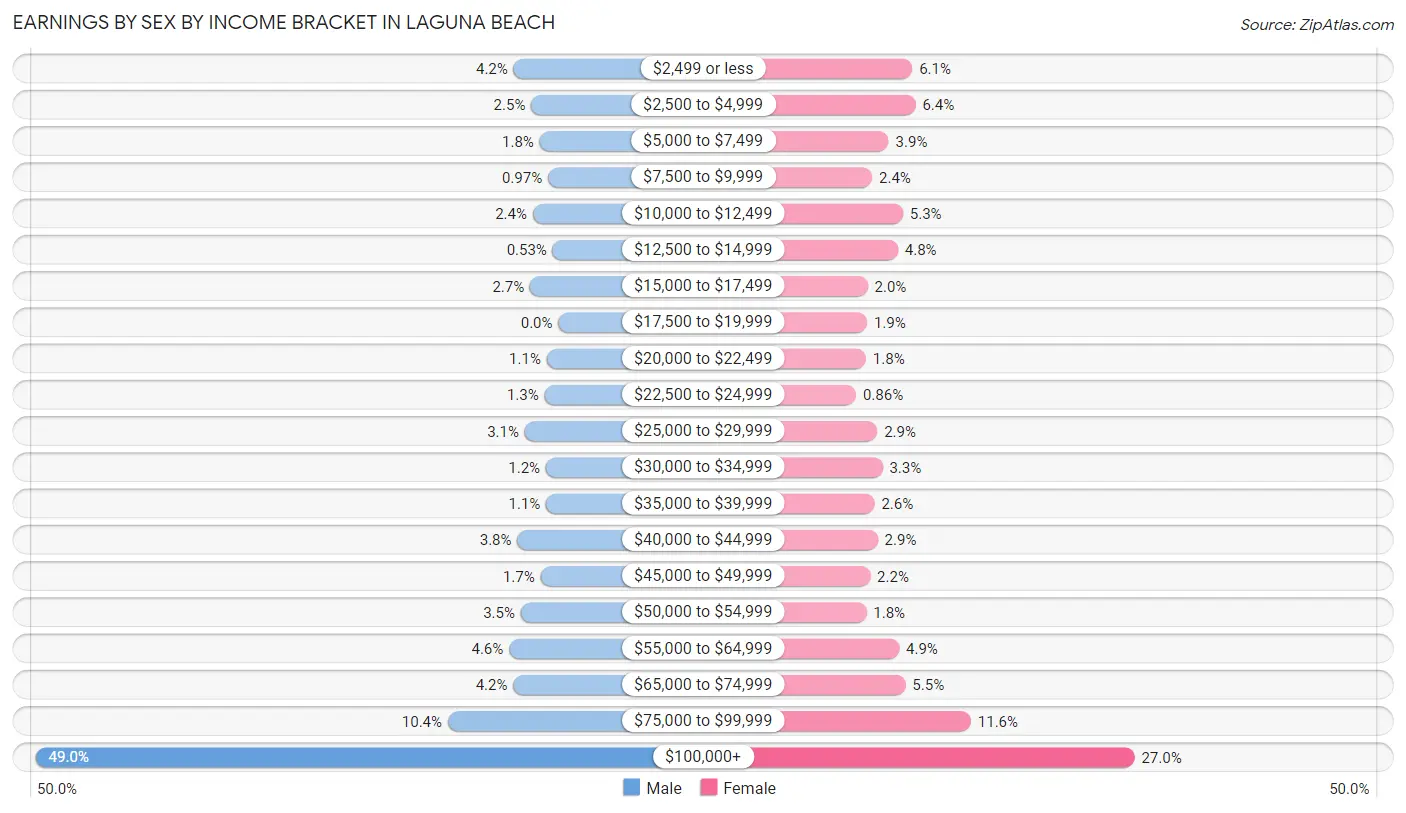
| Income | Male | Female |
| $2,499 or less | 319 (4.2%) | 308 (6.1%) |
| $2,500 to $4,999 | 193 (2.5%) | 323 (6.4%) |
| $5,000 to $7,499 | 133 (1.8%) | 197 (3.9%) |
| $7,500 to $9,999 | 74 (1.0%) | 119 (2.4%) |
| $10,000 to $12,499 | 182 (2.4%) | 264 (5.2%) |
| $12,500 to $14,999 | 40 (0.5%) | 240 (4.8%) |
| $15,000 to $17,499 | 202 (2.6%) | 98 (1.9%) |
| $17,500 to $19,999 | 0 (0.0%) | 95 (1.9%) |
| $20,000 to $22,499 | 83 (1.1%) | 90 (1.8%) |
| $22,500 to $24,999 | 98 (1.3%) | 43 (0.9%) |
| $25,000 to $29,999 | 239 (3.1%) | 143 (2.9%) |
| $30,000 to $34,999 | 88 (1.2%) | 168 (3.3%) |
| $35,000 to $39,999 | 87 (1.1%) | 130 (2.6%) |
| $40,000 to $44,999 | 292 (3.8%) | 145 (2.9%) |
| $45,000 to $49,999 | 127 (1.7%) | 110 (2.2%) |
| $50,000 to $54,999 | 268 (3.5%) | 92 (1.8%) |
| $55,000 to $64,999 | 351 (4.6%) | 246 (4.9%) |
| $65,000 to $74,999 | 321 (4.2%) | 276 (5.5%) |
| $75,000 to $99,999 | 788 (10.3%) | 584 (11.6%) |
| $100,000+ | 3,726 (49.0%) | 1,354 (27.0%) |
| Total | 7,611 (100.0%) | 5,025 (100.0%) |
Earnings by Sex by Educational Attainment in Laguna Beach
Average earnings in Laguna Beach are $107,143 for men and $60,912 for women, a difference of 43.1%. Men with an educational attainment of graduate degree enjoy the highest average annual earnings of $169,664, while those with less than high school education earn the least with $41,887. Women with an educational attainment of graduate degree earn the most with the average annual earnings of $75,682, while those with high school diploma education have the smallest earnings of $41,505.
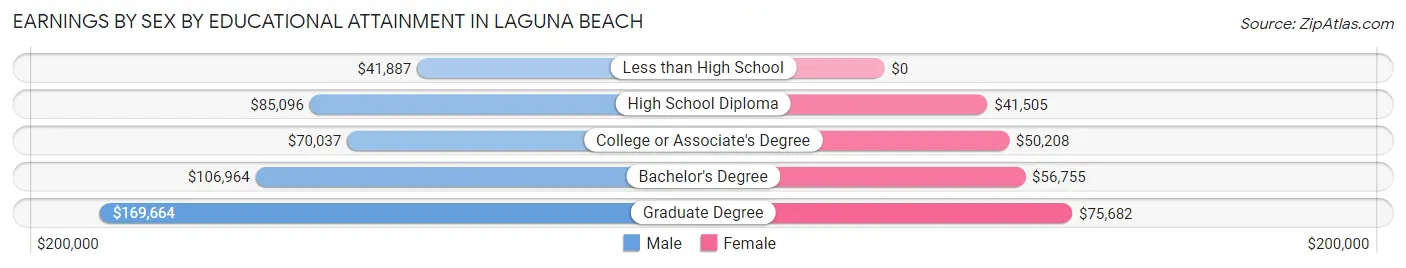
| Educational Attainment | Male Income | Female Income |
| Less than High School | $41,887 | $0 |
| High School Diploma | $85,096 | $41,505 |
| College or Associate's Degree | $70,037 | $50,208 |
| Bachelor's Degree | $106,964 | $56,755 |
| Graduate Degree | $169,664 | $75,682 |
| Total | $107,143 | $60,912 |
Family Income in Laguna Beach
Family Income Brackets in Laguna Beach
According to the Laguna Beach family income data, there are 2,921 families falling into the $200,000+ income range, which is the most common income bracket and makes up 46.8% of all families. Conversely, the $10,000 to $14,999 income bracket is the least frequent group with only 37 families (0.6%) belonging to this category.
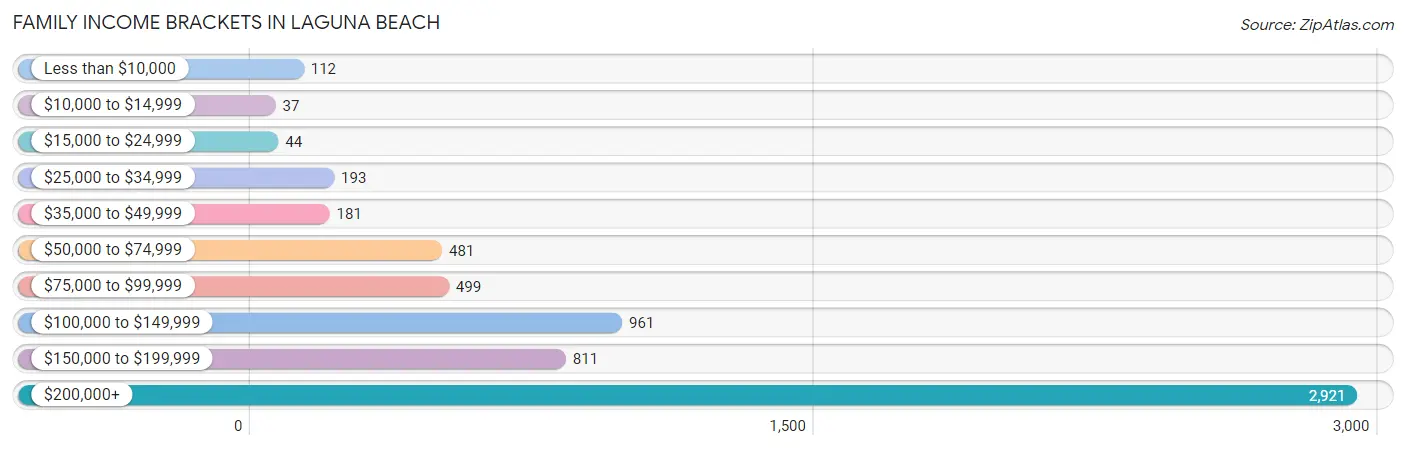
| Income Bracket | # Families | % Families |
| Less than $10,000 | 112 | 1.8% |
| $10,000 to $14,999 | 37 | 0.6% |
| $15,000 to $24,999 | 44 | 0.7% |
| $25,000 to $34,999 | 193 | 3.1% |
| $35,000 to $49,999 | 181 | 2.9% |
| $50,000 to $74,999 | 481 | 7.7% |
| $75,000 to $99,999 | 499 | 8.0% |
| $100,000 to $149,999 | 961 | 15.4% |
| $150,000 to $199,999 | 811 | 13.0% |
| $200,000+ | 2,921 | 46.8% |
Family Income by Famaliy Size in Laguna Beach
4-person families (1,002 | 16.1%) account for the highest median family income in Laguna Beach with $250,001 per family, while 2-person families (3,819 | 61.2%) have the highest median income of $86,762 per family member.
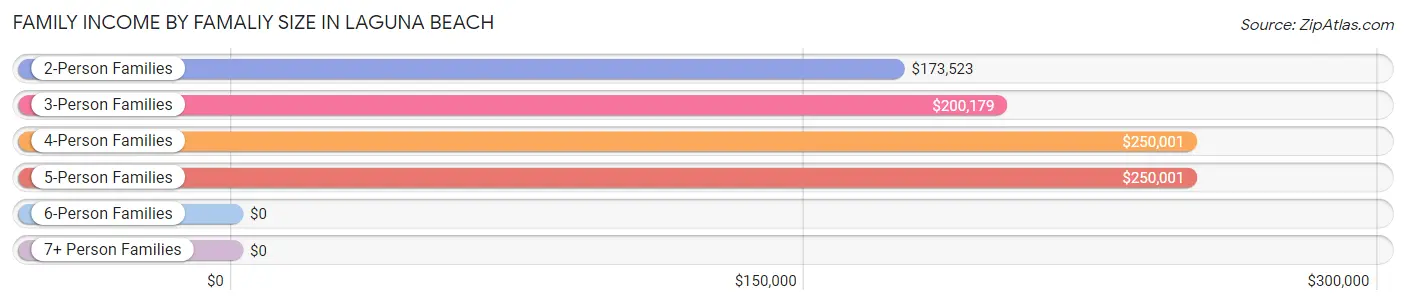
| Income Bracket | # Families | Median Income |
| 2-Person Families | 3,819 (61.2%) | $173,523 |
| 3-Person Families | 1,049 (16.8%) | $200,179 |
| 4-Person Families | 1,002 (16.1%) | $250,001 |
| 5-Person Families | 299 (4.8%) | $250,001 |
| 6-Person Families | 65 (1.0%) | $0 |
| 7+ Person Families | 7 (0.1%) | $0 |
| Total | 6,241 (100.0%) | $191,426 |
Family Income by Number of Earners in Laguna Beach
The median family income in Laguna Beach is $191,426, with families comprising 3+ earners (441) having the highest median family income of $250,001, while families with no earners (1,028) have the lowest median family income of $117,188, accounting for 7.1% and 16.5% of families, respectively.
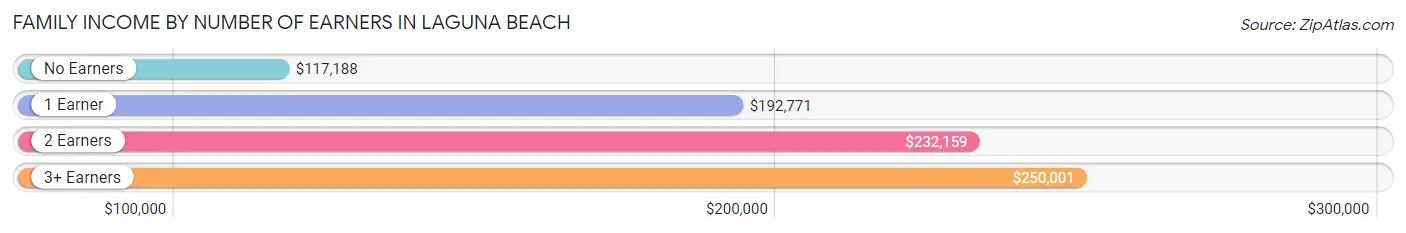
| Number of Earners | # Families | Median Income |
| No Earners | 1,028 (16.5%) | $117,188 |
| 1 Earner | 2,291 (36.7%) | $192,771 |
| 2 Earners | 2,481 (39.8%) | $232,159 |
| 3+ Earners | 441 (7.1%) | $250,001 |
| Total | 6,241 (100.0%) | $191,426 |
Household Income in Laguna Beach
Household Income Brackets in Laguna Beach
With 3,918 households falling in the category, the $200,000+ income range is the most frequent in Laguna Beach, accounting for 36.9% of all households. In contrast, only 212 households (2.0%) fall into the $10,000 to $14,999 income bracket, making it the least populous group.
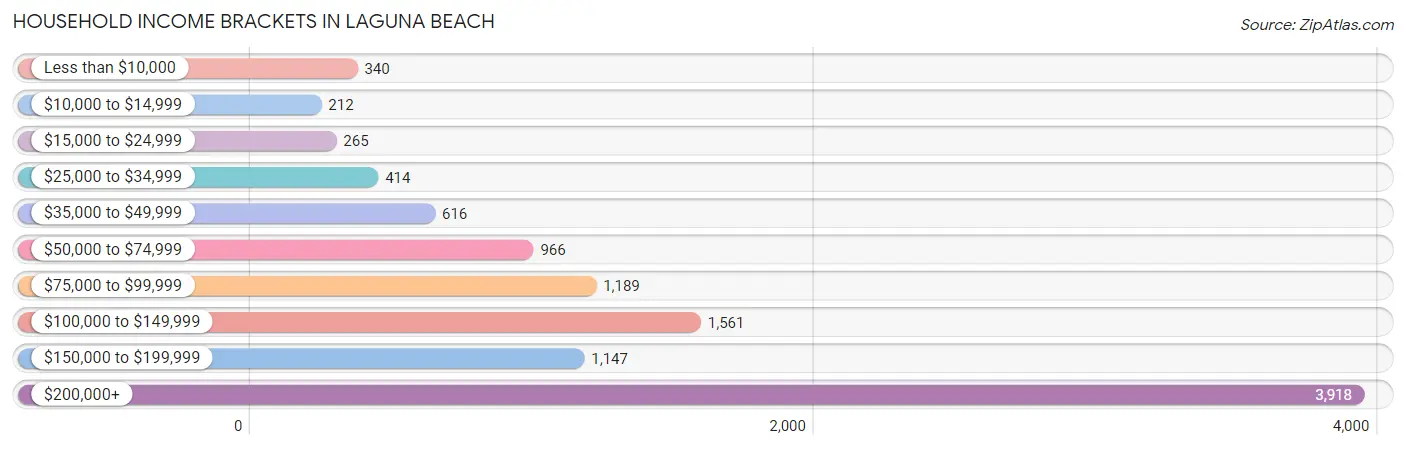
| Income Bracket | # Households | % Households |
| Less than $10,000 | 340 | 3.2% |
| $10,000 to $14,999 | 212 | 2.0% |
| $15,000 to $24,999 | 265 | 2.5% |
| $25,000 to $34,999 | 414 | 3.9% |
| $35,000 to $49,999 | 616 | 5.8% |
| $50,000 to $74,999 | 966 | 9.1% |
| $75,000 to $99,999 | 1,189 | 11.2% |
| $100,000 to $149,999 | 1,561 | 14.7% |
| $150,000 to $199,999 | 1,147 | 10.8% |
| $200,000+ | 3,918 | 36.9% |
Household Income by Householder Age in Laguna Beach
The median household income in Laguna Beach is $141,875, with the highest median household income of $183,568 found in the 45 to 64 years age bracket for the primary householder. A total of 4,655 households (43.8%) fall into this category. Meanwhile, the 15 to 24 years age bracket for the primary householder has the lowest median household income of $14,583, with 45 households (0.4%) in this group.
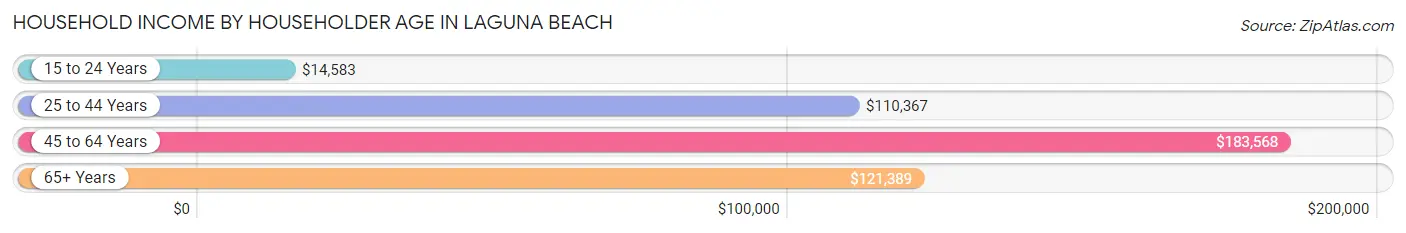
| Income Bracket | # Households | Median Income |
| 15 to 24 Years | 45 (0.4%) | $14,583 |
| 25 to 44 Years | 1,920 (18.1%) | $110,367 |
| 45 to 64 Years | 4,655 (43.8%) | $183,568 |
| 65+ Years | 3,998 (37.7%) | $121,389 |
| Total | 10,618 (100.0%) | $141,875 |
Poverty in Laguna Beach
Income Below Poverty by Sex and Age in Laguna Beach
With 5.6% poverty level for males and 5.4% for females among the residents of Laguna Beach, 18 to 24 year old males and 18 to 24 year old females are the most vulnerable to poverty, with 138 males (22.3%) and 48 females (12.2%) in their respective age groups living below the poverty level.
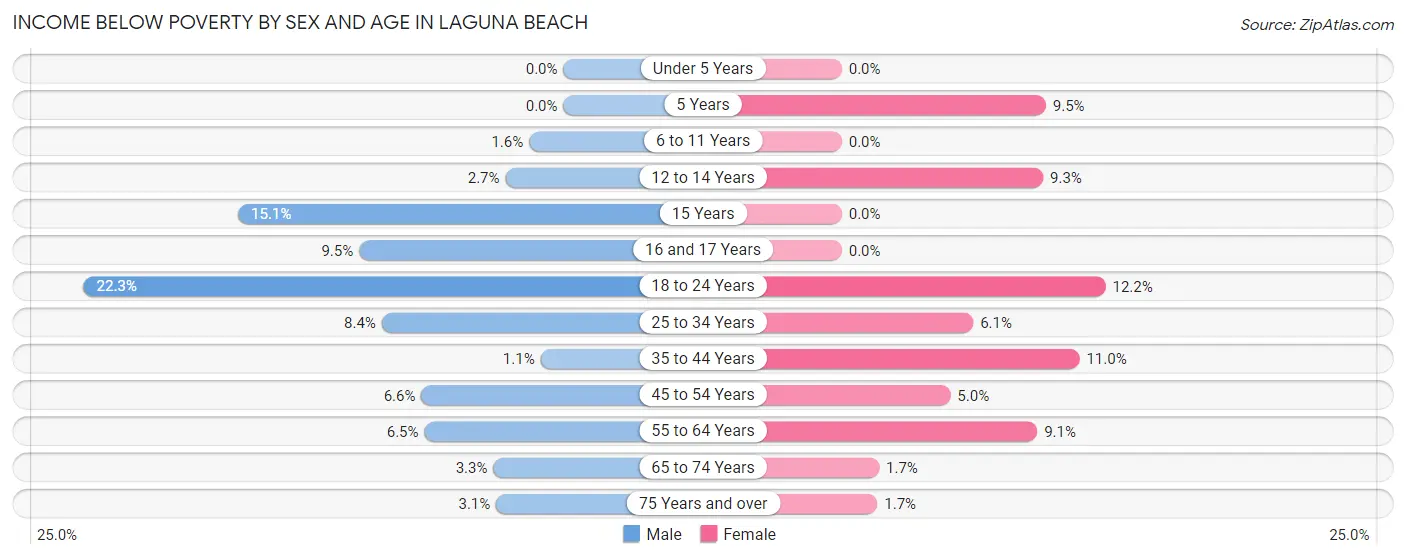
| Age Bracket | Male | Female |
| Under 5 Years | 0 (0.0%) | 0 (0.0%) |
| 5 Years | 0 (0.0%) | 9 (9.5%) |
| 6 to 11 Years | 9 (1.6%) | 0 (0.0%) |
| 12 to 14 Years | 10 (2.7%) | 38 (9.3%) |
| 15 Years | 8 (15.1%) | 0 (0.0%) |
| 16 and 17 Years | 33 (9.5%) | 0 (0.0%) |
| 18 to 24 Years | 138 (22.3%) | 48 (12.2%) |
| 25 to 34 Years | 73 (8.4%) | 43 (6.1%) |
| 35 to 44 Years | 12 (1.1%) | 136 (11.0%) |
| 45 to 54 Years | 108 (6.6%) | 89 (5.0%) |
| 55 to 64 Years | 169 (6.5%) | 171 (9.1%) |
| 65 to 74 Years | 60 (3.3%) | 34 (1.7%) |
| 75 Years and over | 43 (3.1%) | 21 (1.7%) |
| Total | 663 (5.6%) | 589 (5.4%) |
Income Above Poverty by Sex and Age in Laguna Beach
According to the poverty statistics in Laguna Beach, males aged under 5 years and females aged under 5 years are the age groups that are most secure financially, with 100.0% of males and 100.0% of females in these age groups living above the poverty line.
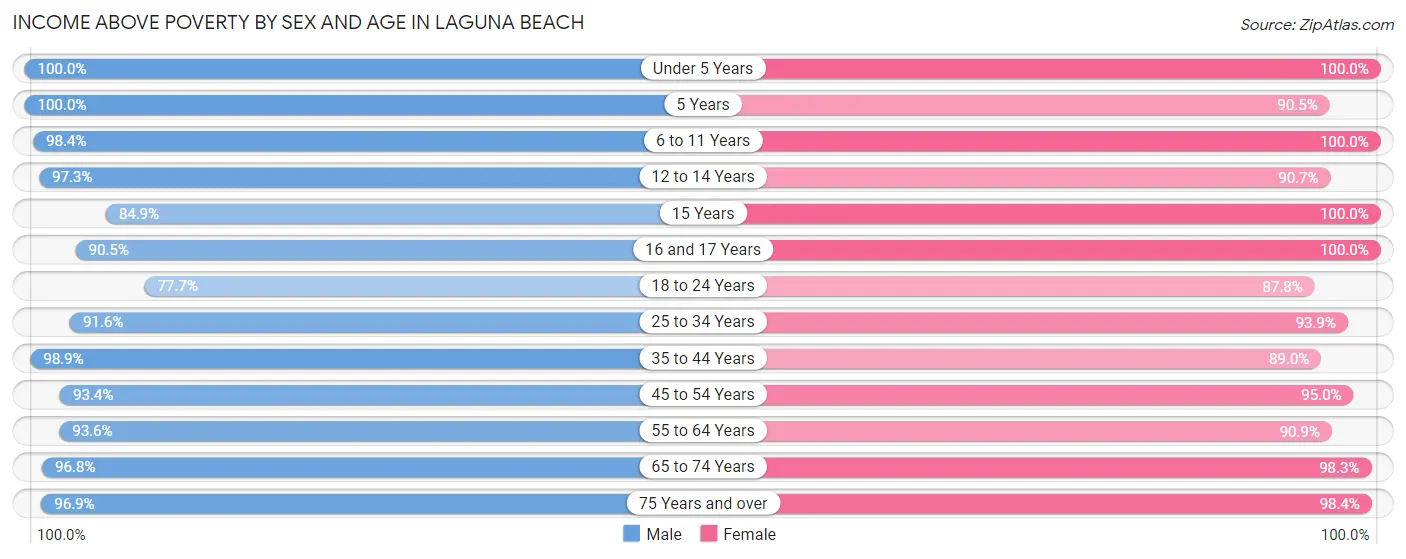
| Age Bracket | Male | Female |
| Under 5 Years | 314 (100.0%) | 221 (100.0%) |
| 5 Years | 129 (100.0%) | 86 (90.5%) |
| 6 to 11 Years | 557 (98.4%) | 555 (100.0%) |
| 12 to 14 Years | 362 (97.3%) | 369 (90.7%) |
| 15 Years | 45 (84.9%) | 99 (100.0%) |
| 16 and 17 Years | 315 (90.5%) | 360 (100.0%) |
| 18 to 24 Years | 482 (77.7%) | 344 (87.8%) |
| 25 to 34 Years | 793 (91.6%) | 662 (93.9%) |
| 35 to 44 Years | 1,120 (98.9%) | 1,097 (89.0%) |
| 45 to 54 Years | 1,531 (93.4%) | 1,676 (95.0%) |
| 55 to 64 Years | 2,452 (93.5%) | 1,715 (90.9%) |
| 65 to 74 Years | 1,786 (96.8%) | 1,937 (98.3%) |
| 75 Years and over | 1,335 (96.9%) | 1,255 (98.4%) |
| Total | 11,221 (94.4%) | 10,376 (94.6%) |
Income Below Poverty Among Married-Couple Families in Laguna Beach
The poverty statistics for married-couple families in Laguna Beach show that 1.5% or 81 of the total 5,436 families live below the poverty line. Families with 3 or 4 children have the highest poverty rate of 3.0%, comprising of 9 families. On the other hand, families with 1 or 2 children have the lowest poverty rate of 0.5%, which includes 7 families.
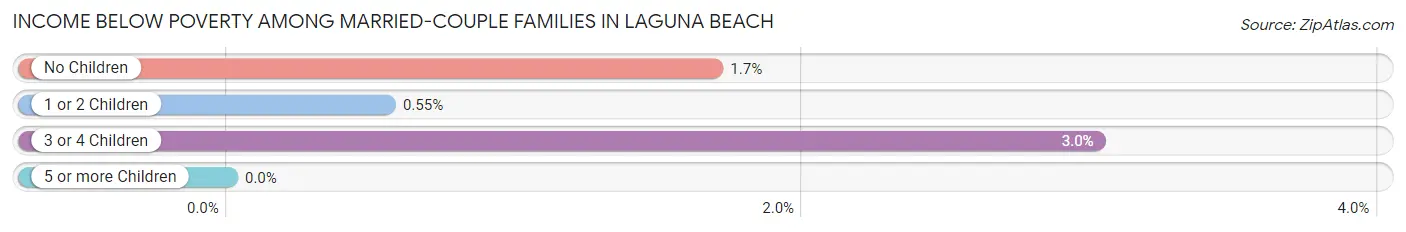
| Children | Above Poverty | Below Poverty |
| No Children | 3,792 (98.3%) | 65 (1.7%) |
| 1 or 2 Children | 1,274 (99.5%) | 7 (0.5%) |
| 3 or 4 Children | 289 (97.0%) | 9 (3.0%) |
| 5 or more Children | 0 (0.0%) | 0 (0.0%) |
| Total | 5,355 (98.5%) | 81 (1.5%) |
Income Below Poverty Among Single-Parent Households in Laguna Beach
According to the poverty data in Laguna Beach, 9.4% or 31 single-father households and 11.8% or 56 single-mother households are living below the poverty line. Among single-father households, those with 1 or 2 children have the highest poverty rate, with 23 households (15.2%) experiencing poverty. Likewise, among single-mother households, those with 1 or 2 children have the highest poverty rate, with 37 households (14.1%) falling below the poverty line.
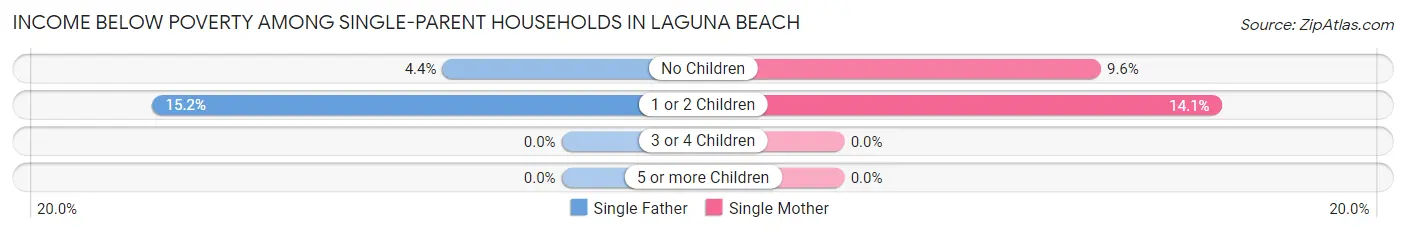
| Children | Single Father | Single Mother |
| No Children | 8 (4.4%) | 19 (9.6%) |
| 1 or 2 Children | 23 (15.2%) | 37 (14.1%) |
| 3 or 4 Children | 0 (0.0%) | 0 (0.0%) |
| 5 or more Children | 0 (0.0%) | 0 (0.0%) |
| Total | 31 (9.4%) | 56 (11.8%) |
Income Below Poverty Among Married-Couple vs Single-Parent Households in Laguna Beach
The poverty data for Laguna Beach shows that 81 of the married-couple family households (1.5%) and 87 of the single-parent households (10.8%) are living below the poverty level. Within the married-couple family households, those with 3 or 4 children have the highest poverty rate, with 9 households (3.0%) falling below the poverty line. Among the single-parent households, those with 1 or 2 children have the highest poverty rate, with 60 household (14.5%) living below poverty.
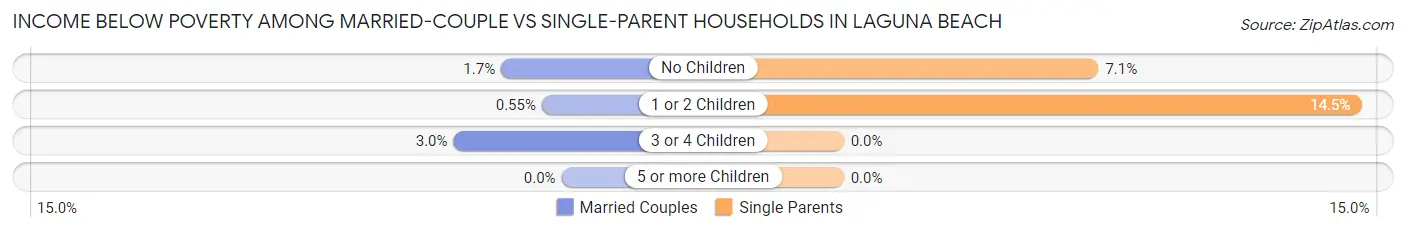
| Children | Married-Couple Families | Single-Parent Households |
| No Children | 65 (1.7%) | 27 (7.1%) |
| 1 or 2 Children | 7 (0.5%) | 60 (14.5%) |
| 3 or 4 Children | 9 (3.0%) | 0 (0.0%) |
| 5 or more Children | 0 (0.0%) | 0 (0.0%) |
| Total | 81 (1.5%) | 87 (10.8%) |
Race in Laguna Beach
The most populous races in Laguna Beach are White / Caucasian (19,736 | 86.0%), Two or more Races (1,798 | 7.8%), and Hispanic or Latino (1,623 | 7.1%).
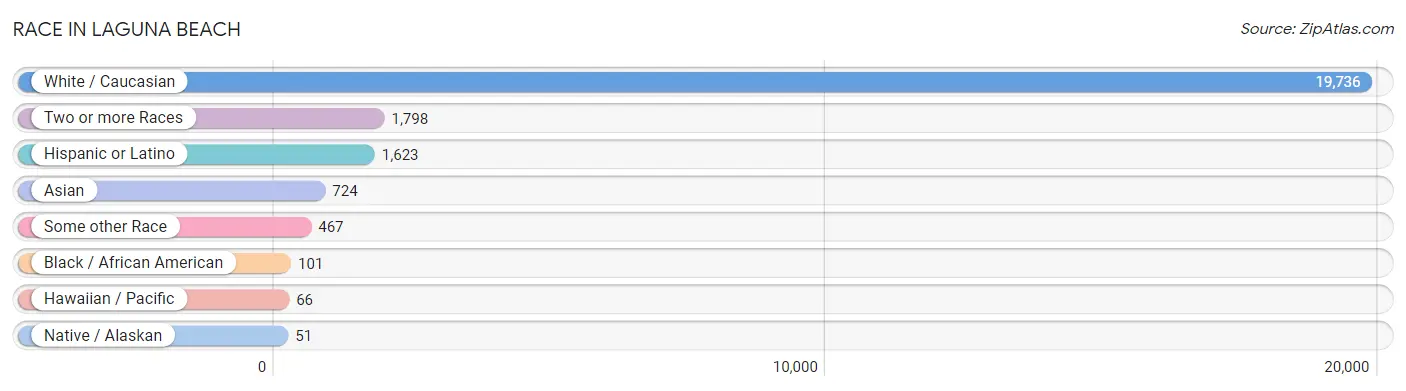
| Race | # Population | % Population |
| Asian | 724 | 3.2% |
| Black / African American | 101 | 0.4% |
| Hawaiian / Pacific | 66 | 0.3% |
| Hispanic or Latino | 1,623 | 7.1% |
| Native / Alaskan | 51 | 0.2% |
| White / Caucasian | 19,736 | 86.0% |
| Two or more Races | 1,798 | 7.8% |
| Some other Race | 467 | 2.0% |
| Total | 22,943 | 100.0% |
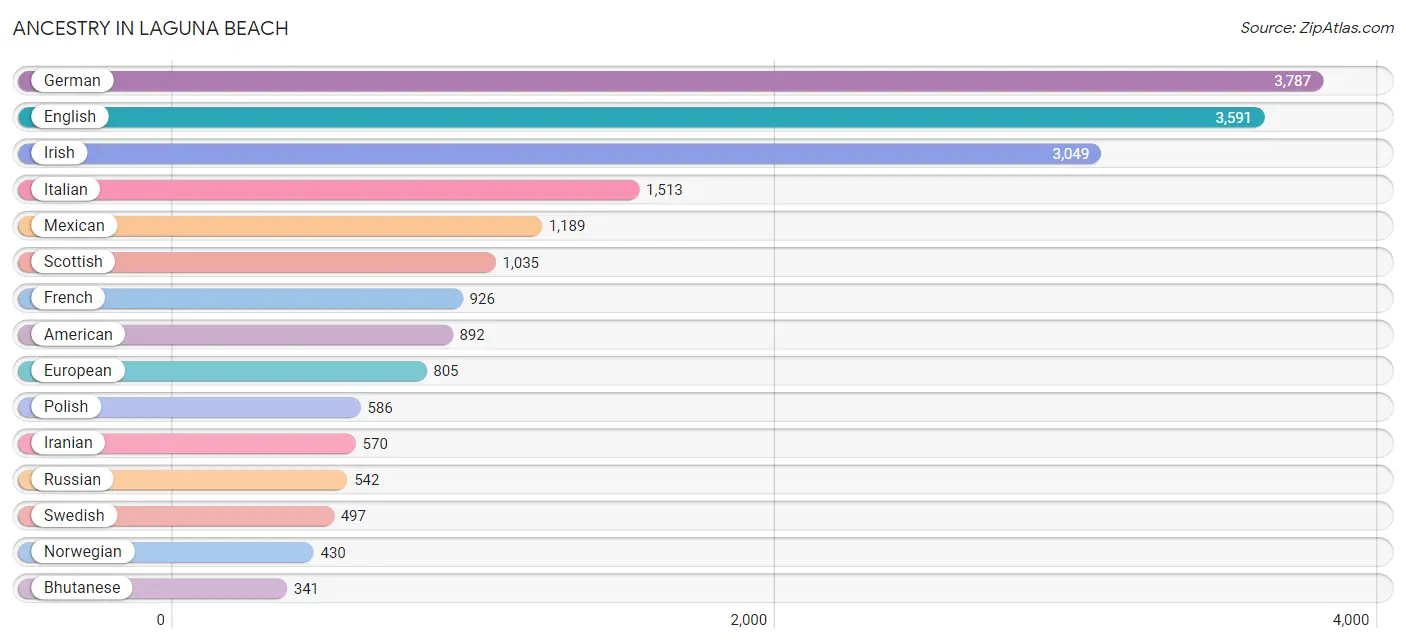
Ancestry in Laguna Beach
The most populous ancestries reported in Laguna Beach are German (3,787 | 16.5%), English (3,591 | 15.7%), Irish (3,049 | 13.3%), Italian (1,513 | 6.6%), and Mexican (1,189 | 5.2%), together accounting for 57.2% of all Laguna Beach residents.
| Ancestry | # Population | % Population |
| Afghan | 45 | 0.2% |
| African | 22 | 0.1% |
| American | 892 | 3.9% |
| Apache | 32 | 0.1% |
| Arab | 307 | 1.3% |
| Armenian | 61 | 0.3% |
| Australian | 44 | 0.2% |
| Austrian | 89 | 0.4% |
| Bangladeshi | 65 | 0.3% |
| Basque | 39 | 0.2% |
| Belgian | 23 | 0.1% |
| Bhutanese | 341 | 1.5% |
| Blackfeet | 2 | 0.0% |
| British | 236 | 1.0% |
| Burmese | 181 | 0.8% |
| Cambodian | 6 | 0.0% |
| Canadian | 122 | 0.5% |
| Central American | 95 | 0.4% |
| Cherokee | 16 | 0.1% |
| Choctaw | 9 | 0.0% |
| Costa Rican | 30 | 0.1% |
| Croatian | 111 | 0.5% |
| Cuban | 24 | 0.1% |
| Czech | 95 | 0.4% |
| Czechoslovakian | 32 | 0.1% |
| Danish | 201 | 0.9% |
| Dutch | 302 | 1.3% |
| Eastern European | 285 | 1.2% |
| Egyptian | 78 | 0.3% |
| English | 3,591 | 15.7% |
| European | 805 | 3.5% |
| Filipino | 109 | 0.5% |
| Finnish | 39 | 0.2% |
| French | 926 | 4.0% |
| French American Indian | 1 | 0.0% |
| French Canadian | 136 | 0.6% |
| German | 3,787 | 16.5% |
| Greek | 172 | 0.7% |
| Guatemalan | 35 | 0.2% |
| Hungarian | 182 | 0.8% |
| Icelander | 8 | 0.0% |
| Indian (Asian) | 287 | 1.3% |
| Iranian | 570 | 2.5% |
| Iraqi | 91 | 0.4% |
| Irish | 3,049 | 13.3% |
| Italian | 1,513 | 6.6% |
| Japanese | 28 | 0.1% |
| Korean | 144 | 0.6% |
| Latvian | 5 | 0.0% |
| Lebanese | 131 | 0.6% |
| Lithuanian | 53 | 0.2% |
| Maltese | 3 | 0.0% |
| Mexican | 1,189 | 5.2% |
| Mexican American Indian | 37 | 0.2% |
| Native Hawaiian | 98 | 0.4% |
| Northern European | 128 | 0.6% |
| Norwegian | 430 | 1.9% |
| Pakistani | 108 | 0.5% |
| Palestinian | 11 | 0.1% |
| Panamanian | 30 | 0.1% |
| Paraguayan | 9 | 0.0% |
| Pennsylvania German | 12 | 0.1% |
| Polish | 586 | 2.5% |
| Portuguese | 144 | 0.6% |
| Puerto Rican | 32 | 0.1% |
| Romanian | 165 | 0.7% |
| Russian | 542 | 2.4% |
| Scandinavian | 233 | 1.0% |
| Scotch-Irish | 333 | 1.5% |
| Scottish | 1,035 | 4.5% |
| Serbian | 114 | 0.5% |
| Shoshone | 13 | 0.1% |
| Sioux | 13 | 0.1% |
| Slavic | 10 | 0.0% |
| Slovak | 6 | 0.0% |
| South African | 39 | 0.2% |
| South American | 9 | 0.0% |
| Spaniard | 67 | 0.3% |
| Spanish | 111 | 0.5% |
| Sri Lankan | 31 | 0.1% |
| Subsaharan African | 61 | 0.3% |
| Swedish | 497 | 2.2% |
| Swiss | 48 | 0.2% |
| Thai | 78 | 0.3% |
| Turkish | 11 | 0.1% |
| Ukrainian | 220 | 1.0% |
| Welsh | 315 | 1.4% |
| Yugoslavian | 74 | 0.3% | View All 88 Rows |
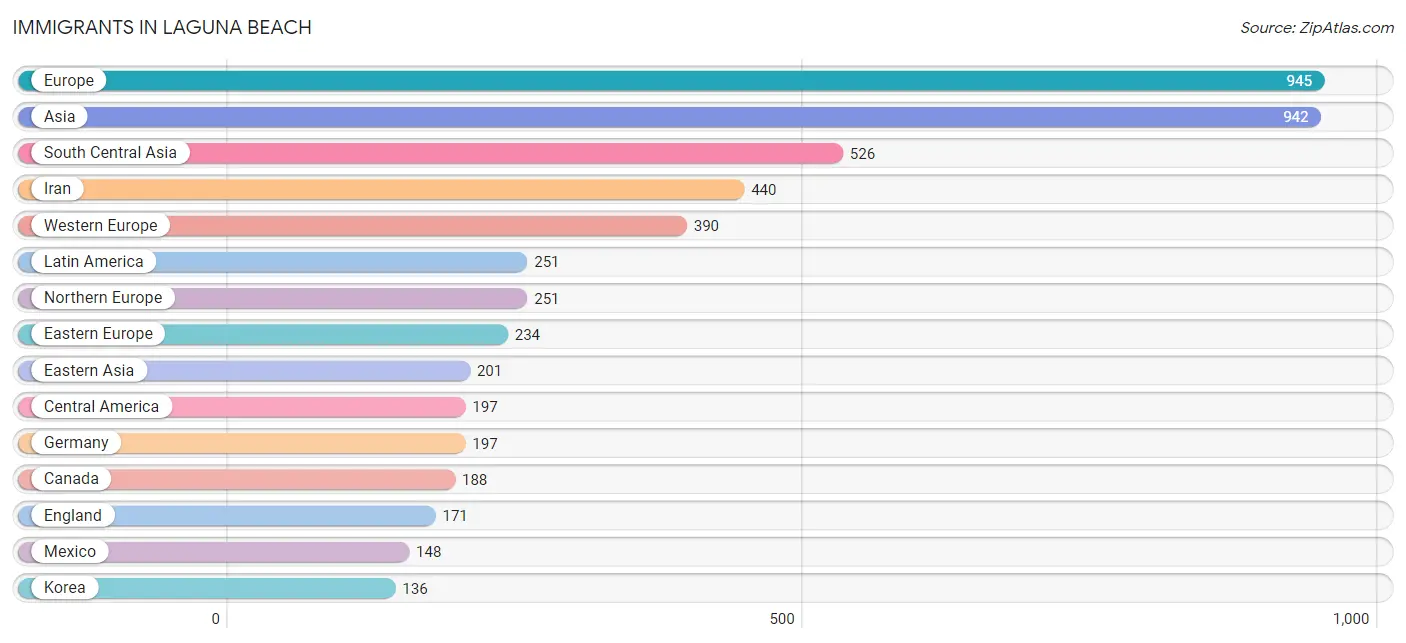
Immigrants in Laguna Beach
The most numerous immigrant groups reported in Laguna Beach came from Europe (945 | 4.1%), Asia (942 | 4.1%), South Central Asia (526 | 2.3%), Iran (440 | 1.9%), and Western Europe (390 | 1.7%), together accounting for 14.1% of all Laguna Beach residents.
| Immigration Origin | # Population | % Population |
| Afghanistan | 25 | 0.1% |
| Africa | 86 | 0.4% |
| Asia | 942 | 4.1% |
| Austria | 8 | 0.0% |
| Brazil | 33 | 0.1% |
| Bulgaria | 29 | 0.1% |
| Cambodia | 9 | 0.0% |
| Canada | 188 | 0.8% |
| Caribbean | 12 | 0.1% |
| Central America | 197 | 0.9% |
| China | 59 | 0.3% |
| Costa Rica | 10 | 0.0% |
| Cuba | 12 | 0.1% |
| Eastern Asia | 201 | 0.9% |
| Eastern Europe | 234 | 1.0% |
| Egypt | 43 | 0.2% |
| England | 171 | 0.7% |
| Europe | 945 | 4.1% |
| France | 99 | 0.4% |
| Germany | 197 | 0.9% |
| Greece | 39 | 0.2% |
| Guatemala | 25 | 0.1% |
| Hong Kong | 31 | 0.1% |
| Hungary | 34 | 0.2% |
| India | 22 | 0.1% |
| Iran | 440 | 1.9% |
| Ireland | 42 | 0.2% |
| Israel | 23 | 0.1% |
| Italy | 17 | 0.1% |
| Kazakhstan | 39 | 0.2% |
| Korea | 136 | 0.6% |
| Kuwait | 11 | 0.1% |
| Laos | 21 | 0.1% |
| Latin America | 251 | 1.1% |
| Latvia | 9 | 0.0% |
| Mexico | 148 | 0.6% |
| Moldova | 14 | 0.1% |
| Netherlands | 75 | 0.3% |
| Northern Africa | 43 | 0.2% |
| Northern Europe | 251 | 1.1% |
| Oceania | 8 | 0.0% |
| Panama | 14 | 0.1% |
| Poland | 10 | 0.0% |
| Romania | 26 | 0.1% |
| Russia | 54 | 0.2% |
| Saudi Arabia | 91 | 0.4% |
| Scotland | 12 | 0.1% |
| South Africa | 43 | 0.2% |
| South America | 42 | 0.2% |
| South Central Asia | 526 | 2.3% |
| South Eastern Asia | 90 | 0.4% |
| Southern Europe | 70 | 0.3% |
| Spain | 14 | 0.1% |
| Switzerland | 11 | 0.1% |
| Taiwan | 6 | 0.0% |
| Thailand | 10 | 0.0% |
| Ukraine | 58 | 0.3% |
| Vietnam | 50 | 0.2% |
| Western Asia | 125 | 0.5% |
| Western Europe | 390 | 1.7% | View All 60 Rows |
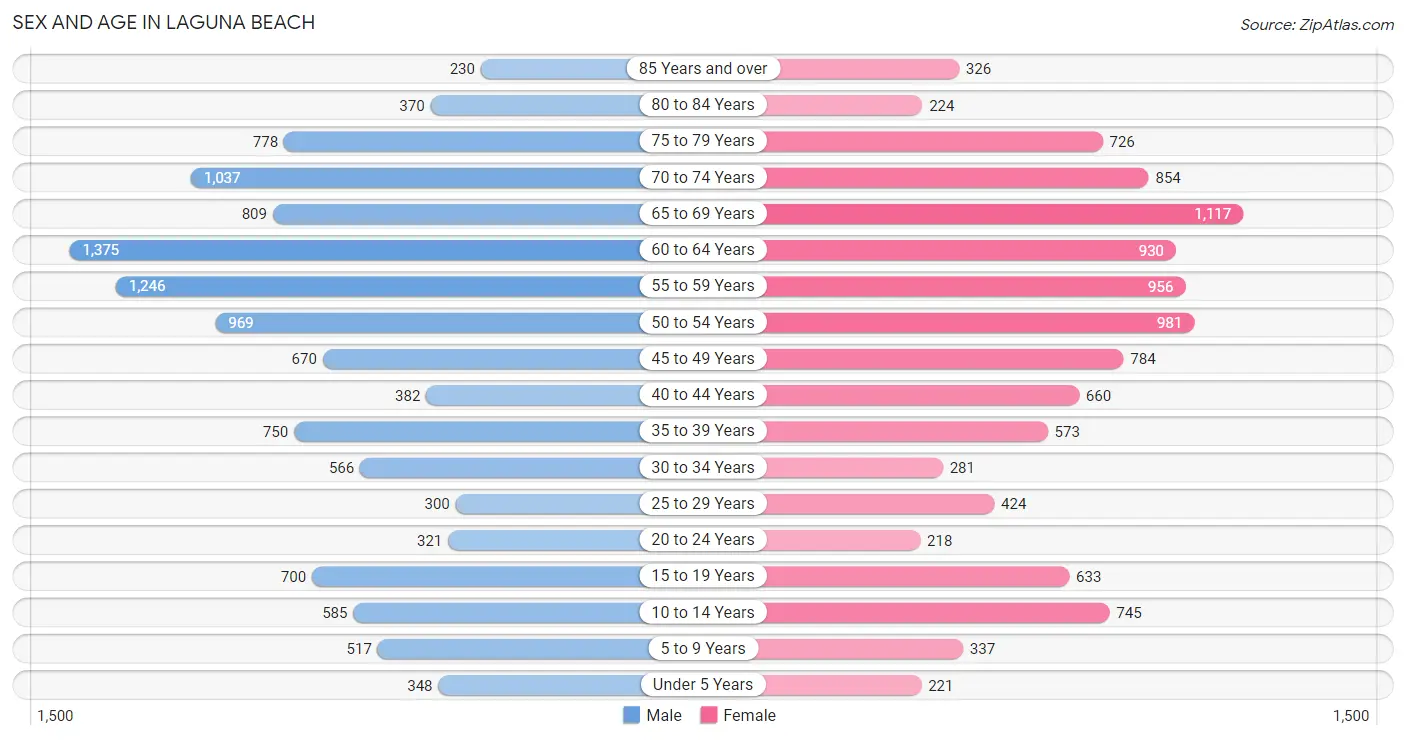
Sex and Age in Laguna Beach
Sex and Age in Laguna Beach
The most populous age groups in Laguna Beach are 60 to 64 Years (1,375 | 11.5%) for men and 65 to 69 Years (1,117 | 10.2%) for women.
| Age Bracket | Male | Female |
| Under 5 Years | 348 (2.9%) | 221 (2.0%) |
| 5 to 9 Years | 517 (4.3%) | 337 (3.1%) |
| 10 to 14 Years | 585 (4.9%) | 745 (6.8%) |
| 15 to 19 Years | 700 (5.9%) | 633 (5.8%) |
| 20 to 24 Years | 321 (2.7%) | 218 (2.0%) |
| 25 to 29 Years | 300 (2.5%) | 424 (3.9%) |
| 30 to 34 Years | 566 (4.7%) | 281 (2.6%) |
| 35 to 39 Years | 750 (6.3%) | 573 (5.2%) |
| 40 to 44 Years | 382 (3.2%) | 660 (6.0%) |
| 45 to 49 Years | 670 (5.6%) | 784 (7.1%) |
| 50 to 54 Years | 969 (8.1%) | 981 (8.9%) |
| 55 to 59 Years | 1,246 (10.4%) | 956 (8.7%) |
| 60 to 64 Years | 1,375 (11.5%) | 930 (8.5%) |
| 65 to 69 Years | 809 (6.8%) | 1,117 (10.2%) |
| 70 to 74 Years | 1,037 (8.7%) | 854 (7.8%) |
| 75 to 79 Years | 778 (6.5%) | 726 (6.6%) |
| 80 to 84 Years | 370 (3.1%) | 224 (2.0%) |
| 85 Years and over | 230 (1.9%) | 326 (3.0%) |
| Total | 11,953 (100.0%) | 10,990 (100.0%) |
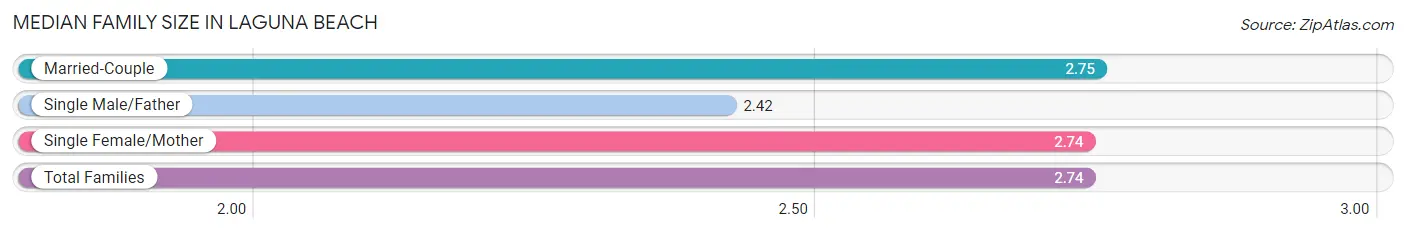
Families and Households in Laguna Beach
Median Family Size in Laguna Beach
The median family size in Laguna Beach is 2.74 persons per family, with married-couple families (5,436 | 87.1%) accounting for the largest median family size of 2.75 persons per family. On the other hand, single male/father families (331 | 5.3%) represent the smallest median family size with 2.42 persons per family.
| Family Type | # Families | Family Size |
| Married-Couple | 5,436 (87.1%) | 2.75 |
| Single Male/Father | 331 (5.3%) | 2.42 |
| Single Female/Mother | 474 (7.6%) | 2.74 |
| Total Families | 6,241 (100.0%) | 2.74 |
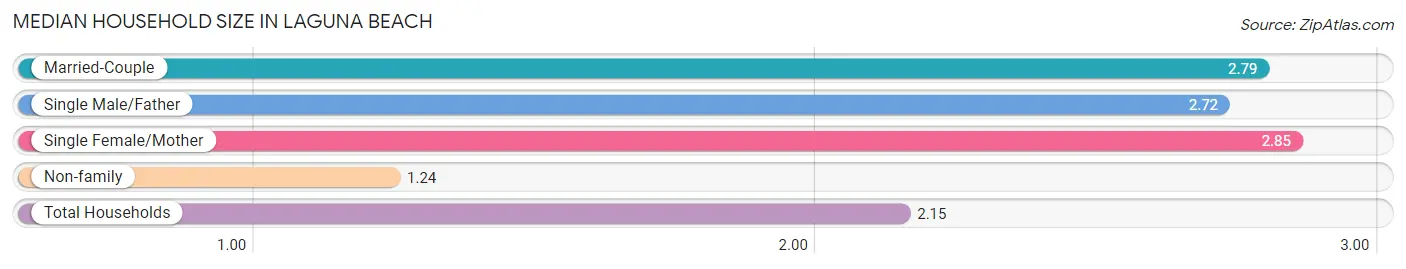
Median Household Size in Laguna Beach
The median household size in Laguna Beach is 2.15 persons per household, with single female/mother households (474 | 4.5%) accounting for the largest median household size of 2.85 persons per household. non-family households (4,377 | 41.2%) represent the smallest median household size with 1.24 persons per household.
| Household Type | # Households | Household Size |
| Married-Couple | 5,436 (51.2%) | 2.79 |
| Single Male/Father | 331 (3.1%) | 2.72 |
| Single Female/Mother | 474 (4.5%) | 2.85 |
| Non-family | 4,377 (41.2%) | 1.24 |
| Total Households | 10,618 (100.0%) | 2.15 |
Household Size by Marriage Status in Laguna Beach
Out of a total of 10,618 households in Laguna Beach, 6,241 (58.8%) are family households, while 4,377 (41.2%) are nonfamily households. The most numerous type of family households are 2-person households, comprising 3,738, and the most common type of nonfamily households are 1-person households, comprising 3,581.
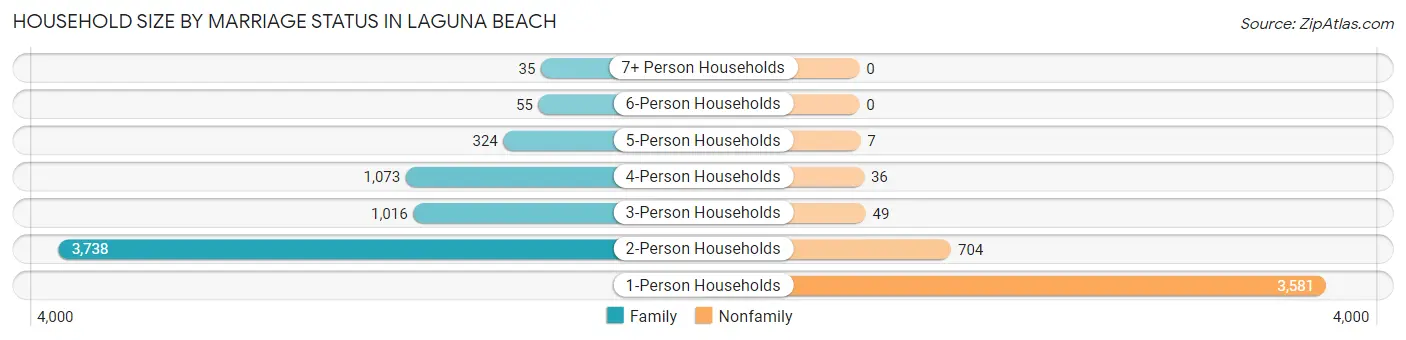
| Household Size | Family Households | Nonfamily Households |
| 1-Person Households | - | 3,581 (33.7%) |
| 2-Person Households | 3,738 (35.2%) | 704 (6.6%) |
| 3-Person Households | 1,016 (9.6%) | 49 (0.5%) |
| 4-Person Households | 1,073 (10.1%) | 36 (0.3%) |
| 5-Person Households | 324 (3.0%) | 7 (0.1%) |
| 6-Person Households | 55 (0.5%) | 0 (0.0%) |
| 7+ Person Households | 35 (0.3%) | 0 (0.0%) |
| Total | 6,241 (58.8%) | 4,377 (41.2%) |
Female Fertility in Laguna Beach
Fertility by Age in Laguna Beach
Average fertility rate in Laguna Beach is 29.0 births per 1,000 women. Women in the age bracket of 20 to 34 years have the highest fertility rate with 94.0 births per 1,000 women. Women in the age bracket of 20 to 34 years acount for 79.8% of all women with births.
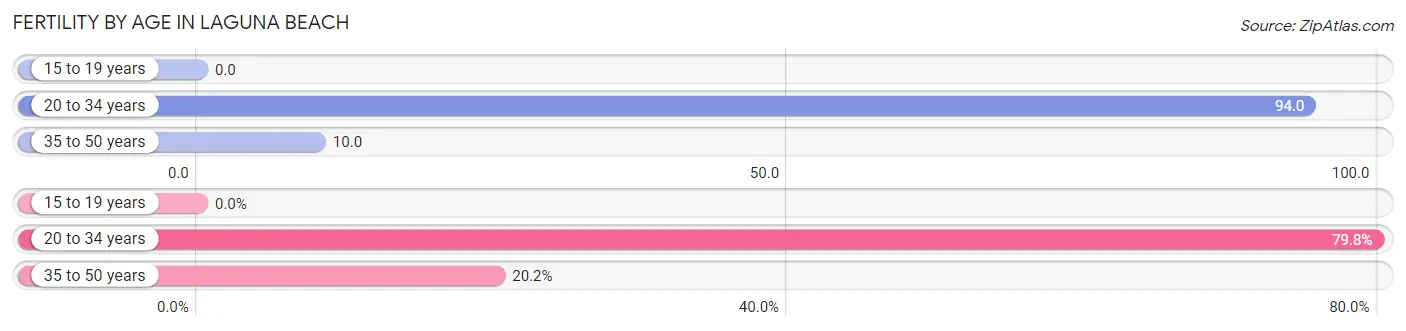
| Age Bracket | Women with Births | Births / 1,000 Women |
| 15 to 19 years | 0 (0.0%) | 0.0 |
| 20 to 34 years | 87 (79.8%) | 94.0 |
| 35 to 50 years | 22 (20.2%) | 10.0 |
| Total | 109 (100.0%) | 29.0 |
Fertility by Age by Marriage Status in Laguna Beach
47.7% of women with births (109) in Laguna Beach are married. The highest percentage of unmarried women with births falls into 20 to 34 years age bracket with 65.5% of them unmarried at the time of birth, while the lowest percentage of unmarried women with births belong to 35 to 50 years age bracket with 0.0% of them unmarried.
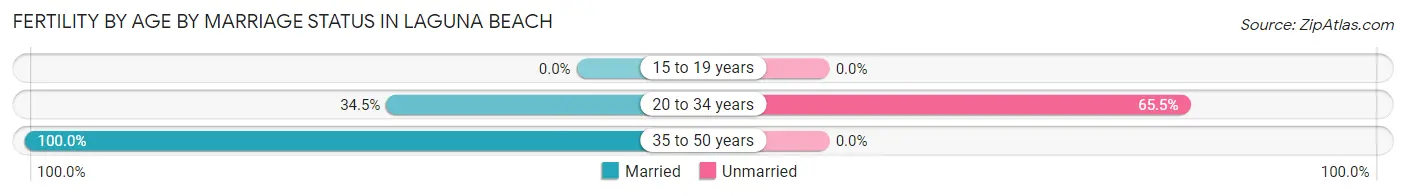
| Age Bracket | Married | Unmarried |
| 15 to 19 years | 0 (0.0%) | 0 (0.0%) |
| 20 to 34 years | 30 (34.5%) | 57 (65.5%) |
| 35 to 50 years | 22 (100.0%) | 0 (0.0%) |
| Total | 52 (47.7%) | 57 (52.3%) |
Fertility by Education in Laguna Beach
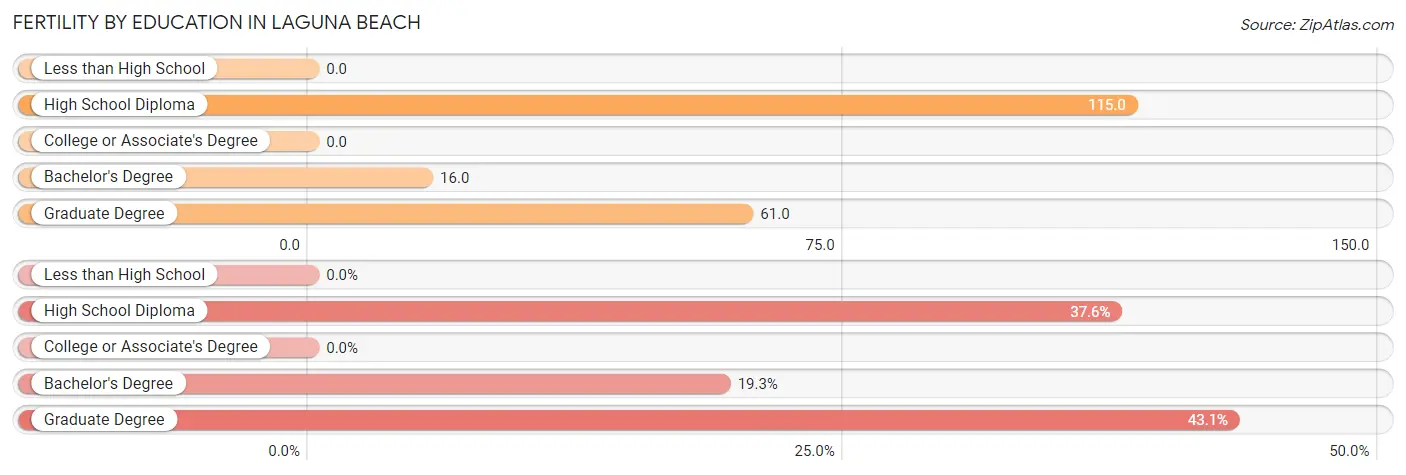
| Educational Attainment | Women with Births | Births / 1,000 Women |
| Less than High School | 0 (0.0%) | 0.0 |
| High School Diploma | 41 (37.6%) | 115.0 |
| College or Associate's Degree | 0 (0.0%) | 0.0 |
| Bachelor's Degree | 21 (19.3%) | 16.0 |
| Graduate Degree | 47 (43.1%) | 61.0 |
| Total | 109 (100.0%) | 29.0 |
Fertility by Education by Marriage Status in Laguna Beach
52.3% of women with births in Laguna Beach are unmarried. Women with the educational attainment of bachelor's degree are most likely to be married with 100.0% of them married at childbirth, while women with the educational attainment of high school diploma are least likely to be married with 100.0% of them unmarried at childbirth.
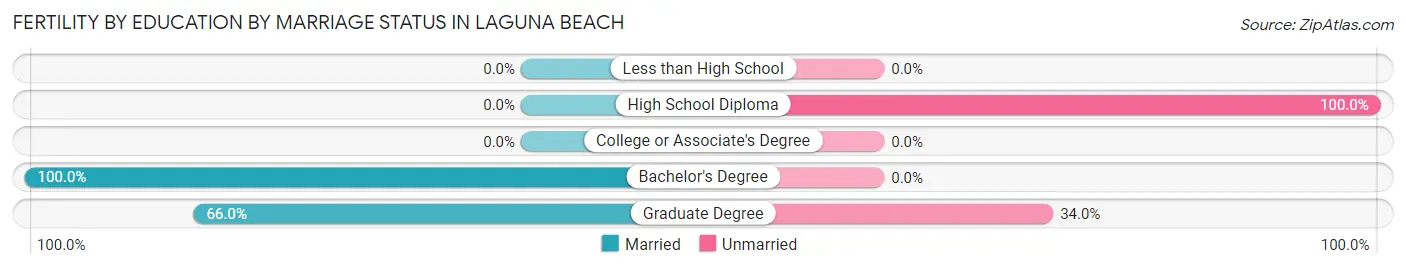
| Educational Attainment | Married | Unmarried |
| Less than High School | 0 (0.0%) | 0 (0.0%) |
| High School Diploma | 0 (0.0%) | 41 (100.0%) |
| College or Associate's Degree | 0 (0.0%) | 0 (0.0%) |
| Bachelor's Degree | 21 (100.0%) | 0 (0.0%) |
| Graduate Degree | 31 (66.0%) | 16 (34.0%) |
| Total | 52 (47.7%) | 57 (52.3%) |
Employment Characteristics in Laguna Beach
Employment by Class of Employer in Laguna Beach
Among the 10,975 employed individuals in Laguna Beach, private company employees (6,331 | 57.7%), self-employed (not incorporated) (1,599 | 14.6%), and self-employed (incorporated) (1,523 | 13.9%) make up the most common classes of employment.
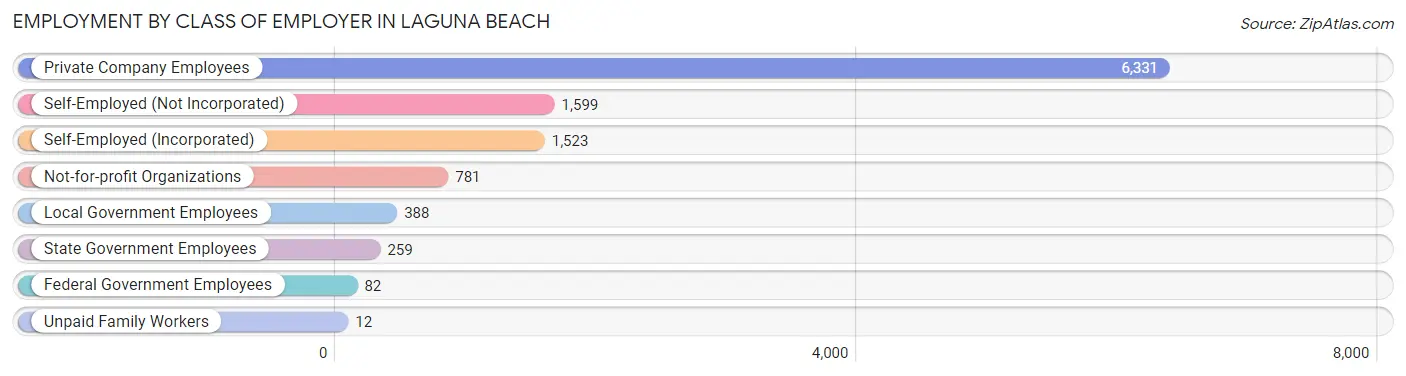
| Employer Class | # Employees | % Employees |
| Private Company Employees | 6,331 | 57.7% |
| Self-Employed (Incorporated) | 1,523 | 13.9% |
| Self-Employed (Not Incorporated) | 1,599 | 14.6% |
| Not-for-profit Organizations | 781 | 7.1% |
| Local Government Employees | 388 | 3.5% |
| State Government Employees | 259 | 2.4% |
| Federal Government Employees | 82 | 0.7% |
| Unpaid Family Workers | 12 | 0.1% |
| Total | 10,975 | 100.0% |
Employment Status by Age in Laguna Beach
According to the labor force statistics for Laguna Beach, out of the total population over 16 years of age (20,038), 60.6% or 12,143 individuals are in the labor force, with 6.8% or 826 of them unemployed. The age group with the highest labor force participation rate is 25 to 29 years, with 90.3% or 654 individuals in the labor force. Within the labor force, the 16 to 19 years age range has the highest percentage of unemployed individuals, with 16.1% or 81 of them being unemployed.
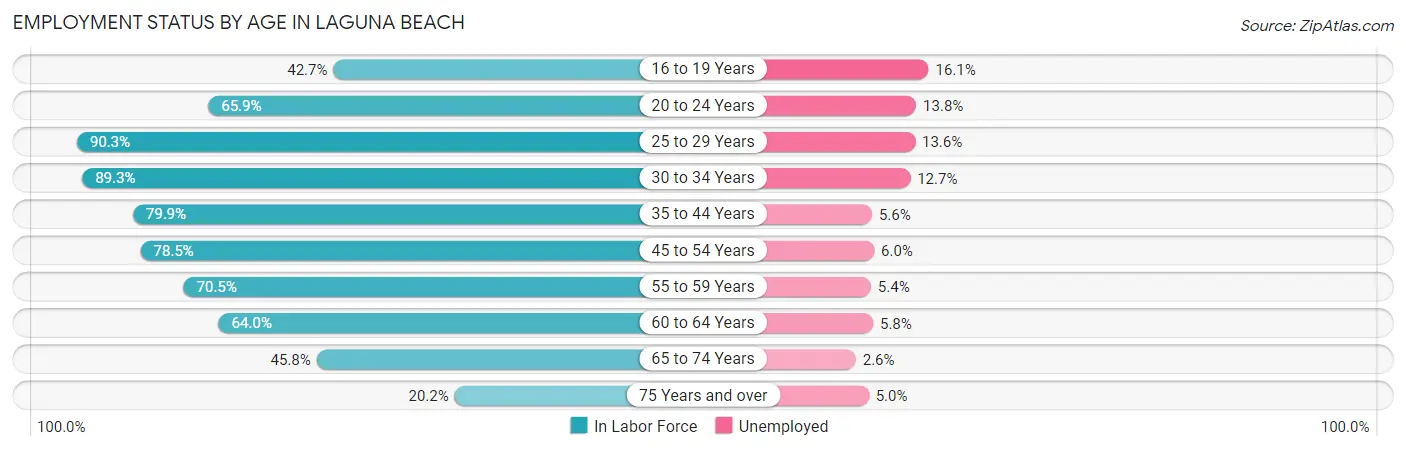
| Age Bracket | In Labor Force | Unemployed |
| 16 to 19 Years | 504 (42.7%) | 81 (16.1%) |
| 20 to 24 Years | 355 (65.9%) | 49 (13.8%) |
| 25 to 29 Years | 654 (90.3%) | 89 (13.6%) |
| 30 to 34 Years | 756 (89.3%) | 96 (12.7%) |
| 35 to 44 Years | 1,890 (79.9%) | 106 (5.6%) |
| 45 to 54 Years | 2,672 (78.5%) | 160 (6.0%) |
| 55 to 59 Years | 1,552 (70.5%) | 84 (5.4%) |
| 60 to 64 Years | 1,475 (64.0%) | 86 (5.8%) |
| 65 to 74 Years | 1,748 (45.8%) | 45 (2.6%) |
| 75 Years and over | 536 (20.2%) | 27 (5.0%) |
| Total | 12,143 (60.6%) | 826 (6.8%) |
Employment Status by Educational Attainment in Laguna Beach
According to labor force statistics for Laguna Beach, 76.0% of individuals (9,004) out of the total population between 25 and 64 years of age (11,847) are in the labor force, with 6.9% or 621 of them being unemployed. The group with the highest labor force participation rate are those with the educational attainment of less than high school, with 81.0% or 209 individuals in the labor force. Within the labor force, individuals with high school diploma education have the highest percentage of unemployment, with 15.7% or 116 of them being unemployed.
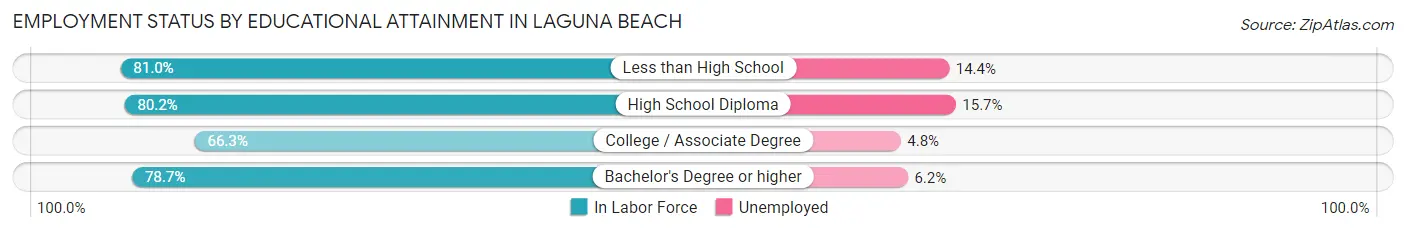
| Educational Attainment | In Labor Force | Unemployed |
| Less than High School | 209 (81.0%) | 37 (14.4%) |
| High School Diploma | 739 (80.2%) | 145 (15.7%) |
| College / Associate Degree | 1,837 (66.3%) | 133 (4.8%) |
| Bachelor's Degree or higher | 6,216 (78.7%) | 490 (6.2%) |
| Total | 9,004 (76.0%) | 817 (6.9%) |
Employment Occupations by Sex in Laguna Beach
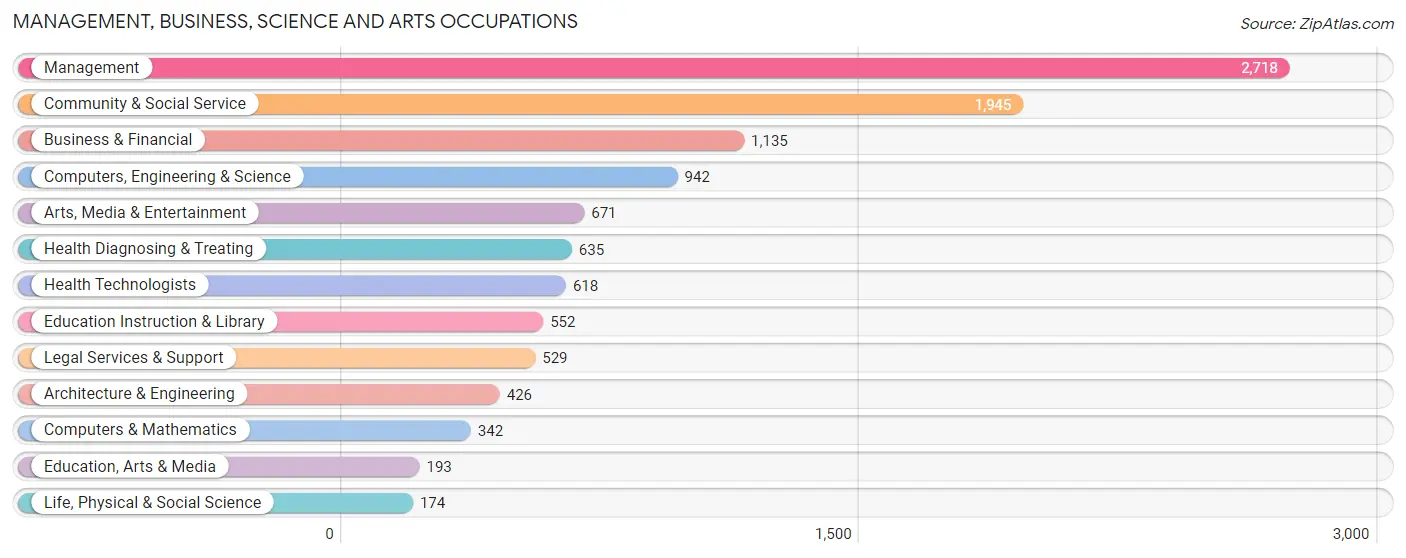
Management, Business, Science and Arts Occupations
The most common Management, Business, Science and Arts occupations in Laguna Beach are Management (2,718 | 24.0%), Community & Social Service (1,945 | 17.2%), Business & Financial (1,135 | 10.0%), Computers, Engineering & Science (942 | 8.3%), and Arts, Media & Entertainment (671 | 5.9%).
Management, Business, Science and Arts Occupations by Sex
Within the Management, Business, Science and Arts occupations in Laguna Beach, the most male-oriented occupations are Architecture & Engineering (95.8%), Computers & Mathematics (85.1%), and Computers, Engineering & Science (84.6%), while the most female-oriented occupations are Education, Arts & Media (100.0%), Education Instruction & Library (66.5%), and Community & Social Service (59.1%).
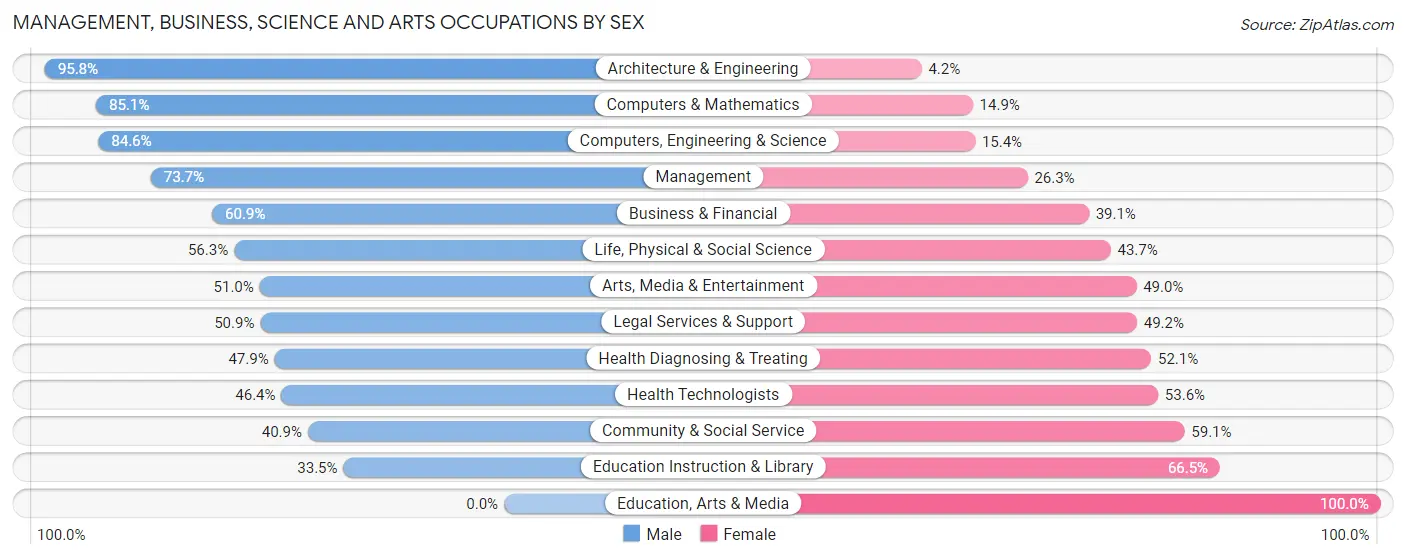
| Occupation | Male | Female |
| Management | 2,002 (73.7%) | 716 (26.3%) |
| Business & Financial | 691 (60.9%) | 444 (39.1%) |
| Computers, Engineering & Science | 797 (84.6%) | 145 (15.4%) |
| Computers & Mathematics | 291 (85.1%) | 51 (14.9%) |
| Architecture & Engineering | 408 (95.8%) | 18 (4.2%) |
| Life, Physical & Social Science | 98 (56.3%) | 76 (43.7%) |
| Community & Social Service | 796 (40.9%) | 1,149 (59.1%) |
| Education, Arts & Media | 0 (0.0%) | 193 (100.0%) |
| Legal Services & Support | 269 (50.8%) | 260 (49.1%) |
| Education Instruction & Library | 185 (33.5%) | 367 (66.5%) |
| Arts, Media & Entertainment | 342 (51.0%) | 329 (49.0%) |
| Health Diagnosing & Treating | 304 (47.9%) | 331 (52.1%) |
| Health Technologists | 287 (46.4%) | 331 (53.6%) |
| Total (Category) | 4,590 (62.2%) | 2,785 (37.8%) |
| Total (Overall) | 6,943 (61.3%) | 4,379 (38.7%) |
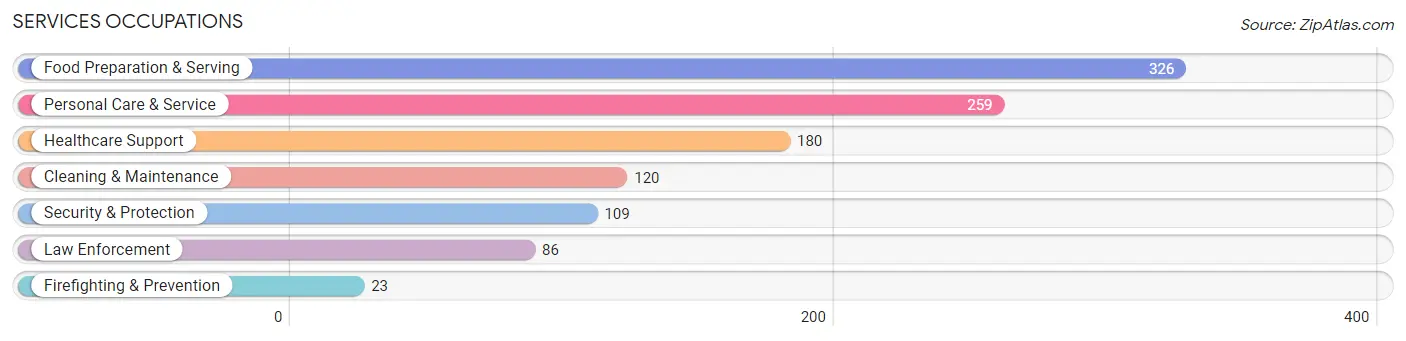
Services Occupations
The most common Services occupations in Laguna Beach are Food Preparation & Serving (326 | 2.9%), Personal Care & Service (259 | 2.3%), Healthcare Support (180 | 1.6%), Cleaning & Maintenance (120 | 1.1%), and Security & Protection (109 | 1.0%).
Services Occupations by Sex
Within the Services occupations in Laguna Beach, the most male-oriented occupations are Firefighting & Prevention (100.0%), Security & Protection (69.7%), and Healthcare Support (67.8%), while the most female-oriented occupations are Food Preparation & Serving (63.8%), Personal Care & Service (52.1%), and Cleaning & Maintenance (39.2%).
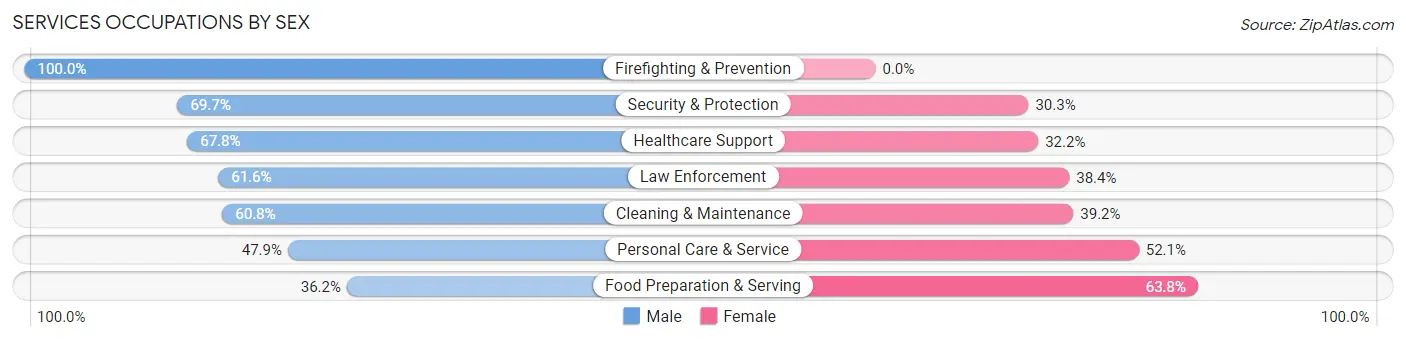
| Occupation | Male | Female |
| Healthcare Support | 122 (67.8%) | 58 (32.2%) |
| Security & Protection | 76 (69.7%) | 33 (30.3%) |
| Firefighting & Prevention | 23 (100.0%) | 0 (0.0%) |
| Law Enforcement | 53 (61.6%) | 33 (38.4%) |
| Food Preparation & Serving | 118 (36.2%) | 208 (63.8%) |
| Cleaning & Maintenance | 73 (60.8%) | 47 (39.2%) |
| Personal Care & Service | 124 (47.9%) | 135 (52.1%) |
| Total (Category) | 513 (51.6%) | 481 (48.4%) |
| Total (Overall) | 6,943 (61.3%) | 4,379 (38.7%) |
Sales and Office Occupations
The most common Sales and Office occupations in Laguna Beach are Sales & Related (1,564 | 13.8%), and Office & Administration (587 | 5.2%).
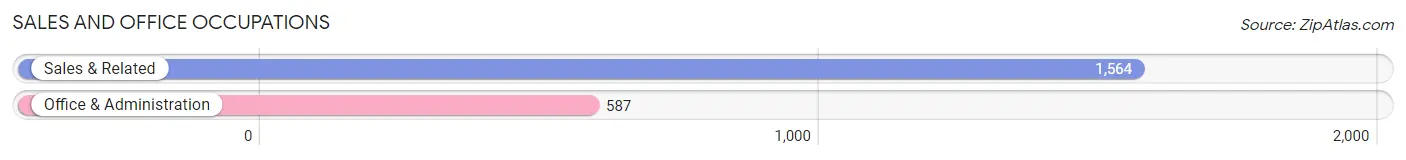
Sales and Office Occupations by Sex
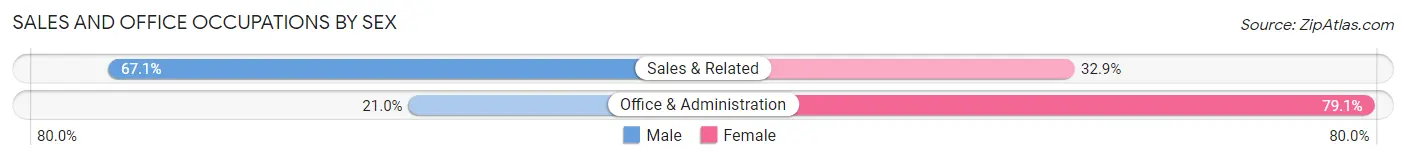
| Occupation | Male | Female |
| Sales & Related | 1,050 (67.1%) | 514 (32.9%) |
| Office & Administration | 123 (20.9%) | 464 (79.0%) |
| Total (Category) | 1,173 (54.5%) | 978 (45.5%) |
| Total (Overall) | 6,943 (61.3%) | 4,379 (38.7%) |
Natural Resources, Construction and Maintenance Occupations
The most common Natural Resources, Construction and Maintenance occupations in Laguna Beach are Installation, Maintenance & Repair (259 | 2.3%), Construction & Extraction (175 | 1.5%), and Farming, Fishing & Forestry (12 | 0.1%).
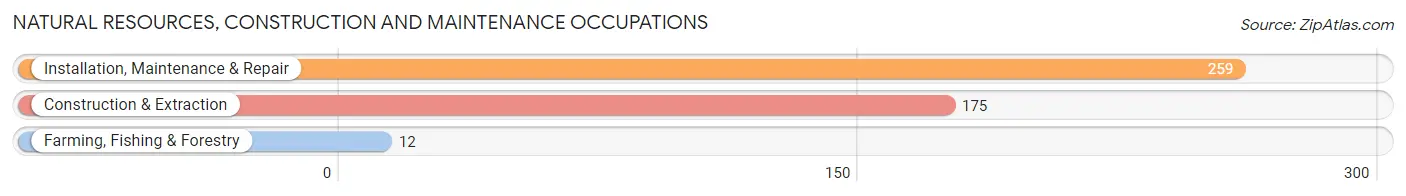
Natural Resources, Construction and Maintenance Occupations by Sex
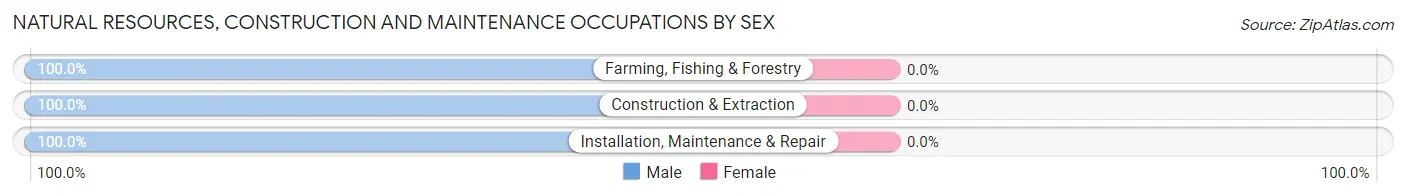
| Occupation | Male | Female |
| Farming, Fishing & Forestry | 12 (100.0%) | 0 (0.0%) |
| Construction & Extraction | 175 (100.0%) | 0 (0.0%) |
| Installation, Maintenance & Repair | 259 (100.0%) | 0 (0.0%) |
| Total (Category) | 446 (100.0%) | 0 (0.0%) |
| Total (Overall) | 6,943 (61.3%) | 4,379 (38.7%) |
Production, Transportation and Moving Occupations
The most common Production, Transportation and Moving occupations in Laguna Beach are Production (217 | 1.9%), Transportation (75 | 0.7%), and Material Moving (64 | 0.6%).
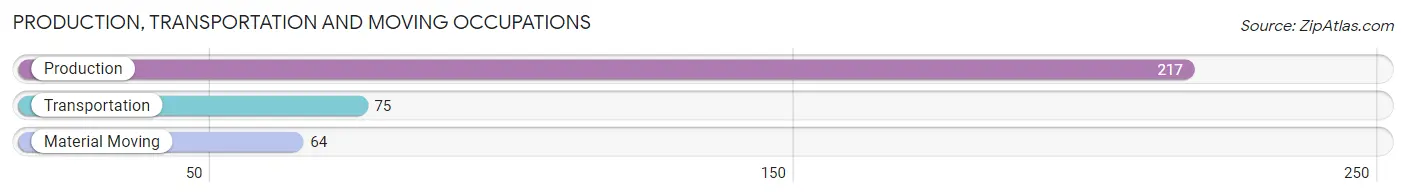
Production, Transportation and Moving Occupations by Sex
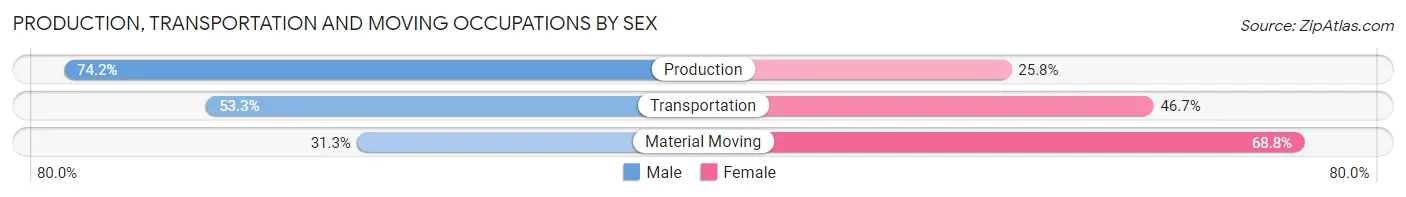
| Occupation | Male | Female |
| Production | 161 (74.2%) | 56 (25.8%) |
| Transportation | 40 (53.3%) | 35 (46.7%) |
| Material Moving | 20 (31.2%) | 44 (68.8%) |
| Total (Category) | 221 (62.1%) | 135 (37.9%) |
| Total (Overall) | 6,943 (61.3%) | 4,379 (38.7%) |
Employment Industries by Sex in Laguna Beach
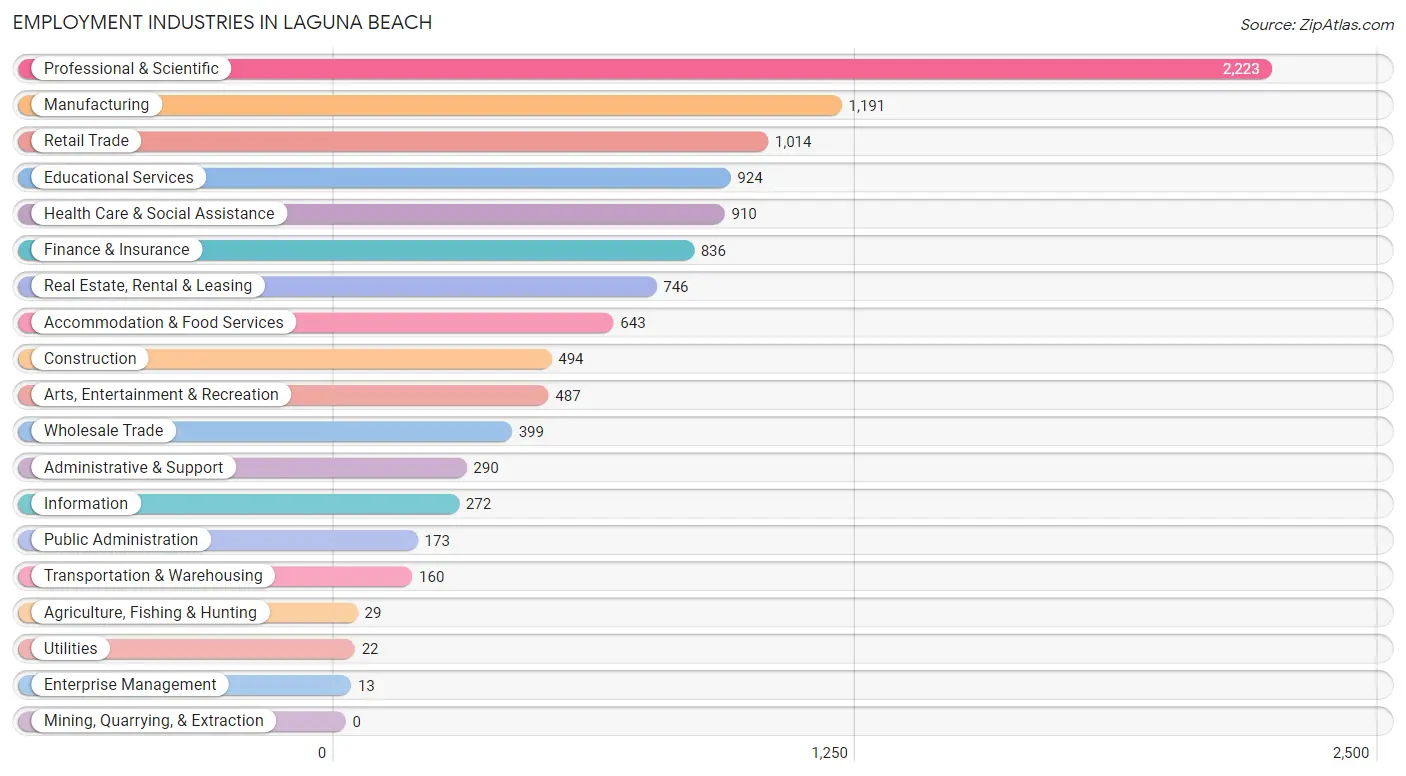
Employment Industries in Laguna Beach
The major employment industries in Laguna Beach include Professional & Scientific (2,223 | 19.6%), Manufacturing (1,191 | 10.5%), Retail Trade (1,014 | 9.0%), Educational Services (924 | 8.2%), and Health Care & Social Assistance (910 | 8.0%).
Employment Industries by Sex in Laguna Beach
The Laguna Beach industries that see more men than women are Agriculture, Fishing & Hunting (100.0%), Utilities (100.0%), and Enterprise Management (100.0%), whereas the industries that tend to have a higher number of women are Administrative & Support (80.3%), Educational Services (67.1%), and Public Administration (56.1%).
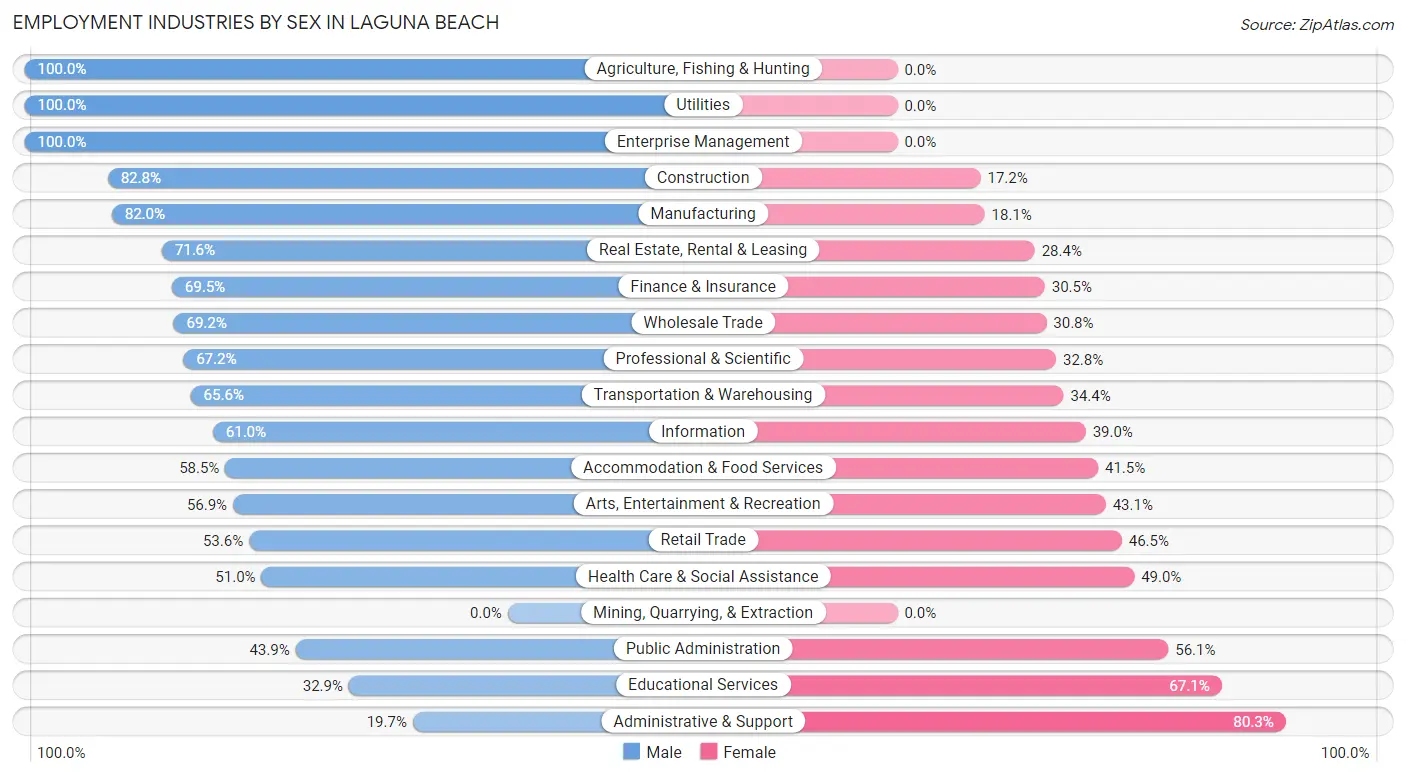
| Industry | Male | Female |
| Agriculture, Fishing & Hunting | 29 (100.0%) | 0 (0.0%) |
| Mining, Quarrying, & Extraction | 0 (0.0%) | 0 (0.0%) |
| Construction | 409 (82.8%) | 85 (17.2%) |
| Manufacturing | 976 (82.0%) | 215 (18.0%) |
| Wholesale Trade | 276 (69.2%) | 123 (30.8%) |
| Retail Trade | 543 (53.5%) | 471 (46.5%) |
| Transportation & Warehousing | 105 (65.6%) | 55 (34.4%) |
| Utilities | 22 (100.0%) | 0 (0.0%) |
| Information | 166 (61.0%) | 106 (39.0%) |
| Finance & Insurance | 581 (69.5%) | 255 (30.5%) |
| Real Estate, Rental & Leasing | 534 (71.6%) | 212 (28.4%) |
| Professional & Scientific | 1,493 (67.2%) | 730 (32.8%) |
| Enterprise Management | 13 (100.0%) | 0 (0.0%) |
| Administrative & Support | 57 (19.7%) | 233 (80.3%) |
| Educational Services | 304 (32.9%) | 620 (67.1%) |
| Health Care & Social Assistance | 464 (51.0%) | 446 (49.0%) |
| Arts, Entertainment & Recreation | 277 (56.9%) | 210 (43.1%) |
| Accommodation & Food Services | 376 (58.5%) | 267 (41.5%) |
| Public Administration | 76 (43.9%) | 97 (56.1%) |
| Total | 6,943 (61.3%) | 4,379 (38.7%) |
Education in Laguna Beach
School Enrollment in Laguna Beach
The most common levels of schooling among the 4,520 students in Laguna Beach are high school (1,298 | 28.7%), middle school (1,031 | 22.8%), and college / undergraduate (733 | 16.2%).
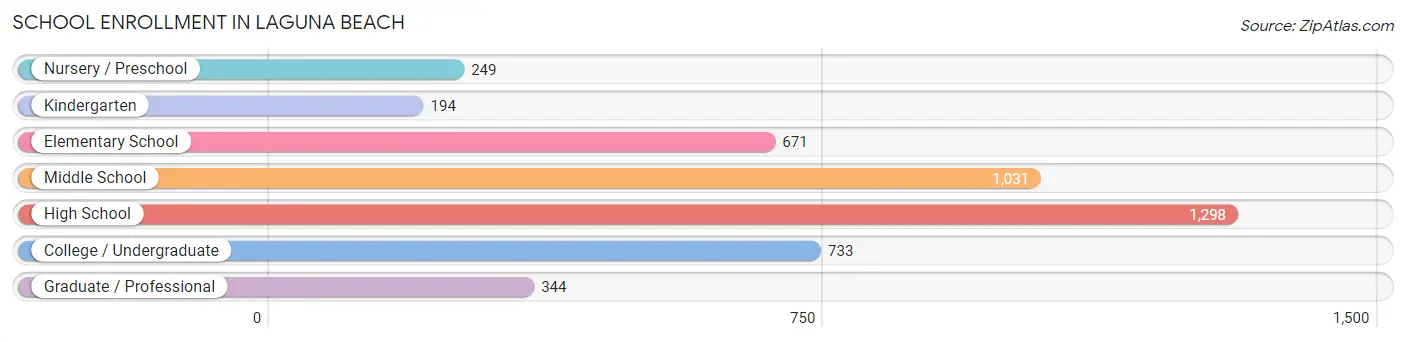
| School Level | # Students | % Students |
| Nursery / Preschool | 249 | 5.5% |
| Kindergarten | 194 | 4.3% |
| Elementary School | 671 | 14.8% |
| Middle School | 1,031 | 22.8% |
| High School | 1,298 | 28.7% |
| College / Undergraduate | 733 | 16.2% |
| Graduate / Professional | 344 | 7.6% |
| Total | 4,520 | 100.0% |
School Enrollment by Age by Funding Source in Laguna Beach
Out of a total of 4,520 students who are enrolled in schools in Laguna Beach, 1,112 (24.6%) attend a private institution, while the remaining 3,408 (75.4%) are enrolled in public schools. The age group of 3 to 4 year olds has the highest likelihood of being enrolled in private schools, with 159 (82.8% in the age bracket) enrolled. Conversely, the age group of 25 to 34 year olds has the lowest likelihood of being enrolled in a private school, with 168 (87.1% in the age bracket) attending a public institution.
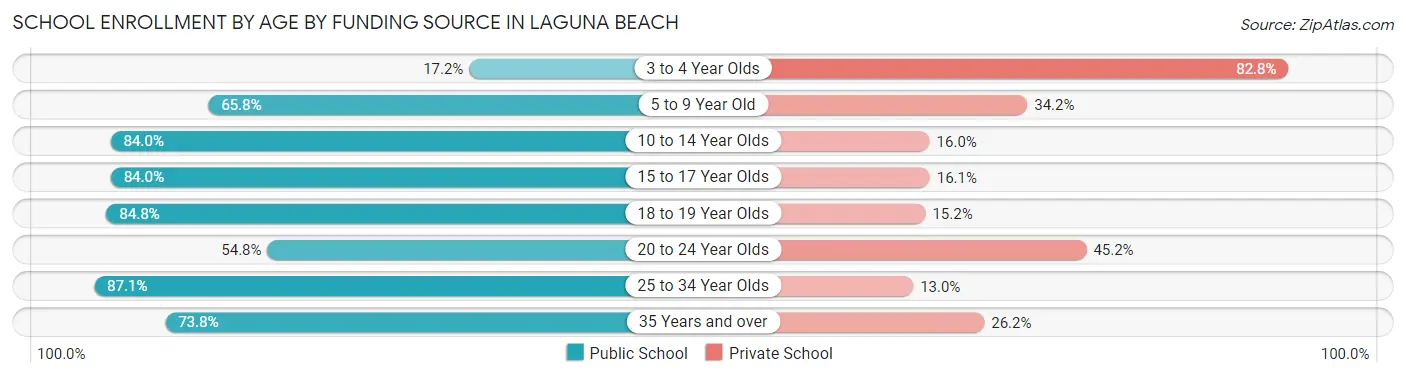
| Age Bracket | Public School | Private School |
| 3 to 4 Year Olds | 33 (17.2%) | 159 (82.8%) |
| 5 to 9 Year Old | 523 (65.8%) | 272 (34.2%) |
| 10 to 14 Year Olds | 1,117 (84.0%) | 213 (16.0%) |
| 15 to 17 Year Olds | 722 (84.0%) | 138 (16.1%) |
| 18 to 19 Year Olds | 356 (84.8%) | 64 (15.2%) |
| 20 to 24 Year Olds | 149 (54.8%) | 123 (45.2%) |
| 25 to 34 Year Olds | 168 (87.1%) | 25 (13.0%) |
| 35 Years and over | 338 (73.8%) | 120 (26.2%) |
| Total | 3,408 (75.4%) | 1,112 (24.6%) |
Educational Attainment by Field of Study in Laguna Beach
Business (2,705 | 21.0%), social sciences (1,487 | 11.6%), engineering (987 | 7.7%), education (940 | 7.3%), and science & technology (920 | 7.1%) are the most common fields of study among 12,859 individuals in Laguna Beach who have obtained a bachelor's degree or higher.
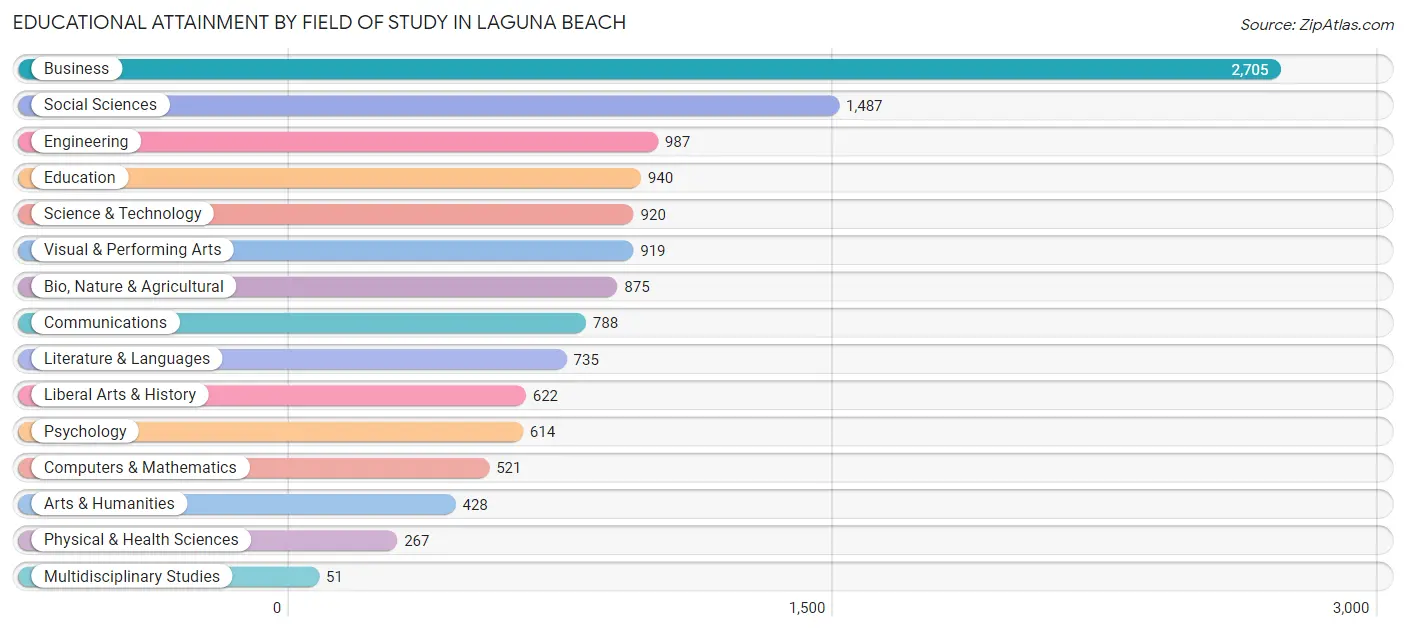
| Field of Study | # Graduates | % Graduates |
| Computers & Mathematics | 521 | 4.1% |
| Bio, Nature & Agricultural | 875 | 6.8% |
| Physical & Health Sciences | 267 | 2.1% |
| Psychology | 614 | 4.8% |
| Social Sciences | 1,487 | 11.6% |
| Engineering | 987 | 7.7% |
| Multidisciplinary Studies | 51 | 0.4% |
| Science & Technology | 920 | 7.1% |
| Business | 2,705 | 21.0% |
| Education | 940 | 7.3% |
| Literature & Languages | 735 | 5.7% |
| Liberal Arts & History | 622 | 4.8% |
| Visual & Performing Arts | 919 | 7.1% |
| Communications | 788 | 6.1% |
| Arts & Humanities | 428 | 3.3% |
| Total | 12,859 | 100.0% |
Transportation & Commute in Laguna Beach
Vehicle Availability by Sex in Laguna Beach
The most prevalent vehicle ownership categories in Laguna Beach are males with 2 vehicles (3,050, accounting for 44.7%) and females with 2 vehicles (1,675, making up 73.5%).
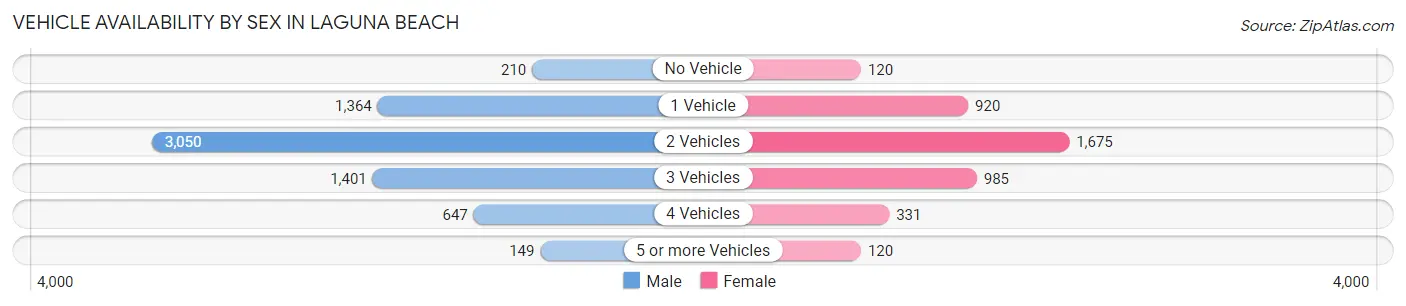
| Vehicles Available | Male | Female |
| No Vehicle | 210 (3.1%) | 120 (2.9%) |
| 1 Vehicle | 1,364 (20.0%) | 920 (22.2%) |
| 2 Vehicles | 3,050 (44.7%) | 1,675 (40.4%) |
| 3 Vehicles | 1,401 (20.5%) | 985 (23.7%) |
| 4 Vehicles | 647 (9.5%) | 331 (8.0%) |
| 5 or more Vehicles | 149 (2.2%) | 120 (2.9%) |
| Total | 6,821 (100.0%) | 4,151 (100.0%) |
Commute Time in Laguna Beach
The most frequently occuring commute durations in Laguna Beach are 20 to 24 minutes (1,271 commuters, 16.6%), 5 to 9 minutes (1,099 commuters, 14.4%), and 30 to 34 minutes (1,079 commuters, 14.1%).
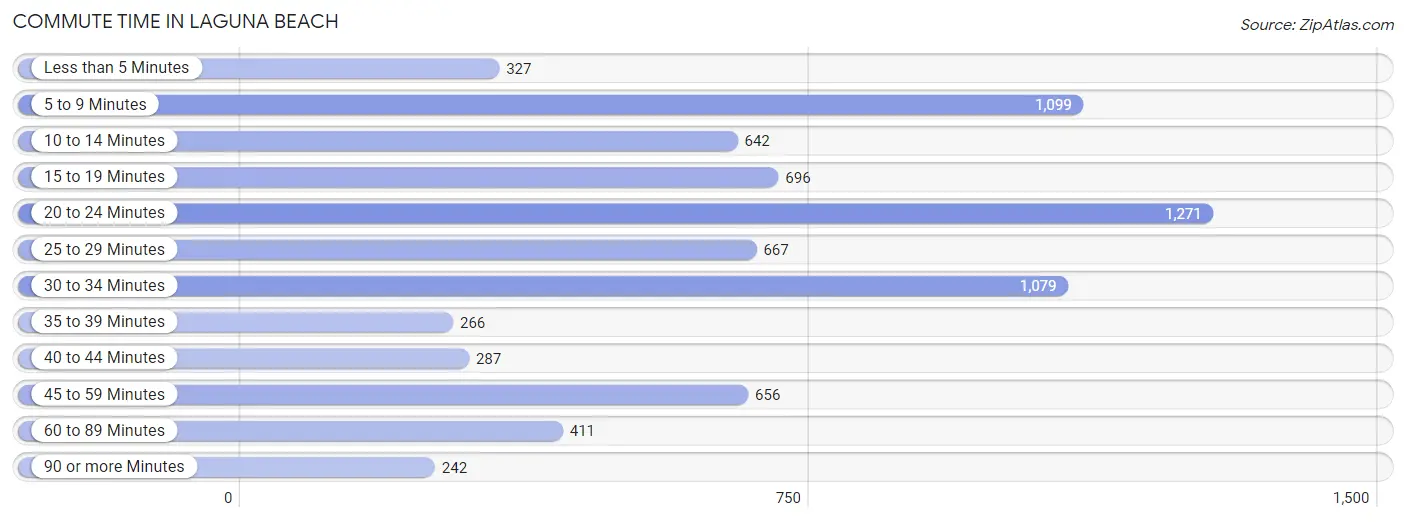
| Commute Time | # Commuters | % Commuters |
| Less than 5 Minutes | 327 | 4.3% |
| 5 to 9 Minutes | 1,099 | 14.4% |
| 10 to 14 Minutes | 642 | 8.4% |
| 15 to 19 Minutes | 696 | 9.1% |
| 20 to 24 Minutes | 1,271 | 16.6% |
| 25 to 29 Minutes | 667 | 8.7% |
| 30 to 34 Minutes | 1,079 | 14.1% |
| 35 to 39 Minutes | 266 | 3.5% |
| 40 to 44 Minutes | 287 | 3.8% |
| 45 to 59 Minutes | 656 | 8.6% |
| 60 to 89 Minutes | 411 | 5.4% |
| 90 or more Minutes | 242 | 3.2% |
Commute Time by Sex in Laguna Beach
The most common commute times in Laguna Beach are 20 to 24 minutes (801 commuters, 17.0%) for males and 5 to 9 minutes (598 commuters, 20.4%) for females.
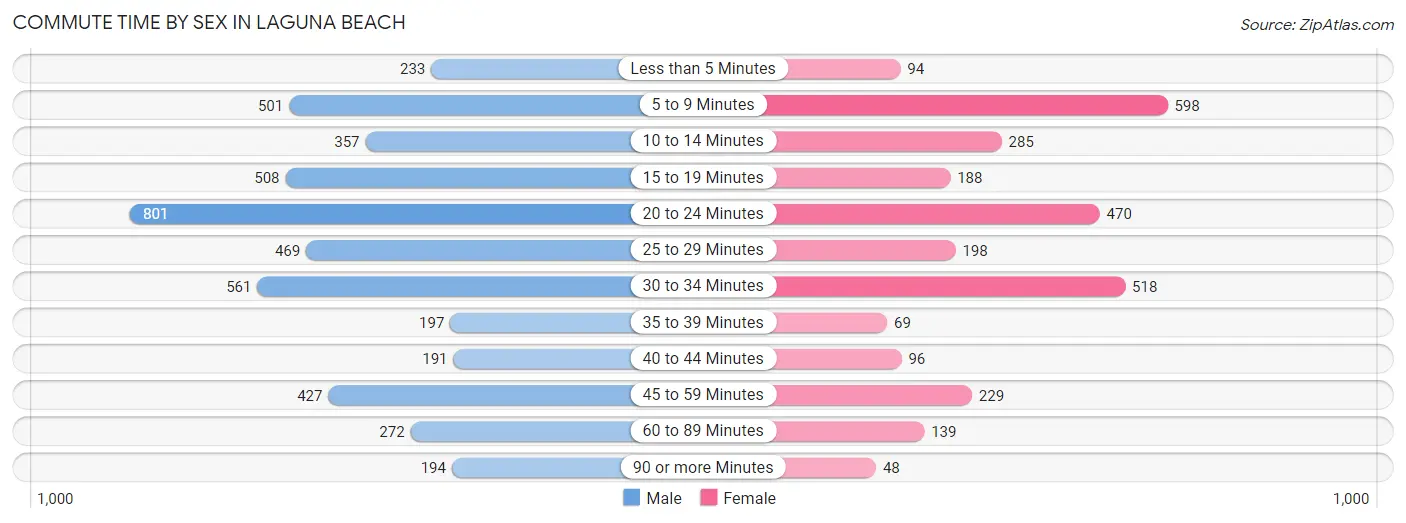
| Commute Time | Male | Female |
| Less than 5 Minutes | 233 (5.0%) | 94 (3.2%) |
| 5 to 9 Minutes | 501 (10.6%) | 598 (20.4%) |
| 10 to 14 Minutes | 357 (7.6%) | 285 (9.7%) |
| 15 to 19 Minutes | 508 (10.8%) | 188 (6.4%) |
| 20 to 24 Minutes | 801 (17.0%) | 470 (16.0%) |
| 25 to 29 Minutes | 469 (10.0%) | 198 (6.8%) |
| 30 to 34 Minutes | 561 (11.9%) | 518 (17.7%) |
| 35 to 39 Minutes | 197 (4.2%) | 69 (2.4%) |
| 40 to 44 Minutes | 191 (4.1%) | 96 (3.3%) |
| 45 to 59 Minutes | 427 (9.1%) | 229 (7.8%) |
| 60 to 89 Minutes | 272 (5.8%) | 139 (4.7%) |
| 90 or more Minutes | 194 (4.1%) | 48 (1.6%) |
Time of Departure to Work by Sex in Laguna Beach
The most frequent times of departure to work in Laguna Beach are 8:00 AM to 8:29 AM (898, 19.1%) for males and 8:00 AM to 8:29 AM (429, 14.6%) for females.
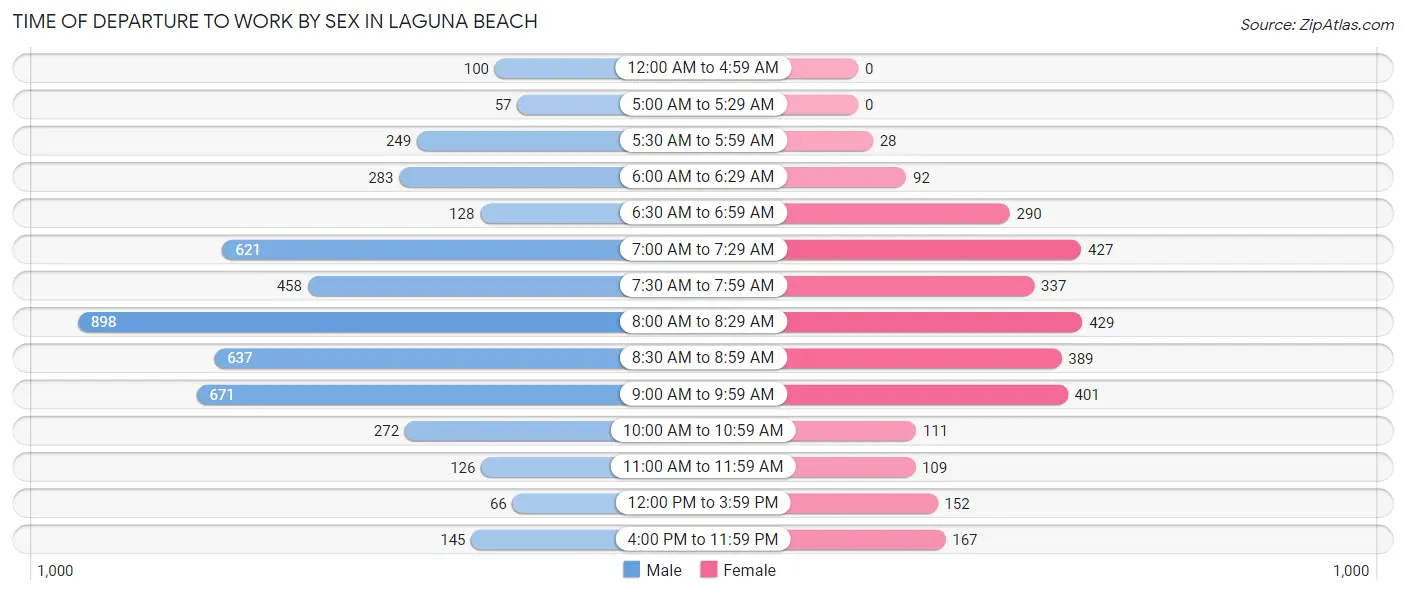
| Time of Departure | Male | Female |
| 12:00 AM to 4:59 AM | 100 (2.1%) | 0 (0.0%) |
| 5:00 AM to 5:29 AM | 57 (1.2%) | 0 (0.0%) |
| 5:30 AM to 5:59 AM | 249 (5.3%) | 28 (0.9%) |
| 6:00 AM to 6:29 AM | 283 (6.0%) | 92 (3.1%) |
| 6:30 AM to 6:59 AM | 128 (2.7%) | 290 (9.9%) |
| 7:00 AM to 7:29 AM | 621 (13.2%) | 427 (14.6%) |
| 7:30 AM to 7:59 AM | 458 (9.7%) | 337 (11.5%) |
| 8:00 AM to 8:29 AM | 898 (19.1%) | 429 (14.6%) |
| 8:30 AM to 8:59 AM | 637 (13.5%) | 389 (13.3%) |
| 9:00 AM to 9:59 AM | 671 (14.2%) | 401 (13.7%) |
| 10:00 AM to 10:59 AM | 272 (5.8%) | 111 (3.8%) |
| 11:00 AM to 11:59 AM | 126 (2.7%) | 109 (3.7%) |
| 12:00 PM to 3:59 PM | 66 (1.4%) | 152 (5.2%) |
| 4:00 PM to 11:59 PM | 145 (3.1%) | 167 (5.7%) |
| Total | 4,711 (100.0%) | 2,932 (100.0%) |
Housing Occupancy in Laguna Beach
Occupancy by Ownership in Laguna Beach
Of the total 10,618 dwellings in Laguna Beach, owner-occupied units account for 7,146 (67.3%), while renter-occupied units make up 3,472 (32.7%).
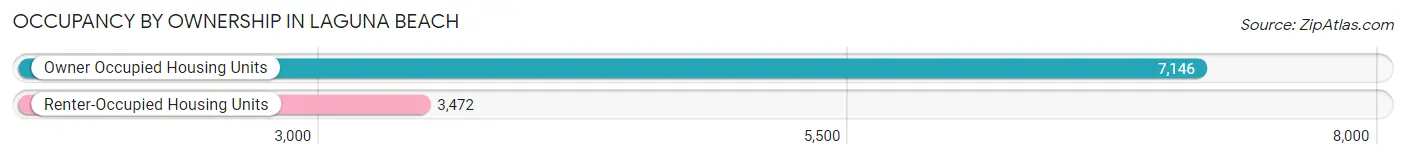
| Occupancy | # Housing Units | % Housing Units |
| Owner Occupied Housing Units | 7,146 | 67.3% |
| Renter-Occupied Housing Units | 3,472 | 32.7% |
| Total Occupied Housing Units | 10,618 | 100.0% |
Occupancy by Household Size in Laguna Beach
| Household Size | # Housing Units | % Housing Units |
| 1-Person Household | 3,581 | 33.7% |
| 2-Person Household | 4,442 | 41.8% |
| 3-Person Household | 1,065 | 10.0% |
| 4+ Person Household | 1,530 | 14.4% |
| Total Housing Units | 10,618 | 100.0% |
Occupancy by Ownership by Household Size in Laguna Beach
| Household Size | Owner-occupied | Renter-occupied |
| 1-Person Household | 1,720 (48.0%) | 1,861 (52.0%) |
| 2-Person Household | 3,438 (77.4%) | 1,004 (22.6%) |
| 3-Person Household | 854 (80.2%) | 211 (19.8%) |
| 4+ Person Household | 1,134 (74.1%) | 396 (25.9%) |
| Total Housing Units | 7,146 (67.3%) | 3,472 (32.7%) |
Occupancy by Educational Attainment in Laguna Beach
| Household Size | Owner-occupied | Renter-occupied |
| Less than High School | 25 (17.1%) | 121 (82.9%) |
| High School Diploma | 351 (53.1%) | 310 (46.9%) |
| College/Associate Degree | 1,624 (61.8%) | 1,003 (38.2%) |
| Bachelor's Degree or higher | 5,146 (71.6%) | 2,038 (28.4%) |
Occupancy by Age of Householder in Laguna Beach
| Age Bracket | # Households | % Households |
| Under 35 Years | 689 | 6.5% |
| 35 to 44 Years | 1,276 | 12.0% |
| 45 to 54 Years | 1,960 | 18.5% |
| 55 to 64 Years | 2,695 | 25.4% |
| 65 to 74 Years | 2,294 | 21.6% |
| 75 to 84 Years | 1,325 | 12.5% |
| 85 Years and Over | 379 | 3.6% |
| Total | 10,618 | 100.0% |
Housing Finances in Laguna Beach
Median Income by Occupancy in Laguna Beach
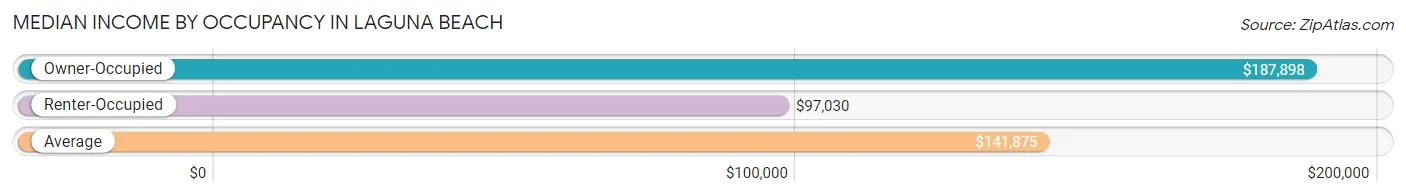
| Occupancy Type | # Households | Median Income |
| Owner-Occupied | 7,146 (67.3%) | $187,898 |
| Renter-Occupied | 3,472 (32.7%) | $97,030 |
| Average | 10,618 (100.0%) | $141,875 |
Occupancy by Householder Income Bracket in Laguna Beach
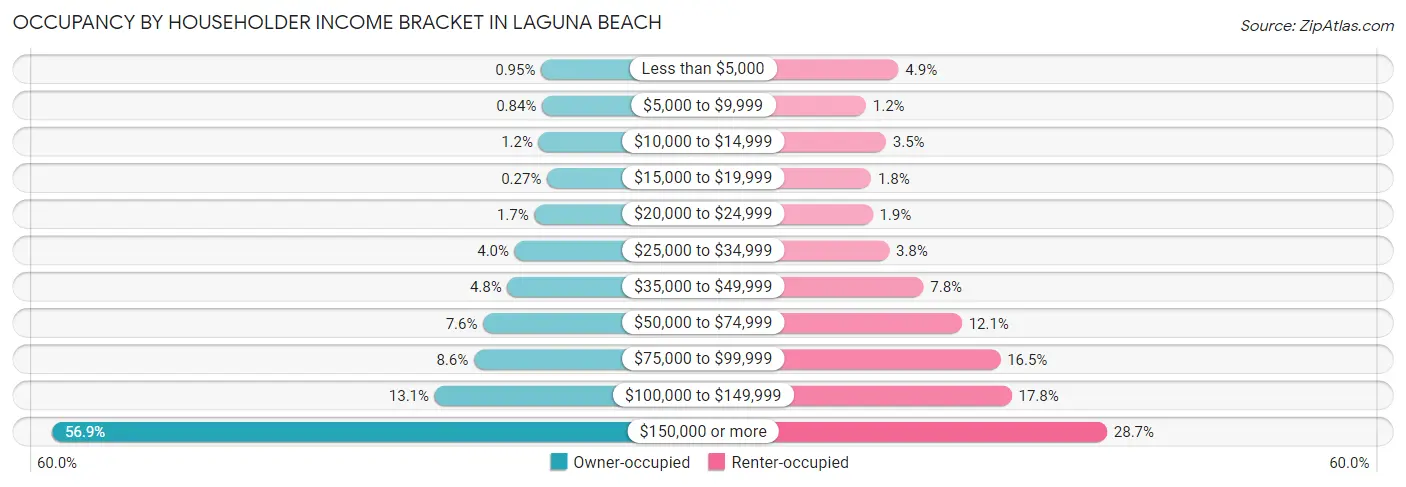
| Income Bracket | Owner-occupied | Renter-occupied |
| Less than $5,000 | 68 (0.9%) | 170 (4.9%) |
| $5,000 to $9,999 | 60 (0.8%) | 41 (1.2%) |
| $10,000 to $14,999 | 88 (1.2%) | 120 (3.5%) |
| $15,000 to $19,999 | 19 (0.3%) | 61 (1.8%) |
| $20,000 to $24,999 | 123 (1.7%) | 67 (1.9%) |
| $25,000 to $34,999 | 284 (4.0%) | 133 (3.8%) |
| $35,000 to $49,999 | 344 (4.8%) | 269 (7.7%) |
| $50,000 to $74,999 | 542 (7.6%) | 421 (12.1%) |
| $75,000 to $99,999 | 617 (8.6%) | 574 (16.5%) |
| $100,000 to $149,999 | 937 (13.1%) | 619 (17.8%) |
| $150,000 or more | 4,064 (56.9%) | 997 (28.7%) |
| Total | 7,146 (100.0%) | 3,472 (100.0%) |
Monthly Housing Cost Tiers in Laguna Beach
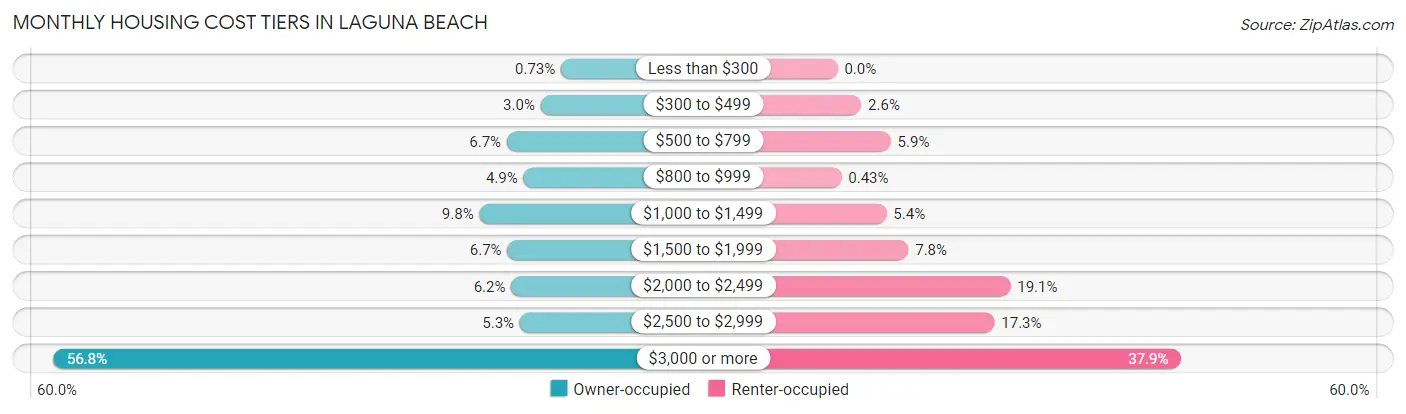
| Monthly Cost | Owner-occupied | Renter-occupied |
| Less than $300 | 52 (0.7%) | 0 (0.0%) |
| $300 to $499 | 213 (3.0%) | 91 (2.6%) |
| $500 to $799 | 480 (6.7%) | 204 (5.9%) |
| $800 to $999 | 349 (4.9%) | 15 (0.4%) |
| $1,000 to $1,499 | 697 (9.8%) | 188 (5.4%) |
| $1,500 to $1,999 | 476 (6.7%) | 272 (7.8%) |
| $2,000 to $2,499 | 445 (6.2%) | 663 (19.1%) |
| $2,500 to $2,999 | 377 (5.3%) | 602 (17.3%) |
| $3,000 or more | 4,057 (56.8%) | 1,315 (37.9%) |
| Total | 7,146 (100.0%) | 3,472 (100.0%) |
Physical Housing Characteristics in Laguna Beach
Housing Structures in Laguna Beach
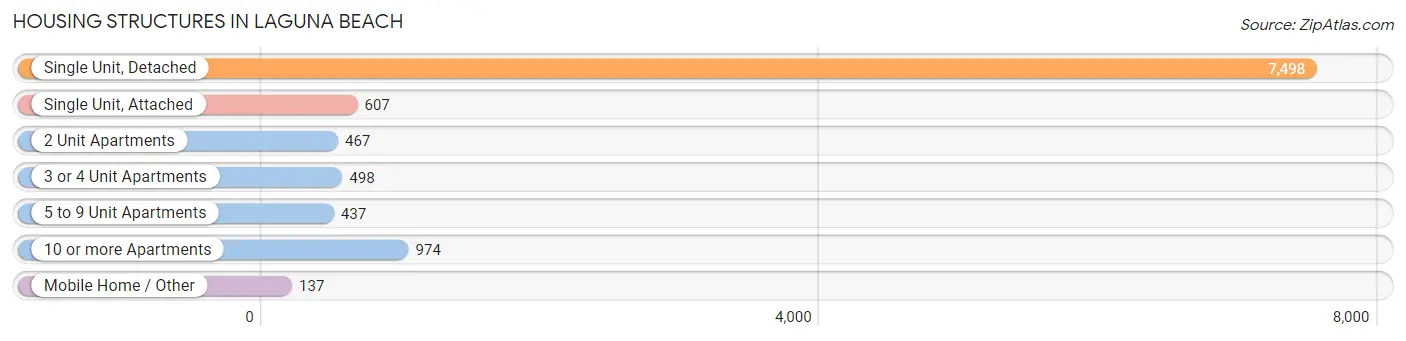
| Structure Type | # Housing Units | % Housing Units |
| Single Unit, Detached | 7,498 | 70.6% |
| Single Unit, Attached | 607 | 5.7% |
| 2 Unit Apartments | 467 | 4.4% |
| 3 or 4 Unit Apartments | 498 | 4.7% |
| 5 to 9 Unit Apartments | 437 | 4.1% |
| 10 or more Apartments | 974 | 9.2% |
| Mobile Home / Other | 137 | 1.3% |
| Total | 10,618 | 100.0% |
Housing Structures by Occupancy in Laguna Beach
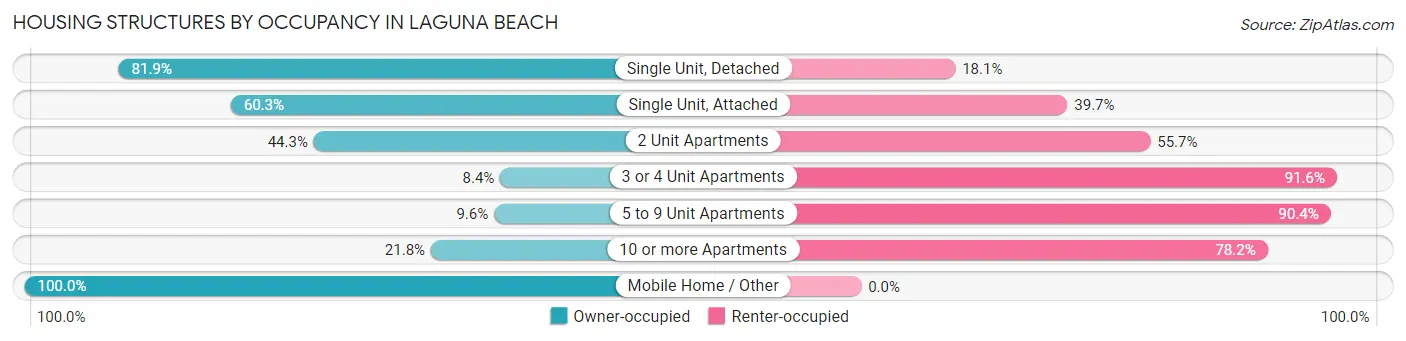
| Structure Type | Owner-occupied | Renter-occupied |
| Single Unit, Detached | 6,140 (81.9%) | 1,358 (18.1%) |
| Single Unit, Attached | 366 (60.3%) | 241 (39.7%) |
| 2 Unit Apartments | 207 (44.3%) | 260 (55.7%) |
| 3 or 4 Unit Apartments | 42 (8.4%) | 456 (91.6%) |
| 5 to 9 Unit Apartments | 42 (9.6%) | 395 (90.4%) |
| 10 or more Apartments | 212 (21.8%) | 762 (78.2%) |
| Mobile Home / Other | 137 (100.0%) | 0 (0.0%) |
| Total | 7,146 (67.3%) | 3,472 (32.7%) |
Housing Structures by Number of Rooms in Laguna Beach
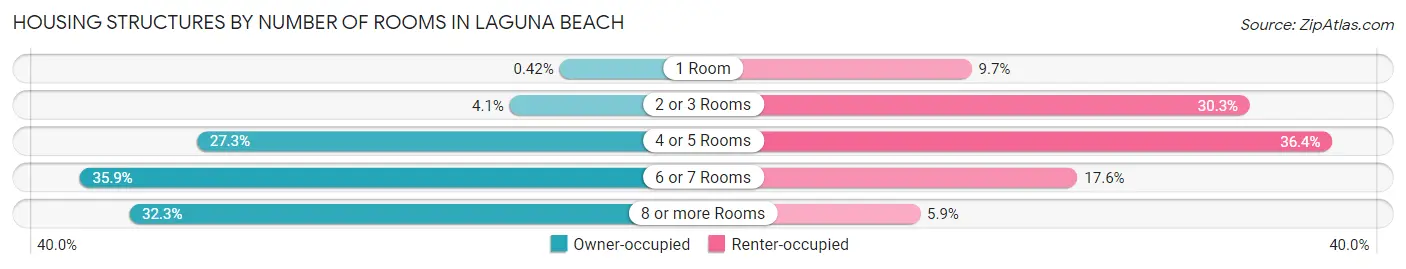
| Number of Rooms | Owner-occupied | Renter-occupied |
| 1 Room | 30 (0.4%) | 338 (9.7%) |
| 2 or 3 Rooms | 294 (4.1%) | 1,053 (30.3%) |
| 4 or 5 Rooms | 1,948 (27.3%) | 1,265 (36.4%) |
| 6 or 7 Rooms | 2,568 (35.9%) | 610 (17.6%) |
| 8 or more Rooms | 2,306 (32.3%) | 206 (5.9%) |
| Total | 7,146 (100.0%) | 3,472 (100.0%) |
Housing Structure by Heating Type in Laguna Beach
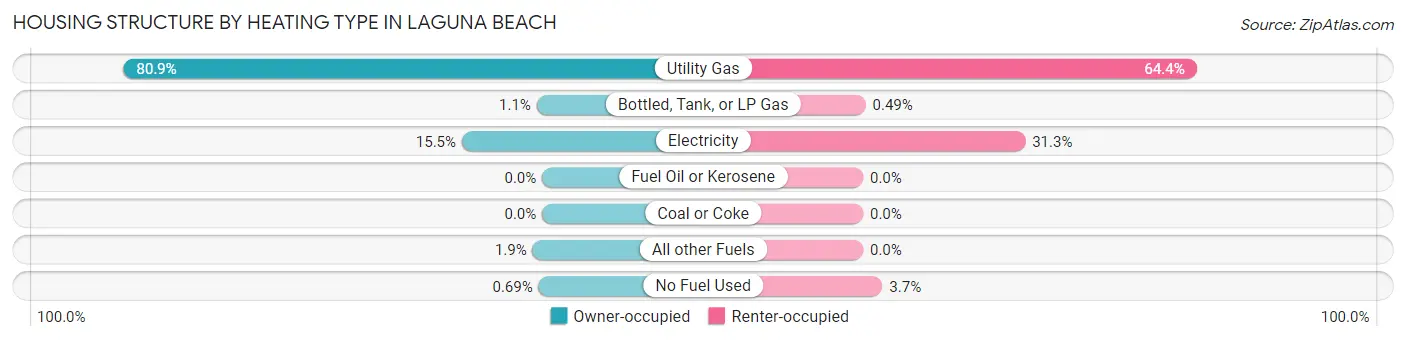
| Heating Type | Owner-occupied | Renter-occupied |
| Utility Gas | 5,782 (80.9%) | 2,237 (64.4%) |
| Bottled, Tank, or LP Gas | 75 (1.1%) | 17 (0.5%) |
| Electricity | 1,108 (15.5%) | 1,088 (31.3%) |
| Fuel Oil or Kerosene | 0 (0.0%) | 0 (0.0%) |
| Coal or Coke | 0 (0.0%) | 0 (0.0%) |
| All other Fuels | 132 (1.8%) | 0 (0.0%) |
| No Fuel Used | 49 (0.7%) | 130 (3.7%) |
| Total | 7,146 (100.0%) | 3,472 (100.0%) |
Household Vehicle Usage in Laguna Beach
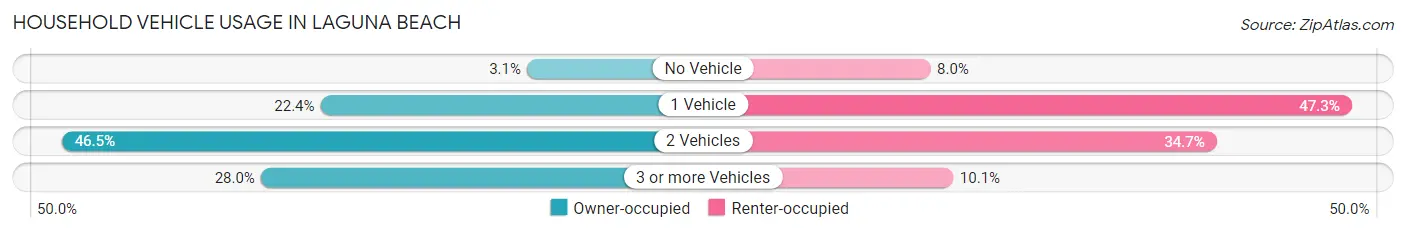
| Vehicles per Household | Owner-occupied | Renter-occupied |
| No Vehicle | 223 (3.1%) | 276 (8.0%) |
| 1 Vehicle | 1,600 (22.4%) | 1,642 (47.3%) |
| 2 Vehicles | 3,325 (46.5%) | 1,204 (34.7%) |
| 3 or more Vehicles | 1,998 (28.0%) | 350 (10.1%) |
| Total | 7,146 (100.0%) | 3,472 (100.0%) |
Real Estate & Mortgages in Laguna Beach
Real Estate and Mortgage Overview in Laguna Beach
| Characteristic | Without Mortgage | With Mortgage |
| Housing Units | 2,695 | 4,451 |
| Median Property Value | $2,000,001 | $2,000,001 |
| Median Household Income | $145,058 | $2,811 |
| Monthly Housing Costs | $1,202 | $3,722 |
| Real Estate Taxes | $7,967 | $9 |
Property Value by Mortgage Status in Laguna Beach
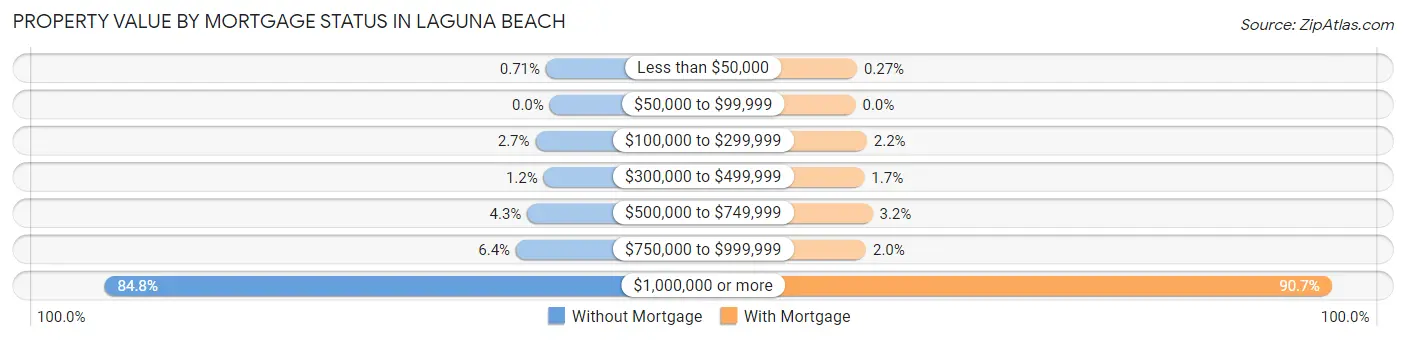
| Property Value | Without Mortgage | With Mortgage |
| Less than $50,000 | 19 (0.7%) | 12 (0.3%) |
| $50,000 to $99,999 | 0 (0.0%) | 0 (0.0%) |
| $100,000 to $299,999 | 73 (2.7%) | 96 (2.2%) |
| $300,000 to $499,999 | 31 (1.1%) | 75 (1.7%) |
| $500,000 to $749,999 | 115 (4.3%) | 144 (3.2%) |
| $750,000 to $999,999 | 173 (6.4%) | 89 (2.0%) |
| $1,000,000 or more | 2,284 (84.8%) | 4,035 (90.6%) |
| Total | 2,695 (100.0%) | 4,451 (100.0%) |
Household Income by Mortgage Status in Laguna Beach
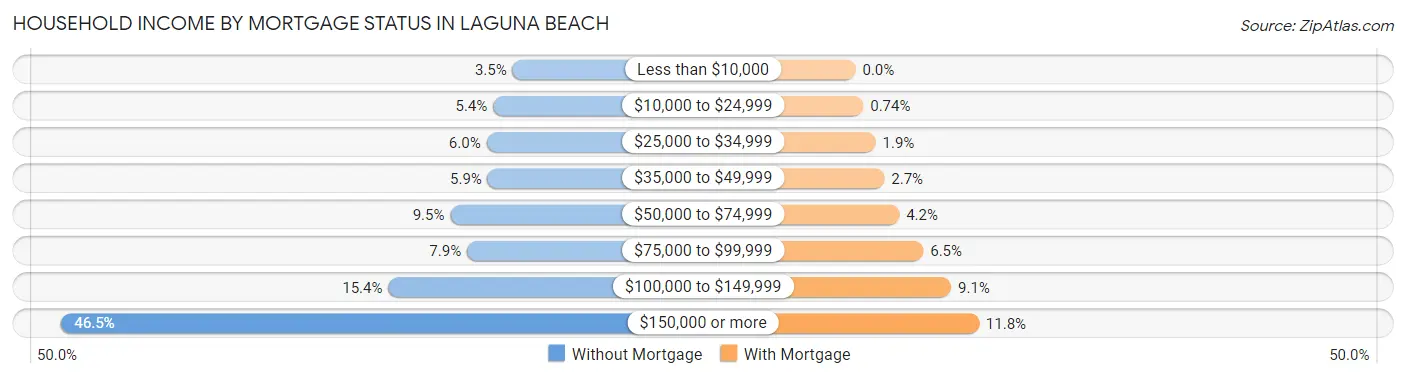
| Household Income | Without Mortgage | With Mortgage |
| Less than $10,000 | 95 (3.5%) | 0 (0.0%) |
| $10,000 to $24,999 | 145 (5.4%) | 33 (0.7%) |
| $25,000 to $34,999 | 162 (6.0%) | 85 (1.9%) |
| $35,000 to $49,999 | 159 (5.9%) | 122 (2.7%) |
| $50,000 to $74,999 | 255 (9.5%) | 185 (4.2%) |
| $75,000 to $99,999 | 212 (7.9%) | 287 (6.5%) |
| $100,000 to $149,999 | 414 (15.4%) | 405 (9.1%) |
| $150,000 or more | 1,253 (46.5%) | 523 (11.7%) |
| Total | 2,695 (100.0%) | 4,451 (100.0%) |
Property Value to Household Income Ratio in Laguna Beach
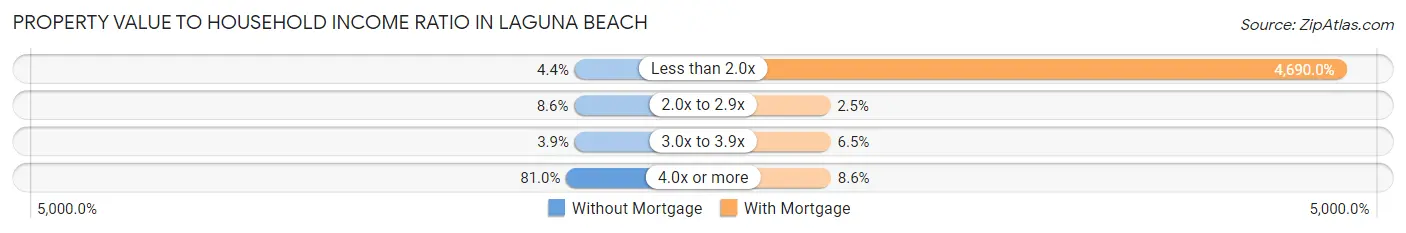
| Value-to-Income Ratio | Without Mortgage | With Mortgage |
| Less than 2.0x | 119 (4.4%) | 208,750 (4,690.0%) |
| 2.0x to 2.9x | 231 (8.6%) | 113 (2.5%) |
| 3.0x to 3.9x | 104 (3.9%) | 289 (6.5%) |
| 4.0x or more | 2,182 (81.0%) | 383 (8.6%) |
| Total | 2,695 (100.0%) | 4,451 (100.0%) |
Real Estate Taxes by Mortgage Status in Laguna Beach
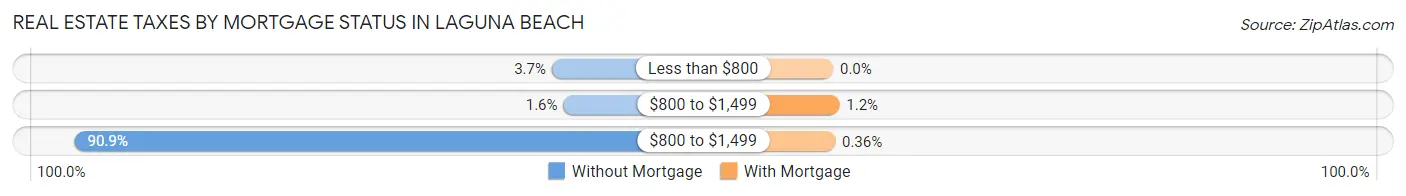
| Property Taxes | Without Mortgage | With Mortgage |
| Less than $800 | 100 (3.7%) | 0 (0.0%) |
| $800 to $1,499 | 43 (1.6%) | 51 (1.1%) |
| $800 to $1,499 | 2,449 (90.9%) | 16 (0.4%) |
| Total | 2,695 (100.0%) | 4,451 (100.0%) |
Health & Disability in Laguna Beach
Health Insurance Coverage by Age in Laguna Beach
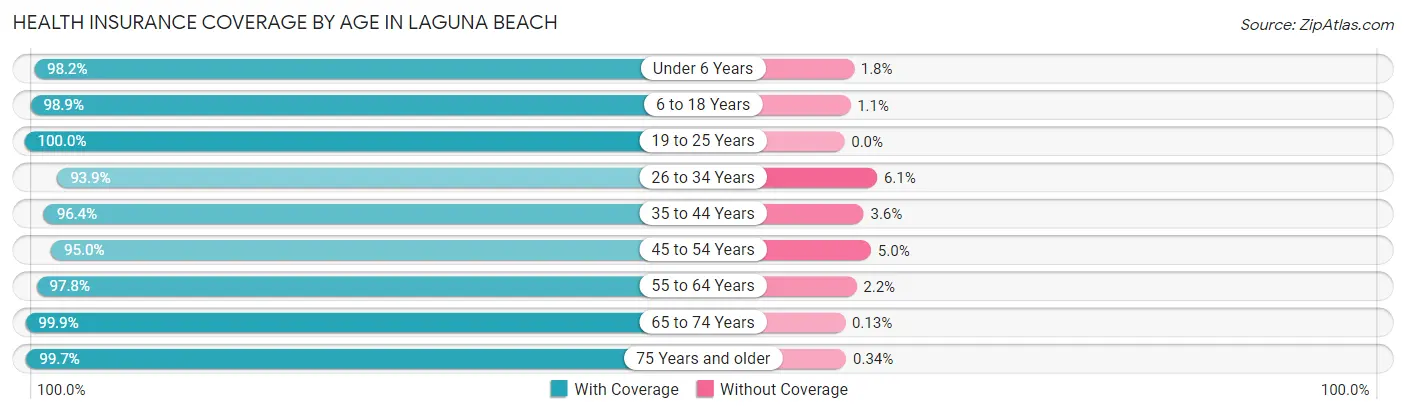
| Age Bracket | With Coverage | Without Coverage |
| Under 6 Years | 779 (98.2%) | 14 (1.8%) |
| 6 to 18 Years | 3,144 (98.9%) | 35 (1.1%) |
| 19 to 25 Years | 829 (100.0%) | 0 (0.0%) |
| 26 to 34 Years | 1,310 (93.9%) | 85 (6.1%) |
| 35 to 44 Years | 2,280 (96.4%) | 85 (3.6%) |
| 45 to 54 Years | 3,235 (95.0%) | 169 (5.0%) |
| 55 to 64 Years | 4,406 (97.8%) | 101 (2.2%) |
| 65 to 74 Years | 3,812 (99.9%) | 5 (0.1%) |
| 75 Years and older | 2,645 (99.7%) | 9 (0.3%) |
| Total | 22,440 (97.8%) | 503 (2.2%) |
Health Insurance Coverage by Citizenship Status in Laguna Beach
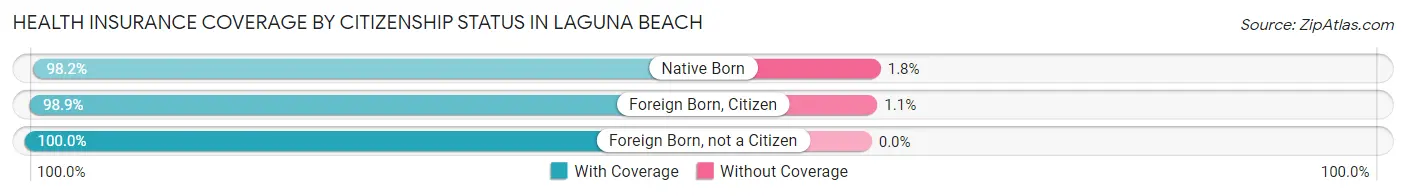
| Citizenship Status | With Coverage | Without Coverage |
| Native Born | 779 (98.2%) | 14 (1.8%) |
| Foreign Born, Citizen | 3,144 (98.9%) | 35 (1.1%) |
| Foreign Born, not a Citizen | 829 (100.0%) | 0 (0.0%) |
Health Insurance Coverage by Household Income in Laguna Beach
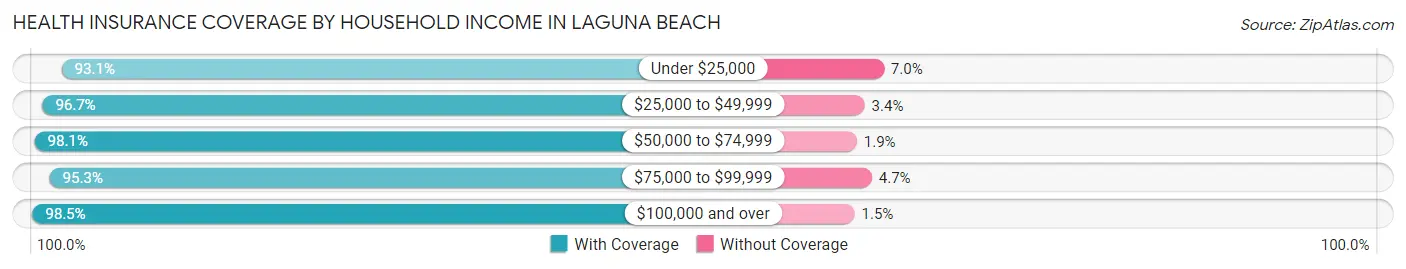
| Household Income | With Coverage | Without Coverage |
| Under $25,000 | 1,178 (93.0%) | 88 (7.0%) |
| $25,000 to $49,999 | 1,556 (96.7%) | 54 (3.4%) |
| $50,000 to $74,999 | 1,771 (98.1%) | 34 (1.9%) |
| $75,000 to $99,999 | 1,827 (95.3%) | 90 (4.7%) |
| $100,000 and over | 15,998 (98.5%) | 237 (1.5%) |
Public vs Private Health Insurance Coverage by Age in Laguna Beach
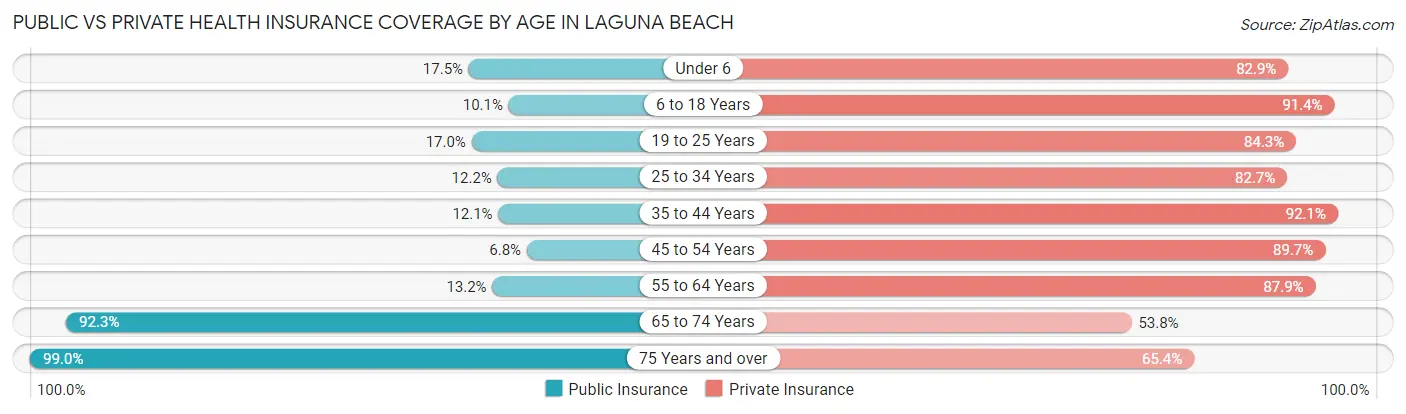
| Age Bracket | Public Insurance | Private Insurance |
| Under 6 | 139 (17.5%) | 657 (82.9%) |
| 6 to 18 Years | 322 (10.1%) | 2,907 (91.4%) |
| 19 to 25 Years | 141 (17.0%) | 699 (84.3%) |
| 25 to 34 Years | 170 (12.2%) | 1,153 (82.7%) |
| 35 to 44 Years | 285 (12.0%) | 2,177 (92.0%) |
| 45 to 54 Years | 230 (6.8%) | 3,053 (89.7%) |
| 55 to 64 Years | 593 (13.2%) | 3,962 (87.9%) |
| 65 to 74 Years | 3,523 (92.3%) | 2,052 (53.8%) |
| 75 Years and over | 2,627 (99.0%) | 1,735 (65.4%) |
| Total | 8,030 (35.0%) | 18,395 (80.2%) |
Disability Status by Sex by Age in Laguna Beach
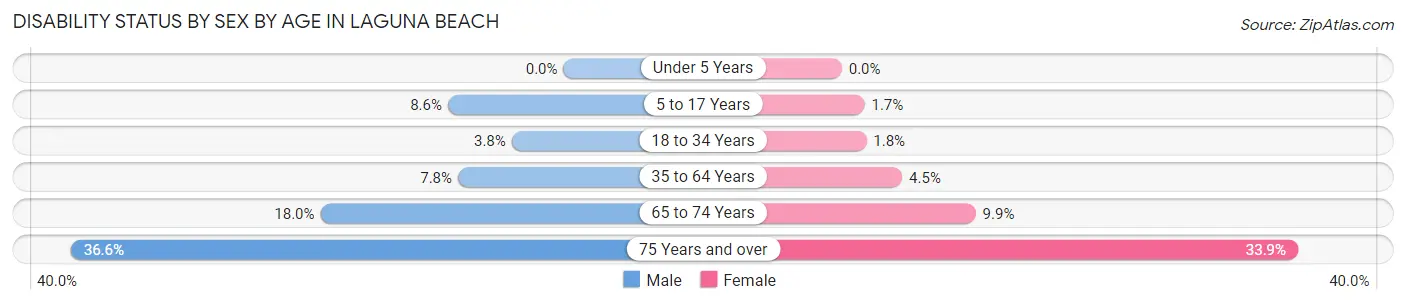
| Age Bracket | Male | Female |
| Under 5 Years | 0 (0.0%) | 0 (0.0%) |
| 5 to 17 Years | 129 (8.6%) | 26 (1.7%) |
| 18 to 34 Years | 57 (3.8%) | 20 (1.8%) |
| 35 to 64 Years | 422 (7.8%) | 219 (4.5%) |
| 65 to 74 Years | 333 (18.0%) | 196 (9.9%) |
| 75 Years and over | 504 (36.6%) | 432 (33.9%) |
Disability Class by Sex by Age in Laguna Beach
Disability Class: Hearing Difficulty
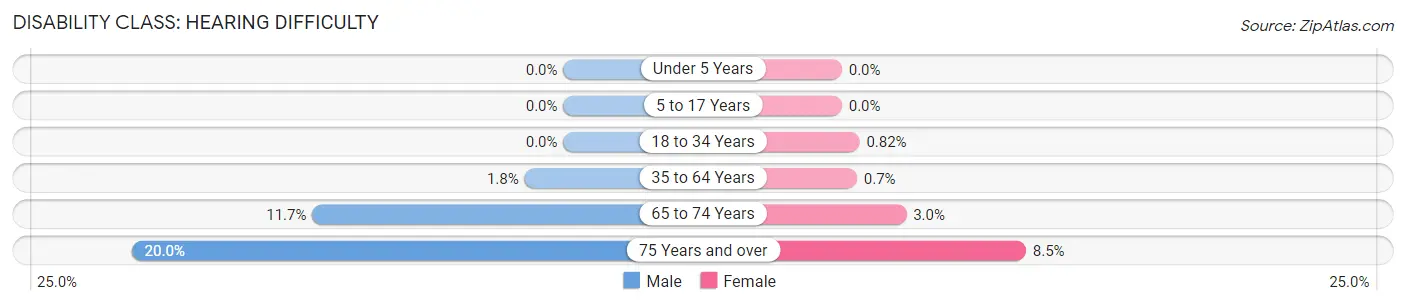
| Age Bracket | Male | Female |
| Under 5 Years | 0 (0.0%) | 0 (0.0%) |
| 5 to 17 Years | 0 (0.0%) | 0 (0.0%) |
| 18 to 34 Years | 0 (0.0%) | 9 (0.8%) |
| 35 to 64 Years | 97 (1.8%) | 34 (0.7%) |
| 65 to 74 Years | 215 (11.7%) | 59 (3.0%) |
| 75 Years and over | 276 (20.0%) | 109 (8.5%) |
Disability Class: Vision Difficulty
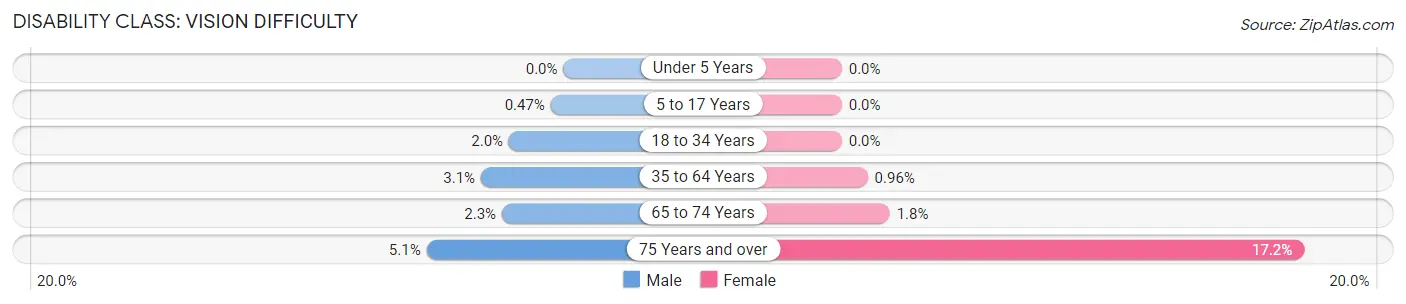
| Age Bracket | Male | Female |
| Under 5 Years | 0 (0.0%) | 0 (0.0%) |
| 5 to 17 Years | 7 (0.5%) | 0 (0.0%) |
| 18 to 34 Years | 30 (2.0%) | 0 (0.0%) |
| 35 to 64 Years | 165 (3.1%) | 47 (1.0%) |
| 65 to 74 Years | 42 (2.3%) | 35 (1.8%) |
| 75 Years and over | 70 (5.1%) | 219 (17.2%) |
Disability Class: Cognitive Difficulty
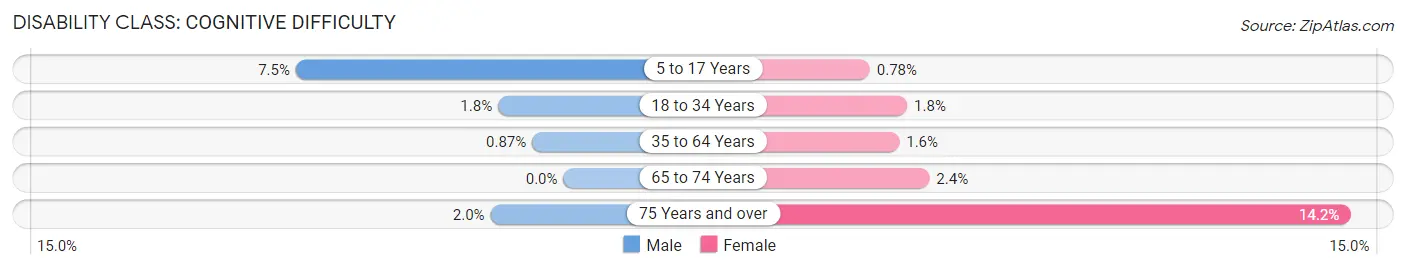
| Age Bracket | Male | Female |
| 5 to 17 Years | 112 (7.4%) | 12 (0.8%) |
| 18 to 34 Years | 27 (1.8%) | 20 (1.8%) |
| 35 to 64 Years | 47 (0.9%) | 78 (1.6%) |
| 65 to 74 Years | 0 (0.0%) | 48 (2.4%) |
| 75 Years and over | 28 (2.0%) | 181 (14.2%) |
Disability Class: Ambulatory Difficulty
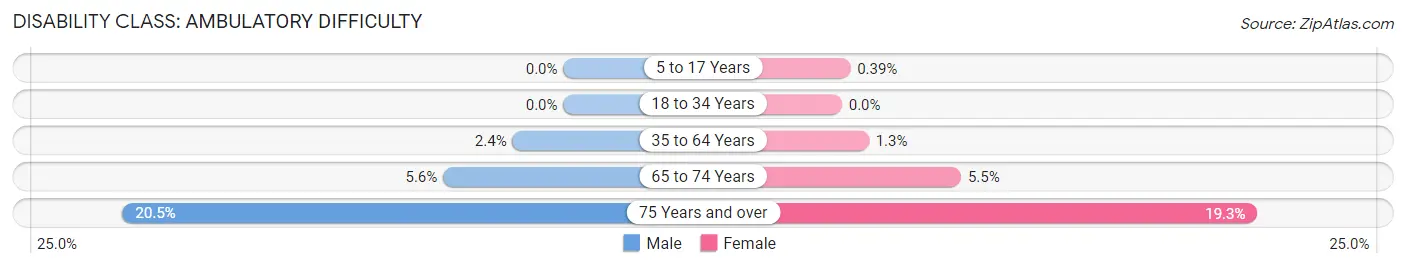
| Age Bracket | Male | Female |
| 5 to 17 Years | 0 (0.0%) | 6 (0.4%) |
| 18 to 34 Years | 0 (0.0%) | 0 (0.0%) |
| 35 to 64 Years | 127 (2.4%) | 61 (1.3%) |
| 65 to 74 Years | 103 (5.6%) | 109 (5.5%) |
| 75 Years and over | 282 (20.5%) | 246 (19.3%) |
Disability Class: Self-Care Difficulty
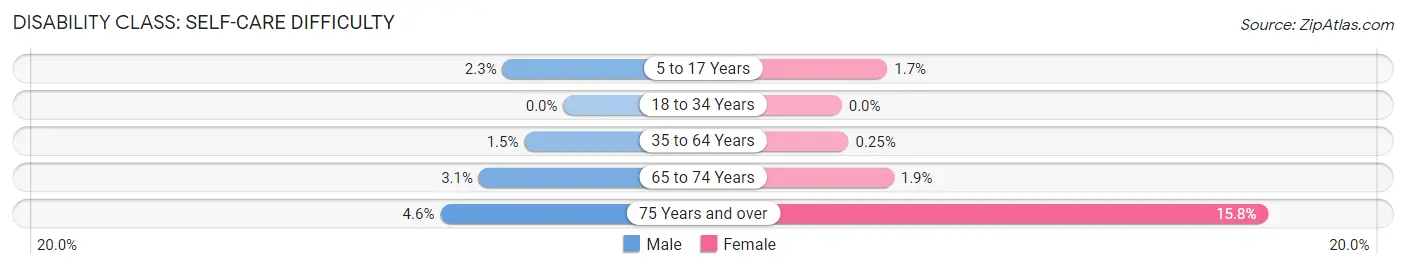
| Age Bracket | Male | Female |
| 5 to 17 Years | 34 (2.3%) | 26 (1.7%) |
| 18 to 34 Years | 0 (0.0%) | 0 (0.0%) |
| 35 to 64 Years | 78 (1.5%) | 12 (0.3%) |
| 65 to 74 Years | 58 (3.1%) | 38 (1.9%) |
| 75 Years and over | 63 (4.6%) | 202 (15.8%) |
Technology Access in Laguna Beach
Computing Device Access in Laguna Beach
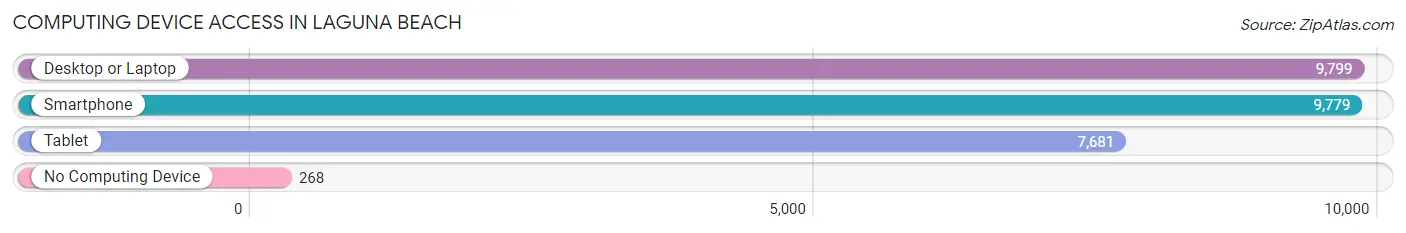
| Device Type | # Households | % Households |
| Desktop or Laptop | 9,799 | 92.3% |
| Smartphone | 9,779 | 92.1% |
| Tablet | 7,681 | 72.3% |
| No Computing Device | 268 | 2.5% |
| Total | 10,618 | 100.0% |
Internet Access in Laguna Beach
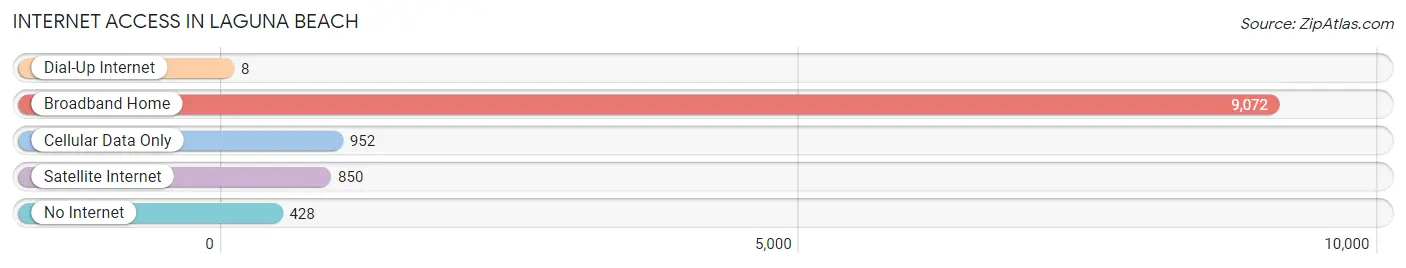
| Internet Type | # Households | % Households |
| Dial-Up Internet | 8 | 0.1% |
| Broadband Home | 9,072 | 85.4% |
| Cellular Data Only | 952 | 9.0% |
| Satellite Internet | 850 | 8.0% |
| No Internet | 428 | 4.0% |
| Total | 10,618 | 100.0% |
Laguna Beach Summary
Laguna Beach is a coastal city located in Orange County, California. It is situated on the Pacific Ocean, about halfway between Los Angeles and San Diego. The city is known for its beautiful beaches, art galleries, and coves. It is also home to the Laguna Art Museum, which houses a collection of modern and contemporary art.
History
The area that is now Laguna Beach was first inhabited by the Tongva people, who were the original inhabitants of the Los Angeles Basin. The area was later settled by Spanish missionaries in the late 1700s. The area was then part of the Rancho San Joaquin, which was granted to Juan Avila in 1842. In the late 1800s, the area was developed as a resort town, and the first hotel was built in 1887.
In 1927, the city of Laguna Beach was incorporated. The city was known for its art galleries and coves, and it quickly became a popular destination for tourists. In the 1950s, the city began to attract a large number of artists, and it became known as an artist colony.
Geography
Laguna Beach is located in Orange County, California, on the Pacific Ocean. It is situated about halfway between Los Angeles and San Diego. The city is bordered by the cities of Dana Point to the north, San Clemente to the south, and Aliso Viejo to the east. The city covers an area of 8.4 square miles, and it has a population of 23,727 (as of 2020).
The city is known for its beautiful beaches, coves, and cliffs. The most popular beaches in the city are Main Beach, Thousand Steps Beach, and Aliso Beach. The city is also home to several parks, including Heisler Park, Alta Laguna Park, and Laguna Coast Wilderness Park.
Economy
The economy of Laguna Beach is largely driven by tourism. The city is home to several art galleries, museums, and other attractions, which attract visitors from all over the world. The city is also home to several restaurants, hotels, and other businesses that cater to tourists.
The city is also home to several technology companies, including the software company Oracle and the video game company Blizzard Entertainment. The city is also home to several medical and healthcare companies, including the medical device company St. Jude Medical and the pharmaceutical company Allergan.
Demographics
As of 2020, the population of Laguna Beach was 23,727. The population is predominantly white (83.3%), followed by Hispanic or Latino (7.2%), Asian (4.3%), and African American (2.2%). The median household income in the city is $90,845, and the median age is 44.
The city is home to several educational institutions, including Laguna Beach High School, Laguna College of Art and Design, and the University of California, Irvine. The city is also home to several religious institutions, including the Church of Jesus Christ of Latter-day Saints, the Catholic Church, and the Episcopal Church.
Common Questions
What is Per Capita Income in Laguna Beach?
Per Capita income in Laguna Beach is $107,044.
What is the Median Family Income in Laguna Beach?
Median Family Income in Laguna Beach is $191,426.
What is the Median Household income in Laguna Beach?
Median Household Income in Laguna Beach is $141,875.
What is Income or Wage Gap in Laguna Beach?
Income or Wage Gap in Laguna Beach is 45.9%.
Women in Laguna Beach earn 54.1 cents for every dollar earned by a man.
What is Inequality or Gini Index in Laguna Beach?
Inequality or Gini Index in Laguna Beach is 0.53.
What is the Total Population of Laguna Beach?
Total Population of Laguna Beach is 22,943.
What is the Total Male Population of Laguna Beach?
Total Male Population of Laguna Beach is 11,953.
What is the Total Female Population of Laguna Beach?
Total Female Population of Laguna Beach is 10,990.
What is the Ratio of Males per 100 Females in Laguna Beach?
There are 108.76 Males per 100 Females in Laguna Beach.
What is the Ratio of Females per 100 Males in Laguna Beach?
There are 91.94 Females per 100 Males in Laguna Beach.
What is the Median Population Age in Laguna Beach?
Median Population Age in Laguna Beach is 53.7 Years.
What is the Average Family Size in Laguna Beach
Average Family Size in Laguna Beach is 2.7 People.
What is the Average Household Size in Laguna Beach
Average Household Size in Laguna Beach is 2.1 People.
How Large is the Labor Force in Laguna Beach?
There are 12,143 People in the Labor Forcein in Laguna Beach.
What is the Percentage of People in the Labor Force in Laguna Beach?
60.6% of People are in the Labor Force in Laguna Beach.
What is the Unemployment Rate in Laguna Beach?
Unemployment Rate in Laguna Beach is 6.8%.