Kernville, CA Map & Demographics
Kernville Map
Kernville Overview
$19,375
PER CAPITA INCOME
$46,833
AVG FAMILY INCOME
$41,497
AVG HOUSEHOLD INCOME
82.4%
WAGE / INCOME GAP [ % ]
17.6¢/ $1
WAGE / INCOME GAP [ $ ]
0.29
INEQUALITY / GINI INDEX
836
TOTAL POPULATION
377
MALE POPULATION
459
FEMALE POPULATION
82.14
MALES / 100 FEMALES
121.75
FEMALES / 100 MALES
59.8
MEDIAN AGE
3.5
AVG FAMILY SIZE
2.1
AVG HOUSEHOLD SIZE
312
LABOR FORCE [ PEOPLE ]
49.9%
PERCENT IN LABOR FORCE
18.6%
UNEMPLOYMENT RATE
Kernville Zip Codes
Kernville Area Codes
Income in Kernville
Income Overview in Kernville
Per Capita Income in Kernville is $19,375, while median incomes of families and households are $46,833 and $41,497 respectively.
| Characteristic | Number | Measure |
| Per Capita Income | 836 | $19,375 |
| Median Family Income | 150 | $46,833 |
| Mean Family Income | 150 | $51,612 |
| Median Household Income | 385 | $41,497 |
| Mean Household Income | 385 | $38,816 |
| Income Deficit | 150 | $0 |
| Wage / Income Gap (%) | 836 | 82.36% |
| Wage / Income Gap ($) | 836 | 17.64¢ per $1 |
| Gini / Inequality Index | 836 | 0.29 |
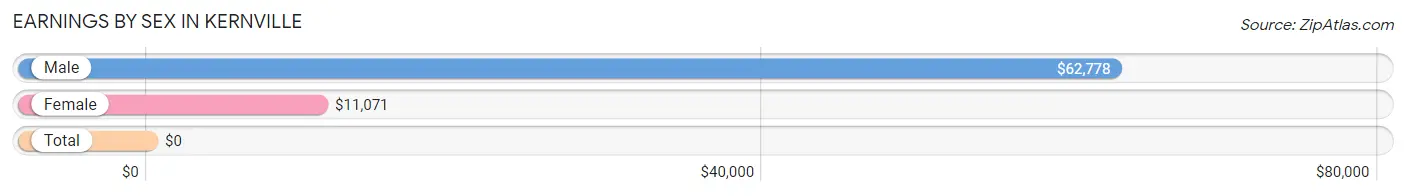
Earnings by Sex in Kernville
| Sex | Number | Average Earnings |
| Male | 112 (44.1%) | $62,778 |
| Female | 142 (55.9%) | $11,071 |
| Total | 254 (100.0%) | $0 |
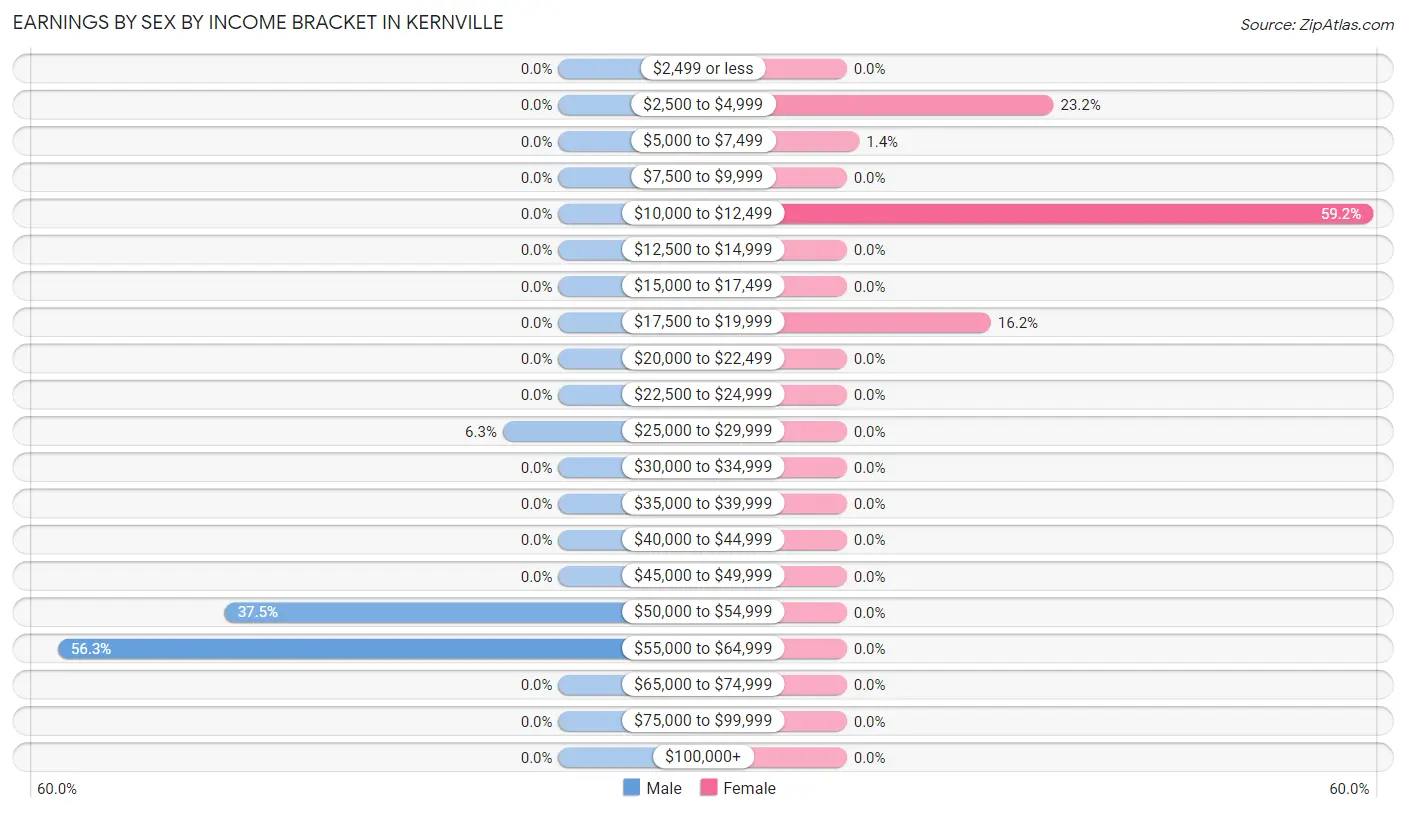
Earnings by Sex by Income Bracket in Kernville
The most common earnings brackets in Kernville are $55,000 to $64,999 for men (63 | 56.2%) and $10,000 to $12,499 for women (84 | 59.2%).
| Income | Male | Female |
| $2,499 or less | 0 (0.0%) | 0 (0.0%) |
| $2,500 to $4,999 | 0 (0.0%) | 33 (23.2%) |
| $5,000 to $7,499 | 0 (0.0%) | 2 (1.4%) |
| $7,500 to $9,999 | 0 (0.0%) | 0 (0.0%) |
| $10,000 to $12,499 | 0 (0.0%) | 84 (59.2%) |
| $12,500 to $14,999 | 0 (0.0%) | 0 (0.0%) |
| $15,000 to $17,499 | 0 (0.0%) | 0 (0.0%) |
| $17,500 to $19,999 | 0 (0.0%) | 23 (16.2%) |
| $20,000 to $22,499 | 0 (0.0%) | 0 (0.0%) |
| $22,500 to $24,999 | 0 (0.0%) | 0 (0.0%) |
| $25,000 to $29,999 | 7 (6.2%) | 0 (0.0%) |
| $30,000 to $34,999 | 0 (0.0%) | 0 (0.0%) |
| $35,000 to $39,999 | 0 (0.0%) | 0 (0.0%) |
| $40,000 to $44,999 | 0 (0.0%) | 0 (0.0%) |
| $45,000 to $49,999 | 0 (0.0%) | 0 (0.0%) |
| $50,000 to $54,999 | 42 (37.5%) | 0 (0.0%) |
| $55,000 to $64,999 | 63 (56.2%) | 0 (0.0%) |
| $65,000 to $74,999 | 0 (0.0%) | 0 (0.0%) |
| $75,000 to $99,999 | 0 (0.0%) | 0 (0.0%) |
| $100,000+ | 0 (0.0%) | 0 (0.0%) |
| Total | 112 (100.0%) | 142 (100.0%) |
Earnings by Sex by Educational Attainment in Kernville
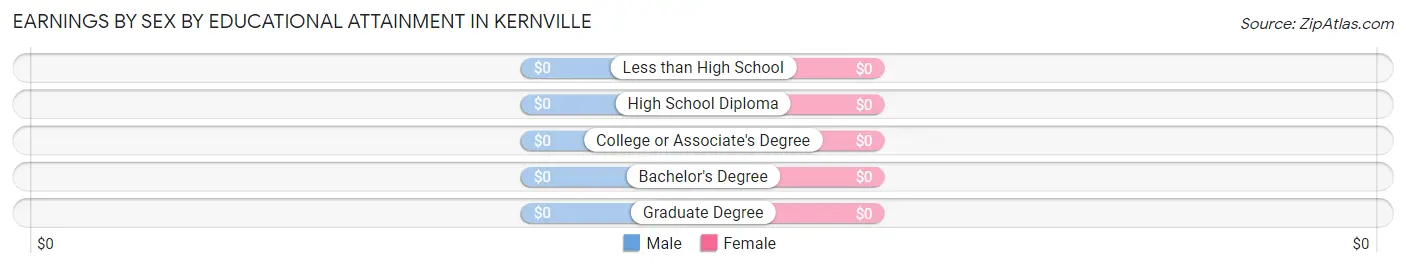
| Educational Attainment | Male Income | Female Income |
| Less than High School | - | - |
| High School Diploma | - | - |
| College or Associate's Degree | - | - |
| Bachelor's Degree | - | - |
| Graduate Degree | - | - |
| Total | $62,778 | $11,071 |
Family Income in Kernville
Family Income Brackets in Kernville
According to the Kernville family income data, there are 84 families falling into the $35,000 to $49,999 income range, which is the most common income bracket and makes up 56.0% of all families.
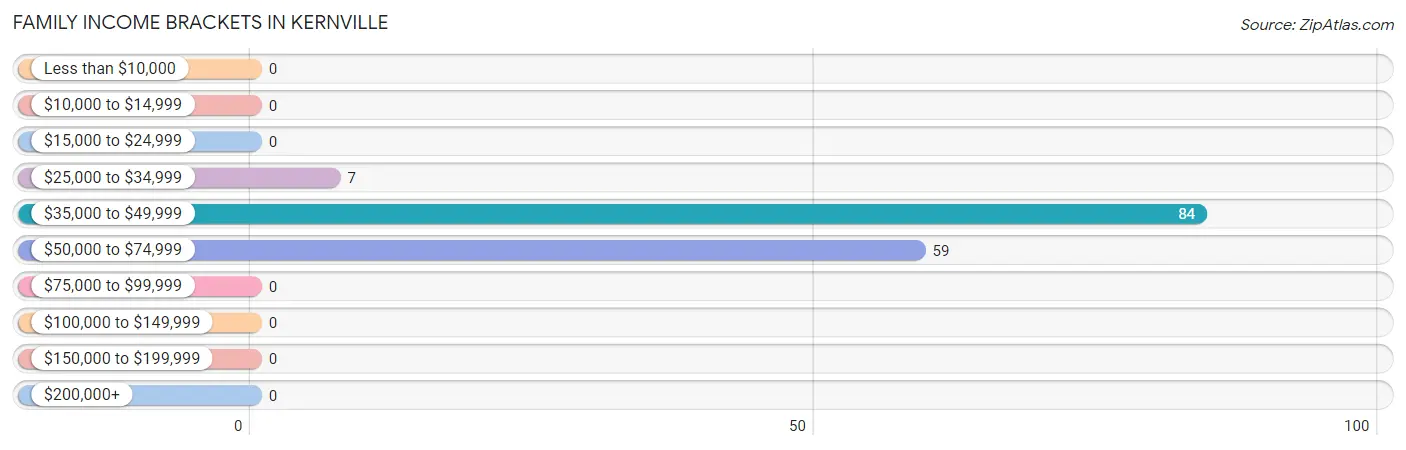
| Income Bracket | # Families | % Families |
| Less than $10,000 | 0 | 0.0% |
| $10,000 to $14,999 | 0 | 0.0% |
| $15,000 to $24,999 | 0 | 0.0% |
| $25,000 to $34,999 | 7 | 4.7% |
| $35,000 to $49,999 | 84 | 56.0% |
| $50,000 to $74,999 | 59 | 39.3% |
| $75,000 to $99,999 | 0 | 0.0% |
| $100,000 to $149,999 | 0 | 0.0% |
| $150,000 to $199,999 | 0 | 0.0% |
| $200,000+ | 0 | 0.0% |
Family Income by Famaliy Size in Kernville
2-person families (91 | 60.7%) account for the highest median family income in Kernville with $45,604 per family, while 2-person families (91 | 60.7%) have the highest median income of $22,802 per family member.
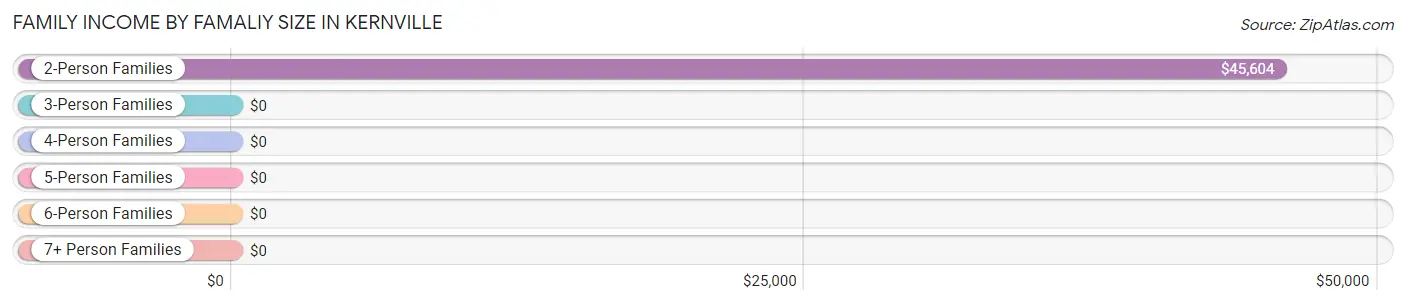
| Income Bracket | # Families | Median Income |
| 2-Person Families | 91 (60.7%) | $45,604 |
| 3-Person Families | 0 (0.0%) | $0 |
| 4-Person Families | 0 (0.0%) | $0 |
| 5-Person Families | 59 (39.3%) | $0 |
| 6-Person Families | 0 (0.0%) | $0 |
| 7+ Person Families | 0 (0.0%) | $0 |
| Total | 150 (100.0%) | $46,833 |
Family Income by Number of Earners in Kernville
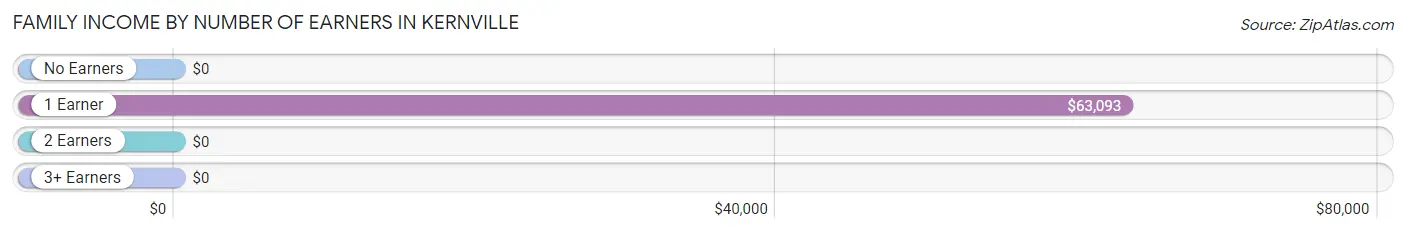
| Number of Earners | # Families | Median Income |
| No Earners | 60 (40.0%) | $0 |
| 1 Earner | 90 (60.0%) | $63,093 |
| 2 Earners | 0 (0.0%) | $0 |
| 3+ Earners | 0 (0.0%) | $0 |
| Total | 150 (100.0%) | $46,833 |
Household Income in Kernville
Household Income Brackets in Kernville
With 156 households falling in the category, the $35,000 to $49,999 income range is the most frequent in Kernville, accounting for 40.5% of all households.
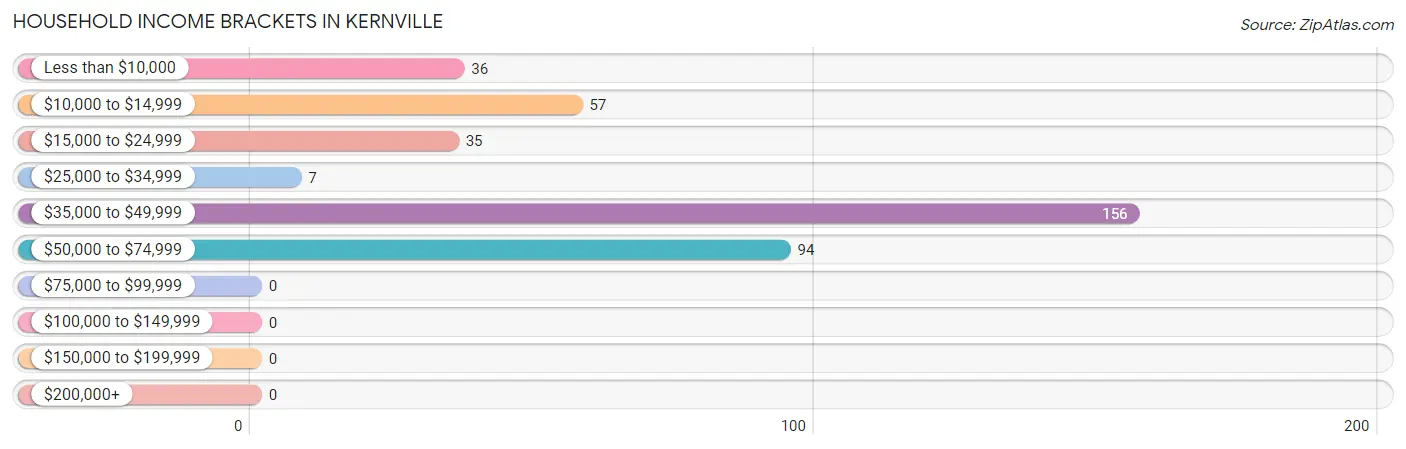
| Income Bracket | # Households | % Households |
| Less than $10,000 | 36 | 9.4% |
| $10,000 to $14,999 | 57 | 14.8% |
| $15,000 to $24,999 | 35 | 9.1% |
| $25,000 to $34,999 | 7 | 1.8% |
| $35,000 to $49,999 | 156 | 40.5% |
| $50,000 to $74,999 | 94 | 24.4% |
| $75,000 to $99,999 | 0 | 0.0% |
| $100,000 to $149,999 | 0 | 0.0% |
| $150,000 to $199,999 | 0 | 0.0% |
| $200,000+ | 0 | 0.0% |
Household Income by Householder Age in Kernville
The median household income in Kernville is $41,497, with the highest median household income of $40,690 found in the 65+ years age bracket for the primary householder. A total of 263 households (68.3%) fall into this category.
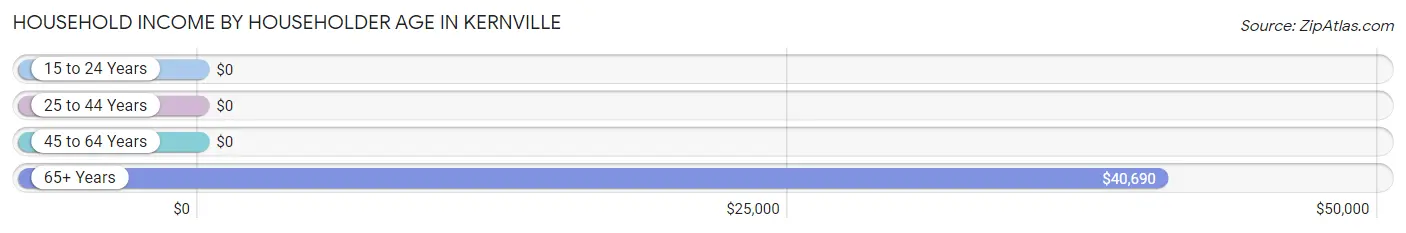
| Income Bracket | # Households | Median Income |
| 15 to 24 Years | 0 (0.0%) | $0 |
| 25 to 44 Years | 66 (17.1%) | $0 |
| 45 to 64 Years | 56 (14.5%) | $0 |
| 65+ Years | 263 (68.3%) | $40,690 |
| Total | 385 (100.0%) | $41,497 |
Poverty in Kernville
Income Below Poverty by Sex and Age in Kernville
With 4.0% poverty level for males and 20.3% for females among the residents of Kernville, 18 to 24 year old males and 75 year old and over females are the most vulnerable to poverty, with 8 males (100.0%) and 93 females (55.4%) in their respective age groups living below the poverty level.
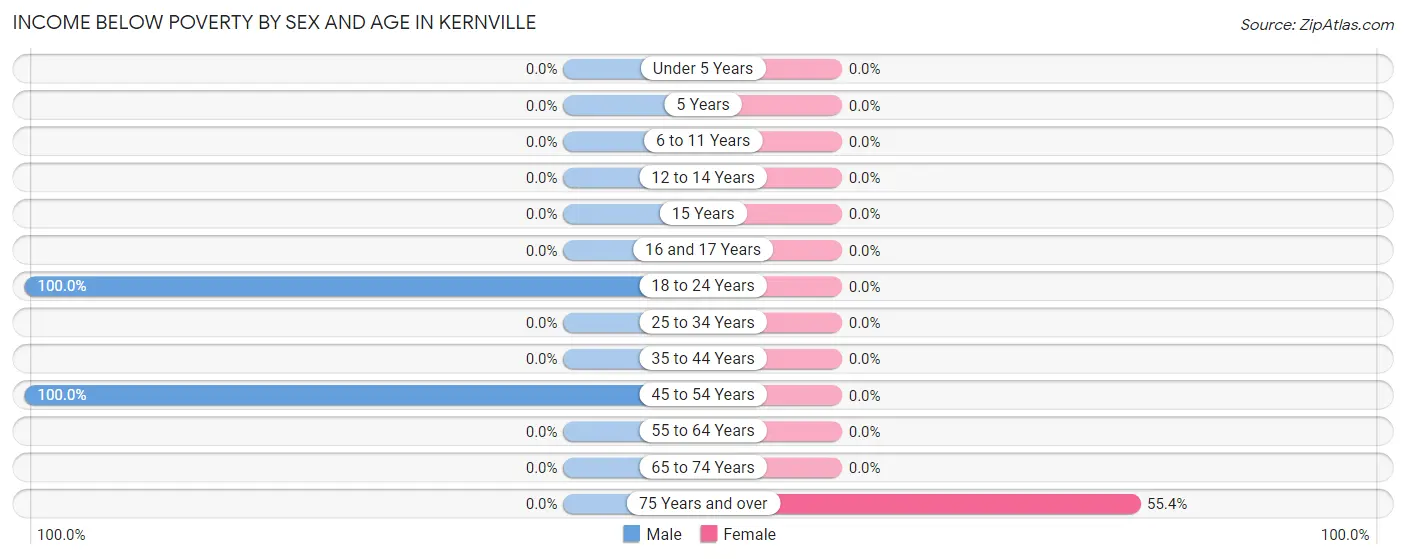
| Age Bracket | Male | Female |
| Under 5 Years | 0 (0.0%) | 0 (0.0%) |
| 5 Years | 0 (0.0%) | 0 (0.0%) |
| 6 to 11 Years | 0 (0.0%) | 0 (0.0%) |
| 12 to 14 Years | 0 (0.0%) | 0 (0.0%) |
| 15 Years | 0 (0.0%) | 0 (0.0%) |
| 16 and 17 Years | 0 (0.0%) | 0 (0.0%) |
| 18 to 24 Years | 8 (100.0%) | 0 (0.0%) |
| 25 to 34 Years | 0 (0.0%) | 0 (0.0%) |
| 35 to 44 Years | 0 (0.0%) | 0 (0.0%) |
| 45 to 54 Years | 7 (100.0%) | 0 (0.0%) |
| 55 to 64 Years | 0 (0.0%) | 0 (0.0%) |
| 65 to 74 Years | 0 (0.0%) | 0 (0.0%) |
| 75 Years and over | 0 (0.0%) | 93 (55.4%) |
| Total | 15 (4.0%) | 93 (20.3%) |
Income Above Poverty by Sex and Age in Kernville
According to the poverty statistics in Kernville, males aged under 5 years and females aged 12 to 14 years are the age groups that are most secure financially, with 100.0% of males and 100.0% of females in these age groups living above the poverty line.
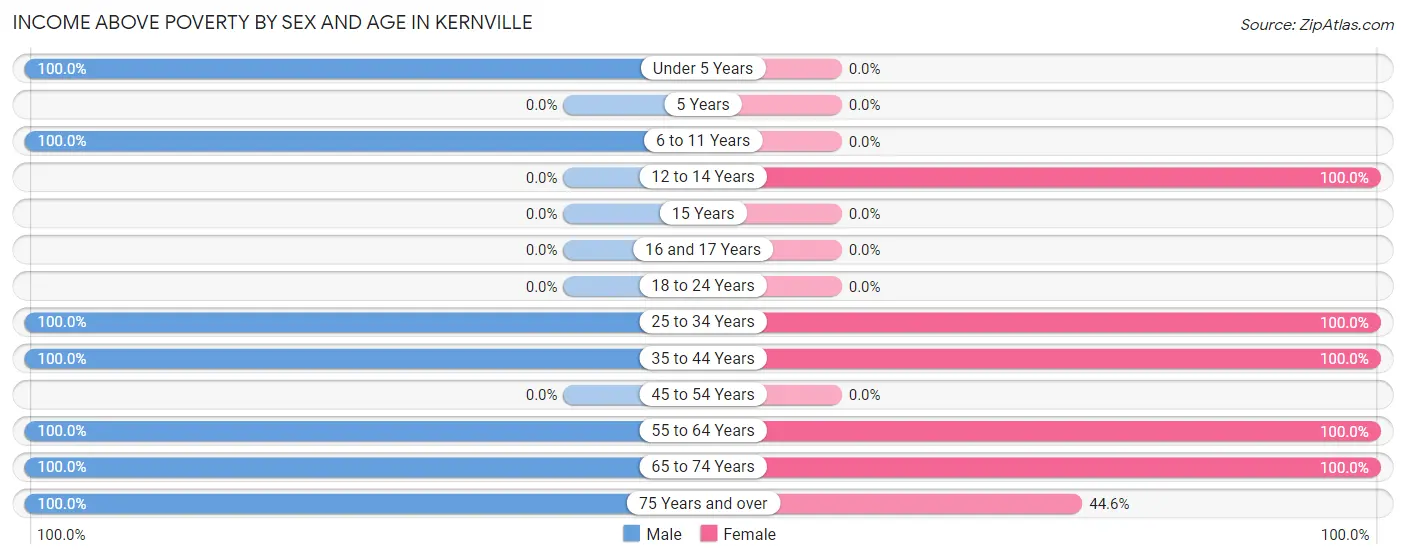
| Age Bracket | Male | Female |
| Under 5 Years | 81 (100.0%) | 0 (0.0%) |
| 5 Years | 0 (0.0%) | 0 (0.0%) |
| 6 to 11 Years | 62 (100.0%) | 0 (0.0%) |
| 12 to 14 Years | 0 (0.0%) | 67 (100.0%) |
| 15 Years | 0 (0.0%) | 0 (0.0%) |
| 16 and 17 Years | 0 (0.0%) | 0 (0.0%) |
| 18 to 24 Years | 0 (0.0%) | 0 (0.0%) |
| 25 to 34 Years | 7 (100.0%) | 7 (100.0%) |
| 35 to 44 Years | 63 (100.0%) | 59 (100.0%) |
| 45 to 54 Years | 0 (0.0%) | 0 (0.0%) |
| 55 to 64 Years | 42 (100.0%) | 83 (100.0%) |
| 65 to 74 Years | 85 (100.0%) | 74 (100.0%) |
| 75 Years and over | 21 (100.0%) | 75 (44.6%) |
| Total | 361 (96.0%) | 365 (79.7%) |
Income Below Poverty Among Married-Couple Families in Kernville
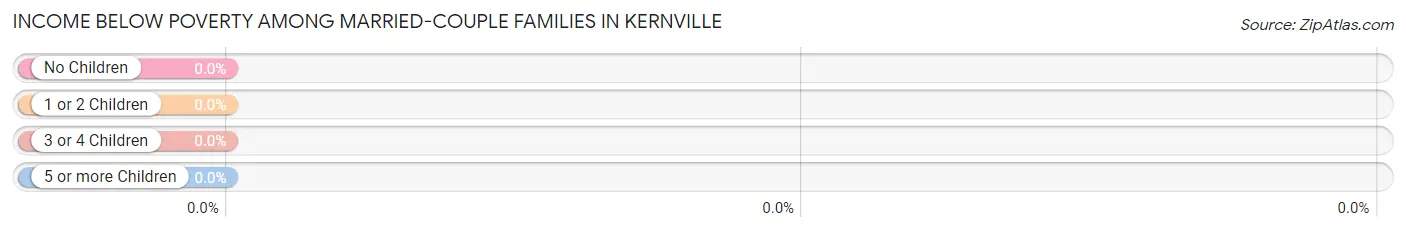
| Children | Above Poverty | Below Poverty |
| No Children | 91 (100.0%) | 0 (0.0%) |
| 1 or 2 Children | 0 (0.0%) | 0 (0.0%) |
| 3 or 4 Children | 59 (100.0%) | 0 (0.0%) |
| 5 or more Children | 0 (0.0%) | 0 (0.0%) |
| Total | 150 (100.0%) | 0 (0.0%) |
Income Below Poverty Among Single-Parent Households in Kernville
| Children | Single Father | Single Mother |
| No Children | 0 (0.0%) | 0 (0.0%) |
| 1 or 2 Children | 0 (0.0%) | 0 (0.0%) |
| 3 or 4 Children | 0 (0.0%) | 0 (0.0%) |
| 5 or more Children | 0 (0.0%) | 0 (0.0%) |
| Total | 0 (0.0%) | 0 (0.0%) |
Income Below Poverty Among Married-Couple vs Single-Parent Households in Kernville
| Children | Married-Couple Families | Single-Parent Households |
| No Children | 0 (0.0%) | 0 (0.0%) |
| 1 or 2 Children | 0 (0.0%) | 0 (0.0%) |
| 3 or 4 Children | 0 (0.0%) | 0 (0.0%) |
| 5 or more Children | 0 (0.0%) | 0 (0.0%) |
| Total | 0 (0.0%) | 0 (0.0%) |
Race in Kernville
The most populous races in Kernville are White / Caucasian (794 | 95.0%), Hispanic or Latino (44 | 5.3%), and Asian (22 | 2.6%).
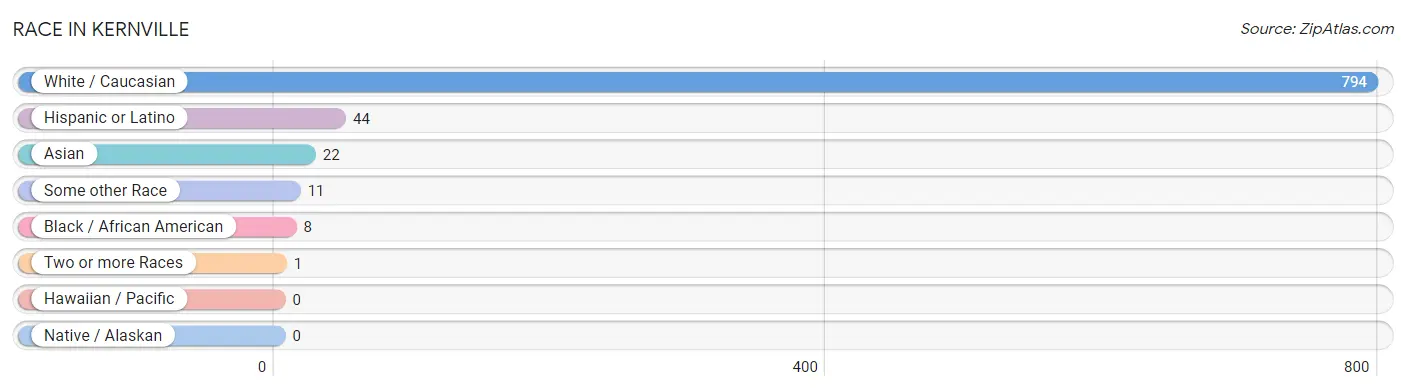
| Race | # Population | % Population |
| Asian | 22 | 2.6% |
| Black / African American | 8 | 1.0% |
| Hawaiian / Pacific | 0 | 0.0% |
| Hispanic or Latino | 44 | 5.3% |
| Native / Alaskan | 0 | 0.0% |
| White / Caucasian | 794 | 95.0% |
| Two or more Races | 1 | 0.1% |
| Some other Race | 11 | 1.3% |
| Total | 836 | 100.0% |
Ancestry in Kernville
The most populous ancestries reported in Kernville are English (117 | 14.0%), Italian (75 | 9.0%), Scotch-Irish (57 | 6.8%), French (54 | 6.5%), and American (43 | 5.1%), together accounting for 41.4% of all Kernville residents.
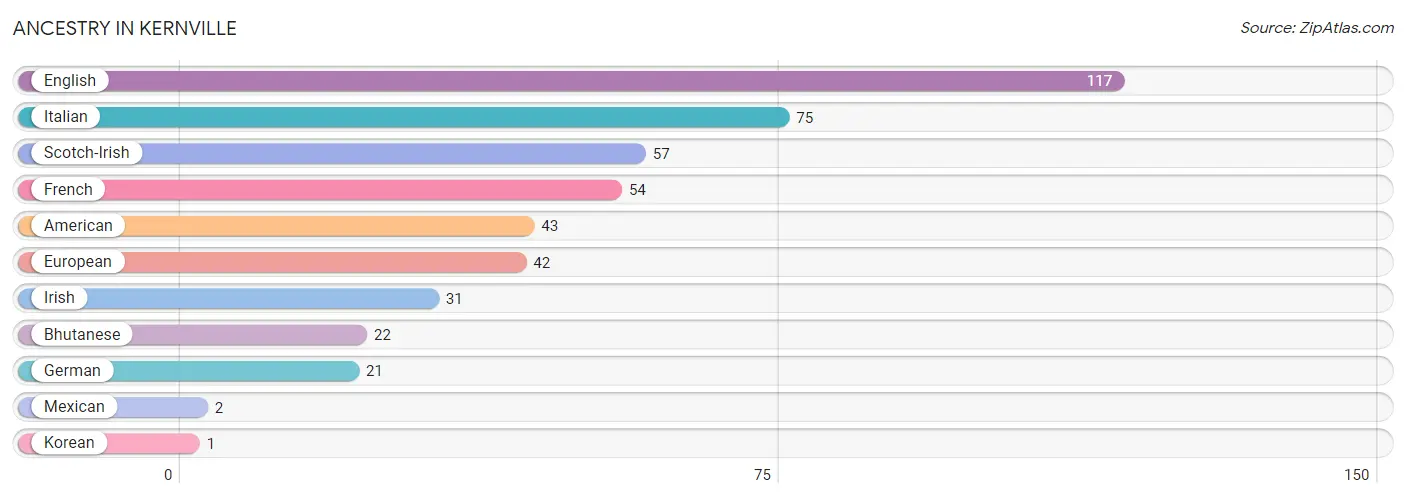
| Ancestry | # Population | % Population |
| American | 43 | 5.1% |
| Bhutanese | 22 | 2.6% |
| English | 117 | 14.0% |
| European | 42 | 5.0% |
| French | 54 | 6.5% |
| German | 21 | 2.5% |
| Irish | 31 | 3.7% |
| Italian | 75 | 9.0% |
| Korean | 1 | 0.1% |
| Mexican | 2 | 0.2% |
| Scotch-Irish | 57 | 6.8% | View All 11 Rows |
Immigrants in Kernville
The most numerous immigrant groups reported in Kernville came from Asia (22 | 2.6%), Eastern Asia (22 | 2.6%), and Japan (22 | 2.6%), together accounting for 7.9% of all Kernville residents.
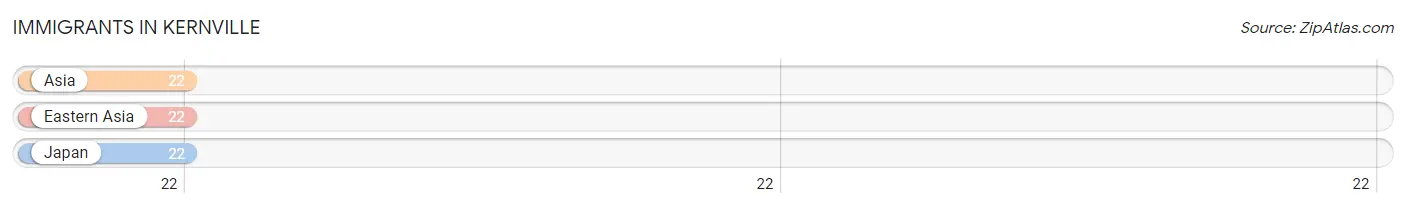
| Immigration Origin | # Population | % Population |
| Asia | 22 | 2.6% |
| Eastern Asia | 22 | 2.6% |
| Japan | 22 | 2.6% | View All 3 Rows |
Sex and Age in Kernville
Sex and Age in Kernville
The most populous age groups in Kernville are Under 5 Years (81 | 21.5%) for men and 75 to 79 Years (87 | 19.0%) for women.
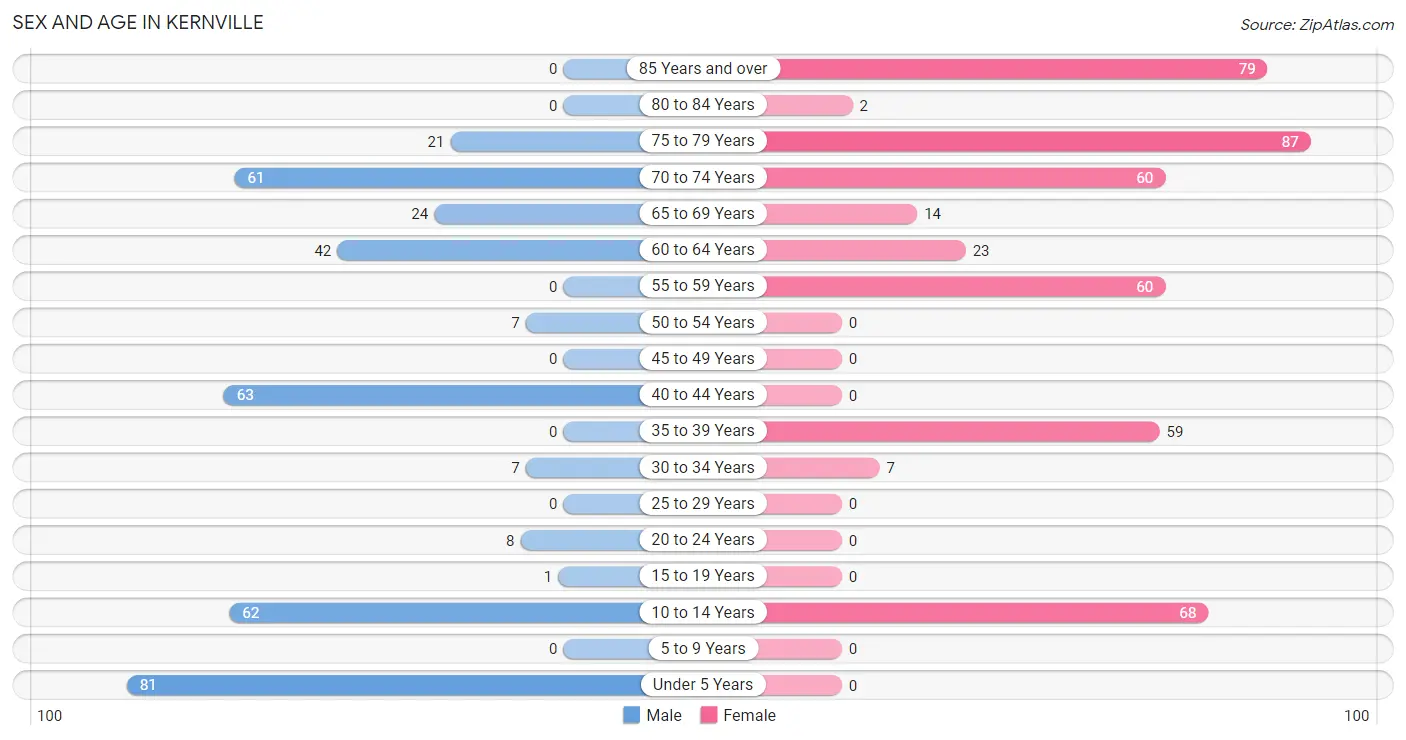
| Age Bracket | Male | Female |
| Under 5 Years | 81 (21.5%) | 0 (0.0%) |
| 5 to 9 Years | 0 (0.0%) | 0 (0.0%) |
| 10 to 14 Years | 62 (16.5%) | 68 (14.8%) |
| 15 to 19 Years | 1 (0.3%) | 0 (0.0%) |
| 20 to 24 Years | 8 (2.1%) | 0 (0.0%) |
| 25 to 29 Years | 0 (0.0%) | 0 (0.0%) |
| 30 to 34 Years | 7 (1.9%) | 7 (1.5%) |
| 35 to 39 Years | 0 (0.0%) | 59 (12.9%) |
| 40 to 44 Years | 63 (16.7%) | 0 (0.0%) |
| 45 to 49 Years | 0 (0.0%) | 0 (0.0%) |
| 50 to 54 Years | 7 (1.9%) | 0 (0.0%) |
| 55 to 59 Years | 0 (0.0%) | 60 (13.1%) |
| 60 to 64 Years | 42 (11.1%) | 23 (5.0%) |
| 65 to 69 Years | 24 (6.4%) | 14 (3.0%) |
| 70 to 74 Years | 61 (16.2%) | 60 (13.1%) |
| 75 to 79 Years | 21 (5.6%) | 87 (19.0%) |
| 80 to 84 Years | 0 (0.0%) | 2 (0.4%) |
| 85 Years and over | 0 (0.0%) | 79 (17.2%) |
| Total | 377 (100.0%) | 459 (100.0%) |
Families and Households in Kernville
Median Family Size in Kernville
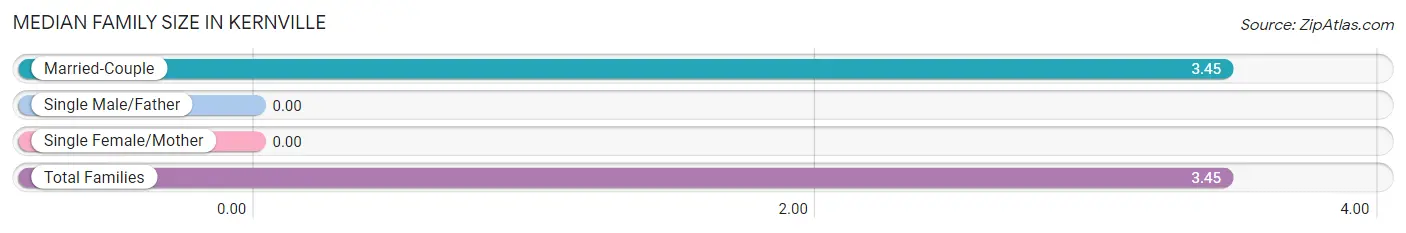
| Family Type | # Families | Family Size |
| Married-Couple | 150 (100.0%) | 3.45 |
| Single Male/Father | 0 (0.0%) | - |
| Single Female/Mother | 0 (0.0%) | - |
| Total Families | 150 (100.0%) | 3.45 |
Median Household Size in Kernville
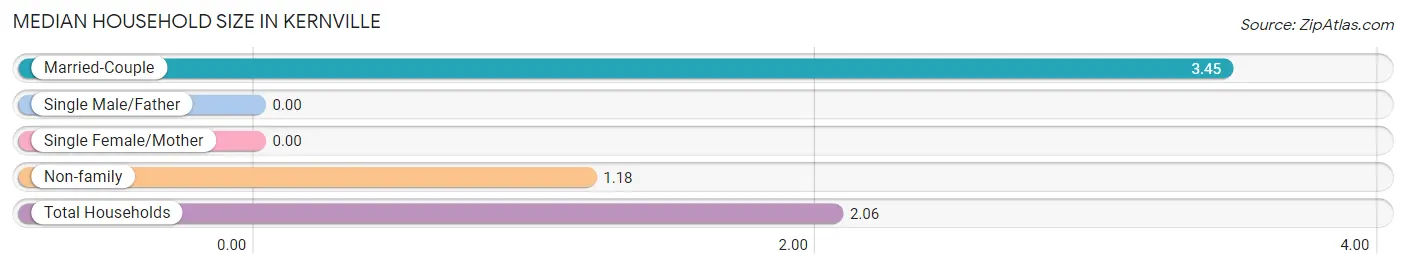
| Household Type | # Households | Household Size |
| Married-Couple | 150 (39.0%) | 3.45 |
| Single Male/Father | 0 (0.0%) | - |
| Single Female/Mother | 0 (0.0%) | - |
| Non-family | 235 (61.0%) | 1.18 |
| Total Households | 385 (100.0%) | 2.06 |
Household Size by Marriage Status in Kernville
Out of a total of 385 households in Kernville, 150 (39.0%) are family households, while 235 (61.0%) are nonfamily households. The most numerous type of family households are 2-person households, comprising 91, and the most common type of nonfamily households are 1-person households, comprising 202.
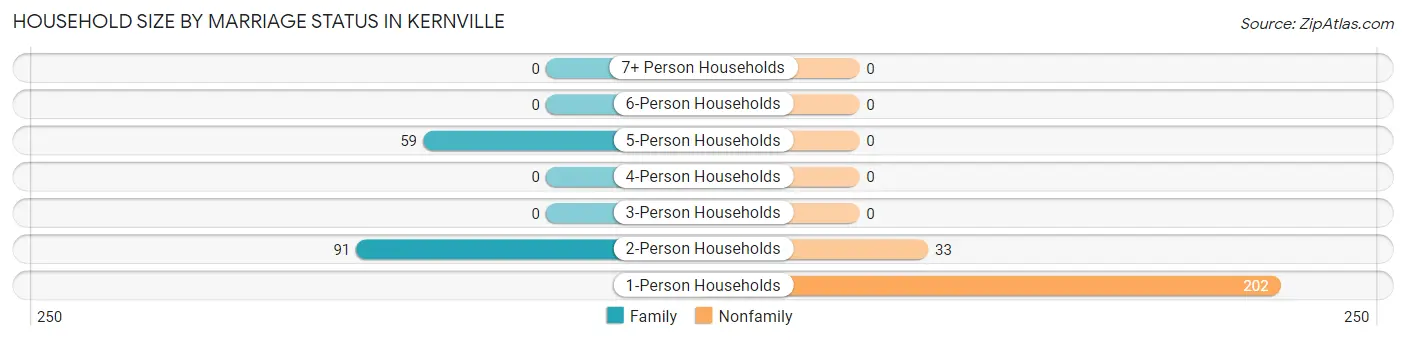
| Household Size | Family Households | Nonfamily Households |
| 1-Person Households | - | 202 (52.5%) |
| 2-Person Households | 91 (23.6%) | 33 (8.6%) |
| 3-Person Households | 0 (0.0%) | 0 (0.0%) |
| 4-Person Households | 0 (0.0%) | 0 (0.0%) |
| 5-Person Households | 59 (15.3%) | 0 (0.0%) |
| 6-Person Households | 0 (0.0%) | 0 (0.0%) |
| 7+ Person Households | 0 (0.0%) | 0 (0.0%) |
| Total | 150 (39.0%) | 235 (61.0%) |
Female Fertility in Kernville
Fertility by Age in Kernville
| Age Bracket | Women with Births | Births / 1,000 Women |
| 15 to 19 years | 0 (0.0%) | 0.0 |
| 20 to 34 years | 0 (0.0%) | 0.0 |
| 35 to 50 years | 0 (0.0%) | 0.0 |
| Total | 0 (0.0%) | 0.0 |
Fertility by Age by Marriage Status in Kernville
| Age Bracket | Married | Unmarried |
| 15 to 19 years | 0 (0.0%) | 0 (0.0%) |
| 20 to 34 years | 0 (0.0%) | 0 (0.0%) |
| 35 to 50 years | 0 (0.0%) | 0 (0.0%) |
| Total | 0 (0.0%) | 0 (0.0%) |
Fertility by Education in Kernville
| Educational Attainment | Women with Births | Births / 1,000 Women |
| Less than High School | 0 (0.0%) | 0.0 |
| High School Diploma | 0 (0.0%) | 0.0 |
| College or Associate's Degree | 0 (0.0%) | 0.0 |
| Bachelor's Degree | 0 (0.0%) | 0.0 |
| Graduate Degree | 0 (0.0%) | 0.0 |
| Total | 0 (0.0%) | 0.0 |
Fertility by Education by Marriage Status in Kernville
| Educational Attainment | Married | Unmarried |
| Less than High School | 0 (0.0%) | 0 (0.0%) |
| High School Diploma | 0 (0.0%) | 0 (0.0%) |
| College or Associate's Degree | 0 (0.0%) | 0 (0.0%) |
| Bachelor's Degree | 0 (0.0%) | 0 (0.0%) |
| Graduate Degree | 0 (0.0%) | 0 (0.0%) |
| Total | 0 (0.0%) | 0 (0.0%) |
Employment Characteristics in Kernville
Employment by Class of Employer in Kernville
Among the 197 employed individuals in Kernville, private company employees (132 | 67.0%), not-for-profit organizations (63 | 32.0%), and self-employed (not incorporated) (2 | 1.0%) make up the most common classes of employment.
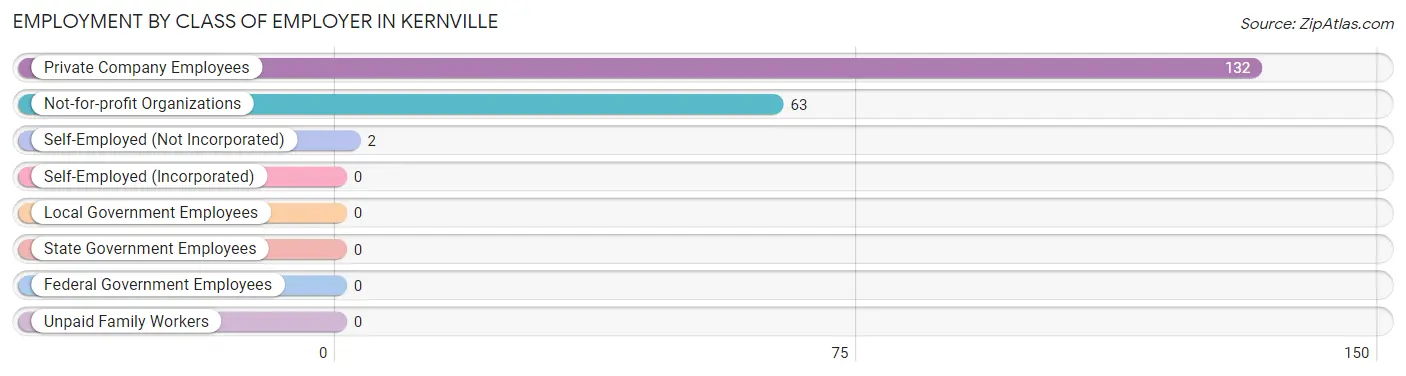
| Employer Class | # Employees | % Employees |
| Private Company Employees | 132 | 67.0% |
| Self-Employed (Incorporated) | 0 | 0.0% |
| Self-Employed (Not Incorporated) | 2 | 1.0% |
| Not-for-profit Organizations | 63 | 32.0% |
| Local Government Employees | 0 | 0.0% |
| State Government Employees | 0 | 0.0% |
| Federal Government Employees | 0 | 0.0% |
| Unpaid Family Workers | 0 | 0.0% |
| Total | 197 | 100.0% |
Employment Status by Age in Kernville
According to the labor force statistics for Kernville, out of the total population over 16 years of age (625), 49.9% or 312 individuals are in the labor force, with 18.6% or 58 of them unemployed. The age group with the highest labor force participation rate is 45 to 54 years, with 100.0% or 7 individuals in the labor force. Within the labor force, the 45 to 54 years age range has the highest percentage of unemployed individuals, with 100.0% or 7 of them being unemployed.
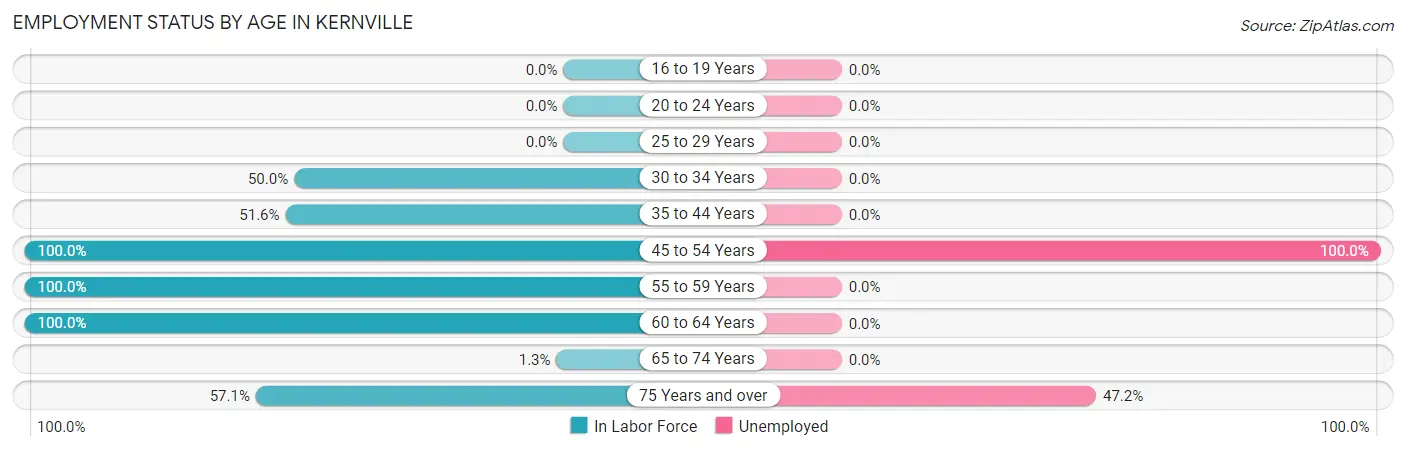
| Age Bracket | In Labor Force | Unemployed |
| 16 to 19 Years | 0 (0.0%) | 0 (0.0%) |
| 20 to 24 Years | 0 (0.0%) | 0 (0.0%) |
| 25 to 29 Years | 0 (0.0%) | 0 (0.0%) |
| 30 to 34 Years | 7 (50.0%) | 0 (0.0%) |
| 35 to 44 Years | 63 (51.6%) | 0 (0.0%) |
| 45 to 54 Years | 7 (100.0%) | 7 (100.0%) |
| 55 to 59 Years | 60 (100.0%) | 0 (0.0%) |
| 60 to 64 Years | 65 (100.0%) | 0 (0.0%) |
| 65 to 74 Years | 2 (1.3%) | 0 (0.0%) |
| 75 Years and over | 108 (57.1%) | 51 (47.2%) |
| Total | 312 (49.9%) | 58 (18.6%) |
Employment Status by Educational Attainment in Kernville
According to labor force statistics for Kernville, 75.4% of individuals (202) out of the total population between 25 and 64 years of age (268) are in the labor force, with 3.5% or 7 of them being unemployed. The group with the highest labor force participation rate are those with the educational attainment of college / associate degree, with 100.0% or 57 individuals in the labor force. Within the labor force, individuals with college / associate degree education have the highest percentage of unemployment, with 12.3% or 7 of them being unemployed.
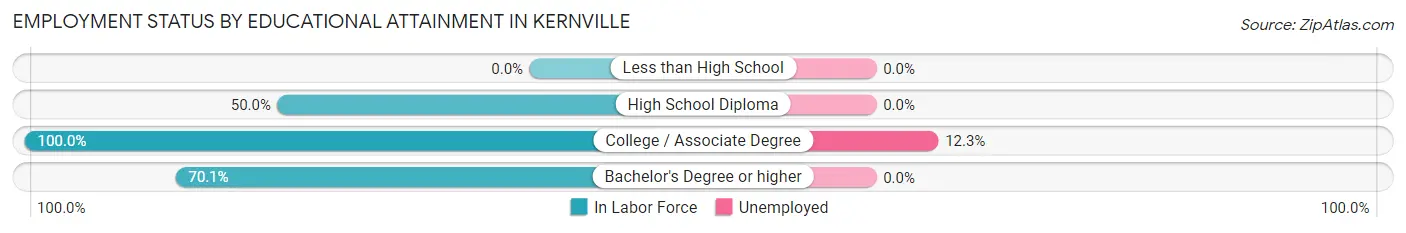
| Educational Attainment | In Labor Force | Unemployed |
| Less than High School | 0 (0.0%) | 0 (0.0%) |
| High School Diploma | 7 (50.0%) | 0 (0.0%) |
| College / Associate Degree | 57 (100.0%) | 7 (12.3%) |
| Bachelor's Degree or higher | 138 (70.1%) | 0 (0.0%) |
| Total | 202 (75.4%) | 9 (3.5%) |
Employment Occupations by Sex in Kernville
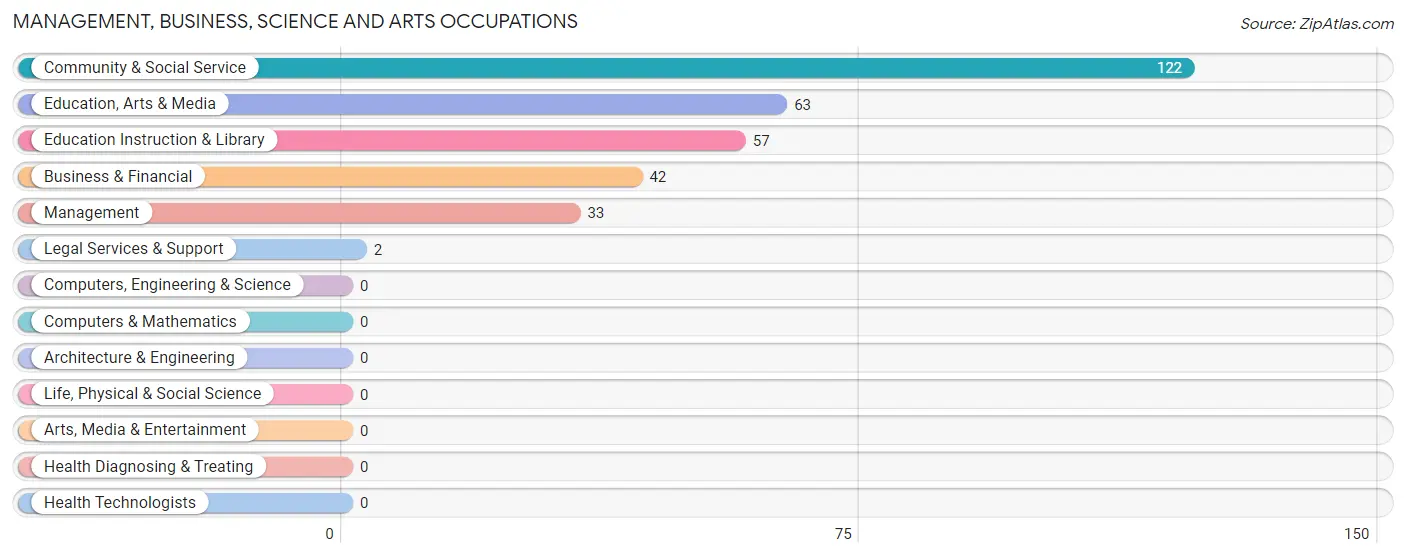
Management, Business, Science and Arts Occupations
The most common Management, Business, Science and Arts occupations in Kernville are Community & Social Service (122 | 48.0%), Education, Arts & Media (63 | 24.8%), Education Instruction & Library (57 | 22.4%), Business & Financial (42 | 16.5%), and Management (33 | 13.0%).
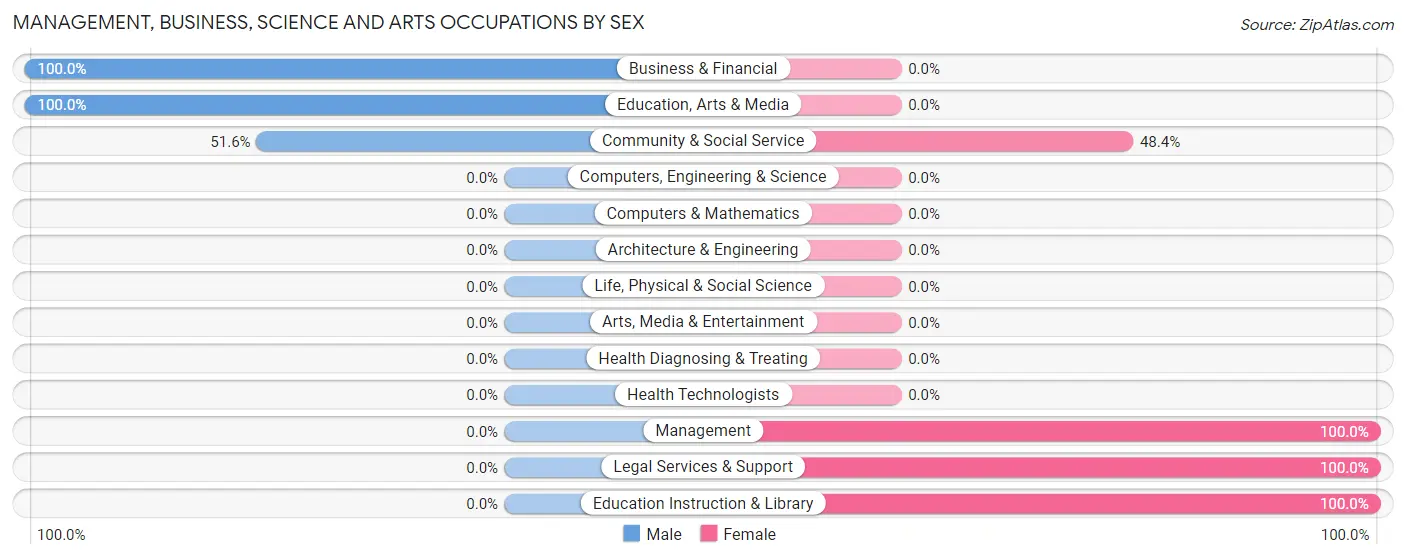
Management, Business, Science and Arts Occupations by Sex
Within the Management, Business, Science and Arts occupations in Kernville, the most male-oriented occupations are Business & Financial (100.0%), Education, Arts & Media (100.0%), and Community & Social Service (51.6%), while the most female-oriented occupations are Management (100.0%), Legal Services & Support (100.0%), and Education Instruction & Library (100.0%).
| Occupation | Male | Female |
| Management | 0 (0.0%) | 33 (100.0%) |
| Business & Financial | 42 (100.0%) | 0 (0.0%) |
| Computers, Engineering & Science | 0 (0.0%) | 0 (0.0%) |
| Computers & Mathematics | 0 (0.0%) | 0 (0.0%) |
| Architecture & Engineering | 0 (0.0%) | 0 (0.0%) |
| Life, Physical & Social Science | 0 (0.0%) | 0 (0.0%) |
| Community & Social Service | 63 (51.6%) | 59 (48.4%) |
| Education, Arts & Media | 63 (100.0%) | 0 (0.0%) |
| Legal Services & Support | 0 (0.0%) | 2 (100.0%) |
| Education Instruction & Library | 0 (0.0%) | 57 (100.0%) |
| Arts, Media & Entertainment | 0 (0.0%) | 0 (0.0%) |
| Health Diagnosing & Treating | 0 (0.0%) | 0 (0.0%) |
| Health Technologists | 0 (0.0%) | 0 (0.0%) |
| Total (Category) | 105 (53.3%) | 92 (46.7%) |
| Total (Overall) | 112 (44.1%) | 142 (55.9%) |
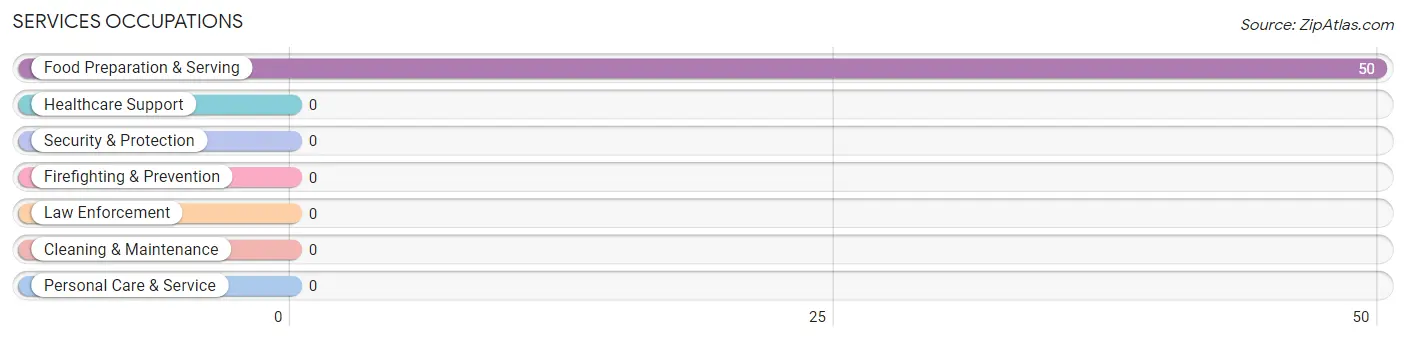
Services Occupations
The most common Services occupations in Kernville are , and Food Preparation & Serving (50 | 19.7%).
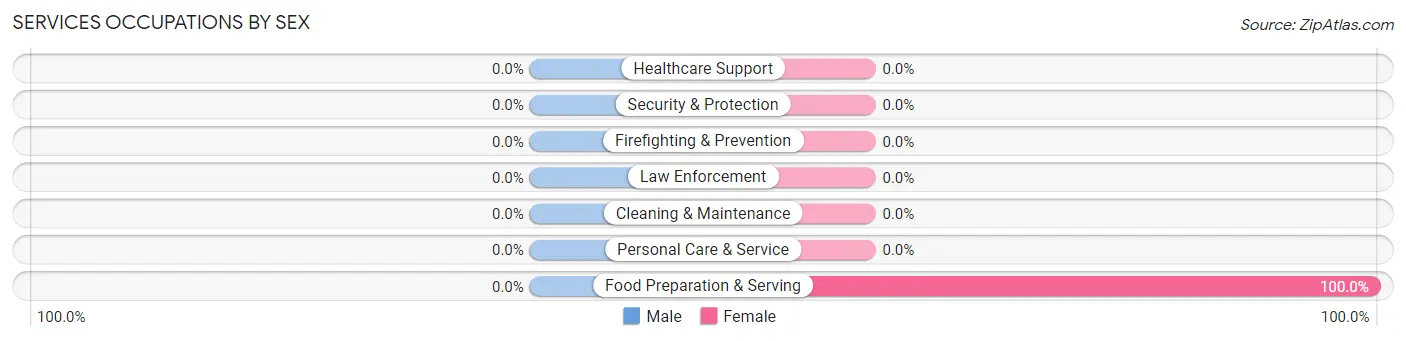
Services Occupations by Sex
| Occupation | Male | Female |
| Healthcare Support | 0 (0.0%) | 0 (0.0%) |
| Security & Protection | 0 (0.0%) | 0 (0.0%) |
| Firefighting & Prevention | 0 (0.0%) | 0 (0.0%) |
| Law Enforcement | 0 (0.0%) | 0 (0.0%) |
| Food Preparation & Serving | 0 (0.0%) | 50 (100.0%) |
| Cleaning & Maintenance | 0 (0.0%) | 0 (0.0%) |
| Personal Care & Service | 0 (0.0%) | 0 (0.0%) |
| Total (Category) | 0 (0.0%) | 50 (100.0%) |
| Total (Overall) | 112 (44.1%) | 142 (55.9%) |
Sales and Office Occupations
The most common Sales and Office occupations in Kernville are , and Office & Administration (7 | 2.8%).
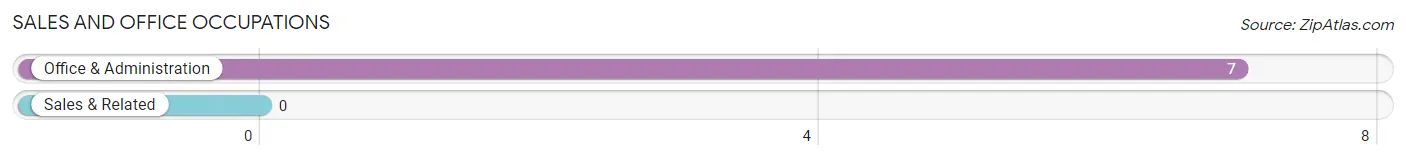
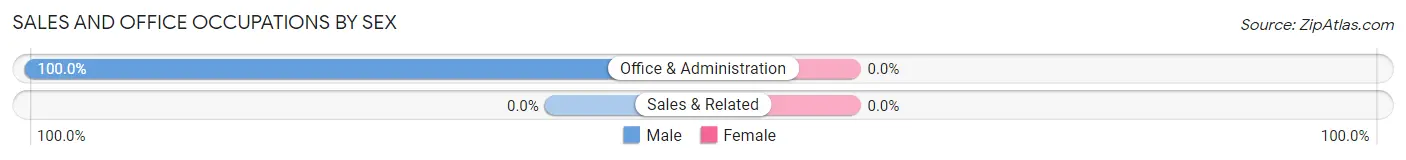
Sales and Office Occupations by Sex
| Occupation | Male | Female |
| Sales & Related | 0 (0.0%) | 0 (0.0%) |
| Office & Administration | 7 (100.0%) | 0 (0.0%) |
| Total (Category) | 7 (100.0%) | 0 (0.0%) |
| Total (Overall) | 112 (44.1%) | 142 (55.9%) |
Natural Resources, Construction and Maintenance Occupations
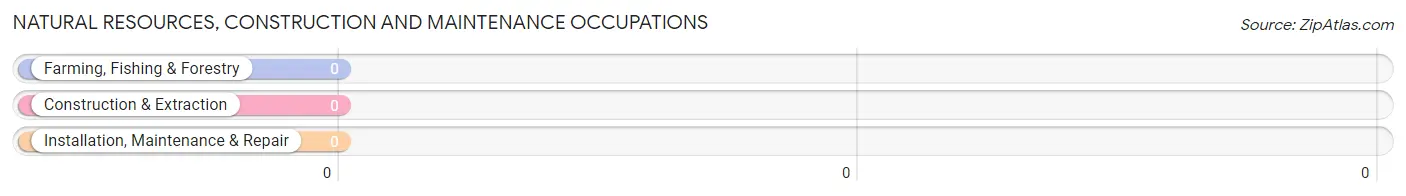
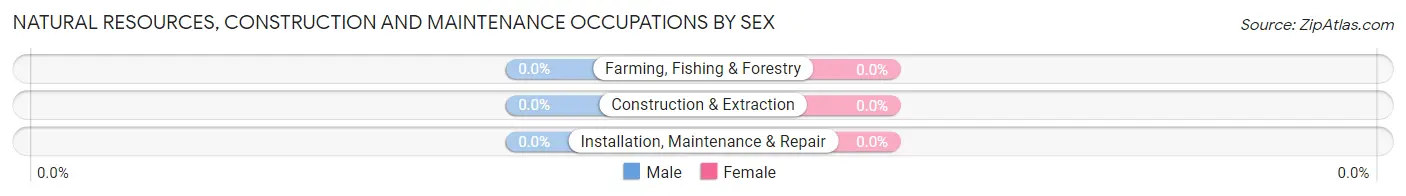
Natural Resources, Construction and Maintenance Occupations by Sex
| Occupation | Male | Female |
| Farming, Fishing & Forestry | 0 (0.0%) | 0 (0.0%) |
| Construction & Extraction | 0 (0.0%) | 0 (0.0%) |
| Installation, Maintenance & Repair | 0 (0.0%) | 0 (0.0%) |
| Total (Category) | 0 (0.0%) | 0 (0.0%) |
| Total (Overall) | 112 (44.1%) | 142 (55.9%) |
Production, Transportation and Moving Occupations
Production, Transportation and Moving Occupations by Sex
| Occupation | Male | Female |
| Production | 0 (0.0%) | 0 (0.0%) |
| Transportation | 0 (0.0%) | 0 (0.0%) |
| Material Moving | 0 (0.0%) | 0 (0.0%) |
| Total (Category) | 0 (0.0%) | 0 (0.0%) |
| Total (Overall) | 112 (44.1%) | 142 (55.9%) |
Employment Industries by Sex in Kernville
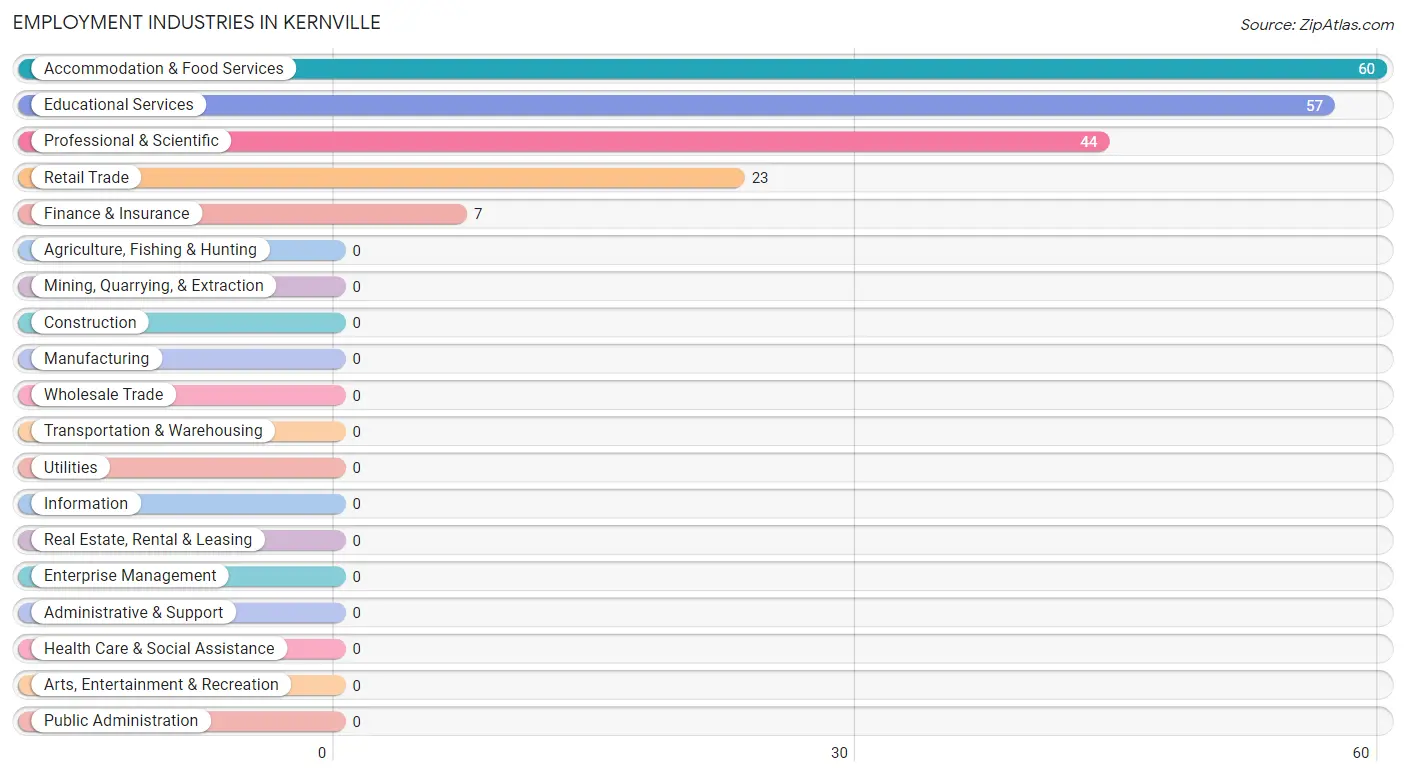
Employment Industries in Kernville
The major employment industries in Kernville include Accommodation & Food Services (60 | 23.6%), Educational Services (57 | 22.4%), Professional & Scientific (44 | 17.3%), Retail Trade (23 | 9.1%), and Finance & Insurance (7 | 2.8%).
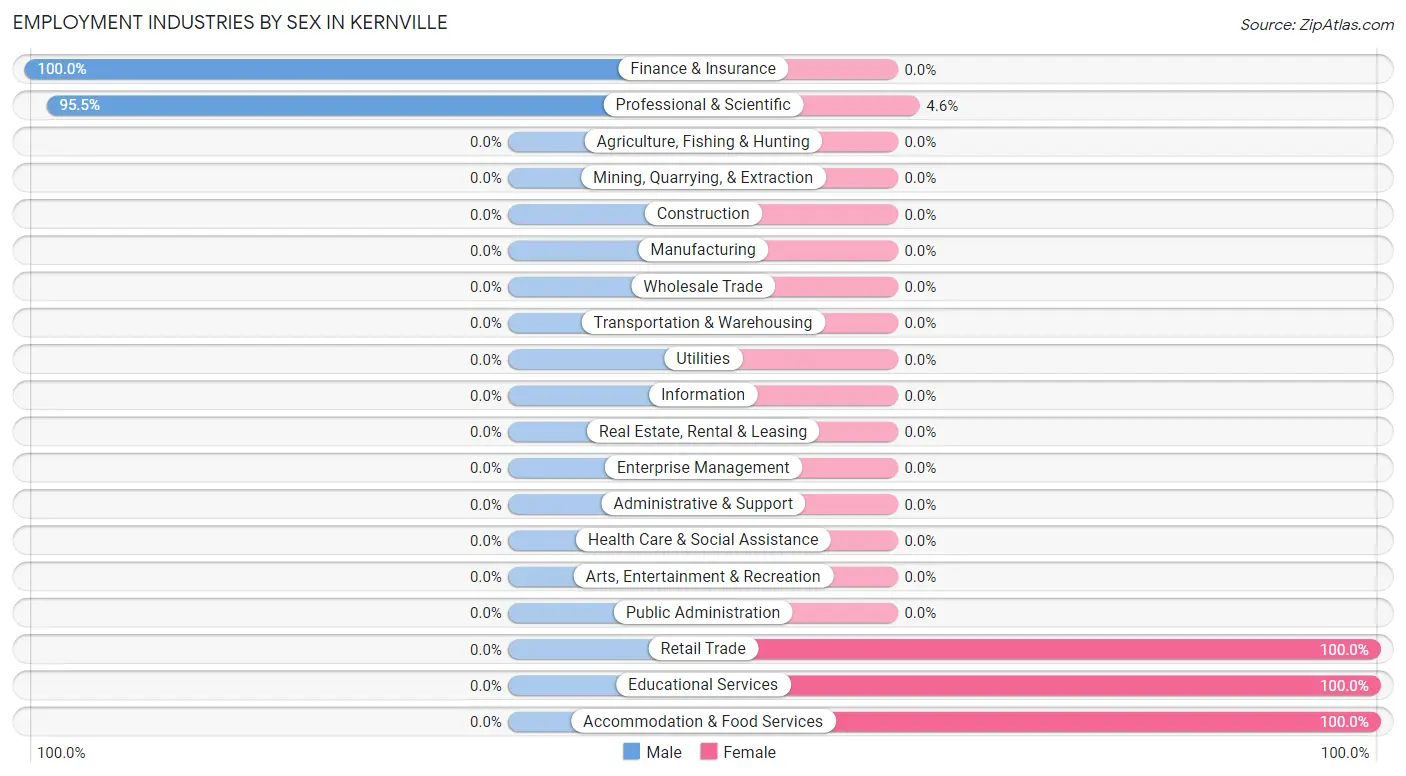
Employment Industries by Sex in Kernville
The Kernville industries that see more men than women are Finance & Insurance (100.0%), and Professional & Scientific (95.5%), whereas the industries that tend to have a higher number of women are Retail Trade (100.0%), Educational Services (100.0%), and Accommodation & Food Services (100.0%).
| Industry | Male | Female |
| Agriculture, Fishing & Hunting | 0 (0.0%) | 0 (0.0%) |
| Mining, Quarrying, & Extraction | 0 (0.0%) | 0 (0.0%) |
| Construction | 0 (0.0%) | 0 (0.0%) |
| Manufacturing | 0 (0.0%) | 0 (0.0%) |
| Wholesale Trade | 0 (0.0%) | 0 (0.0%) |
| Retail Trade | 0 (0.0%) | 23 (100.0%) |
| Transportation & Warehousing | 0 (0.0%) | 0 (0.0%) |
| Utilities | 0 (0.0%) | 0 (0.0%) |
| Information | 0 (0.0%) | 0 (0.0%) |
| Finance & Insurance | 7 (100.0%) | 0 (0.0%) |
| Real Estate, Rental & Leasing | 0 (0.0%) | 0 (0.0%) |
| Professional & Scientific | 42 (95.5%) | 2 (4.5%) |
| Enterprise Management | 0 (0.0%) | 0 (0.0%) |
| Administrative & Support | 0 (0.0%) | 0 (0.0%) |
| Educational Services | 0 (0.0%) | 57 (100.0%) |
| Health Care & Social Assistance | 0 (0.0%) | 0 (0.0%) |
| Arts, Entertainment & Recreation | 0 (0.0%) | 0 (0.0%) |
| Accommodation & Food Services | 0 (0.0%) | 60 (100.0%) |
| Public Administration | 0 (0.0%) | 0 (0.0%) |
| Total | 112 (44.1%) | 142 (55.9%) |
Education in Kernville
School Enrollment in Kernville
The most common levels of schooling among the 133 students in Kernville are middle school (67 | 50.4%), elementary school (62 | 46.6%), and high school (2 | 1.5%).
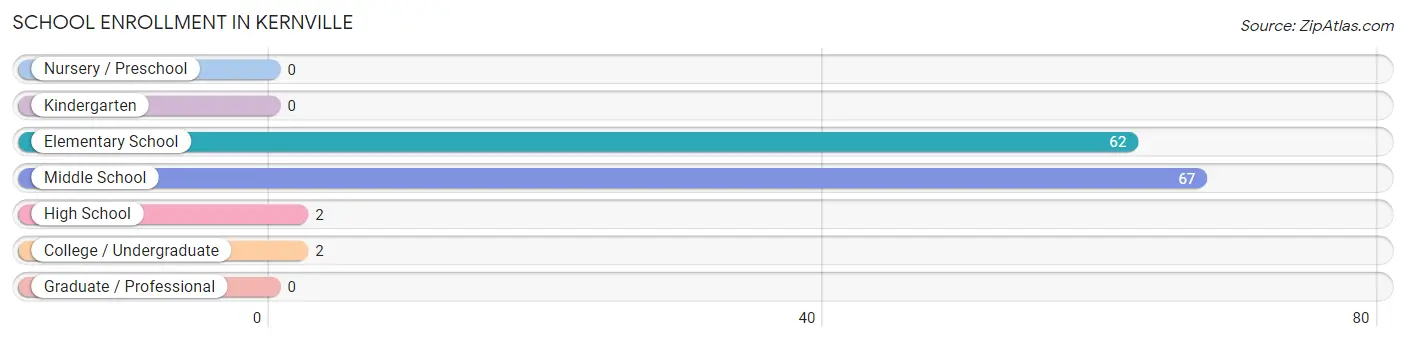
| School Level | # Students | % Students |
| Nursery / Preschool | 0 | 0.0% |
| Kindergarten | 0 | 0.0% |
| Elementary School | 62 | 46.6% |
| Middle School | 67 | 50.4% |
| High School | 2 | 1.5% |
| College / Undergraduate | 2 | 1.5% |
| Graduate / Professional | 0 | 0.0% |
| Total | 133 | 100.0% |
School Enrollment by Age by Funding Source in Kernville
Out of a total of 133 students who are enrolled in schools in Kernville, 68 (51.1%) attend a private institution, while the remaining 65 (48.9%) are enrolled in public schools. The age group of 15 to 17 year olds has the highest likelihood of being enrolled in private schools, with 1 (100.0% in the age bracket) enrolled. Conversely, the age group of 35 years and over has the lowest likelihood of being enrolled in a private school, with 2 (100.0% in the age bracket) attending a public institution.
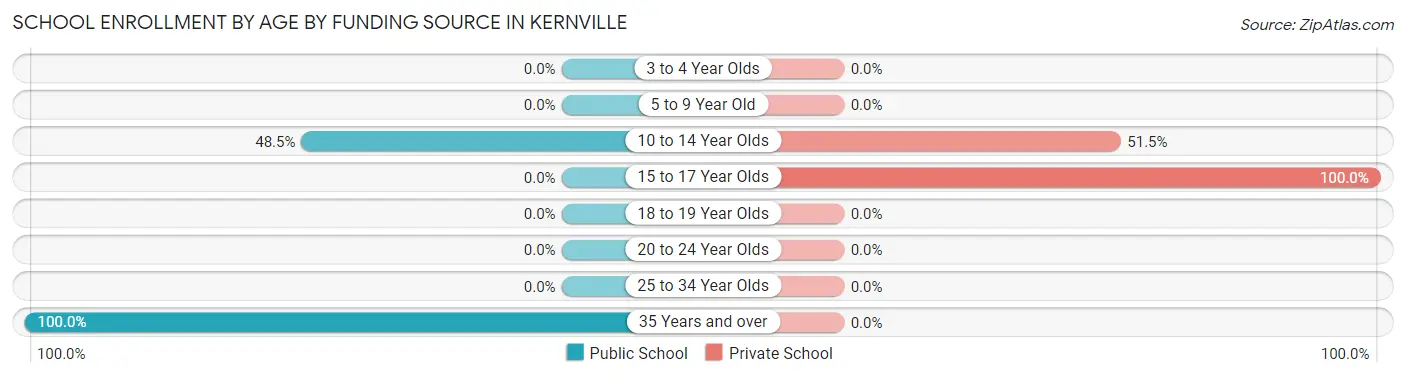
| Age Bracket | Public School | Private School |
| 3 to 4 Year Olds | 0 (0.0%) | 0 (0.0%) |
| 5 to 9 Year Old | 0 (0.0%) | 0 (0.0%) |
| 10 to 14 Year Olds | 63 (48.5%) | 67 (51.5%) |
| 15 to 17 Year Olds | 0 (0.0%) | 1 (100.0%) |
| 18 to 19 Year Olds | 0 (0.0%) | 0 (0.0%) |
| 20 to 24 Year Olds | 0 (0.0%) | 0 (0.0%) |
| 25 to 34 Year Olds | 0 (0.0%) | 0 (0.0%) |
| 35 Years and over | 2 (100.0%) | 0 (0.0%) |
| Total | 65 (48.9%) | 68 (51.1%) |
Educational Attainment by Field of Study in Kernville
Liberal arts & history (124 | 32.7%), education (117 | 30.9%), social sciences (75 | 19.8%), business (61 | 16.1%), and literature & languages (2 | 0.5%) are the most common fields of study among 379 individuals in Kernville who have obtained a bachelor's degree or higher.
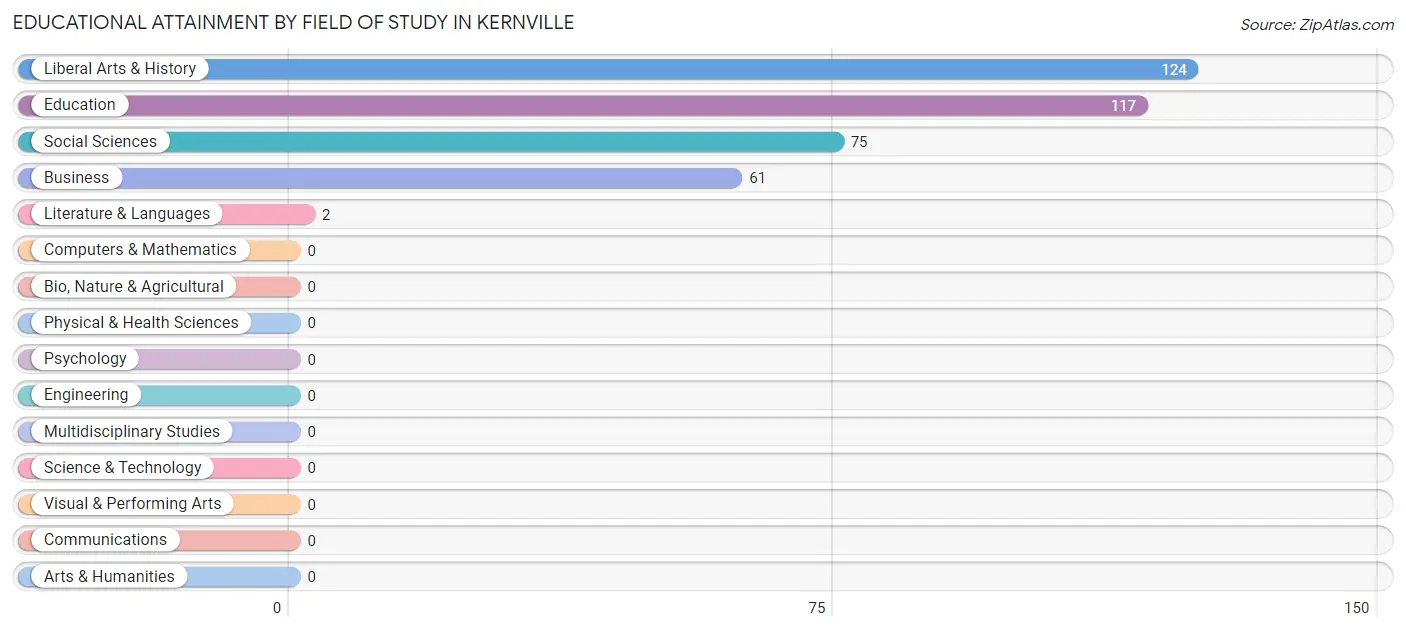
| Field of Study | # Graduates | % Graduates |
| Computers & Mathematics | 0 | 0.0% |
| Bio, Nature & Agricultural | 0 | 0.0% |
| Physical & Health Sciences | 0 | 0.0% |
| Psychology | 0 | 0.0% |
| Social Sciences | 75 | 19.8% |
| Engineering | 0 | 0.0% |
| Multidisciplinary Studies | 0 | 0.0% |
| Science & Technology | 0 | 0.0% |
| Business | 61 | 16.1% |
| Education | 117 | 30.9% |
| Literature & Languages | 2 | 0.5% |
| Liberal Arts & History | 124 | 32.7% |
| Visual & Performing Arts | 0 | 0.0% |
| Communications | 0 | 0.0% |
| Arts & Humanities | 0 | 0.0% |
| Total | 379 | 100.0% |
Transportation & Commute in Kernville
Vehicle Availability by Sex in Kernville
The most prevalent vehicle ownership categories in Kernville are males with 2 vehicles (63, accounting for 56.2%) and females with 2 vehicles (27, making up 74.1%).
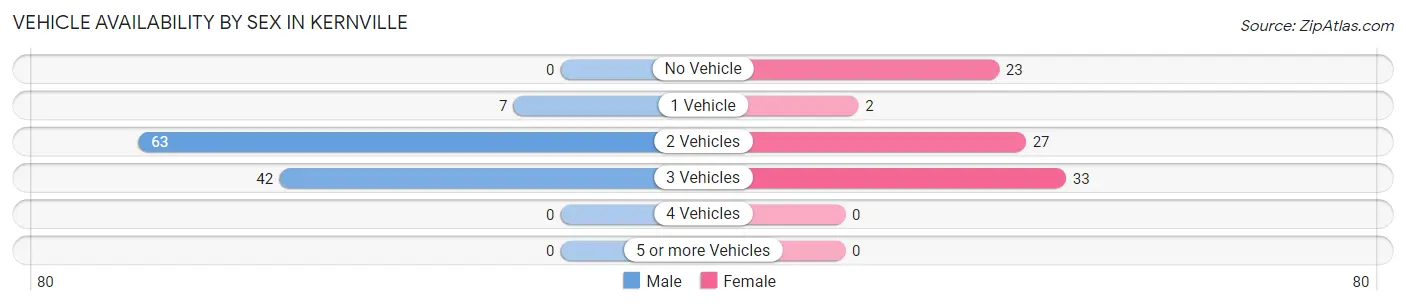
| Vehicles Available | Male | Female |
| No Vehicle | 0 (0.0%) | 23 (27.1%) |
| 1 Vehicle | 7 (6.2%) | 2 (2.4%) |
| 2 Vehicles | 63 (56.2%) | 27 (31.8%) |
| 3 Vehicles | 42 (37.5%) | 33 (38.8%) |
| 4 Vehicles | 0 (0.0%) | 0 (0.0%) |
| 5 or more Vehicles | 0 (0.0%) | 0 (0.0%) |
| Total | 112 (100.0%) | 85 (100.0%) |
Commute Time in Kernville
The most frequently occuring commute durations in Kernville are 15 to 19 minutes (63 commuters, 36.2%), 90 or more minutes (42 commuters, 24.1%), and 10 to 14 minutes (34 commuters, 19.5%).
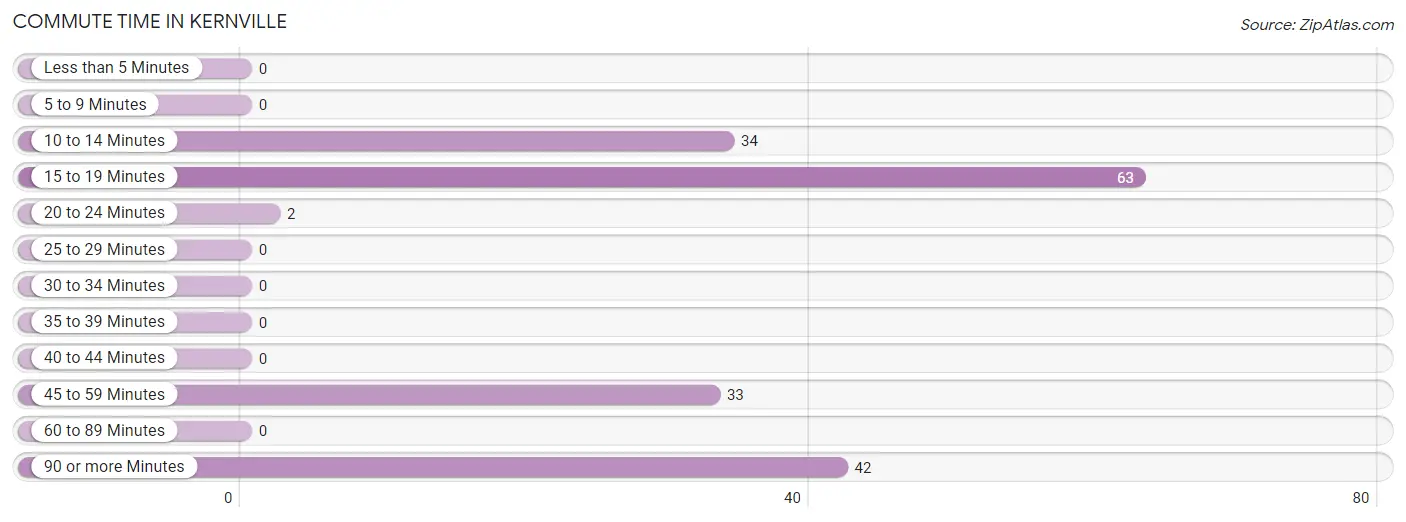
| Commute Time | # Commuters | % Commuters |
| Less than 5 Minutes | 0 | 0.0% |
| 5 to 9 Minutes | 0 | 0.0% |
| 10 to 14 Minutes | 34 | 19.5% |
| 15 to 19 Minutes | 63 | 36.2% |
| 20 to 24 Minutes | 2 | 1.1% |
| 25 to 29 Minutes | 0 | 0.0% |
| 30 to 34 Minutes | 0 | 0.0% |
| 35 to 39 Minutes | 0 | 0.0% |
| 40 to 44 Minutes | 0 | 0.0% |
| 45 to 59 Minutes | 33 | 19.0% |
| 60 to 89 Minutes | 0 | 0.0% |
| 90 or more Minutes | 42 | 24.1% |
Commute Time by Sex in Kernville
The most common commute times in Kernville are 15 to 19 minutes (63 commuters, 56.2%) for males and 45 to 59 minutes (33 commuters, 53.2%) for females.
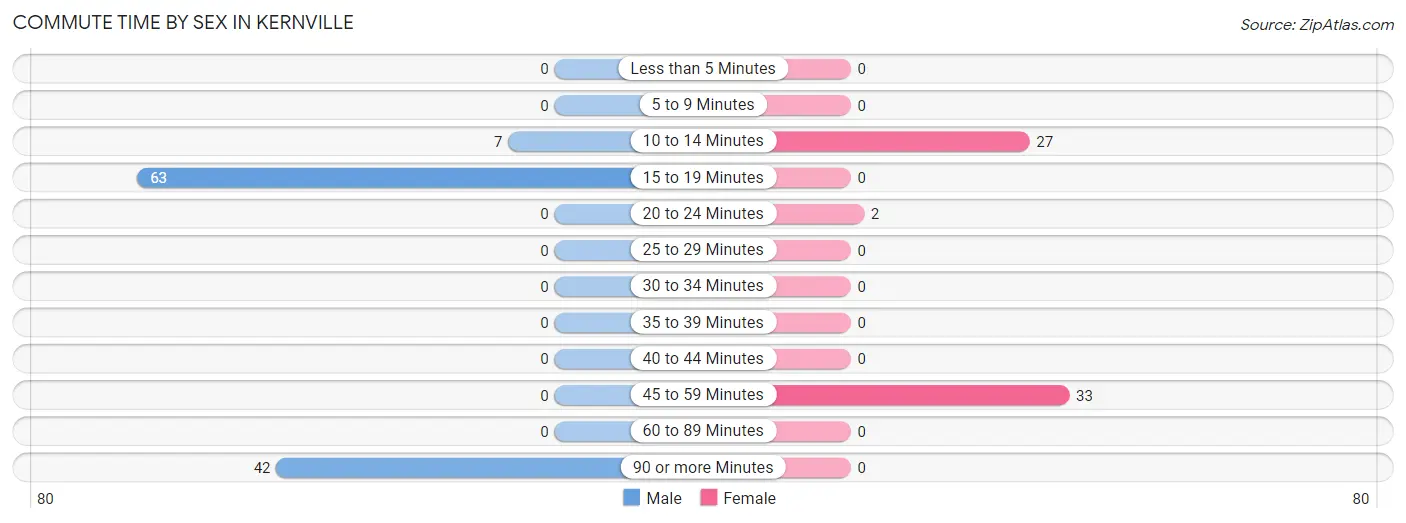
| Commute Time | Male | Female |
| Less than 5 Minutes | 0 (0.0%) | 0 (0.0%) |
| 5 to 9 Minutes | 0 (0.0%) | 0 (0.0%) |
| 10 to 14 Minutes | 7 (6.2%) | 27 (43.5%) |
| 15 to 19 Minutes | 63 (56.2%) | 0 (0.0%) |
| 20 to 24 Minutes | 0 (0.0%) | 2 (3.2%) |
| 25 to 29 Minutes | 0 (0.0%) | 0 (0.0%) |
| 30 to 34 Minutes | 0 (0.0%) | 0 (0.0%) |
| 35 to 39 Minutes | 0 (0.0%) | 0 (0.0%) |
| 40 to 44 Minutes | 0 (0.0%) | 0 (0.0%) |
| 45 to 59 Minutes | 0 (0.0%) | 33 (53.2%) |
| 60 to 89 Minutes | 0 (0.0%) | 0 (0.0%) |
| 90 or more Minutes | 42 (37.5%) | 0 (0.0%) |
Time of Departure to Work by Sex in Kernville
The most frequent times of departure to work in Kernville are 7:30 AM to 7:59 AM (63, 56.2%) for males and 7:00 AM to 7:29 AM (33, 53.2%) for females.
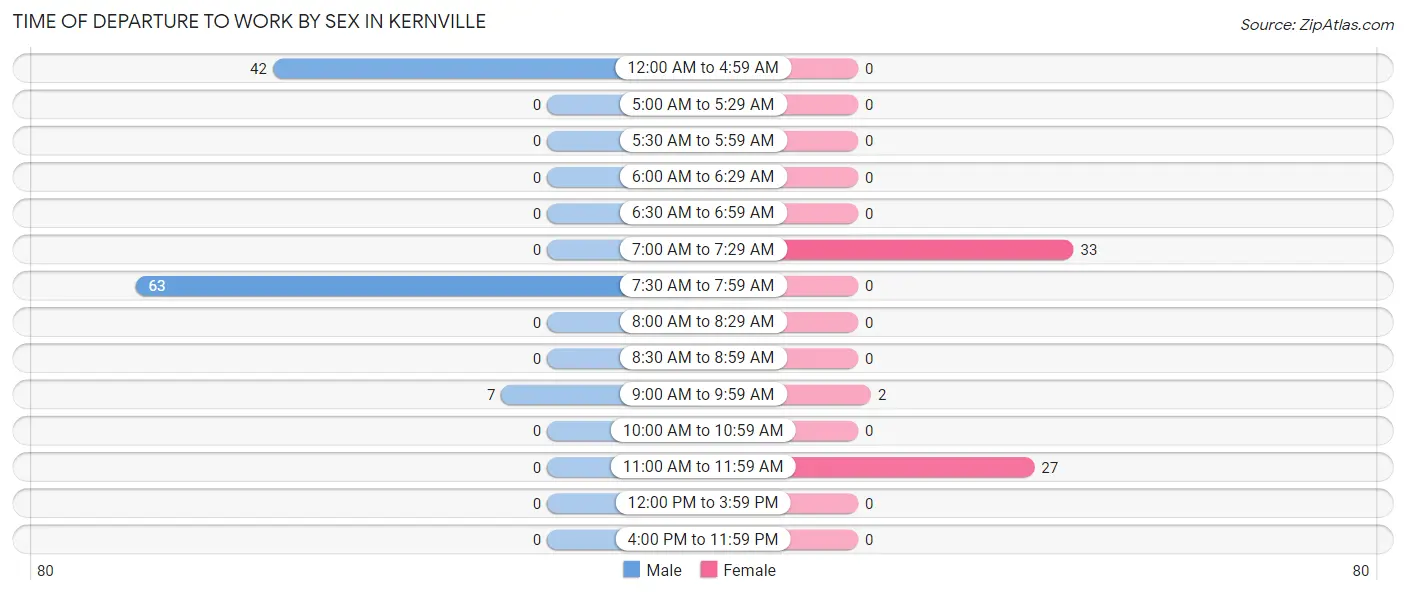
| Time of Departure | Male | Female |
| 12:00 AM to 4:59 AM | 42 (37.5%) | 0 (0.0%) |
| 5:00 AM to 5:29 AM | 0 (0.0%) | 0 (0.0%) |
| 5:30 AM to 5:59 AM | 0 (0.0%) | 0 (0.0%) |
| 6:00 AM to 6:29 AM | 0 (0.0%) | 0 (0.0%) |
| 6:30 AM to 6:59 AM | 0 (0.0%) | 0 (0.0%) |
| 7:00 AM to 7:29 AM | 0 (0.0%) | 33 (53.2%) |
| 7:30 AM to 7:59 AM | 63 (56.2%) | 0 (0.0%) |
| 8:00 AM to 8:29 AM | 0 (0.0%) | 0 (0.0%) |
| 8:30 AM to 8:59 AM | 0 (0.0%) | 0 (0.0%) |
| 9:00 AM to 9:59 AM | 7 (6.2%) | 2 (3.2%) |
| 10:00 AM to 10:59 AM | 0 (0.0%) | 0 (0.0%) |
| 11:00 AM to 11:59 AM | 0 (0.0%) | 27 (43.5%) |
| 12:00 PM to 3:59 PM | 0 (0.0%) | 0 (0.0%) |
| 4:00 PM to 11:59 PM | 0 (0.0%) | 0 (0.0%) |
| Total | 112 (100.0%) | 62 (100.0%) |
Housing Occupancy in Kernville
Occupancy by Ownership in Kernville
Of the total 385 dwellings in Kernville, owner-occupied units account for 385 (100.0%), while renter-occupied units make up 0 (0.0%).
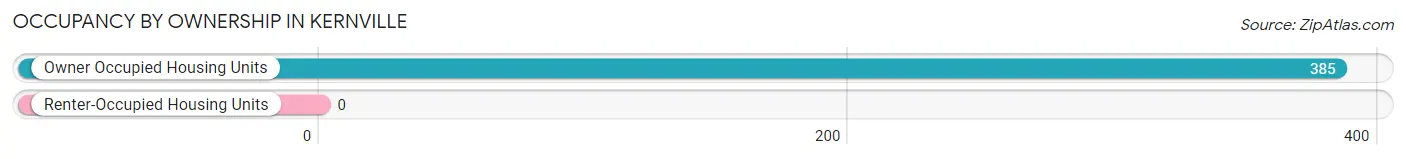
| Occupancy | # Housing Units | % Housing Units |
| Owner Occupied Housing Units | 385 | 100.0% |
| Renter-Occupied Housing Units | 0 | 0.0% |
| Total Occupied Housing Units | 385 | 100.0% |
Occupancy by Household Size in Kernville
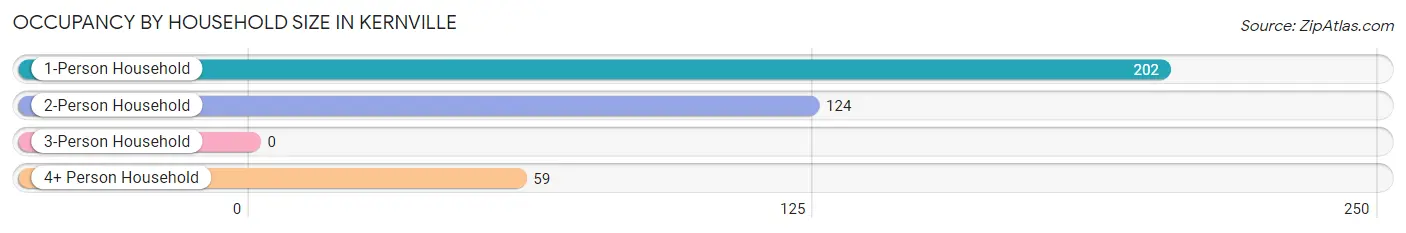
| Household Size | # Housing Units | % Housing Units |
| 1-Person Household | 202 | 52.5% |
| 2-Person Household | 124 | 32.2% |
| 3-Person Household | 0 | 0.0% |
| 4+ Person Household | 59 | 15.3% |
| Total Housing Units | 385 | 100.0% |
Occupancy by Ownership by Household Size in Kernville
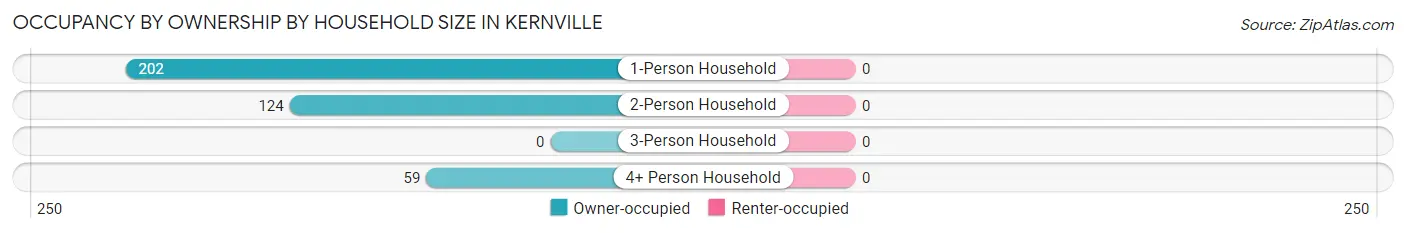
| Household Size | Owner-occupied | Renter-occupied |
| 1-Person Household | 202 (100.0%) | 0 (0.0%) |
| 2-Person Household | 124 (100.0%) | 0 (0.0%) |
| 3-Person Household | 0 (0.0%) | 0 (0.0%) |
| 4+ Person Household | 59 (100.0%) | 0 (0.0%) |
| Total Housing Units | 385 (100.0%) | 0 (0.0%) |
Occupancy by Educational Attainment in Kernville
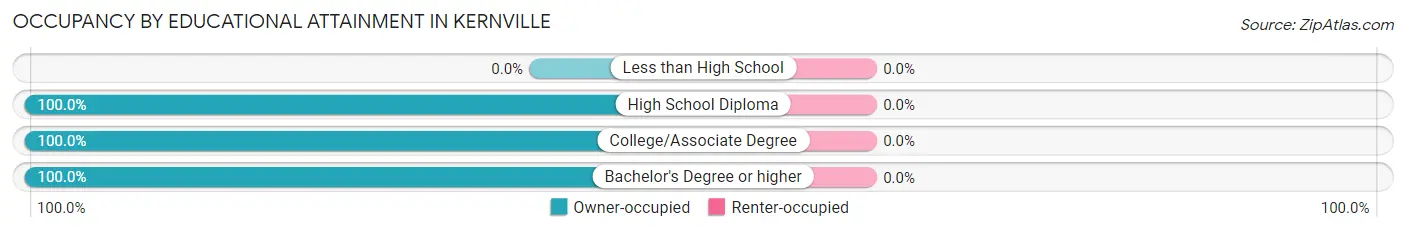
| Household Size | Owner-occupied | Renter-occupied |
| Less than High School | 0 (0.0%) | 0 (0.0%) |
| High School Diploma | 43 (100.0%) | 0 (0.0%) |
| College/Associate Degree | 131 (100.0%) | 0 (0.0%) |
| Bachelor's Degree or higher | 211 (100.0%) | 0 (0.0%) |
Occupancy by Age of Householder in Kernville
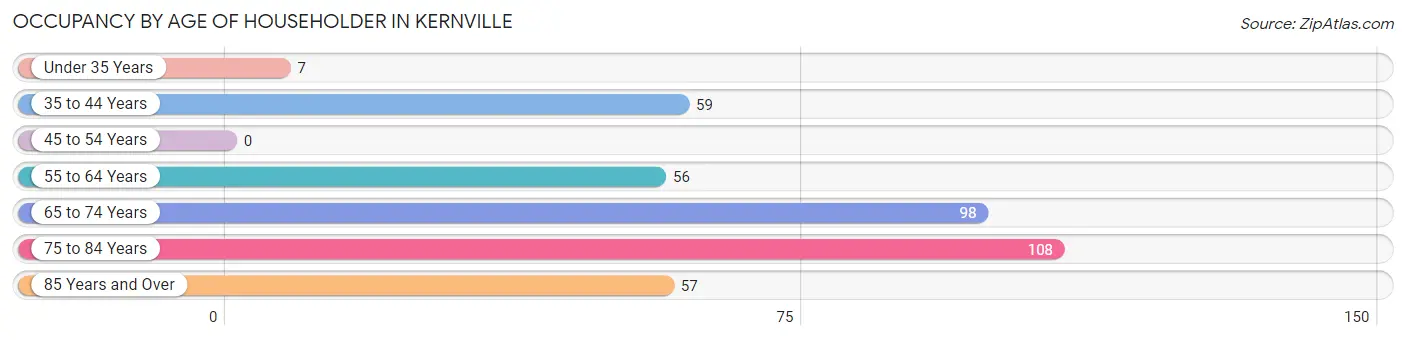
| Age Bracket | # Households | % Households |
| Under 35 Years | 7 | 1.8% |
| 35 to 44 Years | 59 | 15.3% |
| 45 to 54 Years | 0 | 0.0% |
| 55 to 64 Years | 56 | 14.5% |
| 65 to 74 Years | 98 | 25.5% |
| 75 to 84 Years | 108 | 28.1% |
| 85 Years and Over | 57 | 14.8% |
| Total | 385 | 100.0% |
Housing Finances in Kernville
Median Income by Occupancy in Kernville
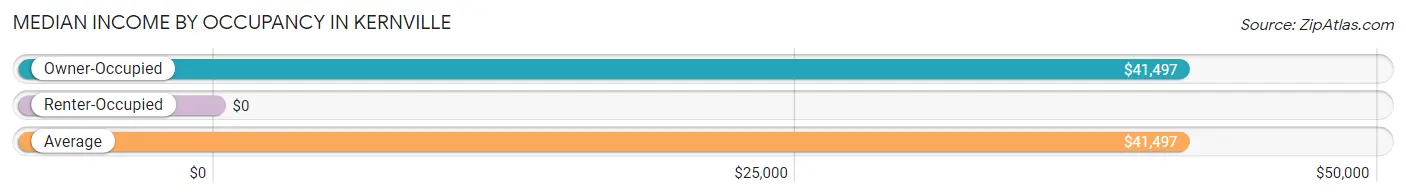
| Occupancy Type | # Households | Median Income |
| Owner-Occupied | 385 (100.0%) | $41,497 |
| Renter-Occupied | 0 (0.0%) | $0 |
| Average | 385 (100.0%) | $41,497 |
Occupancy by Householder Income Bracket in Kernville
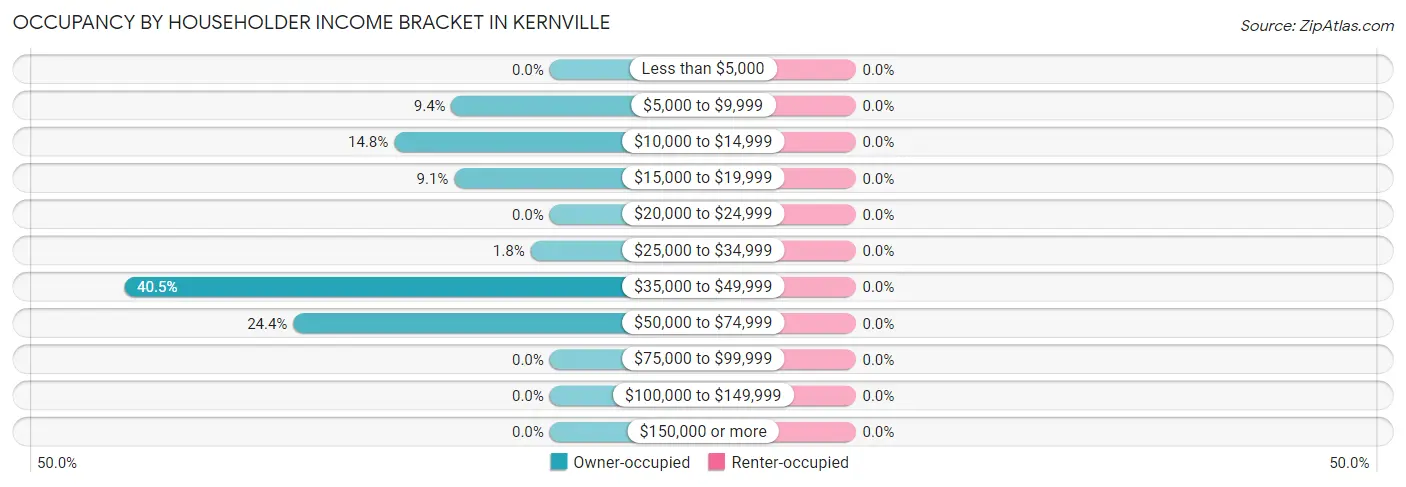
| Income Bracket | Owner-occupied | Renter-occupied |
| Less than $5,000 | 0 (0.0%) | 0 (0.0%) |
| $5,000 to $9,999 | 36 (9.3%) | 0 (0.0%) |
| $10,000 to $14,999 | 57 (14.8%) | 0 (0.0%) |
| $15,000 to $19,999 | 35 (9.1%) | 0 (0.0%) |
| $20,000 to $24,999 | 0 (0.0%) | 0 (0.0%) |
| $25,000 to $34,999 | 7 (1.8%) | 0 (0.0%) |
| $35,000 to $49,999 | 156 (40.5%) | 0 (0.0%) |
| $50,000 to $74,999 | 94 (24.4%) | 0 (0.0%) |
| $75,000 to $99,999 | 0 (0.0%) | 0 (0.0%) |
| $100,000 to $149,999 | 0 (0.0%) | 0 (0.0%) |
| $150,000 or more | 0 (0.0%) | 0 (0.0%) |
| Total | 385 (100.0%) | 0 (0.0%) |
Monthly Housing Cost Tiers in Kernville
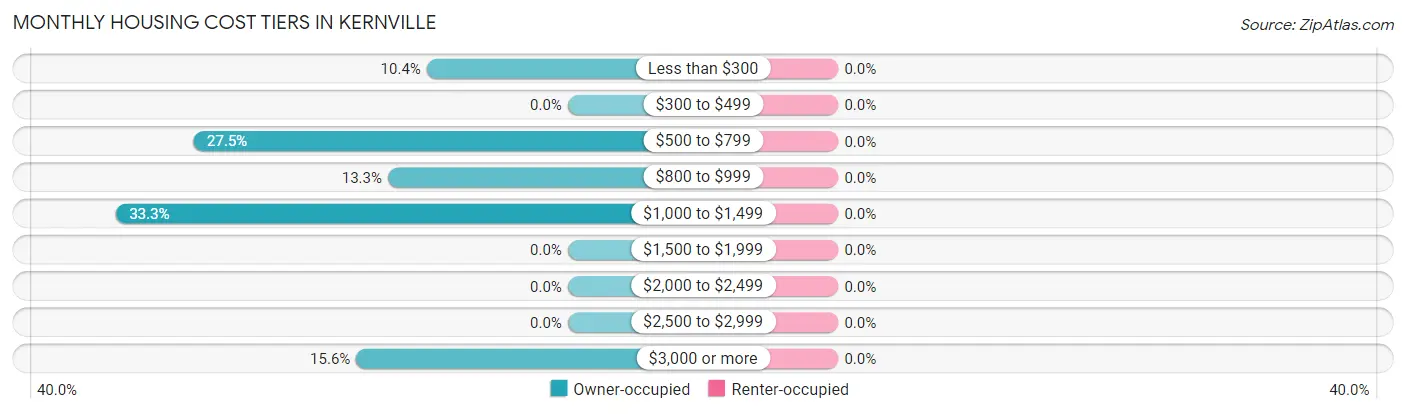
| Monthly Cost | Owner-occupied | Renter-occupied |
| Less than $300 | 40 (10.4%) | 0 (0.0%) |
| $300 to $499 | 0 (0.0%) | 0 (0.0%) |
| $500 to $799 | 106 (27.5%) | 0 (0.0%) |
| $800 to $999 | 51 (13.3%) | 0 (0.0%) |
| $1,000 to $1,499 | 128 (33.3%) | 0 (0.0%) |
| $1,500 to $1,999 | 0 (0.0%) | 0 (0.0%) |
| $2,000 to $2,499 | 0 (0.0%) | 0 (0.0%) |
| $2,500 to $2,999 | 0 (0.0%) | 0 (0.0%) |
| $3,000 or more | 60 (15.6%) | 0 (0.0%) |
| Total | 385 (100.0%) | 0 (0.0%) |
Physical Housing Characteristics in Kernville
Housing Structures in Kernville
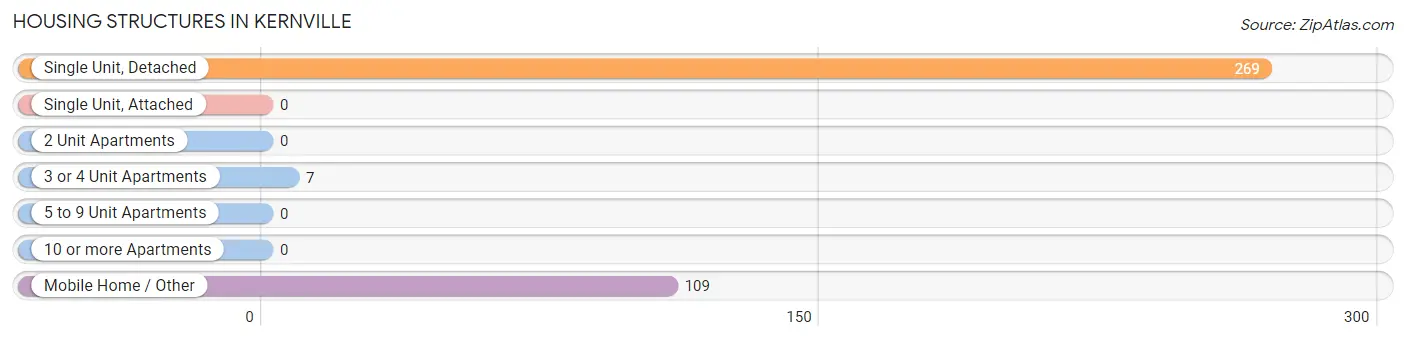
| Structure Type | # Housing Units | % Housing Units |
| Single Unit, Detached | 269 | 69.9% |
| Single Unit, Attached | 0 | 0.0% |
| 2 Unit Apartments | 0 | 0.0% |
| 3 or 4 Unit Apartments | 7 | 1.8% |
| 5 to 9 Unit Apartments | 0 | 0.0% |
| 10 or more Apartments | 0 | 0.0% |
| Mobile Home / Other | 109 | 28.3% |
| Total | 385 | 100.0% |
Housing Structures by Occupancy in Kernville
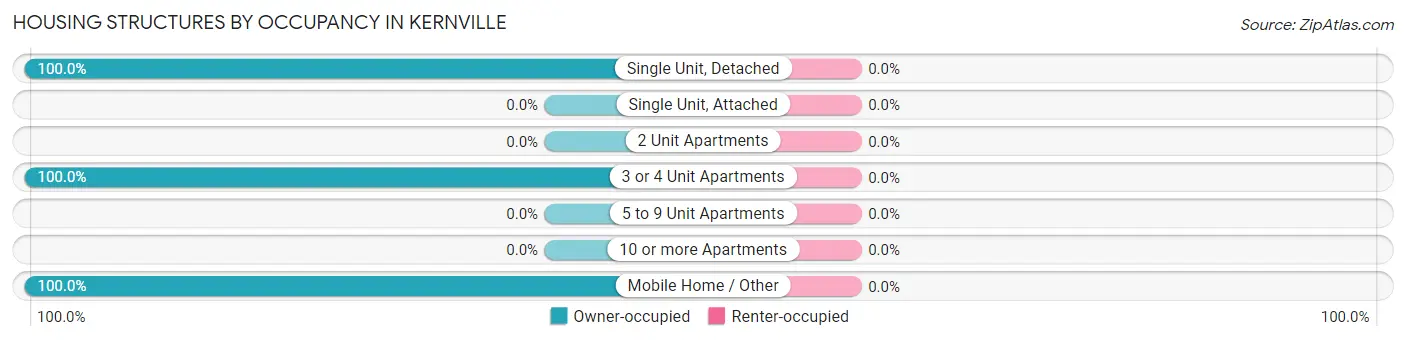
| Structure Type | Owner-occupied | Renter-occupied |
| Single Unit, Detached | 269 (100.0%) | 0 (0.0%) |
| Single Unit, Attached | 0 (0.0%) | 0 (0.0%) |
| 2 Unit Apartments | 0 (0.0%) | 0 (0.0%) |
| 3 or 4 Unit Apartments | 7 (100.0%) | 0 (0.0%) |
| 5 to 9 Unit Apartments | 0 (0.0%) | 0 (0.0%) |
| 10 or more Apartments | 0 (0.0%) | 0 (0.0%) |
| Mobile Home / Other | 109 (100.0%) | 0 (0.0%) |
| Total | 385 (100.0%) | 0 (0.0%) |
Housing Structures by Number of Rooms in Kernville
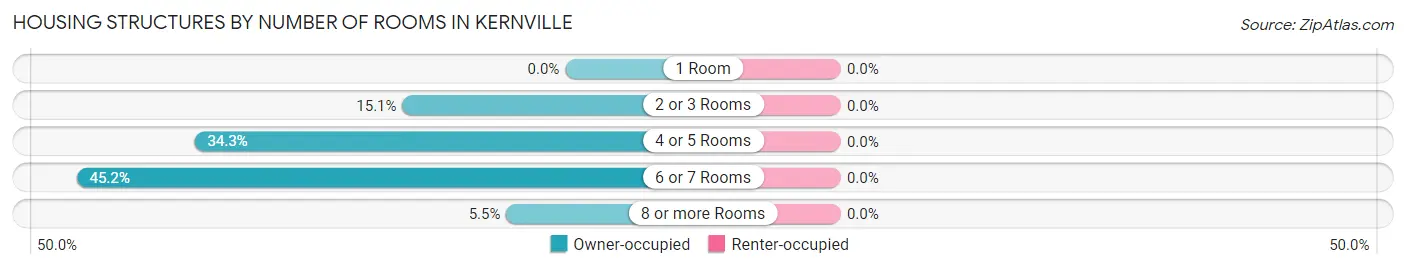
| Number of Rooms | Owner-occupied | Renter-occupied |
| 1 Room | 0 (0.0%) | 0 (0.0%) |
| 2 or 3 Rooms | 58 (15.1%) | 0 (0.0%) |
| 4 or 5 Rooms | 132 (34.3%) | 0 (0.0%) |
| 6 or 7 Rooms | 174 (45.2%) | 0 (0.0%) |
| 8 or more Rooms | 21 (5.4%) | 0 (0.0%) |
| Total | 385 (100.0%) | 0 (0.0%) |
Housing Structure by Heating Type in Kernville
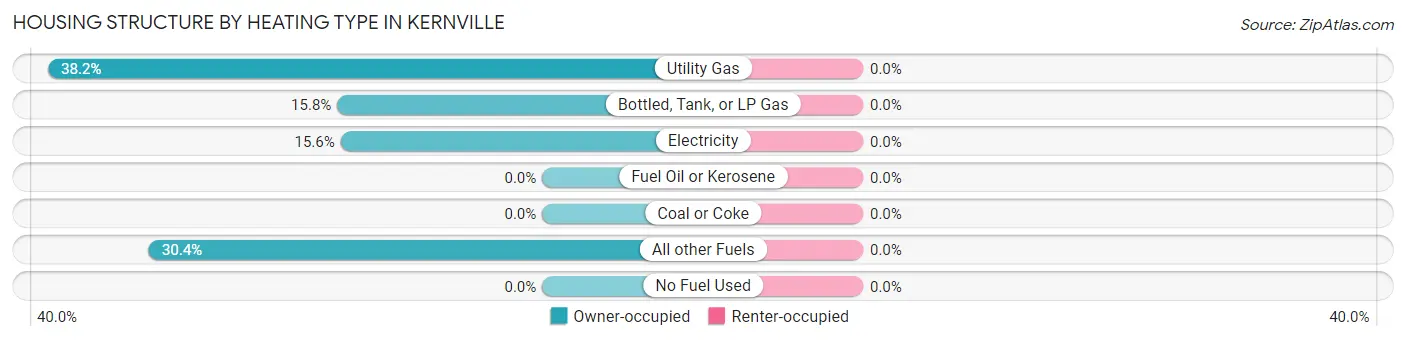
| Heating Type | Owner-occupied | Renter-occupied |
| Utility Gas | 147 (38.2%) | 0 (0.0%) |
| Bottled, Tank, or LP Gas | 61 (15.8%) | 0 (0.0%) |
| Electricity | 60 (15.6%) | 0 (0.0%) |
| Fuel Oil or Kerosene | 0 (0.0%) | 0 (0.0%) |
| Coal or Coke | 0 (0.0%) | 0 (0.0%) |
| All other Fuels | 117 (30.4%) | 0 (0.0%) |
| No Fuel Used | 0 (0.0%) | 0 (0.0%) |
| Total | 385 (100.0%) | 0 (0.0%) |
Household Vehicle Usage in Kernville
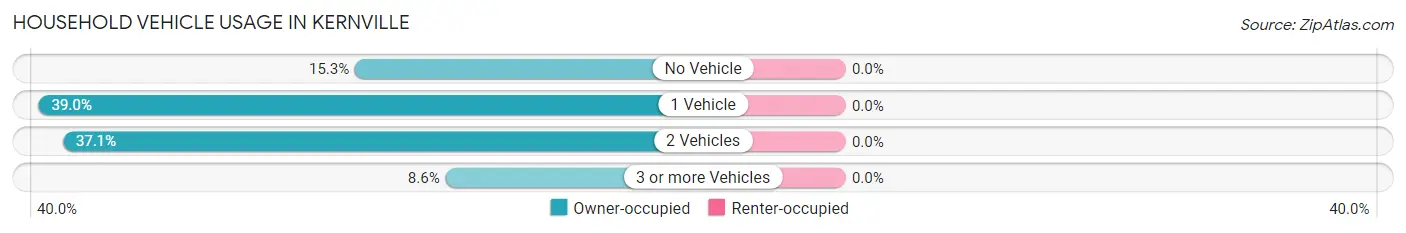
| Vehicles per Household | Owner-occupied | Renter-occupied |
| No Vehicle | 59 (15.3%) | 0 (0.0%) |
| 1 Vehicle | 150 (39.0%) | 0 (0.0%) |
| 2 Vehicles | 143 (37.1%) | 0 (0.0%) |
| 3 or more Vehicles | 33 (8.6%) | 0 (0.0%) |
| Total | 385 (100.0%) | 0 (0.0%) |
Real Estate & Mortgages in Kernville
Real Estate and Mortgage Overview in Kernville
| Characteristic | Without Mortgage | With Mortgage |
| Housing Units | 197 | 188 |
| Median Property Value | - | - |
| Median Household Income | - | - |
| Monthly Housing Costs | $703 | $60 |
| Real Estate Taxes | $5,417 | $0 |
Property Value by Mortgage Status in Kernville
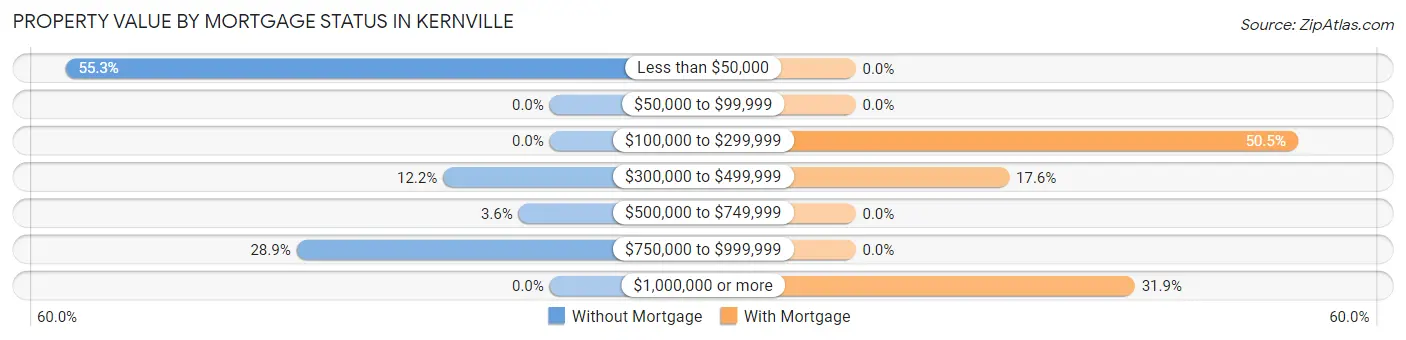
| Property Value | Without Mortgage | With Mortgage |
| Less than $50,000 | 109 (55.3%) | 0 (0.0%) |
| $50,000 to $99,999 | 0 (0.0%) | 0 (0.0%) |
| $100,000 to $299,999 | 0 (0.0%) | 95 (50.5%) |
| $300,000 to $499,999 | 24 (12.2%) | 33 (17.5%) |
| $500,000 to $749,999 | 7 (3.5%) | 0 (0.0%) |
| $750,000 to $999,999 | 57 (28.9%) | 0 (0.0%) |
| $1,000,000 or more | 0 (0.0%) | 60 (31.9%) |
| Total | 197 (100.0%) | 188 (100.0%) |
Household Income by Mortgage Status in Kernville
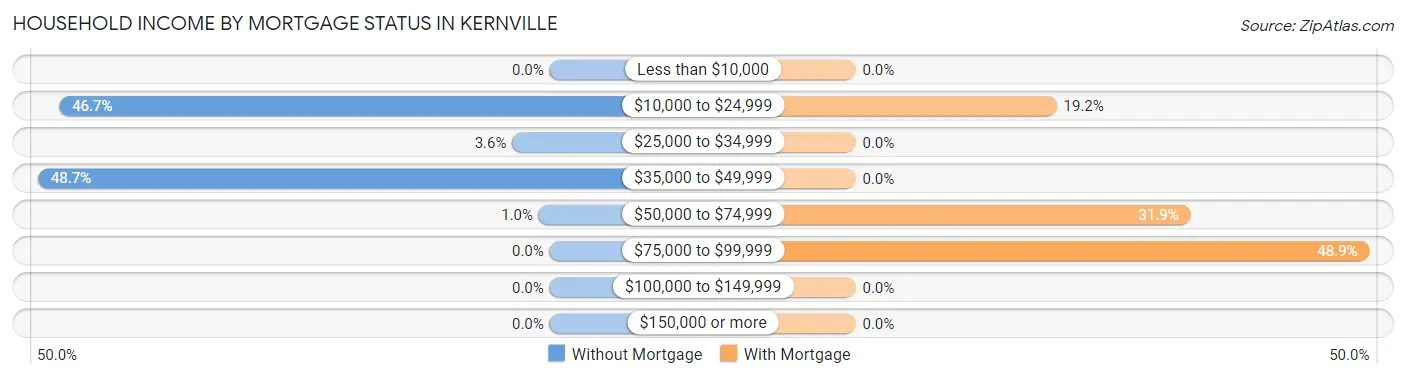
| Household Income | Without Mortgage | With Mortgage |
| Less than $10,000 | 0 (0.0%) | 0 (0.0%) |
| $10,000 to $24,999 | 92 (46.7%) | 36 (19.2%) |
| $25,000 to $34,999 | 7 (3.5%) | 0 (0.0%) |
| $35,000 to $49,999 | 96 (48.7%) | 0 (0.0%) |
| $50,000 to $74,999 | 2 (1.0%) | 60 (31.9%) |
| $75,000 to $99,999 | 0 (0.0%) | 92 (48.9%) |
| $100,000 to $149,999 | 0 (0.0%) | 0 (0.0%) |
| $150,000 or more | 0 (0.0%) | 0 (0.0%) |
| Total | 197 (100.0%) | 188 (100.0%) |
Property Value to Household Income Ratio in Kernville
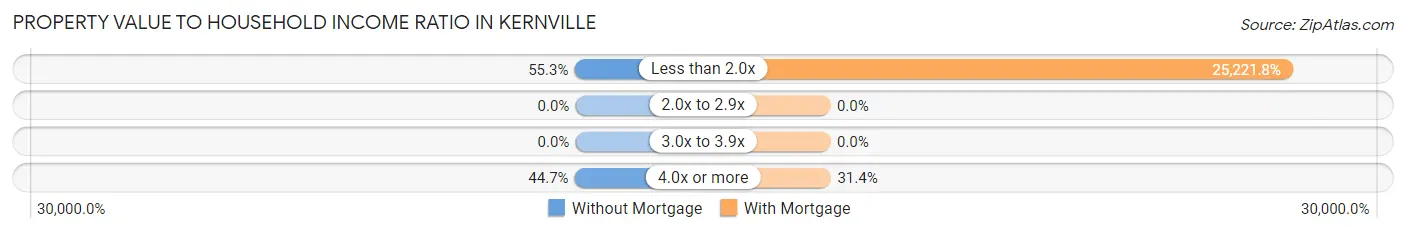
| Value-to-Income Ratio | Without Mortgage | With Mortgage |
| Less than 2.0x | 109 (55.3%) | 47,417 (25,221.8%) |
| 2.0x to 2.9x | 0 (0.0%) | 0 (0.0%) |
| 3.0x to 3.9x | 0 (0.0%) | 0 (0.0%) |
| 4.0x or more | 88 (44.7%) | 59 (31.4%) |
| Total | 197 (100.0%) | 188 (100.0%) |
Real Estate Taxes by Mortgage Status in Kernville
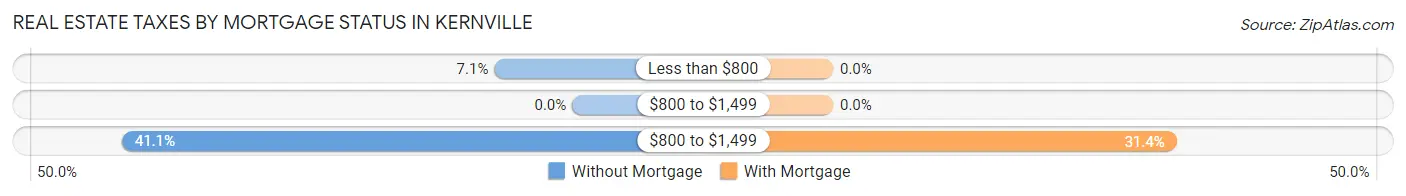
| Property Taxes | Without Mortgage | With Mortgage |
| Less than $800 | 14 (7.1%) | 0 (0.0%) |
| $800 to $1,499 | 0 (0.0%) | 0 (0.0%) |
| $800 to $1,499 | 81 (41.1%) | 59 (31.4%) |
| Total | 197 (100.0%) | 188 (100.0%) |
Health & Disability in Kernville
Health Insurance Coverage by Age in Kernville
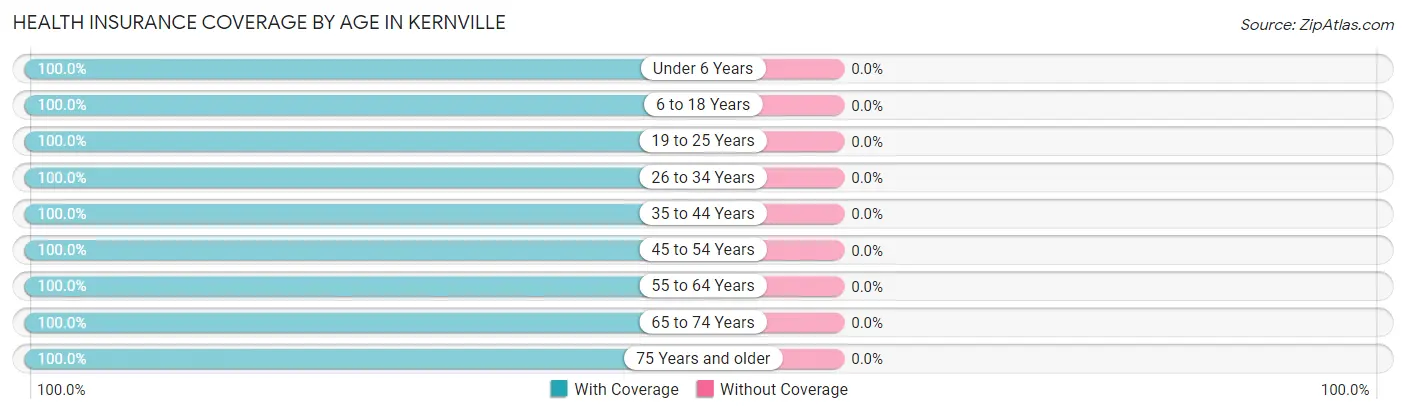
| Age Bracket | With Coverage | Without Coverage |
| Under 6 Years | 81 (100.0%) | 0 (0.0%) |
| 6 to 18 Years | 129 (100.0%) | 0 (0.0%) |
| 19 to 25 Years | 8 (100.0%) | 0 (0.0%) |
| 26 to 34 Years | 14 (100.0%) | 0 (0.0%) |
| 35 to 44 Years | 122 (100.0%) | 0 (0.0%) |
| 45 to 54 Years | 7 (100.0%) | 0 (0.0%) |
| 55 to 64 Years | 125 (100.0%) | 0 (0.0%) |
| 65 to 74 Years | 159 (100.0%) | 0 (0.0%) |
| 75 Years and older | 189 (100.0%) | 0 (0.0%) |
| Total | 834 (100.0%) | 0 (0.0%) |
Health Insurance Coverage by Citizenship Status in Kernville
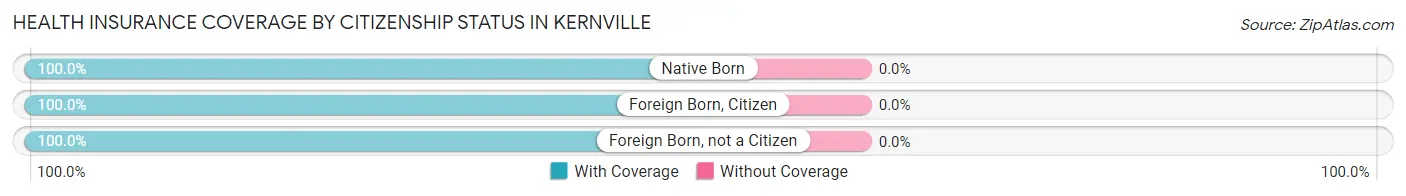
| Citizenship Status | With Coverage | Without Coverage |
| Native Born | 81 (100.0%) | 0 (0.0%) |
| Foreign Born, Citizen | 129 (100.0%) | 0 (0.0%) |
| Foreign Born, not a Citizen | 8 (100.0%) | 0 (0.0%) |
Health Insurance Coverage by Household Income in Kernville
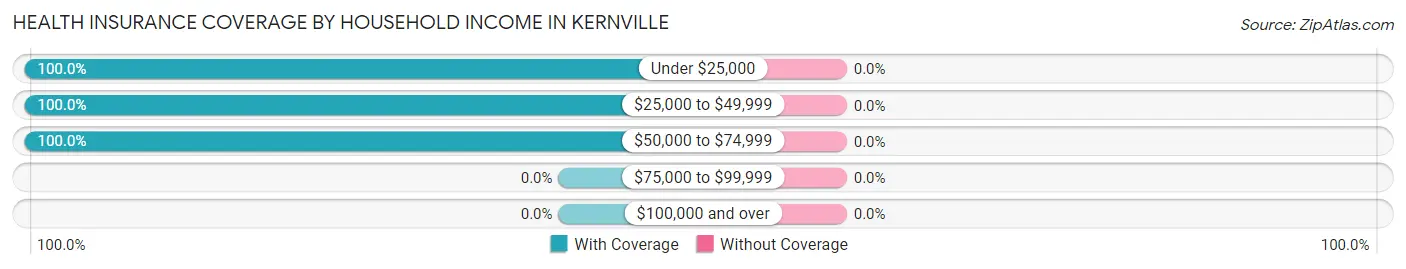
| Household Income | With Coverage | Without Coverage |
| Under $25,000 | 128 (100.0%) | 0 (0.0%) |
| $25,000 to $49,999 | 258 (100.0%) | 0 (0.0%) |
| $50,000 to $74,999 | 409 (100.0%) | 0 (0.0%) |
| $75,000 to $99,999 | 0 (0.0%) | 0 (0.0%) |
| $100,000 and over | 0 (0.0%) | 0 (0.0%) |
Public vs Private Health Insurance Coverage by Age in Kernville
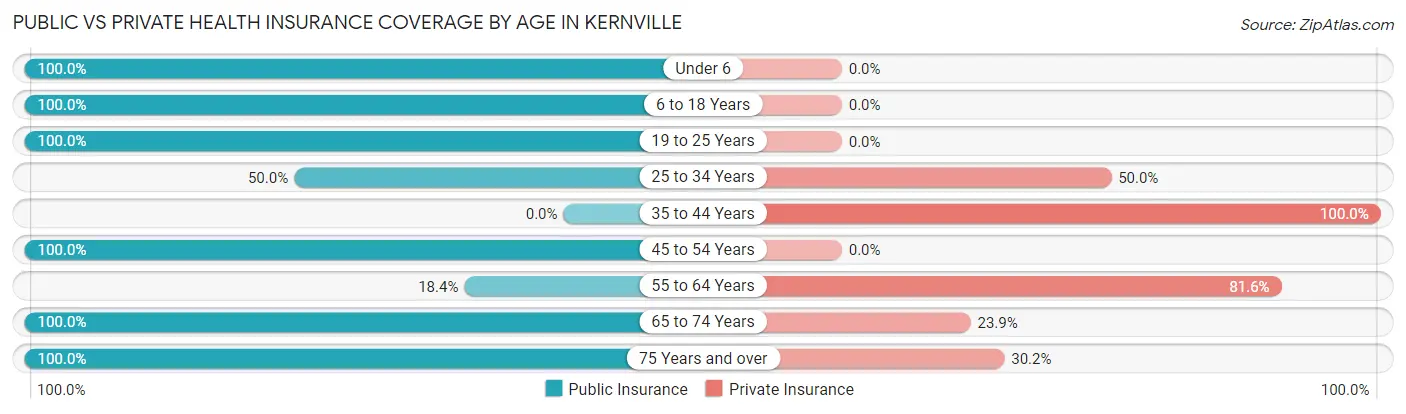
| Age Bracket | Public Insurance | Private Insurance |
| Under 6 | 81 (100.0%) | 0 (0.0%) |
| 6 to 18 Years | 129 (100.0%) | 0 (0.0%) |
| 19 to 25 Years | 8 (100.0%) | 0 (0.0%) |
| 25 to 34 Years | 7 (50.0%) | 7 (50.0%) |
| 35 to 44 Years | 0 (0.0%) | 122 (100.0%) |
| 45 to 54 Years | 7 (100.0%) | 0 (0.0%) |
| 55 to 64 Years | 23 (18.4%) | 102 (81.6%) |
| 65 to 74 Years | 159 (100.0%) | 38 (23.9%) |
| 75 Years and over | 189 (100.0%) | 57 (30.2%) |
| Total | 603 (72.3%) | 326 (39.1%) |
Disability Status by Sex by Age in Kernville
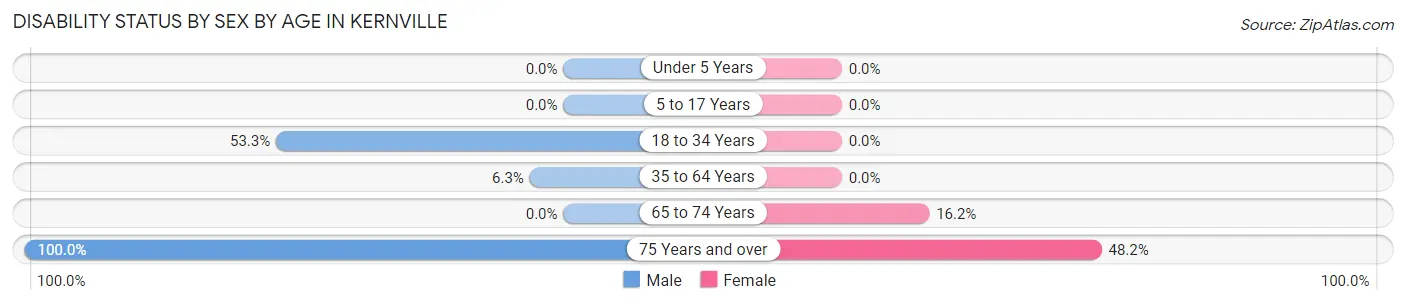
| Age Bracket | Male | Female |
| Under 5 Years | 0 (0.0%) | 0 (0.0%) |
| 5 to 17 Years | 0 (0.0%) | 0 (0.0%) |
| 18 to 34 Years | 8 (53.3%) | 0 (0.0%) |
| 35 to 64 Years | 7 (6.2%) | 0 (0.0%) |
| 65 to 74 Years | 0 (0.0%) | 12 (16.2%) |
| 75 Years and over | 21 (100.0%) | 81 (48.2%) |
Disability Class by Sex by Age in Kernville
Disability Class: Hearing Difficulty
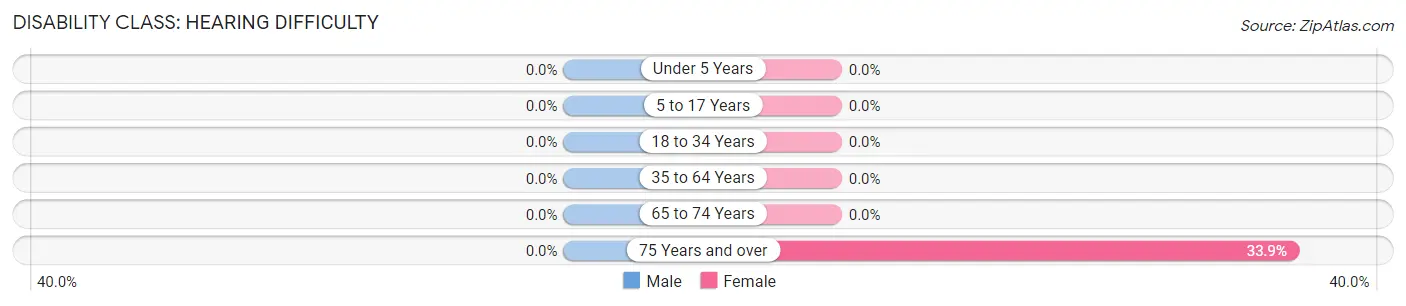
| Age Bracket | Male | Female |
| Under 5 Years | 0 (0.0%) | 0 (0.0%) |
| 5 to 17 Years | 0 (0.0%) | 0 (0.0%) |
| 18 to 34 Years | 0 (0.0%) | 0 (0.0%) |
| 35 to 64 Years | 0 (0.0%) | 0 (0.0%) |
| 65 to 74 Years | 0 (0.0%) | 0 (0.0%) |
| 75 Years and over | 0 (0.0%) | 57 (33.9%) |
Disability Class: Vision Difficulty
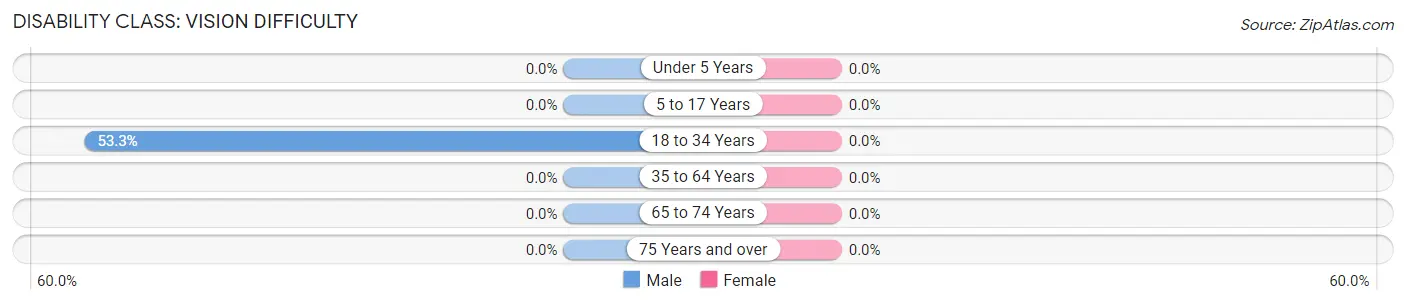
| Age Bracket | Male | Female |
| Under 5 Years | 0 (0.0%) | 0 (0.0%) |
| 5 to 17 Years | 0 (0.0%) | 0 (0.0%) |
| 18 to 34 Years | 8 (53.3%) | 0 (0.0%) |
| 35 to 64 Years | 0 (0.0%) | 0 (0.0%) |
| 65 to 74 Years | 0 (0.0%) | 0 (0.0%) |
| 75 Years and over | 0 (0.0%) | 0 (0.0%) |
Disability Class: Cognitive Difficulty
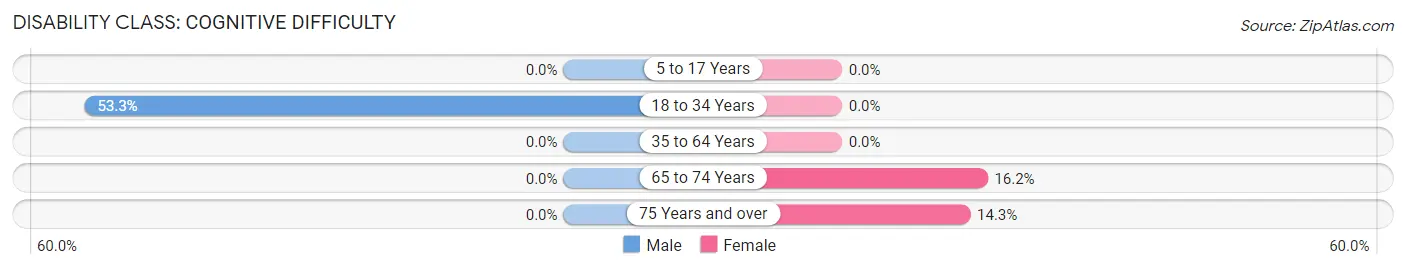
| Age Bracket | Male | Female |
| 5 to 17 Years | 0 (0.0%) | 0 (0.0%) |
| 18 to 34 Years | 8 (53.3%) | 0 (0.0%) |
| 35 to 64 Years | 0 (0.0%) | 0 (0.0%) |
| 65 to 74 Years | 0 (0.0%) | 12 (16.2%) |
| 75 Years and over | 0 (0.0%) | 24 (14.3%) |
Disability Class: Ambulatory Difficulty
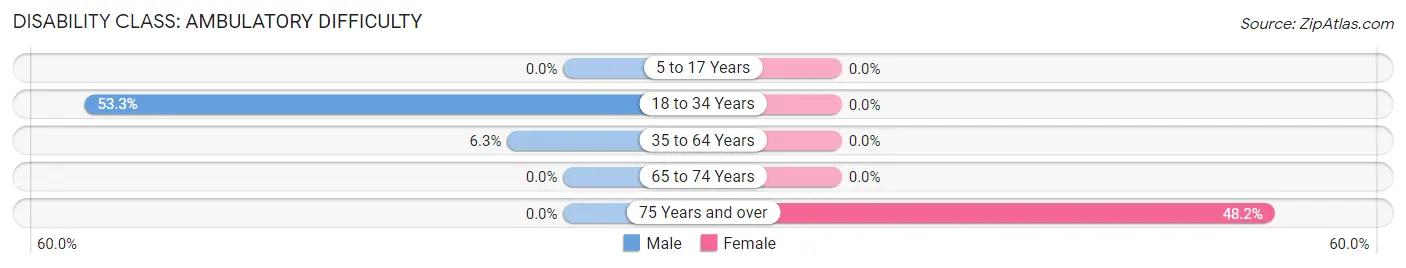
| Age Bracket | Male | Female |
| 5 to 17 Years | 0 (0.0%) | 0 (0.0%) |
| 18 to 34 Years | 8 (53.3%) | 0 (0.0%) |
| 35 to 64 Years | 7 (6.2%) | 0 (0.0%) |
| 65 to 74 Years | 0 (0.0%) | 0 (0.0%) |
| 75 Years and over | 0 (0.0%) | 81 (48.2%) |
Disability Class: Self-Care Difficulty
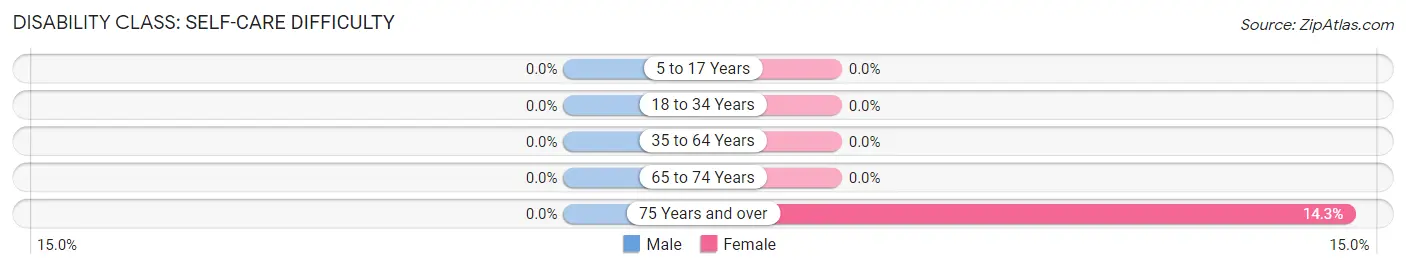
| Age Bracket | Male | Female |
| 5 to 17 Years | 0 (0.0%) | 0 (0.0%) |
| 18 to 34 Years | 0 (0.0%) | 0 (0.0%) |
| 35 to 64 Years | 0 (0.0%) | 0 (0.0%) |
| 65 to 74 Years | 0 (0.0%) | 0 (0.0%) |
| 75 Years and over | 0 (0.0%) | 24 (14.3%) |
Technology Access in Kernville
Computing Device Access in Kernville
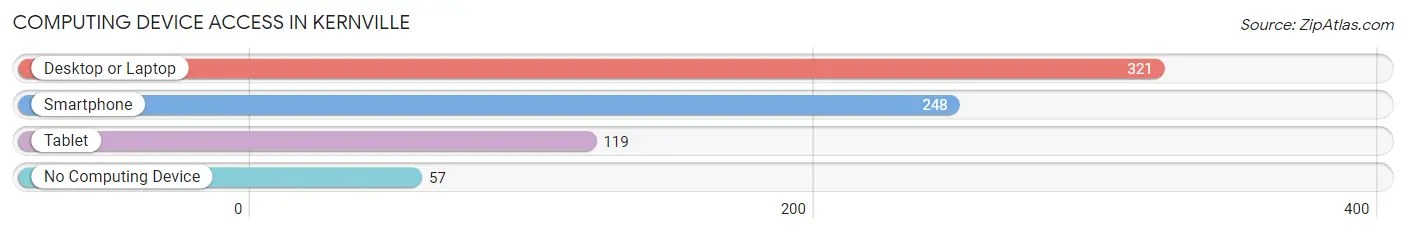
| Device Type | # Households | % Households |
| Desktop or Laptop | 321 | 83.4% |
| Smartphone | 248 | 64.4% |
| Tablet | 119 | 30.9% |
| No Computing Device | 57 | 14.8% |
| Total | 385 | 100.0% |
Internet Access in Kernville
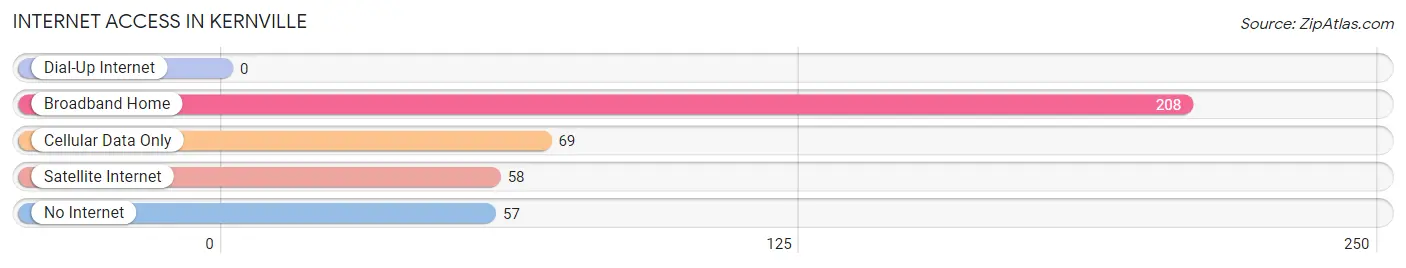
| Internet Type | # Households | % Households |
| Dial-Up Internet | 0 | 0.0% |
| Broadband Home | 208 | 54.0% |
| Cellular Data Only | 69 | 17.9% |
| Satellite Internet | 58 | 15.1% |
| No Internet | 57 | 14.8% |
| Total | 385 | 100.0% |
Kernville Summary
Kernville is a small town located in the southern Sierra Nevada Mountains of California, in the county of Kern. It is situated along the Kern River, approximately 40 miles east of Bakersfield. The town was founded in 1855 and is the oldest town in Kern County.
History
Kernville was founded in 1855 by Thomas Baker, a settler from Missouri. Baker named the town after his friend, Edward M. Kern, who was a surveyor for the U.S. Army Corps of Topographical Engineers. The town was originally a trading post and a stop for travelers on their way to the gold fields of California.
In the late 1800s, Kernville became a popular destination for tourists and vacationers. The town was known for its hot springs, which were believed to have healing properties. The Kern River was also a popular spot for fishing and swimming.
In the early 1900s, Kernville began to experience a decline in tourism due to the construction of the Southern Pacific Railroad, which bypassed the town. The town also suffered from a series of floods and fires, which caused further damage to the local economy.
In the 1950s, Kernville experienced a resurgence in popularity due to the construction of the Isabella Dam, which created Lake Isabella. The lake became a popular destination for fishing, boating, and other recreational activities.
Geography
Kernville is located in the southern Sierra Nevada Mountains of California, in the county of Kern. The town is situated along the Kern River, approximately 40 miles east of Bakersfield. The town is surrounded by the Sequoia National Forest and is located at an elevation of 2,000 feet.
The climate in Kernville is semi-arid, with hot summers and mild winters. The average annual temperature is 64°F, with an average high of 95°F in the summer and an average low of 33°F in the winter. The average annual precipitation is 8.5 inches.
Economy
Kernville’s economy is largely based on tourism and recreation. The town is home to several resorts, campgrounds, and other tourist attractions. The nearby Lake Isabella is a popular destination for fishing, boating, and other recreational activities.
The town is also home to several businesses, including restaurants, bars, and retail stores. The local economy is also supported by the nearby oil and gas industry.
Demographics
As of the 2010 census, Kernville had a population of 1,788. The racial makeup of the town was 87.3% White, 0.7% African American, 0.7% Native American, 0.7% Asian, 0.1% Pacific Islander, 8.2% from other races, and 2.2% from two or more races. Hispanic or Latino of any race were 16.2% of the population.
The median household income in Kernville was $37,917, and the median family income was $45,000. The per capita income for the town was $20,945. About 11.2% of families and 14.2% of the population were below the poverty line, including 18.2% of those under age 18 and 8.3% of those age 65 or over.
Common Questions
What is Per Capita Income in Kernville?
Per Capita income in Kernville is $19,375.
What is the Median Family Income in Kernville?
Median Family Income in Kernville is $46,833.
What is the Median Household income in Kernville?
Median Household Income in Kernville is $41,497.
What is Income or Wage Gap in Kernville?
Income or Wage Gap in Kernville is 82.4%.
Women in Kernville earn 17.6 cents for every dollar earned by a man.
What is Inequality or Gini Index in Kernville?
Inequality or Gini Index in Kernville is 0.29.
What is the Total Population of Kernville?
Total Population of Kernville is 836.
What is the Total Male Population of Kernville?
Total Male Population of Kernville is 377.
What is the Total Female Population of Kernville?
Total Female Population of Kernville is 459.
What is the Ratio of Males per 100 Females in Kernville?
There are 82.14 Males per 100 Females in Kernville.
What is the Ratio of Females per 100 Males in Kernville?
There are 121.75 Females per 100 Males in Kernville.
What is the Median Population Age in Kernville?
Median Population Age in Kernville is 59.8 Years.
What is the Average Family Size in Kernville
Average Family Size in Kernville is 3.5 People.
What is the Average Household Size in Kernville
Average Household Size in Kernville is 2.1 People.
How Large is the Labor Force in Kernville?
There are 312 People in the Labor Forcein in Kernville.
What is the Percentage of People in the Labor Force in Kernville?
49.9% of People are in the Labor Force in Kernville.
What is the Unemployment Rate in Kernville?
Unemployment Rate in Kernville is 18.6%.