Irwindale, CA Map & Demographics
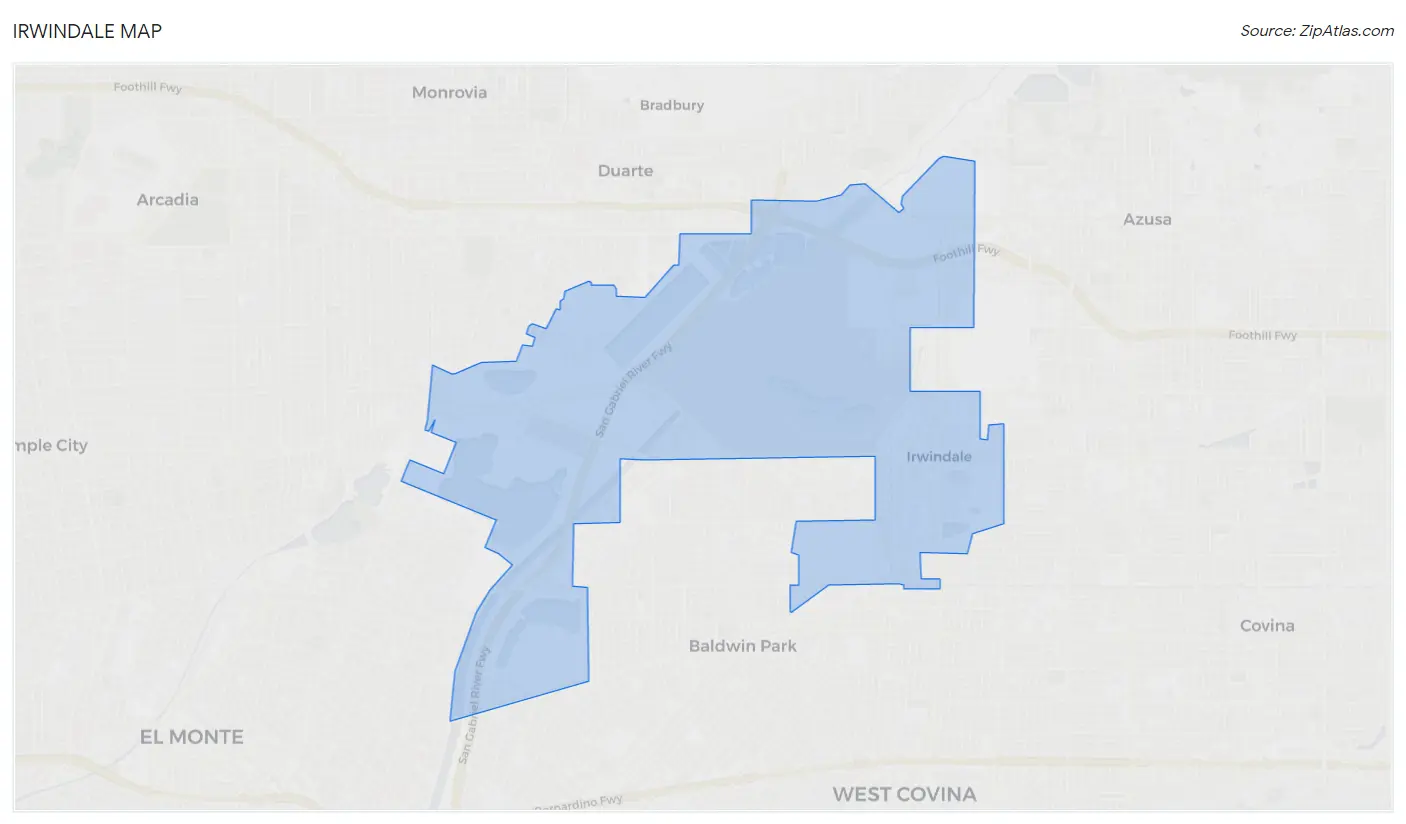
Irwindale Map
Irwindale Overview
$42,766
PER CAPITA INCOME
$115,750
AVG FAMILY INCOME
$101,181
AVG HOUSEHOLD INCOME
36.5%
WAGE / INCOME GAP [ % ]
63.5¢/ $1
WAGE / INCOME GAP [ $ ]
0.44
INEQUALITY / GINI INDEX
1,343
TOTAL POPULATION
669
MALE POPULATION
674
FEMALE POPULATION
99.26
MALES / 100 FEMALES
100.75
FEMALES / 100 MALES
34.0
MEDIAN AGE
3.7
AVG FAMILY SIZE
3.0
AVG HOUSEHOLD SIZE
728
LABOR FORCE [ PEOPLE ]
65.6%
PERCENT IN LABOR FORCE
4.5%
UNEMPLOYMENT RATE
Irwindale Area Codes
Income in Irwindale
Income Overview in Irwindale
Per Capita Income in Irwindale is $42,766, while median incomes of families and households are $115,750 and $101,181 respectively.
| Characteristic | Number | Measure |
| Per Capita Income | 1,343 | $42,766 |
| Median Family Income | 301 | $115,750 |
| Mean Family Income | 301 | $155,047 |
| Median Household Income | 443 | $101,181 |
| Mean Household Income | 443 | $130,621 |
| Income Deficit | 301 | $0 |
| Wage / Income Gap (%) | 1,343 | 36.52% |
| Wage / Income Gap ($) | 1,343 | 63.48¢ per $1 |
| Gini / Inequality Index | 1,343 | 0.44 |
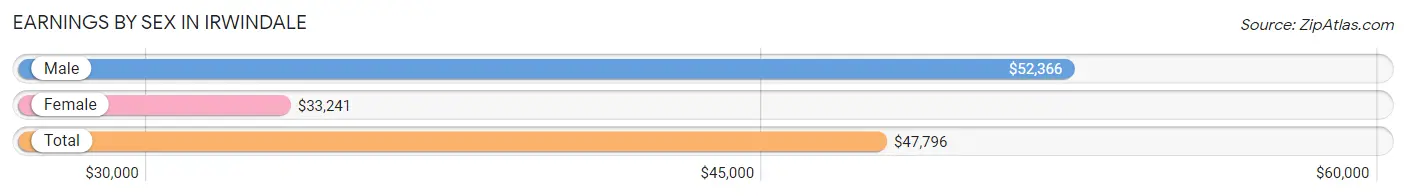
Earnings by Sex in Irwindale
Average Earnings in Irwindale are $47,796, $52,366 for men and $33,241 for women, a difference of 36.5%.
| Sex | Number | Average Earnings |
| Male | 405 (53.8%) | $52,366 |
| Female | 348 (46.2%) | $33,241 |
| Total | 753 (100.0%) | $47,796 |
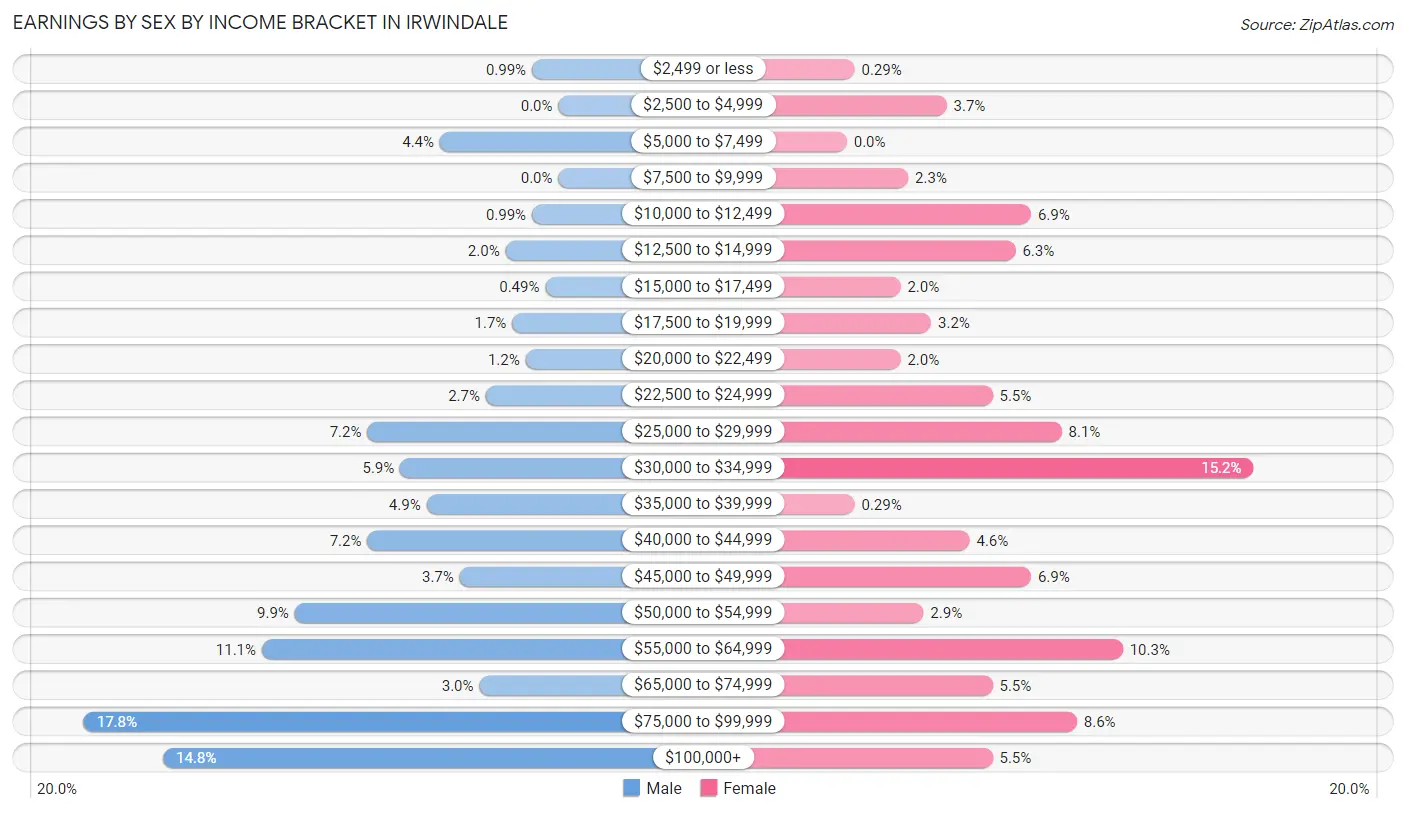
Earnings by Sex by Income Bracket in Irwindale
The most common earnings brackets in Irwindale are $75,000 to $99,999 for men (72 | 17.8%) and $30,000 to $34,999 for women (53 | 15.2%).
| Income | Male | Female |
| $2,499 or less | 4 (1.0%) | 1 (0.3%) |
| $2,500 to $4,999 | 0 (0.0%) | 13 (3.7%) |
| $5,000 to $7,499 | 18 (4.4%) | 0 (0.0%) |
| $7,500 to $9,999 | 0 (0.0%) | 8 (2.3%) |
| $10,000 to $12,499 | 4 (1.0%) | 24 (6.9%) |
| $12,500 to $14,999 | 8 (2.0%) | 22 (6.3%) |
| $15,000 to $17,499 | 2 (0.5%) | 7 (2.0%) |
| $17,500 to $19,999 | 7 (1.7%) | 11 (3.2%) |
| $20,000 to $22,499 | 5 (1.2%) | 7 (2.0%) |
| $22,500 to $24,999 | 11 (2.7%) | 19 (5.5%) |
| $25,000 to $29,999 | 29 (7.2%) | 28 (8.1%) |
| $30,000 to $34,999 | 24 (5.9%) | 53 (15.2%) |
| $35,000 to $39,999 | 20 (4.9%) | 1 (0.3%) |
| $40,000 to $44,999 | 29 (7.2%) | 16 (4.6%) |
| $45,000 to $49,999 | 15 (3.7%) | 24 (6.9%) |
| $50,000 to $54,999 | 40 (9.9%) | 10 (2.9%) |
| $55,000 to $64,999 | 45 (11.1%) | 36 (10.3%) |
| $65,000 to $74,999 | 12 (3.0%) | 19 (5.5%) |
| $75,000 to $99,999 | 72 (17.8%) | 30 (8.6%) |
| $100,000+ | 60 (14.8%) | 19 (5.5%) |
| Total | 405 (100.0%) | 348 (100.0%) |
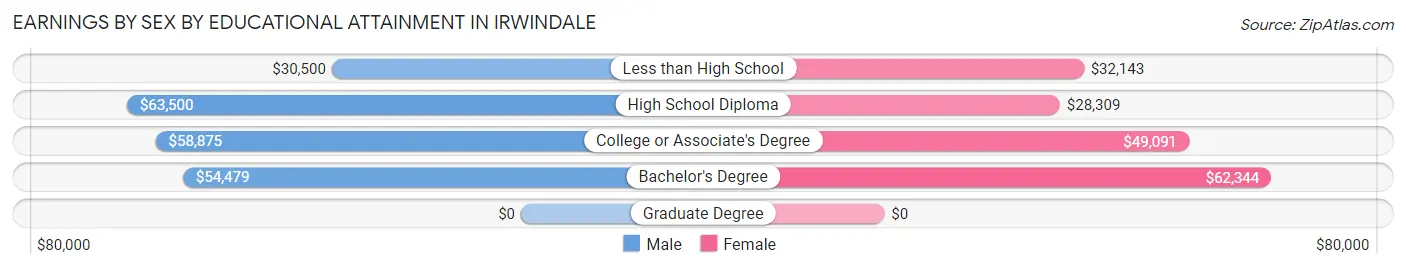
Earnings by Sex by Educational Attainment in Irwindale
Average earnings in Irwindale are $55,368 for men and $40,625 for women, a difference of 26.6%. Men with an educational attainment of high school diploma enjoy the highest average annual earnings of $63,500, while those with less than high school education earn the least with $30,500. Women with an educational attainment of bachelor's degree earn the most with the average annual earnings of $62,344, while those with high school diploma education have the smallest earnings of $28,309.
| Educational Attainment | Male Income | Female Income |
| Less than High School | $30,500 | $32,143 |
| High School Diploma | $63,500 | $28,309 |
| College or Associate's Degree | $58,875 | $49,091 |
| Bachelor's Degree | $54,479 | $62,344 |
| Graduate Degree | - | - |
| Total | $55,368 | $40,625 |
Family Income in Irwindale
Family Income Brackets in Irwindale
According to the Irwindale family income data, there are 93 families falling into the $100,000 to $149,999 income range, which is the most common income bracket and makes up 30.9% of all families.
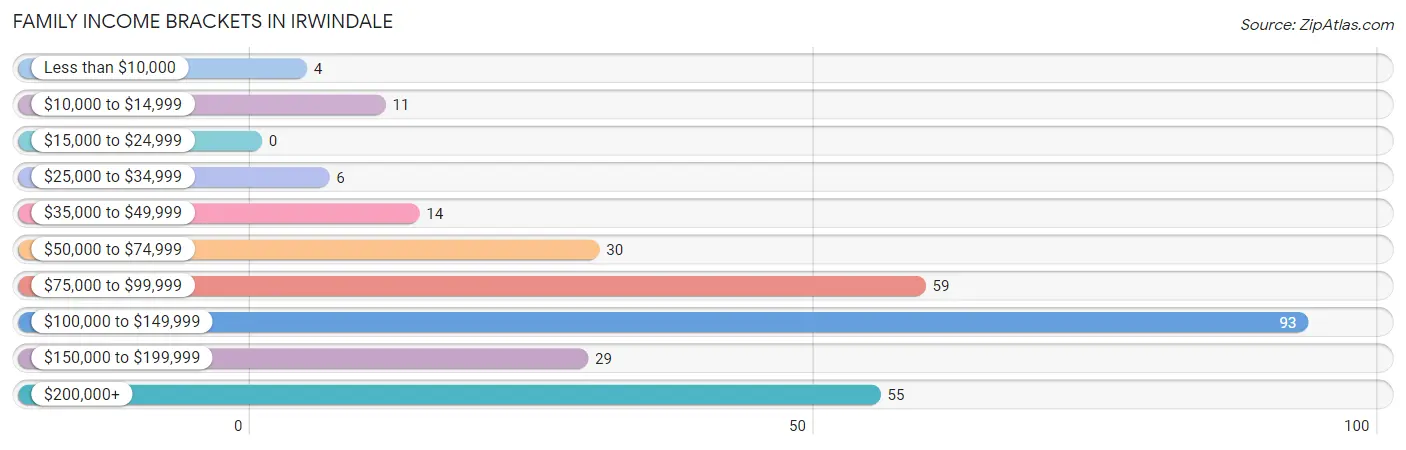
| Income Bracket | # Families | % Families |
| Less than $10,000 | 4 | 1.3% |
| $10,000 to $14,999 | 11 | 3.7% |
| $15,000 to $24,999 | 0 | 0.0% |
| $25,000 to $34,999 | 6 | 2.0% |
| $35,000 to $49,999 | 14 | 4.7% |
| $50,000 to $74,999 | 30 | 10.0% |
| $75,000 to $99,999 | 59 | 19.6% |
| $100,000 to $149,999 | 93 | 30.9% |
| $150,000 to $199,999 | 29 | 9.6% |
| $200,000+ | 55 | 18.3% |
Family Income by Famaliy Size in Irwindale
7+ person families (20 | 6.6%) account for the highest median family income in Irwindale with $168,750 per family, while 2-person families (78 | 25.9%) have the highest median income of $58,047 per family member.
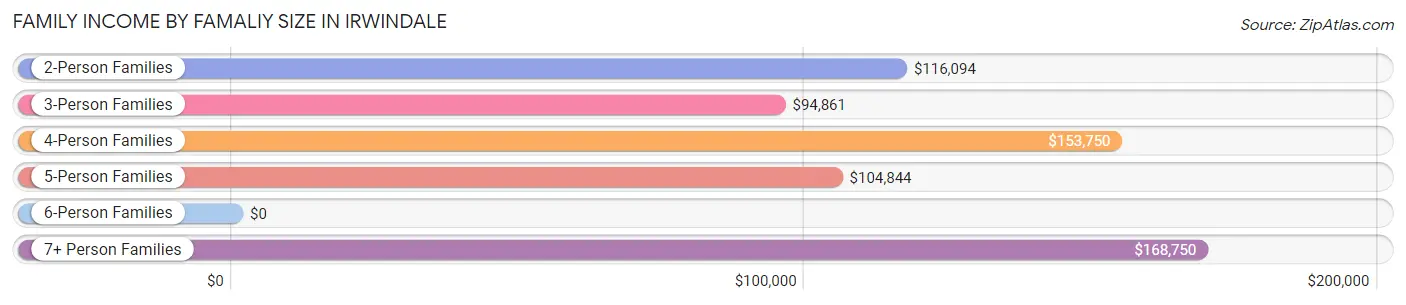
| Income Bracket | # Families | Median Income |
| 2-Person Families | 78 (25.9%) | $116,094 |
| 3-Person Families | 83 (27.6%) | $94,861 |
| 4-Person Families | 88 (29.2%) | $153,750 |
| 5-Person Families | 23 (7.6%) | $104,844 |
| 6-Person Families | 9 (3.0%) | $0 |
| 7+ Person Families | 20 (6.6%) | $168,750 |
| Total | 301 (100.0%) | $115,750 |
Family Income by Number of Earners in Irwindale
The median family income in Irwindale is $115,750, with families comprising 3+ earners (83) having the highest median family income of $200,208, while families with no earners (52) have the lowest median family income of $83,026, accounting for 27.6% and 17.3% of families, respectively.
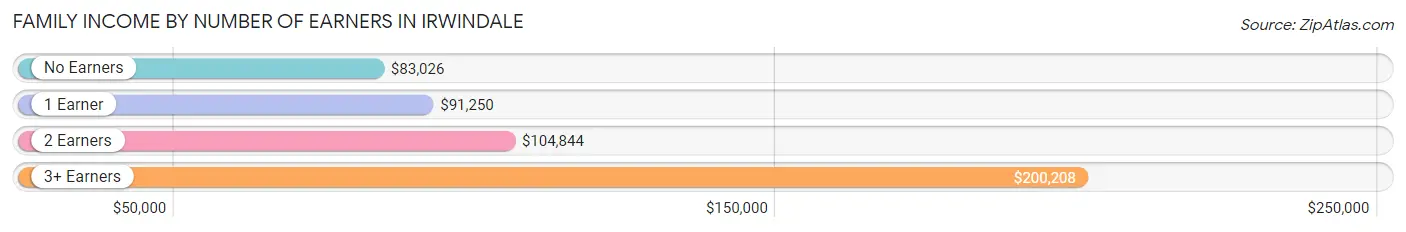
| Number of Earners | # Families | Median Income |
| No Earners | 52 (17.3%) | $83,026 |
| 1 Earner | 55 (18.3%) | $91,250 |
| 2 Earners | 111 (36.9%) | $104,844 |
| 3+ Earners | 83 (27.6%) | $200,208 |
| Total | 301 (100.0%) | $115,750 |
Household Income in Irwindale
Household Income Brackets in Irwindale
With 115 households falling in the category, the $100,000 to $149,999 income range is the most frequent in Irwindale, accounting for 26.0% of all households. In contrast, only 5 households (1.1%) fall into the $25,000 to $34,999 income bracket, making it the least populous group.
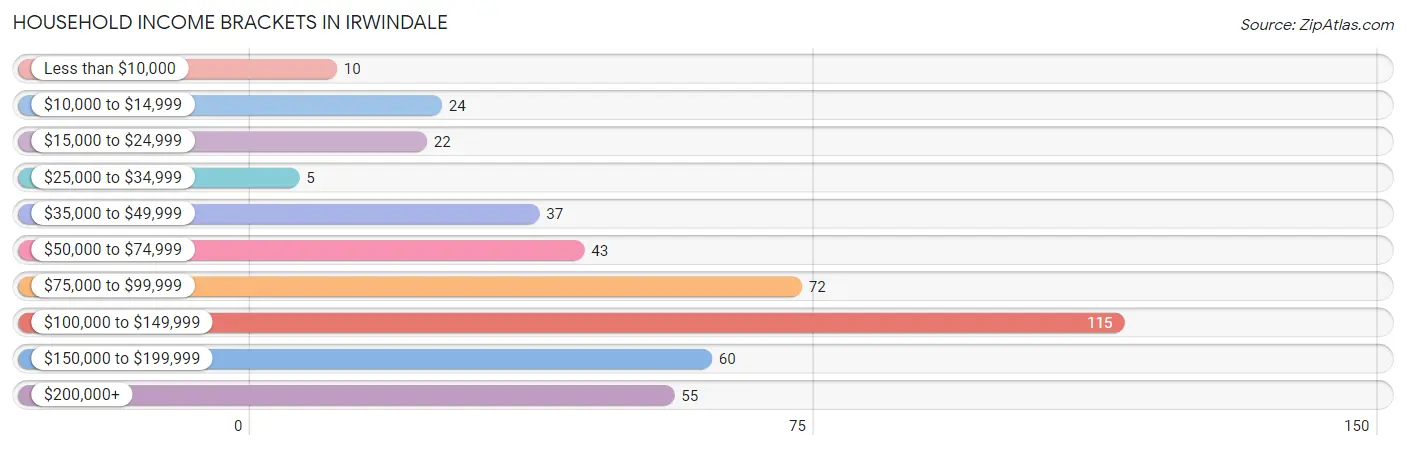
| Income Bracket | # Households | % Households |
| Less than $10,000 | 10 | 2.3% |
| $10,000 to $14,999 | 24 | 5.4% |
| $15,000 to $24,999 | 22 | 5.0% |
| $25,000 to $34,999 | 5 | 1.1% |
| $35,000 to $49,999 | 37 | 8.4% |
| $50,000 to $74,999 | 43 | 9.7% |
| $75,000 to $99,999 | 72 | 16.3% |
| $100,000 to $149,999 | 115 | 26.0% |
| $150,000 to $199,999 | 60 | 13.5% |
| $200,000+ | 55 | 12.4% |
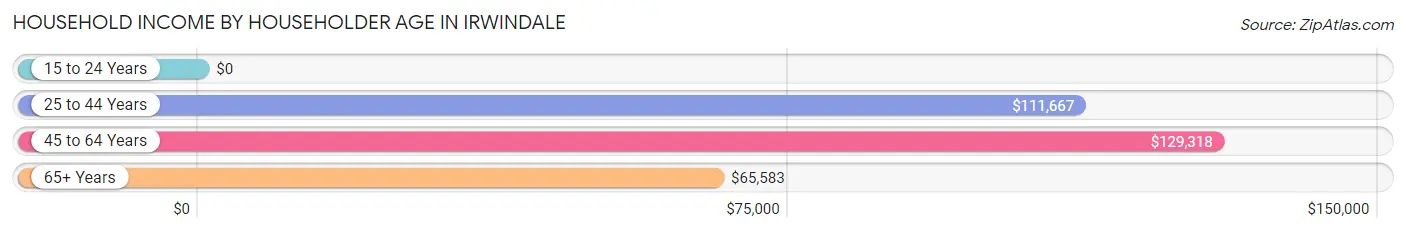
Household Income by Householder Age in Irwindale
The median household income in Irwindale is $101,181, with the highest median household income of $129,318 found in the 45 to 64 years age bracket for the primary householder. A total of 124 households (28.0%) fall into this category.
| Income Bracket | # Households | Median Income |
| 15 to 24 Years | 0 (0.0%) | $0 |
| 25 to 44 Years | 144 (32.5%) | $111,667 |
| 45 to 64 Years | 124 (28.0%) | $129,318 |
| 65+ Years | 175 (39.5%) | $65,583 |
| Total | 443 (100.0%) | $101,181 |
Poverty in Irwindale
Income Below Poverty by Sex and Age in Irwindale
With 7.1% poverty level for males and 6.3% for females among the residents of Irwindale, 45 to 54 year old males and 75 year old and over females are the most vulnerable to poverty, with 17 males (20.5%) and 19 females (19.0%) in their respective age groups living below the poverty level.
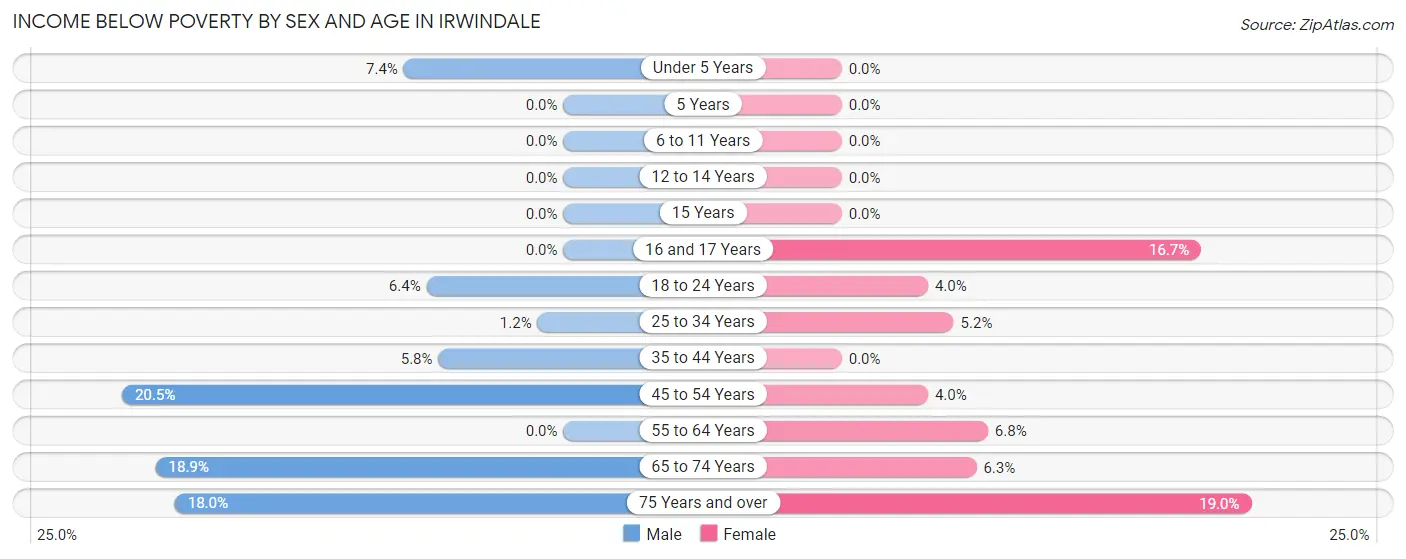
| Age Bracket | Male | Female |
| Under 5 Years | 2 (7.4%) | 0 (0.0%) |
| 5 Years | 0 (0.0%) | 0 (0.0%) |
| 6 to 11 Years | 0 (0.0%) | 0 (0.0%) |
| 12 to 14 Years | 0 (0.0%) | 0 (0.0%) |
| 15 Years | 0 (0.0%) | 0 (0.0%) |
| 16 and 17 Years | 0 (0.0%) | 3 (16.7%) |
| 18 to 24 Years | 4 (6.4%) | 3 (4.0%) |
| 25 to 34 Years | 2 (1.2%) | 7 (5.2%) |
| 35 to 44 Years | 4 (5.8%) | 0 (0.0%) |
| 45 to 54 Years | 17 (20.5%) | 3 (4.0%) |
| 55 to 64 Years | 0 (0.0%) | 4 (6.8%) |
| 65 to 74 Years | 7 (18.9%) | 3 (6.2%) |
| 75 Years and over | 11 (18.0%) | 19 (19.0%) |
| Total | 47 (7.1%) | 42 (6.3%) |
Income Above Poverty by Sex and Age in Irwindale
According to the poverty statistics in Irwindale, males aged 5 years and females aged under 5 years are the age groups that are most secure financially, with 100.0% of males and 100.0% of females in these age groups living above the poverty line.
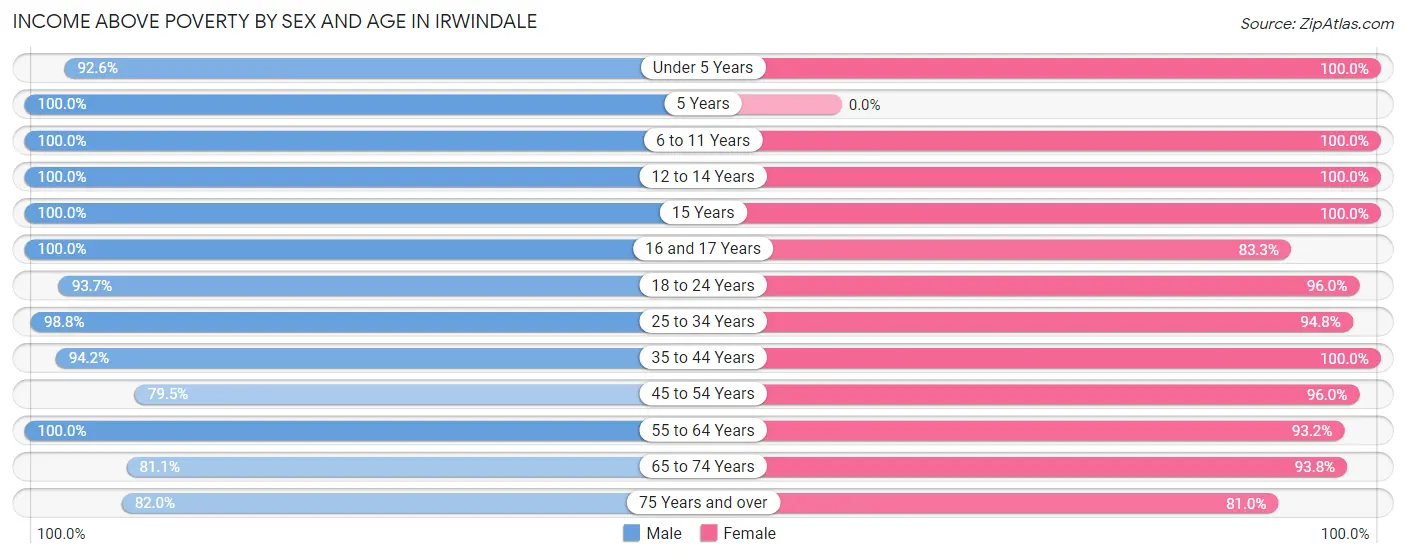
| Age Bracket | Male | Female |
| Under 5 Years | 25 (92.6%) | 44 (100.0%) |
| 5 Years | 11 (100.0%) | 0 (0.0%) |
| 6 to 11 Years | 42 (100.0%) | 35 (100.0%) |
| 12 to 14 Years | 34 (100.0%) | 9 (100.0%) |
| 15 Years | 5 (100.0%) | 16 (100.0%) |
| 16 and 17 Years | 20 (100.0%) | 15 (83.3%) |
| 18 to 24 Years | 59 (93.6%) | 72 (96.0%) |
| 25 to 34 Years | 164 (98.8%) | 128 (94.8%) |
| 35 to 44 Years | 65 (94.2%) | 56 (100.0%) |
| 45 to 54 Years | 66 (79.5%) | 72 (96.0%) |
| 55 to 64 Years | 44 (100.0%) | 55 (93.2%) |
| 65 to 74 Years | 30 (81.1%) | 45 (93.8%) |
| 75 Years and over | 50 (82.0%) | 81 (81.0%) |
| Total | 615 (92.9%) | 628 (93.7%) |
Income Below Poverty Among Married-Couple Families in Irwindale
The poverty statistics for married-couple families in Irwindale show that 8.1% or 14 of the total 174 families live below the poverty line. Families with no children have the highest poverty rate of 16.7%, comprising of 14 families. On the other hand, families with 1 or 2 children have the lowest poverty rate of 0.0%, which includes 0 families.
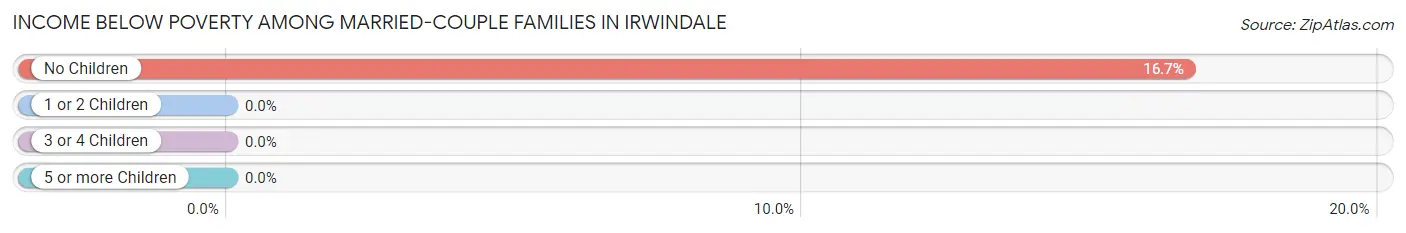
| Children | Above Poverty | Below Poverty |
| No Children | 70 (83.3%) | 14 (16.7%) |
| 1 or 2 Children | 82 (100.0%) | 0 (0.0%) |
| 3 or 4 Children | 6 (100.0%) | 0 (0.0%) |
| 5 or more Children | 2 (100.0%) | 0 (0.0%) |
| Total | 160 (91.9%) | 14 (8.1%) |
Income Below Poverty Among Single-Parent Households in Irwindale
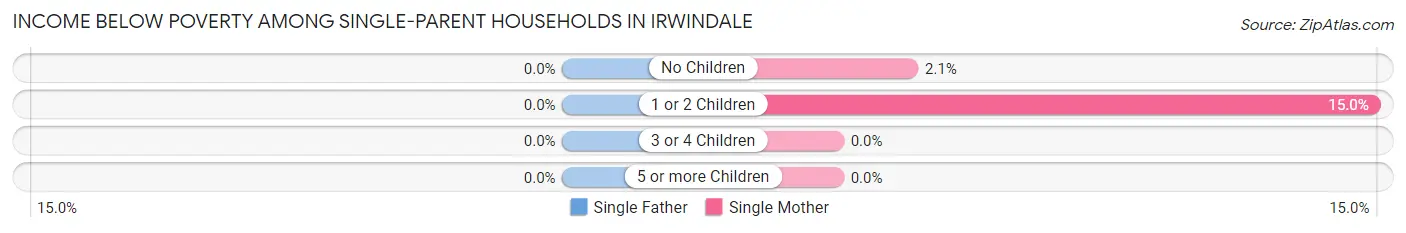
| Children | Single Father | Single Mother |
| No Children | 0 (0.0%) | 1 (2.1%) |
| 1 or 2 Children | 0 (0.0%) | 3 (15.0%) |
| 3 or 4 Children | 0 (0.0%) | 0 (0.0%) |
| 5 or more Children | 0 (0.0%) | 0 (0.0%) |
| Total | 0 (0.0%) | 4 (5.6%) |
Income Below Poverty Among Married-Couple vs Single-Parent Households in Irwindale
The poverty data for Irwindale shows that 14 of the married-couple family households (8.1%) and 4 of the single-parent households (3.2%) are living below the poverty level. Within the married-couple family households, those with no children have the highest poverty rate, with 14 households (16.7%) falling below the poverty line. Among the single-parent households, those with 1 or 2 children have the highest poverty rate, with 3 household (6.5%) living below poverty.
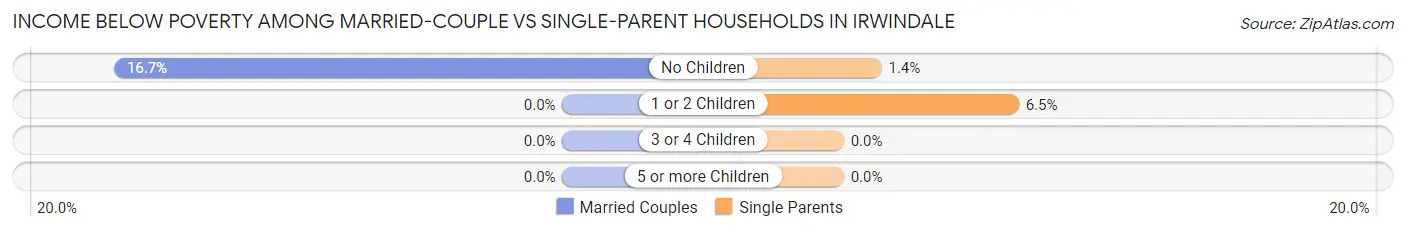
| Children | Married-Couple Families | Single-Parent Households |
| No Children | 14 (16.7%) | 1 (1.4%) |
| 1 or 2 Children | 0 (0.0%) | 3 (6.5%) |
| 3 or 4 Children | 0 (0.0%) | 0 (0.0%) |
| 5 or more Children | 0 (0.0%) | 0 (0.0%) |
| Total | 14 (8.1%) | 4 (3.2%) |
Race in Irwindale
The most populous races in Irwindale are Hispanic or Latino (1,229 | 91.5%), White / Caucasian (552 | 41.1%), and Some other Race (451 | 33.6%).
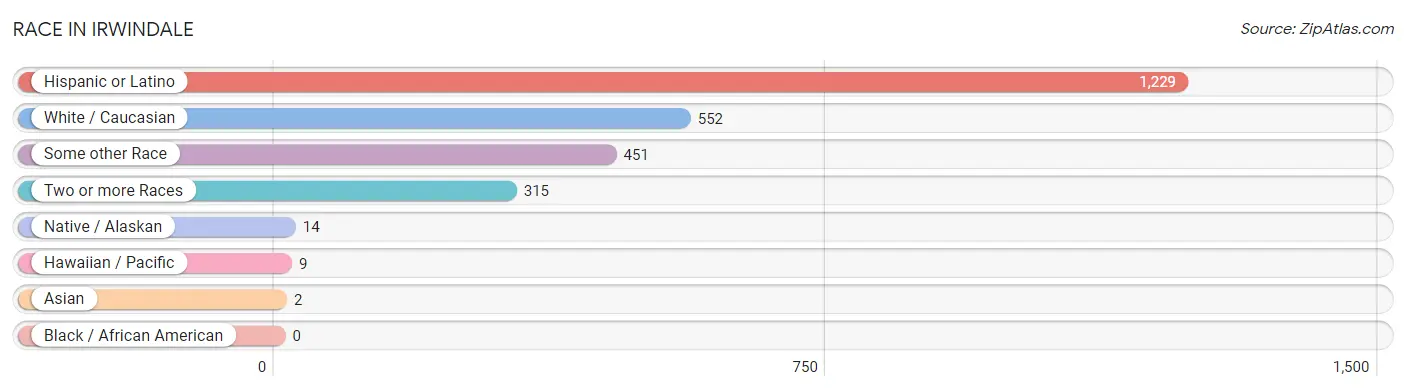
| Race | # Population | % Population |
| Asian | 2 | 0.2% |
| Black / African American | 0 | 0.0% |
| Hawaiian / Pacific | 9 | 0.7% |
| Hispanic or Latino | 1,229 | 91.5% |
| Native / Alaskan | 14 | 1.0% |
| White / Caucasian | 552 | 41.1% |
| Two or more Races | 315 | 23.4% |
| Some other Race | 451 | 33.6% |
| Total | 1,343 | 100.0% |
Ancestry in Irwindale
The most populous ancestries reported in Irwindale are Mexican (1,053 | 78.4%), Central American (107 | 8.0%), Irish (61 | 4.5%), Salvadoran (53 | 4.0%), and Italian (42 | 3.1%), together accounting for 98.0% of all Irwindale residents.
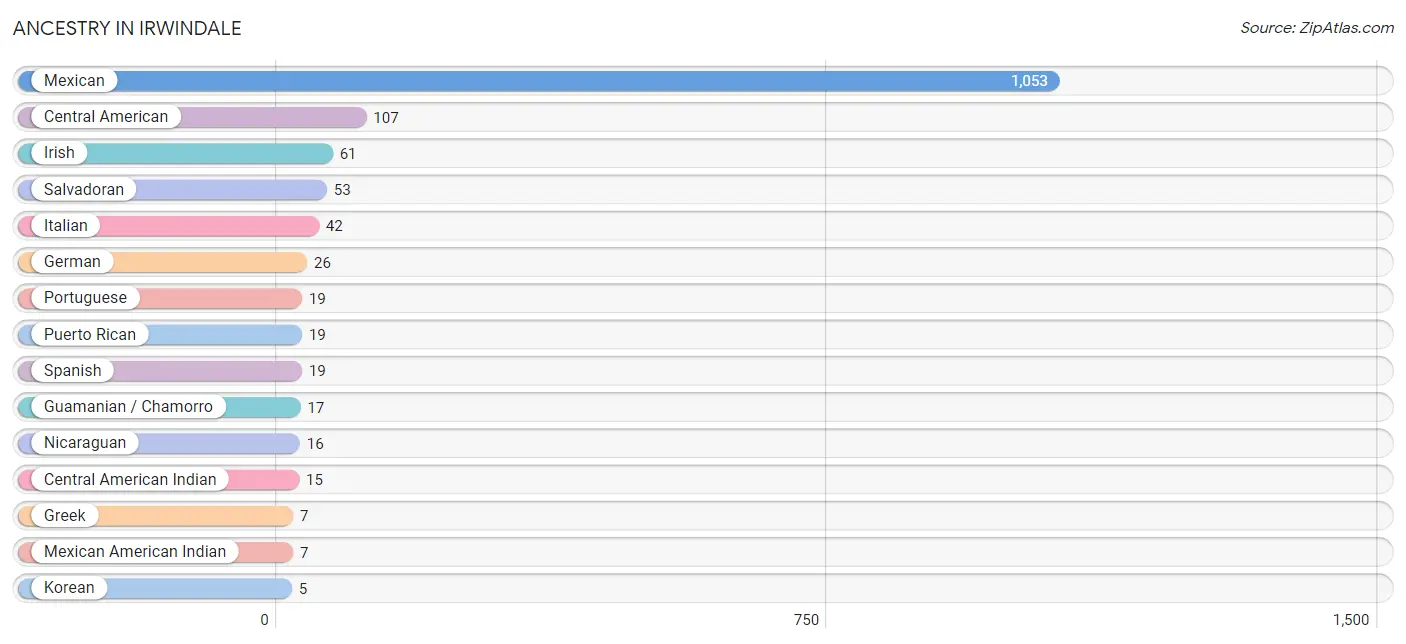
| Ancestry | # Population | % Population |
| American | 3 | 0.2% |
| Central American | 107 | 8.0% |
| Central American Indian | 15 | 1.1% |
| Costa Rican | 1 | 0.1% |
| European | 3 | 0.2% |
| German | 26 | 1.9% |
| Greek | 7 | 0.5% |
| Guamanian / Chamorro | 17 | 1.3% |
| Indian (Asian) | 3 | 0.2% |
| Irish | 61 | 4.5% |
| Italian | 42 | 3.1% |
| Korean | 5 | 0.4% |
| Mexican | 1,053 | 78.4% |
| Mexican American Indian | 7 | 0.5% |
| Nicaraguan | 16 | 1.2% |
| Norwegian | 2 | 0.2% |
| Portuguese | 19 | 1.4% |
| Puerto Rican | 19 | 1.4% |
| Salvadoran | 53 | 4.0% |
| Spanish | 19 | 1.4% | View All 20 Rows |
Immigrants in Irwindale
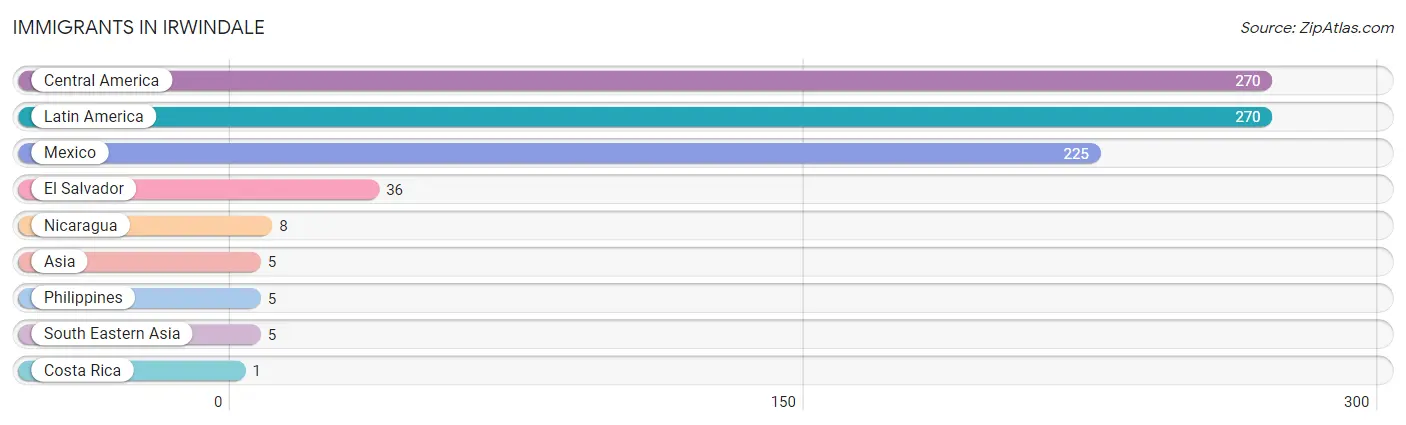
The most numerous immigrant groups reported in Irwindale came from Central America (270 | 20.1%), Latin America (270 | 20.1%), Mexico (225 | 16.8%), El Salvador (36 | 2.7%), and Nicaragua (8 | 0.6%), together accounting for 60.2% of all Irwindale residents.
| Immigration Origin | # Population | % Population |
| Asia | 5 | 0.4% |
| Central America | 270 | 20.1% |
| Costa Rica | 1 | 0.1% |
| El Salvador | 36 | 2.7% |
| Latin America | 270 | 20.1% |
| Mexico | 225 | 16.8% |
| Nicaragua | 8 | 0.6% |
| Philippines | 5 | 0.4% |
| South Eastern Asia | 5 | 0.4% | View All 9 Rows |
Sex and Age in Irwindale
Sex and Age in Irwindale
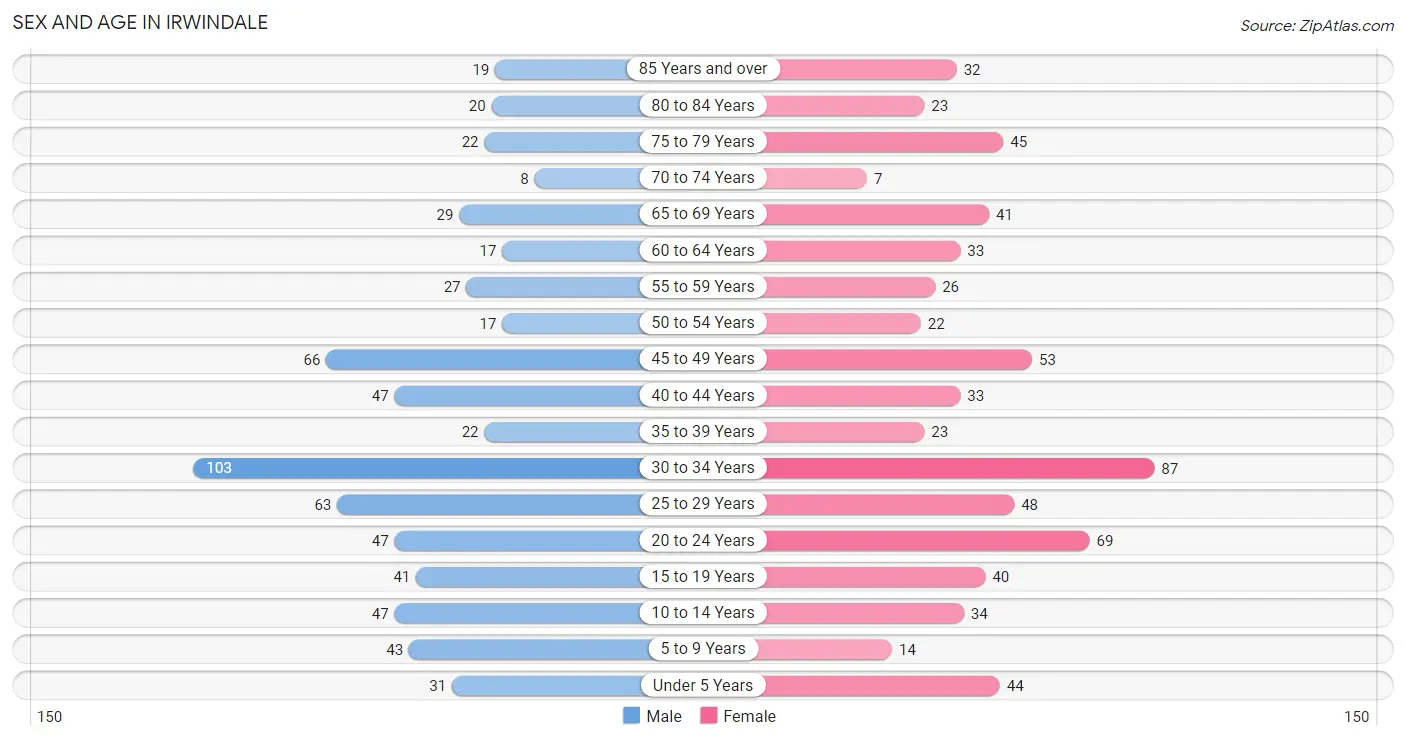
The most populous age groups in Irwindale are 30 to 34 Years (103 | 15.4%) for men and 30 to 34 Years (87 | 12.9%) for women.
| Age Bracket | Male | Female |
| Under 5 Years | 31 (4.6%) | 44 (6.5%) |
| 5 to 9 Years | 43 (6.4%) | 14 (2.1%) |
| 10 to 14 Years | 47 (7.0%) | 34 (5.0%) |
| 15 to 19 Years | 41 (6.1%) | 40 (5.9%) |
| 20 to 24 Years | 47 (7.0%) | 69 (10.2%) |
| 25 to 29 Years | 63 (9.4%) | 48 (7.1%) |
| 30 to 34 Years | 103 (15.4%) | 87 (12.9%) |
| 35 to 39 Years | 22 (3.3%) | 23 (3.4%) |
| 40 to 44 Years | 47 (7.0%) | 33 (4.9%) |
| 45 to 49 Years | 66 (9.9%) | 53 (7.9%) |
| 50 to 54 Years | 17 (2.5%) | 22 (3.3%) |
| 55 to 59 Years | 27 (4.0%) | 26 (3.9%) |
| 60 to 64 Years | 17 (2.5%) | 33 (4.9%) |
| 65 to 69 Years | 29 (4.3%) | 41 (6.1%) |
| 70 to 74 Years | 8 (1.2%) | 7 (1.0%) |
| 75 to 79 Years | 22 (3.3%) | 45 (6.7%) |
| 80 to 84 Years | 20 (3.0%) | 23 (3.4%) |
| 85 Years and over | 19 (2.8%) | 32 (4.8%) |
| Total | 669 (100.0%) | 674 (100.0%) |
Families and Households in Irwindale
Median Family Size in Irwindale
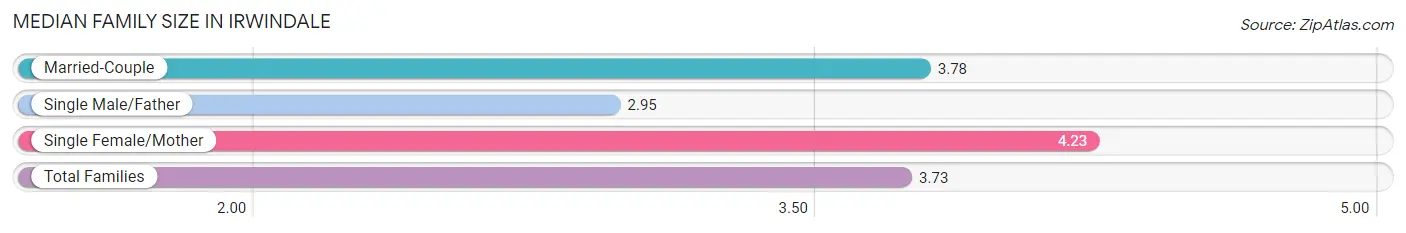
The median family size in Irwindale is 3.73 persons per family, with single female/mother families (71 | 23.6%) accounting for the largest median family size of 4.23 persons per family. On the other hand, single male/father families (56 | 18.6%) represent the smallest median family size with 2.95 persons per family.
| Family Type | # Families | Family Size |
| Married-Couple | 174 (57.8%) | 3.78 |
| Single Male/Father | 56 (18.6%) | 2.95 |
| Single Female/Mother | 71 (23.6%) | 4.23 |
| Total Families | 301 (100.0%) | 3.73 |
Median Household Size in Irwindale
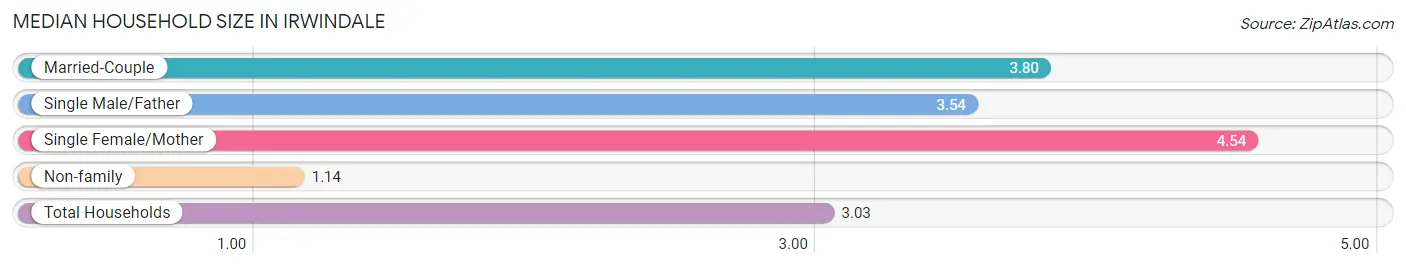
The median household size in Irwindale is 3.03 persons per household, with single female/mother households (71 | 16.0%) accounting for the largest median household size of 4.54 persons per household. non-family households (142 | 32.1%) represent the smallest median household size with 1.14 persons per household.
| Household Type | # Households | Household Size |
| Married-Couple | 174 (39.3%) | 3.80 |
| Single Male/Father | 56 (12.6%) | 3.54 |
| Single Female/Mother | 71 (16.0%) | 4.54 |
| Non-family | 142 (32.1%) | 1.14 |
| Total Households | 443 (100.0%) | 3.03 |
Household Size by Marriage Status in Irwindale
Out of a total of 443 households in Irwindale, 301 (67.9%) are family households, while 142 (32.1%) are nonfamily households. The most numerous type of family households are 4-person households, comprising 83, and the most common type of nonfamily households are 1-person households, comprising 132.
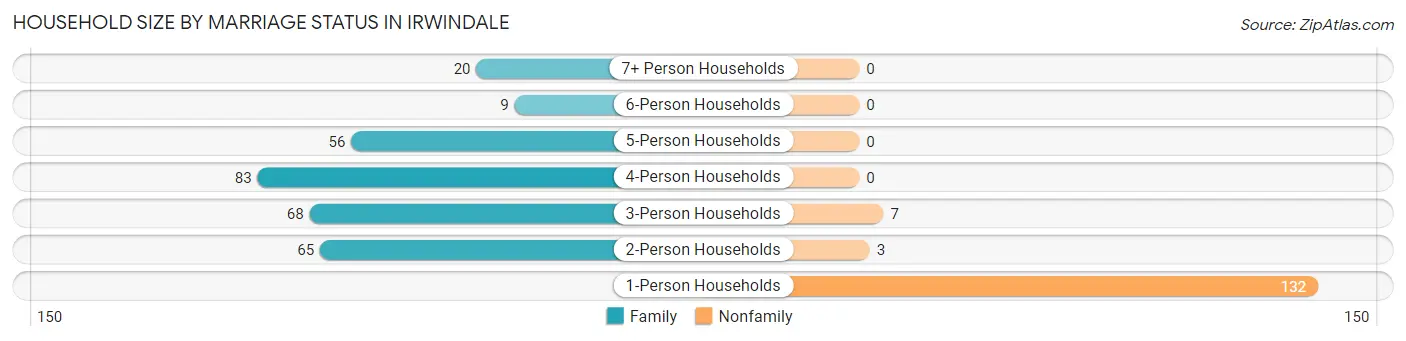
| Household Size | Family Households | Nonfamily Households |
| 1-Person Households | - | 132 (29.8%) |
| 2-Person Households | 65 (14.7%) | 3 (0.7%) |
| 3-Person Households | 68 (15.3%) | 7 (1.6%) |
| 4-Person Households | 83 (18.7%) | 0 (0.0%) |
| 5-Person Households | 56 (12.6%) | 0 (0.0%) |
| 6-Person Households | 9 (2.0%) | 0 (0.0%) |
| 7+ Person Households | 20 (4.5%) | 0 (0.0%) |
| Total | 301 (67.9%) | 142 (32.1%) |
Female Fertility in Irwindale
Fertility by Age in Irwindale
Average fertility rate in Irwindale is 8.0 births per 1,000 women. Women in the age bracket of 35 to 50 years have the highest fertility rate with 27.0 births per 1,000 women. Women in the age bracket of 35 to 50 years acount for 100.0% of all women with births.
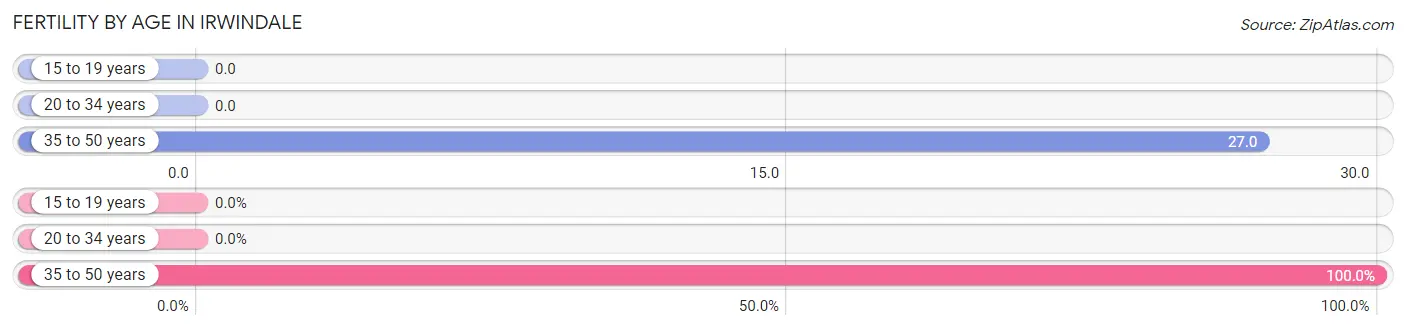
| Age Bracket | Women with Births | Births / 1,000 Women |
| 15 to 19 years | 0 (0.0%) | 0.0 |
| 20 to 34 years | 0 (0.0%) | 0.0 |
| 35 to 50 years | 3 (100.0%) | 27.0 |
| Total | 3 (100.0%) | 8.0 |
Fertility by Age by Marriage Status in Irwindale
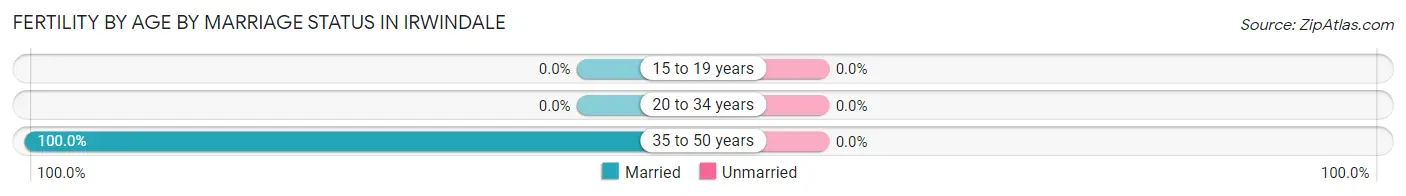
| Age Bracket | Married | Unmarried |
| 15 to 19 years | 0 (0.0%) | 0 (0.0%) |
| 20 to 34 years | 0 (0.0%) | 0 (0.0%) |
| 35 to 50 years | 3 (100.0%) | 0 (0.0%) |
| Total | 3 (100.0%) | 0 (0.0%) |
Fertility by Education in Irwindale
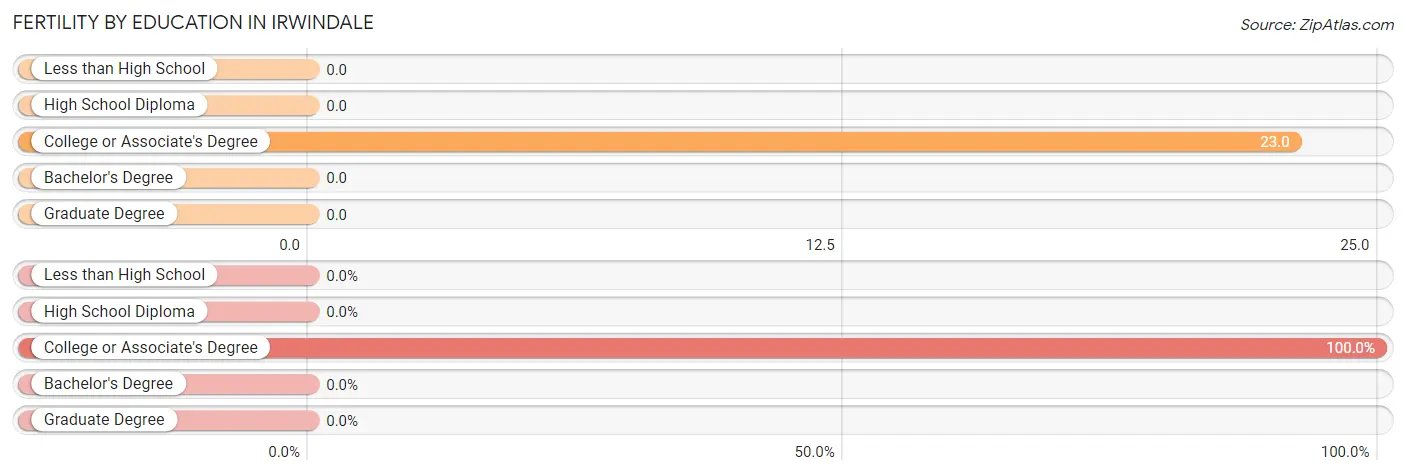
| Educational Attainment | Women with Births | Births / 1,000 Women |
| Less than High School | 0 (0.0%) | 0.0 |
| High School Diploma | 0 (0.0%) | 0.0 |
| College or Associate's Degree | 3 (100.0%) | 23.0 |
| Bachelor's Degree | 0 (0.0%) | 0.0 |
| Graduate Degree | 0 (0.0%) | 0.0 |
| Total | 3 (100.0%) | 8.0 |
Fertility by Education by Marriage Status in Irwindale
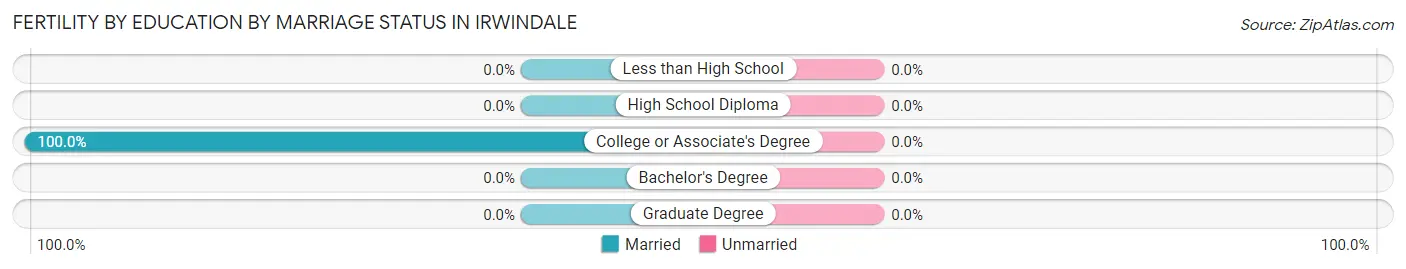
| Educational Attainment | Married | Unmarried |
| Less than High School | 0 (0.0%) | 0 (0.0%) |
| High School Diploma | 0 (0.0%) | 0 (0.0%) |
| College or Associate's Degree | 3 (100.0%) | 0 (0.0%) |
| Bachelor's Degree | 0 (0.0%) | 0 (0.0%) |
| Graduate Degree | 0 (0.0%) | 0 (0.0%) |
| Total | 3 (100.0%) | 0 (0.0%) |
Employment Characteristics in Irwindale
Employment by Class of Employer in Irwindale
Among the 684 employed individuals in Irwindale, private company employees (483 | 70.6%), local government employees (79 | 11.6%), and not-for-profit organizations (59 | 8.6%) make up the most common classes of employment.
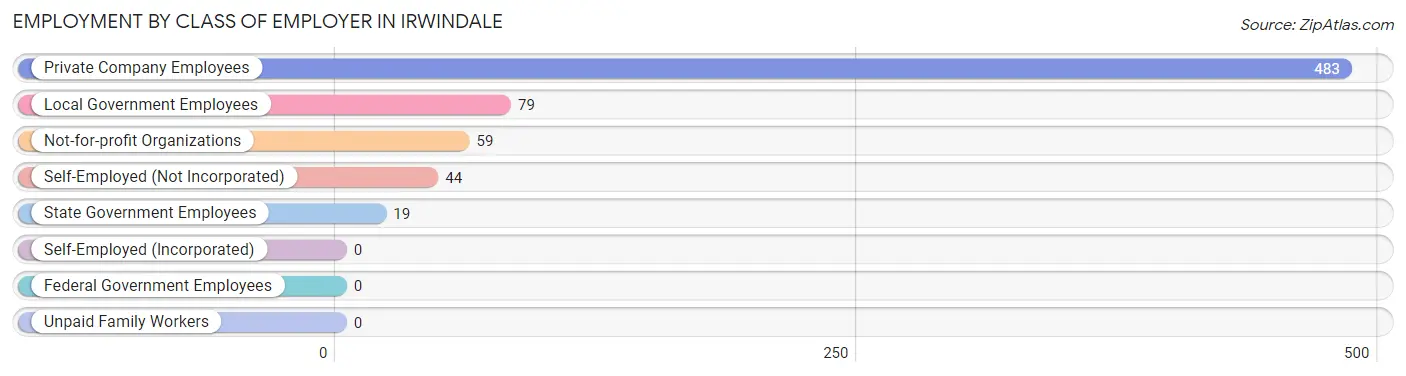
| Employer Class | # Employees | % Employees |
| Private Company Employees | 483 | 70.6% |
| Self-Employed (Incorporated) | 0 | 0.0% |
| Self-Employed (Not Incorporated) | 44 | 6.4% |
| Not-for-profit Organizations | 59 | 8.6% |
| Local Government Employees | 79 | 11.6% |
| State Government Employees | 19 | 2.8% |
| Federal Government Employees | 0 | 0.0% |
| Unpaid Family Workers | 0 | 0.0% |
| Total | 684 | 100.0% |
Employment Status by Age in Irwindale
According to the labor force statistics for Irwindale, out of the total population over 16 years of age (1,109), 65.6% or 728 individuals are in the labor force, with 4.5% or 33 of them unemployed. The age group with the highest labor force participation rate is 30 to 34 years, with 100.0% or 190 individuals in the labor force. Within the labor force, the 16 to 19 years age range has the highest percentage of unemployed individuals, with 42.9% or 3 of them being unemployed.
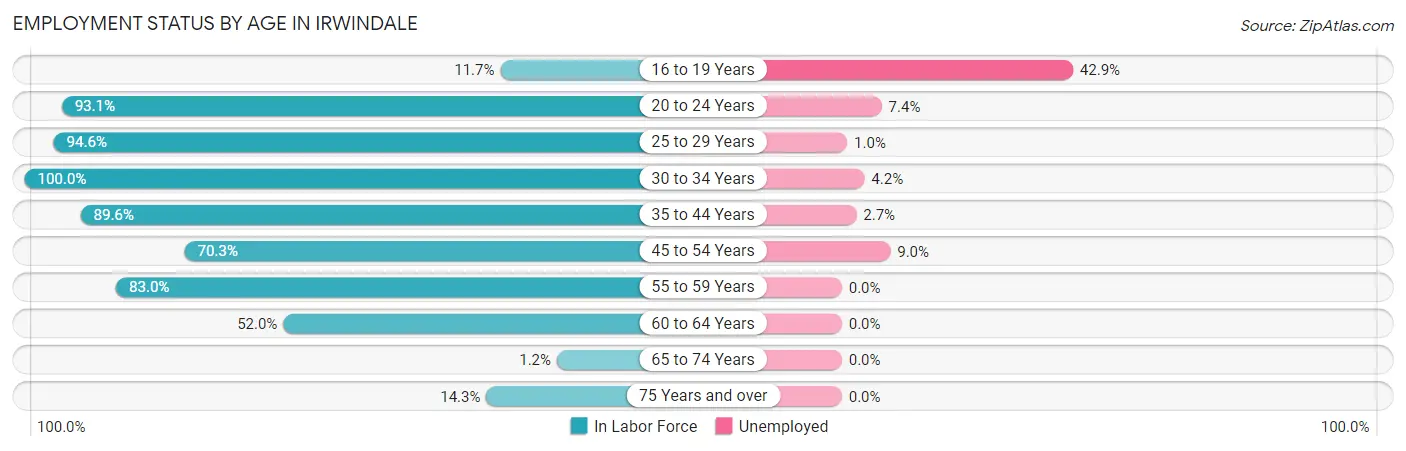
| Age Bracket | In Labor Force | Unemployed |
| 16 to 19 Years | 7 (11.7%) | 3 (42.9%) |
| 20 to 24 Years | 108 (93.1%) | 8 (7.4%) |
| 25 to 29 Years | 105 (94.6%) | 1 (1.0%) |
| 30 to 34 Years | 190 (100.0%) | 8 (4.2%) |
| 35 to 44 Years | 112 (89.6%) | 3 (2.7%) |
| 45 to 54 Years | 111 (70.3%) | 10 (9.0%) |
| 55 to 59 Years | 44 (83.0%) | 0 (0.0%) |
| 60 to 64 Years | 26 (52.0%) | 0 (0.0%) |
| 65 to 74 Years | 1 (1.2%) | 0 (0.0%) |
| 75 Years and over | 23 (14.3%) | 0 (0.0%) |
| Total | 728 (65.6%) | 33 (4.5%) |
Employment Status by Educational Attainment in Irwindale
According to labor force statistics for Irwindale, 85.6% of individuals (588) out of the total population between 25 and 64 years of age (687) are in the labor force, with 3.7% or 22 of them being unemployed. The group with the highest labor force participation rate are those with the educational attainment of bachelor's degree or higher, with 90.5% or 143 individuals in the labor force. Within the labor force, individuals with less than high school education have the highest percentage of unemployment, with 7.6% or 6 of them being unemployed.
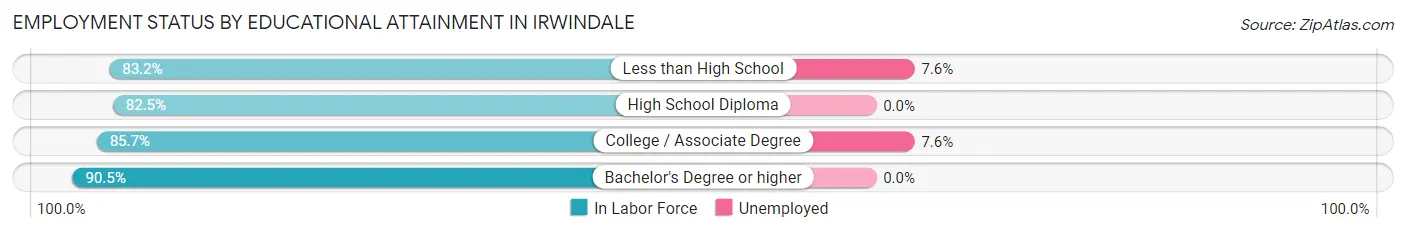
| Educational Attainment | In Labor Force | Unemployed |
| Less than High School | 79 (83.2%) | 7 (7.6%) |
| High School Diploma | 156 (82.5%) | 0 (0.0%) |
| College / Associate Degree | 210 (85.7%) | 19 (7.6%) |
| Bachelor's Degree or higher | 143 (90.5%) | 0 (0.0%) |
| Total | 588 (85.6%) | 25 (3.7%) |
Employment Occupations by Sex in Irwindale
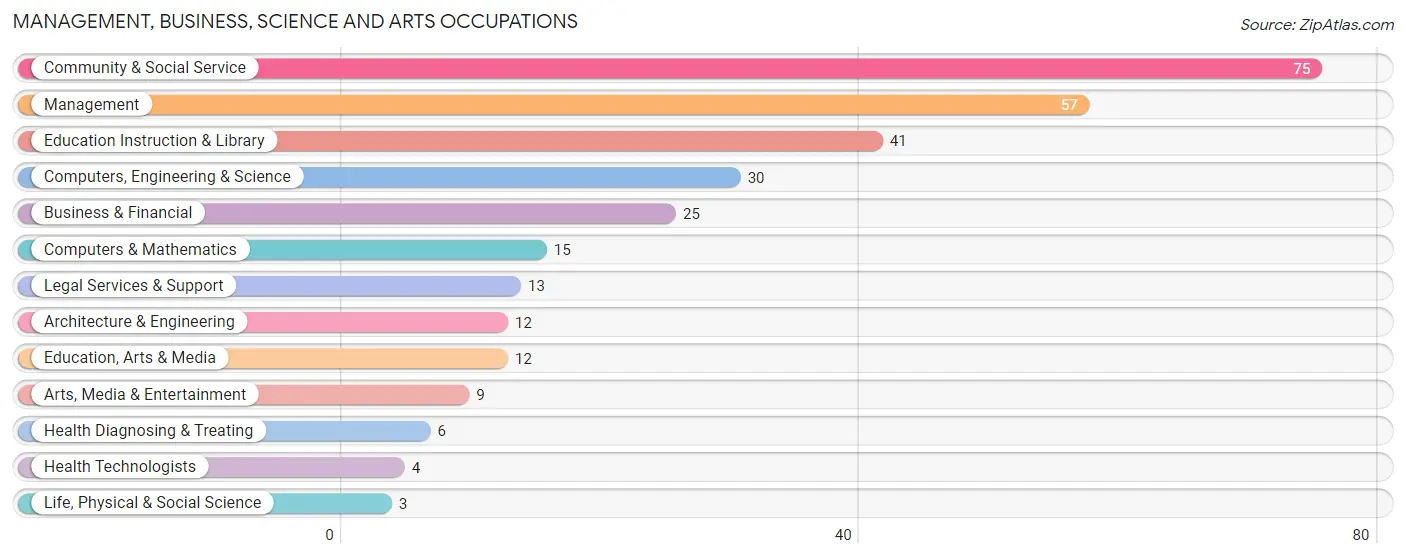
Management, Business, Science and Arts Occupations
The most common Management, Business, Science and Arts occupations in Irwindale are Community & Social Service (75 | 10.8%), Management (57 | 8.2%), Education Instruction & Library (41 | 5.9%), Computers, Engineering & Science (30 | 4.3%), and Business & Financial (25 | 3.6%).
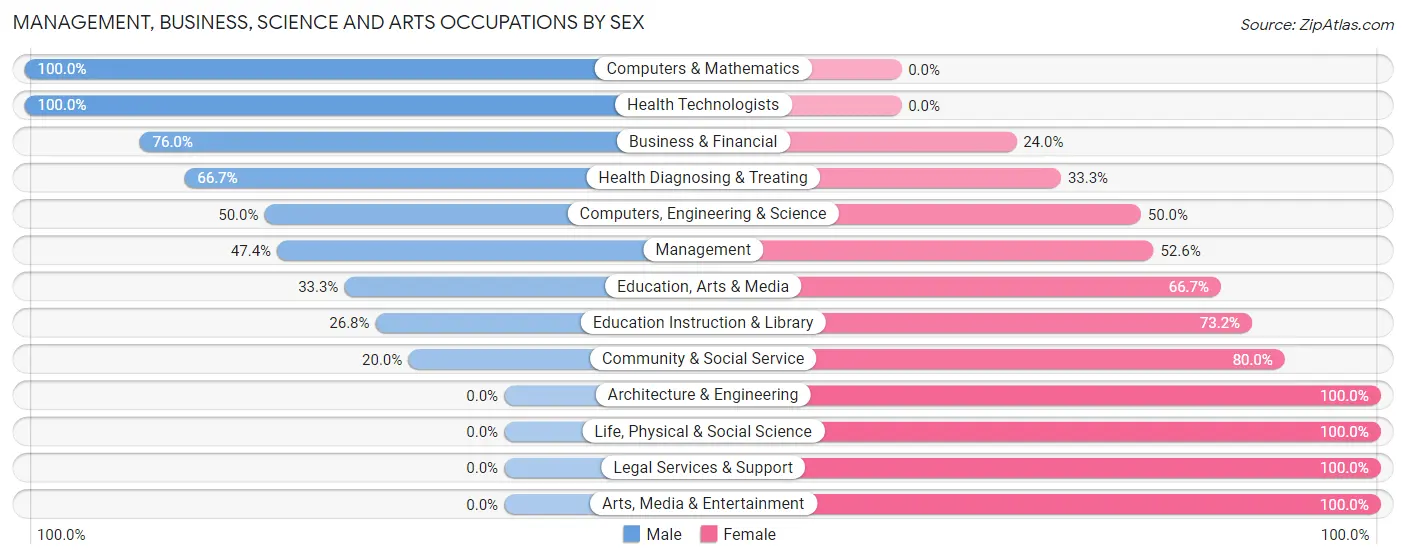
Management, Business, Science and Arts Occupations by Sex
Within the Management, Business, Science and Arts occupations in Irwindale, the most male-oriented occupations are Computers & Mathematics (100.0%), Health Technologists (100.0%), and Business & Financial (76.0%), while the most female-oriented occupations are Architecture & Engineering (100.0%), Life, Physical & Social Science (100.0%), and Legal Services & Support (100.0%).
| Occupation | Male | Female |
| Management | 27 (47.4%) | 30 (52.6%) |
| Business & Financial | 19 (76.0%) | 6 (24.0%) |
| Computers, Engineering & Science | 15 (50.0%) | 15 (50.0%) |
| Computers & Mathematics | 15 (100.0%) | 0 (0.0%) |
| Architecture & Engineering | 0 (0.0%) | 12 (100.0%) |
| Life, Physical & Social Science | 0 (0.0%) | 3 (100.0%) |
| Community & Social Service | 15 (20.0%) | 60 (80.0%) |
| Education, Arts & Media | 4 (33.3%) | 8 (66.7%) |
| Legal Services & Support | 0 (0.0%) | 13 (100.0%) |
| Education Instruction & Library | 11 (26.8%) | 30 (73.2%) |
| Arts, Media & Entertainment | 0 (0.0%) | 9 (100.0%) |
| Health Diagnosing & Treating | 4 (66.7%) | 2 (33.3%) |
| Health Technologists | 4 (100.0%) | 0 (0.0%) |
| Total (Category) | 80 (41.4%) | 113 (58.6%) |
| Total (Overall) | 362 (52.2%) | 332 (47.8%) |
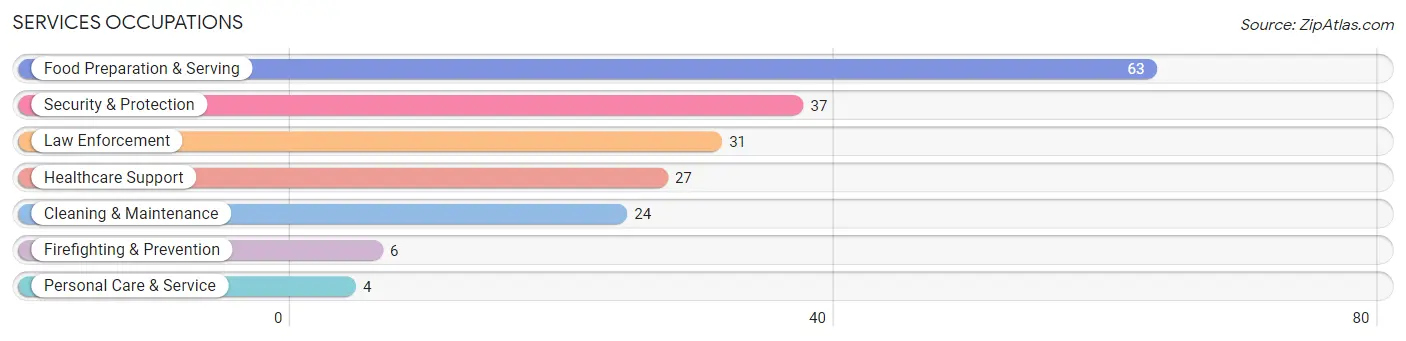
Services Occupations
The most common Services occupations in Irwindale are Food Preparation & Serving (63 | 9.1%), Security & Protection (37 | 5.3%), Law Enforcement (31 | 4.5%), Healthcare Support (27 | 3.9%), and Cleaning & Maintenance (24 | 3.5%).
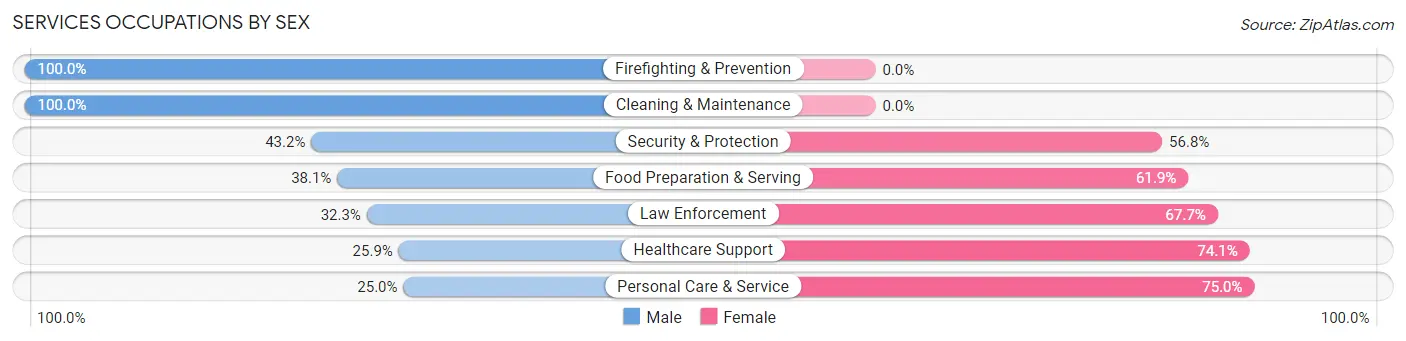
Services Occupations by Sex
Within the Services occupations in Irwindale, the most male-oriented occupations are Firefighting & Prevention (100.0%), Cleaning & Maintenance (100.0%), and Security & Protection (43.2%), while the most female-oriented occupations are Personal Care & Service (75.0%), Healthcare Support (74.1%), and Law Enforcement (67.7%).
| Occupation | Male | Female |
| Healthcare Support | 7 (25.9%) | 20 (74.1%) |
| Security & Protection | 16 (43.2%) | 21 (56.8%) |
| Firefighting & Prevention | 6 (100.0%) | 0 (0.0%) |
| Law Enforcement | 10 (32.3%) | 21 (67.7%) |
| Food Preparation & Serving | 24 (38.1%) | 39 (61.9%) |
| Cleaning & Maintenance | 24 (100.0%) | 0 (0.0%) |
| Personal Care & Service | 1 (25.0%) | 3 (75.0%) |
| Total (Category) | 72 (46.5%) | 83 (53.5%) |
| Total (Overall) | 362 (52.2%) | 332 (47.8%) |
Sales and Office Occupations
The most common Sales and Office occupations in Irwindale are Office & Administration (87 | 12.5%), and Sales & Related (34 | 4.9%).
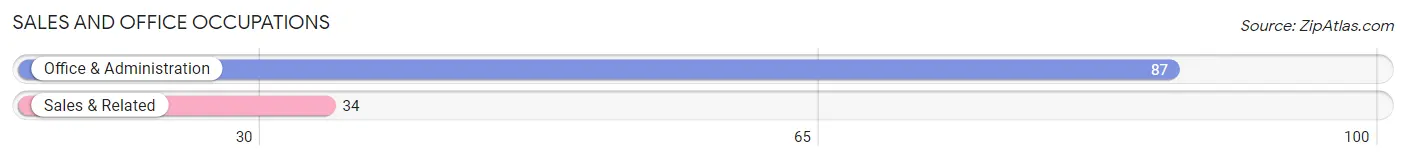
Sales and Office Occupations by Sex
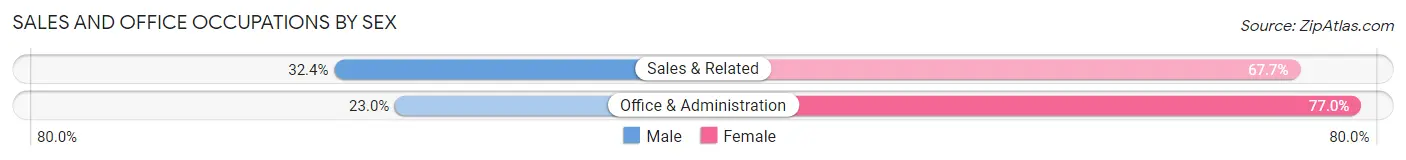
| Occupation | Male | Female |
| Sales & Related | 11 (32.4%) | 23 (67.6%) |
| Office & Administration | 20 (23.0%) | 67 (77.0%) |
| Total (Category) | 31 (25.6%) | 90 (74.4%) |
| Total (Overall) | 362 (52.2%) | 332 (47.8%) |
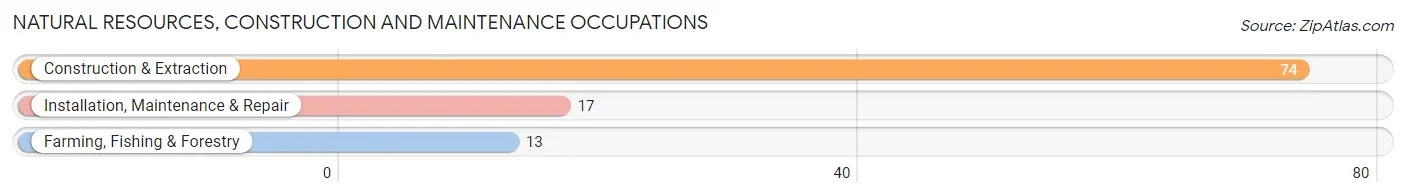
Natural Resources, Construction and Maintenance Occupations
The most common Natural Resources, Construction and Maintenance occupations in Irwindale are Construction & Extraction (74 | 10.7%), Installation, Maintenance & Repair (17 | 2.5%), and Farming, Fishing & Forestry (13 | 1.9%).
Natural Resources, Construction and Maintenance Occupations by Sex
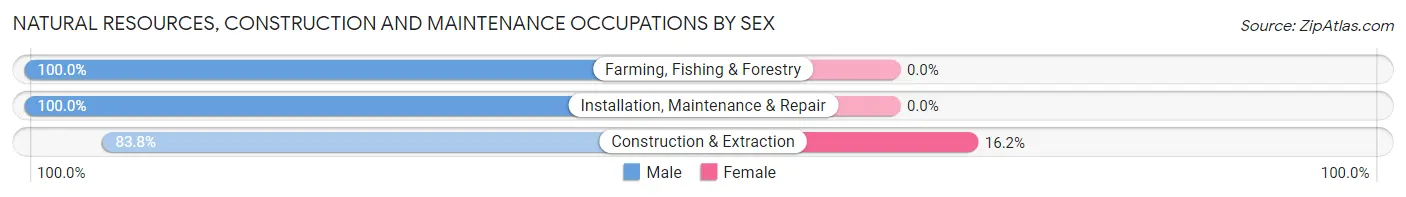
| Occupation | Male | Female |
| Farming, Fishing & Forestry | 13 (100.0%) | 0 (0.0%) |
| Construction & Extraction | 62 (83.8%) | 12 (16.2%) |
| Installation, Maintenance & Repair | 17 (100.0%) | 0 (0.0%) |
| Total (Category) | 92 (88.5%) | 12 (11.5%) |
| Total (Overall) | 362 (52.2%) | 332 (47.8%) |
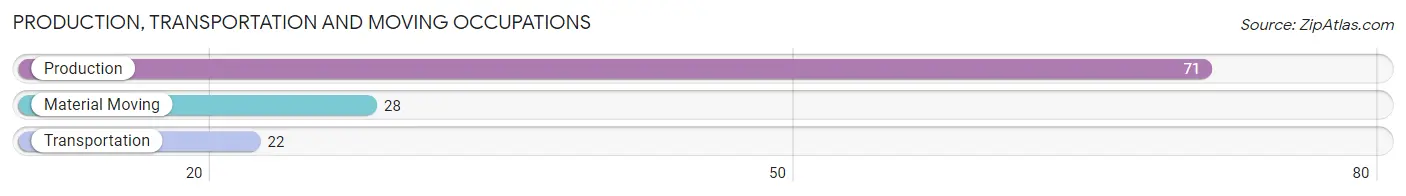
Production, Transportation and Moving Occupations
The most common Production, Transportation and Moving occupations in Irwindale are Production (71 | 10.2%), Material Moving (28 | 4.0%), and Transportation (22 | 3.2%).
Production, Transportation and Moving Occupations by Sex
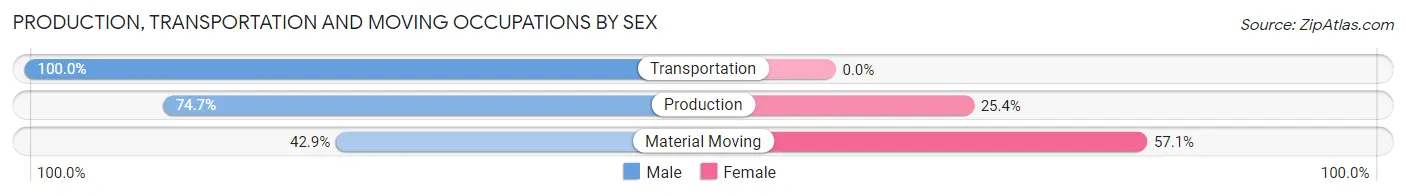
| Occupation | Male | Female |
| Production | 53 (74.7%) | 18 (25.4%) |
| Transportation | 22 (100.0%) | 0 (0.0%) |
| Material Moving | 12 (42.9%) | 16 (57.1%) |
| Total (Category) | 87 (71.9%) | 34 (28.1%) |
| Total (Overall) | 362 (52.2%) | 332 (47.8%) |
Employment Industries by Sex in Irwindale
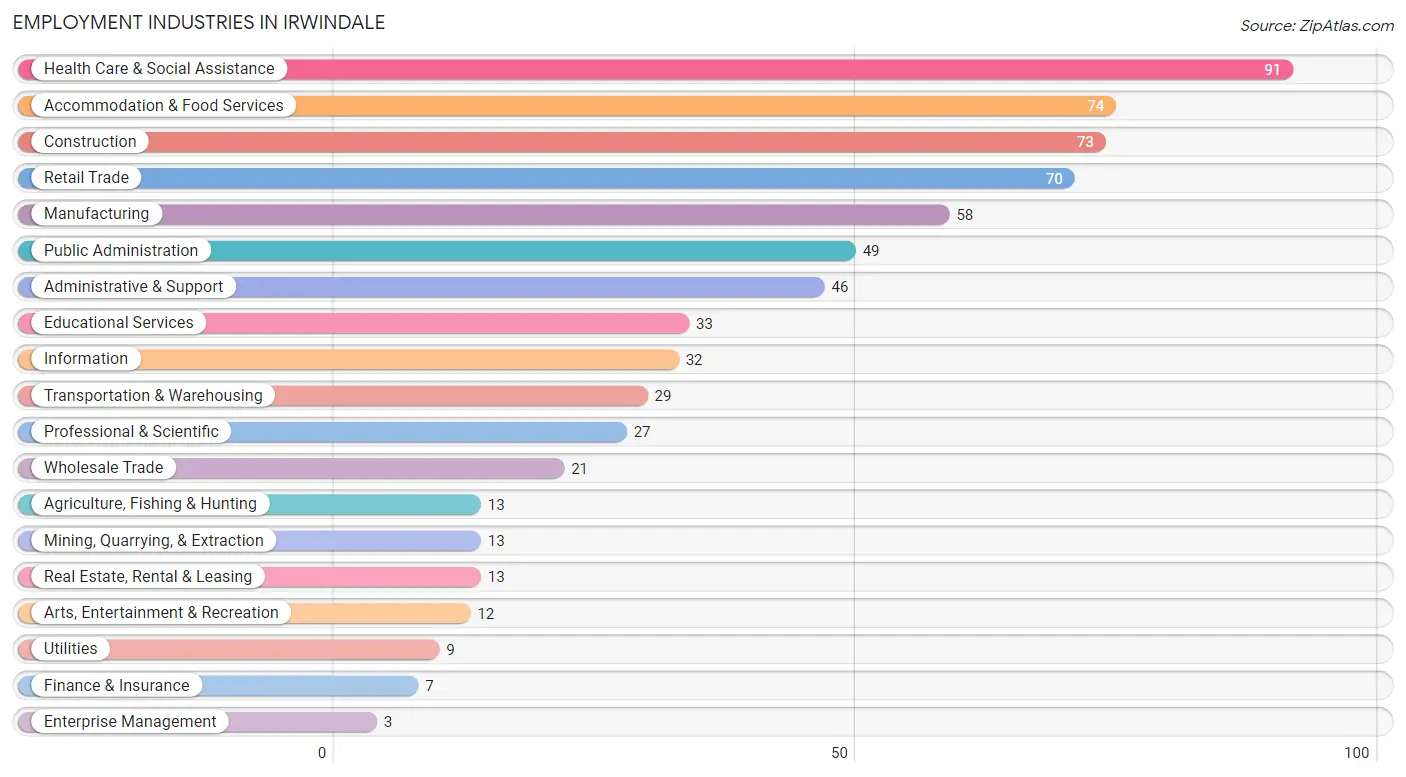
Employment Industries in Irwindale
The major employment industries in Irwindale include Health Care & Social Assistance (91 | 13.1%), Accommodation & Food Services (74 | 10.7%), Construction (73 | 10.5%), Retail Trade (70 | 10.1%), and Manufacturing (58 | 8.4%).
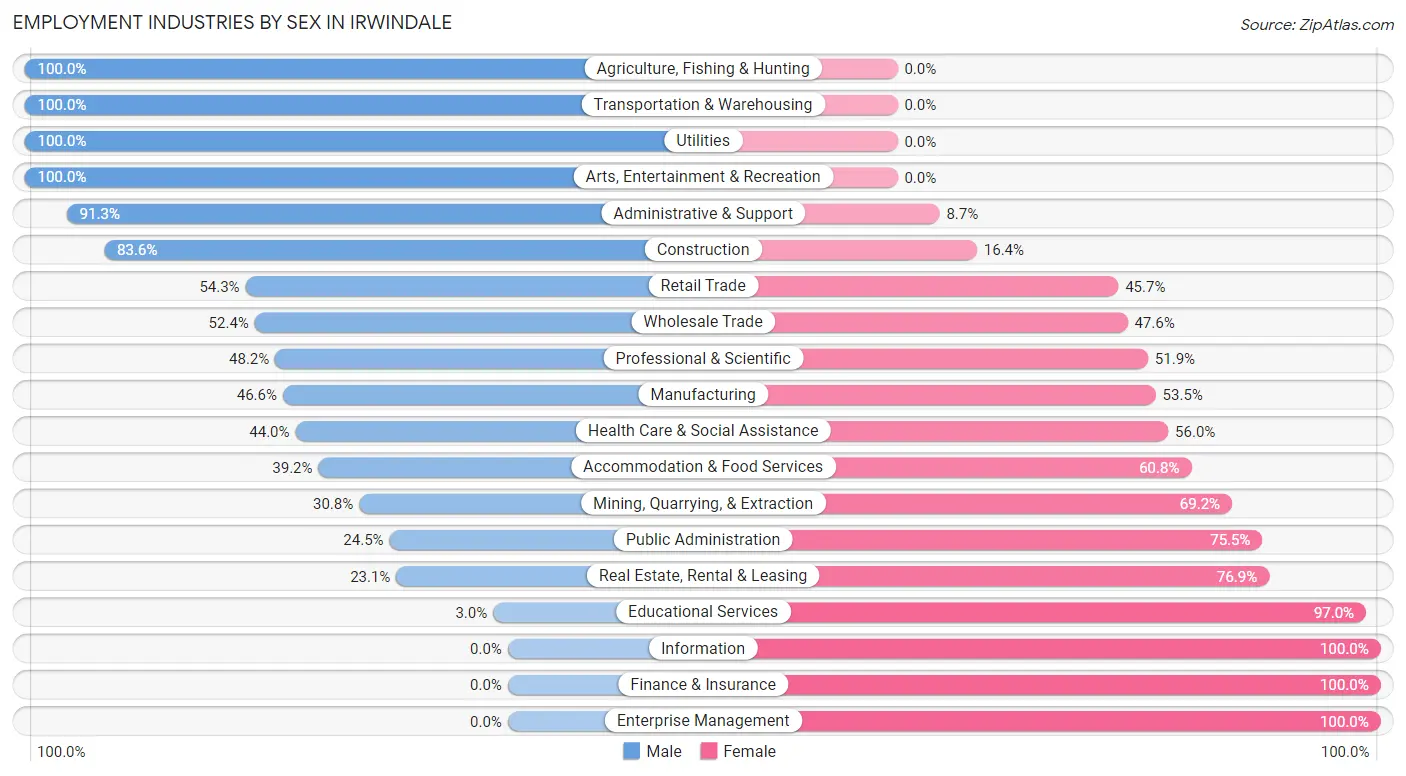
Employment Industries by Sex in Irwindale
The Irwindale industries that see more men than women are Agriculture, Fishing & Hunting (100.0%), Transportation & Warehousing (100.0%), and Utilities (100.0%), whereas the industries that tend to have a higher number of women are Information (100.0%), Finance & Insurance (100.0%), and Enterprise Management (100.0%).
| Industry | Male | Female |
| Agriculture, Fishing & Hunting | 13 (100.0%) | 0 (0.0%) |
| Mining, Quarrying, & Extraction | 4 (30.8%) | 9 (69.2%) |
| Construction | 61 (83.6%) | 12 (16.4%) |
| Manufacturing | 27 (46.6%) | 31 (53.4%) |
| Wholesale Trade | 11 (52.4%) | 10 (47.6%) |
| Retail Trade | 38 (54.3%) | 32 (45.7%) |
| Transportation & Warehousing | 29 (100.0%) | 0 (0.0%) |
| Utilities | 9 (100.0%) | 0 (0.0%) |
| Information | 0 (0.0%) | 32 (100.0%) |
| Finance & Insurance | 0 (0.0%) | 7 (100.0%) |
| Real Estate, Rental & Leasing | 3 (23.1%) | 10 (76.9%) |
| Professional & Scientific | 13 (48.1%) | 14 (51.8%) |
| Enterprise Management | 0 (0.0%) | 3 (100.0%) |
| Administrative & Support | 42 (91.3%) | 4 (8.7%) |
| Educational Services | 1 (3.0%) | 32 (97.0%) |
| Health Care & Social Assistance | 40 (44.0%) | 51 (56.0%) |
| Arts, Entertainment & Recreation | 12 (100.0%) | 0 (0.0%) |
| Accommodation & Food Services | 29 (39.2%) | 45 (60.8%) |
| Public Administration | 12 (24.5%) | 37 (75.5%) |
| Total | 362 (52.2%) | 332 (47.8%) |
Education in Irwindale
School Enrollment in Irwindale
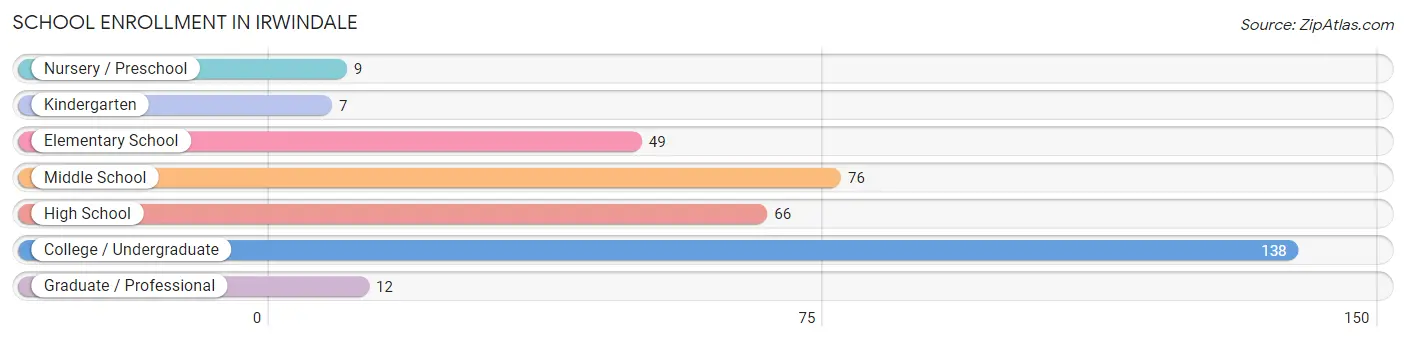
The most common levels of schooling among the 357 students in Irwindale are college / undergraduate (138 | 38.7%), middle school (76 | 21.3%), and high school (66 | 18.5%).
| School Level | # Students | % Students |
| Nursery / Preschool | 9 | 2.5% |
| Kindergarten | 7 | 2.0% |
| Elementary School | 49 | 13.7% |
| Middle School | 76 | 21.3% |
| High School | 66 | 18.5% |
| College / Undergraduate | 138 | 38.7% |
| Graduate / Professional | 12 | 3.4% |
| Total | 357 | 100.0% |
School Enrollment by Age by Funding Source in Irwindale
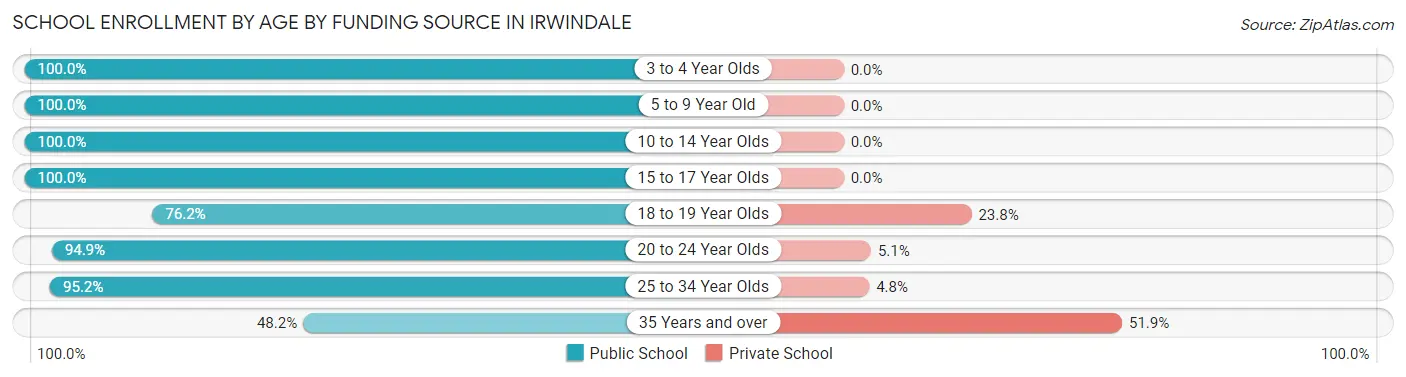
Out of a total of 357 students who are enrolled in schools in Irwindale, 37 (10.4%) attend a private institution, while the remaining 320 (89.6%) are enrolled in public schools. The age group of 35 years and over has the highest likelihood of being enrolled in private schools, with 28 (51.8% in the age bracket) enrolled. Conversely, the age group of 3 to 4 year olds has the lowest likelihood of being enrolled in a private school, with 5 (100.0% in the age bracket) attending a public institution.
| Age Bracket | Public School | Private School |
| 3 to 4 Year Olds | 5 (100.0%) | 0 (0.0%) |
| 5 to 9 Year Old | 57 (100.0%) | 0 (0.0%) |
| 10 to 14 Year Olds | 81 (100.0%) | 0 (0.0%) |
| 15 to 17 Year Olds | 59 (100.0%) | 0 (0.0%) |
| 18 to 19 Year Olds | 16 (76.2%) | 5 (23.8%) |
| 20 to 24 Year Olds | 56 (94.9%) | 3 (5.1%) |
| 25 to 34 Year Olds | 20 (95.2%) | 1 (4.8%) |
| 35 Years and over | 26 (48.1%) | 28 (51.8%) |
| Total | 320 (89.6%) | 37 (10.4%) |
Educational Attainment by Field of Study in Irwindale
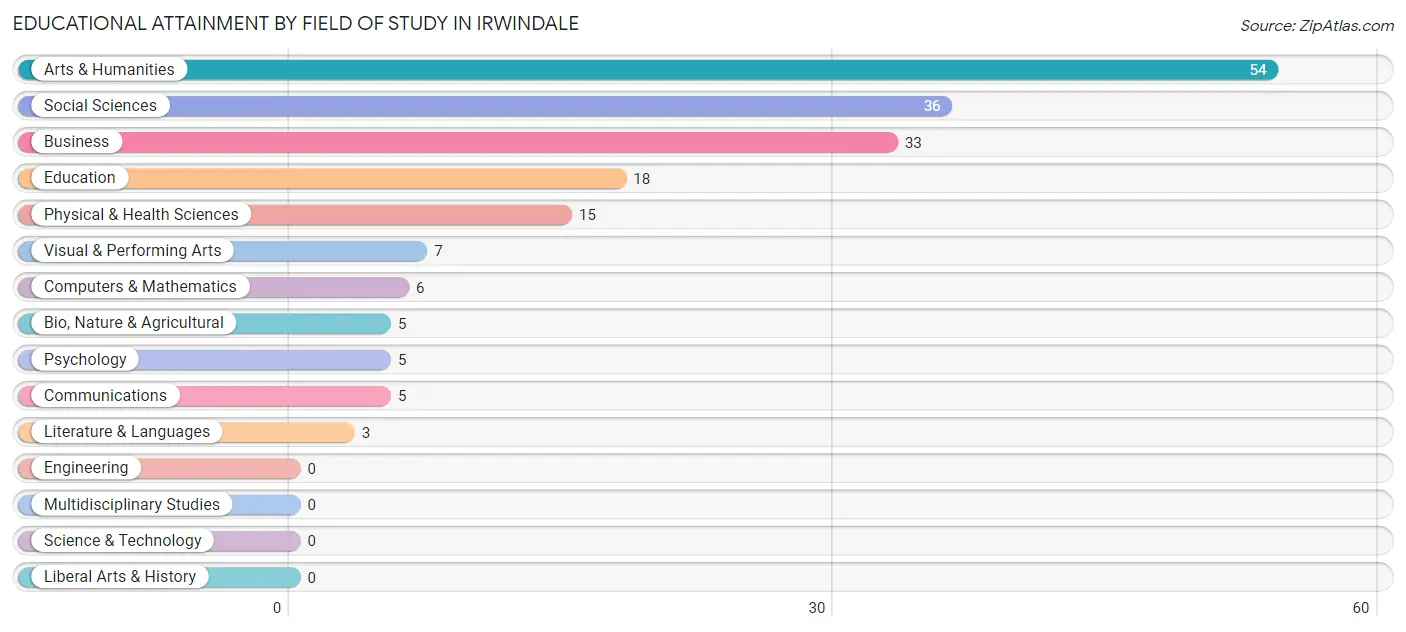
Arts & humanities (54 | 28.9%), social sciences (36 | 19.3%), business (33 | 17.6%), education (18 | 9.6%), and physical & health sciences (15 | 8.0%) are the most common fields of study among 187 individuals in Irwindale who have obtained a bachelor's degree or higher.
| Field of Study | # Graduates | % Graduates |
| Computers & Mathematics | 6 | 3.2% |
| Bio, Nature & Agricultural | 5 | 2.7% |
| Physical & Health Sciences | 15 | 8.0% |
| Psychology | 5 | 2.7% |
| Social Sciences | 36 | 19.3% |
| Engineering | 0 | 0.0% |
| Multidisciplinary Studies | 0 | 0.0% |
| Science & Technology | 0 | 0.0% |
| Business | 33 | 17.6% |
| Education | 18 | 9.6% |
| Literature & Languages | 3 | 1.6% |
| Liberal Arts & History | 0 | 0.0% |
| Visual & Performing Arts | 7 | 3.7% |
| Communications | 5 | 2.7% |
| Arts & Humanities | 54 | 28.9% |
| Total | 187 | 100.0% |
Transportation & Commute in Irwindale
Vehicle Availability by Sex in Irwindale
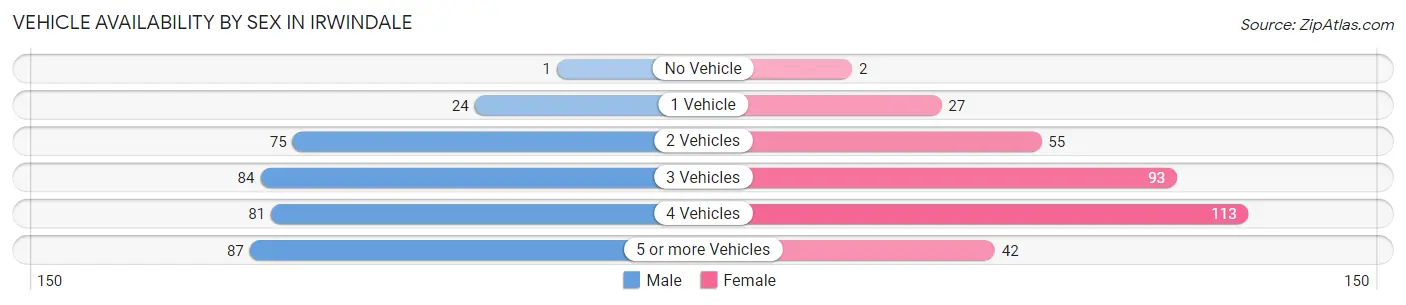
The most prevalent vehicle ownership categories in Irwindale are males with 5 or more vehicles (87, accounting for 24.7%) and females with 5 or more vehicles (42, making up 26.2%).
| Vehicles Available | Male | Female |
| No Vehicle | 1 (0.3%) | 2 (0.6%) |
| 1 Vehicle | 24 (6.8%) | 27 (8.1%) |
| 2 Vehicles | 75 (21.3%) | 55 (16.6%) |
| 3 Vehicles | 84 (23.9%) | 93 (28.0%) |
| 4 Vehicles | 81 (23.0%) | 113 (34.0%) |
| 5 or more Vehicles | 87 (24.7%) | 42 (12.7%) |
| Total | 352 (100.0%) | 332 (100.0%) |
Commute Time in Irwindale
The most frequently occuring commute durations in Irwindale are 5 to 9 minutes (97 commuters, 15.3%), 45 to 59 minutes (96 commuters, 15.1%), and 30 to 34 minutes (82 commuters, 12.9%).
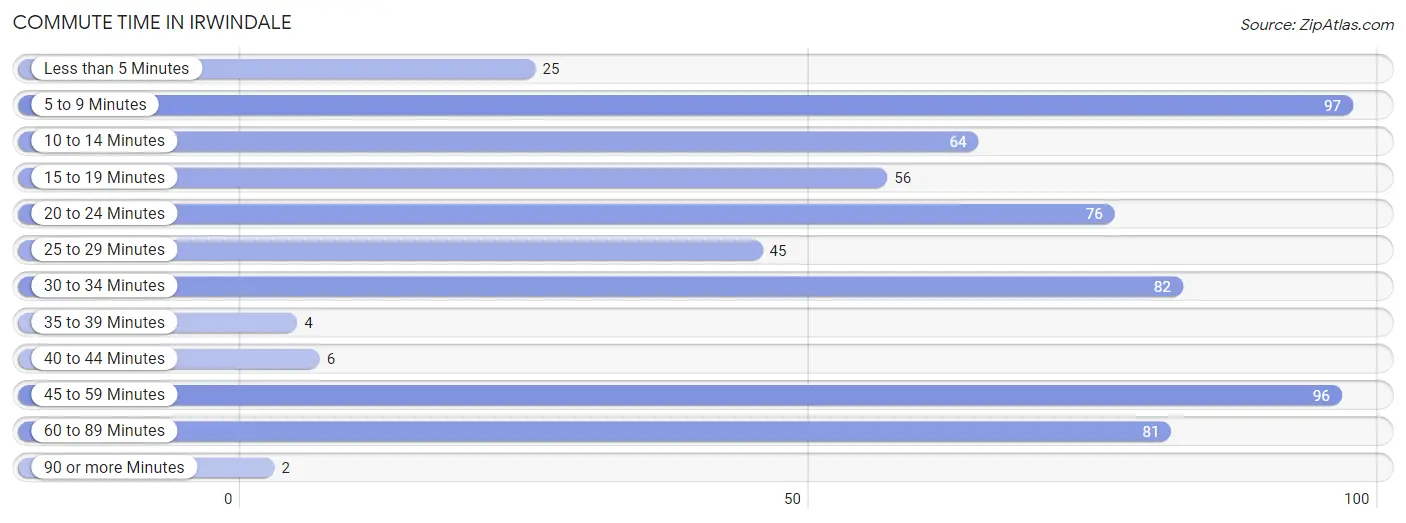
| Commute Time | # Commuters | % Commuters |
| Less than 5 Minutes | 25 | 3.9% |
| 5 to 9 Minutes | 97 | 15.3% |
| 10 to 14 Minutes | 64 | 10.1% |
| 15 to 19 Minutes | 56 | 8.8% |
| 20 to 24 Minutes | 76 | 12.0% |
| 25 to 29 Minutes | 45 | 7.1% |
| 30 to 34 Minutes | 82 | 12.9% |
| 35 to 39 Minutes | 4 | 0.6% |
| 40 to 44 Minutes | 6 | 0.9% |
| 45 to 59 Minutes | 96 | 15.1% |
| 60 to 89 Minutes | 81 | 12.8% |
| 90 or more Minutes | 2 | 0.3% |
Commute Time by Sex in Irwindale
The most common commute times in Irwindale are 30 to 34 minutes (60 commuters, 18.9%) for males and 45 to 59 minutes (56 commuters, 17.7%) for females.
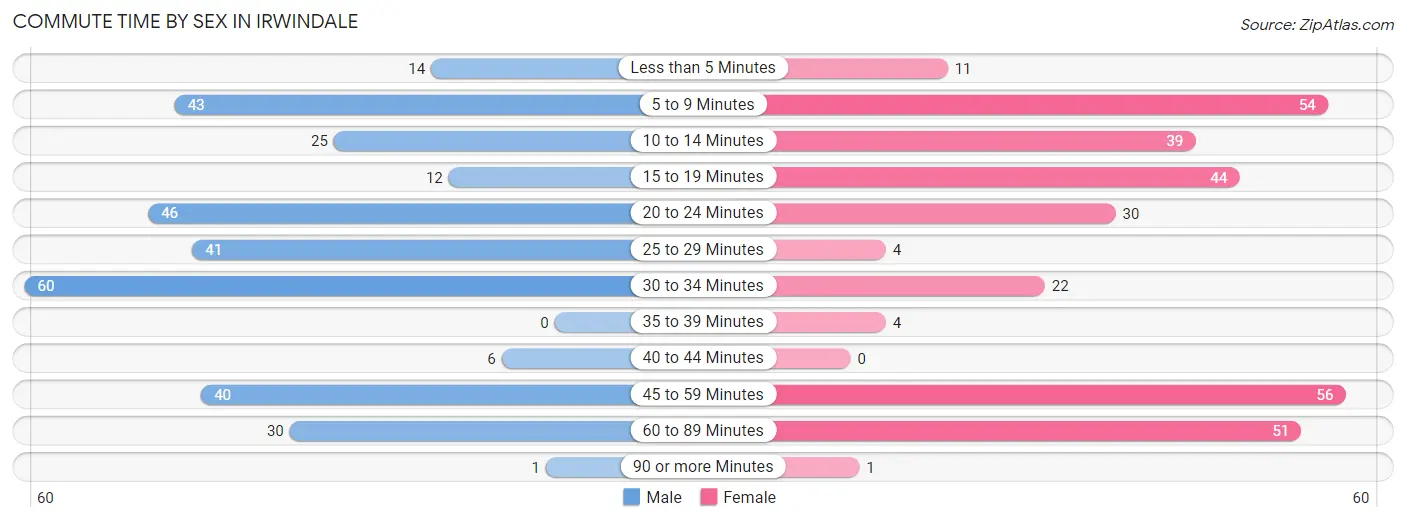
| Commute Time | Male | Female |
| Less than 5 Minutes | 14 (4.4%) | 11 (3.5%) |
| 5 to 9 Minutes | 43 (13.5%) | 54 (17.1%) |
| 10 to 14 Minutes | 25 (7.9%) | 39 (12.3%) |
| 15 to 19 Minutes | 12 (3.8%) | 44 (13.9%) |
| 20 to 24 Minutes | 46 (14.5%) | 30 (9.5%) |
| 25 to 29 Minutes | 41 (12.9%) | 4 (1.3%) |
| 30 to 34 Minutes | 60 (18.9%) | 22 (7.0%) |
| 35 to 39 Minutes | 0 (0.0%) | 4 (1.3%) |
| 40 to 44 Minutes | 6 (1.9%) | 0 (0.0%) |
| 45 to 59 Minutes | 40 (12.6%) | 56 (17.7%) |
| 60 to 89 Minutes | 30 (9.4%) | 51 (16.1%) |
| 90 or more Minutes | 1 (0.3%) | 1 (0.3%) |
Time of Departure to Work by Sex in Irwindale
The most frequent times of departure to work in Irwindale are 12:00 AM to 4:59 AM (83, 26.1%) for males and 8:00 AM to 8:29 AM (69, 21.8%) for females.
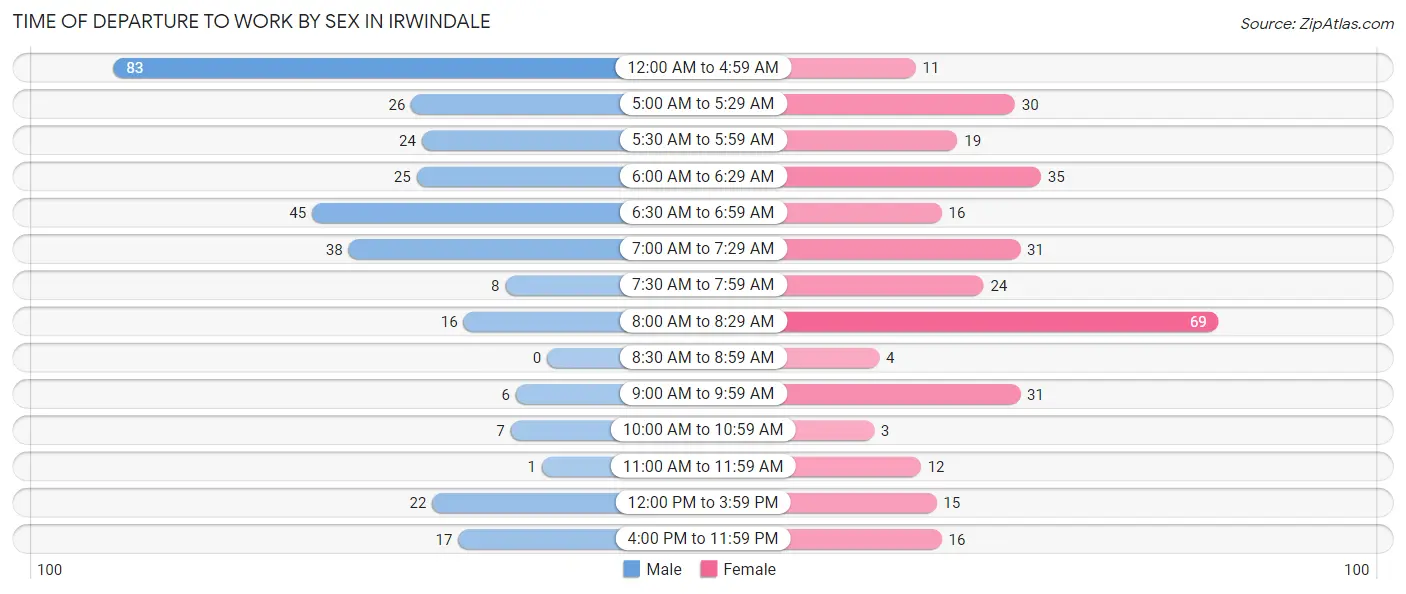
| Time of Departure | Male | Female |
| 12:00 AM to 4:59 AM | 83 (26.1%) | 11 (3.5%) |
| 5:00 AM to 5:29 AM | 26 (8.2%) | 30 (9.5%) |
| 5:30 AM to 5:59 AM | 24 (7.5%) | 19 (6.0%) |
| 6:00 AM to 6:29 AM | 25 (7.9%) | 35 (11.1%) |
| 6:30 AM to 6:59 AM | 45 (14.1%) | 16 (5.1%) |
| 7:00 AM to 7:29 AM | 38 (11.9%) | 31 (9.8%) |
| 7:30 AM to 7:59 AM | 8 (2.5%) | 24 (7.6%) |
| 8:00 AM to 8:29 AM | 16 (5.0%) | 69 (21.8%) |
| 8:30 AM to 8:59 AM | 0 (0.0%) | 4 (1.3%) |
| 9:00 AM to 9:59 AM | 6 (1.9%) | 31 (9.8%) |
| 10:00 AM to 10:59 AM | 7 (2.2%) | 3 (0.9%) |
| 11:00 AM to 11:59 AM | 1 (0.3%) | 12 (3.8%) |
| 12:00 PM to 3:59 PM | 22 (6.9%) | 15 (4.8%) |
| 4:00 PM to 11:59 PM | 17 (5.3%) | 16 (5.1%) |
| Total | 318 (100.0%) | 316 (100.0%) |
Housing Occupancy in Irwindale
Occupancy by Ownership in Irwindale
Of the total 443 dwellings in Irwindale, owner-occupied units account for 359 (81.0%), while renter-occupied units make up 84 (19.0%).
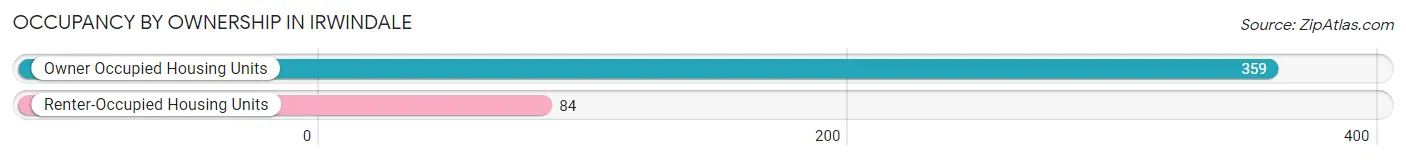
| Occupancy | # Housing Units | % Housing Units |
| Owner Occupied Housing Units | 359 | 81.0% |
| Renter-Occupied Housing Units | 84 | 19.0% |
| Total Occupied Housing Units | 443 | 100.0% |
Occupancy by Household Size in Irwindale
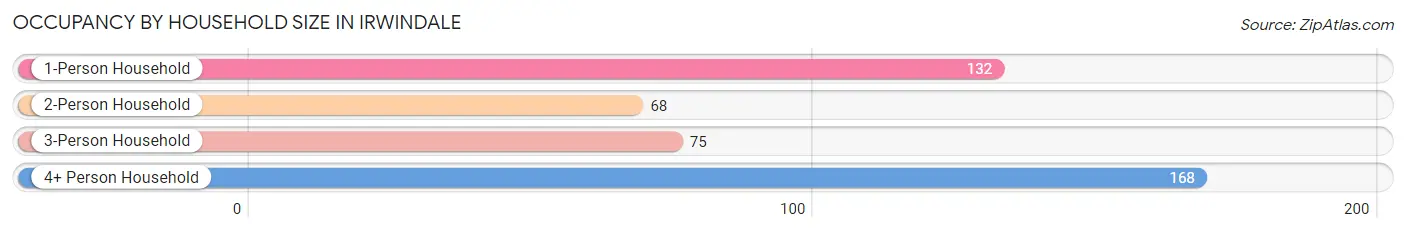
| Household Size | # Housing Units | % Housing Units |
| 1-Person Household | 132 | 29.8% |
| 2-Person Household | 68 | 15.3% |
| 3-Person Household | 75 | 16.9% |
| 4+ Person Household | 168 | 37.9% |
| Total Housing Units | 443 | 100.0% |
Occupancy by Ownership by Household Size in Irwindale
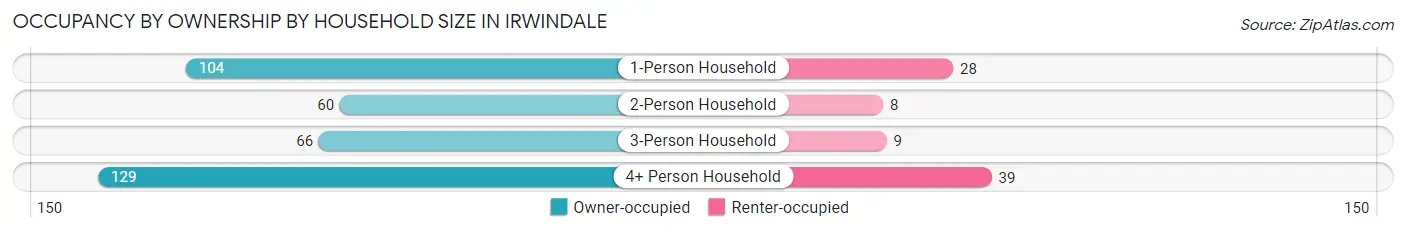
| Household Size | Owner-occupied | Renter-occupied |
| 1-Person Household | 104 (78.8%) | 28 (21.2%) |
| 2-Person Household | 60 (88.2%) | 8 (11.8%) |
| 3-Person Household | 66 (88.0%) | 9 (12.0%) |
| 4+ Person Household | 129 (76.8%) | 39 (23.2%) |
| Total Housing Units | 359 (81.0%) | 84 (19.0%) |
Occupancy by Educational Attainment in Irwindale
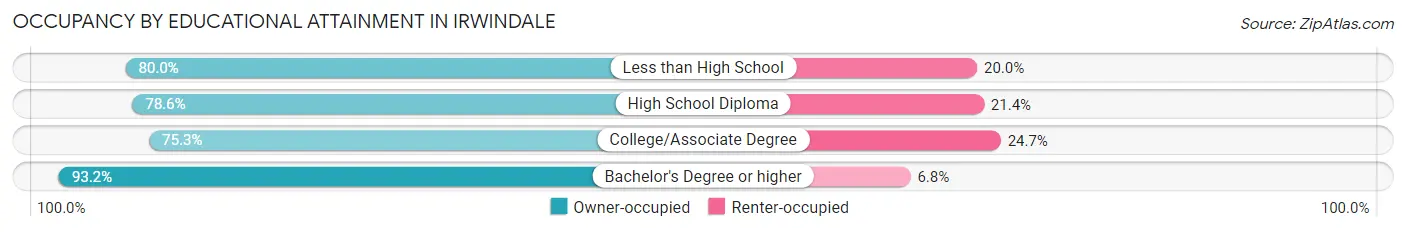
| Household Size | Owner-occupied | Renter-occupied |
| Less than High School | 60 (80.0%) | 15 (20.0%) |
| High School Diploma | 81 (78.6%) | 22 (21.4%) |
| College/Associate Degree | 122 (75.3%) | 40 (24.7%) |
| Bachelor's Degree or higher | 96 (93.2%) | 7 (6.8%) |
Occupancy by Age of Householder in Irwindale
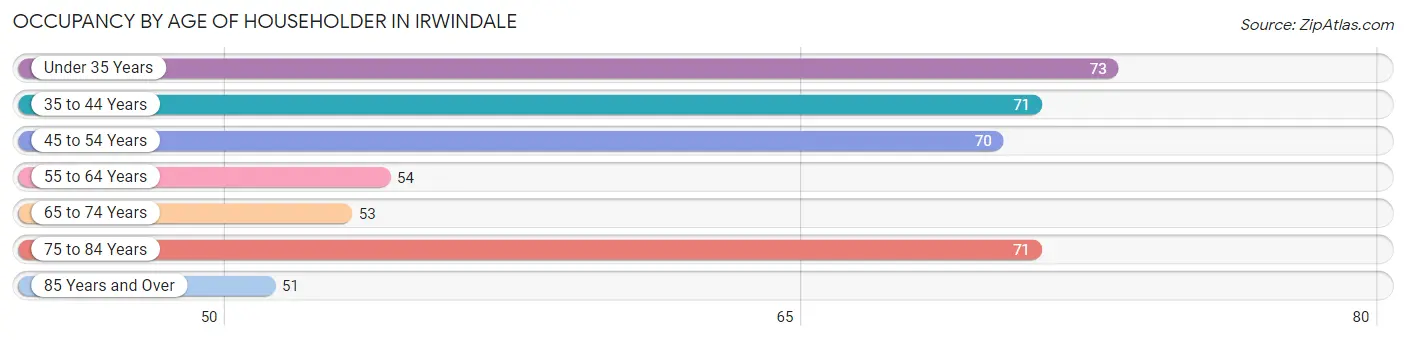
| Age Bracket | # Households | % Households |
| Under 35 Years | 73 | 16.5% |
| 35 to 44 Years | 71 | 16.0% |
| 45 to 54 Years | 70 | 15.8% |
| 55 to 64 Years | 54 | 12.2% |
| 65 to 74 Years | 53 | 12.0% |
| 75 to 84 Years | 71 | 16.0% |
| 85 Years and Over | 51 | 11.5% |
| Total | 443 | 100.0% |
Housing Finances in Irwindale
Median Income by Occupancy in Irwindale
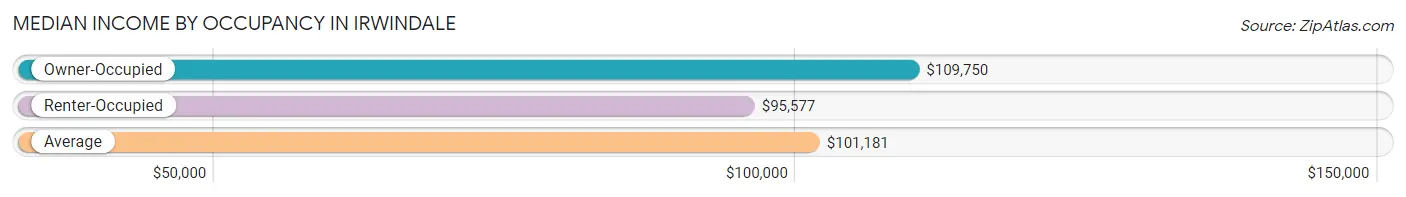
| Occupancy Type | # Households | Median Income |
| Owner-Occupied | 359 (81.0%) | $109,750 |
| Renter-Occupied | 84 (19.0%) | $95,577 |
| Average | 443 (100.0%) | $101,181 |
Occupancy by Householder Income Bracket in Irwindale
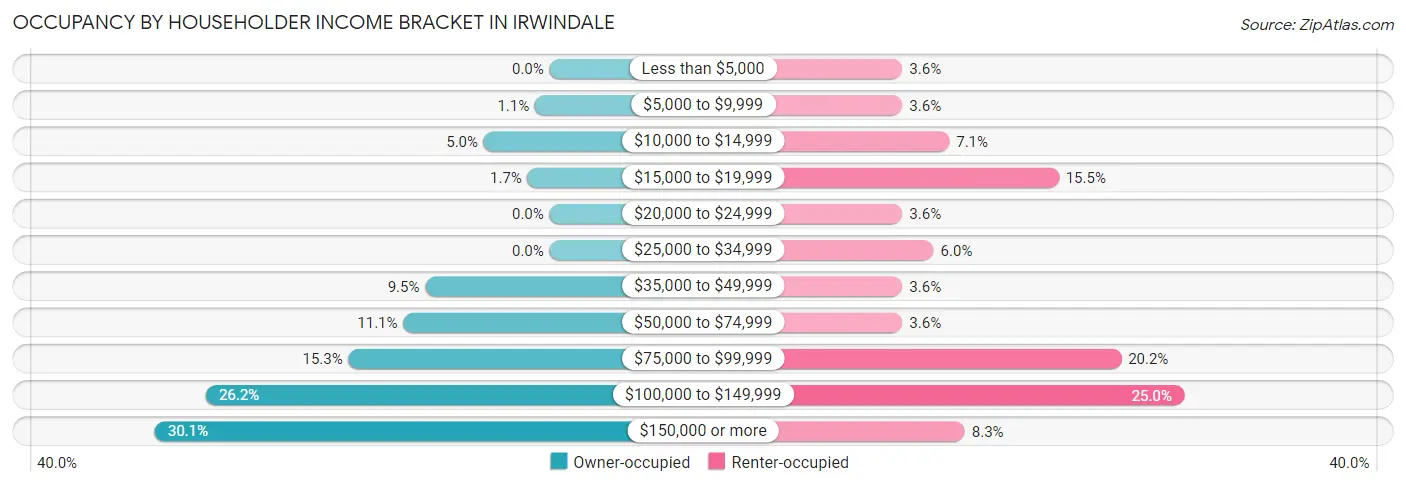
| Income Bracket | Owner-occupied | Renter-occupied |
| Less than $5,000 | 0 (0.0%) | 3 (3.6%) |
| $5,000 to $9,999 | 4 (1.1%) | 3 (3.6%) |
| $10,000 to $14,999 | 18 (5.0%) | 6 (7.1%) |
| $15,000 to $19,999 | 6 (1.7%) | 13 (15.5%) |
| $20,000 to $24,999 | 0 (0.0%) | 3 (3.6%) |
| $25,000 to $34,999 | 0 (0.0%) | 5 (5.9%) |
| $35,000 to $49,999 | 34 (9.5%) | 3 (3.6%) |
| $50,000 to $74,999 | 40 (11.1%) | 3 (3.6%) |
| $75,000 to $99,999 | 55 (15.3%) | 17 (20.2%) |
| $100,000 to $149,999 | 94 (26.2%) | 21 (25.0%) |
| $150,000 or more | 108 (30.1%) | 7 (8.3%) |
| Total | 359 (100.0%) | 84 (100.0%) |
Monthly Housing Cost Tiers in Irwindale
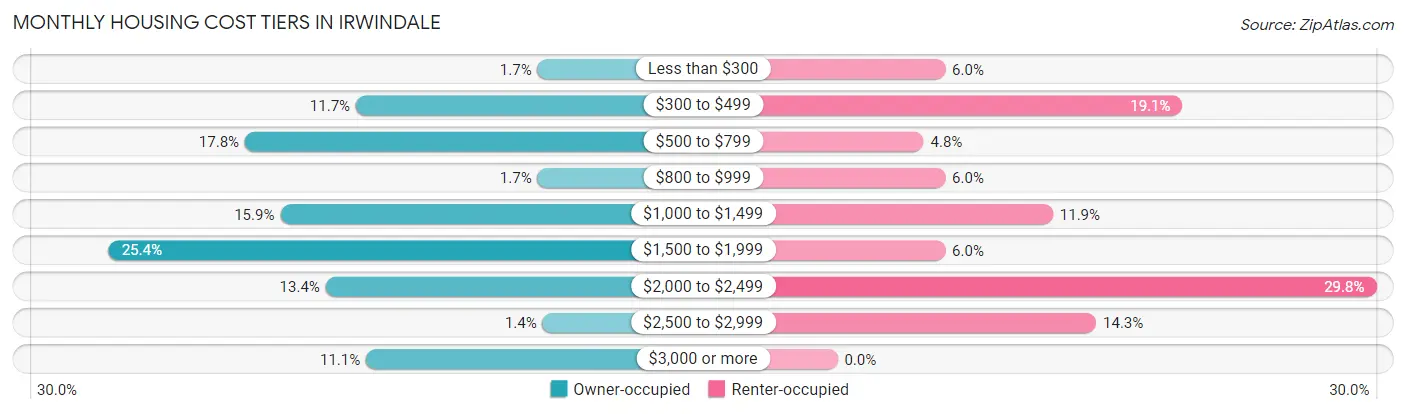
| Monthly Cost | Owner-occupied | Renter-occupied |
| Less than $300 | 6 (1.7%) | 5 (5.9%) |
| $300 to $499 | 42 (11.7%) | 16 (19.1%) |
| $500 to $799 | 64 (17.8%) | 4 (4.8%) |
| $800 to $999 | 6 (1.7%) | 5 (5.9%) |
| $1,000 to $1,499 | 57 (15.9%) | 10 (11.9%) |
| $1,500 to $1,999 | 91 (25.4%) | 5 (5.9%) |
| $2,000 to $2,499 | 48 (13.4%) | 25 (29.8%) |
| $2,500 to $2,999 | 5 (1.4%) | 12 (14.3%) |
| $3,000 or more | 40 (11.1%) | 0 (0.0%) |
| Total | 359 (100.0%) | 84 (100.0%) |
Physical Housing Characteristics in Irwindale
Housing Structures in Irwindale
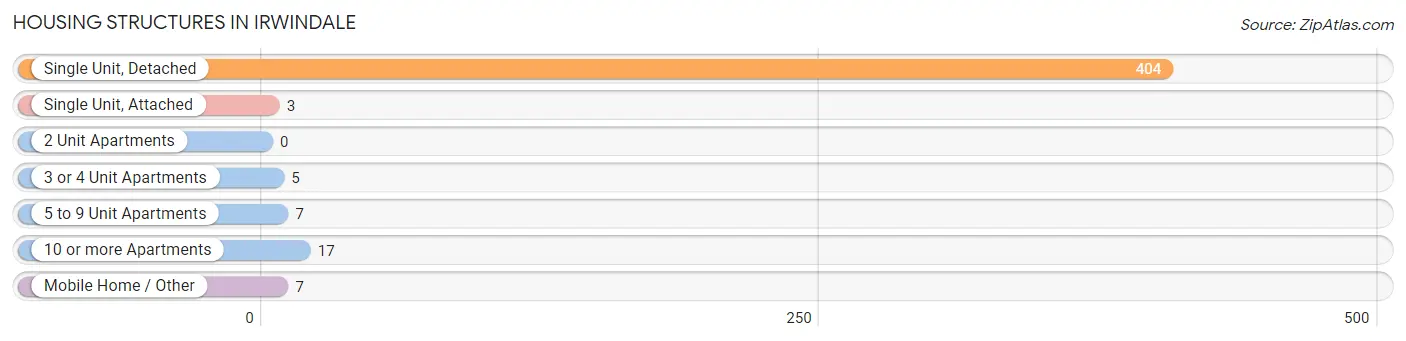
| Structure Type | # Housing Units | % Housing Units |
| Single Unit, Detached | 404 | 91.2% |
| Single Unit, Attached | 3 | 0.7% |
| 2 Unit Apartments | 0 | 0.0% |
| 3 or 4 Unit Apartments | 5 | 1.1% |
| 5 to 9 Unit Apartments | 7 | 1.6% |
| 10 or more Apartments | 17 | 3.8% |
| Mobile Home / Other | 7 | 1.6% |
| Total | 443 | 100.0% |
Housing Structures by Occupancy in Irwindale
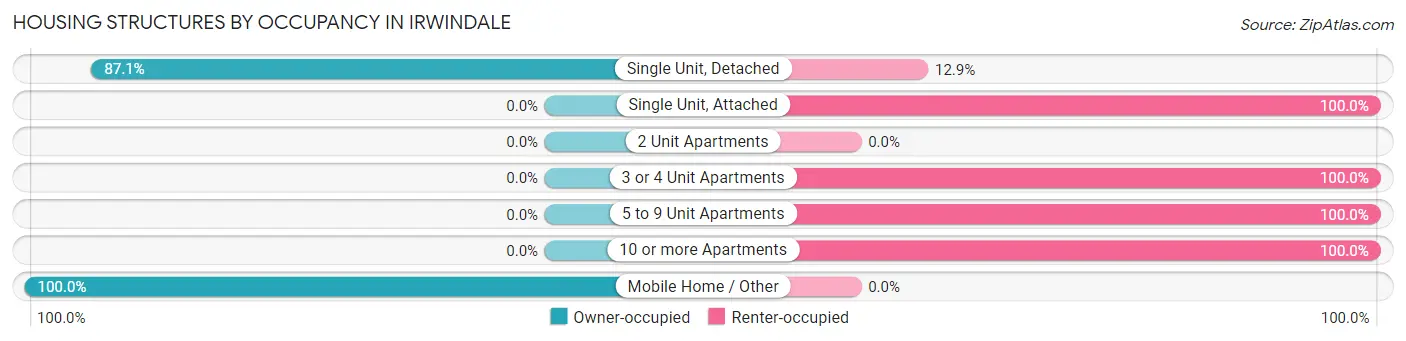
| Structure Type | Owner-occupied | Renter-occupied |
| Single Unit, Detached | 352 (87.1%) | 52 (12.9%) |
| Single Unit, Attached | 0 (0.0%) | 3 (100.0%) |
| 2 Unit Apartments | 0 (0.0%) | 0 (0.0%) |
| 3 or 4 Unit Apartments | 0 (0.0%) | 5 (100.0%) |
| 5 to 9 Unit Apartments | 0 (0.0%) | 7 (100.0%) |
| 10 or more Apartments | 0 (0.0%) | 17 (100.0%) |
| Mobile Home / Other | 7 (100.0%) | 0 (0.0%) |
| Total | 359 (81.0%) | 84 (19.0%) |
Housing Structures by Number of Rooms in Irwindale
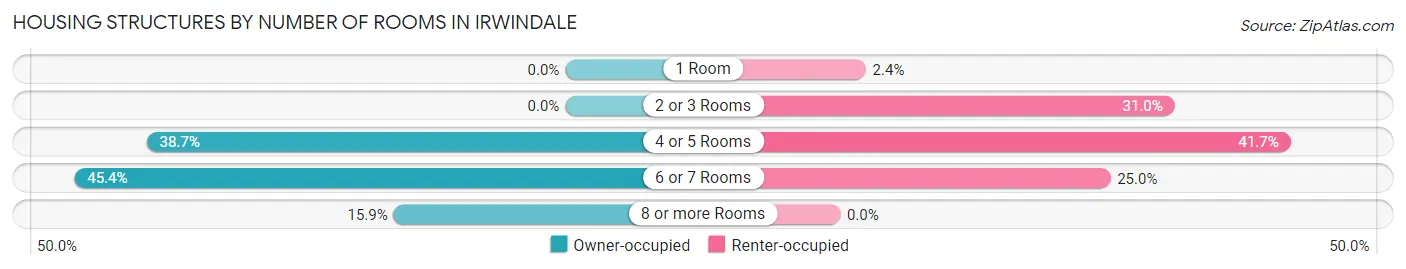
| Number of Rooms | Owner-occupied | Renter-occupied |
| 1 Room | 0 (0.0%) | 2 (2.4%) |
| 2 or 3 Rooms | 0 (0.0%) | 26 (30.9%) |
| 4 or 5 Rooms | 139 (38.7%) | 35 (41.7%) |
| 6 or 7 Rooms | 163 (45.4%) | 21 (25.0%) |
| 8 or more Rooms | 57 (15.9%) | 0 (0.0%) |
| Total | 359 (100.0%) | 84 (100.0%) |
Housing Structure by Heating Type in Irwindale
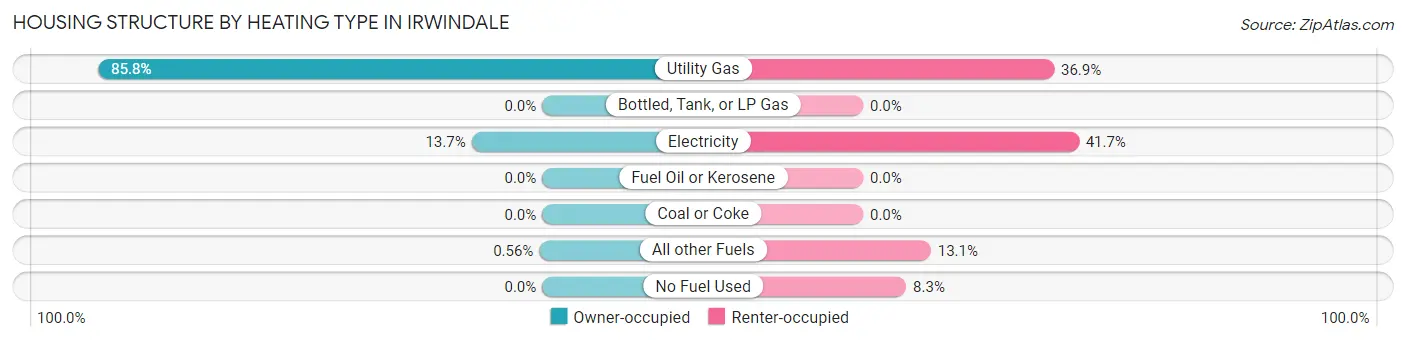
| Heating Type | Owner-occupied | Renter-occupied |
| Utility Gas | 308 (85.8%) | 31 (36.9%) |
| Bottled, Tank, or LP Gas | 0 (0.0%) | 0 (0.0%) |
| Electricity | 49 (13.7%) | 35 (41.7%) |
| Fuel Oil or Kerosene | 0 (0.0%) | 0 (0.0%) |
| Coal or Coke | 0 (0.0%) | 0 (0.0%) |
| All other Fuels | 2 (0.6%) | 11 (13.1%) |
| No Fuel Used | 0 (0.0%) | 7 (8.3%) |
| Total | 359 (100.0%) | 84 (100.0%) |
Household Vehicle Usage in Irwindale
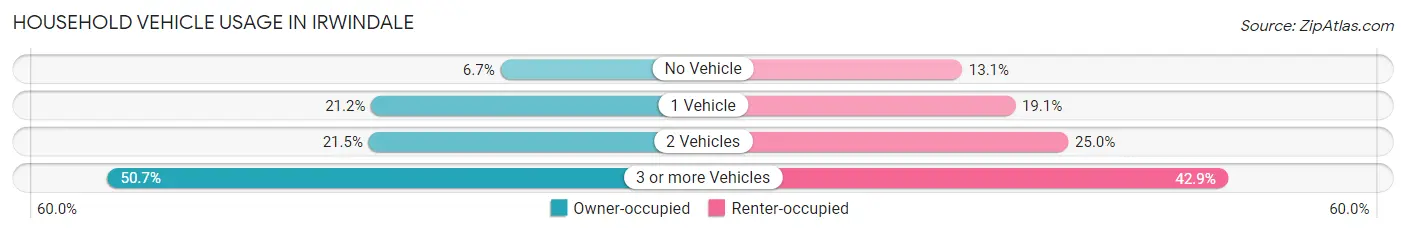
| Vehicles per Household | Owner-occupied | Renter-occupied |
| No Vehicle | 24 (6.7%) | 11 (13.1%) |
| 1 Vehicle | 76 (21.2%) | 16 (19.1%) |
| 2 Vehicles | 77 (21.4%) | 21 (25.0%) |
| 3 or more Vehicles | 182 (50.7%) | 36 (42.9%) |
| Total | 359 (100.0%) | 84 (100.0%) |
Real Estate & Mortgages in Irwindale
Real Estate and Mortgage Overview in Irwindale
| Characteristic | Without Mortgage | With Mortgage |
| Housing Units | 118 | 241 |
| Median Property Value | $611,100 | $599,500 |
| Median Household Income | $66,333 | $86 |
| Monthly Housing Costs | $585 | $40 |
| Real Estate Taxes | $2,133 | $0 |
Property Value by Mortgage Status in Irwindale
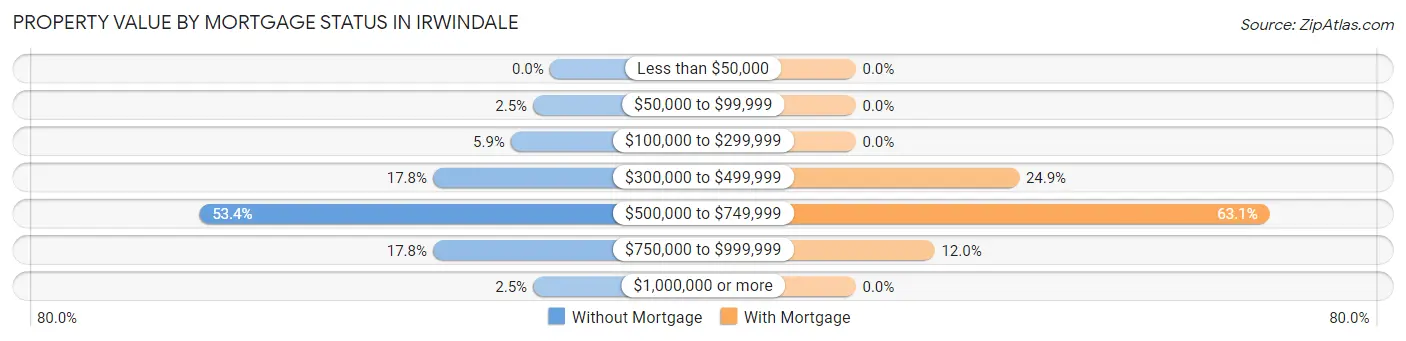
| Property Value | Without Mortgage | With Mortgage |
| Less than $50,000 | 0 (0.0%) | 0 (0.0%) |
| $50,000 to $99,999 | 3 (2.5%) | 0 (0.0%) |
| $100,000 to $299,999 | 7 (5.9%) | 0 (0.0%) |
| $300,000 to $499,999 | 21 (17.8%) | 60 (24.9%) |
| $500,000 to $749,999 | 63 (53.4%) | 152 (63.1%) |
| $750,000 to $999,999 | 21 (17.8%) | 29 (12.0%) |
| $1,000,000 or more | 3 (2.5%) | 0 (0.0%) |
| Total | 118 (100.0%) | 241 (100.0%) |
Household Income by Mortgage Status in Irwindale
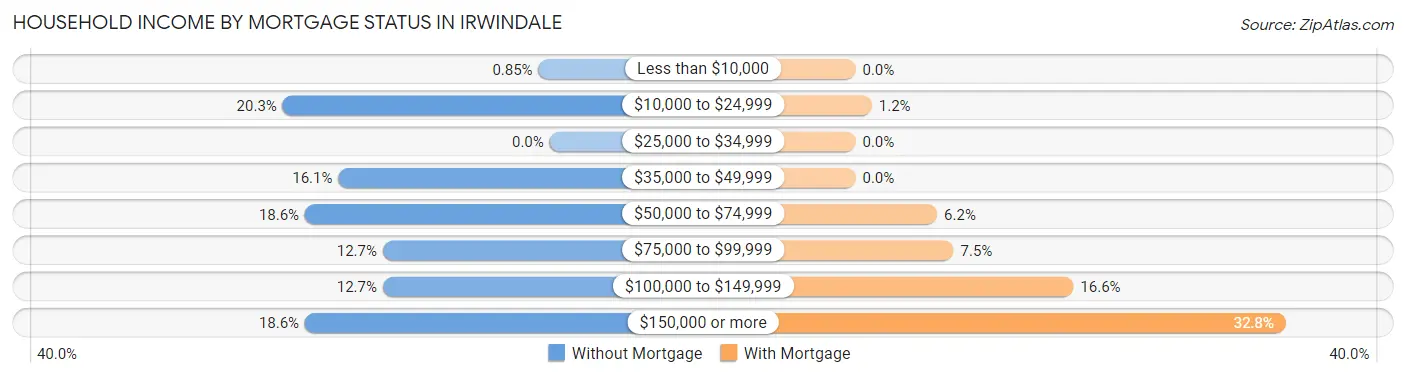
| Household Income | Without Mortgage | With Mortgage |
| Less than $10,000 | 1 (0.9%) | 0 (0.0%) |
| $10,000 to $24,999 | 24 (20.3%) | 3 (1.2%) |
| $25,000 to $34,999 | 0 (0.0%) | 0 (0.0%) |
| $35,000 to $49,999 | 19 (16.1%) | 0 (0.0%) |
| $50,000 to $74,999 | 22 (18.6%) | 15 (6.2%) |
| $75,000 to $99,999 | 15 (12.7%) | 18 (7.5%) |
| $100,000 to $149,999 | 15 (12.7%) | 40 (16.6%) |
| $150,000 or more | 22 (18.6%) | 79 (32.8%) |
| Total | 118 (100.0%) | 241 (100.0%) |
Property Value to Household Income Ratio in Irwindale
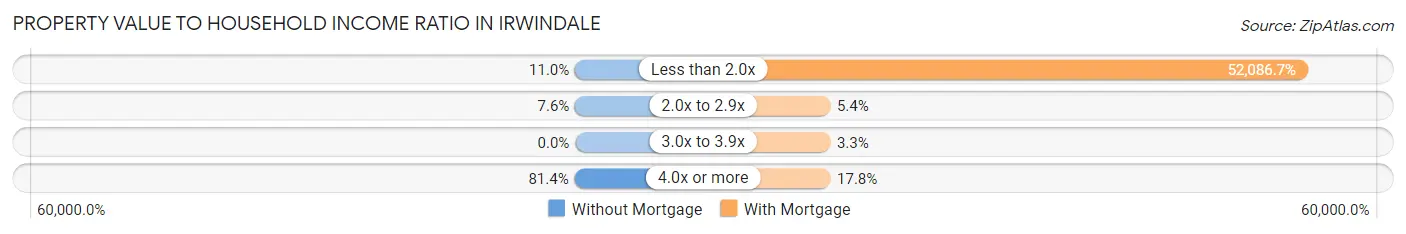
| Value-to-Income Ratio | Without Mortgage | With Mortgage |
| Less than 2.0x | 13 (11.0%) | 125,529 (52,086.7%) |
| 2.0x to 2.9x | 9 (7.6%) | 13 (5.4%) |
| 3.0x to 3.9x | 0 (0.0%) | 8 (3.3%) |
| 4.0x or more | 96 (81.4%) | 43 (17.8%) |
| Total | 118 (100.0%) | 241 (100.0%) |
Real Estate Taxes by Mortgage Status in Irwindale
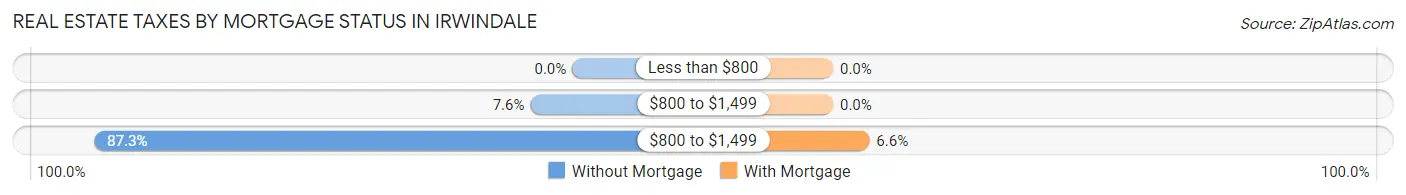
| Property Taxes | Without Mortgage | With Mortgage |
| Less than $800 | 0 (0.0%) | 0 (0.0%) |
| $800 to $1,499 | 9 (7.6%) | 0 (0.0%) |
| $800 to $1,499 | 103 (87.3%) | 16 (6.6%) |
| Total | 118 (100.0%) | 241 (100.0%) |
Health & Disability in Irwindale
Health Insurance Coverage by Age in Irwindale
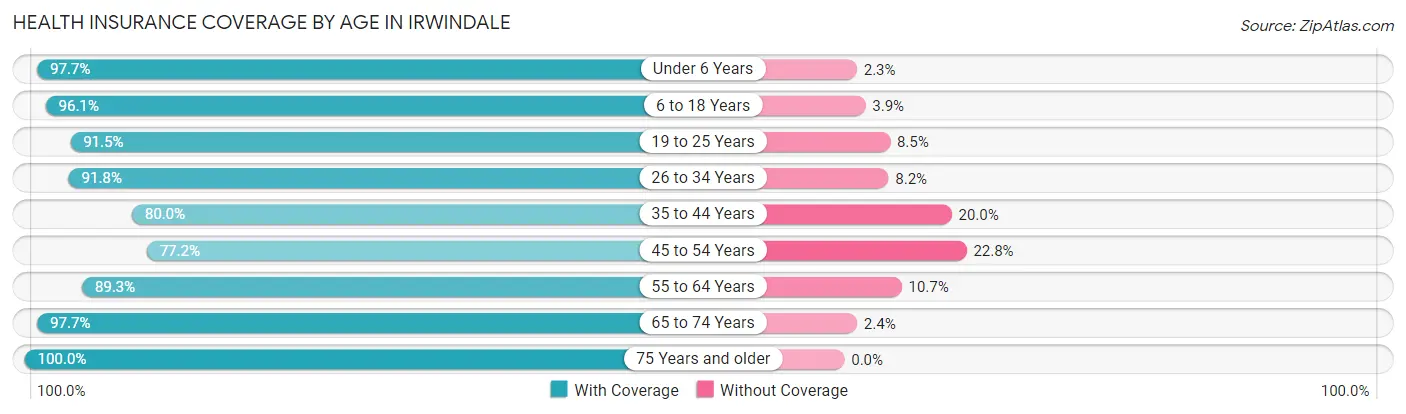
| Age Bracket | With Coverage | Without Coverage |
| Under 6 Years | 84 (97.7%) | 2 (2.3%) |
| 6 to 18 Years | 196 (96.1%) | 8 (3.9%) |
| 19 to 25 Years | 129 (91.5%) | 12 (8.5%) |
| 26 to 34 Years | 257 (91.8%) | 23 (8.2%) |
| 35 to 44 Years | 100 (80.0%) | 25 (20.0%) |
| 45 to 54 Years | 122 (77.2%) | 36 (22.8%) |
| 55 to 64 Years | 92 (89.3%) | 11 (10.7%) |
| 65 to 74 Years | 83 (97.7%) | 2 (2.4%) |
| 75 Years and older | 161 (100.0%) | 0 (0.0%) |
| Total | 1,224 (91.1%) | 119 (8.9%) |
Health Insurance Coverage by Citizenship Status in Irwindale
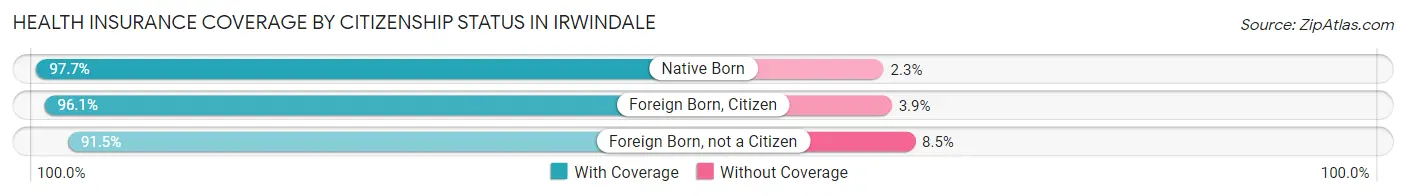
| Citizenship Status | With Coverage | Without Coverage |
| Native Born | 84 (97.7%) | 2 (2.3%) |
| Foreign Born, Citizen | 196 (96.1%) | 8 (3.9%) |
| Foreign Born, not a Citizen | 129 (91.5%) | 12 (8.5%) |
Health Insurance Coverage by Household Income in Irwindale
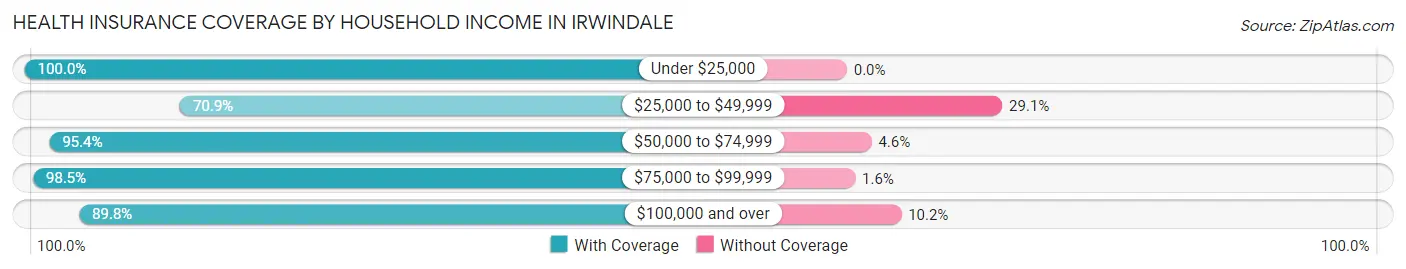
| Household Income | With Coverage | Without Coverage |
| Under $25,000 | 87 (100.0%) | 0 (0.0%) |
| $25,000 to $49,999 | 56 (70.9%) | 23 (29.1%) |
| $50,000 to $74,999 | 124 (95.4%) | 6 (4.6%) |
| $75,000 to $99,999 | 190 (98.5%) | 3 (1.5%) |
| $100,000 and over | 767 (89.8%) | 87 (10.2%) |
Public vs Private Health Insurance Coverage by Age in Irwindale
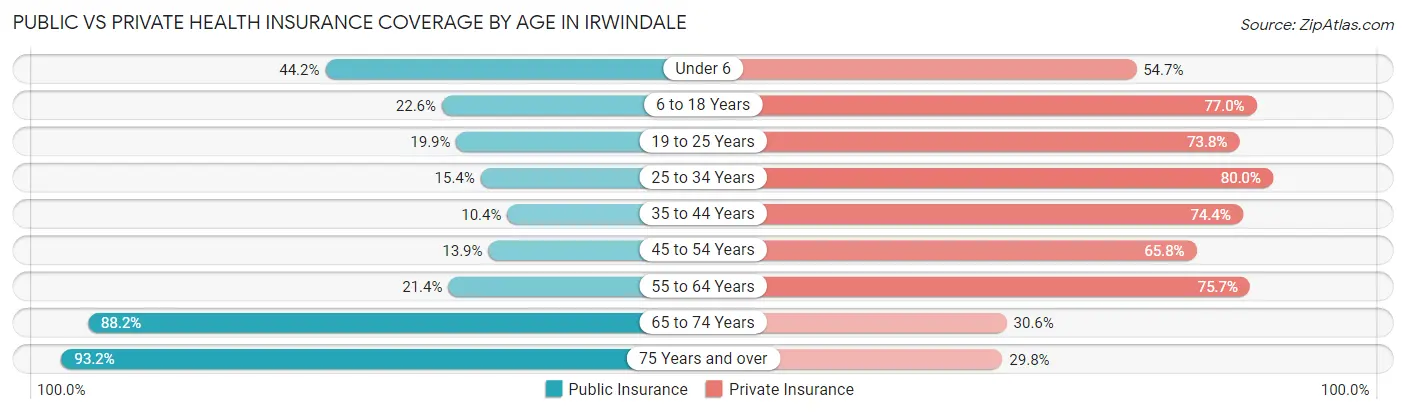
| Age Bracket | Public Insurance | Private Insurance |
| Under 6 | 38 (44.2%) | 47 (54.6%) |
| 6 to 18 Years | 46 (22.6%) | 157 (77.0%) |
| 19 to 25 Years | 28 (19.9%) | 104 (73.8%) |
| 25 to 34 Years | 43 (15.4%) | 224 (80.0%) |
| 35 to 44 Years | 13 (10.4%) | 93 (74.4%) |
| 45 to 54 Years | 22 (13.9%) | 104 (65.8%) |
| 55 to 64 Years | 22 (21.4%) | 78 (75.7%) |
| 65 to 74 Years | 75 (88.2%) | 26 (30.6%) |
| 75 Years and over | 150 (93.2%) | 48 (29.8%) |
| Total | 437 (32.5%) | 881 (65.6%) |
Disability Status by Sex by Age in Irwindale
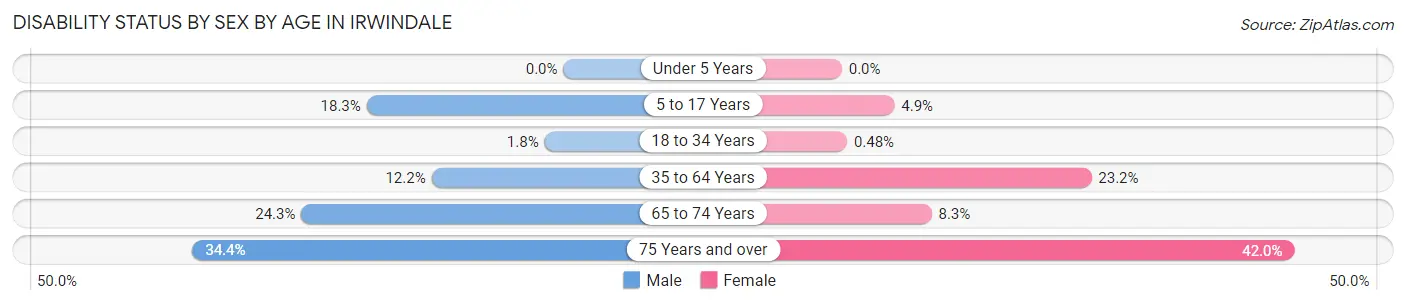
| Age Bracket | Male | Female |
| Under 5 Years | 0 (0.0%) | 0 (0.0%) |
| 5 to 17 Years | 21 (18.3%) | 4 (4.9%) |
| 18 to 34 Years | 4 (1.8%) | 1 (0.5%) |
| 35 to 64 Years | 24 (12.2%) | 44 (23.2%) |
| 65 to 74 Years | 9 (24.3%) | 4 (8.3%) |
| 75 Years and over | 21 (34.4%) | 42 (42.0%) |
Disability Class by Sex by Age in Irwindale
Disability Class: Hearing Difficulty
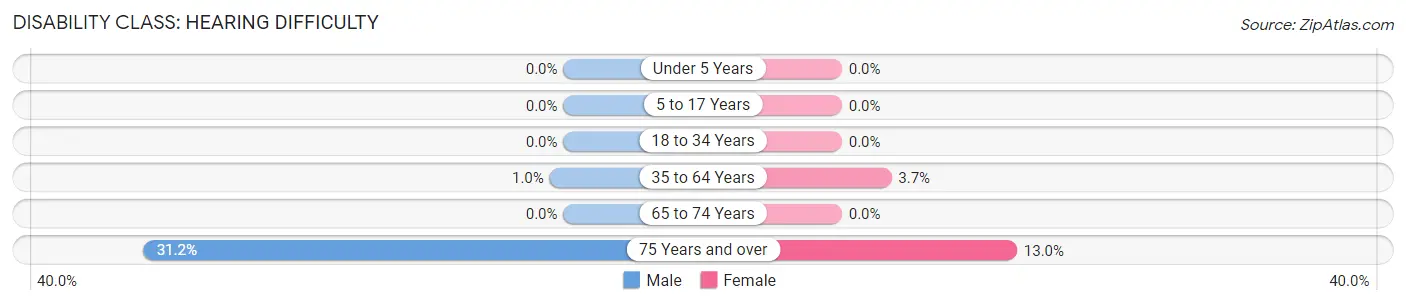
| Age Bracket | Male | Female |
| Under 5 Years | 0 (0.0%) | 0 (0.0%) |
| 5 to 17 Years | 0 (0.0%) | 0 (0.0%) |
| 18 to 34 Years | 0 (0.0%) | 0 (0.0%) |
| 35 to 64 Years | 2 (1.0%) | 7 (3.7%) |
| 65 to 74 Years | 0 (0.0%) | 0 (0.0%) |
| 75 Years and over | 19 (31.1%) | 13 (13.0%) |
Disability Class: Vision Difficulty
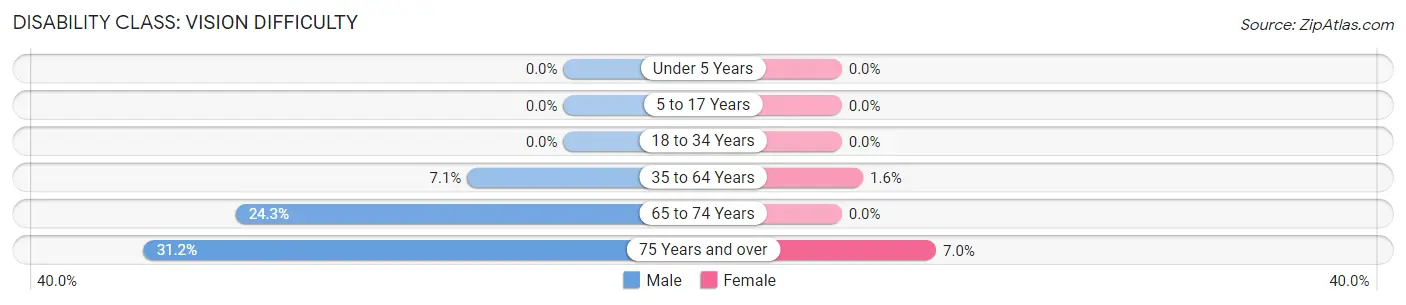
| Age Bracket | Male | Female |
| Under 5 Years | 0 (0.0%) | 0 (0.0%) |
| 5 to 17 Years | 0 (0.0%) | 0 (0.0%) |
| 18 to 34 Years | 0 (0.0%) | 0 (0.0%) |
| 35 to 64 Years | 14 (7.1%) | 3 (1.6%) |
| 65 to 74 Years | 9 (24.3%) | 0 (0.0%) |
| 75 Years and over | 19 (31.1%) | 7 (7.0%) |
Disability Class: Cognitive Difficulty
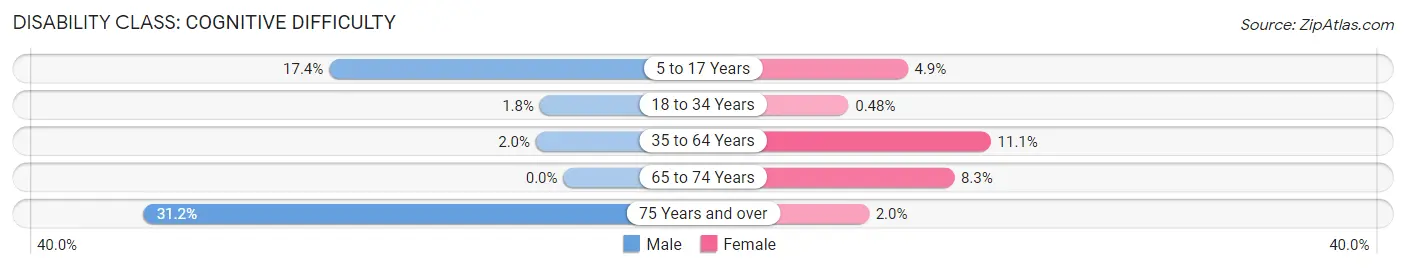
| Age Bracket | Male | Female |
| 5 to 17 Years | 20 (17.4%) | 4 (4.9%) |
| 18 to 34 Years | 4 (1.8%) | 1 (0.5%) |
| 35 to 64 Years | 4 (2.0%) | 21 (11.1%) |
| 65 to 74 Years | 0 (0.0%) | 4 (8.3%) |
| 75 Years and over | 19 (31.1%) | 2 (2.0%) |
Disability Class: Ambulatory Difficulty
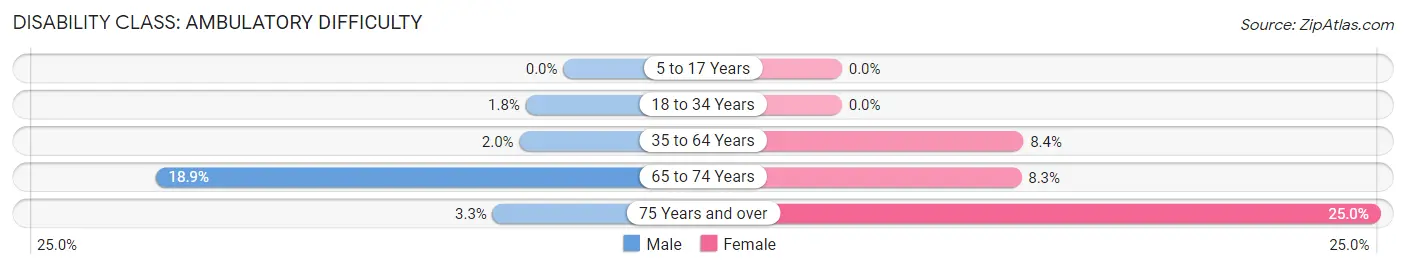
| Age Bracket | Male | Female |
| 5 to 17 Years | 0 (0.0%) | 0 (0.0%) |
| 18 to 34 Years | 4 (1.8%) | 0 (0.0%) |
| 35 to 64 Years | 4 (2.0%) | 16 (8.4%) |
| 65 to 74 Years | 7 (18.9%) | 4 (8.3%) |
| 75 Years and over | 2 (3.3%) | 25 (25.0%) |
Disability Class: Self-Care Difficulty
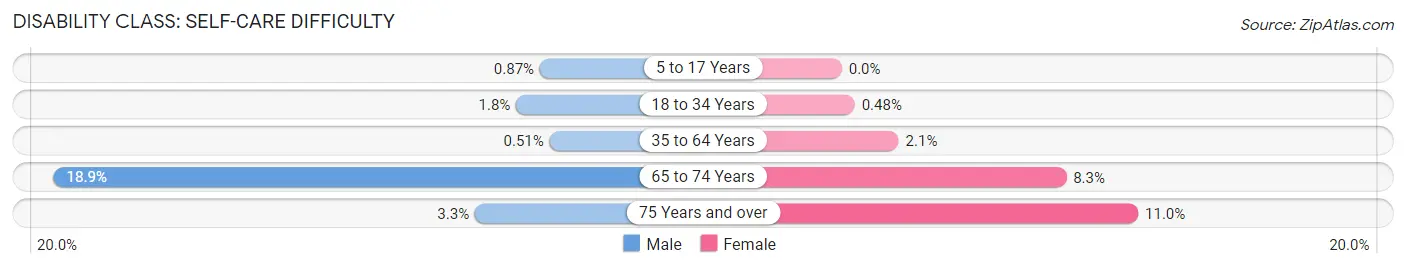
| Age Bracket | Male | Female |
| 5 to 17 Years | 1 (0.9%) | 0 (0.0%) |
| 18 to 34 Years | 4 (1.8%) | 1 (0.5%) |
| 35 to 64 Years | 1 (0.5%) | 4 (2.1%) |
| 65 to 74 Years | 7 (18.9%) | 4 (8.3%) |
| 75 Years and over | 2 (3.3%) | 11 (11.0%) |
Technology Access in Irwindale
Computing Device Access in Irwindale
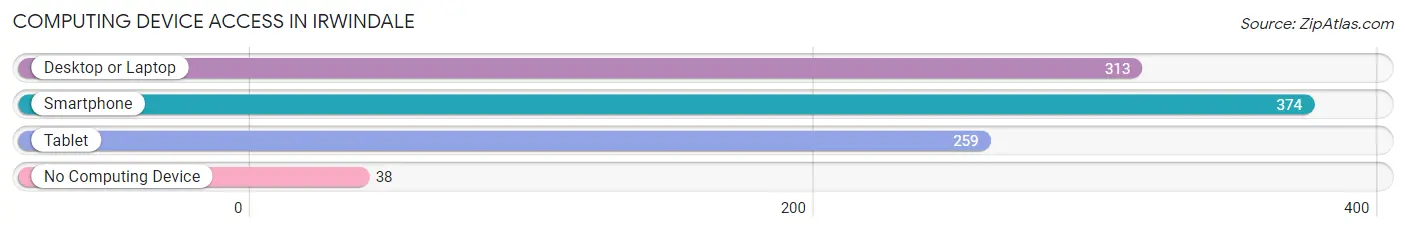
| Device Type | # Households | % Households |
| Desktop or Laptop | 313 | 70.7% |
| Smartphone | 374 | 84.4% |
| Tablet | 259 | 58.5% |
| No Computing Device | 38 | 8.6% |
| Total | 443 | 100.0% |
Internet Access in Irwindale
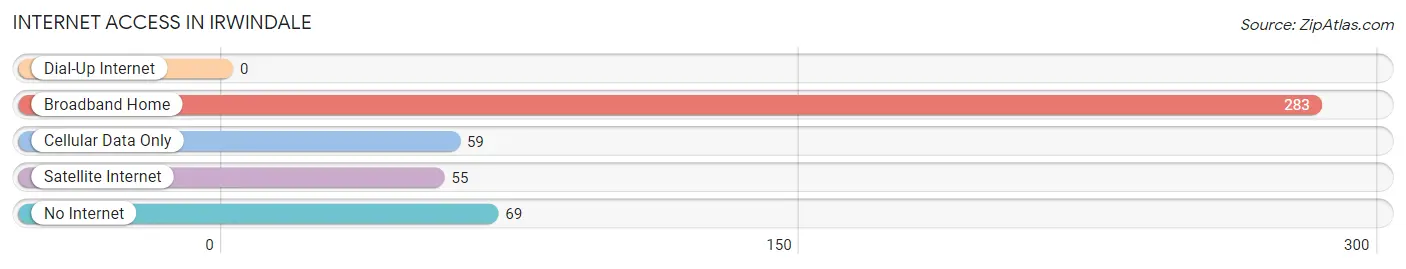
| Internet Type | # Households | % Households |
| Dial-Up Internet | 0 | 0.0% |
| Broadband Home | 283 | 63.9% |
| Cellular Data Only | 59 | 13.3% |
| Satellite Internet | 55 | 12.4% |
| No Internet | 69 | 15.6% |
| Total | 443 | 100.0% |
Irwindale Summary
Irwindale, California is a small city located in the San Gabriel Valley of Los Angeles County. It is bordered by the cities of Azusa, Baldwin Park, and Duarte. The city was incorporated in 1957 and has a population of 1,422 as of the 2010 census.
History
The area that is now Irwindale was originally inhabited by the Tongva Native American tribe. The first Europeans to settle in the area were the Spanish, who established the San Gabriel Mission in 1771. The area was later part of the Rancho Azusa de Dalton land grant. In the late 19th century, the area was used for farming and ranching.
In 1957, the area was incorporated as the City of Irwindale. The city was named after the nearby Irwindale Oil Field, which was discovered in the late 19th century. The city was initially a small agricultural community, but it began to grow in the 1960s and 1970s as the population of Los Angeles County increased.
Geography
Irwindale is located in the San Gabriel Valley of Los Angeles County. It is bordered by the cities of Azusa, Baldwin Park, and Duarte. The city has a total area of 1.7 square miles, all of which is land. The city is located at an elevation of 645 feet.
The city is located in the San Gabriel Valley, which is a large alluvial plain. The San Gabriel River runs through the city, and the San Gabriel Mountains are located to the north. The climate in Irwindale is Mediterranean, with hot, dry summers and mild, wet winters.
Economy
The economy of Irwindale is largely based on manufacturing and distribution. The city is home to several large industrial and distribution centers, including the Irwindale Business Park and the Irwindale Speedway. The city is also home to several large companies, including the Miller Brewing Company, the Huy Fong Foods Sriracha Hot Sauce factory, and the San Gabriel Valley Newspaper Group.
Demographics
As of the 2010 census, there were 1,422 people, 463 households, and 369 families living in Irwindale. The population density was 837.3 people per square mile. The racial makeup of the city was 63.2% White, 0.7% African American, 0.7% Native American, 0.7% Asian, 0.1% Pacific Islander, 32.2% from other races, and 2.4% from two or more races. Hispanic or Latino of any race were 81.2% of the population.
The median income for a household in Irwindale was $45,938, and the median income for a family was $50,000. The per capita income for the city was $17,945. About 11.2% of families and 13.3% of the population were below the poverty line, including 17.2% of those under age 18 and 8.3% of those age 65 or over.
Common Questions
What is Per Capita Income in Irwindale?
Per Capita income in Irwindale is $42,766.
What is the Median Family Income in Irwindale?
Median Family Income in Irwindale is $115,750.
What is the Median Household income in Irwindale?
Median Household Income in Irwindale is $101,181.
What is Income or Wage Gap in Irwindale?
Income or Wage Gap in Irwindale is 36.5%.
Women in Irwindale earn 63.5 cents for every dollar earned by a man.
What is Inequality or Gini Index in Irwindale?
Inequality or Gini Index in Irwindale is 0.44.
What is the Total Population of Irwindale?
Total Population of Irwindale is 1,343.
What is the Total Male Population of Irwindale?
Total Male Population of Irwindale is 669.
What is the Total Female Population of Irwindale?
Total Female Population of Irwindale is 674.
What is the Ratio of Males per 100 Females in Irwindale?
There are 99.26 Males per 100 Females in Irwindale.
What is the Ratio of Females per 100 Males in Irwindale?
There are 100.75 Females per 100 Males in Irwindale.
What is the Median Population Age in Irwindale?
Median Population Age in Irwindale is 34.0 Years.
What is the Average Family Size in Irwindale
Average Family Size in Irwindale is 3.7 People.
What is the Average Household Size in Irwindale
Average Household Size in Irwindale is 3.0 People.
How Large is the Labor Force in Irwindale?
There are 728 People in the Labor Forcein in Irwindale.
What is the Percentage of People in the Labor Force in Irwindale?
65.6% of People are in the Labor Force in Irwindale.
What is the Unemployment Rate in Irwindale?
Unemployment Rate in Irwindale is 4.5%.