Hydesville, CA Map & Demographics
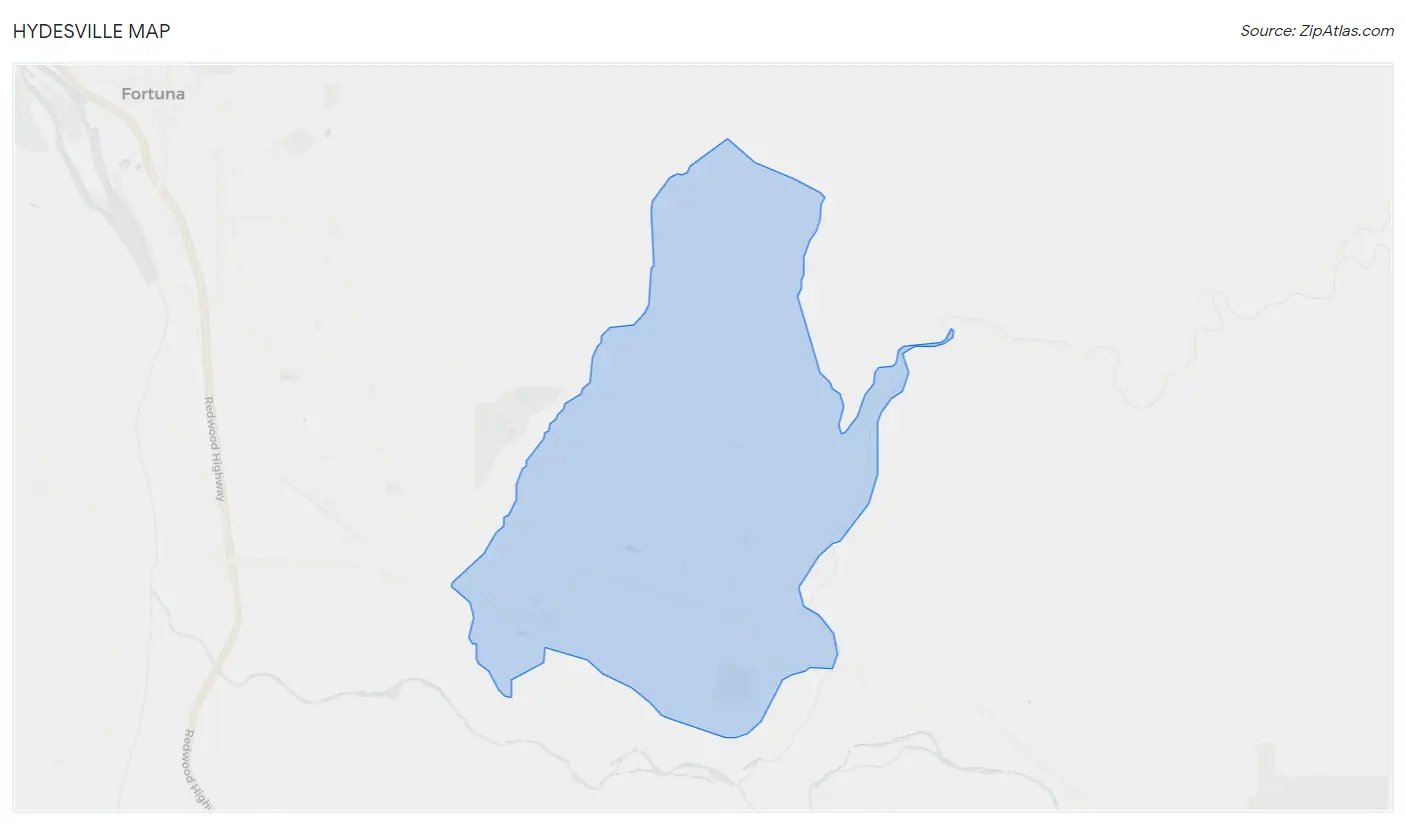
Hydesville Map
Hydesville Overview
$39,371
PER CAPITA INCOME
$87,500
AVG FAMILY INCOME
$62,500
AVG HOUSEHOLD INCOME
0.43
INEQUALITY / GINI INDEX
1,060
TOTAL POPULATION
563
MALE POPULATION
497
FEMALE POPULATION
113.28
MALES / 100 FEMALES
88.28
FEMALES / 100 MALES
58.0
MEDIAN AGE
2.8
AVG FAMILY SIZE
2.4
AVG HOUSEHOLD SIZE
394
LABOR FORCE [ PEOPLE ]
42.3%
PERCENT IN LABOR FORCE
Hydesville Zip Codes
Hydesville Area Codes
Income in Hydesville
Income Overview in Hydesville
Per Capita Income in Hydesville is $39,371, while median incomes of families and households are $87,500 and $62,500 respectively.
| Characteristic | Number | Measure |
| Per Capita Income | 1,060 | $39,371 |
| Median Family Income | 272 | $87,500 |
| Mean Family Income | 272 | $111,501 |
| Median Household Income | 446 | $62,500 |
| Mean Household Income | 446 | $89,344 |
| Income Deficit | 272 | $0 |
| Wage / Income Gap (%) | 1,060 | 0.00% |
| Wage / Income Gap ($) | 1,060 | 100.00¢ per $1 |
| Gini / Inequality Index | 1,060 | 0.43 |
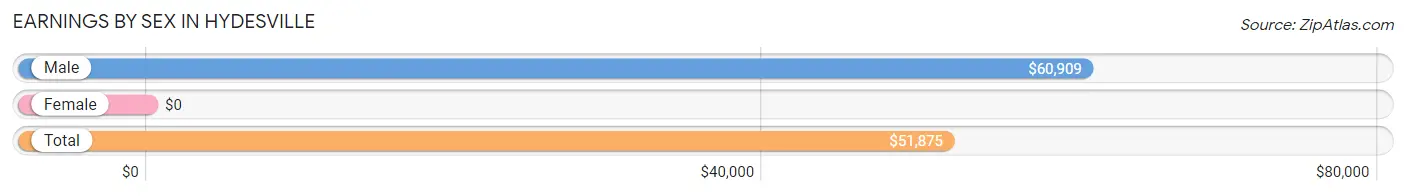
Earnings by Sex in Hydesville
| Sex | Number | Average Earnings |
| Male | 228 (52.2%) | $60,909 |
| Female | 209 (47.8%) | $0 |
| Total | 437 (100.0%) | $51,875 |
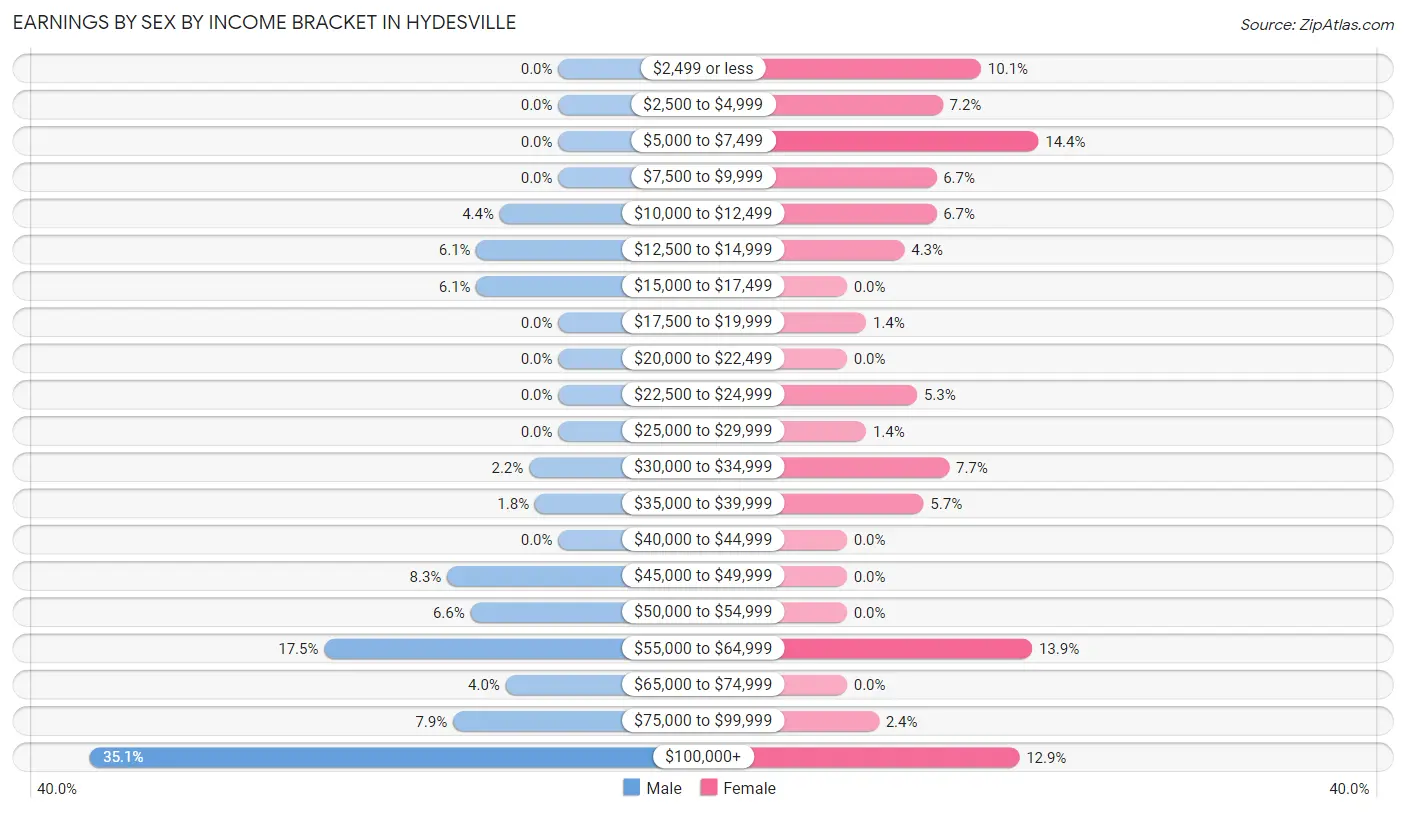
Earnings by Sex by Income Bracket in Hydesville
The most common earnings brackets in Hydesville are $100,000+ for men (80 | 35.1%) and $5,000 to $7,499 for women (30 | 14.3%).
| Income | Male | Female |
| $2,499 or less | 0 (0.0%) | 21 (10.1%) |
| $2,500 to $4,999 | 0 (0.0%) | 15 (7.2%) |
| $5,000 to $7,499 | 0 (0.0%) | 30 (14.3%) |
| $7,500 to $9,999 | 0 (0.0%) | 14 (6.7%) |
| $10,000 to $12,499 | 10 (4.4%) | 14 (6.7%) |
| $12,500 to $14,999 | 14 (6.1%) | 9 (4.3%) |
| $15,000 to $17,499 | 14 (6.1%) | 0 (0.0%) |
| $17,500 to $19,999 | 0 (0.0%) | 3 (1.4%) |
| $20,000 to $22,499 | 0 (0.0%) | 0 (0.0%) |
| $22,500 to $24,999 | 0 (0.0%) | 11 (5.3%) |
| $25,000 to $29,999 | 0 (0.0%) | 3 (1.4%) |
| $30,000 to $34,999 | 5 (2.2%) | 16 (7.7%) |
| $35,000 to $39,999 | 4 (1.8%) | 12 (5.7%) |
| $40,000 to $44,999 | 0 (0.0%) | 0 (0.0%) |
| $45,000 to $49,999 | 19 (8.3%) | 0 (0.0%) |
| $50,000 to $54,999 | 15 (6.6%) | 0 (0.0%) |
| $55,000 to $64,999 | 40 (17.5%) | 29 (13.9%) |
| $65,000 to $74,999 | 9 (4.0%) | 0 (0.0%) |
| $75,000 to $99,999 | 18 (7.9%) | 5 (2.4%) |
| $100,000+ | 80 (35.1%) | 27 (12.9%) |
| Total | 228 (100.0%) | 209 (100.0%) |
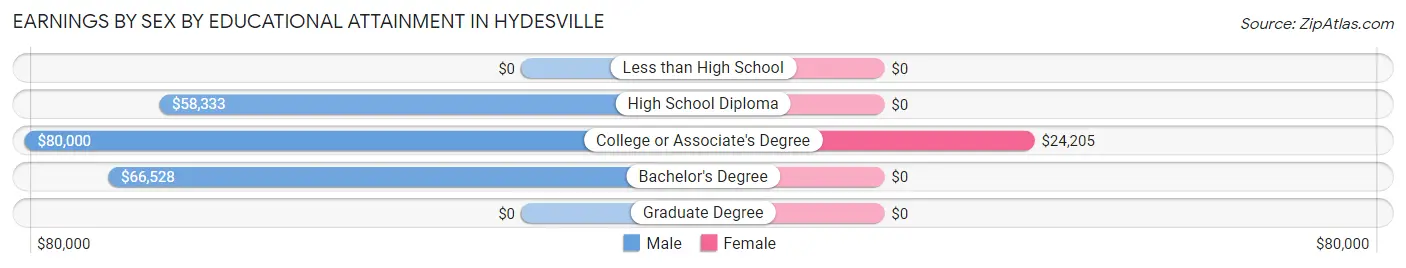
Earnings by Sex by Educational Attainment in Hydesville
Average earnings in Hydesville are $60,909 for men and $24,545 for women, a difference of 59.7%. Men with an educational attainment of college or associate's degree enjoy the highest average annual earnings of $80,000, while those with high school diploma education earn the least with $58,333. Women with an educational attainment of college or associate's degree earn the most with the average annual earnings of $24,205, while those with college or associate's degree education have the smallest earnings of $24,205.
| Educational Attainment | Male Income | Female Income |
| Less than High School | - | - |
| High School Diploma | $58,333 | $0 |
| College or Associate's Degree | $80,000 | $24,205 |
| Bachelor's Degree | $66,528 | $0 |
| Graduate Degree | - | - |
| Total | $60,909 | $24,545 |
Family Income in Hydesville
Family Income Brackets in Hydesville
According to the Hydesville family income data, there are 59 families falling into the $50,000 to $74,999 income range, which is the most common income bracket and makes up 21.7% of all families.
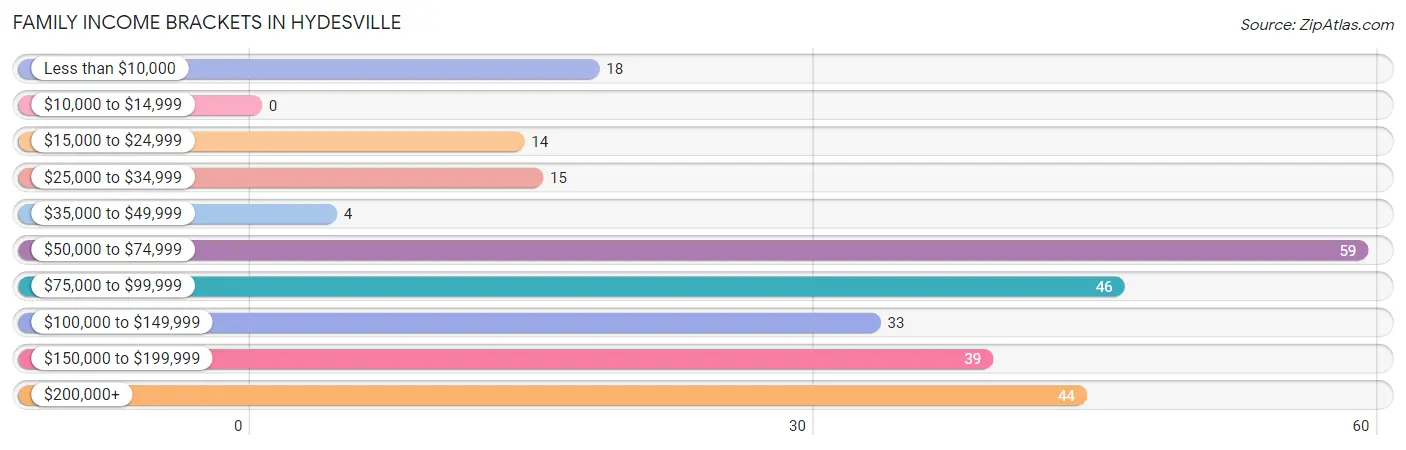
| Income Bracket | # Families | % Families |
| Less than $10,000 | 18 | 6.6% |
| $10,000 to $14,999 | 0 | 0.0% |
| $15,000 to $24,999 | 14 | 5.1% |
| $25,000 to $34,999 | 15 | 5.5% |
| $35,000 to $49,999 | 4 | 1.5% |
| $50,000 to $74,999 | 59 | 21.7% |
| $75,000 to $99,999 | 46 | 16.9% |
| $100,000 to $149,999 | 33 | 12.1% |
| $150,000 to $199,999 | 39 | 14.3% |
| $200,000+ | 44 | 16.2% |
Family Income by Famaliy Size in Hydesville
4-person families (54 | 19.9%) account for the highest median family income in Hydesville with $190,769 per family, while 4-person families (54 | 19.9%) have the highest median income of $47,692 per family member.
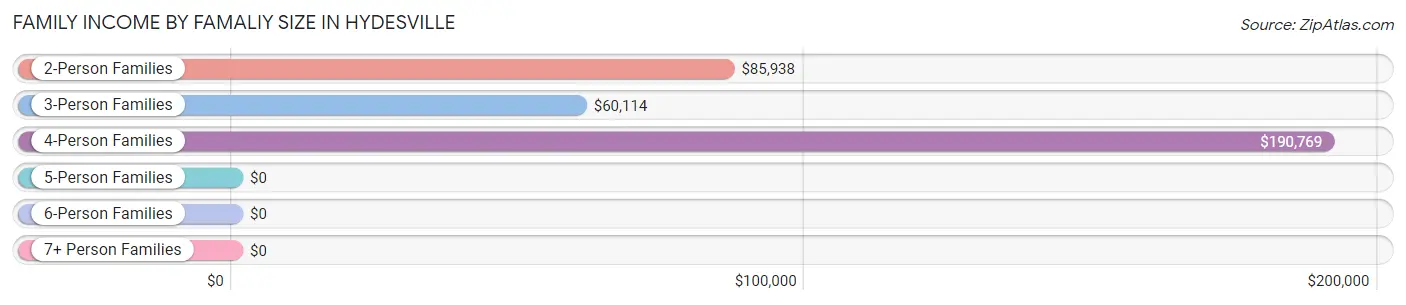
| Income Bracket | # Families | Median Income |
| 2-Person Families | 177 (65.1%) | $85,938 |
| 3-Person Families | 27 (9.9%) | $60,114 |
| 4-Person Families | 54 (19.9%) | $190,769 |
| 5-Person Families | 9 (3.3%) | $0 |
| 6-Person Families | 5 (1.8%) | $0 |
| 7+ Person Families | 0 (0.0%) | $0 |
| Total | 272 (100.0%) | $87,500 |
Family Income by Number of Earners in Hydesville
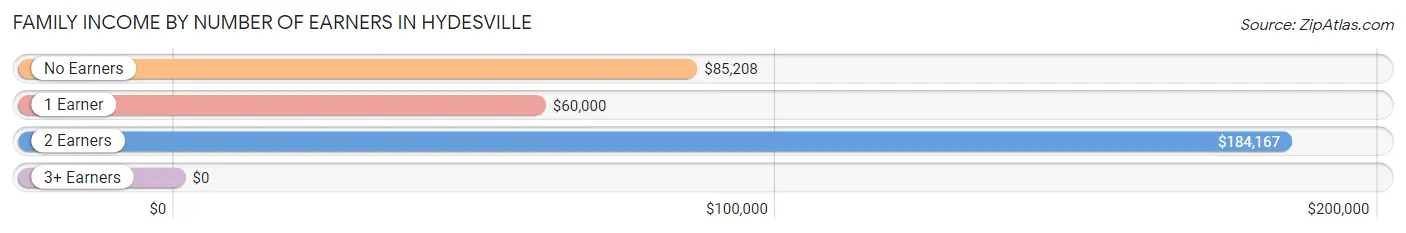
| Number of Earners | # Families | Median Income |
| No Earners | 104 (38.2%) | $85,208 |
| 1 Earner | 94 (34.6%) | $60,000 |
| 2 Earners | 50 (18.4%) | $184,167 |
| 3+ Earners | 24 (8.8%) | $0 |
| Total | 272 (100.0%) | $87,500 |
Household Income in Hydesville
Household Income Brackets in Hydesville
With 112 households falling in the category, the $50,000 to $74,999 income range is the most frequent in Hydesville, accounting for 25.1% of all households. In contrast, only 10 households (2.2%) fall into the $10,000 to $14,999 income bracket, making it the least populous group.
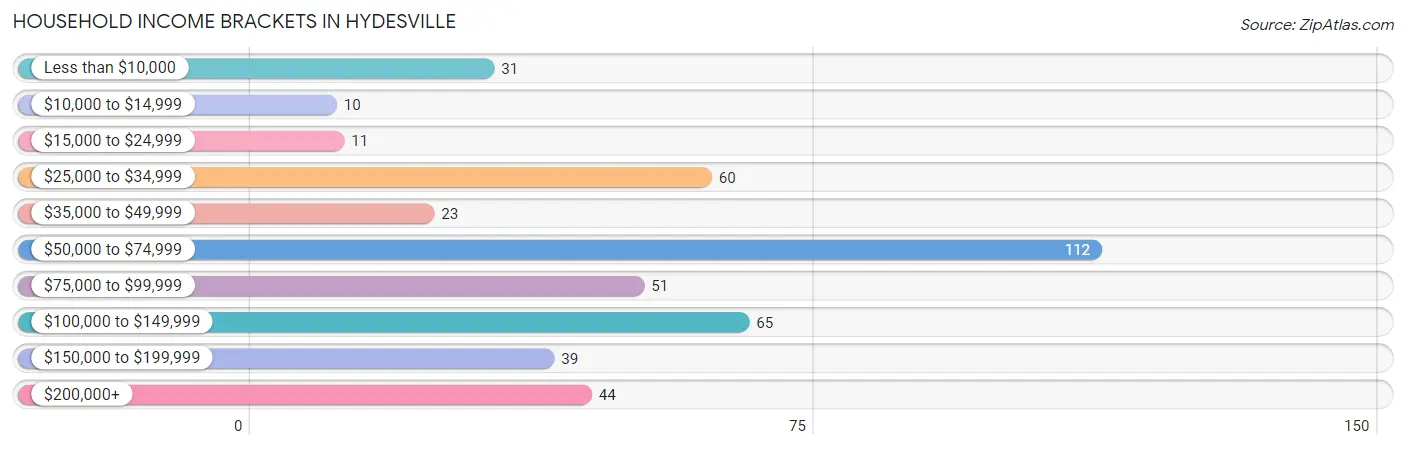
| Income Bracket | # Households | % Households |
| Less than $10,000 | 31 | 7.0% |
| $10,000 to $14,999 | 10 | 2.2% |
| $15,000 to $24,999 | 11 | 2.5% |
| $25,000 to $34,999 | 60 | 13.5% |
| $35,000 to $49,999 | 23 | 5.2% |
| $50,000 to $74,999 | 112 | 25.1% |
| $75,000 to $99,999 | 51 | 11.4% |
| $100,000 to $149,999 | 65 | 14.6% |
| $150,000 to $199,999 | 39 | 8.7% |
| $200,000+ | 44 | 9.9% |
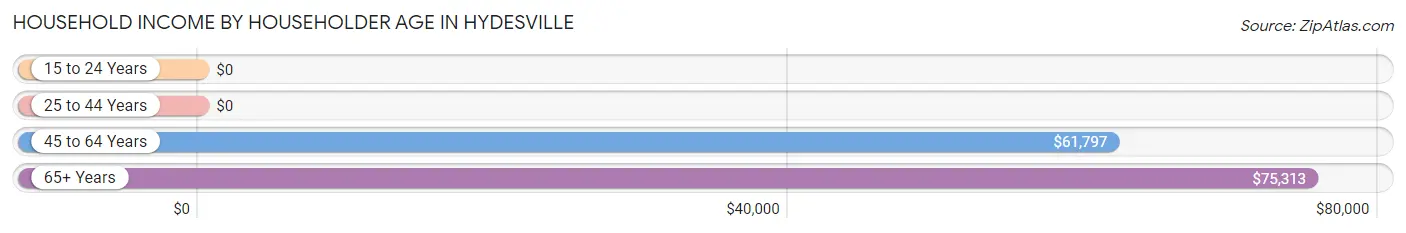
Household Income by Householder Age in Hydesville
The median household income in Hydesville is $62,500, with the highest median household income of $75,313 found in the 65+ years age bracket for the primary householder. A total of 127 households (28.5%) fall into this category.
| Income Bracket | # Households | Median Income |
| 15 to 24 Years | 0 (0.0%) | $0 |
| 25 to 44 Years | 42 (9.4%) | $0 |
| 45 to 64 Years | 277 (62.1%) | $61,797 |
| 65+ Years | 127 (28.5%) | $75,313 |
| Total | 446 (100.0%) | $62,500 |
Poverty in Hydesville
Income Below Poverty by Sex and Age in Hydesville
With 25.9% poverty level for males and 11.5% for females among the residents of Hydesville, under 5 year old males and under 5 year old females are the most vulnerable to poverty, with 13 males (100.0%) and 5 females (41.7%) in their respective age groups living below the poverty level.
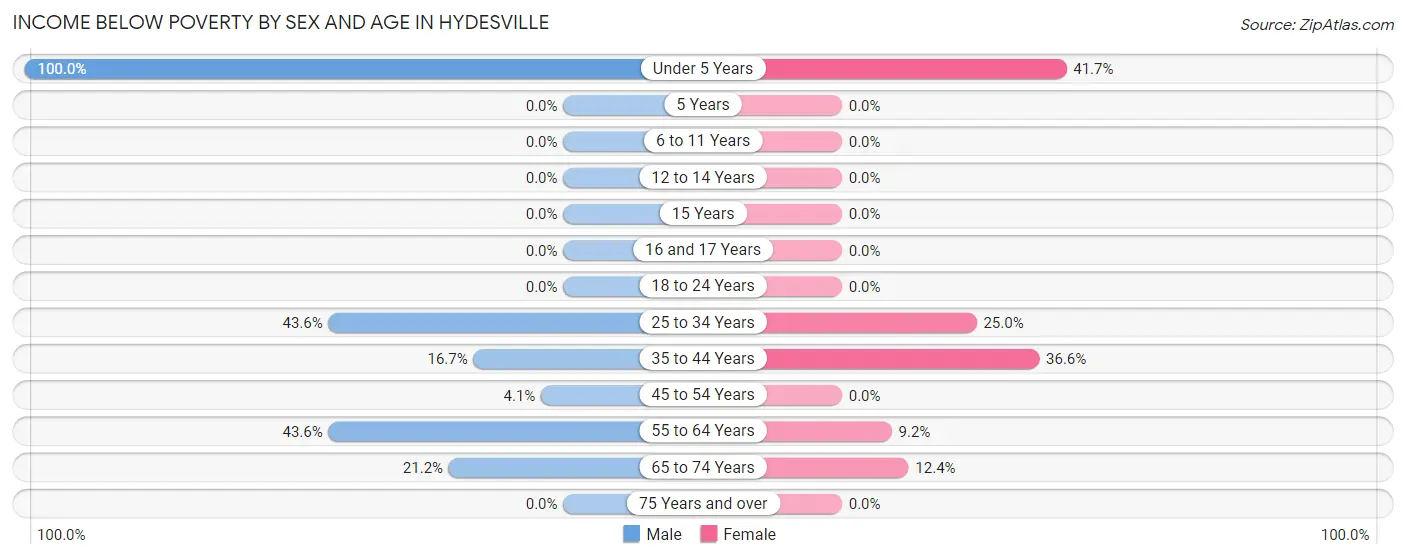
| Age Bracket | Male | Female |
| Under 5 Years | 13 (100.0%) | 5 (41.7%) |
| 5 Years | 0 (0.0%) | 0 (0.0%) |
| 6 to 11 Years | 0 (0.0%) | 0 (0.0%) |
| 12 to 14 Years | 0 (0.0%) | 0 (0.0%) |
| 15 Years | 0 (0.0%) | 0 (0.0%) |
| 16 and 17 Years | 0 (0.0%) | 0 (0.0%) |
| 18 to 24 Years | 0 (0.0%) | 0 (0.0%) |
| 25 to 34 Years | 17 (43.6%) | 4 (25.0%) |
| 35 to 44 Years | 3 (16.7%) | 26 (36.6%) |
| 45 to 54 Years | 4 (4.1%) | 0 (0.0%) |
| 55 to 64 Years | 85 (43.6%) | 11 (9.2%) |
| 65 to 74 Years | 24 (21.2%) | 11 (12.4%) |
| 75 Years and over | 0 (0.0%) | 0 (0.0%) |
| Total | 146 (25.9%) | 57 (11.5%) |
Income Above Poverty by Sex and Age in Hydesville
According to the poverty statistics in Hydesville, males aged 6 to 11 years and females aged 6 to 11 years are the age groups that are most secure financially, with 100.0% of males and 100.0% of females in these age groups living above the poverty line.
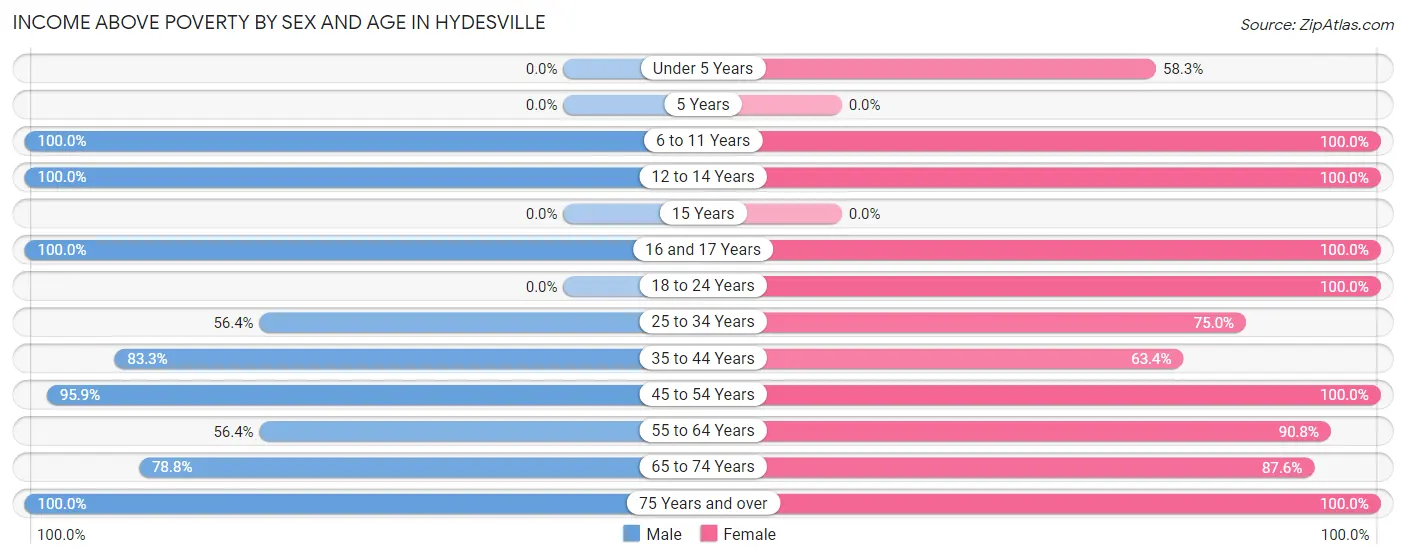
| Age Bracket | Male | Female |
| Under 5 Years | 0 (0.0%) | 7 (58.3%) |
| 5 Years | 0 (0.0%) | 0 (0.0%) |
| 6 to 11 Years | 19 (100.0%) | 24 (100.0%) |
| 12 to 14 Years | 22 (100.0%) | 38 (100.0%) |
| 15 Years | 0 (0.0%) | 0 (0.0%) |
| 16 and 17 Years | 11 (100.0%) | 12 (100.0%) |
| 18 to 24 Years | 0 (0.0%) | 21 (100.0%) |
| 25 to 34 Years | 22 (56.4%) | 12 (75.0%) |
| 35 to 44 Years | 15 (83.3%) | 45 (63.4%) |
| 45 to 54 Years | 93 (95.9%) | 71 (100.0%) |
| 55 to 64 Years | 110 (56.4%) | 108 (90.8%) |
| 65 to 74 Years | 89 (78.8%) | 78 (87.6%) |
| 75 Years and over | 36 (100.0%) | 24 (100.0%) |
| Total | 417 (74.1%) | 440 (88.5%) |
Income Below Poverty Among Married-Couple Families in Hydesville
The poverty statistics for married-couple families in Hydesville show that 7.7% or 18 of the total 233 families live below the poverty line. Families with no children have the highest poverty rate of 8.4%, comprising of 15 families. On the other hand, families with 3 or 4 children have the lowest poverty rate of 0.0%, which includes 0 families.
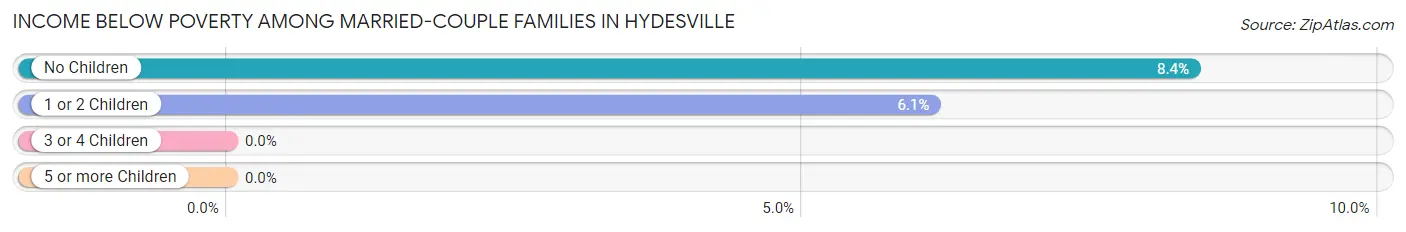
| Children | Above Poverty | Below Poverty |
| No Children | 164 (91.6%) | 15 (8.4%) |
| 1 or 2 Children | 46 (93.9%) | 3 (6.1%) |
| 3 or 4 Children | 5 (100.0%) | 0 (0.0%) |
| 5 or more Children | 0 (0.0%) | 0 (0.0%) |
| Total | 215 (92.3%) | 18 (7.7%) |
Income Below Poverty Among Single-Parent Households in Hydesville
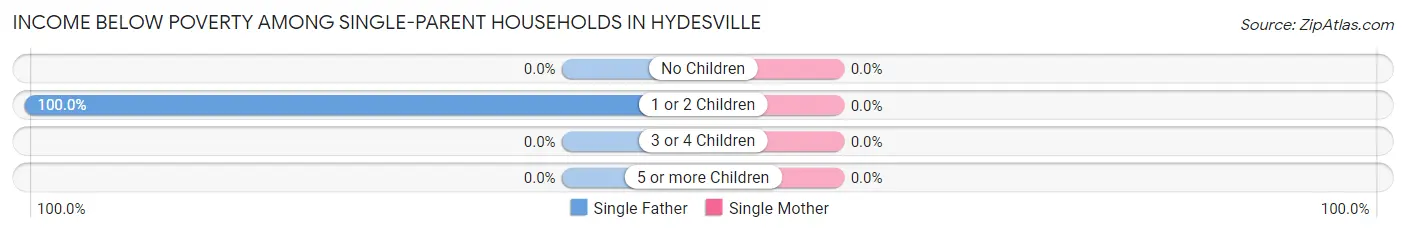
| Children | Single Father | Single Mother |
| No Children | 0 (0.0%) | 0 (0.0%) |
| 1 or 2 Children | 14 (100.0%) | 0 (0.0%) |
| 3 or 4 Children | 0 (0.0%) | 0 (0.0%) |
| 5 or more Children | 0 (0.0%) | 0 (0.0%) |
| Total | 14 (56.0%) | 0 (0.0%) |
Income Below Poverty Among Married-Couple vs Single-Parent Households in Hydesville
The poverty data for Hydesville shows that 18 of the married-couple family households (7.7%) and 14 of the single-parent households (35.9%) are living below the poverty level. Within the married-couple family households, those with no children have the highest poverty rate, with 15 households (8.4%) falling below the poverty line. Among the single-parent households, those with 1 or 2 children have the highest poverty rate, with 14 household (100.0%) living below poverty.
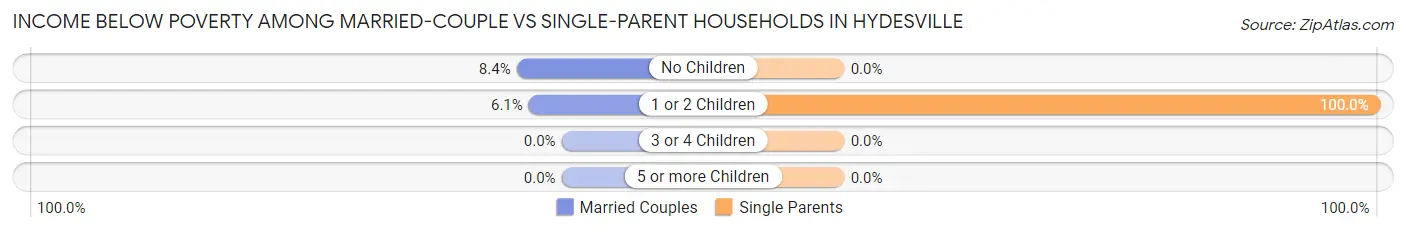
| Children | Married-Couple Families | Single-Parent Households |
| No Children | 15 (8.4%) | 0 (0.0%) |
| 1 or 2 Children | 3 (6.1%) | 14 (100.0%) |
| 3 or 4 Children | 0 (0.0%) | 0 (0.0%) |
| 5 or more Children | 0 (0.0%) | 0 (0.0%) |
| Total | 18 (7.7%) | 14 (35.9%) |
Race in Hydesville
The most populous races in Hydesville are White / Caucasian (905 | 85.4%), Hispanic or Latino (108 | 10.2%), and Two or more Races (66 | 6.2%).
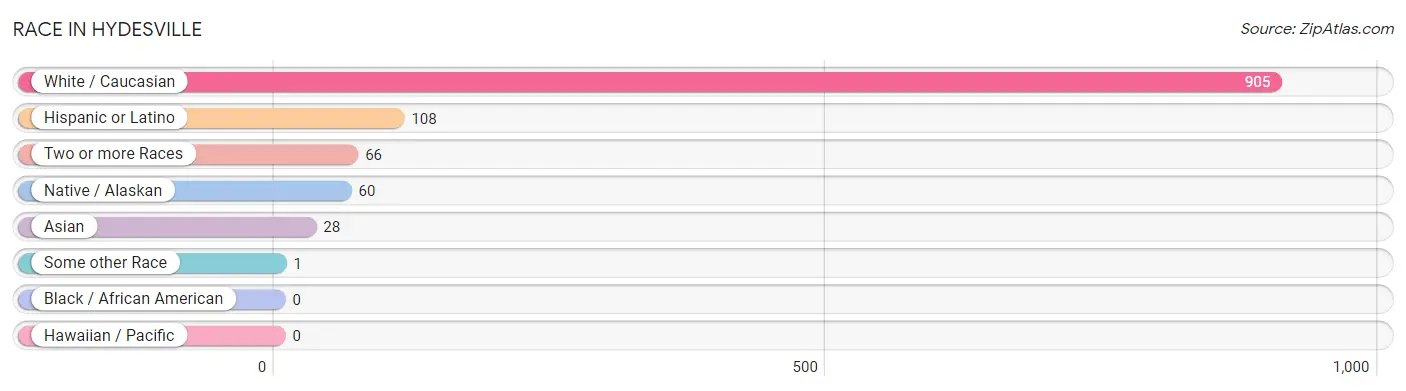
| Race | # Population | % Population |
| Asian | 28 | 2.6% |
| Black / African American | 0 | 0.0% |
| Hawaiian / Pacific | 0 | 0.0% |
| Hispanic or Latino | 108 | 10.2% |
| Native / Alaskan | 60 | 5.7% |
| White / Caucasian | 905 | 85.4% |
| Two or more Races | 66 | 6.2% |
| Some other Race | 1 | 0.1% |
| Total | 1,060 | 100.0% |
Ancestry in Hydesville
The most populous ancestries reported in Hydesville are German (255 | 24.1%), English (128 | 12.1%), Mexican (106 | 10.0%), European (90 | 8.5%), and Irish (77 | 7.3%), together accounting for 61.9% of all Hydesville residents.
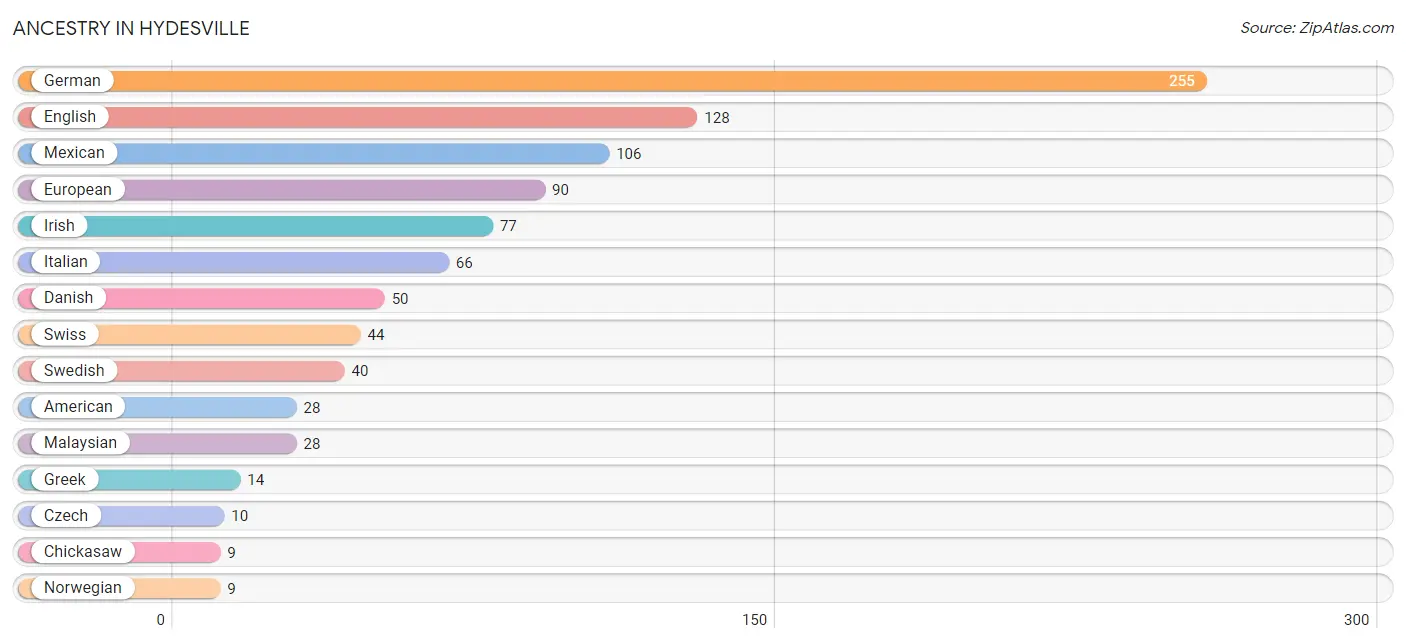
| Ancestry | # Population | % Population |
| American | 28 | 2.6% |
| Blackfeet | 8 | 0.7% |
| British | 4 | 0.4% |
| Carpatho Rusyn | 1 | 0.1% |
| Chickasaw | 9 | 0.9% |
| Czech | 10 | 0.9% |
| Danish | 50 | 4.7% |
| Dutch | 7 | 0.7% |
| English | 128 | 12.1% |
| European | 90 | 8.5% |
| French | 4 | 0.4% |
| French Canadian | 7 | 0.7% |
| German | 255 | 24.1% |
| Greek | 14 | 1.3% |
| Irish | 77 | 7.3% |
| Italian | 66 | 6.2% |
| Malaysian | 28 | 2.6% |
| Mexican | 106 | 10.0% |
| Northern European | 4 | 0.4% |
| Norwegian | 9 | 0.9% |
| Pima | 5 | 0.5% |
| Portuguese | 8 | 0.7% |
| Scottish | 7 | 0.7% |
| Spanish | 2 | 0.2% |
| Swedish | 40 | 3.8% |
| Swiss | 44 | 4.2% |
| Ukrainian | 9 | 0.9% |
| Yugoslavian | 9 | 0.9% | View All 28 Rows |
Immigrants in Hydesville
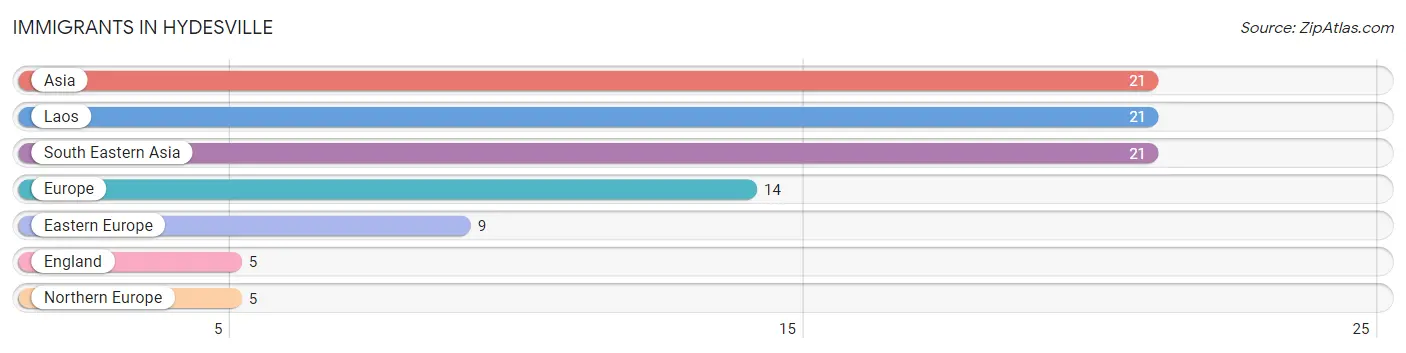
The most numerous immigrant groups reported in Hydesville came from Asia (21 | 2.0%), Laos (21 | 2.0%), South Eastern Asia (21 | 2.0%), Europe (14 | 1.3%), and Eastern Europe (9 | 0.9%), together accounting for 8.1% of all Hydesville residents.
| Immigration Origin | # Population | % Population |
| Asia | 21 | 2.0% |
| Eastern Europe | 9 | 0.9% |
| England | 5 | 0.5% |
| Europe | 14 | 1.3% |
| Laos | 21 | 2.0% |
| Northern Europe | 5 | 0.5% |
| South Eastern Asia | 21 | 2.0% | View All 7 Rows |
Sex and Age in Hydesville
Sex and Age in Hydesville
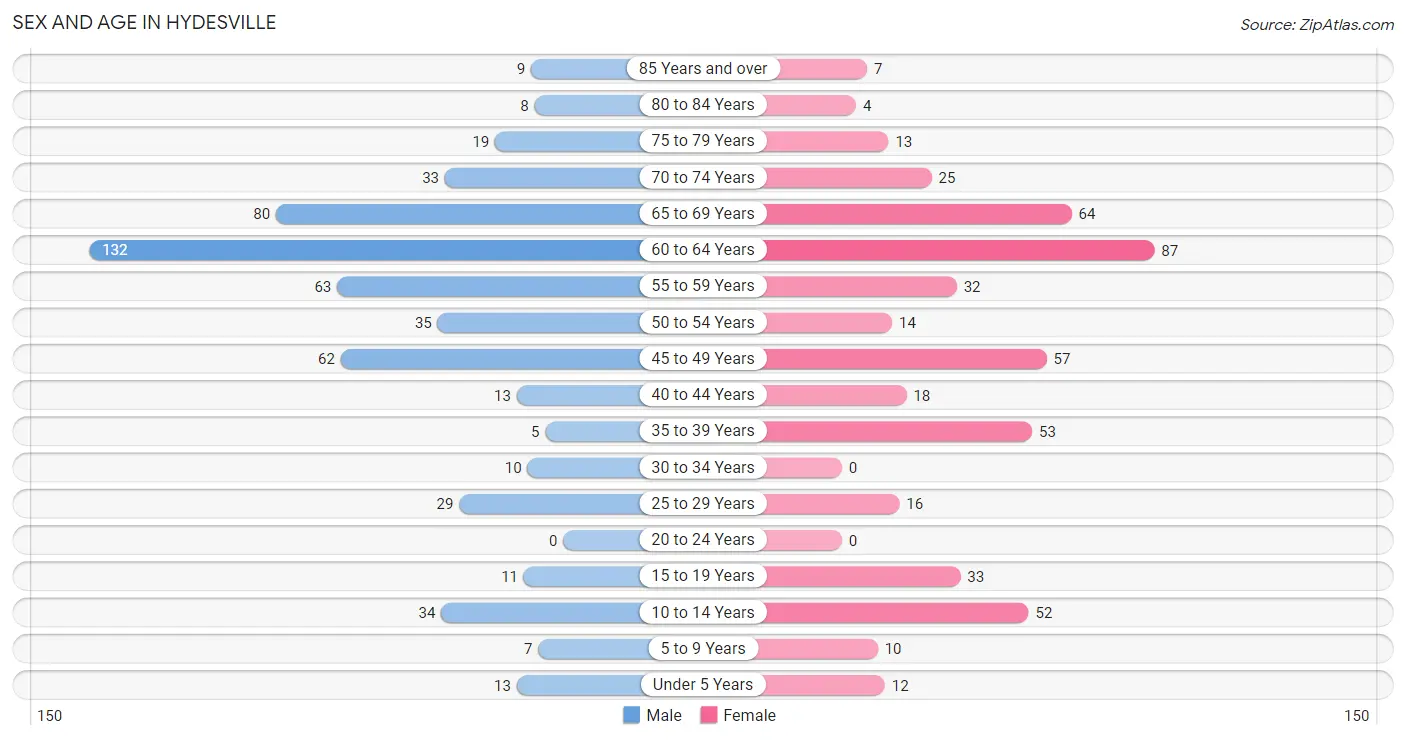
The most populous age groups in Hydesville are 60 to 64 Years (132 | 23.4%) for men and 60 to 64 Years (87 | 17.5%) for women.
| Age Bracket | Male | Female |
| Under 5 Years | 13 (2.3%) | 12 (2.4%) |
| 5 to 9 Years | 7 (1.2%) | 10 (2.0%) |
| 10 to 14 Years | 34 (6.0%) | 52 (10.5%) |
| 15 to 19 Years | 11 (1.9%) | 33 (6.6%) |
| 20 to 24 Years | 0 (0.0%) | 0 (0.0%) |
| 25 to 29 Years | 29 (5.1%) | 16 (3.2%) |
| 30 to 34 Years | 10 (1.8%) | 0 (0.0%) |
| 35 to 39 Years | 5 (0.9%) | 53 (10.7%) |
| 40 to 44 Years | 13 (2.3%) | 18 (3.6%) |
| 45 to 49 Years | 62 (11.0%) | 57 (11.5%) |
| 50 to 54 Years | 35 (6.2%) | 14 (2.8%) |
| 55 to 59 Years | 63 (11.2%) | 32 (6.4%) |
| 60 to 64 Years | 132 (23.4%) | 87 (17.5%) |
| 65 to 69 Years | 80 (14.2%) | 64 (12.9%) |
| 70 to 74 Years | 33 (5.9%) | 25 (5.0%) |
| 75 to 79 Years | 19 (3.4%) | 13 (2.6%) |
| 80 to 84 Years | 8 (1.4%) | 4 (0.8%) |
| 85 Years and over | 9 (1.6%) | 7 (1.4%) |
| Total | 563 (100.0%) | 497 (100.0%) |
Families and Households in Hydesville
Median Family Size in Hydesville
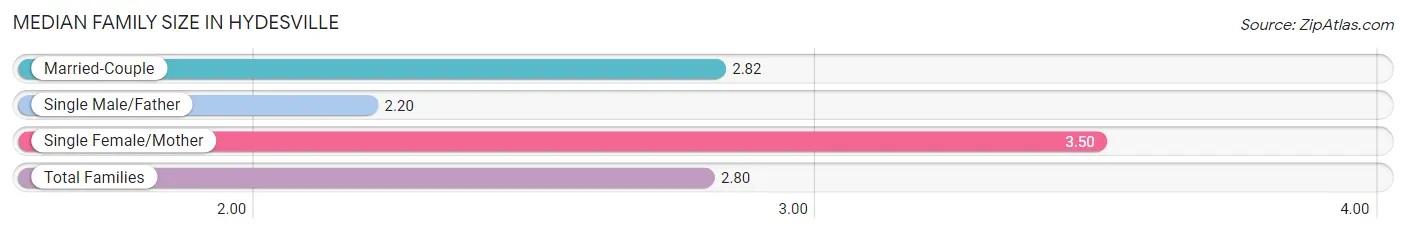
The median family size in Hydesville is 2.80 persons per family, with single female/mother families (14 | 5.1%) accounting for the largest median family size of 3.5 persons per family. On the other hand, single male/father families (25 | 9.2%) represent the smallest median family size with 2.20 persons per family.
| Family Type | # Families | Family Size |
| Married-Couple | 233 (85.7%) | 2.82 |
| Single Male/Father | 25 (9.2%) | 2.20 |
| Single Female/Mother | 14 (5.1%) | 3.50 |
| Total Families | 272 (100.0%) | 2.80 |
Median Household Size in Hydesville
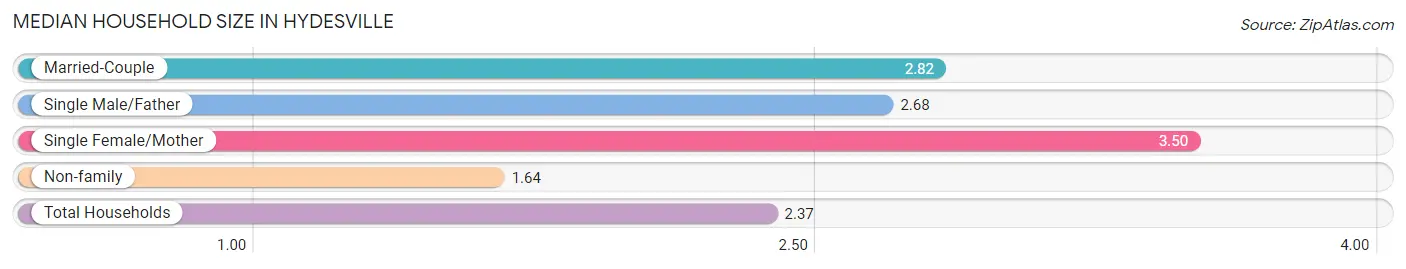
The median household size in Hydesville is 2.37 persons per household, with single female/mother households (14 | 3.1%) accounting for the largest median household size of 3.5 persons per household. non-family households (174 | 39.0%) represent the smallest median household size with 1.64 persons per household.
| Household Type | # Households | Household Size |
| Married-Couple | 233 (52.2%) | 2.82 |
| Single Male/Father | 25 (5.6%) | 2.68 |
| Single Female/Mother | 14 (3.1%) | 3.50 |
| Non-family | 174 (39.0%) | 1.64 |
| Total Households | 446 (100.0%) | 2.37 |
Household Size by Marriage Status in Hydesville
Out of a total of 446 households in Hydesville, 272 (61.0%) are family households, while 174 (39.0%) are nonfamily households. The most numerous type of family households are 2-person households, comprising 163, and the most common type of nonfamily households are 1-person households, comprising 118.
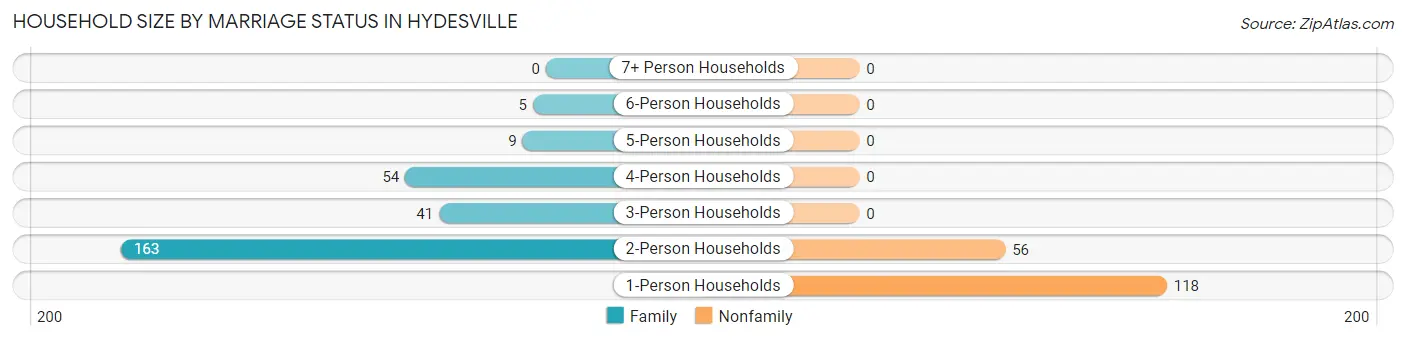
| Household Size | Family Households | Nonfamily Households |
| 1-Person Households | - | 118 (26.5%) |
| 2-Person Households | 163 (36.5%) | 56 (12.6%) |
| 3-Person Households | 41 (9.2%) | 0 (0.0%) |
| 4-Person Households | 54 (12.1%) | 0 (0.0%) |
| 5-Person Households | 9 (2.0%) | 0 (0.0%) |
| 6-Person Households | 5 (1.1%) | 0 (0.0%) |
| 7+ Person Households | 0 (0.0%) | 0 (0.0%) |
| Total | 272 (61.0%) | 174 (39.0%) |
Female Fertility in Hydesville
Fertility by Age in Hydesville
Average fertility rate in Hydesville is 107.0 births per 1,000 women. Women in the age bracket of 35 to 50 years have the highest fertility rate with 148.0 births per 1,000 women. Women in the age bracket of 35 to 50 years acount for 100.0% of all women with births.
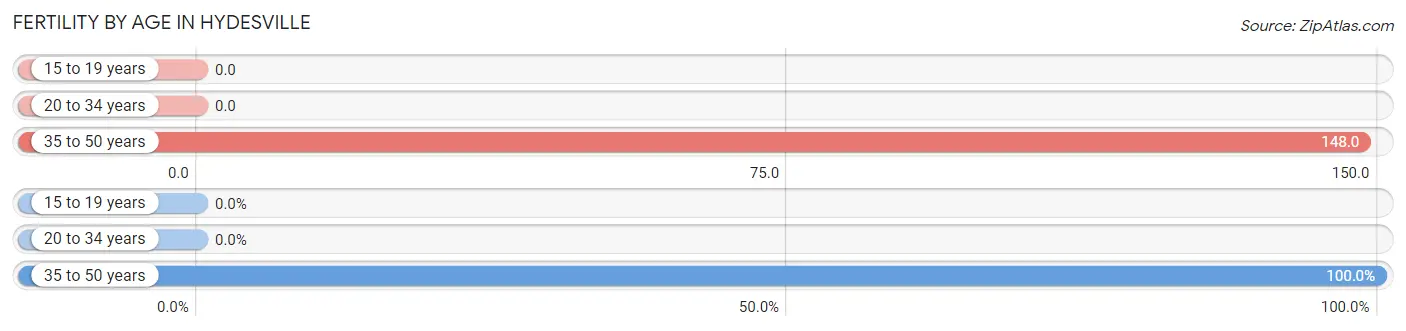
| Age Bracket | Women with Births | Births / 1,000 Women |
| 15 to 19 years | 0 (0.0%) | 0.0 |
| 20 to 34 years | 0 (0.0%) | 0.0 |
| 35 to 50 years | 19 (100.0%) | 148.0 |
| Total | 19 (100.0%) | 107.0 |
Fertility by Age by Marriage Status in Hydesville
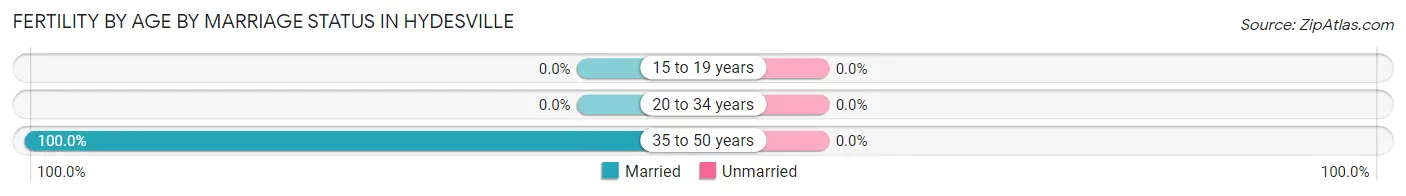
| Age Bracket | Married | Unmarried |
| 15 to 19 years | 0 (0.0%) | 0 (0.0%) |
| 20 to 34 years | 0 (0.0%) | 0 (0.0%) |
| 35 to 50 years | 19 (100.0%) | 0 (0.0%) |
| Total | 19 (100.0%) | 0 (0.0%) |
Fertility by Education in Hydesville
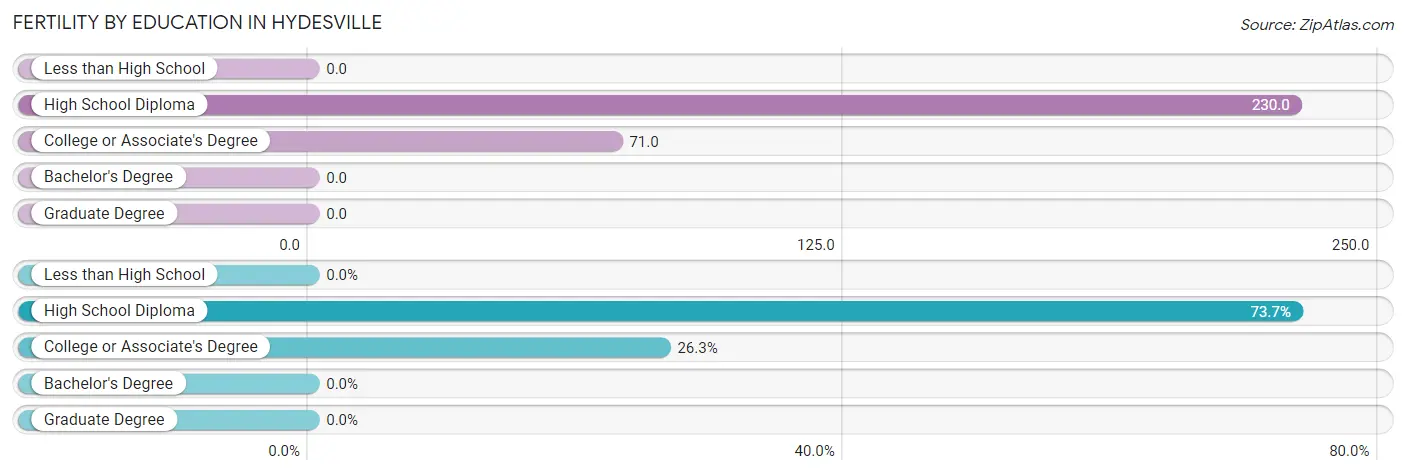
| Educational Attainment | Women with Births | Births / 1,000 Women |
| Less than High School | 0 (0.0%) | 0.0 |
| High School Diploma | 14 (73.7%) | 230.0 |
| College or Associate's Degree | 5 (26.3%) | 71.0 |
| Bachelor's Degree | 0 (0.0%) | 0.0 |
| Graduate Degree | 0 (0.0%) | 0.0 |
| Total | 19 (100.0%) | 107.0 |
Fertility by Education by Marriage Status in Hydesville
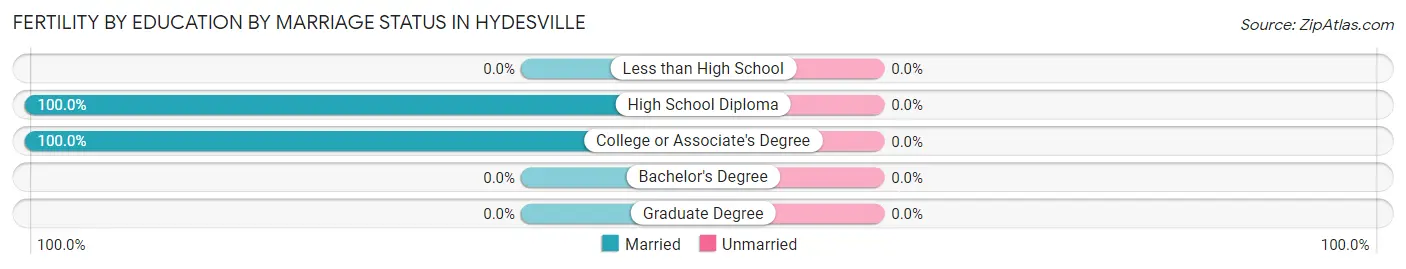
| Educational Attainment | Married | Unmarried |
| Less than High School | 0 (0.0%) | 0 (0.0%) |
| High School Diploma | 14 (100.0%) | 0 (0.0%) |
| College or Associate's Degree | 5 (100.0%) | 0 (0.0%) |
| Bachelor's Degree | 0 (0.0%) | 0 (0.0%) |
| Graduate Degree | 0 (0.0%) | 0 (0.0%) |
| Total | 19 (100.0%) | 0 (0.0%) |
Employment Characteristics in Hydesville
Employment by Class of Employer in Hydesville
Among the 383 employed individuals in Hydesville, private company employees (185 | 48.3%), self-employed (not incorporated) (87 | 22.7%), and not-for-profit organizations (51 | 13.3%) make up the most common classes of employment.
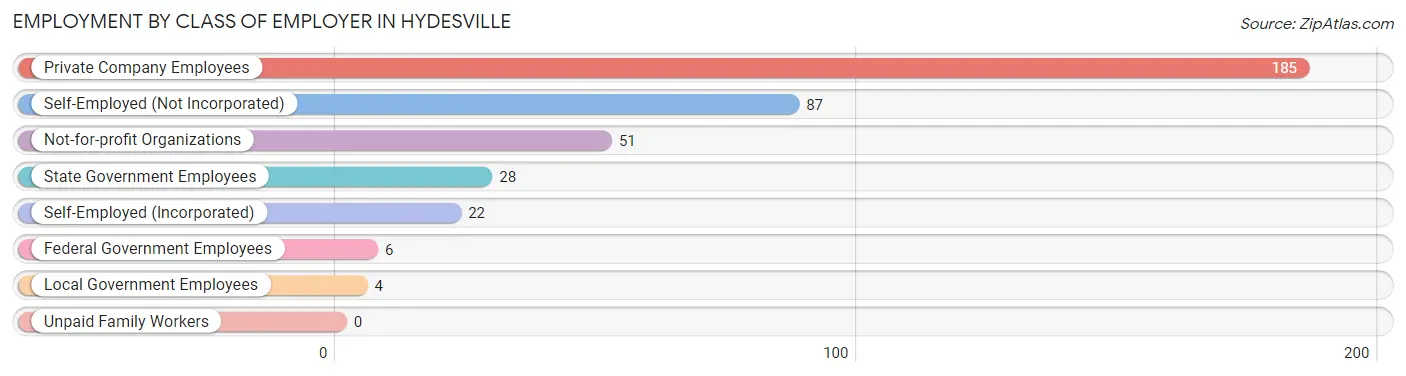
| Employer Class | # Employees | % Employees |
| Private Company Employees | 185 | 48.3% |
| Self-Employed (Incorporated) | 22 | 5.7% |
| Self-Employed (Not Incorporated) | 87 | 22.7% |
| Not-for-profit Organizations | 51 | 13.3% |
| Local Government Employees | 4 | 1.0% |
| State Government Employees | 28 | 7.3% |
| Federal Government Employees | 6 | 1.6% |
| Unpaid Family Workers | 0 | 0.0% |
| Total | 383 | 100.0% |
Employment Status by Age in Hydesville
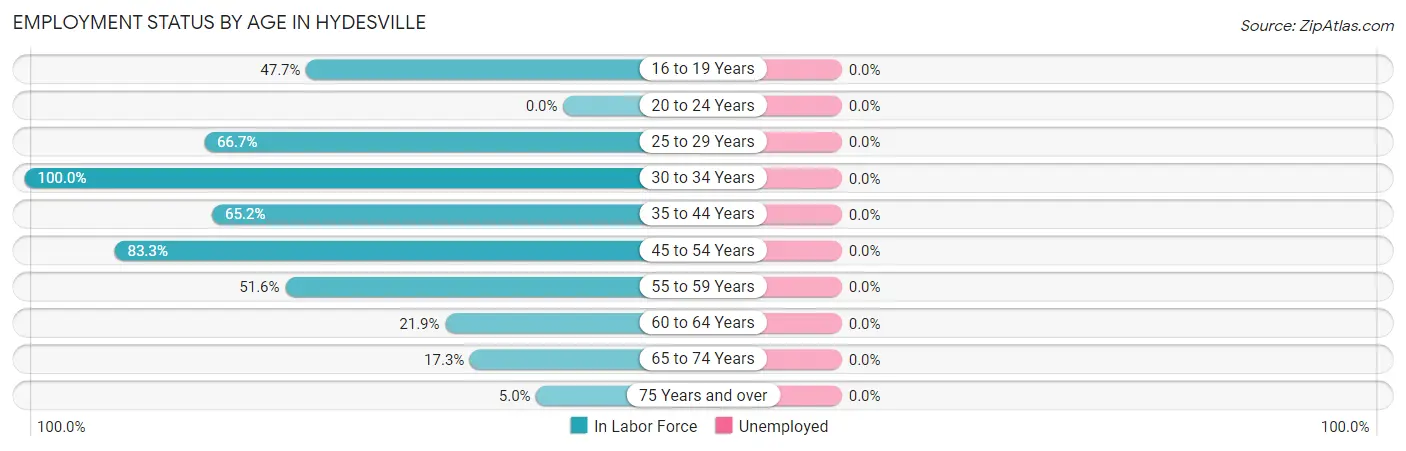
| Age Bracket | In Labor Force | Unemployed |
| 16 to 19 Years | 21 (47.7%) | 0 (0.0%) |
| 20 to 24 Years | 0 (0.0%) | 0 (0.0%) |
| 25 to 29 Years | 30 (66.7%) | 0 (0.0%) |
| 30 to 34 Years | 10 (100.0%) | 0 (0.0%) |
| 35 to 44 Years | 58 (65.2%) | 0 (0.0%) |
| 45 to 54 Years | 140 (83.3%) | 0 (0.0%) |
| 55 to 59 Years | 49 (51.6%) | 0 (0.0%) |
| 60 to 64 Years | 48 (21.9%) | 0 (0.0%) |
| 65 to 74 Years | 35 (17.3%) | 0 (0.0%) |
| 75 Years and over | 3 (5.0%) | 0 (0.0%) |
| Total | 394 (42.3%) | 0 (0.0%) |
Employment Status by Educational Attainment in Hydesville
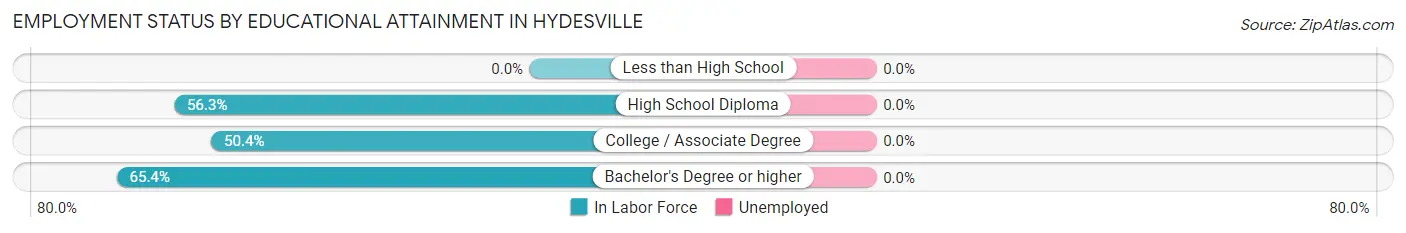
| Educational Attainment | In Labor Force | Unemployed |
| Less than High School | 0 (0.0%) | 0 (0.0%) |
| High School Diploma | 103 (56.3%) | 0 (0.0%) |
| College / Associate Degree | 179 (50.4%) | 0 (0.0%) |
| Bachelor's Degree or higher | 53 (65.4%) | 0 (0.0%) |
| Total | 335 (53.5%) | 0 (0.0%) |
Employment Occupations by Sex in Hydesville
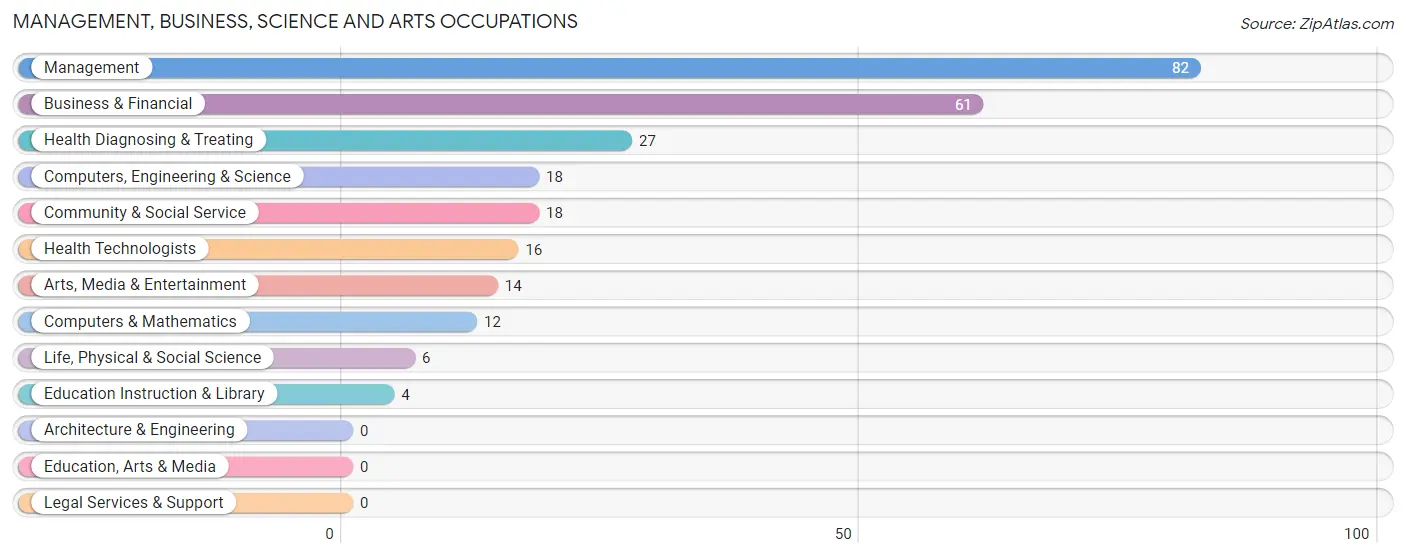
Management, Business, Science and Arts Occupations
The most common Management, Business, Science and Arts occupations in Hydesville are Management (82 | 20.8%), Business & Financial (61 | 15.5%), Health Diagnosing & Treating (27 | 6.9%), Computers, Engineering & Science (18 | 4.6%), and Community & Social Service (18 | 4.6%).
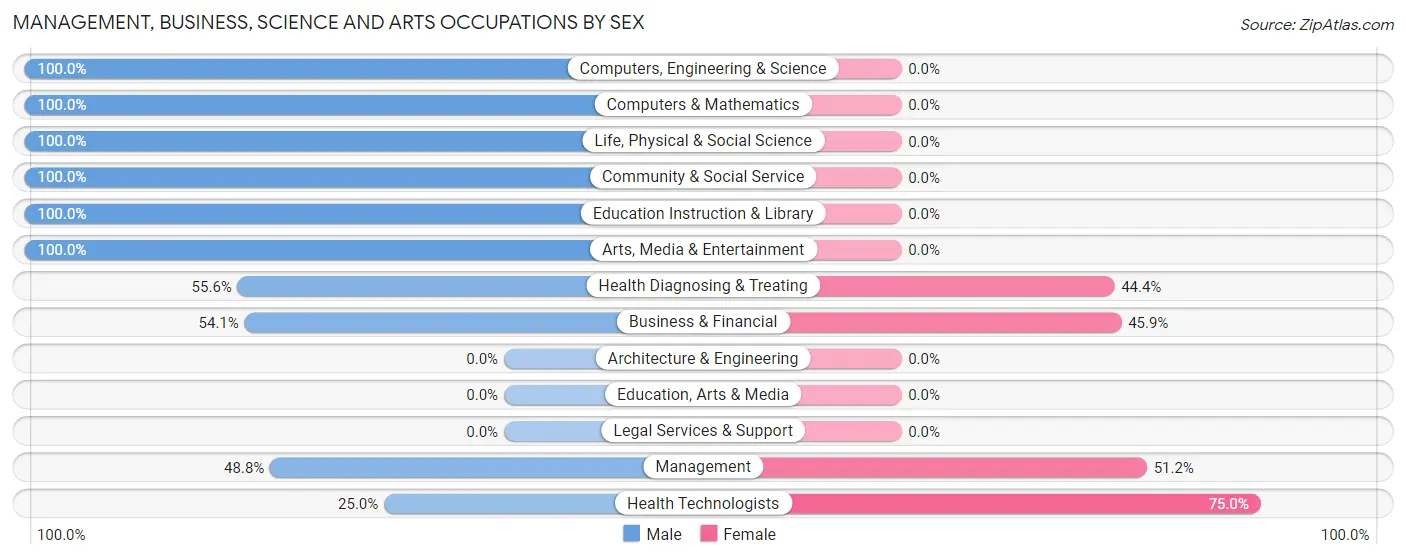
Management, Business, Science and Arts Occupations by Sex
Within the Management, Business, Science and Arts occupations in Hydesville, the most male-oriented occupations are Computers, Engineering & Science (100.0%), Computers & Mathematics (100.0%), and Life, Physical & Social Science (100.0%), while the most female-oriented occupations are Health Technologists (75.0%), Management (51.2%), and Business & Financial (45.9%).
| Occupation | Male | Female |
| Management | 40 (48.8%) | 42 (51.2%) |
| Business & Financial | 33 (54.1%) | 28 (45.9%) |
| Computers, Engineering & Science | 18 (100.0%) | 0 (0.0%) |
| Computers & Mathematics | 12 (100.0%) | 0 (0.0%) |
| Architecture & Engineering | 0 (0.0%) | 0 (0.0%) |
| Life, Physical & Social Science | 6 (100.0%) | 0 (0.0%) |
| Community & Social Service | 18 (100.0%) | 0 (0.0%) |
| Education, Arts & Media | 0 (0.0%) | 0 (0.0%) |
| Legal Services & Support | 0 (0.0%) | 0 (0.0%) |
| Education Instruction & Library | 4 (100.0%) | 0 (0.0%) |
| Arts, Media & Entertainment | 14 (100.0%) | 0 (0.0%) |
| Health Diagnosing & Treating | 15 (55.6%) | 12 (44.4%) |
| Health Technologists | 4 (25.0%) | 12 (75.0%) |
| Total (Category) | 124 (60.2%) | 82 (39.8%) |
| Total (Overall) | 214 (54.3%) | 180 (45.7%) |
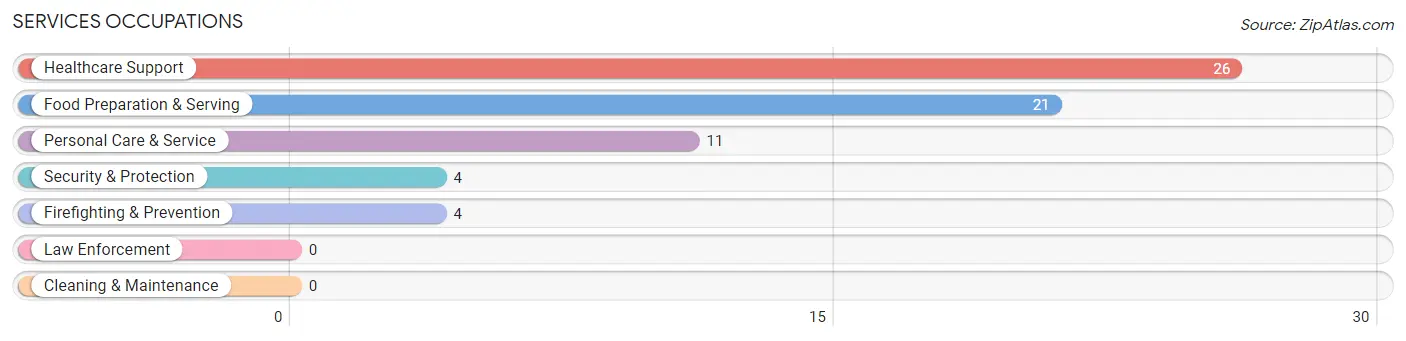
Services Occupations
The most common Services occupations in Hydesville are Healthcare Support (26 | 6.6%), Food Preparation & Serving (21 | 5.3%), Personal Care & Service (11 | 2.8%), Security & Protection (4 | 1.0%), and Firefighting & Prevention (4 | 1.0%).
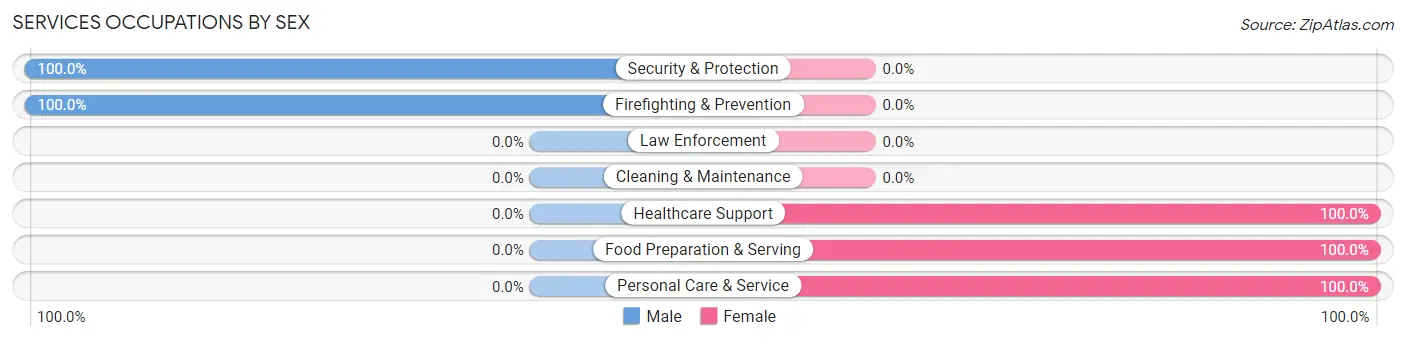
Services Occupations by Sex
Within the Services occupations in Hydesville, the most male-oriented occupations are Security & Protection (100.0%), and Firefighting & Prevention (100.0%), while the most female-oriented occupations are Healthcare Support (100.0%), Food Preparation & Serving (100.0%), and Personal Care & Service (100.0%).
| Occupation | Male | Female |
| Healthcare Support | 0 (0.0%) | 26 (100.0%) |
| Security & Protection | 4 (100.0%) | 0 (0.0%) |
| Firefighting & Prevention | 4 (100.0%) | 0 (0.0%) |
| Law Enforcement | 0 (0.0%) | 0 (0.0%) |
| Food Preparation & Serving | 0 (0.0%) | 21 (100.0%) |
| Cleaning & Maintenance | 0 (0.0%) | 0 (0.0%) |
| Personal Care & Service | 0 (0.0%) | 11 (100.0%) |
| Total (Category) | 4 (6.5%) | 58 (93.5%) |
| Total (Overall) | 214 (54.3%) | 180 (45.7%) |
Sales and Office Occupations
The most common Sales and Office occupations in Hydesville are Sales & Related (37 | 9.4%), and Office & Administration (32 | 8.1%).
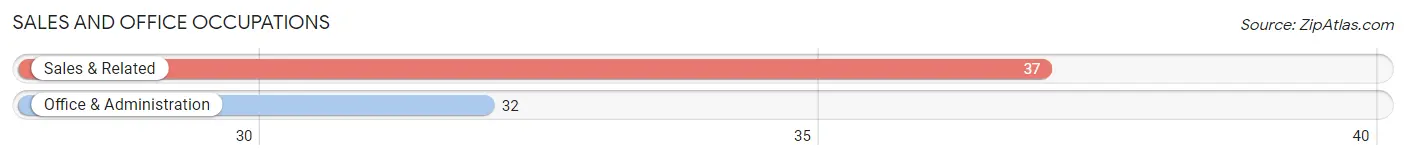
Sales and Office Occupations by Sex

| Occupation | Male | Female |
| Sales & Related | 29 (78.4%) | 8 (21.6%) |
| Office & Administration | 0 (0.0%) | 32 (100.0%) |
| Total (Category) | 29 (42.0%) | 40 (58.0%) |
| Total (Overall) | 214 (54.3%) | 180 (45.7%) |
Natural Resources, Construction and Maintenance Occupations
The most common Natural Resources, Construction and Maintenance occupations in Hydesville are , and Construction & Extraction (33 | 8.4%).

Natural Resources, Construction and Maintenance Occupations by Sex

| Occupation | Male | Female |
| Farming, Fishing & Forestry | 0 (0.0%) | 0 (0.0%) |
| Construction & Extraction | 33 (100.0%) | 0 (0.0%) |
| Installation, Maintenance & Repair | 0 (0.0%) | 0 (0.0%) |
| Total (Category) | 33 (100.0%) | 0 (0.0%) |
| Total (Overall) | 214 (54.3%) | 180 (45.7%) |
Production, Transportation and Moving Occupations
The most common Production, Transportation and Moving occupations in Hydesville are Transportation (12 | 3.0%), Production (8 | 2.0%), and Material Moving (4 | 1.0%).
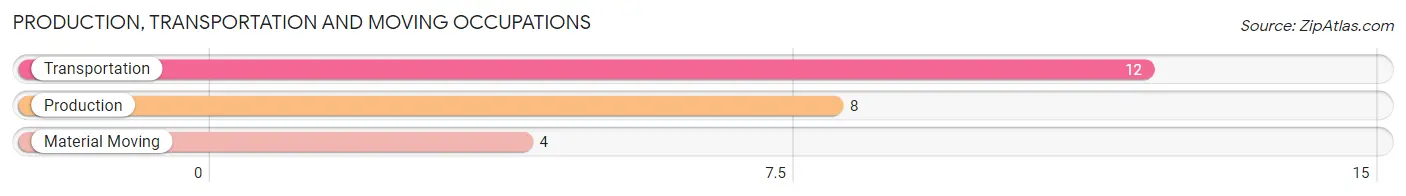
Production, Transportation and Moving Occupations by Sex
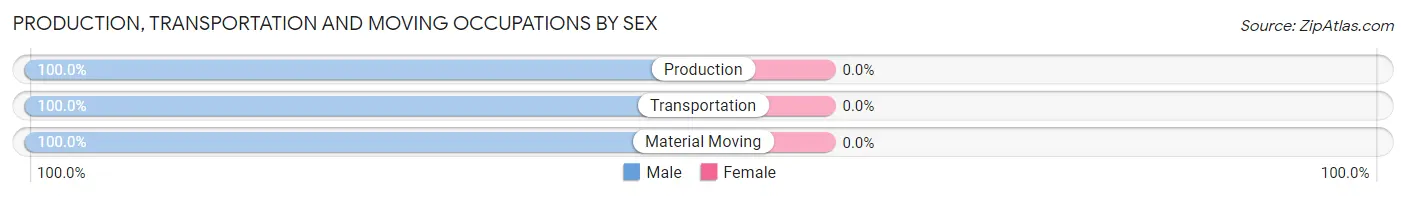
| Occupation | Male | Female |
| Production | 8 (100.0%) | 0 (0.0%) |
| Transportation | 12 (100.0%) | 0 (0.0%) |
| Material Moving | 4 (100.0%) | 0 (0.0%) |
| Total (Category) | 24 (100.0%) | 0 (0.0%) |
| Total (Overall) | 214 (54.3%) | 180 (45.7%) |
Employment Industries by Sex in Hydesville
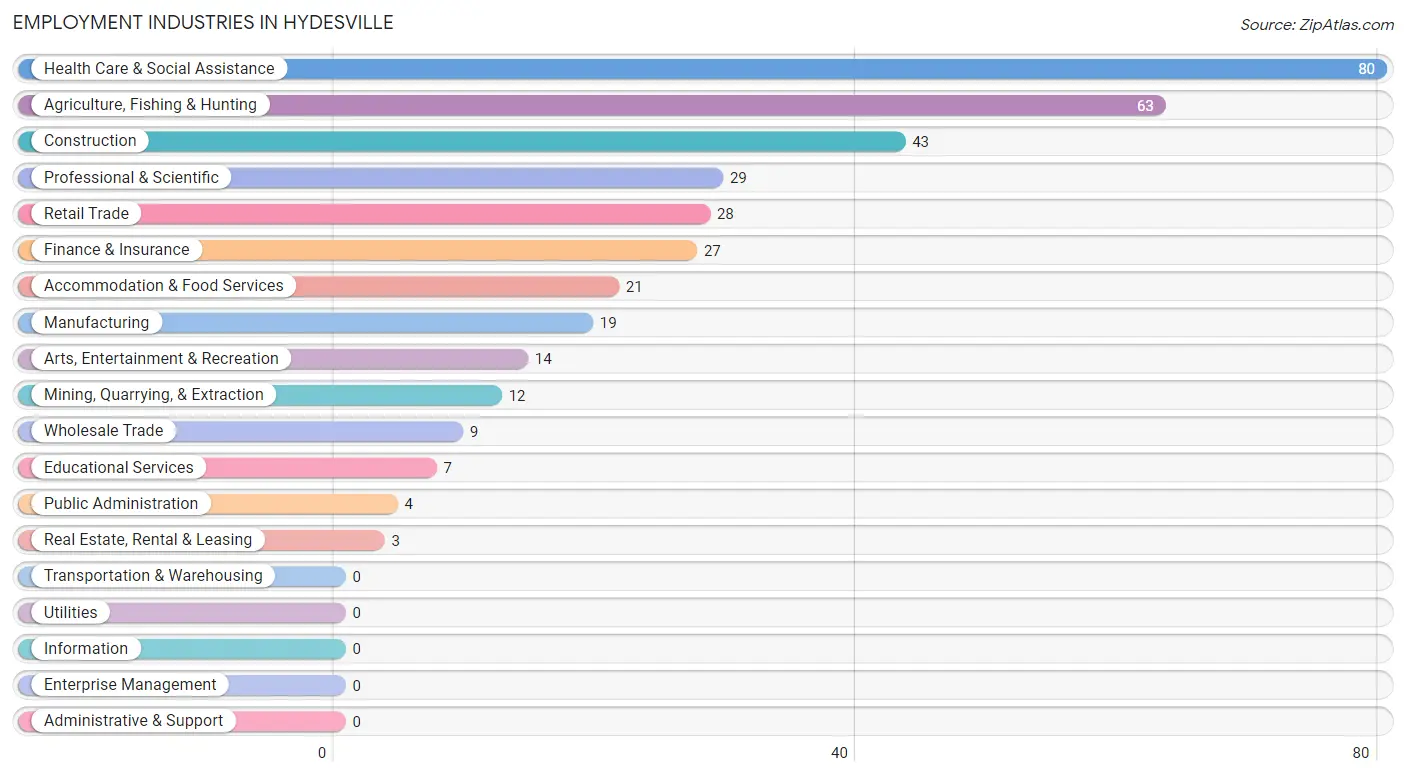
Employment Industries in Hydesville
The major employment industries in Hydesville include Health Care & Social Assistance (80 | 20.3%), Agriculture, Fishing & Hunting (63 | 16.0%), Construction (43 | 10.9%), Professional & Scientific (29 | 7.4%), and Retail Trade (28 | 7.1%).
Employment Industries by Sex in Hydesville
The Hydesville industries that see more men than women are Mining, Quarrying, & Extraction (100.0%), Manufacturing (100.0%), and Wholesale Trade (100.0%), whereas the industries that tend to have a higher number of women are Finance & Insurance (100.0%), Real Estate, Rental & Leasing (100.0%), and Accommodation & Food Services (100.0%).
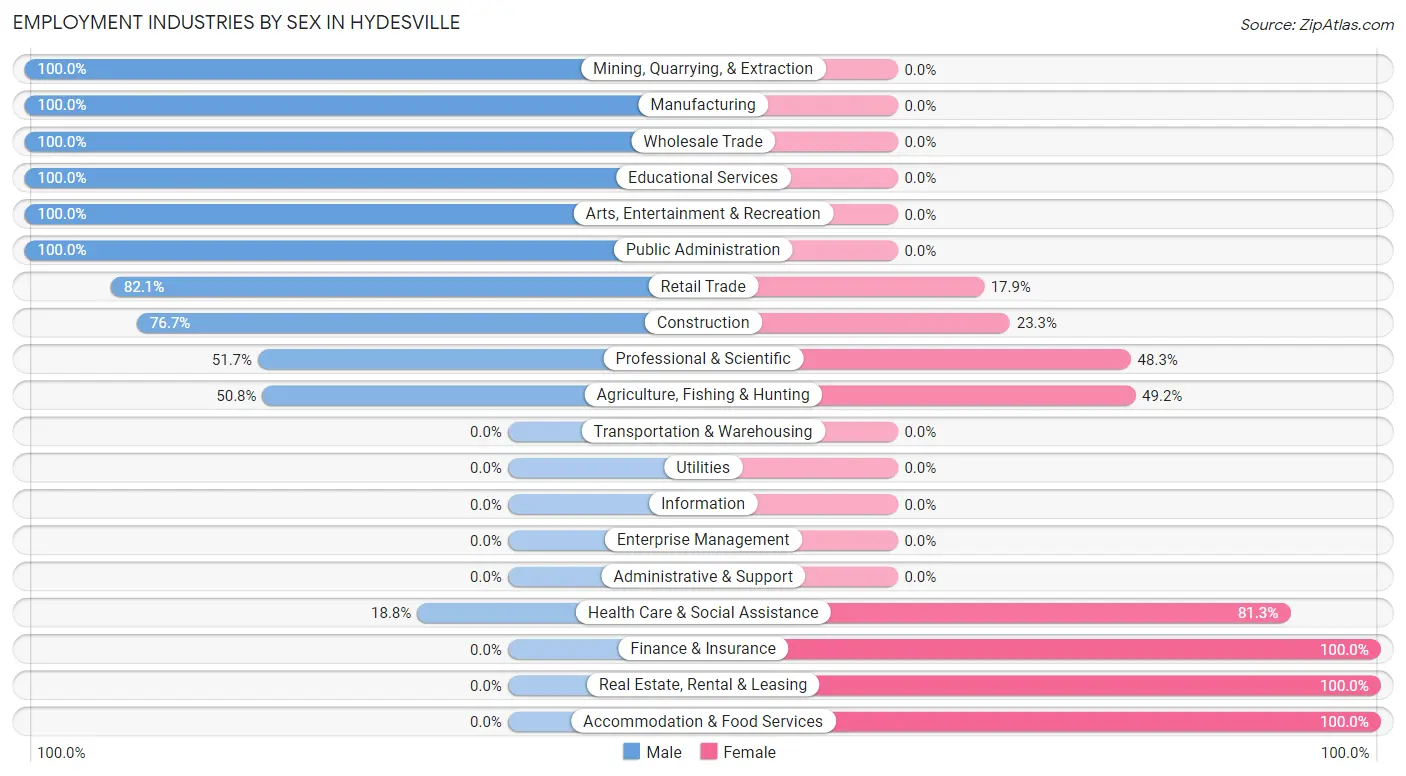
| Industry | Male | Female |
| Agriculture, Fishing & Hunting | 32 (50.8%) | 31 (49.2%) |
| Mining, Quarrying, & Extraction | 12 (100.0%) | 0 (0.0%) |
| Construction | 33 (76.7%) | 10 (23.3%) |
| Manufacturing | 19 (100.0%) | 0 (0.0%) |
| Wholesale Trade | 9 (100.0%) | 0 (0.0%) |
| Retail Trade | 23 (82.1%) | 5 (17.9%) |
| Transportation & Warehousing | 0 (0.0%) | 0 (0.0%) |
| Utilities | 0 (0.0%) | 0 (0.0%) |
| Information | 0 (0.0%) | 0 (0.0%) |
| Finance & Insurance | 0 (0.0%) | 27 (100.0%) |
| Real Estate, Rental & Leasing | 0 (0.0%) | 3 (100.0%) |
| Professional & Scientific | 15 (51.7%) | 14 (48.3%) |
| Enterprise Management | 0 (0.0%) | 0 (0.0%) |
| Administrative & Support | 0 (0.0%) | 0 (0.0%) |
| Educational Services | 7 (100.0%) | 0 (0.0%) |
| Health Care & Social Assistance | 15 (18.8%) | 65 (81.2%) |
| Arts, Entertainment & Recreation | 14 (100.0%) | 0 (0.0%) |
| Accommodation & Food Services | 0 (0.0%) | 21 (100.0%) |
| Public Administration | 4 (100.0%) | 0 (0.0%) |
| Total | 214 (54.3%) | 180 (45.7%) |
Education in Hydesville
School Enrollment in Hydesville
The most common levels of schooling among the 217 students in Hydesville are college / undergraduate (73 | 33.6%), middle school (56 | 25.8%), and high school (53 | 24.4%).
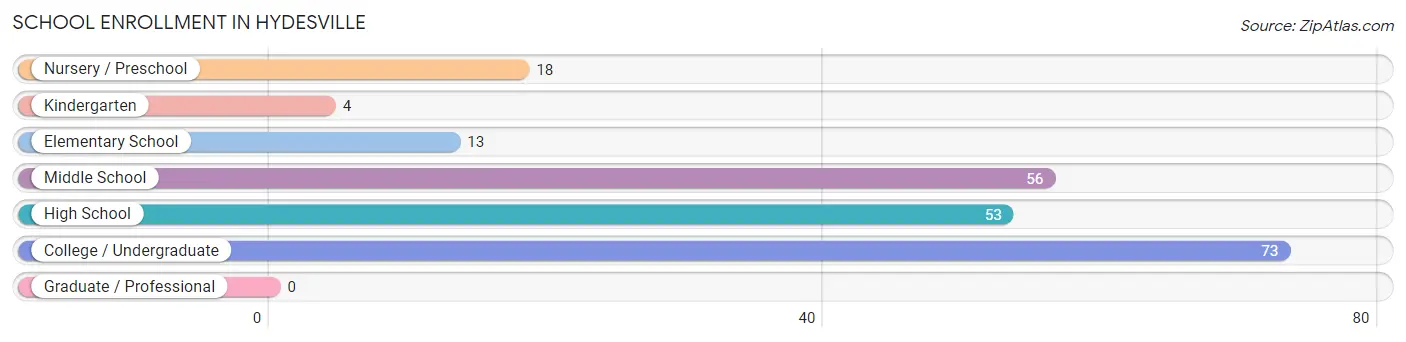
| School Level | # Students | % Students |
| Nursery / Preschool | 18 | 8.3% |
| Kindergarten | 4 | 1.8% |
| Elementary School | 13 | 6.0% |
| Middle School | 56 | 25.8% |
| High School | 53 | 24.4% |
| College / Undergraduate | 73 | 33.6% |
| Graduate / Professional | 0 | 0.0% |
| Total | 217 | 100.0% |
School Enrollment by Age by Funding Source in Hydesville
Out of a total of 217 students who are enrolled in schools in Hydesville, 33 (15.2%) attend a private institution, while the remaining 184 (84.8%) are enrolled in public schools. The age group of 18 to 19 year olds has the highest likelihood of being enrolled in private schools, with 21 (100.0% in the age bracket) enrolled. Conversely, the age group of 3 to 4 year olds has the lowest likelihood of being enrolled in a private school, with 18 (100.0% in the age bracket) attending a public institution.
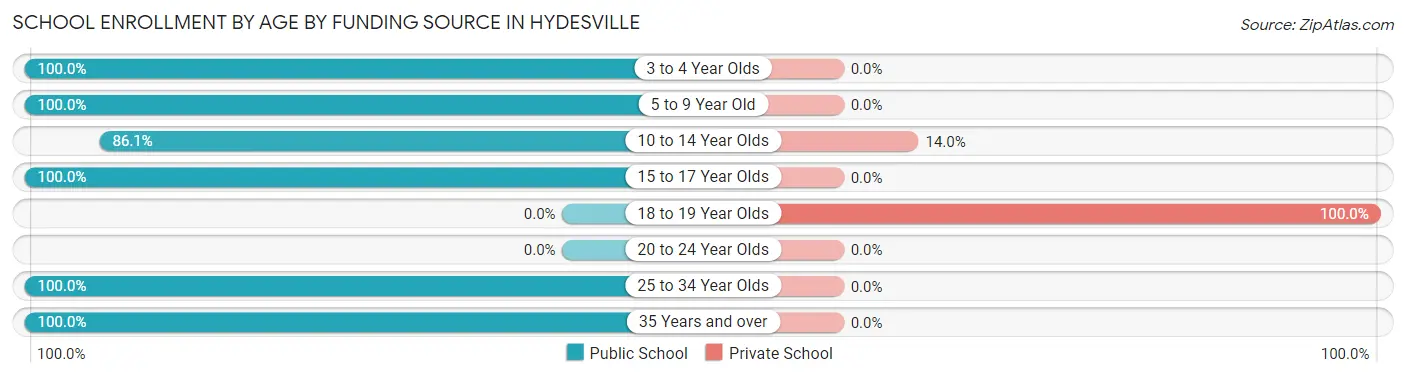
| Age Bracket | Public School | Private School |
| 3 to 4 Year Olds | 18 (100.0%) | 0 (0.0%) |
| 5 to 9 Year Old | 17 (100.0%) | 0 (0.0%) |
| 10 to 14 Year Olds | 74 (86.1%) | 12 (14.0%) |
| 15 to 17 Year Olds | 23 (100.0%) | 0 (0.0%) |
| 18 to 19 Year Olds | 0 (0.0%) | 21 (100.0%) |
| 20 to 24 Year Olds | 0 (0.0%) | 0 (0.0%) |
| 25 to 34 Year Olds | 11 (100.0%) | 0 (0.0%) |
| 35 Years and over | 41 (100.0%) | 0 (0.0%) |
| Total | 184 (84.8%) | 33 (15.2%) |
Educational Attainment by Field of Study in Hydesville
Bio, nature & agricultural (52 | 38.0%), psychology (15 | 11.0%), social sciences (14 | 10.2%), science & technology (13 | 9.5%), and computers & mathematics (12 | 8.8%) are the most common fields of study among 137 individuals in Hydesville who have obtained a bachelor's degree or higher.
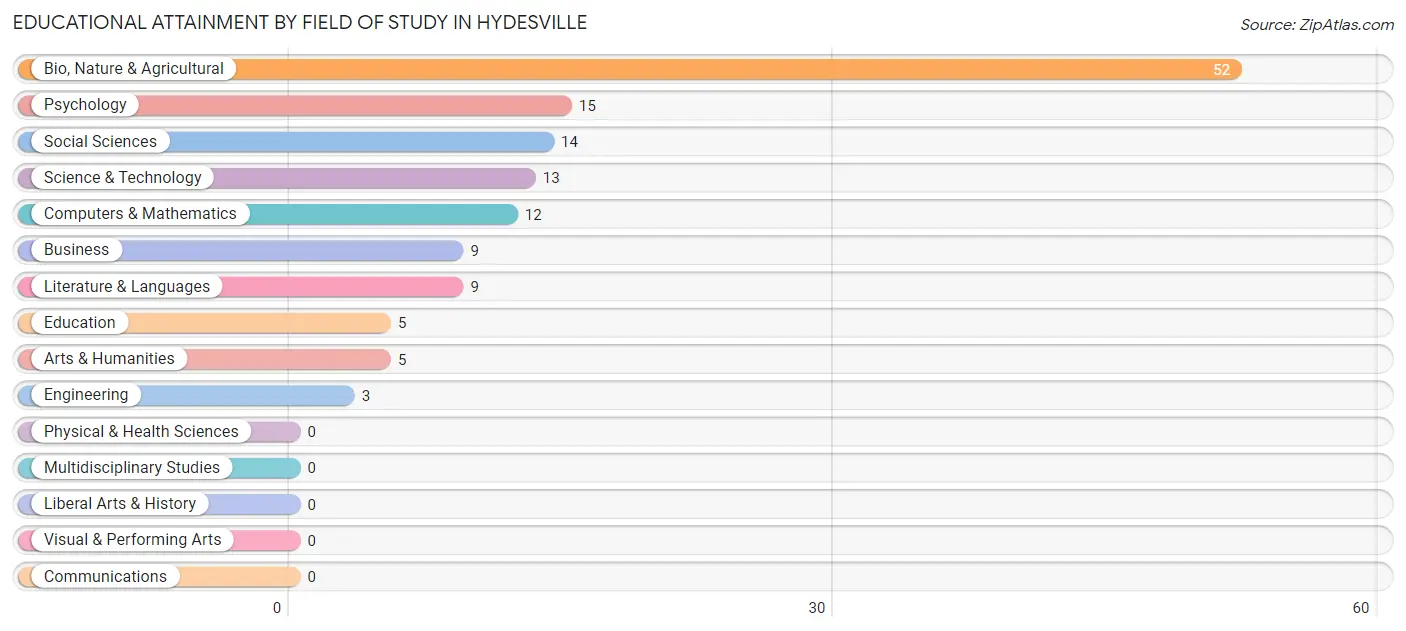
| Field of Study | # Graduates | % Graduates |
| Computers & Mathematics | 12 | 8.8% |
| Bio, Nature & Agricultural | 52 | 38.0% |
| Physical & Health Sciences | 0 | 0.0% |
| Psychology | 15 | 11.0% |
| Social Sciences | 14 | 10.2% |
| Engineering | 3 | 2.2% |
| Multidisciplinary Studies | 0 | 0.0% |
| Science & Technology | 13 | 9.5% |
| Business | 9 | 6.6% |
| Education | 5 | 3.6% |
| Literature & Languages | 9 | 6.6% |
| Liberal Arts & History | 0 | 0.0% |
| Visual & Performing Arts | 0 | 0.0% |
| Communications | 0 | 0.0% |
| Arts & Humanities | 5 | 3.6% |
| Total | 137 | 100.0% |
Transportation & Commute in Hydesville
Vehicle Availability by Sex in Hydesville
The most prevalent vehicle ownership categories in Hydesville are males with 3 vehicles (85, accounting for 41.9%) and females with 3 vehicles (67, making up 47.2%).
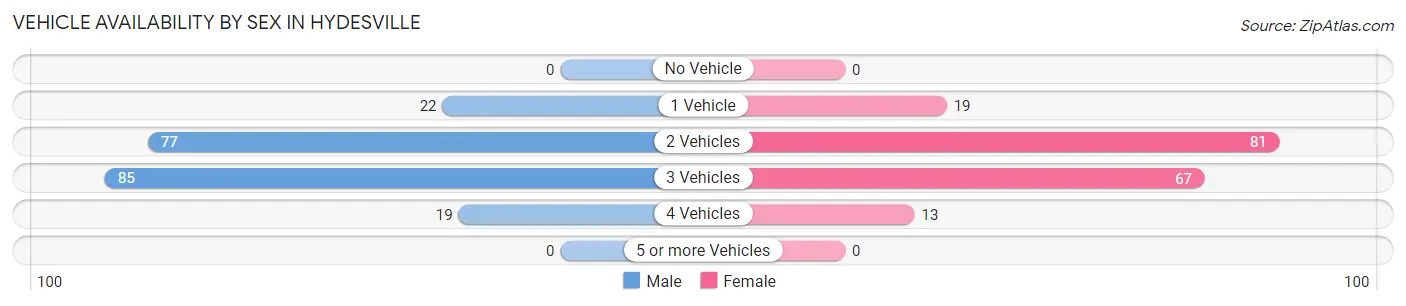
| Vehicles Available | Male | Female |
| No Vehicle | 0 (0.0%) | 0 (0.0%) |
| 1 Vehicle | 22 (10.8%) | 19 (10.6%) |
| 2 Vehicles | 77 (37.9%) | 81 (45.0%) |
| 3 Vehicles | 85 (41.9%) | 67 (37.2%) |
| 4 Vehicles | 19 (9.4%) | 13 (7.2%) |
| 5 or more Vehicles | 0 (0.0%) | 0 (0.0%) |
| Total | 203 (100.0%) | 180 (100.0%) |
Commute Time in Hydesville
The most frequently occuring commute durations in Hydesville are 60 to 89 minutes (70 commuters, 23.0%), 15 to 19 minutes (57 commuters, 18.8%), and 30 to 34 minutes (49 commuters, 16.1%).
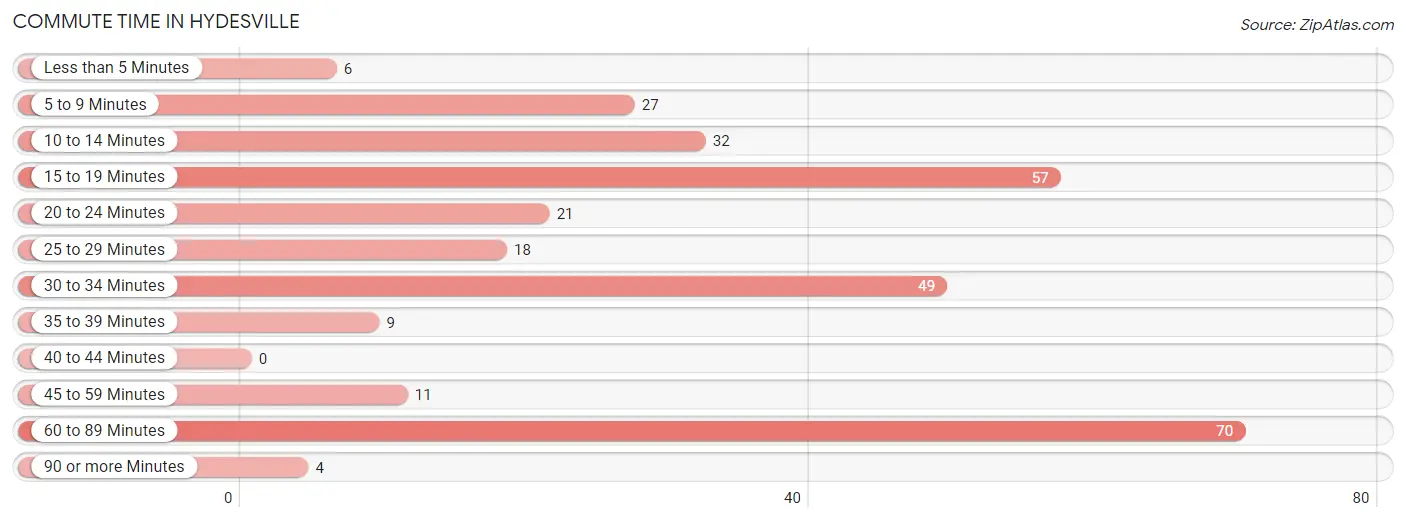
| Commute Time | # Commuters | % Commuters |
| Less than 5 Minutes | 6 | 2.0% |
| 5 to 9 Minutes | 27 | 8.9% |
| 10 to 14 Minutes | 32 | 10.5% |
| 15 to 19 Minutes | 57 | 18.8% |
| 20 to 24 Minutes | 21 | 6.9% |
| 25 to 29 Minutes | 18 | 5.9% |
| 30 to 34 Minutes | 49 | 16.1% |
| 35 to 39 Minutes | 9 | 3.0% |
| 40 to 44 Minutes | 0 | 0.0% |
| 45 to 59 Minutes | 11 | 3.6% |
| 60 to 89 Minutes | 70 | 23.0% |
| 90 or more Minutes | 4 | 1.3% |
Commute Time by Sex in Hydesville
The most common commute times in Hydesville are 60 to 89 minutes (49 commuters, 28.0%) for males and 30 to 34 minutes (41 commuters, 31.8%) for females.
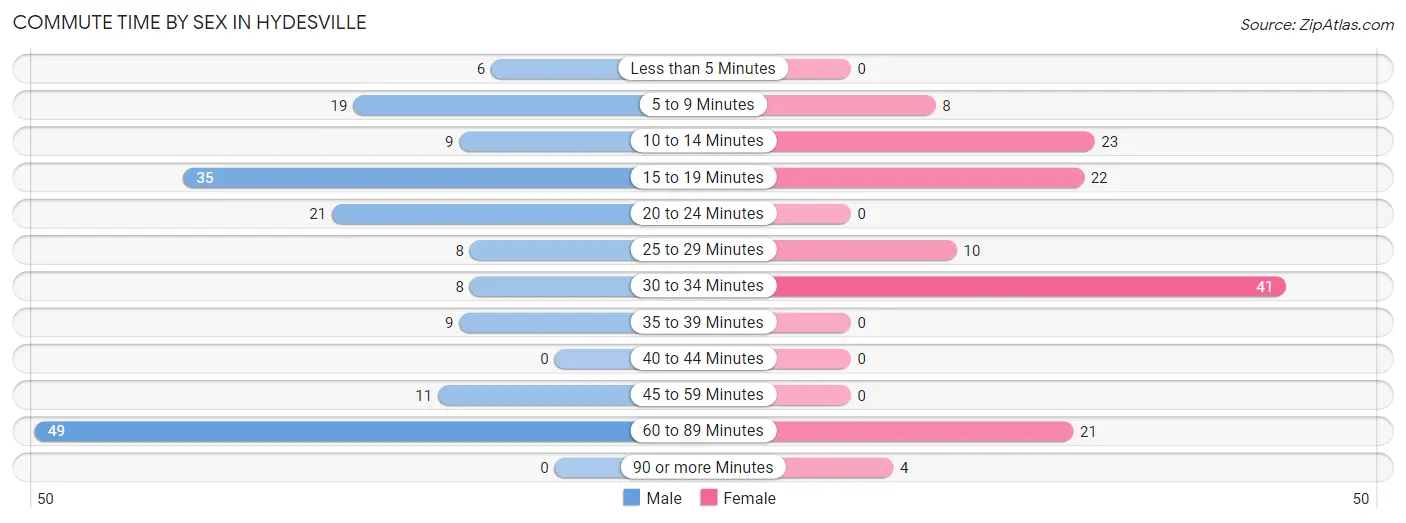
| Commute Time | Male | Female |
| Less than 5 Minutes | 6 (3.4%) | 0 (0.0%) |
| 5 to 9 Minutes | 19 (10.9%) | 8 (6.2%) |
| 10 to 14 Minutes | 9 (5.1%) | 23 (17.8%) |
| 15 to 19 Minutes | 35 (20.0%) | 22 (17.1%) |
| 20 to 24 Minutes | 21 (12.0%) | 0 (0.0%) |
| 25 to 29 Minutes | 8 (4.6%) | 10 (7.7%) |
| 30 to 34 Minutes | 8 (4.6%) | 41 (31.8%) |
| 35 to 39 Minutes | 9 (5.1%) | 0 (0.0%) |
| 40 to 44 Minutes | 0 (0.0%) | 0 (0.0%) |
| 45 to 59 Minutes | 11 (6.3%) | 0 (0.0%) |
| 60 to 89 Minutes | 49 (28.0%) | 21 (16.3%) |
| 90 or more Minutes | 0 (0.0%) | 4 (3.1%) |
Time of Departure to Work by Sex in Hydesville
The most frequent times of departure to work in Hydesville are 12:00 PM to 3:59 PM (35, 20.0%) for males and 7:00 AM to 7:29 AM (30, 23.3%) for females.
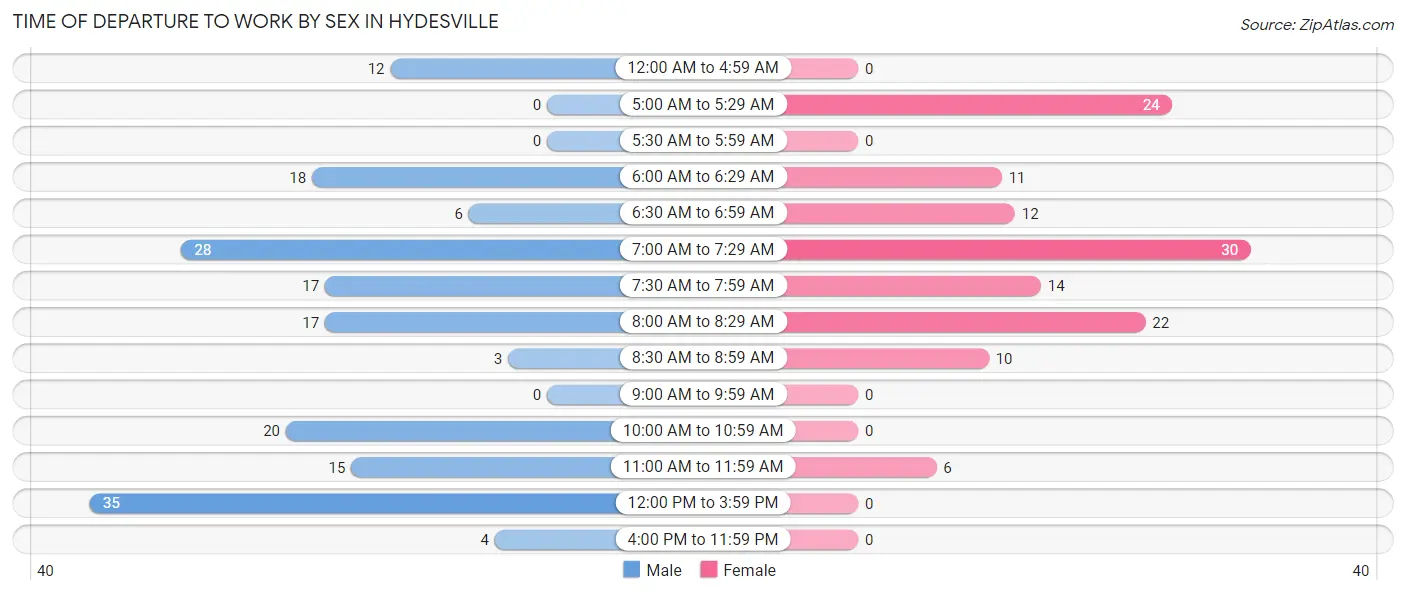
| Time of Departure | Male | Female |
| 12:00 AM to 4:59 AM | 12 (6.9%) | 0 (0.0%) |
| 5:00 AM to 5:29 AM | 0 (0.0%) | 24 (18.6%) |
| 5:30 AM to 5:59 AM | 0 (0.0%) | 0 (0.0%) |
| 6:00 AM to 6:29 AM | 18 (10.3%) | 11 (8.5%) |
| 6:30 AM to 6:59 AM | 6 (3.4%) | 12 (9.3%) |
| 7:00 AM to 7:29 AM | 28 (16.0%) | 30 (23.3%) |
| 7:30 AM to 7:59 AM | 17 (9.7%) | 14 (10.8%) |
| 8:00 AM to 8:29 AM | 17 (9.7%) | 22 (17.1%) |
| 8:30 AM to 8:59 AM | 3 (1.7%) | 10 (7.7%) |
| 9:00 AM to 9:59 AM | 0 (0.0%) | 0 (0.0%) |
| 10:00 AM to 10:59 AM | 20 (11.4%) | 0 (0.0%) |
| 11:00 AM to 11:59 AM | 15 (8.6%) | 6 (4.6%) |
| 12:00 PM to 3:59 PM | 35 (20.0%) | 0 (0.0%) |
| 4:00 PM to 11:59 PM | 4 (2.3%) | 0 (0.0%) |
| Total | 175 (100.0%) | 129 (100.0%) |
Housing Occupancy in Hydesville
Occupancy by Ownership in Hydesville
Of the total 446 dwellings in Hydesville, owner-occupied units account for 397 (89.0%), while renter-occupied units make up 49 (11.0%).
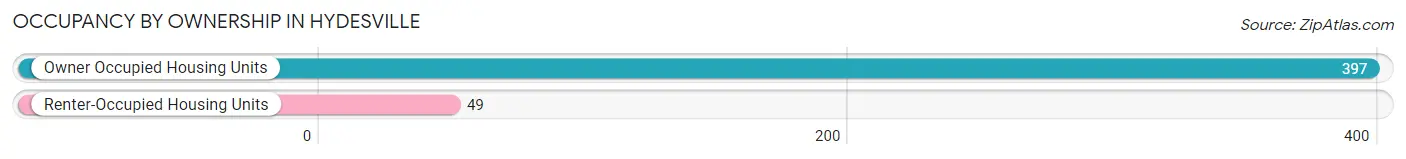
| Occupancy | # Housing Units | % Housing Units |
| Owner Occupied Housing Units | 397 | 89.0% |
| Renter-Occupied Housing Units | 49 | 11.0% |
| Total Occupied Housing Units | 446 | 100.0% |
Occupancy by Household Size in Hydesville
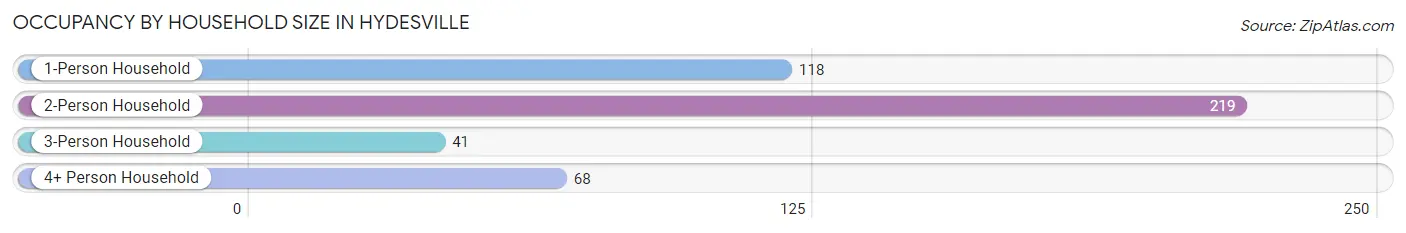
| Household Size | # Housing Units | % Housing Units |
| 1-Person Household | 118 | 26.5% |
| 2-Person Household | 219 | 49.1% |
| 3-Person Household | 41 | 9.2% |
| 4+ Person Household | 68 | 15.2% |
| Total Housing Units | 446 | 100.0% |
Occupancy by Ownership by Household Size in Hydesville
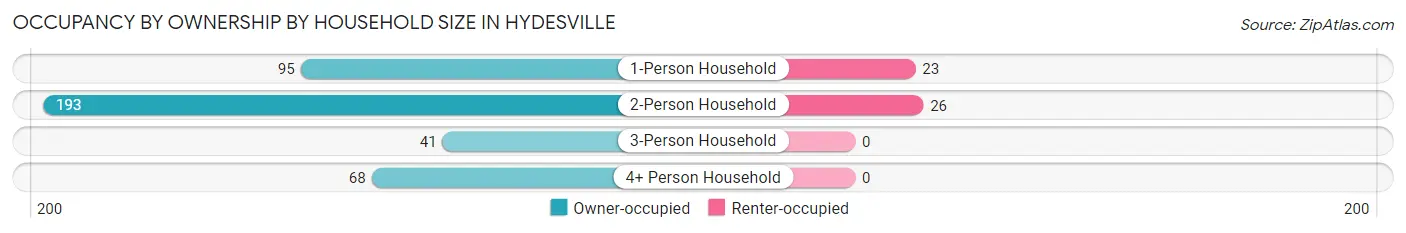
| Household Size | Owner-occupied | Renter-occupied |
| 1-Person Household | 95 (80.5%) | 23 (19.5%) |
| 2-Person Household | 193 (88.1%) | 26 (11.9%) |
| 3-Person Household | 41 (100.0%) | 0 (0.0%) |
| 4+ Person Household | 68 (100.0%) | 0 (0.0%) |
| Total Housing Units | 397 (89.0%) | 49 (11.0%) |
Occupancy by Educational Attainment in Hydesville
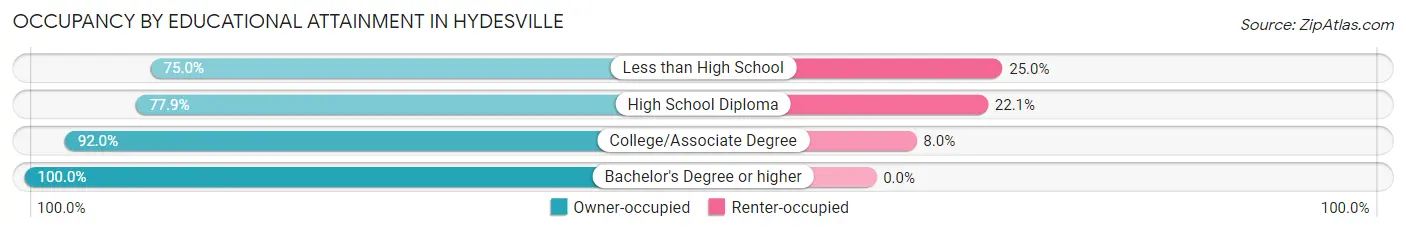
| Household Size | Owner-occupied | Renter-occupied |
| Less than High School | 9 (75.0%) | 3 (25.0%) |
| High School Diploma | 102 (77.9%) | 29 (22.1%) |
| College/Associate Degree | 196 (92.0%) | 17 (8.0%) |
| Bachelor's Degree or higher | 90 (100.0%) | 0 (0.0%) |
Occupancy by Age of Householder in Hydesville
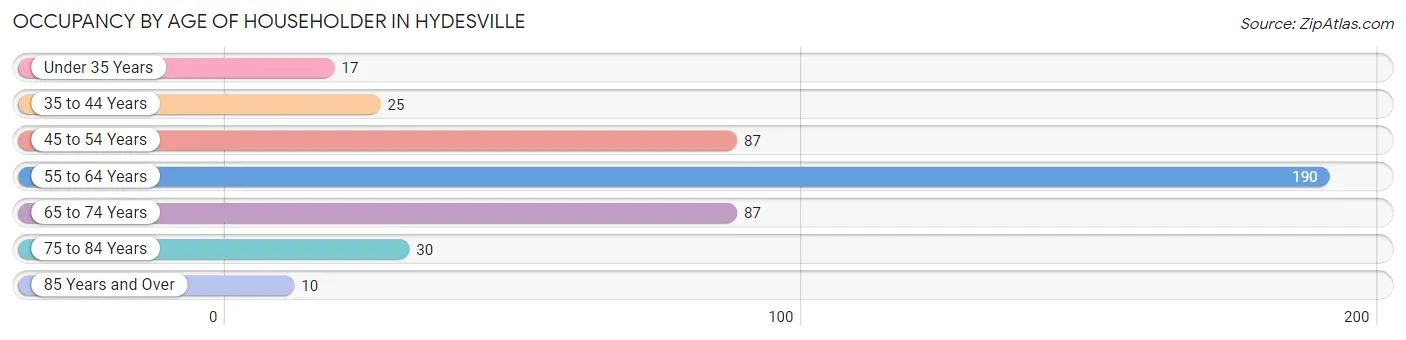
| Age Bracket | # Households | % Households |
| Under 35 Years | 17 | 3.8% |
| 35 to 44 Years | 25 | 5.6% |
| 45 to 54 Years | 87 | 19.5% |
| 55 to 64 Years | 190 | 42.6% |
| 65 to 74 Years | 87 | 19.5% |
| 75 to 84 Years | 30 | 6.7% |
| 85 Years and Over | 10 | 2.2% |
| Total | 446 | 100.0% |
Housing Finances in Hydesville
Median Income by Occupancy in Hydesville
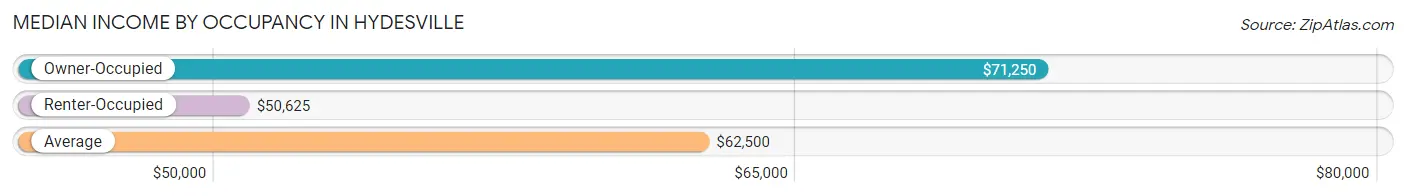
| Occupancy Type | # Households | Median Income |
| Owner-Occupied | 397 (89.0%) | $71,250 |
| Renter-Occupied | 49 (11.0%) | $50,625 |
| Average | 446 (100.0%) | $62,500 |
Occupancy by Householder Income Bracket in Hydesville
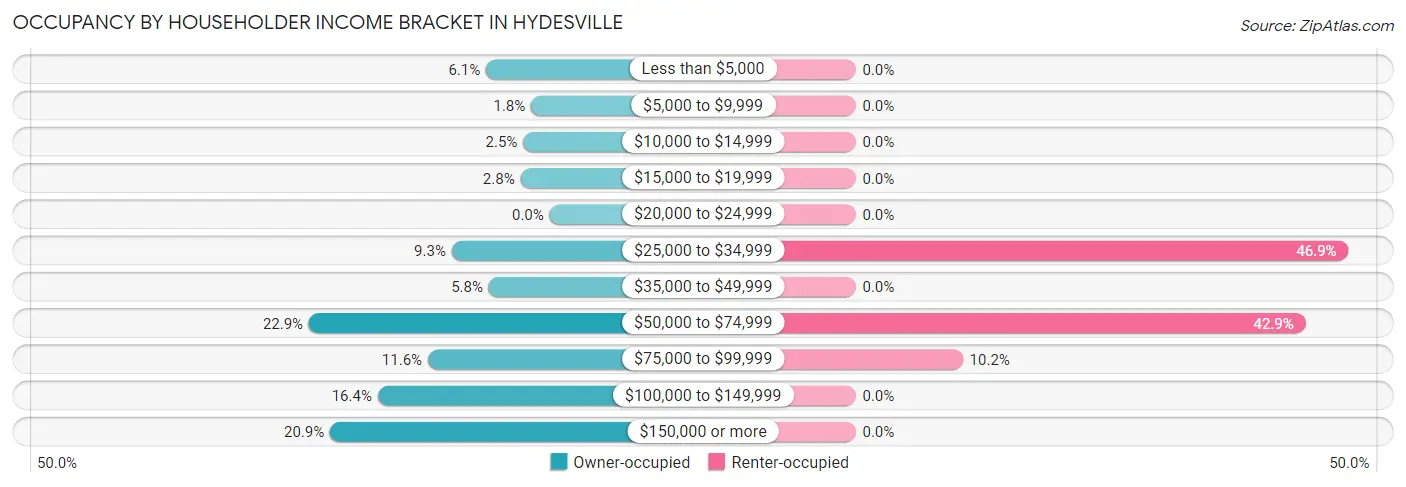
| Income Bracket | Owner-occupied | Renter-occupied |
| Less than $5,000 | 24 (6.0%) | 0 (0.0%) |
| $5,000 to $9,999 | 7 (1.8%) | 0 (0.0%) |
| $10,000 to $14,999 | 10 (2.5%) | 0 (0.0%) |
| $15,000 to $19,999 | 11 (2.8%) | 0 (0.0%) |
| $20,000 to $24,999 | 0 (0.0%) | 0 (0.0%) |
| $25,000 to $34,999 | 37 (9.3%) | 23 (46.9%) |
| $35,000 to $49,999 | 23 (5.8%) | 0 (0.0%) |
| $50,000 to $74,999 | 91 (22.9%) | 21 (42.9%) |
| $75,000 to $99,999 | 46 (11.6%) | 5 (10.2%) |
| $100,000 to $149,999 | 65 (16.4%) | 0 (0.0%) |
| $150,000 or more | 83 (20.9%) | 0 (0.0%) |
| Total | 397 (100.0%) | 49 (100.0%) |
Monthly Housing Cost Tiers in Hydesville
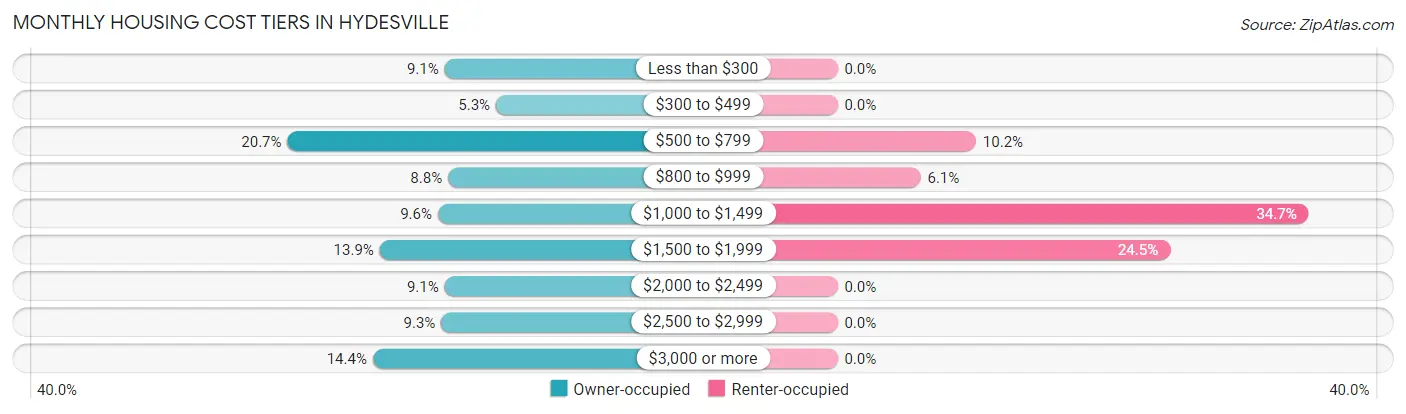
| Monthly Cost | Owner-occupied | Renter-occupied |
| Less than $300 | 36 (9.1%) | 0 (0.0%) |
| $300 to $499 | 21 (5.3%) | 0 (0.0%) |
| $500 to $799 | 82 (20.6%) | 5 (10.2%) |
| $800 to $999 | 35 (8.8%) | 3 (6.1%) |
| $1,000 to $1,499 | 38 (9.6%) | 17 (34.7%) |
| $1,500 to $1,999 | 55 (13.9%) | 12 (24.5%) |
| $2,000 to $2,499 | 36 (9.1%) | 0 (0.0%) |
| $2,500 to $2,999 | 37 (9.3%) | 0 (0.0%) |
| $3,000 or more | 57 (14.4%) | 0 (0.0%) |
| Total | 397 (100.0%) | 49 (100.0%) |
Physical Housing Characteristics in Hydesville
Housing Structures in Hydesville
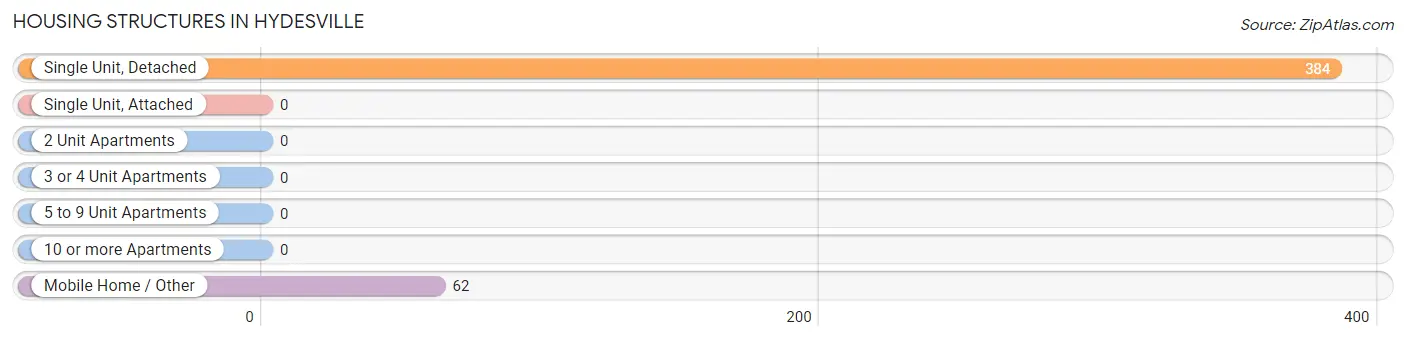
| Structure Type | # Housing Units | % Housing Units |
| Single Unit, Detached | 384 | 86.1% |
| Single Unit, Attached | 0 | 0.0% |
| 2 Unit Apartments | 0 | 0.0% |
| 3 or 4 Unit Apartments | 0 | 0.0% |
| 5 to 9 Unit Apartments | 0 | 0.0% |
| 10 or more Apartments | 0 | 0.0% |
| Mobile Home / Other | 62 | 13.9% |
| Total | 446 | 100.0% |
Housing Structures by Occupancy in Hydesville
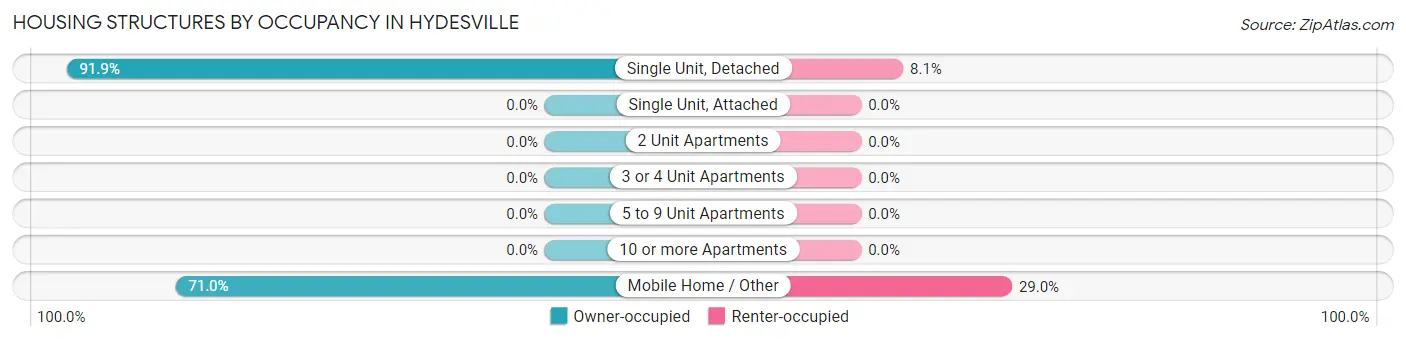
| Structure Type | Owner-occupied | Renter-occupied |
| Single Unit, Detached | 353 (91.9%) | 31 (8.1%) |
| Single Unit, Attached | 0 (0.0%) | 0 (0.0%) |
| 2 Unit Apartments | 0 (0.0%) | 0 (0.0%) |
| 3 or 4 Unit Apartments | 0 (0.0%) | 0 (0.0%) |
| 5 to 9 Unit Apartments | 0 (0.0%) | 0 (0.0%) |
| 10 or more Apartments | 0 (0.0%) | 0 (0.0%) |
| Mobile Home / Other | 44 (71.0%) | 18 (29.0%) |
| Total | 397 (89.0%) | 49 (11.0%) |
Housing Structures by Number of Rooms in Hydesville
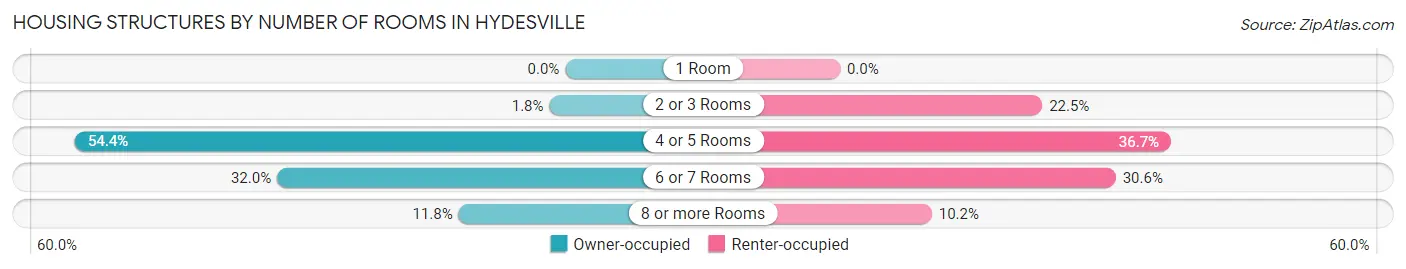
| Number of Rooms | Owner-occupied | Renter-occupied |
| 1 Room | 0 (0.0%) | 0 (0.0%) |
| 2 or 3 Rooms | 7 (1.8%) | 11 (22.5%) |
| 4 or 5 Rooms | 216 (54.4%) | 18 (36.7%) |
| 6 or 7 Rooms | 127 (32.0%) | 15 (30.6%) |
| 8 or more Rooms | 47 (11.8%) | 5 (10.2%) |
| Total | 397 (100.0%) | 49 (100.0%) |
Housing Structure by Heating Type in Hydesville
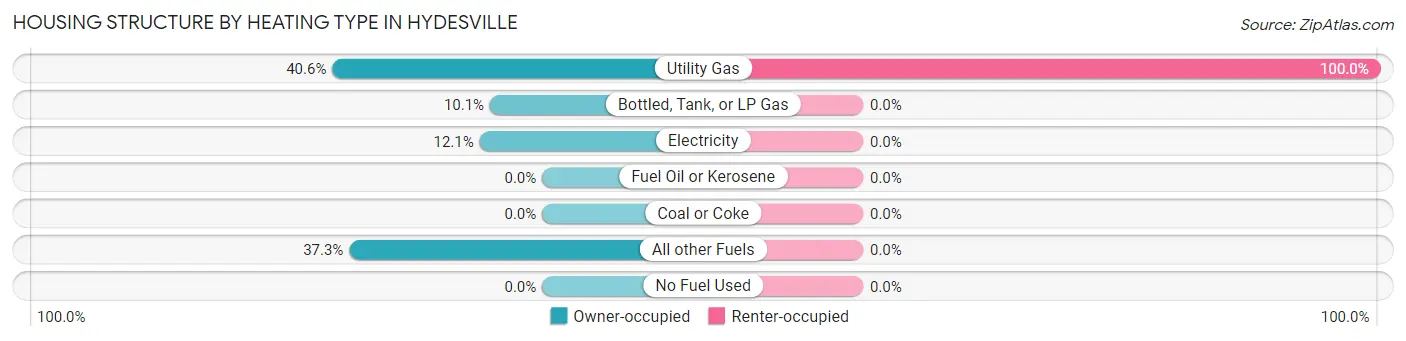
| Heating Type | Owner-occupied | Renter-occupied |
| Utility Gas | 161 (40.6%) | 49 (100.0%) |
| Bottled, Tank, or LP Gas | 40 (10.1%) | 0 (0.0%) |
| Electricity | 48 (12.1%) | 0 (0.0%) |
| Fuel Oil or Kerosene | 0 (0.0%) | 0 (0.0%) |
| Coal or Coke | 0 (0.0%) | 0 (0.0%) |
| All other Fuels | 148 (37.3%) | 0 (0.0%) |
| No Fuel Used | 0 (0.0%) | 0 (0.0%) |
| Total | 397 (100.0%) | 49 (100.0%) |
Household Vehicle Usage in Hydesville
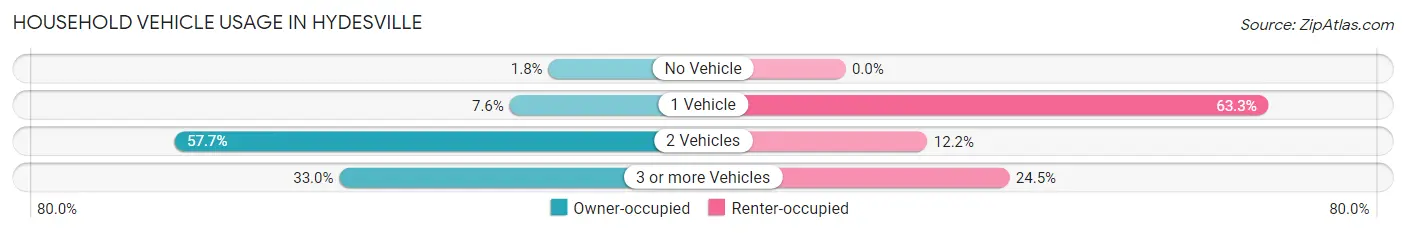
| Vehicles per Household | Owner-occupied | Renter-occupied |
| No Vehicle | 7 (1.8%) | 0 (0.0%) |
| 1 Vehicle | 30 (7.6%) | 31 (63.3%) |
| 2 Vehicles | 229 (57.7%) | 6 (12.2%) |
| 3 or more Vehicles | 131 (33.0%) | 12 (24.5%) |
| Total | 397 (100.0%) | 49 (100.0%) |
Real Estate & Mortgages in Hydesville
Real Estate and Mortgage Overview in Hydesville
| Characteristic | Without Mortgage | With Mortgage |
| Housing Units | 165 | 232 |
| Median Property Value | $513,300 | $472,200 |
| Median Household Income | $58,068 | $70 |
| Monthly Housing Costs | $564 | $57 |
| Real Estate Taxes | $2,656 | $0 |
Property Value by Mortgage Status in Hydesville
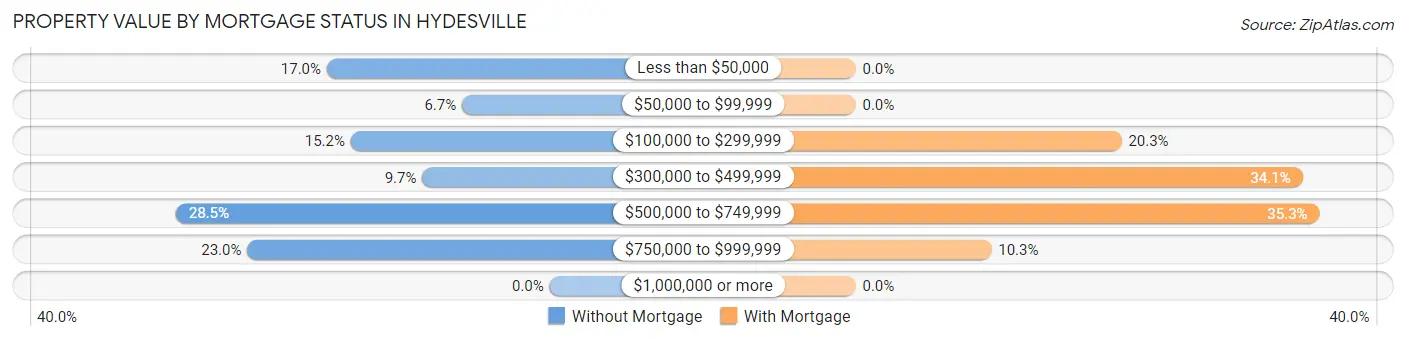
| Property Value | Without Mortgage | With Mortgage |
| Less than $50,000 | 28 (17.0%) | 0 (0.0%) |
| $50,000 to $99,999 | 11 (6.7%) | 0 (0.0%) |
| $100,000 to $299,999 | 25 (15.1%) | 47 (20.3%) |
| $300,000 to $499,999 | 16 (9.7%) | 79 (34.1%) |
| $500,000 to $749,999 | 47 (28.5%) | 82 (35.3%) |
| $750,000 to $999,999 | 38 (23.0%) | 24 (10.3%) |
| $1,000,000 or more | 0 (0.0%) | 0 (0.0%) |
| Total | 165 (100.0%) | 232 (100.0%) |
Household Income by Mortgage Status in Hydesville
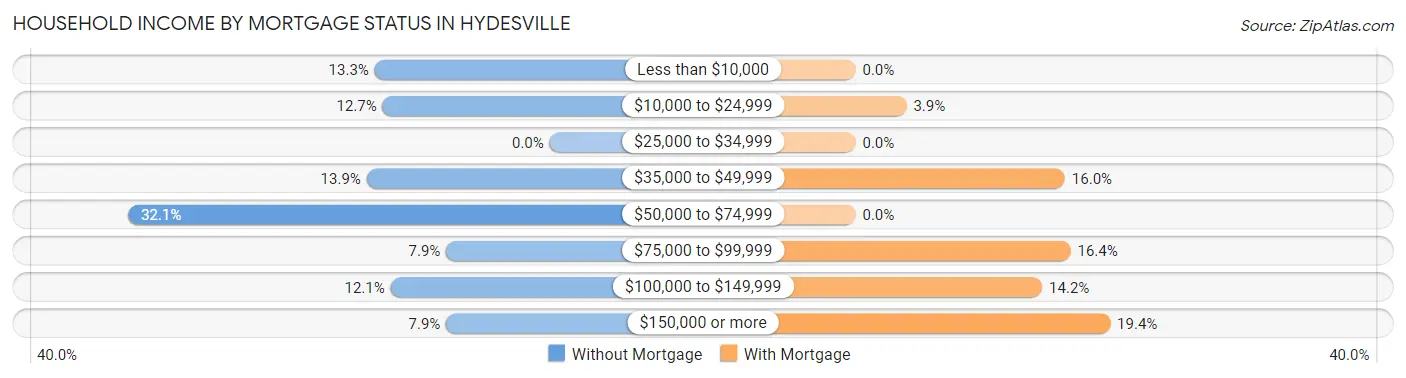
| Household Income | Without Mortgage | With Mortgage |
| Less than $10,000 | 22 (13.3%) | 0 (0.0%) |
| $10,000 to $24,999 | 21 (12.7%) | 9 (3.9%) |
| $25,000 to $34,999 | 0 (0.0%) | 0 (0.0%) |
| $35,000 to $49,999 | 23 (13.9%) | 37 (16.0%) |
| $50,000 to $74,999 | 53 (32.1%) | 0 (0.0%) |
| $75,000 to $99,999 | 13 (7.9%) | 38 (16.4%) |
| $100,000 to $149,999 | 20 (12.1%) | 33 (14.2%) |
| $150,000 or more | 13 (7.9%) | 45 (19.4%) |
| Total | 165 (100.0%) | 232 (100.0%) |
Property Value to Household Income Ratio in Hydesville
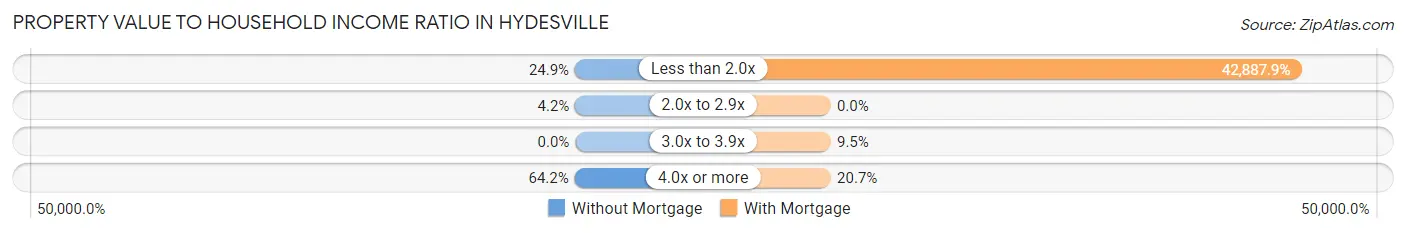
| Value-to-Income Ratio | Without Mortgage | With Mortgage |
| Less than 2.0x | 41 (24.8%) | 99,500 (42,887.9%) |
| 2.0x to 2.9x | 7 (4.2%) | 0 (0.0%) |
| 3.0x to 3.9x | 0 (0.0%) | 22 (9.5%) |
| 4.0x or more | 106 (64.2%) | 48 (20.7%) |
| Total | 165 (100.0%) | 232 (100.0%) |
Real Estate Taxes by Mortgage Status in Hydesville
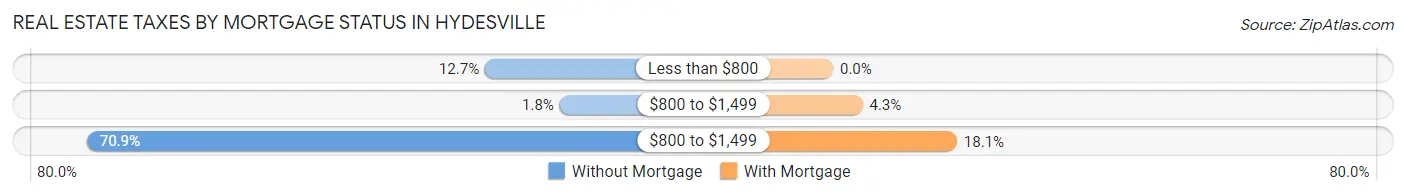
| Property Taxes | Without Mortgage | With Mortgage |
| Less than $800 | 21 (12.7%) | 0 (0.0%) |
| $800 to $1,499 | 3 (1.8%) | 10 (4.3%) |
| $800 to $1,499 | 117 (70.9%) | 42 (18.1%) |
| Total | 165 (100.0%) | 232 (100.0%) |
Health & Disability in Hydesville
Health Insurance Coverage by Age in Hydesville
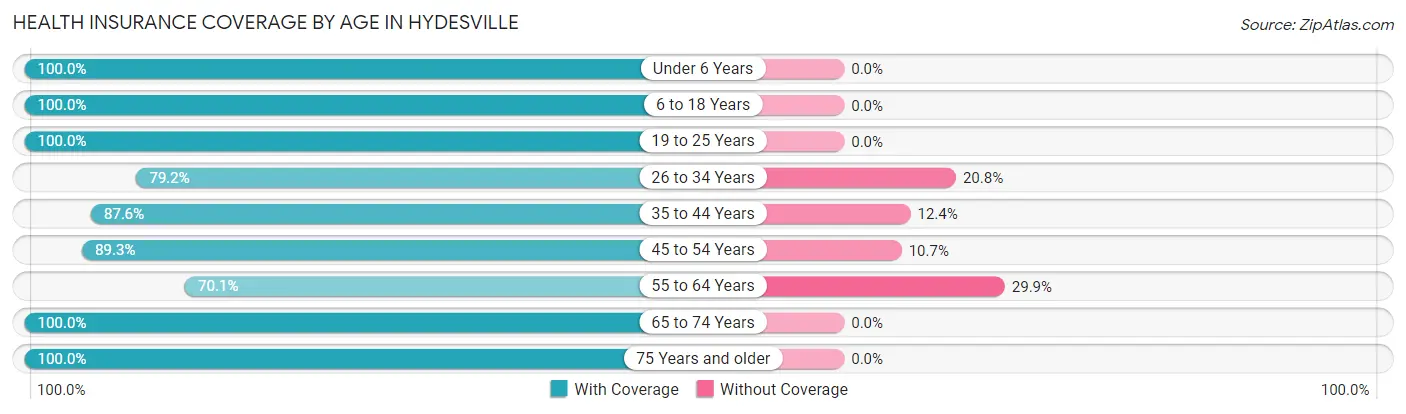
| Age Bracket | With Coverage | Without Coverage |
| Under 6 Years | 25 (100.0%) | 0 (0.0%) |
| 6 to 18 Years | 126 (100.0%) | 0 (0.0%) |
| 19 to 25 Years | 28 (100.0%) | 0 (0.0%) |
| 26 to 34 Years | 38 (79.2%) | 10 (20.8%) |
| 35 to 44 Years | 78 (87.6%) | 11 (12.4%) |
| 45 to 54 Years | 150 (89.3%) | 18 (10.7%) |
| 55 to 64 Years | 220 (70.1%) | 94 (29.9%) |
| 65 to 74 Years | 202 (100.0%) | 0 (0.0%) |
| 75 Years and older | 60 (100.0%) | 0 (0.0%) |
| Total | 927 (87.5%) | 133 (12.6%) |
Health Insurance Coverage by Citizenship Status in Hydesville
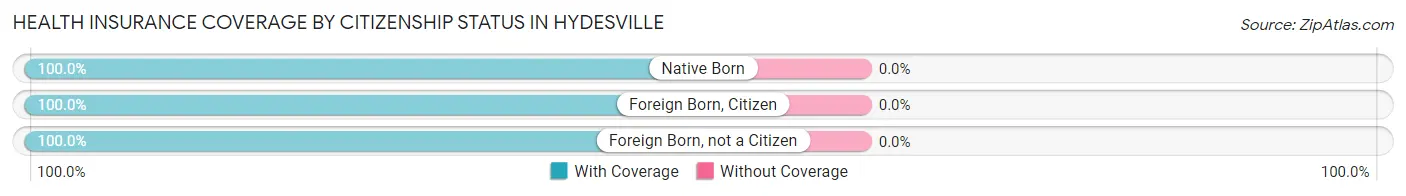
| Citizenship Status | With Coverage | Without Coverage |
| Native Born | 25 (100.0%) | 0 (0.0%) |
| Foreign Born, Citizen | 126 (100.0%) | 0 (0.0%) |
| Foreign Born, not a Citizen | 28 (100.0%) | 0 (0.0%) |
Health Insurance Coverage by Household Income in Hydesville
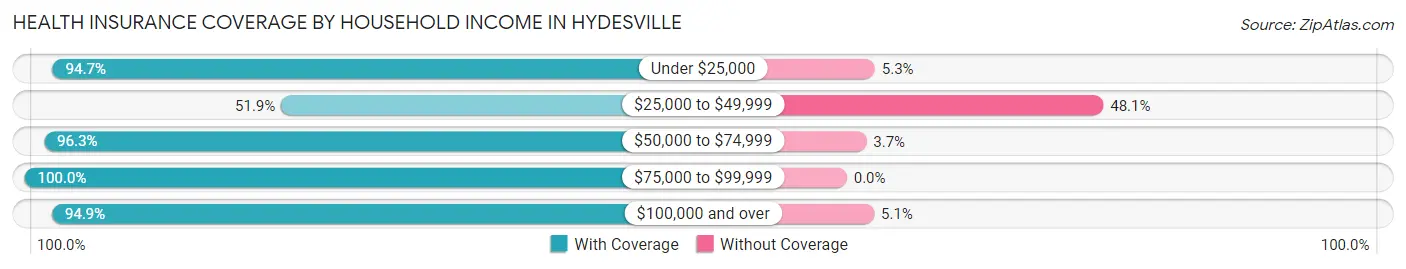
| Household Income | With Coverage | Without Coverage |
| Under $25,000 | 72 (94.7%) | 4 (5.3%) |
| $25,000 to $49,999 | 107 (51.9%) | 99 (48.1%) |
| $50,000 to $74,999 | 236 (96.3%) | 9 (3.7%) |
| $75,000 to $99,999 | 120 (100.0%) | 0 (0.0%) |
| $100,000 and over | 390 (94.9%) | 21 (5.1%) |
Public vs Private Health Insurance Coverage by Age in Hydesville
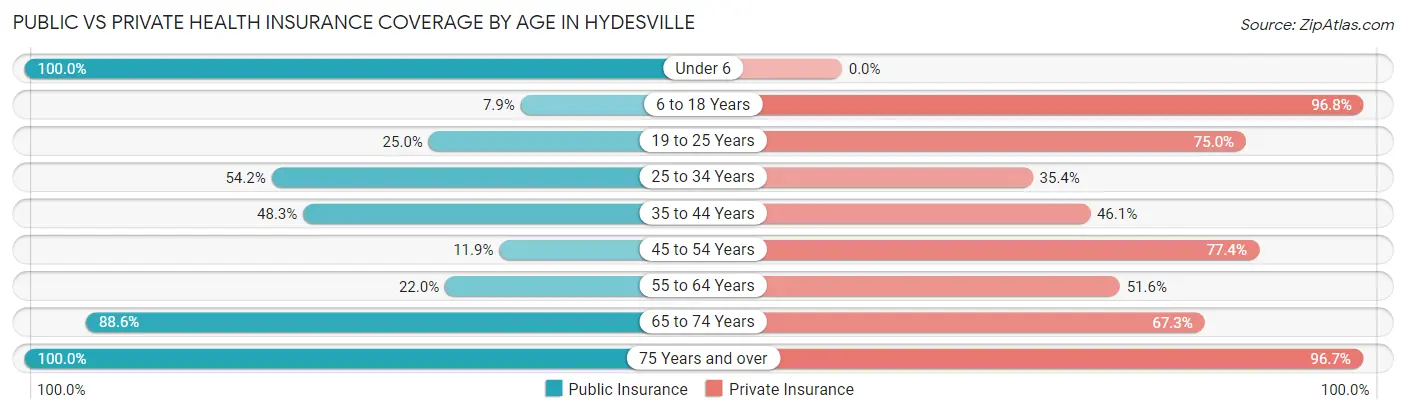
| Age Bracket | Public Insurance | Private Insurance |
| Under 6 | 25 (100.0%) | 0 (0.0%) |
| 6 to 18 Years | 10 (7.9%) | 122 (96.8%) |
| 19 to 25 Years | 7 (25.0%) | 21 (75.0%) |
| 25 to 34 Years | 26 (54.2%) | 17 (35.4%) |
| 35 to 44 Years | 43 (48.3%) | 41 (46.1%) |
| 45 to 54 Years | 20 (11.9%) | 130 (77.4%) |
| 55 to 64 Years | 69 (22.0%) | 162 (51.6%) |
| 65 to 74 Years | 179 (88.6%) | 136 (67.3%) |
| 75 Years and over | 60 (100.0%) | 58 (96.7%) |
| Total | 439 (41.4%) | 687 (64.8%) |
Disability Status by Sex by Age in Hydesville
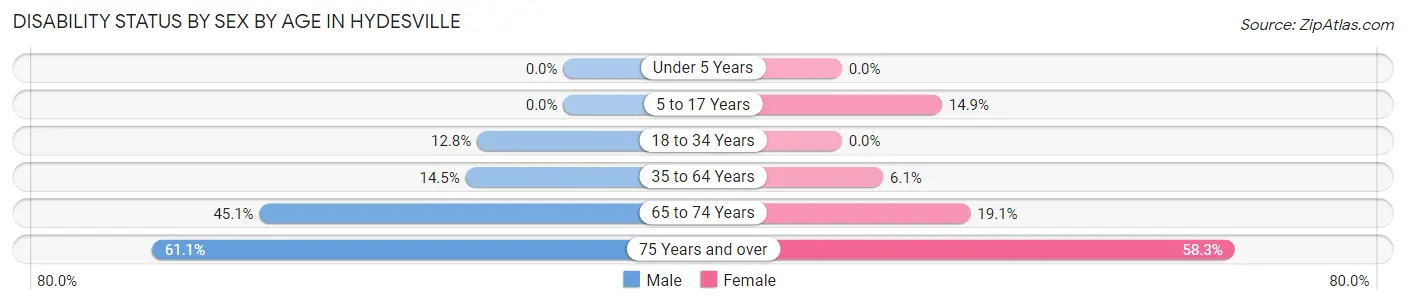
| Age Bracket | Male | Female |
| Under 5 Years | 0 (0.0%) | 0 (0.0%) |
| 5 to 17 Years | 0 (0.0%) | 11 (14.9%) |
| 18 to 34 Years | 5 (12.8%) | 0 (0.0%) |
| 35 to 64 Years | 45 (14.5%) | 16 (6.1%) |
| 65 to 74 Years | 51 (45.1%) | 17 (19.1%) |
| 75 Years and over | 22 (61.1%) | 14 (58.3%) |
Disability Class by Sex by Age in Hydesville
Disability Class: Hearing Difficulty
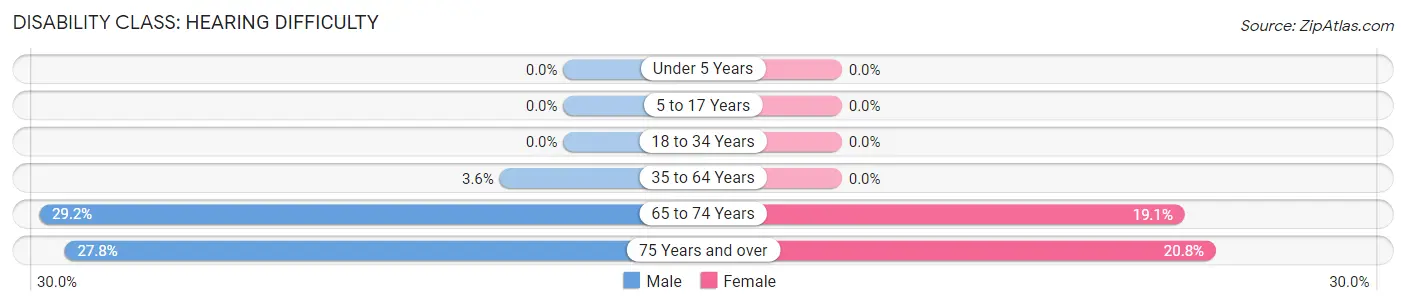
| Age Bracket | Male | Female |
| Under 5 Years | 0 (0.0%) | 0 (0.0%) |
| 5 to 17 Years | 0 (0.0%) | 0 (0.0%) |
| 18 to 34 Years | 0 (0.0%) | 0 (0.0%) |
| 35 to 64 Years | 11 (3.5%) | 0 (0.0%) |
| 65 to 74 Years | 33 (29.2%) | 17 (19.1%) |
| 75 Years and over | 10 (27.8%) | 5 (20.8%) |
Disability Class: Vision Difficulty
| Age Bracket | Male | Female |
| Under 5 Years | 0 (0.0%) | 0 (0.0%) |
| 5 to 17 Years | 0 (0.0%) | 0 (0.0%) |
| 18 to 34 Years | 0 (0.0%) | 0 (0.0%) |
| 35 to 64 Years | 0 (0.0%) | 0 (0.0%) |
| 65 to 74 Years | 0 (0.0%) | 0 (0.0%) |
| 75 Years and over | 0 (0.0%) | 0 (0.0%) |
Disability Class: Cognitive Difficulty
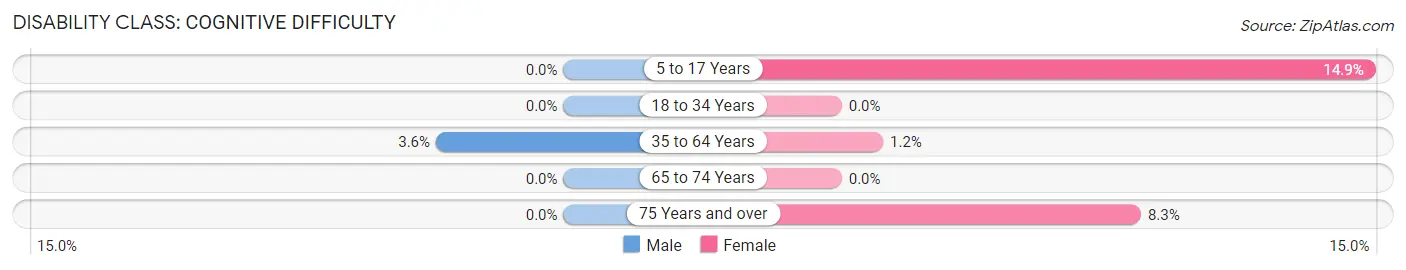
| Age Bracket | Male | Female |
| 5 to 17 Years | 0 (0.0%) | 11 (14.9%) |
| 18 to 34 Years | 0 (0.0%) | 0 (0.0%) |
| 35 to 64 Years | 11 (3.5%) | 3 (1.1%) |
| 65 to 74 Years | 0 (0.0%) | 0 (0.0%) |
| 75 Years and over | 0 (0.0%) | 2 (8.3%) |
Disability Class: Ambulatory Difficulty
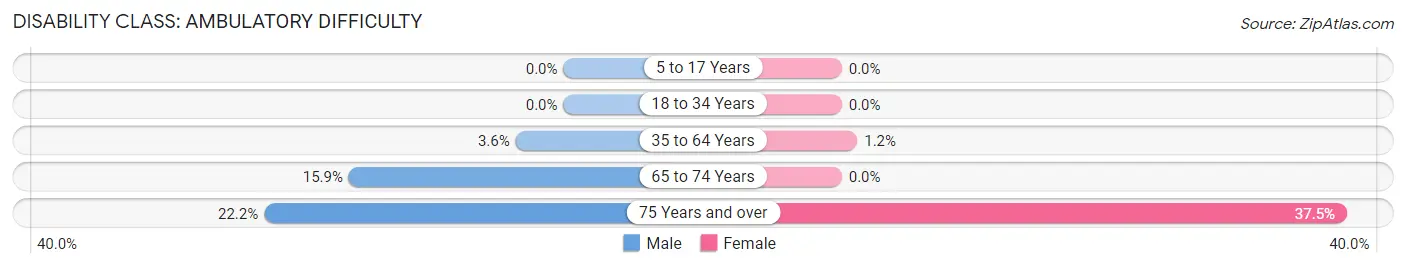
| Age Bracket | Male | Female |
| 5 to 17 Years | 0 (0.0%) | 0 (0.0%) |
| 18 to 34 Years | 0 (0.0%) | 0 (0.0%) |
| 35 to 64 Years | 11 (3.5%) | 3 (1.1%) |
| 65 to 74 Years | 18 (15.9%) | 0 (0.0%) |
| 75 Years and over | 8 (22.2%) | 9 (37.5%) |
Disability Class: Self-Care Difficulty
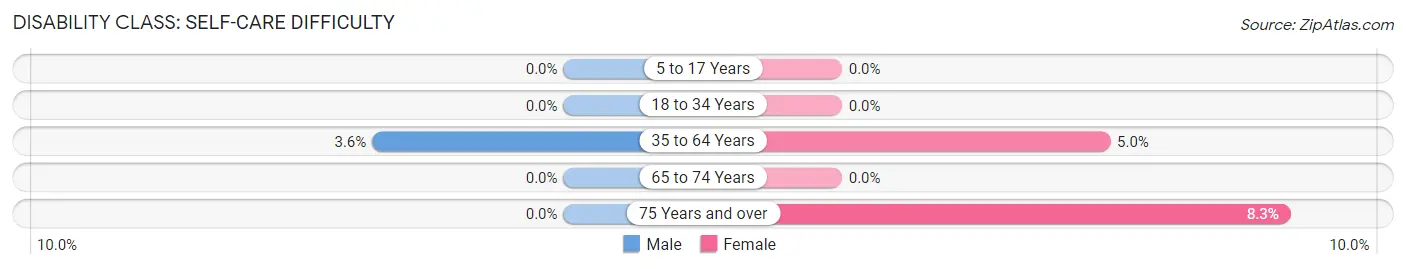
| Age Bracket | Male | Female |
| 5 to 17 Years | 0 (0.0%) | 0 (0.0%) |
| 18 to 34 Years | 0 (0.0%) | 0 (0.0%) |
| 35 to 64 Years | 11 (3.5%) | 13 (5.0%) |
| 65 to 74 Years | 0 (0.0%) | 0 (0.0%) |
| 75 Years and over | 0 (0.0%) | 2 (8.3%) |
Technology Access in Hydesville
Computing Device Access in Hydesville
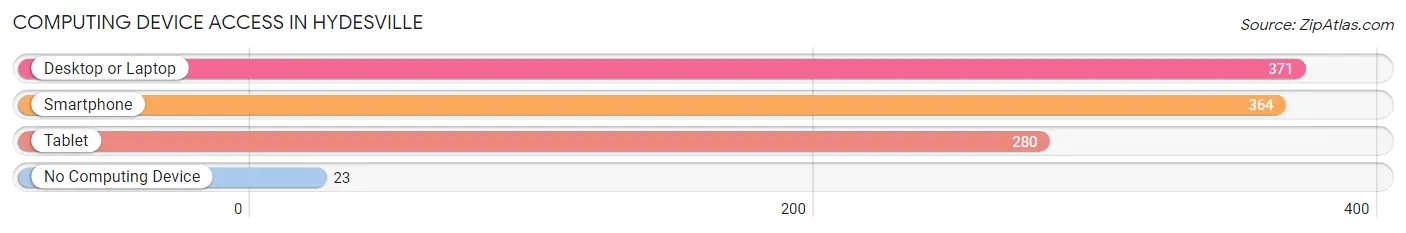
| Device Type | # Households | % Households |
| Desktop or Laptop | 371 | 83.2% |
| Smartphone | 364 | 81.6% |
| Tablet | 280 | 62.8% |
| No Computing Device | 23 | 5.2% |
| Total | 446 | 100.0% |
Internet Access in Hydesville
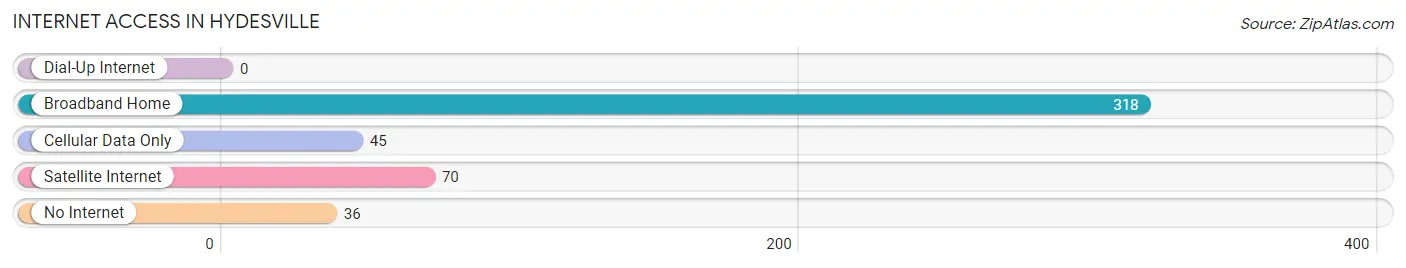
| Internet Type | # Households | % Households |
| Dial-Up Internet | 0 | 0.0% |
| Broadband Home | 318 | 71.3% |
| Cellular Data Only | 45 | 10.1% |
| Satellite Internet | 70 | 15.7% |
| No Internet | 36 | 8.1% |
| Total | 446 | 100.0% |
Hydesville Summary
Hydesville is a small unincorporated community located in Humboldt County, California. It is situated on the banks of the Eel River, approximately 10 miles (16 km) south of Eureka. The population of Hydesville was estimated to be around 1,000 in 2020.
History
Hydesville was founded in 1853 by William and Mary Hydes, who were among the first settlers in the area. The Hydes were originally from Ohio and had moved to California in search of gold. They eventually settled in Hydesville, where they built a sawmill and a flour mill. The town was named after the Hydes and was incorporated in 1858.
The town grew rapidly in the late 19th century, with the construction of a railroad line connecting Hydesville to Eureka. This allowed the town to become a major shipping center for the surrounding area. The railroad also brought in new settlers, and the population of Hydesville grew to over 1,000 by the early 20th century.
Geography
Hydesville is located in Humboldt County, California, on the banks of the Eel River. The town is situated at an elevation of approximately 200 feet (61 m) above sea level. The climate in Hydesville is mild and temperate, with average temperatures ranging from 40 to 70 degrees Fahrenheit (4 to 21 degrees Celsius).
The town is surrounded by a variety of natural features, including the Eel River, the Eel River Valley, and the nearby Coast Range Mountains. The nearby Eel River provides a variety of recreational activities, including fishing, swimming, and boating.
Economy
The economy of Hydesville is largely based on agriculture and timber. The town is home to several farms, which produce a variety of crops, including apples, pears, and berries. The nearby Eel River Valley is also home to a number of timber companies, which harvest and process timber for use in construction and other industries.
In addition to agriculture and timber, Hydesville is also home to a number of small businesses, including restaurants, shops, and other services. The town is also home to a number of tourist attractions, including the Eel River Valley Museum and the Hydesville Historical Society.
Demographics
The population of Hydesville was estimated to be around 1,000 in 2020. The town is predominantly white, with approximately 90% of the population identifying as Caucasian. The remaining 10% of the population is made up of a variety of other ethnicities, including Hispanic, African American, and Asian.
The median household income in Hydesville is approximately $50,000, which is slightly lower than the national average. The town has a relatively low unemployment rate, with only 4.2% of the population unemployed in 2020. The poverty rate in Hydesville is also relatively low, with only 8.3% of the population living below the poverty line.
Common Questions
What is Per Capita Income in Hydesville?
Per Capita income in Hydesville is $39,371.
What is the Median Family Income in Hydesville?
Median Family Income in Hydesville is $87,500.
What is the Median Household income in Hydesville?
Median Household Income in Hydesville is $62,500.
What is Inequality or Gini Index in Hydesville?
Inequality or Gini Index in Hydesville is 0.43.
What is the Total Population of Hydesville?
Total Population of Hydesville is 1,060.
What is the Total Male Population of Hydesville?
Total Male Population of Hydesville is 563.
What is the Total Female Population of Hydesville?
Total Female Population of Hydesville is 497.
What is the Ratio of Males per 100 Females in Hydesville?
There are 113.28 Males per 100 Females in Hydesville.
What is the Ratio of Females per 100 Males in Hydesville?
There are 88.28 Females per 100 Males in Hydesville.
What is the Median Population Age in Hydesville?
Median Population Age in Hydesville is 58.0 Years.
What is the Average Family Size in Hydesville
Average Family Size in Hydesville is 2.8 People.
What is the Average Household Size in Hydesville
Average Household Size in Hydesville is 2.4 People.
How Large is the Labor Force in Hydesville?
There are 394 People in the Labor Forcein in Hydesville.
What is the Percentage of People in the Labor Force in Hydesville?
42.3% of People are in the Labor Force in Hydesville.