Homeland, CA Map & Demographics
Homeland Map
Homeland Overview
$23,301
PER CAPITA INCOME
$56,413
AVG FAMILY INCOME
$55,467
AVG HOUSEHOLD INCOME
37.2%
WAGE / INCOME GAP [ % ]
62.8¢/ $1
WAGE / INCOME GAP [ $ ]
0.36
INEQUALITY / GINI INDEX
6,221
TOTAL POPULATION
3,099
MALE POPULATION
3,122
FEMALE POPULATION
99.26
MALES / 100 FEMALES
100.74
FEMALES / 100 MALES
33.2
MEDIAN AGE
3.8
AVG FAMILY SIZE
3.0
AVG HOUSEHOLD SIZE
2,565
LABOR FORCE [ PEOPLE ]
53.4%
PERCENT IN LABOR FORCE
10.8%
UNEMPLOYMENT RATE
Homeland Zip Codes
Homeland Area Codes
Income in Homeland
Income Overview in Homeland
Per Capita Income in Homeland is $23,301, while median incomes of families and households are $56,413 and $55,467 respectively.
| Characteristic | Number | Measure |
| Per Capita Income | 6,221 | $23,301 |
| Median Family Income | 1,312 | $56,413 |
| Mean Family Income | 1,312 | $73,827 |
| Median Household Income | 2,083 | $55,467 |
| Mean Household Income | 2,083 | $67,168 |
| Income Deficit | 1,312 | $0 |
| Wage / Income Gap (%) | 6,221 | 37.19% |
| Wage / Income Gap ($) | 6,221 | 62.81¢ per $1 |
| Gini / Inequality Index | 6,221 | 0.36 |
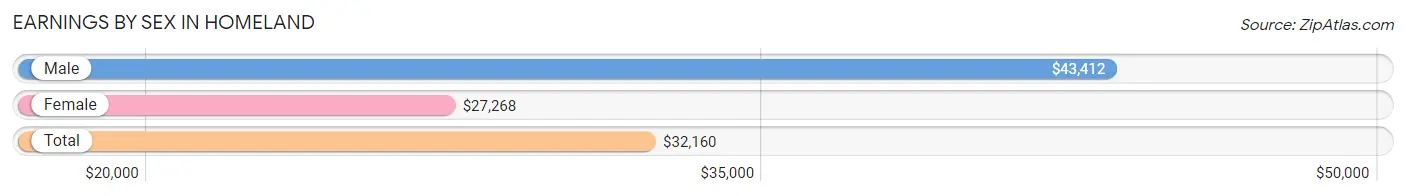
Earnings by Sex in Homeland
Average Earnings in Homeland are $32,160, $43,412 for men and $27,268 for women, a difference of 37.2%.
| Sex | Number | Average Earnings |
| Male | 1,322 (52.6%) | $43,412 |
| Female | 1,191 (47.4%) | $27,268 |
| Total | 2,513 (100.0%) | $32,160 |
Earnings by Sex by Income Bracket in Homeland
The most common earnings brackets in Homeland are $20,000 to $22,499 for men (209 | 15.8%) and $30,000 to $34,999 for women (305 | 25.6%).
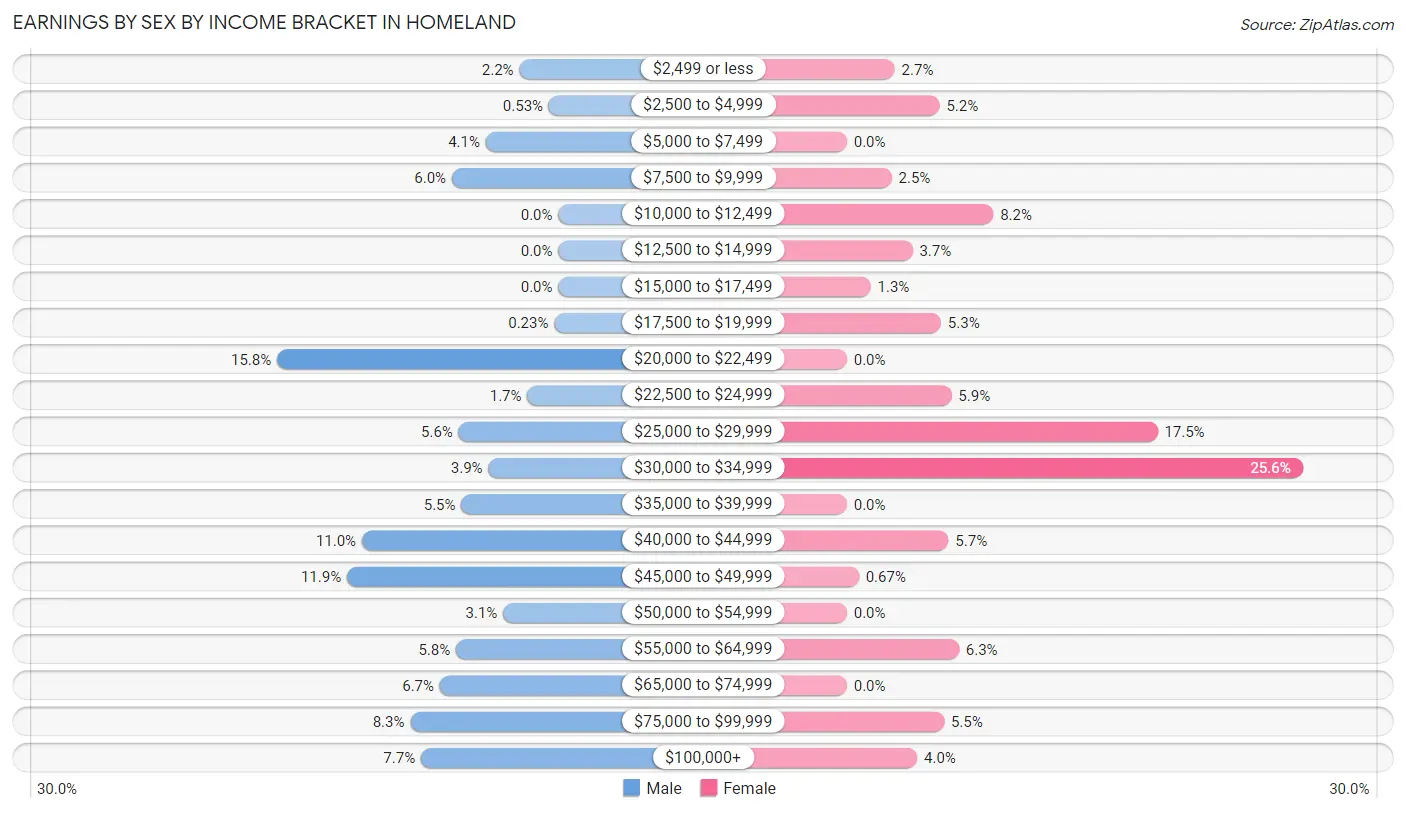
| Income | Male | Female |
| $2,499 or less | 29 (2.2%) | 32 (2.7%) |
| $2,500 to $4,999 | 7 (0.5%) | 62 (5.2%) |
| $5,000 to $7,499 | 54 (4.1%) | 0 (0.0%) |
| $7,500 to $9,999 | 79 (6.0%) | 30 (2.5%) |
| $10,000 to $12,499 | 0 (0.0%) | 98 (8.2%) |
| $12,500 to $14,999 | 0 (0.0%) | 44 (3.7%) |
| $15,000 to $17,499 | 0 (0.0%) | 16 (1.3%) |
| $17,500 to $19,999 | 3 (0.2%) | 63 (5.3%) |
| $20,000 to $22,499 | 209 (15.8%) | 0 (0.0%) |
| $22,500 to $24,999 | 23 (1.7%) | 70 (5.9%) |
| $25,000 to $29,999 | 74 (5.6%) | 208 (17.5%) |
| $30,000 to $34,999 | 52 (3.9%) | 305 (25.6%) |
| $35,000 to $39,999 | 72 (5.4%) | 0 (0.0%) |
| $40,000 to $44,999 | 146 (11.0%) | 68 (5.7%) |
| $45,000 to $49,999 | 157 (11.9%) | 8 (0.7%) |
| $50,000 to $54,999 | 41 (3.1%) | 0 (0.0%) |
| $55,000 to $64,999 | 76 (5.8%) | 75 (6.3%) |
| $65,000 to $74,999 | 88 (6.7%) | 0 (0.0%) |
| $75,000 to $99,999 | 110 (8.3%) | 65 (5.5%) |
| $100,000+ | 102 (7.7%) | 47 (4.0%) |
| Total | 1,322 (100.0%) | 1,191 (100.0%) |
Earnings by Sex by Educational Attainment in Homeland
Average earnings in Homeland are $43,057 for men and $31,080 for women, a difference of 27.8%. Men with an educational attainment of bachelor's degree enjoy the highest average annual earnings of $87,386, while those with high school diploma education earn the least with $36,875. Women with an educational attainment of graduate degree earn the most with the average annual earnings of $140,357, while those with less than high school education have the smallest earnings of $24,318.
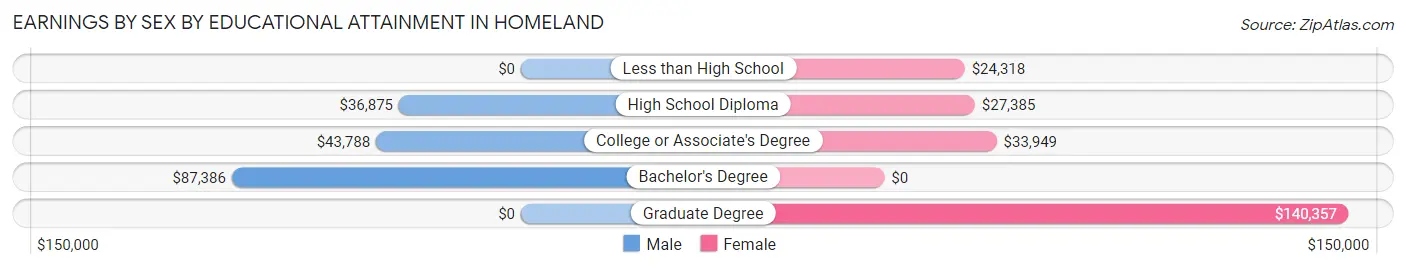
| Educational Attainment | Male Income | Female Income |
| Less than High School | - | - |
| High School Diploma | $36,875 | $27,385 |
| College or Associate's Degree | $43,788 | $33,949 |
| Bachelor's Degree | $87,386 | $0 |
| Graduate Degree | - | - |
| Total | $43,057 | $31,080 |
Family Income in Homeland
Family Income Brackets in Homeland
According to the Homeland family income data, there are 479 families falling into the $50,000 to $74,999 income range, which is the most common income bracket and makes up 36.5% of all families. Conversely, the $150,000 to $199,999 income bracket is the least frequent group with only 8 families (0.6%) belonging to this category.
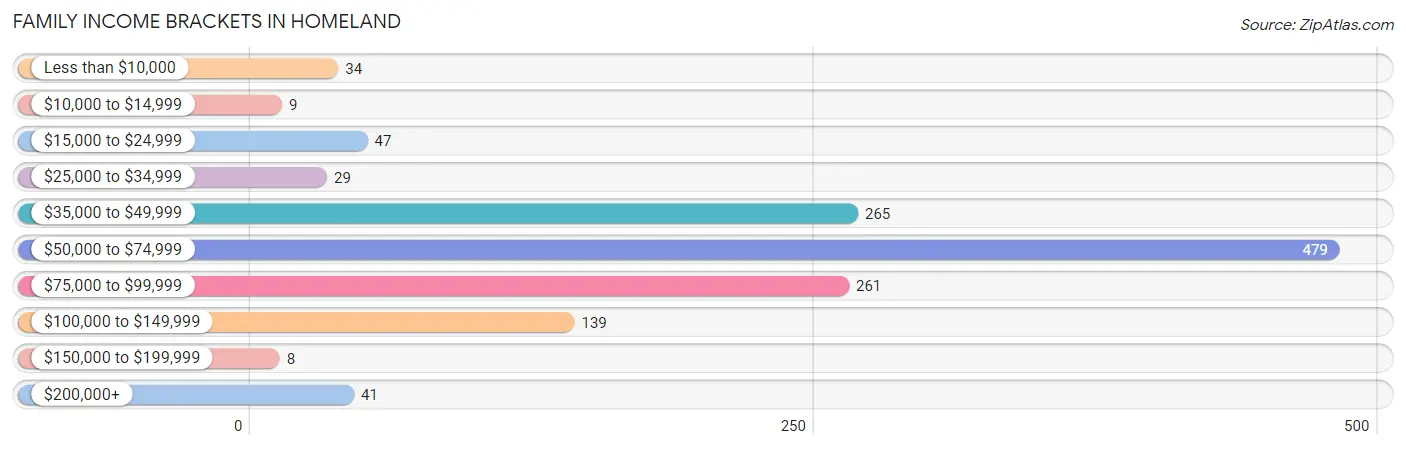
| Income Bracket | # Families | % Families |
| Less than $10,000 | 34 | 2.6% |
| $10,000 to $14,999 | 9 | 0.7% |
| $15,000 to $24,999 | 47 | 3.6% |
| $25,000 to $34,999 | 29 | 2.2% |
| $35,000 to $49,999 | 265 | 20.2% |
| $50,000 to $74,999 | 479 | 36.5% |
| $75,000 to $99,999 | 261 | 19.9% |
| $100,000 to $149,999 | 139 | 10.6% |
| $150,000 to $199,999 | 8 | 0.6% |
| $200,000+ | 41 | 3.1% |
Family Income by Famaliy Size in Homeland
4-person families (107 | 8.2%) account for the highest median family income in Homeland with $76,215 per family, while 2-person families (428 | 32.6%) have the highest median income of $28,864 per family member.
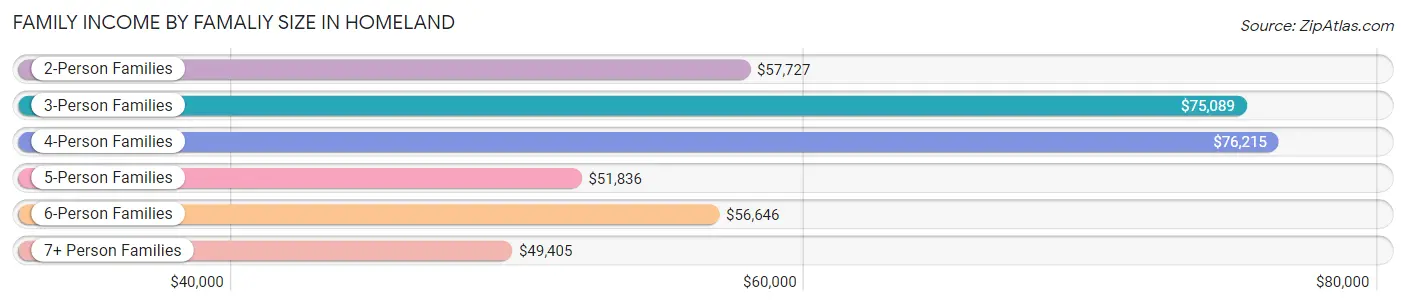
| Income Bracket | # Families | Median Income |
| 2-Person Families | 428 (32.6%) | $57,727 |
| 3-Person Families | 246 (18.8%) | $75,089 |
| 4-Person Families | 107 (8.2%) | $76,215 |
| 5-Person Families | 331 (25.2%) | $51,836 |
| 6-Person Families | 80 (6.1%) | $56,646 |
| 7+ Person Families | 120 (9.1%) | $49,405 |
| Total | 1,312 (100.0%) | $56,413 |
Family Income by Number of Earners in Homeland
The median family income in Homeland is $56,413, with families comprising 3+ earners (88) having the highest median family income of $62,024, while families with no earners (195) have the lowest median family income of $35,893, accounting for 6.7% and 14.9% of families, respectively.
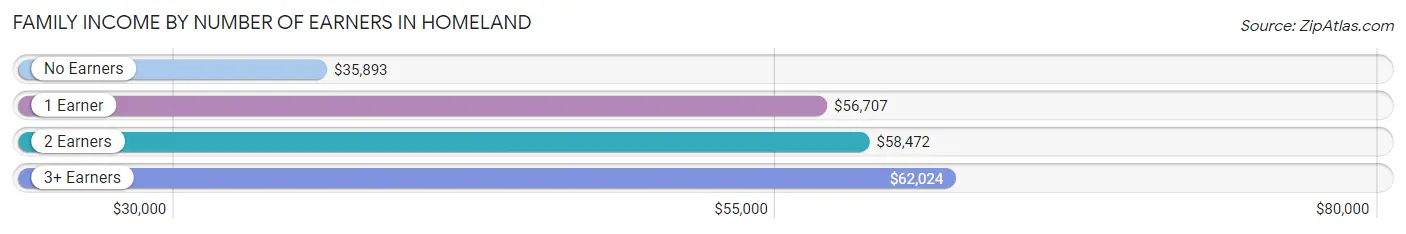
| Number of Earners | # Families | Median Income |
| No Earners | 195 (14.9%) | $35,893 |
| 1 Earner | 402 (30.6%) | $56,707 |
| 2 Earners | 627 (47.8%) | $58,472 |
| 3+ Earners | 88 (6.7%) | $62,024 |
| Total | 1,312 (100.0%) | $56,413 |
Household Income in Homeland
Household Income Brackets in Homeland
With 579 households falling in the category, the $50,000 to $74,999 income range is the most frequent in Homeland, accounting for 27.8% of all households. In contrast, only 8 households (0.4%) fall into the $150,000 to $199,999 income bracket, making it the least populous group.
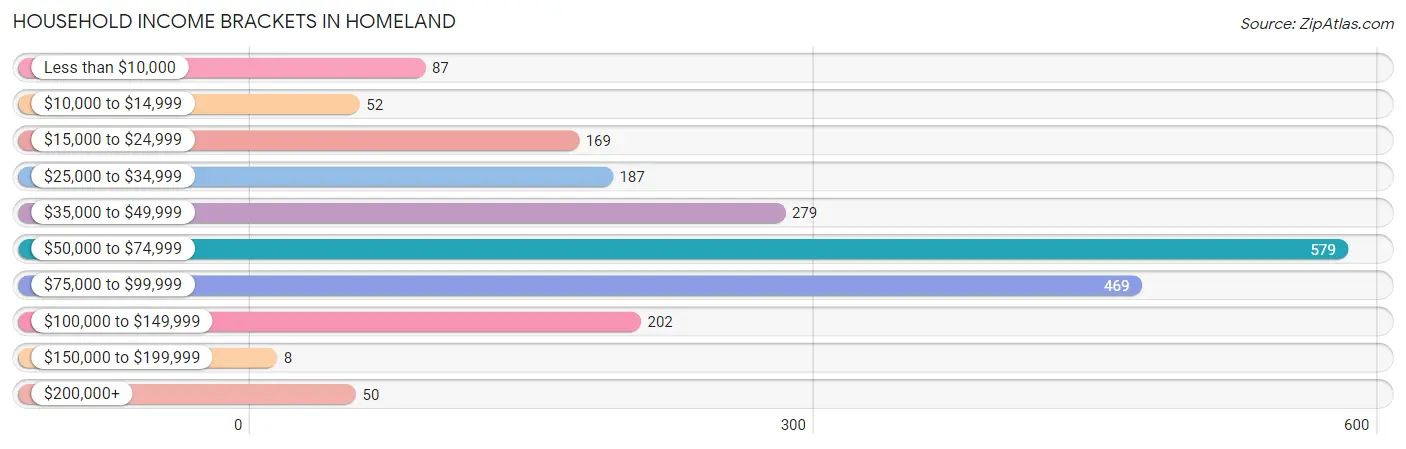
| Income Bracket | # Households | % Households |
| Less than $10,000 | 87 | 4.2% |
| $10,000 to $14,999 | 52 | 2.5% |
| $15,000 to $24,999 | 169 | 8.1% |
| $25,000 to $34,999 | 187 | 9.0% |
| $35,000 to $49,999 | 279 | 13.4% |
| $50,000 to $74,999 | 579 | 27.8% |
| $75,000 to $99,999 | 469 | 22.5% |
| $100,000 to $149,999 | 202 | 9.7% |
| $150,000 to $199,999 | 8 | 0.4% |
| $200,000+ | 50 | 2.4% |
Household Income by Householder Age in Homeland
The median household income in Homeland is $55,467, with the highest median household income of $83,817 found in the 25 to 44 years age bracket for the primary householder. A total of 637 households (30.6%) fall into this category. Meanwhile, the 65+ years age bracket for the primary householder has the lowest median household income of $32,561, with 788 households (37.8%) in this group.
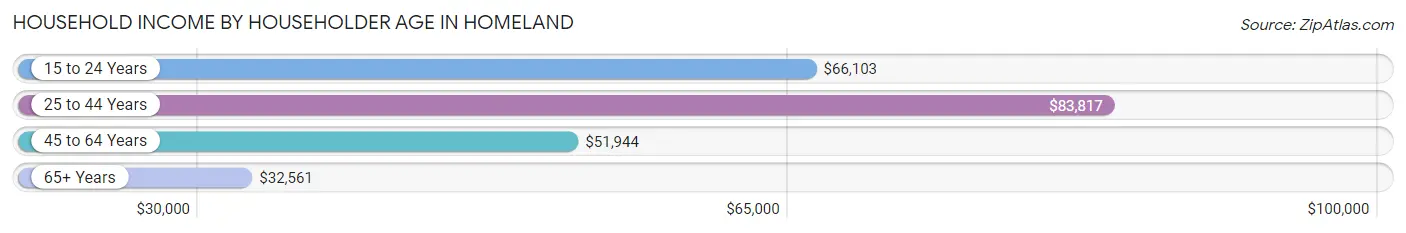
| Income Bracket | # Households | Median Income |
| 15 to 24 Years | 39 (1.9%) | $66,103 |
| 25 to 44 Years | 637 (30.6%) | $83,817 |
| 45 to 64 Years | 619 (29.7%) | $51,944 |
| 65+ Years | 788 (37.8%) | $32,561 |
| Total | 2,083 (100.0%) | $55,467 |
Poverty in Homeland
Income Below Poverty by Sex and Age in Homeland
With 7.7% poverty level for males and 10.1% for females among the residents of Homeland, 75 year old and over males and 55 to 64 year old females are the most vulnerable to poverty, with 84 males (29.1%) and 62 females (32.5%) in their respective age groups living below the poverty level.
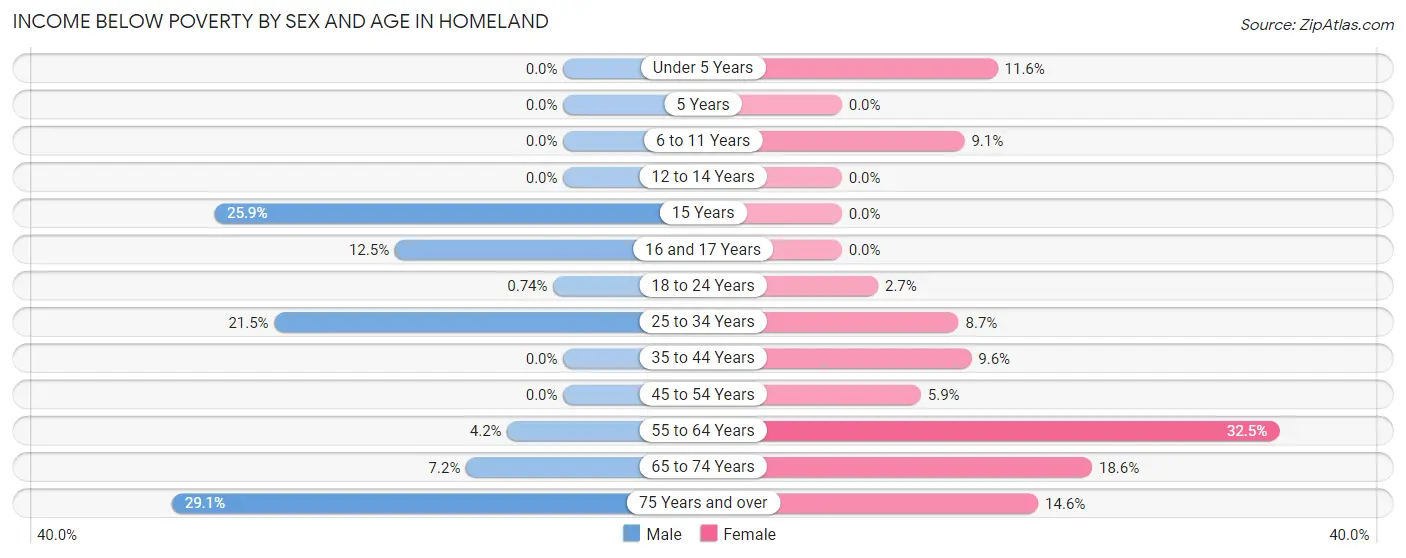
| Age Bracket | Male | Female |
| Under 5 Years | 0 (0.0%) | 14 (11.6%) |
| 5 Years | 0 (0.0%) | 0 (0.0%) |
| 6 to 11 Years | 0 (0.0%) | 38 (9.1%) |
| 12 to 14 Years | 0 (0.0%) | 0 (0.0%) |
| 15 Years | 14 (25.9%) | 0 (0.0%) |
| 16 and 17 Years | 14 (12.5%) | 0 (0.0%) |
| 18 to 24 Years | 2 (0.7%) | 10 (2.7%) |
| 25 to 34 Years | 92 (21.4%) | 54 (8.7%) |
| 35 to 44 Years | 0 (0.0%) | 35 (9.6%) |
| 45 to 54 Years | 0 (0.0%) | 21 (5.9%) |
| 55 to 64 Years | 11 (4.2%) | 62 (32.5%) |
| 65 to 74 Years | 22 (7.2%) | 47 (18.6%) |
| 75 Years and over | 84 (29.1%) | 35 (14.6%) |
| Total | 239 (7.7%) | 316 (10.1%) |
Income Above Poverty by Sex and Age in Homeland
According to the poverty statistics in Homeland, males aged under 5 years and females aged 5 years are the age groups that are most secure financially, with 100.0% of males and 100.0% of females in these age groups living above the poverty line.
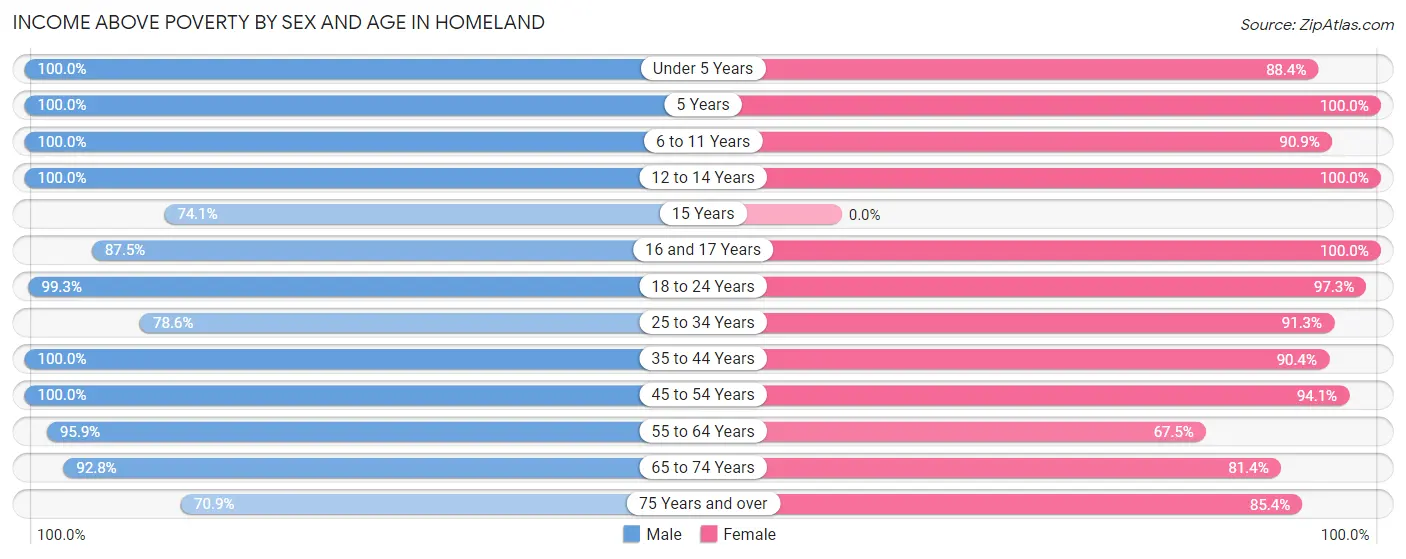
| Age Bracket | Male | Female |
| Under 5 Years | 139 (100.0%) | 107 (88.4%) |
| 5 Years | 14 (100.0%) | 44 (100.0%) |
| 6 to 11 Years | 258 (100.0%) | 379 (90.9%) |
| 12 to 14 Years | 288 (100.0%) | 82 (100.0%) |
| 15 Years | 40 (74.1%) | 0 (0.0%) |
| 16 and 17 Years | 98 (87.5%) | 57 (100.0%) |
| 18 to 24 Years | 269 (99.3%) | 362 (97.3%) |
| 25 to 34 Years | 337 (78.5%) | 569 (91.3%) |
| 35 to 44 Years | 214 (100.0%) | 329 (90.4%) |
| 45 to 54 Years | 461 (100.0%) | 337 (94.1%) |
| 55 to 64 Years | 254 (95.9%) | 129 (67.5%) |
| 65 to 74 Years | 283 (92.8%) | 206 (81.4%) |
| 75 Years and over | 205 (70.9%) | 205 (85.4%) |
| Total | 2,860 (92.3%) | 2,806 (89.9%) |
Income Below Poverty Among Married-Couple Families in Homeland
The poverty statistics for married-couple families in Homeland show that 3.3% or 31 of the total 942 families live below the poverty line. Families with 3 or 4 children have the highest poverty rate of 7.2%, comprising of 12 families. On the other hand, families with 1 or 2 children have the lowest poverty rate of 0.0%, which includes 0 families.
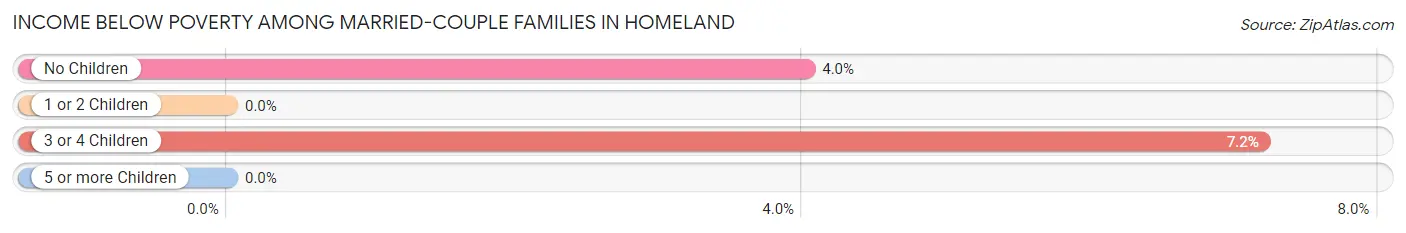
| Children | Above Poverty | Below Poverty |
| No Children | 454 (96.0%) | 19 (4.0%) |
| 1 or 2 Children | 274 (100.0%) | 0 (0.0%) |
| 3 or 4 Children | 155 (92.8%) | 12 (7.2%) |
| 5 or more Children | 28 (100.0%) | 0 (0.0%) |
| Total | 911 (96.7%) | 31 (3.3%) |
Income Below Poverty Among Single-Parent Households in Homeland
According to the poverty data in Homeland, 8.5% or 12 single-father households and 14.8% or 34 single-mother households are living below the poverty line. Among single-father households, those with no children have the highest poverty rate, with 12 households (25.0%) experiencing poverty. Likewise, among single-mother households, those with no children have the highest poverty rate, with 24 households (22.0%) falling below the poverty line.
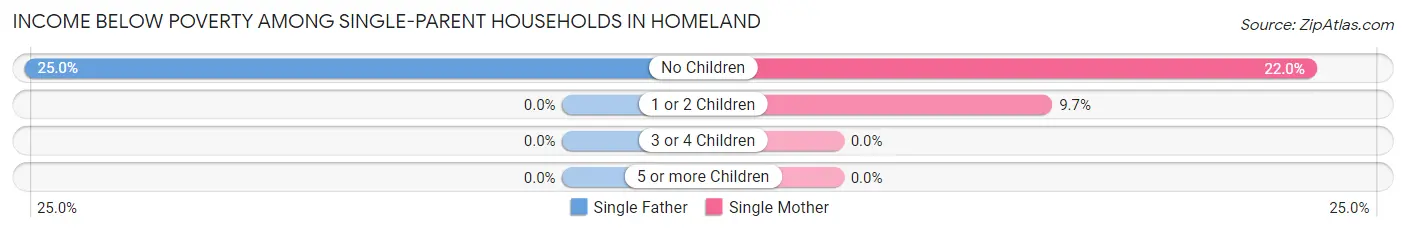
| Children | Single Father | Single Mother |
| No Children | 12 (25.0%) | 24 (22.0%) |
| 1 or 2 Children | 0 (0.0%) | 10 (9.7%) |
| 3 or 4 Children | 0 (0.0%) | 0 (0.0%) |
| 5 or more Children | 0 (0.0%) | 0 (0.0%) |
| Total | 12 (8.5%) | 34 (14.8%) |
Income Below Poverty Among Married-Couple vs Single-Parent Households in Homeland
The poverty data for Homeland shows that 31 of the married-couple family households (3.3%) and 46 of the single-parent households (12.4%) are living below the poverty level. Within the married-couple family households, those with 3 or 4 children have the highest poverty rate, with 12 households (7.2%) falling below the poverty line. Among the single-parent households, those with no children have the highest poverty rate, with 36 household (22.9%) living below poverty.
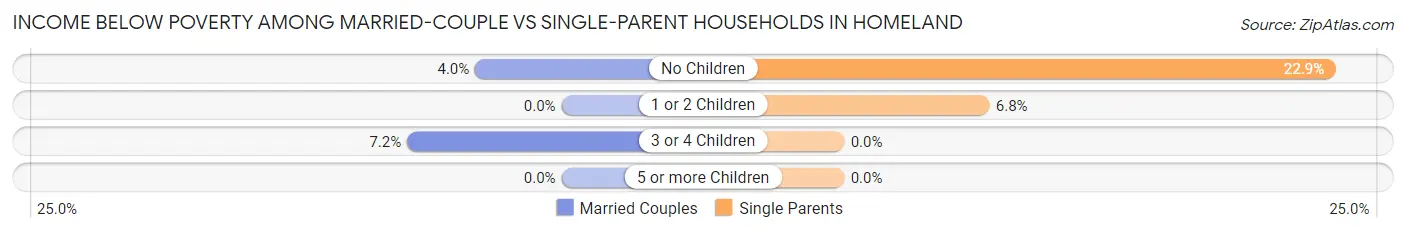
| Children | Married-Couple Families | Single-Parent Households |
| No Children | 19 (4.0%) | 36 (22.9%) |
| 1 or 2 Children | 0 (0.0%) | 10 (6.8%) |
| 3 or 4 Children | 12 (7.2%) | 0 (0.0%) |
| 5 or more Children | 0 (0.0%) | 0 (0.0%) |
| Total | 31 (3.3%) | 46 (12.4%) |
Race in Homeland
The most populous races in Homeland are Hispanic or Latino (4,337 | 69.7%), White / Caucasian (3,804 | 61.2%), and Some other Race (1,609 | 25.9%).
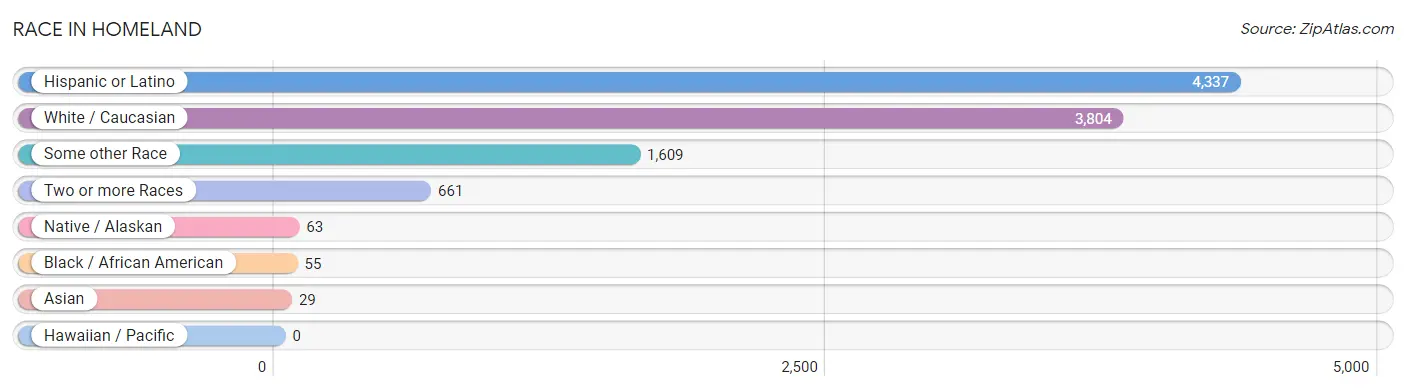
| Race | # Population | % Population |
| Asian | 29 | 0.5% |
| Black / African American | 55 | 0.9% |
| Hawaiian / Pacific | 0 | 0.0% |
| Hispanic or Latino | 4,337 | 69.7% |
| Native / Alaskan | 63 | 1.0% |
| White / Caucasian | 3,804 | 61.2% |
| Two or more Races | 661 | 10.6% |
| Some other Race | 1,609 | 25.9% |
| Total | 6,221 | 100.0% |
Ancestry in Homeland
The most populous ancestries reported in Homeland are Mexican (3,995 | 64.2%), German (177 | 2.9%), American (163 | 2.6%), Puerto Rican (131 | 2.1%), and European (115 | 1.8%), together accounting for 73.6% of all Homeland residents.
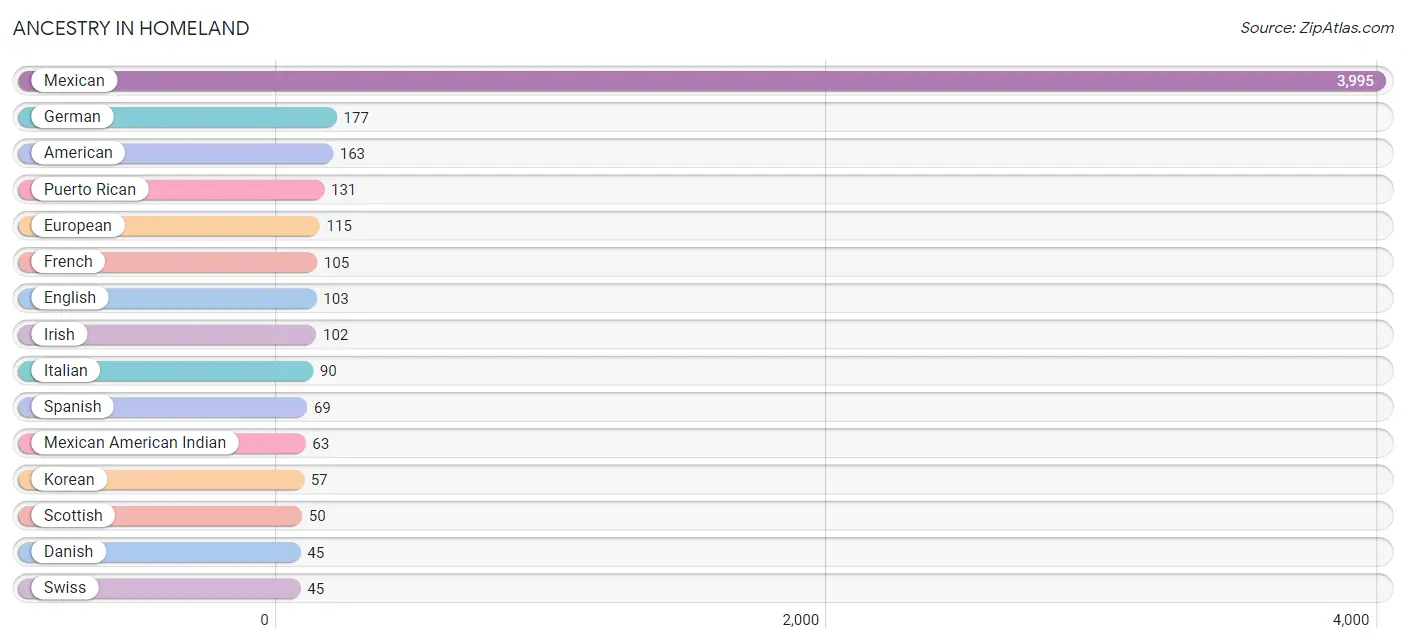
| Ancestry | # Population | % Population |
| American | 163 | 2.6% |
| Belgian | 15 | 0.2% |
| British | 13 | 0.2% |
| Canadian | 9 | 0.1% |
| Central American | 12 | 0.2% |
| Cherokee | 10 | 0.2% |
| Czech | 8 | 0.1% |
| Danish | 45 | 0.7% |
| Dominican | 12 | 0.2% |
| Dutch | 18 | 0.3% |
| English | 103 | 1.7% |
| European | 115 | 1.8% |
| Finnish | 11 | 0.2% |
| French | 105 | 1.7% |
| French Canadian | 9 | 0.1% |
| German | 177 | 2.9% |
| Guatemalan | 12 | 0.2% |
| Irish | 102 | 1.6% |
| Italian | 90 | 1.5% |
| Korean | 57 | 0.9% |
| Laotian | 31 | 0.5% |
| Mexican | 3,995 | 64.2% |
| Mexican American Indian | 63 | 1.0% |
| Norwegian | 34 | 0.5% |
| Polish | 44 | 0.7% |
| Puerto Rican | 131 | 2.1% |
| Russian | 9 | 0.1% |
| Scotch-Irish | 24 | 0.4% |
| Scottish | 50 | 0.8% |
| Spaniard | 44 | 0.7% |
| Spanish | 69 | 1.1% |
| Swedish | 20 | 0.3% |
| Swiss | 45 | 0.7% |
| Tlingit-Haida | 28 | 0.4% |
| Welsh | 10 | 0.2% | View All 35 Rows |
Immigrants in Homeland
The most numerous immigrant groups reported in Homeland came from Latin America (1,371 | 22.0%), Central America (1,346 | 21.6%), Mexico (1,334 | 21.4%), Asia (29 | 0.5%), and Philippines (29 | 0.5%), together accounting for 66.1% of all Homeland residents.
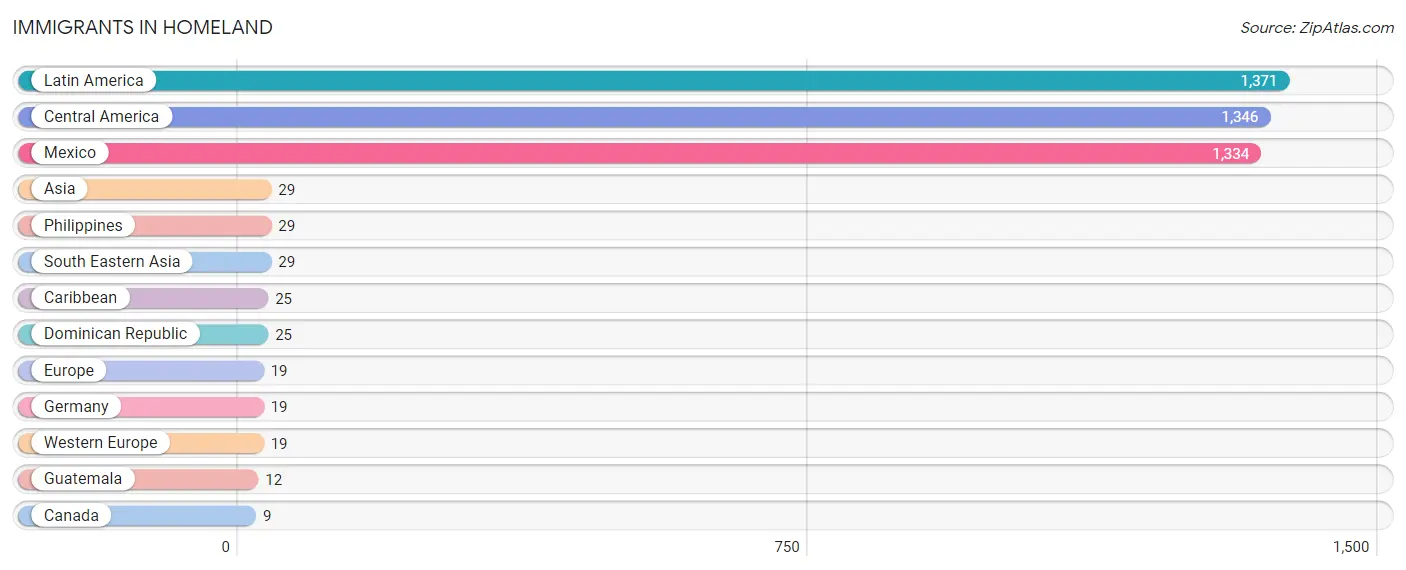
| Immigration Origin | # Population | % Population |
| Asia | 29 | 0.5% |
| Canada | 9 | 0.1% |
| Caribbean | 25 | 0.4% |
| Central America | 1,346 | 21.6% |
| Dominican Republic | 25 | 0.4% |
| Europe | 19 | 0.3% |
| Germany | 19 | 0.3% |
| Guatemala | 12 | 0.2% |
| Latin America | 1,371 | 22.0% |
| Mexico | 1,334 | 21.4% |
| Philippines | 29 | 0.5% |
| South Eastern Asia | 29 | 0.5% |
| Western Europe | 19 | 0.3% | View All 13 Rows |
Sex and Age in Homeland
Sex and Age in Homeland
The most populous age groups in Homeland are 45 to 49 Years (338 | 10.9%) for men and 5 to 9 Years (355 | 11.4%) for women.
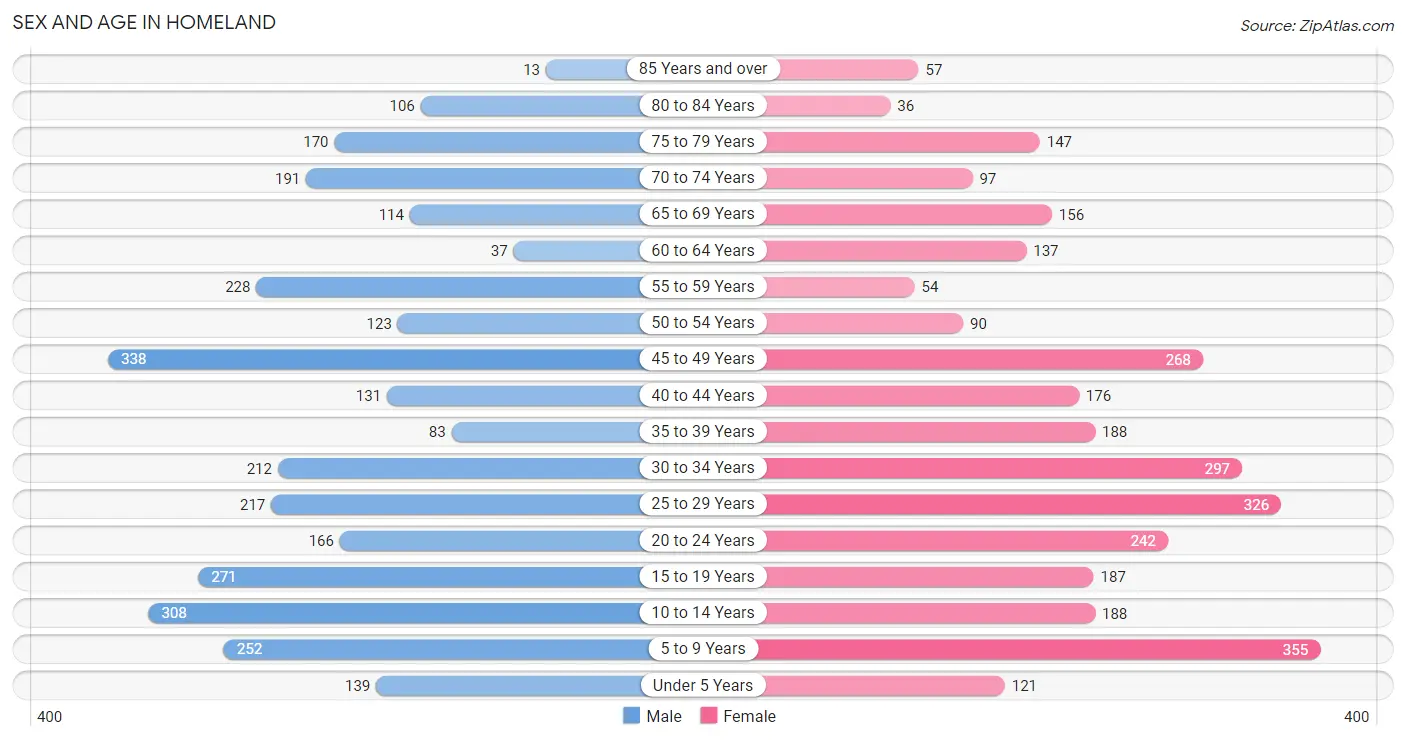
| Age Bracket | Male | Female |
| Under 5 Years | 139 (4.5%) | 121 (3.9%) |
| 5 to 9 Years | 252 (8.1%) | 355 (11.4%) |
| 10 to 14 Years | 308 (9.9%) | 188 (6.0%) |
| 15 to 19 Years | 271 (8.7%) | 187 (6.0%) |
| 20 to 24 Years | 166 (5.4%) | 242 (7.7%) |
| 25 to 29 Years | 217 (7.0%) | 326 (10.4%) |
| 30 to 34 Years | 212 (6.8%) | 297 (9.5%) |
| 35 to 39 Years | 83 (2.7%) | 188 (6.0%) |
| 40 to 44 Years | 131 (4.2%) | 176 (5.6%) |
| 45 to 49 Years | 338 (10.9%) | 268 (8.6%) |
| 50 to 54 Years | 123 (4.0%) | 90 (2.9%) |
| 55 to 59 Years | 228 (7.4%) | 54 (1.7%) |
| 60 to 64 Years | 37 (1.2%) | 137 (4.4%) |
| 65 to 69 Years | 114 (3.7%) | 156 (5.0%) |
| 70 to 74 Years | 191 (6.2%) | 97 (3.1%) |
| 75 to 79 Years | 170 (5.5%) | 147 (4.7%) |
| 80 to 84 Years | 106 (3.4%) | 36 (1.1%) |
| 85 Years and over | 13 (0.4%) | 57 (1.8%) |
| Total | 3,099 (100.0%) | 3,122 (100.0%) |
Families and Households in Homeland
Median Family Size in Homeland
The median family size in Homeland is 3.79 persons per family, with married-couple families (942 | 71.8%) accounting for the largest median family size of 3.93 persons per family. On the other hand, single male/father families (141 | 10.7%) represent the smallest median family size with 3.33 persons per family.
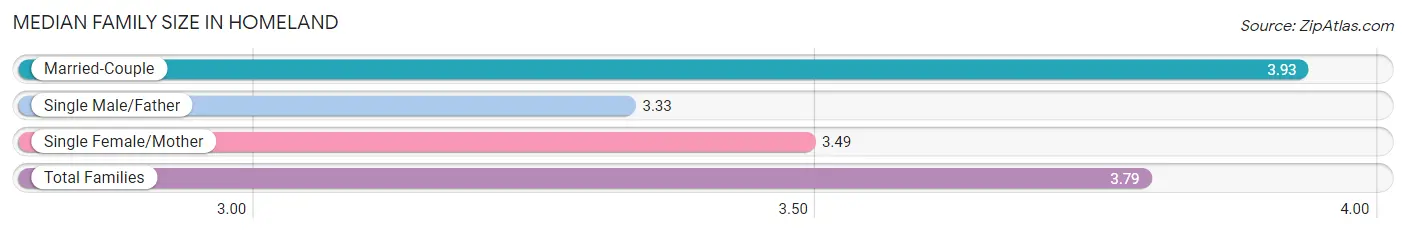
| Family Type | # Families | Family Size |
| Married-Couple | 942 (71.8%) | 3.93 |
| Single Male/Father | 141 (10.7%) | 3.33 |
| Single Female/Mother | 229 (17.4%) | 3.49 |
| Total Families | 1,312 (100.0%) | 3.79 |
Median Household Size in Homeland
The median household size in Homeland is 2.98 persons per household, with single female/mother households (229 | 11.0%) accounting for the largest median household size of 4.04 persons per household. non-family households (771 | 37.0%) represent the smallest median household size with 1.30 persons per household.
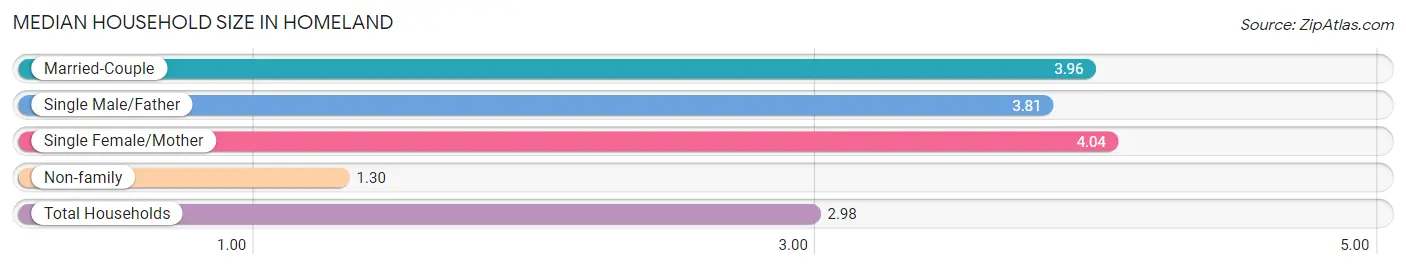
| Household Type | # Households | Household Size |
| Married-Couple | 942 (45.2%) | 3.96 |
| Single Male/Father | 141 (6.8%) | 3.81 |
| Single Female/Mother | 229 (11.0%) | 4.04 |
| Non-family | 771 (37.0%) | 1.30 |
| Total Households | 2,083 (100.0%) | 2.98 |
Household Size by Marriage Status in Homeland
Out of a total of 2,083 households in Homeland, 1,312 (63.0%) are family households, while 771 (37.0%) are nonfamily households. The most numerous type of family households are 2-person households, comprising 396, and the most common type of nonfamily households are 1-person households, comprising 570.
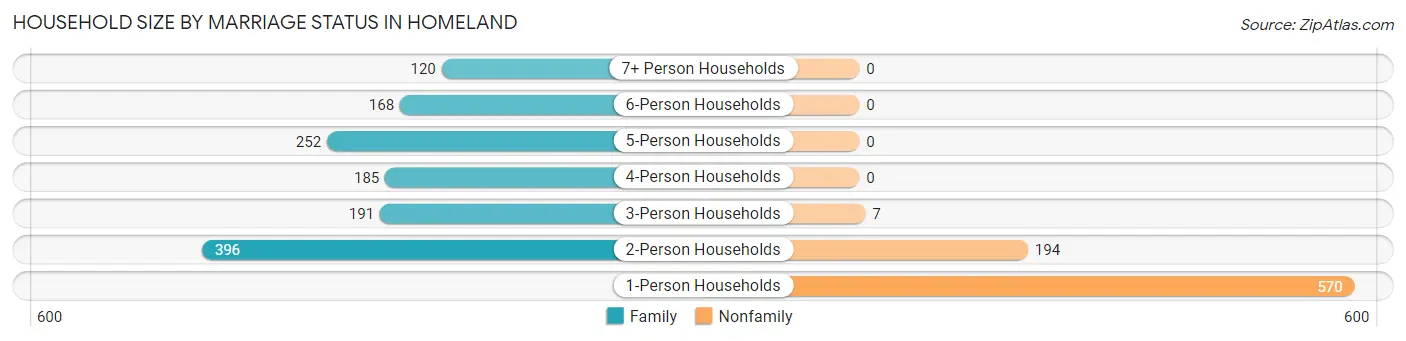
| Household Size | Family Households | Nonfamily Households |
| 1-Person Households | - | 570 (27.4%) |
| 2-Person Households | 396 (19.0%) | 194 (9.3%) |
| 3-Person Households | 191 (9.2%) | 7 (0.3%) |
| 4-Person Households | 185 (8.9%) | 0 (0.0%) |
| 5-Person Households | 252 (12.1%) | 0 (0.0%) |
| 6-Person Households | 168 (8.1%) | 0 (0.0%) |
| 7+ Person Households | 120 (5.8%) | 0 (0.0%) |
| Total | 1,312 (63.0%) | 771 (37.0%) |
Female Fertility in Homeland
Fertility by Age in Homeland
Average fertility rate in Homeland is 7.0 births per 1,000 women. Women in the age bracket of 20 to 34 years have the highest fertility rate with 14.0 births per 1,000 women. Women in the age bracket of 20 to 34 years acount for 100.0% of all women with births.
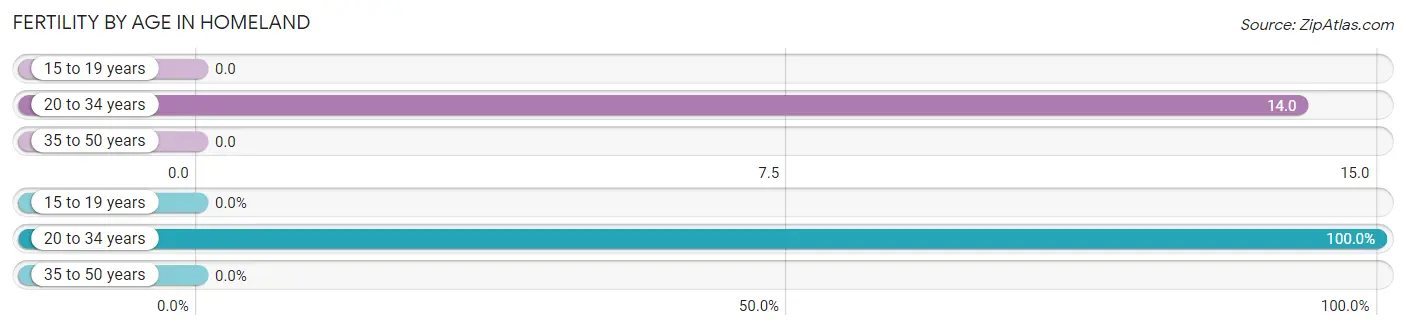
| Age Bracket | Women with Births | Births / 1,000 Women |
| 15 to 19 years | 0 (0.0%) | 0.0 |
| 20 to 34 years | 12 (100.0%) | 14.0 |
| 35 to 50 years | 0 (0.0%) | 0.0 |
| Total | 12 (100.0%) | 7.0 |
Fertility by Age by Marriage Status in Homeland
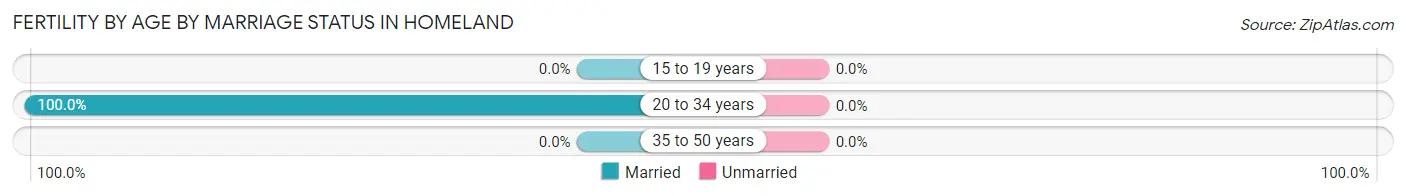
| Age Bracket | Married | Unmarried |
| 15 to 19 years | 0 (0.0%) | 0 (0.0%) |
| 20 to 34 years | 12 (100.0%) | 0 (0.0%) |
| 35 to 50 years | 0 (0.0%) | 0 (0.0%) |
| Total | 12 (100.0%) | 0 (0.0%) |
Fertility by Education in Homeland
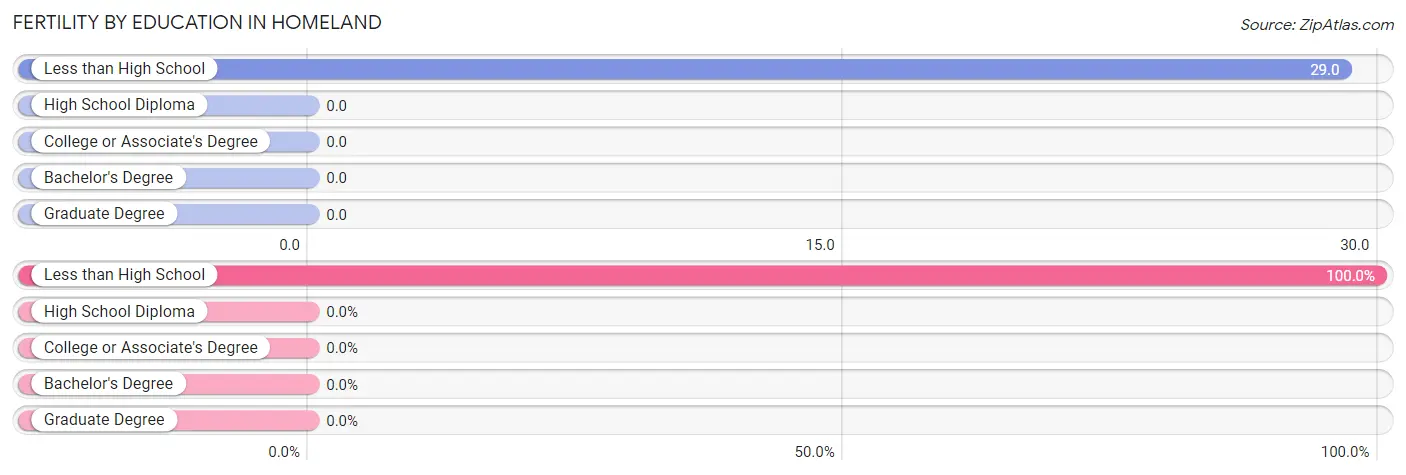
| Educational Attainment | Women with Births | Births / 1,000 Women |
| Less than High School | 12 (100.0%) | 29.0 |
| High School Diploma | 0 (0.0%) | 0.0 |
| College or Associate's Degree | 0 (0.0%) | 0.0 |
| Bachelor's Degree | 0 (0.0%) | 0.0 |
| Graduate Degree | 0 (0.0%) | 0.0 |
| Total | 12 (100.0%) | 7.0 |
Fertility by Education by Marriage Status in Homeland
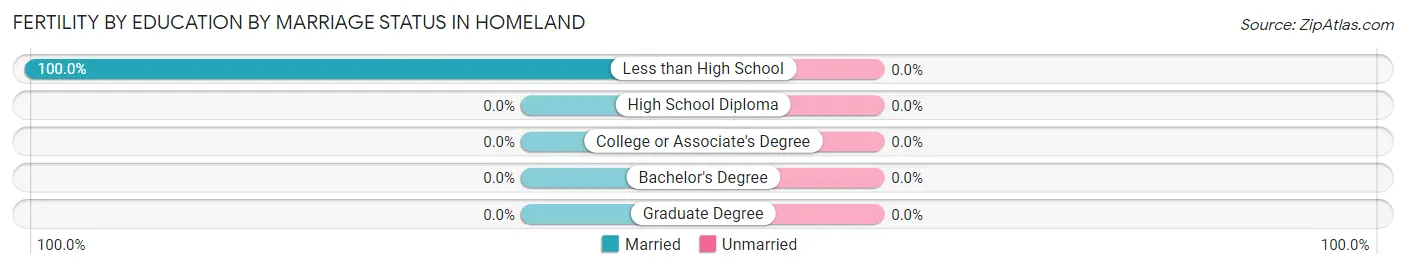
| Educational Attainment | Married | Unmarried |
| Less than High School | 12 (100.0%) | 0 (0.0%) |
| High School Diploma | 0 (0.0%) | 0 (0.0%) |
| College or Associate's Degree | 0 (0.0%) | 0 (0.0%) |
| Bachelor's Degree | 0 (0.0%) | 0 (0.0%) |
| Graduate Degree | 0 (0.0%) | 0 (0.0%) |
| Total | 12 (100.0%) | 0 (0.0%) |
Employment Characteristics in Homeland
Employment by Class of Employer in Homeland
Among the 2,057 employed individuals in Homeland, private company employees (1,389 | 67.5%), local government employees (348 | 16.9%), and self-employed (not incorporated) (138 | 6.7%) make up the most common classes of employment.
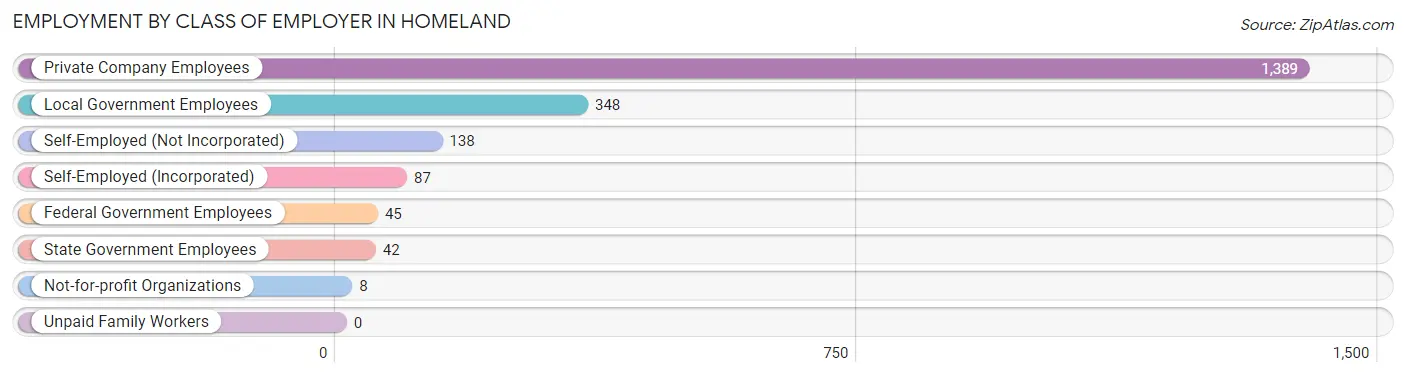
| Employer Class | # Employees | % Employees |
| Private Company Employees | 1,389 | 67.5% |
| Self-Employed (Incorporated) | 87 | 4.2% |
| Self-Employed (Not Incorporated) | 138 | 6.7% |
| Not-for-profit Organizations | 8 | 0.4% |
| Local Government Employees | 348 | 16.9% |
| State Government Employees | 42 | 2.0% |
| Federal Government Employees | 45 | 2.2% |
| Unpaid Family Workers | 0 | 0.0% |
| Total | 2,057 | 100.0% |
Employment Status by Age in Homeland
According to the labor force statistics for Homeland, out of the total population over 16 years of age (4,804), 53.4% or 2,565 individuals are in the labor force, with 10.8% or 277 of them unemployed. The age group with the highest labor force participation rate is 25 to 29 years, with 89.7% or 487 individuals in the labor force. Within the labor force, the 16 to 19 years age range has the highest percentage of unemployed individuals, with 53.1% or 146 of them being unemployed.
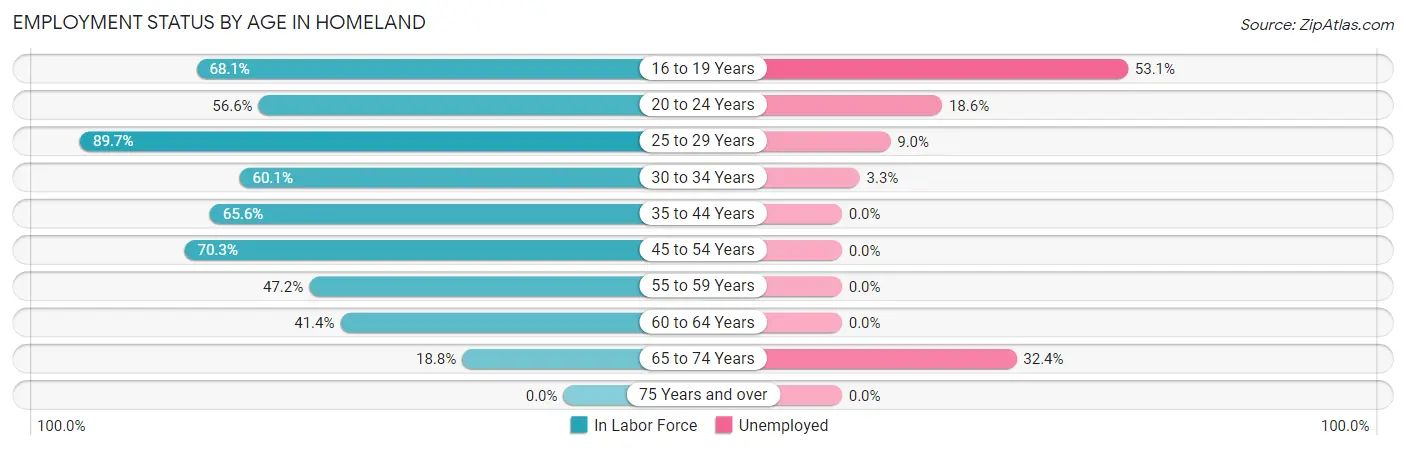
| Age Bracket | In Labor Force | Unemployed |
| 16 to 19 Years | 275 (68.1%) | 146 (53.1%) |
| 20 to 24 Years | 231 (56.6%) | 43 (18.6%) |
| 25 to 29 Years | 487 (89.7%) | 44 (9.0%) |
| 30 to 34 Years | 306 (60.1%) | 10 (3.3%) |
| 35 to 44 Years | 379 (65.6%) | 0 (0.0%) |
| 45 to 54 Years | 576 (70.3%) | 0 (0.0%) |
| 55 to 59 Years | 133 (47.2%) | 0 (0.0%) |
| 60 to 64 Years | 72 (41.4%) | 0 (0.0%) |
| 65 to 74 Years | 105 (18.8%) | 34 (32.4%) |
| 75 Years and over | 0 (0.0%) | 0 (0.0%) |
| Total | 2,565 (53.4%) | 277 (10.8%) |
Employment Status by Educational Attainment in Homeland
According to labor force statistics for Homeland, 67.2% of individuals (1,952) out of the total population between 25 and 64 years of age (2,905) are in the labor force, with 2.8% or 55 of them being unemployed. The group with the highest labor force participation rate are those with the educational attainment of high school diploma, with 78.3% or 889 individuals in the labor force. Within the labor force, individuals with bachelor's degree or higher education have the highest percentage of unemployment, with 14.2% or 26 of them being unemployed.
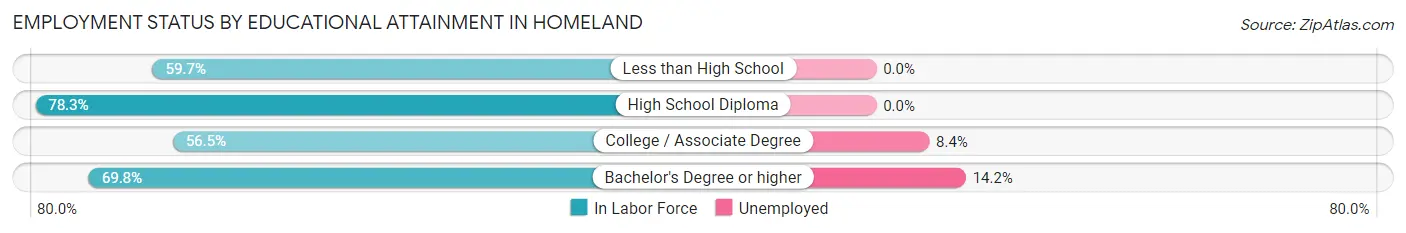
| Educational Attainment | In Labor Force | Unemployed |
| Less than High School | 539 (59.7%) | 0 (0.0%) |
| High School Diploma | 889 (78.3%) | 0 (0.0%) |
| College / Associate Degree | 342 (56.5%) | 51 (8.4%) |
| Bachelor's Degree or higher | 183 (69.8%) | 37 (14.2%) |
| Total | 1,952 (67.2%) | 81 (2.8%) |
Employment Occupations by Sex in Homeland
Management, Business, Science and Arts Occupations
The most common Management, Business, Science and Arts occupations in Homeland are Community & Social Service (273 | 12.0%), Education Instruction & Library (273 | 12.0%), Business & Financial (95 | 4.2%), Management (71 | 3.1%), and Computers, Engineering & Science (35 | 1.5%).
Management, Business, Science and Arts Occupations by Sex
Within the Management, Business, Science and Arts occupations in Homeland, the most male-oriented occupations are Computers, Engineering & Science (100.0%), Computers & Mathematics (100.0%), and Architecture & Engineering (100.0%), while the most female-oriented occupations are Community & Social Service (100.0%), Education Instruction & Library (100.0%), and Health Diagnosing & Treating (100.0%).
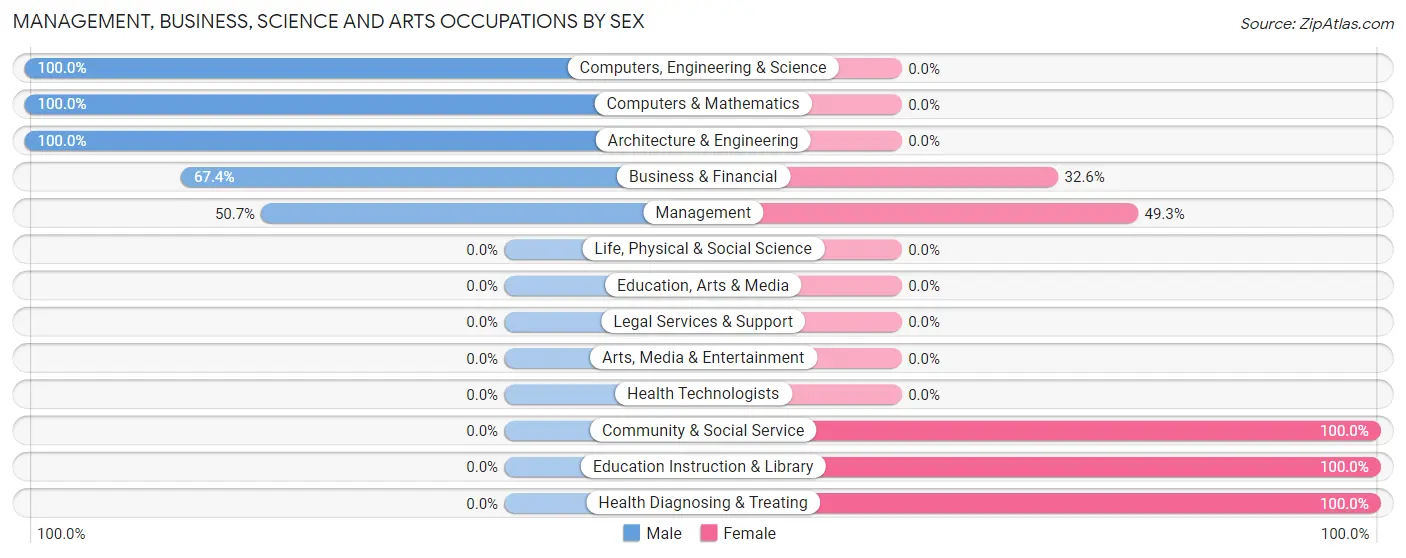
| Occupation | Male | Female |
| Management | 36 (50.7%) | 35 (49.3%) |
| Business & Financial | 64 (67.4%) | 31 (32.6%) |
| Computers, Engineering & Science | 35 (100.0%) | 0 (0.0%) |
| Computers & Mathematics | 14 (100.0%) | 0 (0.0%) |
| Architecture & Engineering | 21 (100.0%) | 0 (0.0%) |
| Life, Physical & Social Science | 0 (0.0%) | 0 (0.0%) |
| Community & Social Service | 0 (0.0%) | 273 (100.0%) |
| Education, Arts & Media | 0 (0.0%) | 0 (0.0%) |
| Legal Services & Support | 0 (0.0%) | 0 (0.0%) |
| Education Instruction & Library | 0 (0.0%) | 273 (100.0%) |
| Arts, Media & Entertainment | 0 (0.0%) | 0 (0.0%) |
| Health Diagnosing & Treating | 0 (0.0%) | 2 (100.0%) |
| Health Technologists | 0 (0.0%) | 0 (0.0%) |
| Total (Category) | 135 (28.4%) | 341 (71.6%) |
| Total (Overall) | 1,255 (55.1%) | 1,024 (44.9%) |
Services Occupations
The most common Services occupations in Homeland are Cleaning & Maintenance (174 | 7.6%), Food Preparation & Serving (67 | 2.9%), Healthcare Support (33 | 1.5%), Personal Care & Service (22 | 1.0%), and Security & Protection (11 | 0.5%).
Services Occupations by Sex
Within the Services occupations in Homeland, the most male-oriented occupations are Security & Protection (100.0%), Firefighting & Prevention (100.0%), and Cleaning & Maintenance (69.0%), while the most female-oriented occupations are Healthcare Support (100.0%), Food Preparation & Serving (76.1%), and Personal Care & Service (54.5%).
| Occupation | Male | Female |
| Healthcare Support | 0 (0.0%) | 33 (100.0%) |
| Security & Protection | 11 (100.0%) | 0 (0.0%) |
| Firefighting & Prevention | 11 (100.0%) | 0 (0.0%) |
| Law Enforcement | 0 (0.0%) | 0 (0.0%) |
| Food Preparation & Serving | 16 (23.9%) | 51 (76.1%) |
| Cleaning & Maintenance | 120 (69.0%) | 54 (31.0%) |
| Personal Care & Service | 10 (45.5%) | 12 (54.5%) |
| Total (Category) | 157 (51.1%) | 150 (48.9%) |
| Total (Overall) | 1,255 (55.1%) | 1,024 (44.9%) |
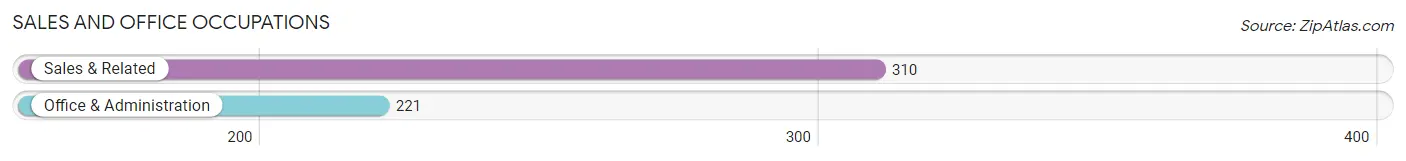
Sales and Office Occupations
The most common Sales and Office occupations in Homeland are Sales & Related (310 | 13.6%), and Office & Administration (221 | 9.7%).
Sales and Office Occupations by Sex
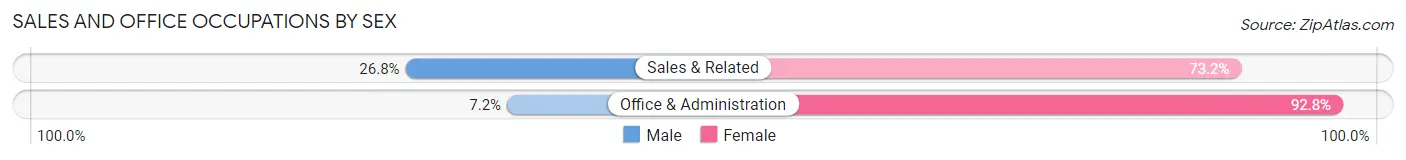
| Occupation | Male | Female |
| Sales & Related | 83 (26.8%) | 227 (73.2%) |
| Office & Administration | 16 (7.2%) | 205 (92.8%) |
| Total (Category) | 99 (18.6%) | 432 (81.4%) |
| Total (Overall) | 1,255 (55.1%) | 1,024 (44.9%) |
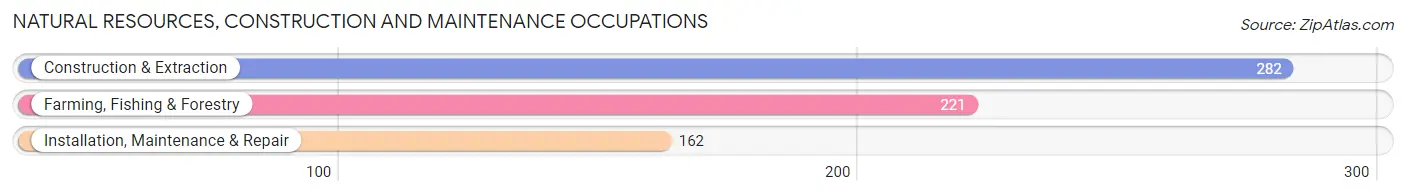
Natural Resources, Construction and Maintenance Occupations
The most common Natural Resources, Construction and Maintenance occupations in Homeland are Construction & Extraction (282 | 12.4%), Farming, Fishing & Forestry (221 | 9.7%), and Installation, Maintenance & Repair (162 | 7.1%).
Natural Resources, Construction and Maintenance Occupations by Sex
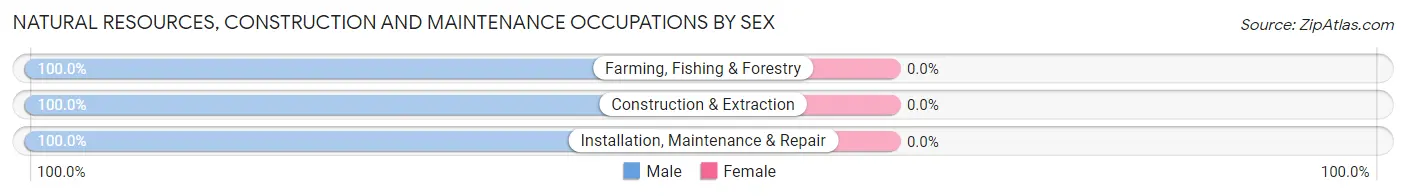
| Occupation | Male | Female |
| Farming, Fishing & Forestry | 221 (100.0%) | 0 (0.0%) |
| Construction & Extraction | 282 (100.0%) | 0 (0.0%) |
| Installation, Maintenance & Repair | 162 (100.0%) | 0 (0.0%) |
| Total (Category) | 665 (100.0%) | 0 (0.0%) |
| Total (Overall) | 1,255 (55.1%) | 1,024 (44.9%) |
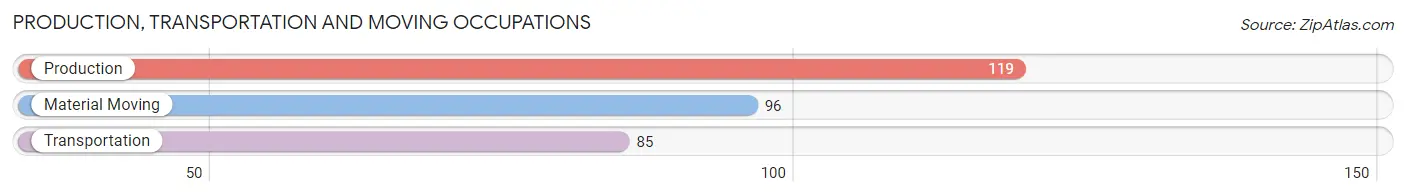
Production, Transportation and Moving Occupations
The most common Production, Transportation and Moving occupations in Homeland are Production (119 | 5.2%), Material Moving (96 | 4.2%), and Transportation (85 | 3.7%).
Production, Transportation and Moving Occupations by Sex
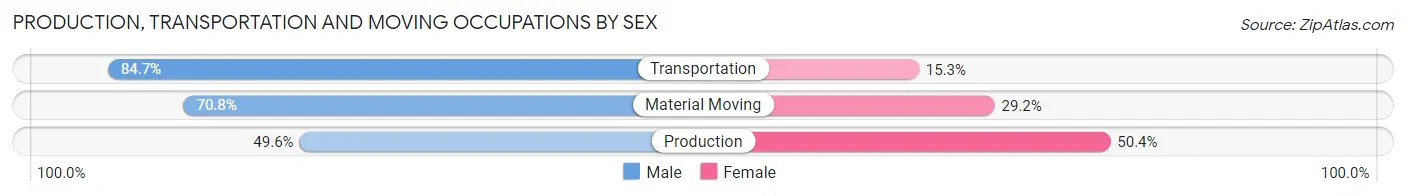
| Occupation | Male | Female |
| Production | 59 (49.6%) | 60 (50.4%) |
| Transportation | 72 (84.7%) | 13 (15.3%) |
| Material Moving | 68 (70.8%) | 28 (29.2%) |
| Total (Category) | 199 (66.3%) | 101 (33.7%) |
| Total (Overall) | 1,255 (55.1%) | 1,024 (44.9%) |
Employment Industries by Sex in Homeland
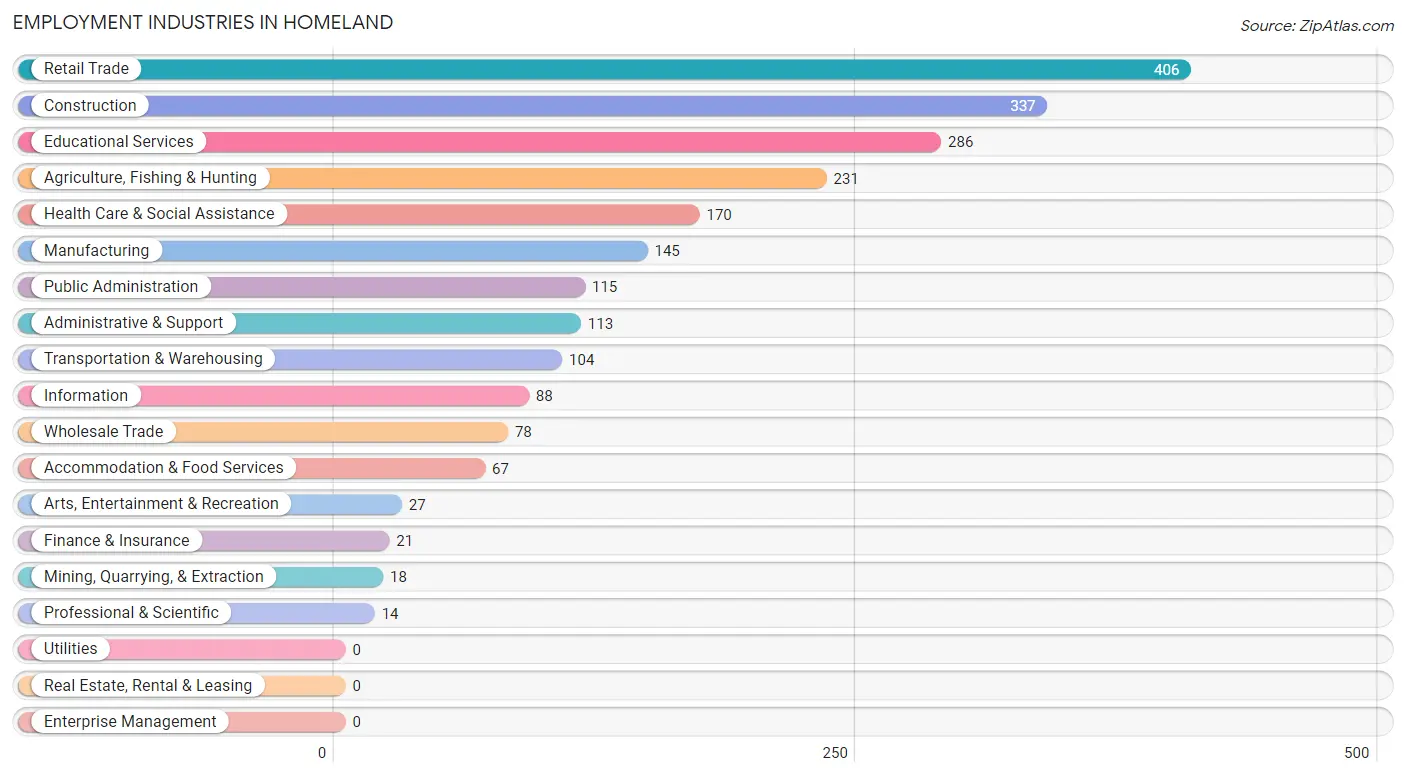
Employment Industries in Homeland
The major employment industries in Homeland include Retail Trade (406 | 17.8%), Construction (337 | 14.8%), Educational Services (286 | 12.6%), Agriculture, Fishing & Hunting (231 | 10.1%), and Health Care & Social Assistance (170 | 7.5%).
Employment Industries by Sex in Homeland
The Homeland industries that see more men than women are Agriculture, Fishing & Hunting (100.0%), Mining, Quarrying, & Extraction (100.0%), and Wholesale Trade (100.0%), whereas the industries that tend to have a higher number of women are Finance & Insurance (100.0%), Educational Services (100.0%), and Health Care & Social Assistance (100.0%).
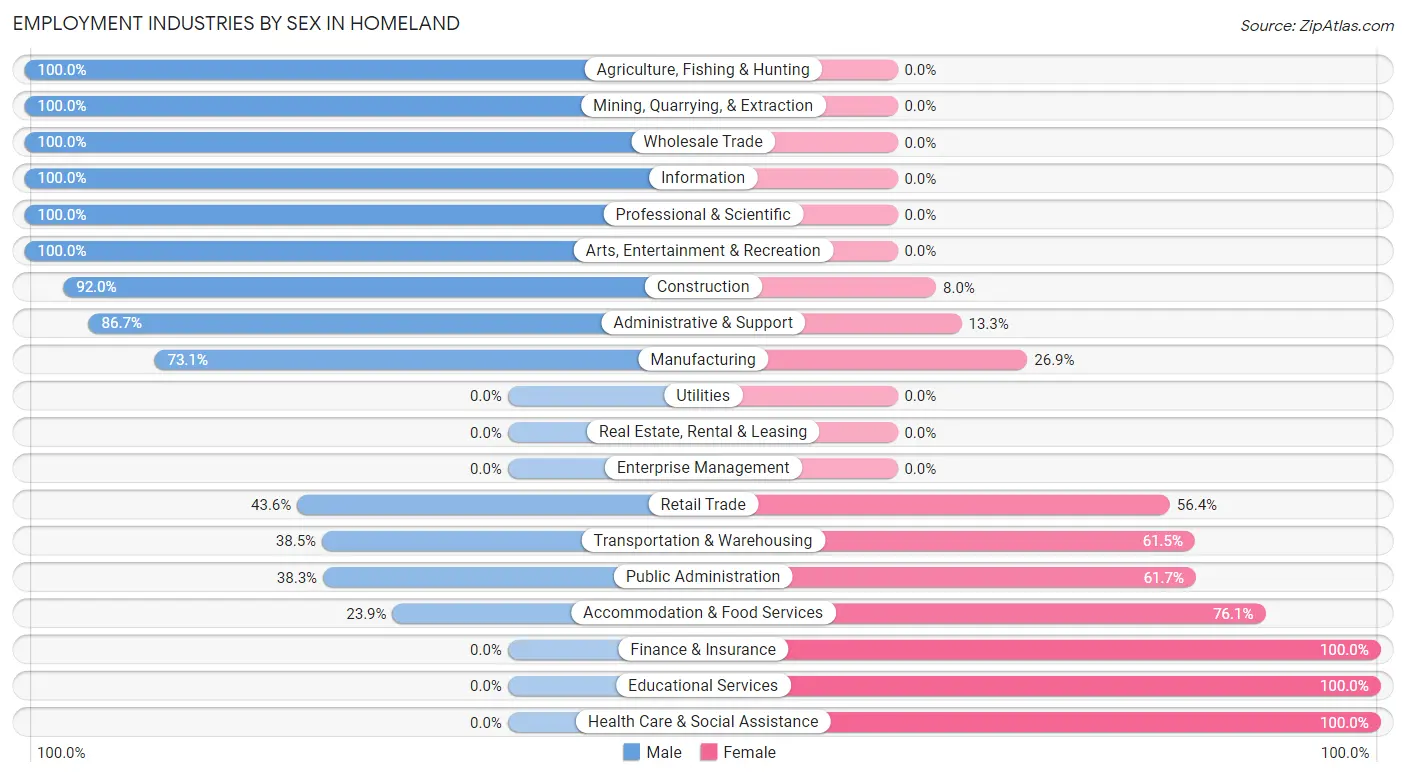
| Industry | Male | Female |
| Agriculture, Fishing & Hunting | 231 (100.0%) | 0 (0.0%) |
| Mining, Quarrying, & Extraction | 18 (100.0%) | 0 (0.0%) |
| Construction | 310 (92.0%) | 27 (8.0%) |
| Manufacturing | 106 (73.1%) | 39 (26.9%) |
| Wholesale Trade | 78 (100.0%) | 0 (0.0%) |
| Retail Trade | 177 (43.6%) | 229 (56.4%) |
| Transportation & Warehousing | 40 (38.5%) | 64 (61.5%) |
| Utilities | 0 (0.0%) | 0 (0.0%) |
| Information | 88 (100.0%) | 0 (0.0%) |
| Finance & Insurance | 0 (0.0%) | 21 (100.0%) |
| Real Estate, Rental & Leasing | 0 (0.0%) | 0 (0.0%) |
| Professional & Scientific | 14 (100.0%) | 0 (0.0%) |
| Enterprise Management | 0 (0.0%) | 0 (0.0%) |
| Administrative & Support | 98 (86.7%) | 15 (13.3%) |
| Educational Services | 0 (0.0%) | 286 (100.0%) |
| Health Care & Social Assistance | 0 (0.0%) | 170 (100.0%) |
| Arts, Entertainment & Recreation | 27 (100.0%) | 0 (0.0%) |
| Accommodation & Food Services | 16 (23.9%) | 51 (76.1%) |
| Public Administration | 44 (38.3%) | 71 (61.7%) |
| Total | 1,255 (55.1%) | 1,024 (44.9%) |
Education in Homeland
School Enrollment in Homeland
The most common levels of schooling among the 1,672 students in Homeland are high school (534 | 31.9%), elementary school (396 | 23.7%), and middle school (248 | 14.8%).
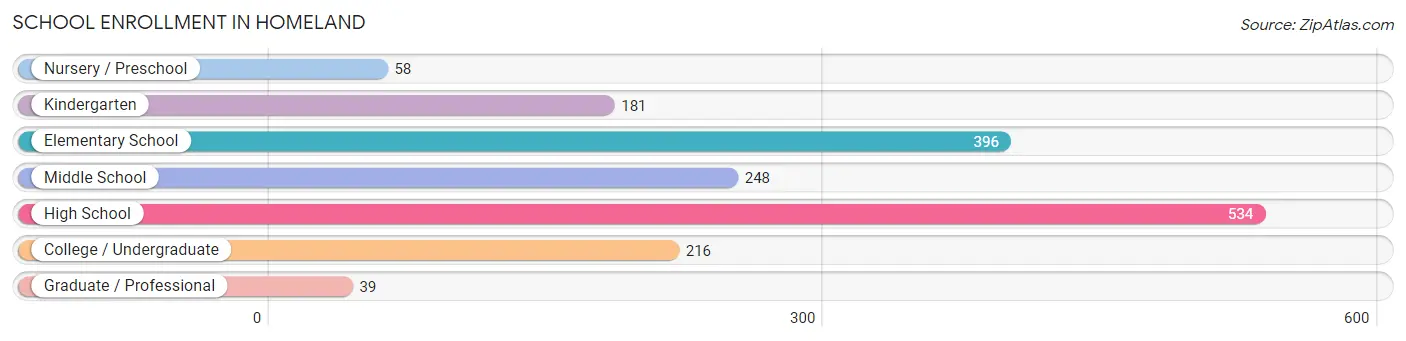
| School Level | # Students | % Students |
| Nursery / Preschool | 58 | 3.5% |
| Kindergarten | 181 | 10.8% |
| Elementary School | 396 | 23.7% |
| Middle School | 248 | 14.8% |
| High School | 534 | 31.9% |
| College / Undergraduate | 216 | 12.9% |
| Graduate / Professional | 39 | 2.3% |
| Total | 1,672 | 100.0% |
School Enrollment by Age by Funding Source in Homeland
Out of a total of 1,672 students who are enrolled in schools in Homeland, 140 (8.4%) attend a private institution, while the remaining 1,532 (91.6%) are enrolled in public schools. The age group of 25 to 34 year olds has the highest likelihood of being enrolled in private schools, with 80 (68.4% in the age bracket) enrolled. Conversely, the age group of 3 to 4 year olds has the lowest likelihood of being enrolled in a private school, with 28 (100.0% in the age bracket) attending a public institution.
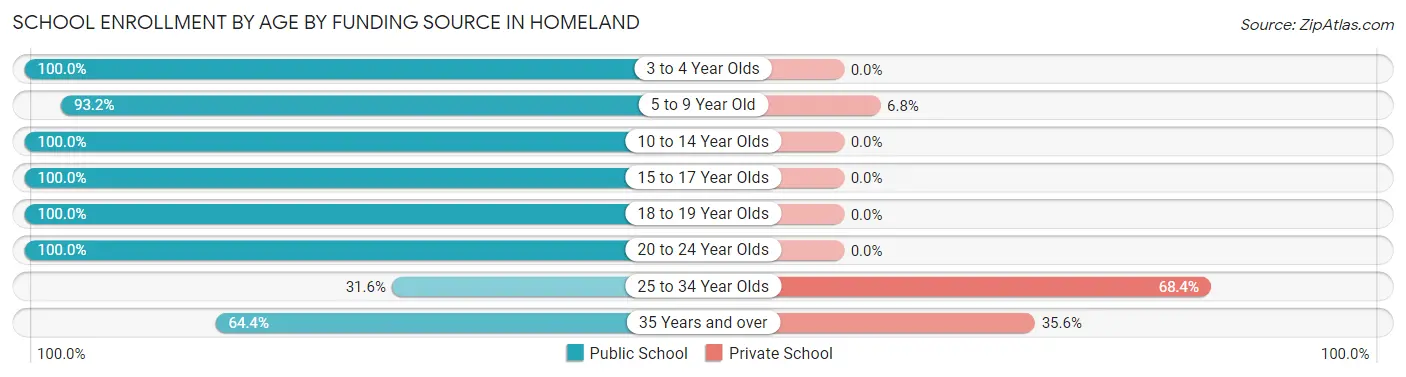
| Age Bracket | Public School | Private School |
| 3 to 4 Year Olds | 28 (100.0%) | 0 (0.0%) |
| 5 to 9 Year Old | 549 (93.2%) | 40 (6.8%) |
| 10 to 14 Year Olds | 496 (100.0%) | 0 (0.0%) |
| 15 to 17 Year Olds | 199 (100.0%) | 0 (0.0%) |
| 18 to 19 Year Olds | 70 (100.0%) | 0 (0.0%) |
| 20 to 24 Year Olds | 114 (100.0%) | 0 (0.0%) |
| 25 to 34 Year Olds | 37 (31.6%) | 80 (68.4%) |
| 35 Years and over | 38 (64.4%) | 21 (35.6%) |
| Total | 1,532 (91.6%) | 140 (8.4%) |
Educational Attainment by Field of Study in Homeland
Business (166 | 36.6%), education (73 | 16.1%), liberal arts & history (66 | 14.5%), psychology (35 | 7.7%), and multidisciplinary studies (33 | 7.3%) are the most common fields of study among 454 individuals in Homeland who have obtained a bachelor's degree or higher.
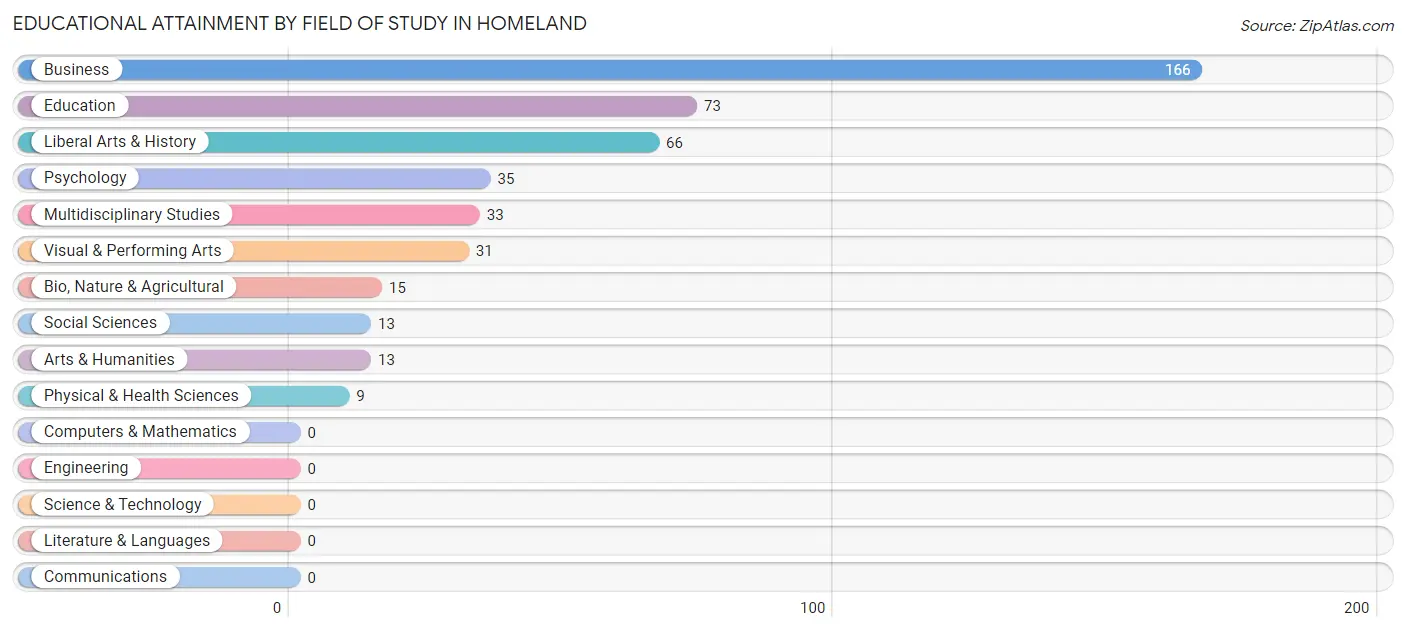
| Field of Study | # Graduates | % Graduates |
| Computers & Mathematics | 0 | 0.0% |
| Bio, Nature & Agricultural | 15 | 3.3% |
| Physical & Health Sciences | 9 | 2.0% |
| Psychology | 35 | 7.7% |
| Social Sciences | 13 | 2.9% |
| Engineering | 0 | 0.0% |
| Multidisciplinary Studies | 33 | 7.3% |
| Science & Technology | 0 | 0.0% |
| Business | 166 | 36.6% |
| Education | 73 | 16.1% |
| Literature & Languages | 0 | 0.0% |
| Liberal Arts & History | 66 | 14.5% |
| Visual & Performing Arts | 31 | 6.8% |
| Communications | 0 | 0.0% |
| Arts & Humanities | 13 | 2.9% |
| Total | 454 | 100.0% |
Transportation & Commute in Homeland
Vehicle Availability by Sex in Homeland
The most prevalent vehicle ownership categories in Homeland are males with 3 vehicles (393, accounting for 37.6%) and females with 3 vehicles (277, making up 38.9%).
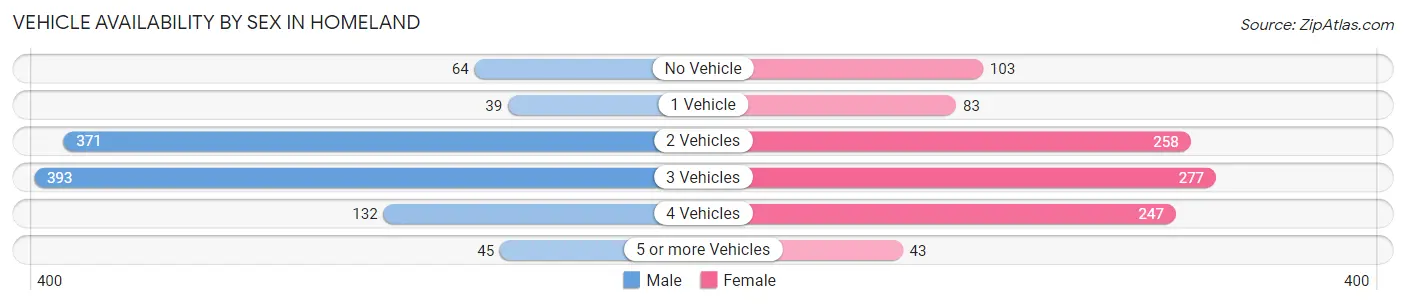
| Vehicles Available | Male | Female |
| No Vehicle | 64 (6.1%) | 103 (10.2%) |
| 1 Vehicle | 39 (3.7%) | 83 (8.2%) |
| 2 Vehicles | 371 (35.5%) | 258 (25.5%) |
| 3 Vehicles | 393 (37.6%) | 277 (27.4%) |
| 4 Vehicles | 132 (12.6%) | 247 (24.4%) |
| 5 or more Vehicles | 45 (4.3%) | 43 (4.3%) |
| Total | 1,044 (100.0%) | 1,011 (100.0%) |
Commute Time in Homeland
The most frequently occuring commute durations in Homeland are 15 to 19 minutes (325 commuters, 18.4%), 60 to 89 minutes (258 commuters, 14.6%), and 30 to 34 minutes (228 commuters, 12.9%).
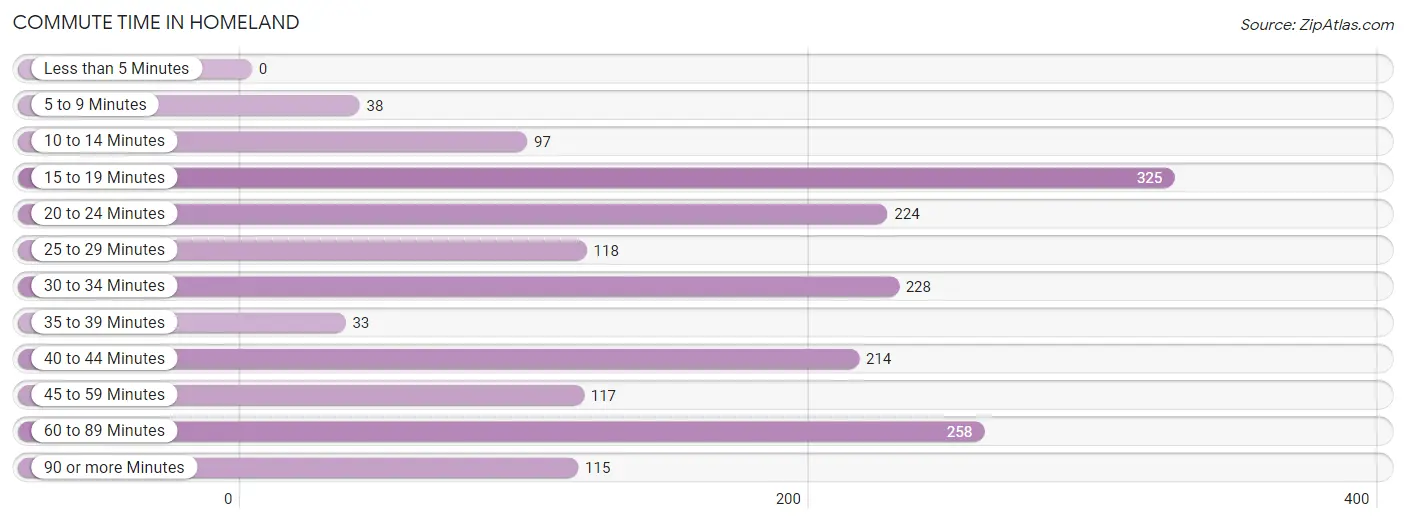
| Commute Time | # Commuters | % Commuters |
| Less than 5 Minutes | 0 | 0.0% |
| 5 to 9 Minutes | 38 | 2.1% |
| 10 to 14 Minutes | 97 | 5.5% |
| 15 to 19 Minutes | 325 | 18.4% |
| 20 to 24 Minutes | 224 | 12.7% |
| 25 to 29 Minutes | 118 | 6.7% |
| 30 to 34 Minutes | 228 | 12.9% |
| 35 to 39 Minutes | 33 | 1.9% |
| 40 to 44 Minutes | 214 | 12.1% |
| 45 to 59 Minutes | 117 | 6.6% |
| 60 to 89 Minutes | 258 | 14.6% |
| 90 or more Minutes | 115 | 6.5% |
Commute Time by Sex in Homeland
The most common commute times in Homeland are 60 to 89 minutes (202 commuters, 20.2%) for males and 15 to 19 minutes (272 commuters, 35.4%) for females.
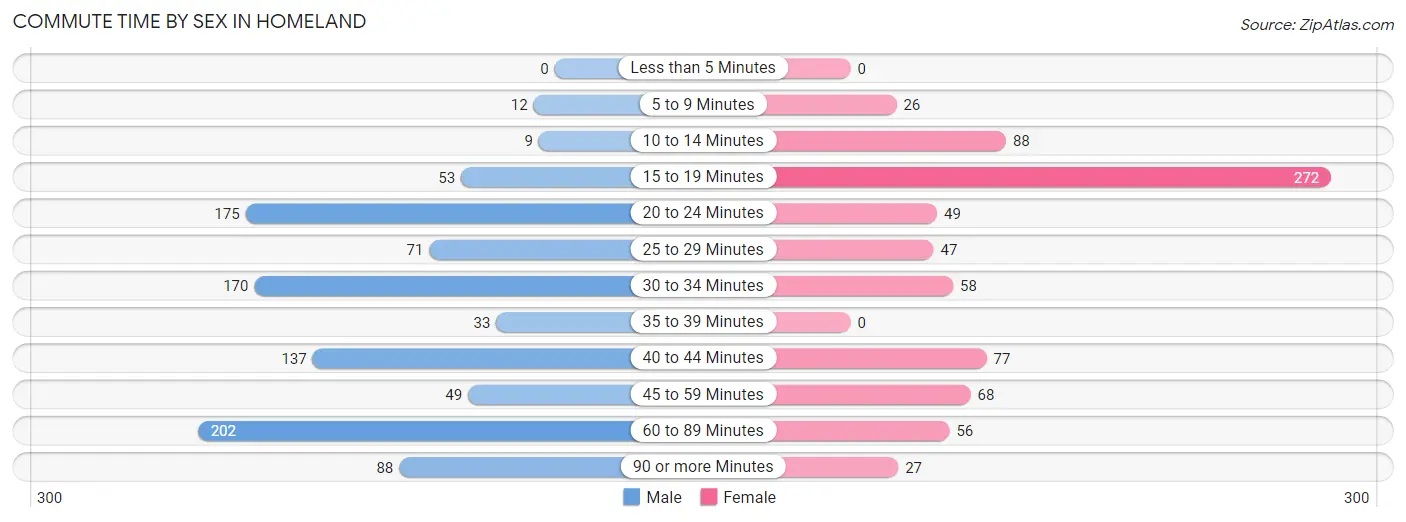
| Commute Time | Male | Female |
| Less than 5 Minutes | 0 (0.0%) | 0 (0.0%) |
| 5 to 9 Minutes | 12 (1.2%) | 26 (3.4%) |
| 10 to 14 Minutes | 9 (0.9%) | 88 (11.5%) |
| 15 to 19 Minutes | 53 (5.3%) | 272 (35.4%) |
| 20 to 24 Minutes | 175 (17.5%) | 49 (6.4%) |
| 25 to 29 Minutes | 71 (7.1%) | 47 (6.1%) |
| 30 to 34 Minutes | 170 (17.0%) | 58 (7.5%) |
| 35 to 39 Minutes | 33 (3.3%) | 0 (0.0%) |
| 40 to 44 Minutes | 137 (13.7%) | 77 (10.0%) |
| 45 to 59 Minutes | 49 (4.9%) | 68 (8.8%) |
| 60 to 89 Minutes | 202 (20.2%) | 56 (7.3%) |
| 90 or more Minutes | 88 (8.8%) | 27 (3.5%) |
Time of Departure to Work by Sex in Homeland
The most frequent times of departure to work in Homeland are 12:00 AM to 4:59 AM (235, 23.5%) for males and 7:00 AM to 7:29 AM (194, 25.3%) for females.
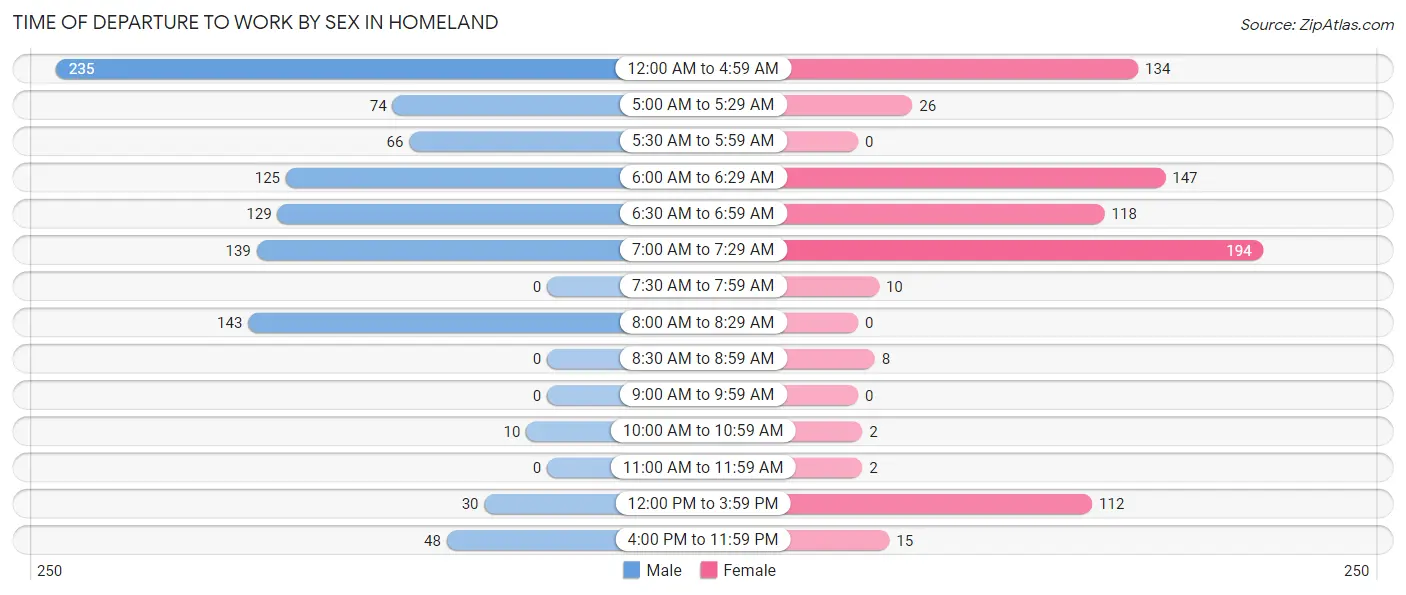
| Time of Departure | Male | Female |
| 12:00 AM to 4:59 AM | 235 (23.5%) | 134 (17.4%) |
| 5:00 AM to 5:29 AM | 74 (7.4%) | 26 (3.4%) |
| 5:30 AM to 5:59 AM | 66 (6.6%) | 0 (0.0%) |
| 6:00 AM to 6:29 AM | 125 (12.5%) | 147 (19.1%) |
| 6:30 AM to 6:59 AM | 129 (12.9%) | 118 (15.4%) |
| 7:00 AM to 7:29 AM | 139 (13.9%) | 194 (25.3%) |
| 7:30 AM to 7:59 AM | 0 (0.0%) | 10 (1.3%) |
| 8:00 AM to 8:29 AM | 143 (14.3%) | 0 (0.0%) |
| 8:30 AM to 8:59 AM | 0 (0.0%) | 8 (1.0%) |
| 9:00 AM to 9:59 AM | 0 (0.0%) | 0 (0.0%) |
| 10:00 AM to 10:59 AM | 10 (1.0%) | 2 (0.3%) |
| 11:00 AM to 11:59 AM | 0 (0.0%) | 2 (0.3%) |
| 12:00 PM to 3:59 PM | 30 (3.0%) | 112 (14.6%) |
| 4:00 PM to 11:59 PM | 48 (4.8%) | 15 (1.9%) |
| Total | 999 (100.0%) | 768 (100.0%) |
Housing Occupancy in Homeland
Occupancy by Ownership in Homeland
Of the total 2,083 dwellings in Homeland, owner-occupied units account for 1,514 (72.7%), while renter-occupied units make up 569 (27.3%).
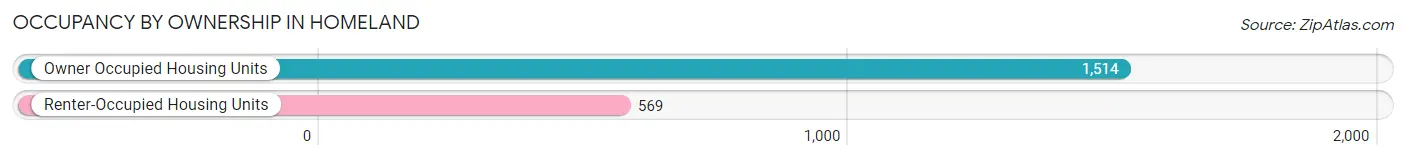
| Occupancy | # Housing Units | % Housing Units |
| Owner Occupied Housing Units | 1,514 | 72.7% |
| Renter-Occupied Housing Units | 569 | 27.3% |
| Total Occupied Housing Units | 2,083 | 100.0% |
Occupancy by Household Size in Homeland
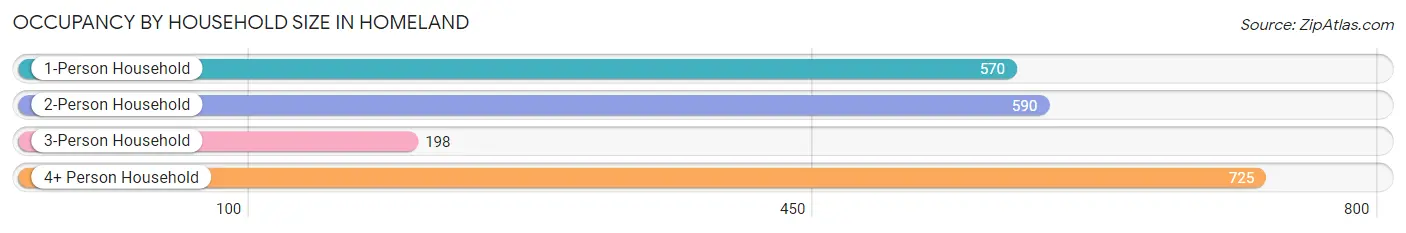
| Household Size | # Housing Units | % Housing Units |
| 1-Person Household | 570 | 27.4% |
| 2-Person Household | 590 | 28.3% |
| 3-Person Household | 198 | 9.5% |
| 4+ Person Household | 725 | 34.8% |
| Total Housing Units | 2,083 | 100.0% |
Occupancy by Ownership by Household Size in Homeland
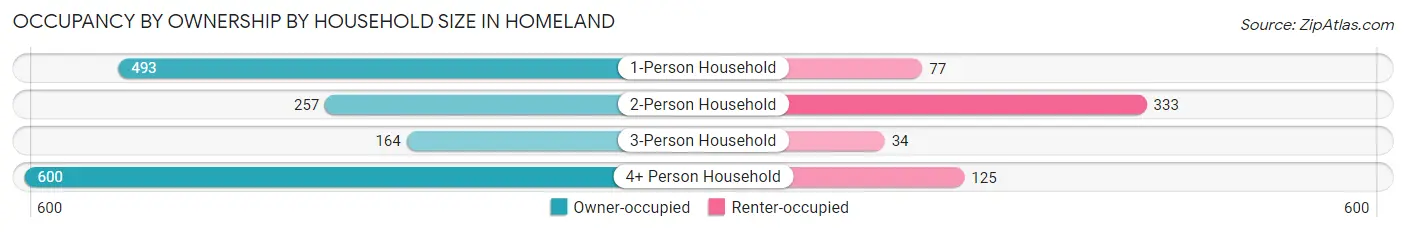
| Household Size | Owner-occupied | Renter-occupied |
| 1-Person Household | 493 (86.5%) | 77 (13.5%) |
| 2-Person Household | 257 (43.6%) | 333 (56.4%) |
| 3-Person Household | 164 (82.8%) | 34 (17.2%) |
| 4+ Person Household | 600 (82.8%) | 125 (17.2%) |
| Total Housing Units | 1,514 (72.7%) | 569 (27.3%) |
Occupancy by Educational Attainment in Homeland
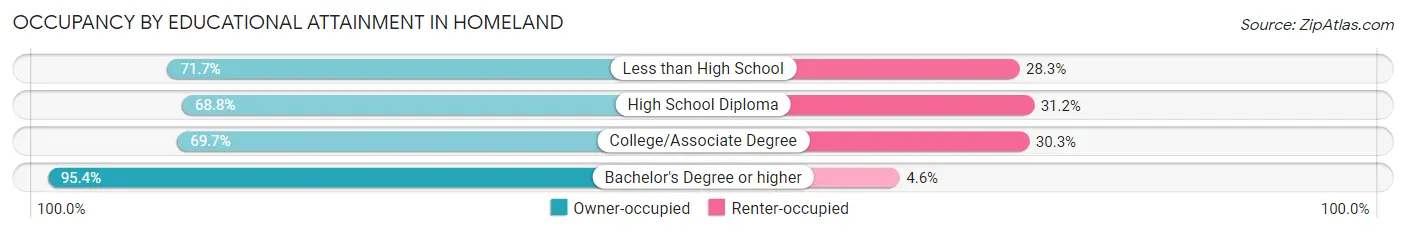
| Household Size | Owner-occupied | Renter-occupied |
| Less than High School | 420 (71.7%) | 166 (28.3%) |
| High School Diploma | 414 (68.8%) | 188 (31.2%) |
| College/Associate Degree | 472 (69.7%) | 205 (30.3%) |
| Bachelor's Degree or higher | 208 (95.4%) | 10 (4.6%) |
Occupancy by Age of Householder in Homeland
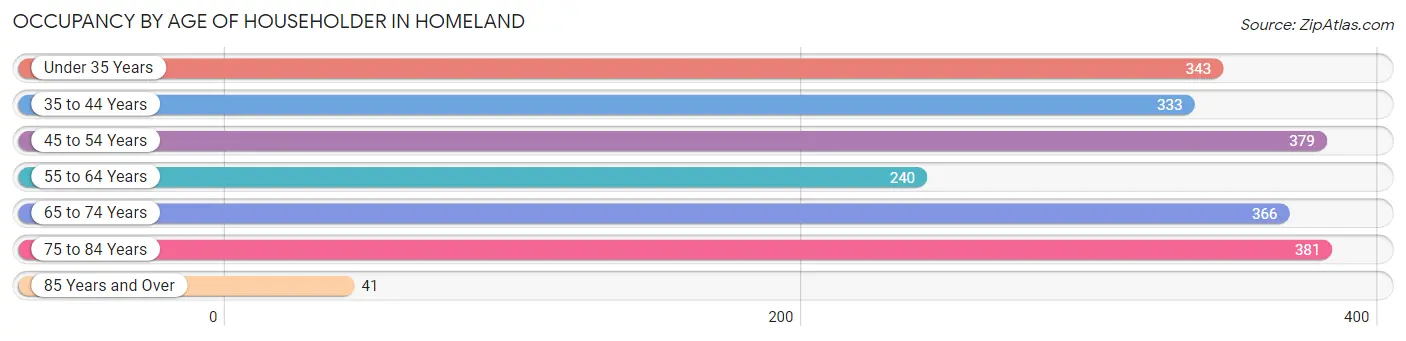
| Age Bracket | # Households | % Households |
| Under 35 Years | 343 | 16.5% |
| 35 to 44 Years | 333 | 16.0% |
| 45 to 54 Years | 379 | 18.2% |
| 55 to 64 Years | 240 | 11.5% |
| 65 to 74 Years | 366 | 17.6% |
| 75 to 84 Years | 381 | 18.3% |
| 85 Years and Over | 41 | 2.0% |
| Total | 2,083 | 100.0% |
Housing Finances in Homeland
Median Income by Occupancy in Homeland
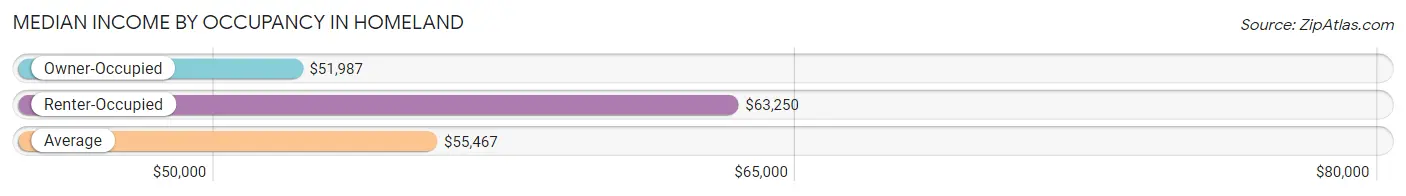
| Occupancy Type | # Households | Median Income |
| Owner-Occupied | 1,514 (72.7%) | $51,987 |
| Renter-Occupied | 569 (27.3%) | $63,250 |
| Average | 2,083 (100.0%) | $55,467 |
Occupancy by Householder Income Bracket in Homeland
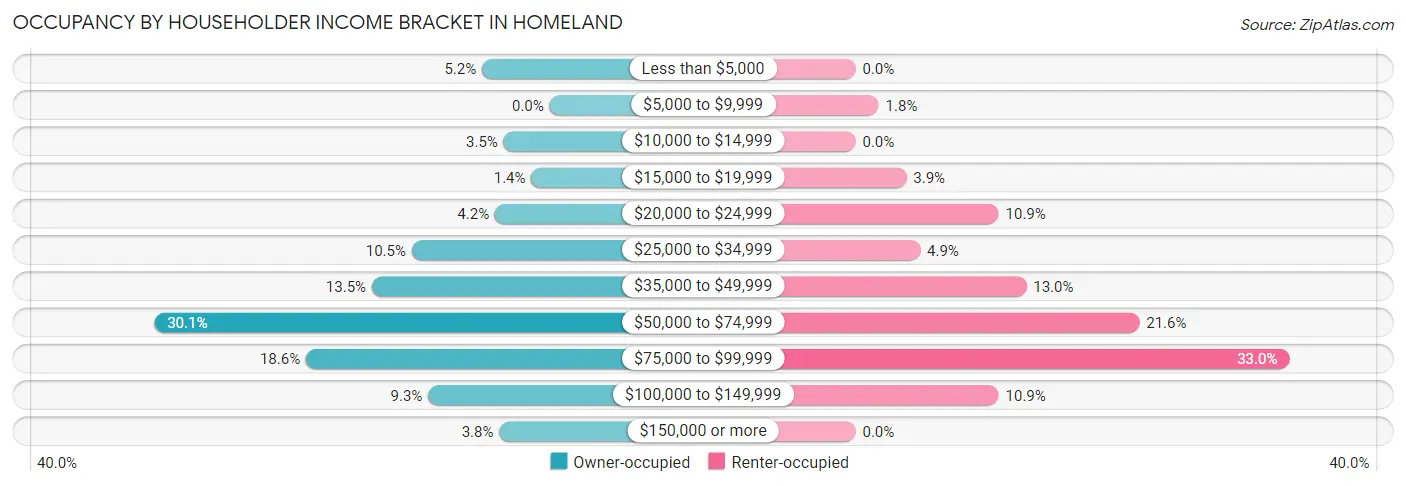
| Income Bracket | Owner-occupied | Renter-occupied |
| Less than $5,000 | 78 (5.1%) | 0 (0.0%) |
| $5,000 to $9,999 | 0 (0.0%) | 10 (1.8%) |
| $10,000 to $14,999 | 53 (3.5%) | 0 (0.0%) |
| $15,000 to $19,999 | 21 (1.4%) | 22 (3.9%) |
| $20,000 to $24,999 | 63 (4.2%) | 62 (10.9%) |
| $25,000 to $34,999 | 159 (10.5%) | 28 (4.9%) |
| $35,000 to $49,999 | 205 (13.5%) | 74 (13.0%) |
| $50,000 to $74,999 | 456 (30.1%) | 123 (21.6%) |
| $75,000 to $99,999 | 281 (18.6%) | 188 (33.0%) |
| $100,000 to $149,999 | 140 (9.2%) | 62 (10.9%) |
| $150,000 or more | 58 (3.8%) | 0 (0.0%) |
| Total | 1,514 (100.0%) | 569 (100.0%) |
Monthly Housing Cost Tiers in Homeland
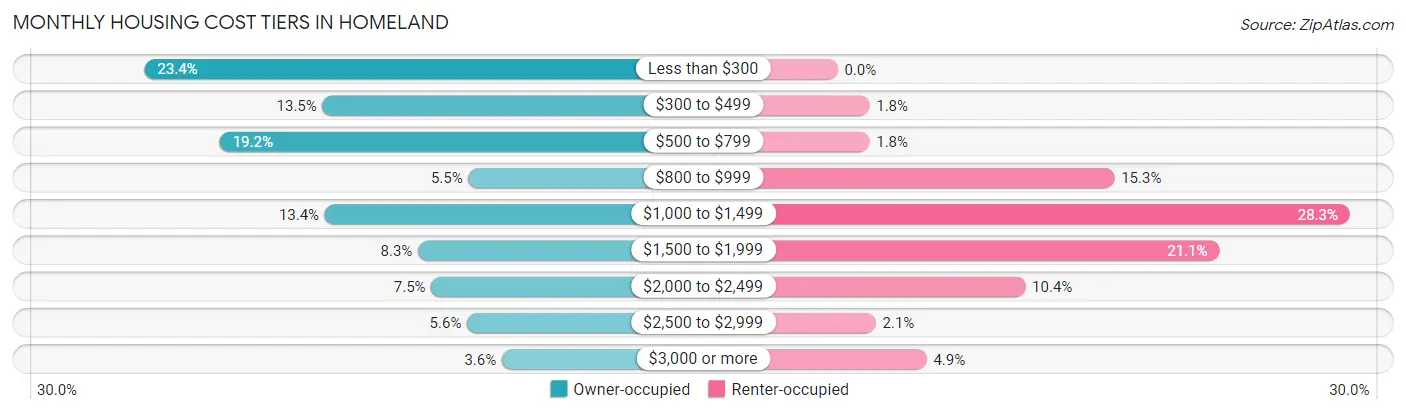
| Monthly Cost | Owner-occupied | Renter-occupied |
| Less than $300 | 354 (23.4%) | 0 (0.0%) |
| $300 to $499 | 205 (13.5%) | 10 (1.8%) |
| $500 to $799 | 291 (19.2%) | 10 (1.8%) |
| $800 to $999 | 83 (5.5%) | 87 (15.3%) |
| $1,000 to $1,499 | 203 (13.4%) | 161 (28.3%) |
| $1,500 to $1,999 | 125 (8.3%) | 120 (21.1%) |
| $2,000 to $2,499 | 114 (7.5%) | 59 (10.4%) |
| $2,500 to $2,999 | 84 (5.6%) | 12 (2.1%) |
| $3,000 or more | 55 (3.6%) | 28 (4.9%) |
| Total | 1,514 (100.0%) | 569 (100.0%) |
Physical Housing Characteristics in Homeland
Housing Structures in Homeland
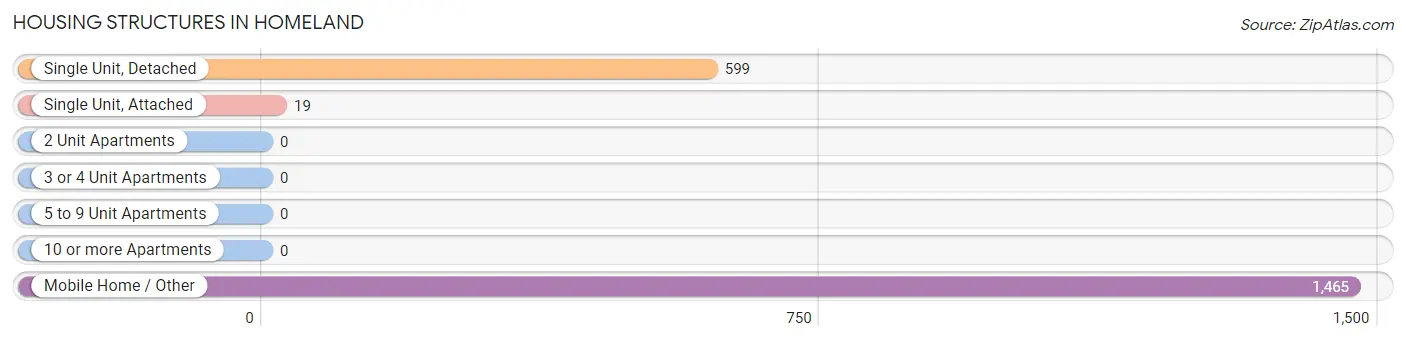
| Structure Type | # Housing Units | % Housing Units |
| Single Unit, Detached | 599 | 28.8% |
| Single Unit, Attached | 19 | 0.9% |
| 2 Unit Apartments | 0 | 0.0% |
| 3 or 4 Unit Apartments | 0 | 0.0% |
| 5 to 9 Unit Apartments | 0 | 0.0% |
| 10 or more Apartments | 0 | 0.0% |
| Mobile Home / Other | 1,465 | 70.3% |
| Total | 2,083 | 100.0% |
Housing Structures by Occupancy in Homeland
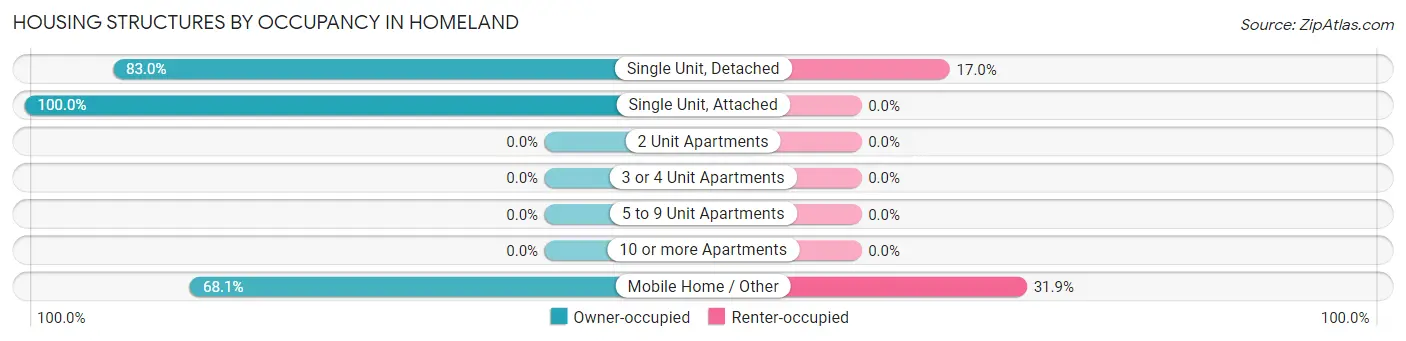
| Structure Type | Owner-occupied | Renter-occupied |
| Single Unit, Detached | 497 (83.0%) | 102 (17.0%) |
| Single Unit, Attached | 19 (100.0%) | 0 (0.0%) |
| 2 Unit Apartments | 0 (0.0%) | 0 (0.0%) |
| 3 or 4 Unit Apartments | 0 (0.0%) | 0 (0.0%) |
| 5 to 9 Unit Apartments | 0 (0.0%) | 0 (0.0%) |
| 10 or more Apartments | 0 (0.0%) | 0 (0.0%) |
| Mobile Home / Other | 998 (68.1%) | 467 (31.9%) |
| Total | 1,514 (72.7%) | 569 (27.3%) |
Housing Structures by Number of Rooms in Homeland
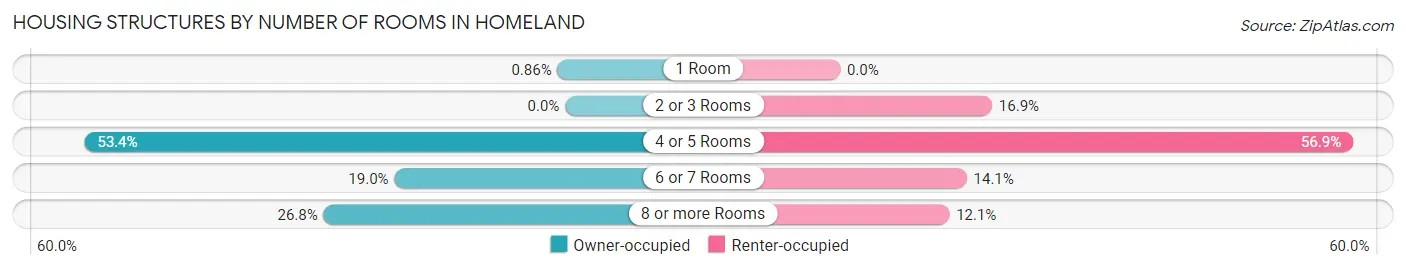
| Number of Rooms | Owner-occupied | Renter-occupied |
| 1 Room | 13 (0.9%) | 0 (0.0%) |
| 2 or 3 Rooms | 0 (0.0%) | 96 (16.9%) |
| 4 or 5 Rooms | 808 (53.4%) | 324 (56.9%) |
| 6 or 7 Rooms | 287 (19.0%) | 80 (14.1%) |
| 8 or more Rooms | 406 (26.8%) | 69 (12.1%) |
| Total | 1,514 (100.0%) | 569 (100.0%) |
Housing Structure by Heating Type in Homeland
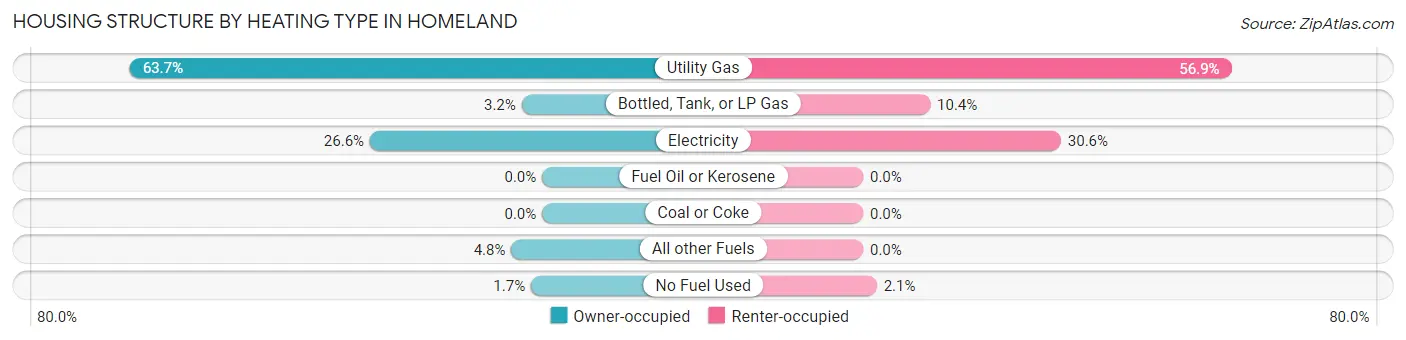
| Heating Type | Owner-occupied | Renter-occupied |
| Utility Gas | 965 (63.7%) | 324 (56.9%) |
| Bottled, Tank, or LP Gas | 48 (3.2%) | 59 (10.4%) |
| Electricity | 403 (26.6%) | 174 (30.6%) |
| Fuel Oil or Kerosene | 0 (0.0%) | 0 (0.0%) |
| Coal or Coke | 0 (0.0%) | 0 (0.0%) |
| All other Fuels | 72 (4.8%) | 0 (0.0%) |
| No Fuel Used | 26 (1.7%) | 12 (2.1%) |
| Total | 1,514 (100.0%) | 569 (100.0%) |
Household Vehicle Usage in Homeland
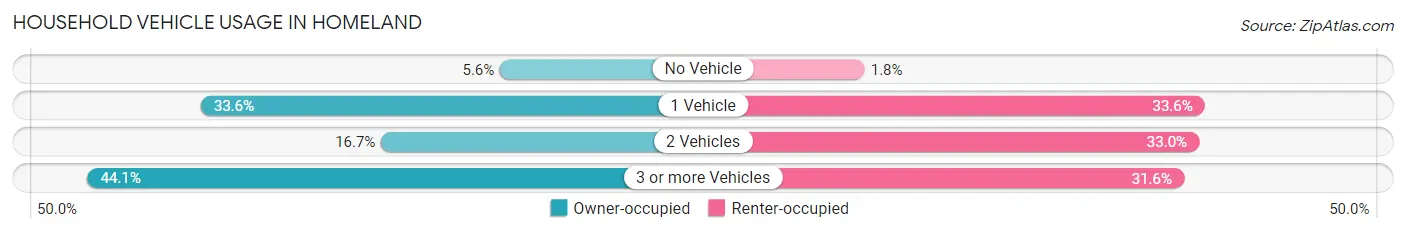
| Vehicles per Household | Owner-occupied | Renter-occupied |
| No Vehicle | 85 (5.6%) | 10 (1.8%) |
| 1 Vehicle | 508 (33.6%) | 191 (33.6%) |
| 2 Vehicles | 253 (16.7%) | 188 (33.0%) |
| 3 or more Vehicles | 668 (44.1%) | 180 (31.6%) |
| Total | 1,514 (100.0%) | 569 (100.0%) |
Real Estate & Mortgages in Homeland
Real Estate and Mortgage Overview in Homeland
| Characteristic | Without Mortgage | With Mortgage |
| Housing Units | 885 | 629 |
| Median Property Value | $121,200 | $279,100 |
| Median Household Income | $50,977 | $58 |
| Monthly Housing Costs | $368 | $42 |
| Real Estate Taxes | $904 | $7 |
Property Value by Mortgage Status in Homeland
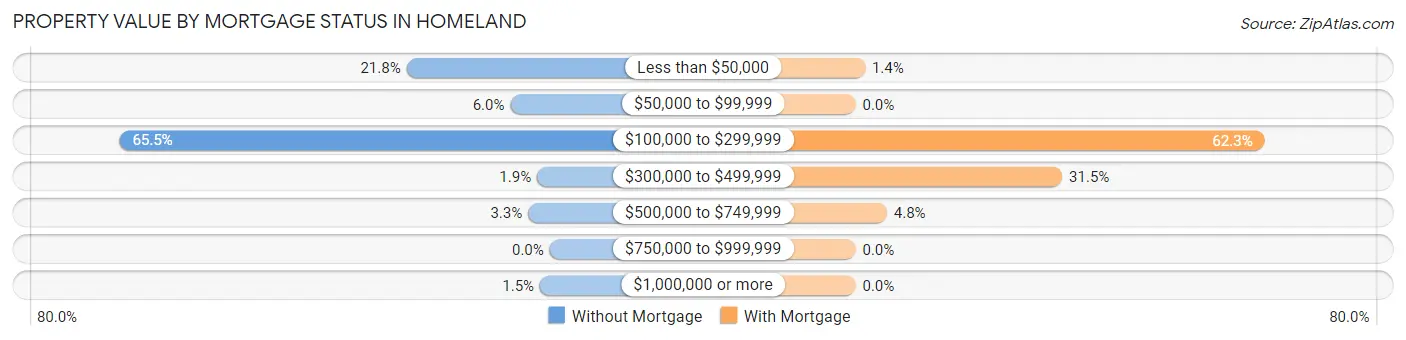
| Property Value | Without Mortgage | With Mortgage |
| Less than $50,000 | 193 (21.8%) | 9 (1.4%) |
| $50,000 to $99,999 | 53 (6.0%) | 0 (0.0%) |
| $100,000 to $299,999 | 580 (65.5%) | 392 (62.3%) |
| $300,000 to $499,999 | 17 (1.9%) | 198 (31.5%) |
| $500,000 to $749,999 | 29 (3.3%) | 30 (4.8%) |
| $750,000 to $999,999 | 0 (0.0%) | 0 (0.0%) |
| $1,000,000 or more | 13 (1.5%) | 0 (0.0%) |
| Total | 885 (100.0%) | 629 (100.0%) |
Household Income by Mortgage Status in Homeland
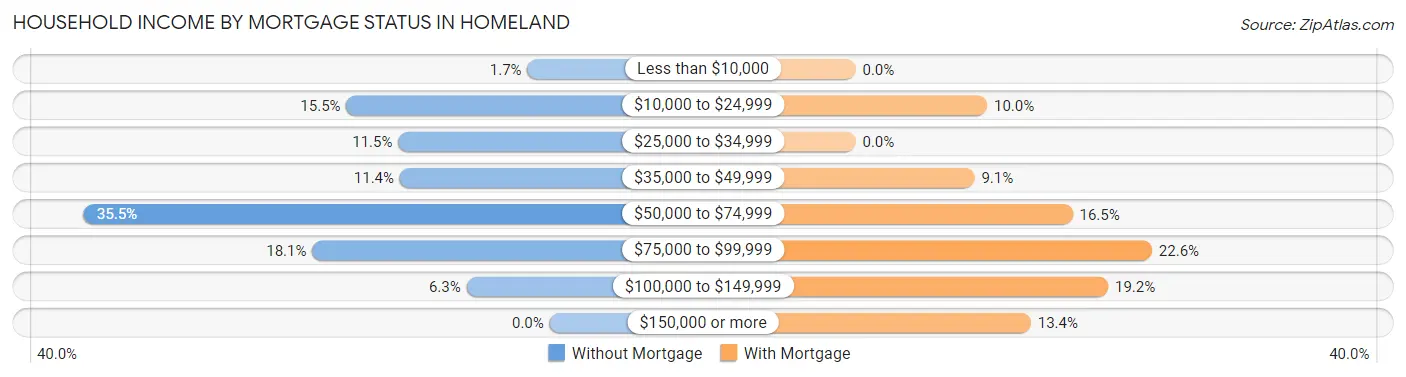
| Household Income | Without Mortgage | With Mortgage |
| Less than $10,000 | 15 (1.7%) | 0 (0.0%) |
| $10,000 to $24,999 | 137 (15.5%) | 63 (10.0%) |
| $25,000 to $34,999 | 102 (11.5%) | 0 (0.0%) |
| $35,000 to $49,999 | 101 (11.4%) | 57 (9.1%) |
| $50,000 to $74,999 | 314 (35.5%) | 104 (16.5%) |
| $75,000 to $99,999 | 160 (18.1%) | 142 (22.6%) |
| $100,000 to $149,999 | 56 (6.3%) | 121 (19.2%) |
| $150,000 or more | 0 (0.0%) | 84 (13.4%) |
| Total | 885 (100.0%) | 629 (100.0%) |
Property Value to Household Income Ratio in Homeland
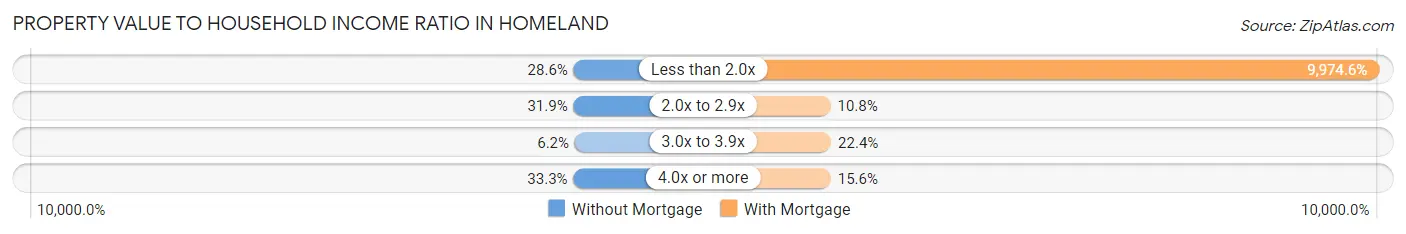
| Value-to-Income Ratio | Without Mortgage | With Mortgage |
| Less than 2.0x | 253 (28.6%) | 62,740 (9,974.6%) |
| 2.0x to 2.9x | 282 (31.9%) | 68 (10.8%) |
| 3.0x to 3.9x | 55 (6.2%) | 141 (22.4%) |
| 4.0x or more | 295 (33.3%) | 98 (15.6%) |
| Total | 885 (100.0%) | 629 (100.0%) |
Real Estate Taxes by Mortgage Status in Homeland
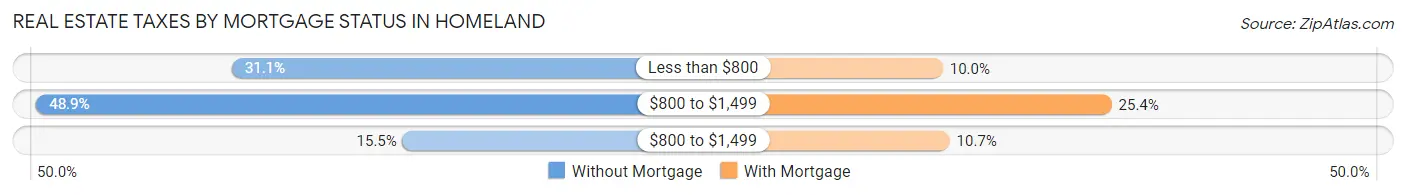
| Property Taxes | Without Mortgage | With Mortgage |
| Less than $800 | 275 (31.1%) | 63 (10.0%) |
| $800 to $1,499 | 433 (48.9%) | 160 (25.4%) |
| $800 to $1,499 | 137 (15.5%) | 67 (10.6%) |
| Total | 885 (100.0%) | 629 (100.0%) |
Health & Disability in Homeland
Health Insurance Coverage by Age in Homeland
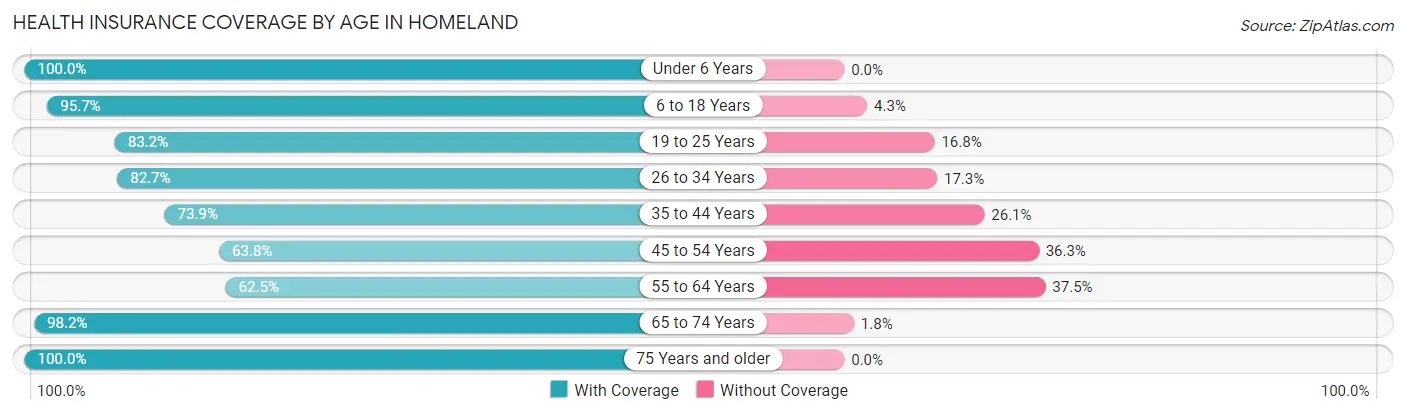
| Age Bracket | With Coverage | Without Coverage |
| Under 6 Years | 318 (100.0%) | 0 (0.0%) |
| 6 to 18 Years | 1,281 (95.7%) | 57 (4.3%) |
| 19 to 25 Years | 544 (83.2%) | 110 (16.8%) |
| 26 to 34 Years | 803 (82.7%) | 168 (17.3%) |
| 35 to 44 Years | 427 (73.9%) | 151 (26.1%) |
| 45 to 54 Years | 517 (63.7%) | 294 (36.2%) |
| 55 to 64 Years | 285 (62.5%) | 171 (37.5%) |
| 65 to 74 Years | 548 (98.2%) | 10 (1.8%) |
| 75 Years and older | 529 (100.0%) | 0 (0.0%) |
| Total | 5,252 (84.5%) | 961 (15.5%) |
Health Insurance Coverage by Citizenship Status in Homeland
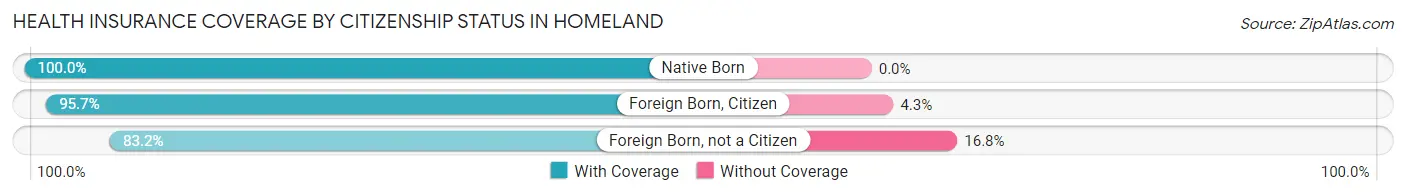
| Citizenship Status | With Coverage | Without Coverage |
| Native Born | 318 (100.0%) | 0 (0.0%) |
| Foreign Born, Citizen | 1,281 (95.7%) | 57 (4.3%) |
| Foreign Born, not a Citizen | 544 (83.2%) | 110 (16.8%) |
Health Insurance Coverage by Household Income in Homeland
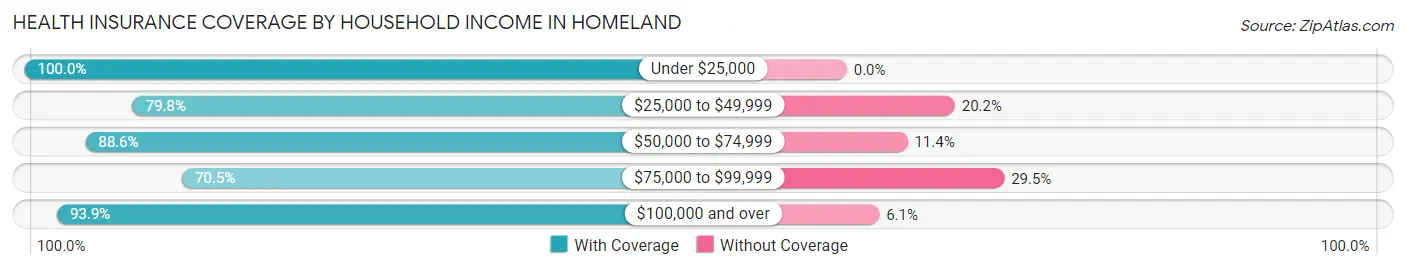
| Household Income | With Coverage | Without Coverage |
| Under $25,000 | 485 (100.0%) | 0 (0.0%) |
| $25,000 to $49,999 | 1,009 (79.8%) | 256 (20.2%) |
| $50,000 to $74,999 | 1,918 (88.6%) | 246 (11.4%) |
| $75,000 to $99,999 | 966 (70.5%) | 404 (29.5%) |
| $100,000 and over | 851 (93.9%) | 55 (6.1%) |
Public vs Private Health Insurance Coverage by Age in Homeland
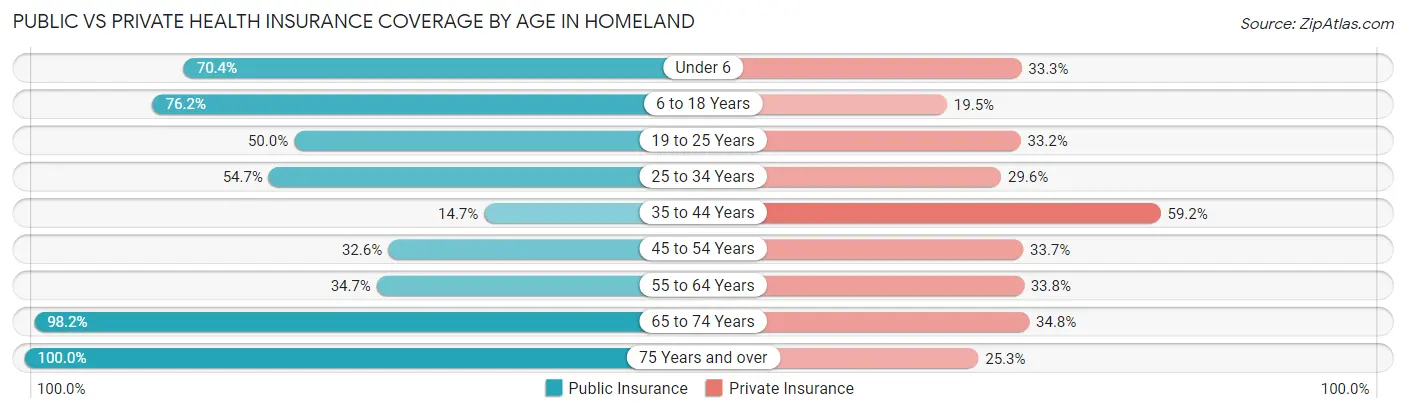
| Age Bracket | Public Insurance | Private Insurance |
| Under 6 | 224 (70.4%) | 106 (33.3%) |
| 6 to 18 Years | 1,020 (76.2%) | 261 (19.5%) |
| 19 to 25 Years | 327 (50.0%) | 217 (33.2%) |
| 25 to 34 Years | 531 (54.7%) | 287 (29.6%) |
| 35 to 44 Years | 85 (14.7%) | 342 (59.2%) |
| 45 to 54 Years | 264 (32.6%) | 273 (33.7%) |
| 55 to 64 Years | 158 (34.6%) | 154 (33.8%) |
| 65 to 74 Years | 548 (98.2%) | 194 (34.8%) |
| 75 Years and over | 529 (100.0%) | 134 (25.3%) |
| Total | 3,686 (59.3%) | 1,968 (31.7%) |
Disability Status by Sex by Age in Homeland
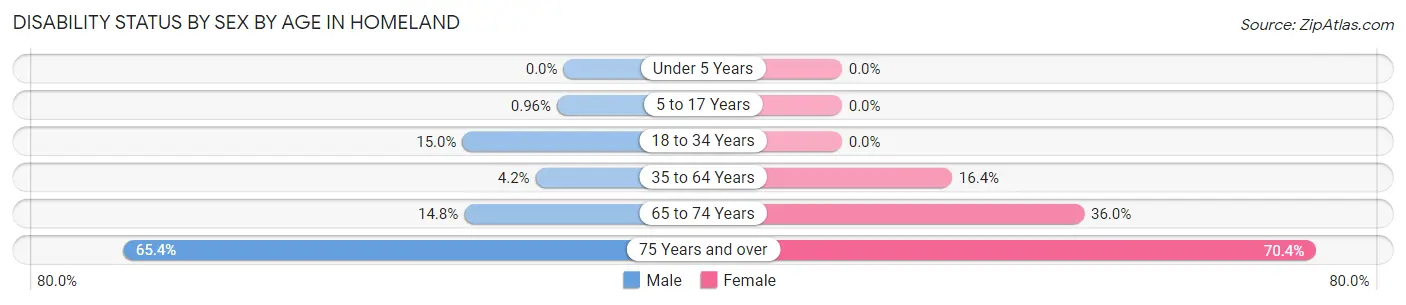
| Age Bracket | Male | Female |
| Under 5 Years | 0 (0.0%) | 0 (0.0%) |
| 5 to 17 Years | 7 (1.0%) | 0 (0.0%) |
| 18 to 34 Years | 105 (15.0%) | 0 (0.0%) |
| 35 to 64 Years | 39 (4.2%) | 148 (16.4%) |
| 65 to 74 Years | 45 (14.7%) | 91 (36.0%) |
| 75 Years and over | 189 (65.4%) | 169 (70.4%) |
Disability Class by Sex by Age in Homeland
Disability Class: Hearing Difficulty
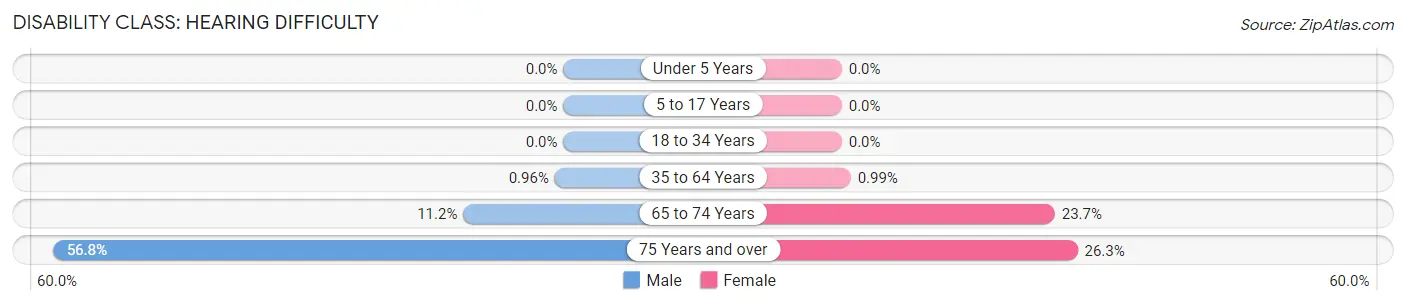
| Age Bracket | Male | Female |
| Under 5 Years | 0 (0.0%) | 0 (0.0%) |
| 5 to 17 Years | 0 (0.0%) | 0 (0.0%) |
| 18 to 34 Years | 0 (0.0%) | 0 (0.0%) |
| 35 to 64 Years | 9 (1.0%) | 9 (1.0%) |
| 65 to 74 Years | 34 (11.2%) | 60 (23.7%) |
| 75 Years and over | 164 (56.8%) | 63 (26.3%) |
Disability Class: Vision Difficulty
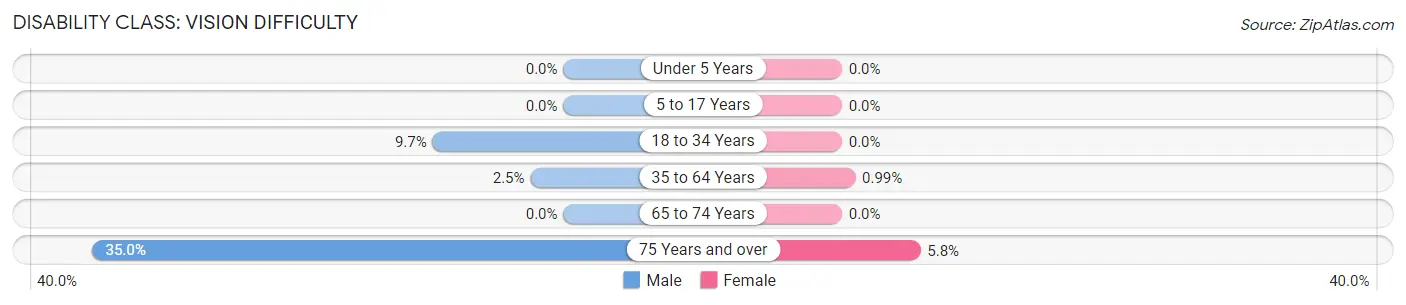
| Age Bracket | Male | Female |
| Under 5 Years | 0 (0.0%) | 0 (0.0%) |
| 5 to 17 Years | 0 (0.0%) | 0 (0.0%) |
| 18 to 34 Years | 68 (9.7%) | 0 (0.0%) |
| 35 to 64 Years | 23 (2.5%) | 9 (1.0%) |
| 65 to 74 Years | 0 (0.0%) | 0 (0.0%) |
| 75 Years and over | 101 (34.9%) | 14 (5.8%) |
Disability Class: Cognitive Difficulty
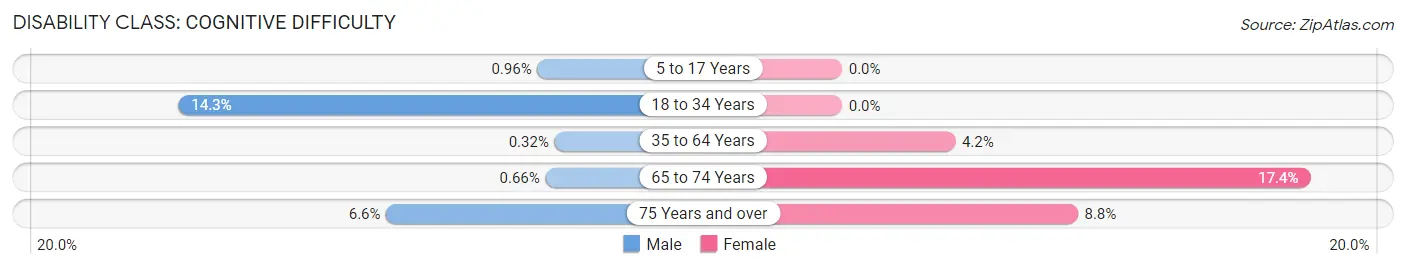
| Age Bracket | Male | Female |
| 5 to 17 Years | 7 (1.0%) | 0 (0.0%) |
| 18 to 34 Years | 100 (14.3%) | 0 (0.0%) |
| 35 to 64 Years | 3 (0.3%) | 38 (4.2%) |
| 65 to 74 Years | 2 (0.7%) | 44 (17.4%) |
| 75 Years and over | 19 (6.6%) | 21 (8.7%) |
Disability Class: Ambulatory Difficulty
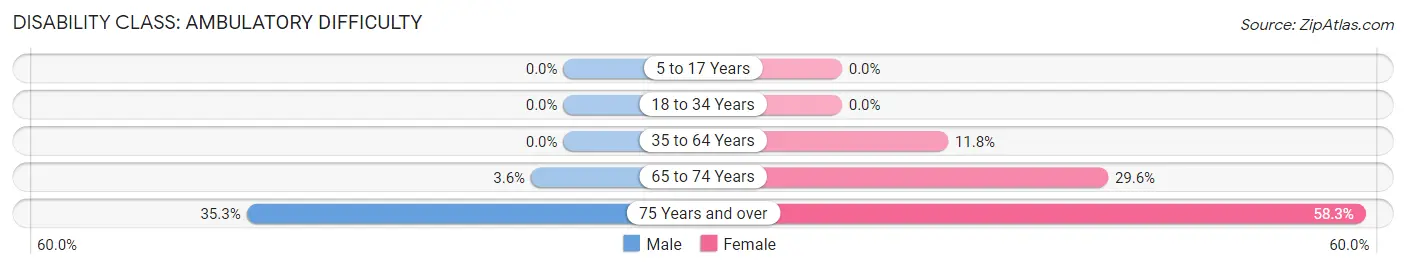
| Age Bracket | Male | Female |
| 5 to 17 Years | 0 (0.0%) | 0 (0.0%) |
| 18 to 34 Years | 0 (0.0%) | 0 (0.0%) |
| 35 to 64 Years | 0 (0.0%) | 107 (11.8%) |
| 65 to 74 Years | 11 (3.6%) | 75 (29.6%) |
| 75 Years and over | 102 (35.3%) | 140 (58.3%) |
Disability Class: Self-Care Difficulty
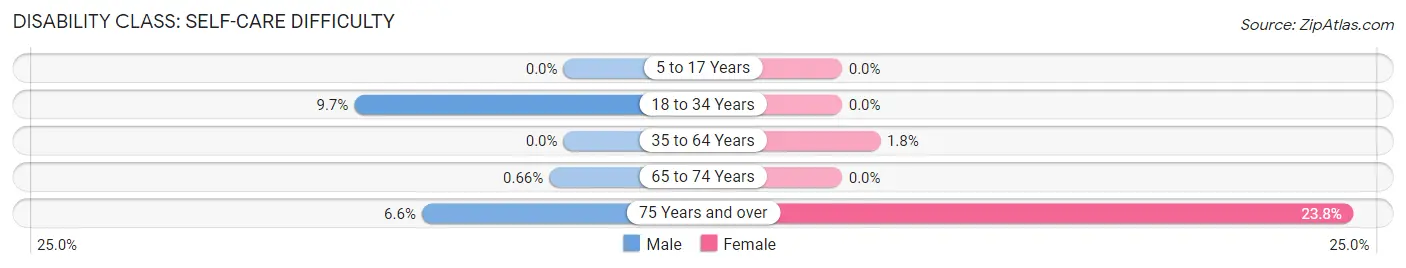
| Age Bracket | Male | Female |
| 5 to 17 Years | 0 (0.0%) | 0 (0.0%) |
| 18 to 34 Years | 68 (9.7%) | 0 (0.0%) |
| 35 to 64 Years | 0 (0.0%) | 16 (1.8%) |
| 65 to 74 Years | 2 (0.7%) | 0 (0.0%) |
| 75 Years and over | 19 (6.6%) | 57 (23.7%) |
Technology Access in Homeland
Computing Device Access in Homeland
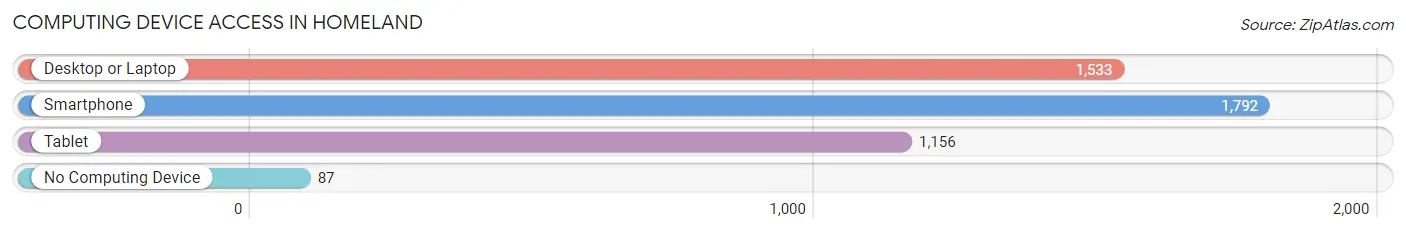
| Device Type | # Households | % Households |
| Desktop or Laptop | 1,533 | 73.6% |
| Smartphone | 1,792 | 86.0% |
| Tablet | 1,156 | 55.5% |
| No Computing Device | 87 | 4.2% |
| Total | 2,083 | 100.0% |
Internet Access in Homeland
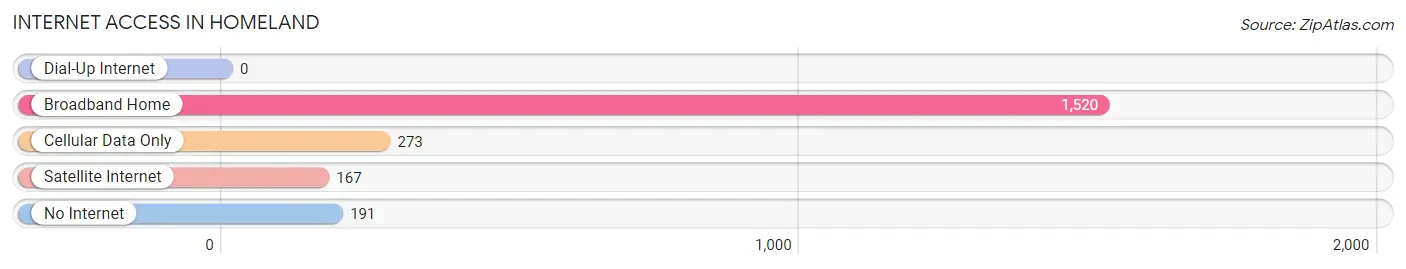
| Internet Type | # Households | % Households |
| Dial-Up Internet | 0 | 0.0% |
| Broadband Home | 1,520 | 73.0% |
| Cellular Data Only | 273 | 13.1% |
| Satellite Internet | 167 | 8.0% |
| No Internet | 191 | 9.2% |
| Total | 2,083 | 100.0% |
Homeland Summary
Homeland is a census-designated place located in Riverside County, California. It is situated in the Coachella Valley, approximately 11 miles east of the city of Coachella. As of the 2010 census, the population of Homeland was 1,895.
Geography
Homeland is located at 33°45'25"N 116°17'17"W (33.756944, -116.288333). It is situated in the Coachella Valley, approximately 11 miles east of the city of Coachella. The terrain is mostly flat, with some rolling hills. The elevation is approximately 890 feet above sea level.
The climate in Homeland is arid, with hot summers and mild winters. The average annual temperature is 73°F, with an average high of 95°F in July and an average low of 48°F in January. The average annual precipitation is 4.5 inches.
Demographics
As of the 2010 census, the population of Homeland was 1,895. The racial makeup of the population was 68.3% White, 0.3% African American, 0.7% Native American, 0.3% Asian, 0.1% Pacific Islander, 28.2% from other races, and 2.2% from two or more races. Hispanic or Latino of any race were 57.2% of the population.
The median household income in Homeland was $37,917, and the median family income was $41,917. The per capita income was $14,917. About 18.3% of the population was below the poverty line.
Economy
The economy of Homeland is largely based on agriculture. The area is known for its production of dates, citrus fruits, and vegetables. Other industries in the area include manufacturing, construction, and retail.
The unemployment rate in Homeland was 8.2% in 2010. The median household income was $37,917, and the median family income was $41,917. The per capita income was $14,917.
History
Homeland was founded in the early 1900s by the Southern Pacific Railroad. The area was originally known as “Homeland Siding”, and was used as a stop for trains. The name was changed to “Homeland” in the 1920s.
In the 1950s, the area began to develop as an agricultural community. The population grew steadily throughout the 1960s and 1970s, and by the 1980s, Homeland had become a thriving community.
In the 1990s, Homeland experienced a period of rapid growth. The population increased from 1,072 in 1990 to 1,895 in 2000. This growth was largely due to the influx of Hispanic immigrants from Mexico and Central America.
Conclusion
Homeland is a census-designated place located in Riverside County, California. It is situated in the Coachella Valley, approximately 11 miles east of the city of Coachella. As of the 2010 census, the population of Homeland was 1,895. The terrain is mostly flat, with some rolling hills. The climate is arid, with hot summers and mild winters. The economy of Homeland is largely based on agriculture, with other industries including manufacturing, construction, and retail. The population is mostly Hispanic or Latino, and the median household income is $37,917. Homeland was founded in the early 1900s by the Southern Pacific Railroad, and experienced a period of rapid growth in the 1990s.
Common Questions
What is Per Capita Income in Homeland?
Per Capita income in Homeland is $23,301.
What is the Median Family Income in Homeland?
Median Family Income in Homeland is $56,413.
What is the Median Household income in Homeland?
Median Household Income in Homeland is $55,467.
What is Income or Wage Gap in Homeland?
Income or Wage Gap in Homeland is 37.2%.
Women in Homeland earn 62.8 cents for every dollar earned by a man.
What is Inequality or Gini Index in Homeland?
Inequality or Gini Index in Homeland is 0.36.
What is the Total Population of Homeland?
Total Population of Homeland is 6,221.
What is the Total Male Population of Homeland?
Total Male Population of Homeland is 3,099.
What is the Total Female Population of Homeland?
Total Female Population of Homeland is 3,122.
What is the Ratio of Males per 100 Females in Homeland?
There are 99.26 Males per 100 Females in Homeland.
What is the Ratio of Females per 100 Males in Homeland?
There are 100.74 Females per 100 Males in Homeland.
What is the Median Population Age in Homeland?
Median Population Age in Homeland is 33.2 Years.
What is the Average Family Size in Homeland
Average Family Size in Homeland is 3.8 People.
What is the Average Household Size in Homeland
Average Household Size in Homeland is 3.0 People.
How Large is the Labor Force in Homeland?
There are 2,565 People in the Labor Forcein in Homeland.
What is the Percentage of People in the Labor Force in Homeland?
53.4% of People are in the Labor Force in Homeland.
What is the Unemployment Rate in Homeland?
Unemployment Rate in Homeland is 10.8%.