Highland, CA Map & Demographics
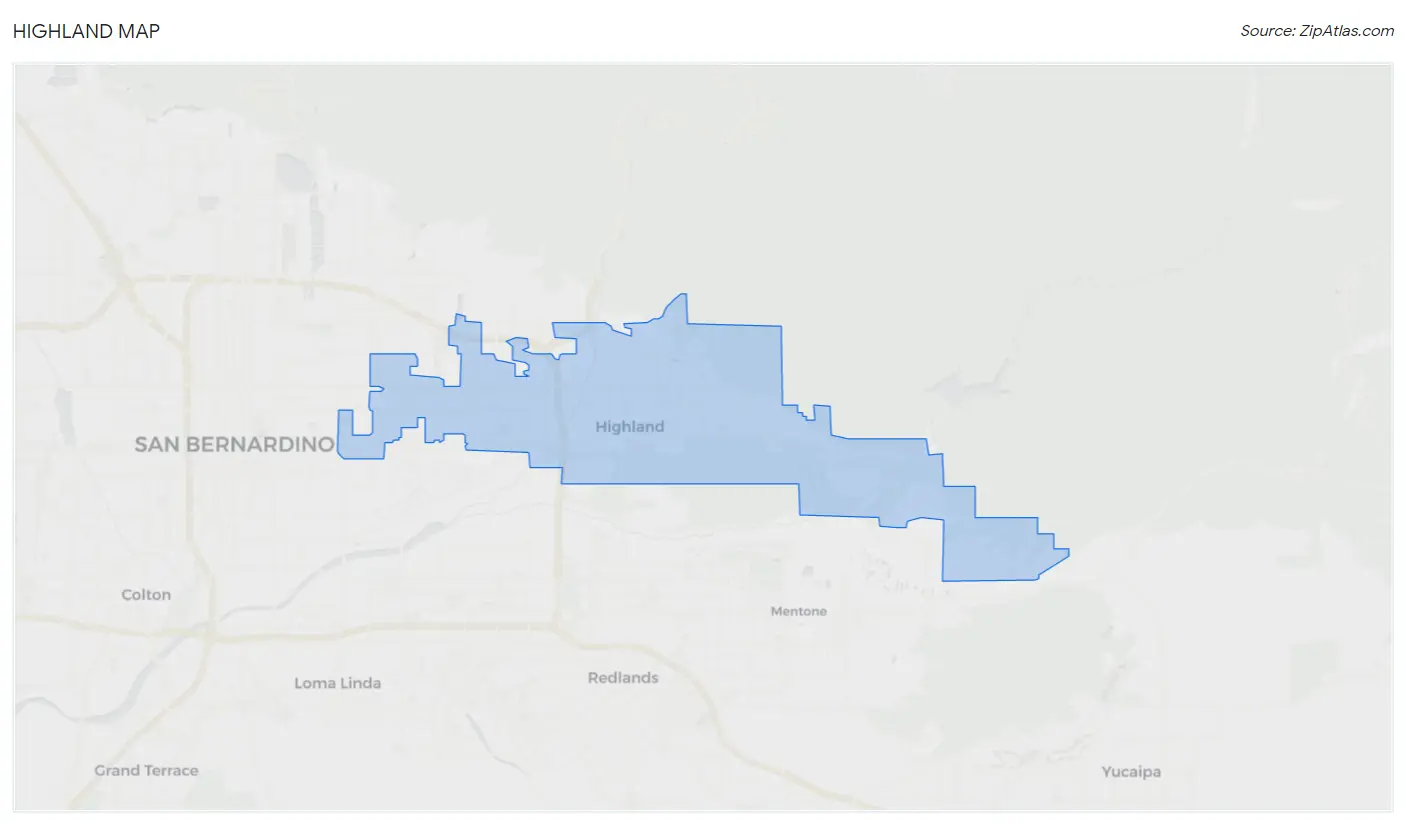
Highland Map
Highland Overview
$33,187
PER CAPITA INCOME
$80,073
AVG FAMILY INCOME
$72,222
AVG HOUSEHOLD INCOME
22.4%
WAGE / INCOME GAP [ % ]
77.6¢/ $1
WAGE / INCOME GAP [ $ ]
$12,752
FAMILY INCOME DEFICIT
0.46
INEQUALITY / GINI INDEX
56,789
TOTAL POPULATION
28,230
MALE POPULATION
28,559
FEMALE POPULATION
98.85
MALES / 100 FEMALES
101.17
FEMALES / 100 MALES
33.0
MEDIAN AGE
3.7
AVG FAMILY SIZE
3.4
AVG HOUSEHOLD SIZE
27,024
LABOR FORCE [ PEOPLE ]
63.0%
PERCENT IN LABOR FORCE
6.0%
UNEMPLOYMENT RATE
Highland Zip Codes
Highland Area Codes
Income in Highland
Income Overview in Highland
Per Capita Income in Highland is $33,187, while median incomes of families and households are $80,073 and $72,222 respectively.
| Characteristic | Number | Measure |
| Per Capita Income | 56,789 | $33,187 |
| Median Family Income | 13,217 | $80,073 |
| Mean Family Income | 13,217 | $111,231 |
| Median Household Income | 16,464 | $72,222 |
| Mean Household Income | 16,464 | $105,787 |
| Income Deficit | 13,217 | $12,752 |
| Wage / Income Gap (%) | 56,789 | 22.42% |
| Wage / Income Gap ($) | 56,789 | 77.58¢ per $1 |
| Gini / Inequality Index | 56,789 | 0.46 |
Earnings by Sex in Highland
Average Earnings in Highland are $35,886, $40,179 for men and $31,170 for women, a difference of 22.4%.
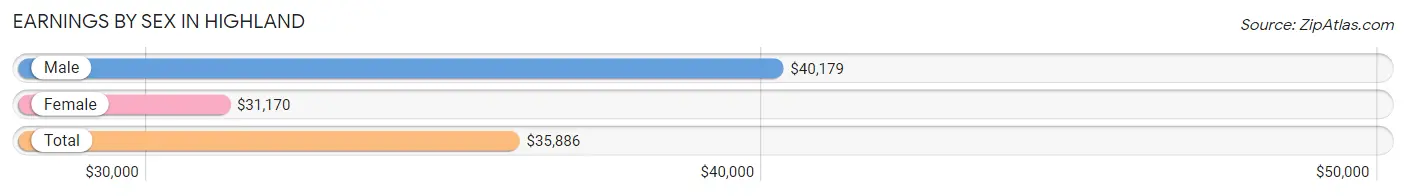
| Sex | Number | Average Earnings |
| Male | 14,667 (53.9%) | $40,179 |
| Female | 12,555 (46.1%) | $31,170 |
| Total | 27,222 (100.0%) | $35,886 |
Earnings by Sex by Income Bracket in Highland
The most common earnings brackets in Highland are $100,000+ for men (2,117 | 14.4%) and $100,000+ for women (1,441 | 11.5%).
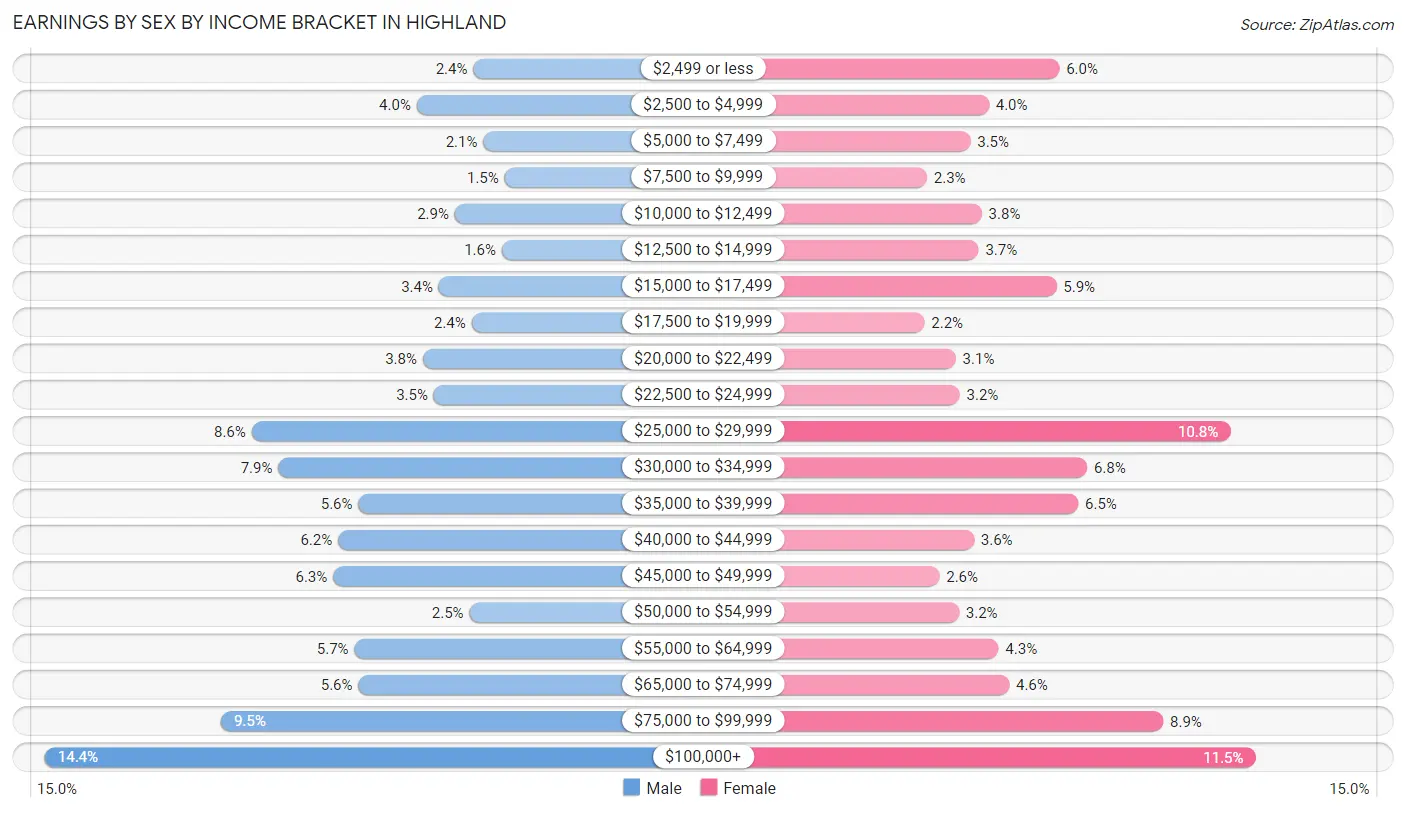
| Income | Male | Female |
| $2,499 or less | 350 (2.4%) | 750 (6.0%) |
| $2,500 to $4,999 | 584 (4.0%) | 501 (4.0%) |
| $5,000 to $7,499 | 309 (2.1%) | 436 (3.5%) |
| $7,500 to $9,999 | 221 (1.5%) | 282 (2.2%) |
| $10,000 to $12,499 | 427 (2.9%) | 476 (3.8%) |
| $12,500 to $14,999 | 233 (1.6%) | 465 (3.7%) |
| $15,000 to $17,499 | 493 (3.4%) | 739 (5.9%) |
| $17,500 to $19,999 | 358 (2.4%) | 274 (2.2%) |
| $20,000 to $22,499 | 559 (3.8%) | 384 (3.1%) |
| $22,500 to $24,999 | 514 (3.5%) | 398 (3.2%) |
| $25,000 to $29,999 | 1,264 (8.6%) | 1,352 (10.8%) |
| $30,000 to $34,999 | 1,155 (7.9%) | 847 (6.8%) |
| $35,000 to $39,999 | 825 (5.6%) | 816 (6.5%) |
| $40,000 to $44,999 | 908 (6.2%) | 448 (3.6%) |
| $45,000 to $49,999 | 929 (6.3%) | 327 (2.6%) |
| $50,000 to $54,999 | 366 (2.5%) | 395 (3.2%) |
| $55,000 to $64,999 | 841 (5.7%) | 535 (4.3%) |
| $65,000 to $74,999 | 824 (5.6%) | 573 (4.6%) |
| $75,000 to $99,999 | 1,390 (9.5%) | 1,116 (8.9%) |
| $100,000+ | 2,117 (14.4%) | 1,441 (11.5%) |
| Total | 14,667 (100.0%) | 12,555 (100.0%) |
Earnings by Sex by Educational Attainment in Highland
Average earnings in Highland are $45,818 for men and $37,652 for women, a difference of 17.8%. Men with an educational attainment of graduate degree enjoy the highest average annual earnings of $117,585, while those with less than high school education earn the least with $35,897. Women with an educational attainment of graduate degree earn the most with the average annual earnings of $94,706, while those with high school diploma education have the smallest earnings of $27,138.
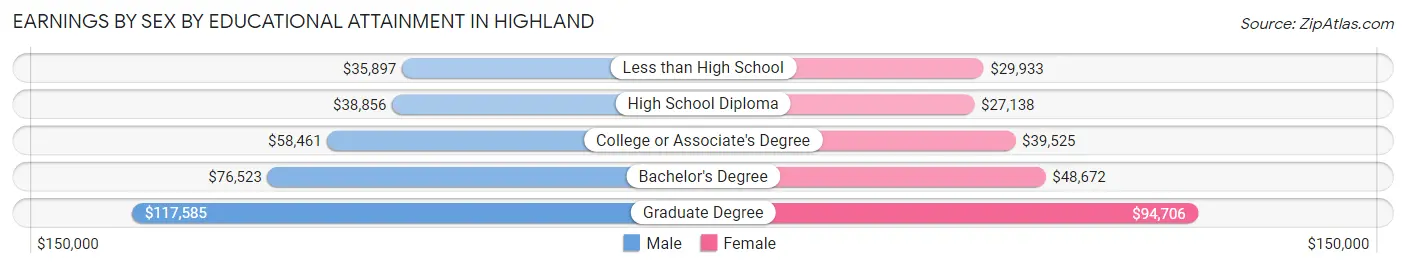
| Educational Attainment | Male Income | Female Income |
| Less than High School | $35,897 | $29,933 |
| High School Diploma | $38,856 | $27,138 |
| College or Associate's Degree | $58,461 | $39,525 |
| Bachelor's Degree | $76,523 | $48,672 |
| Graduate Degree | $117,585 | $94,706 |
| Total | $45,818 | $37,652 |
Family Income in Highland
Family Income Brackets in Highland
According to the Highland family income data, there are 2,300 families falling into the $50,000 to $74,999 income range, which is the most common income bracket and makes up 17.4% of all families. Conversely, the $10,000 to $14,999 income bracket is the least frequent group with only 185 families (1.4%) belonging to this category.
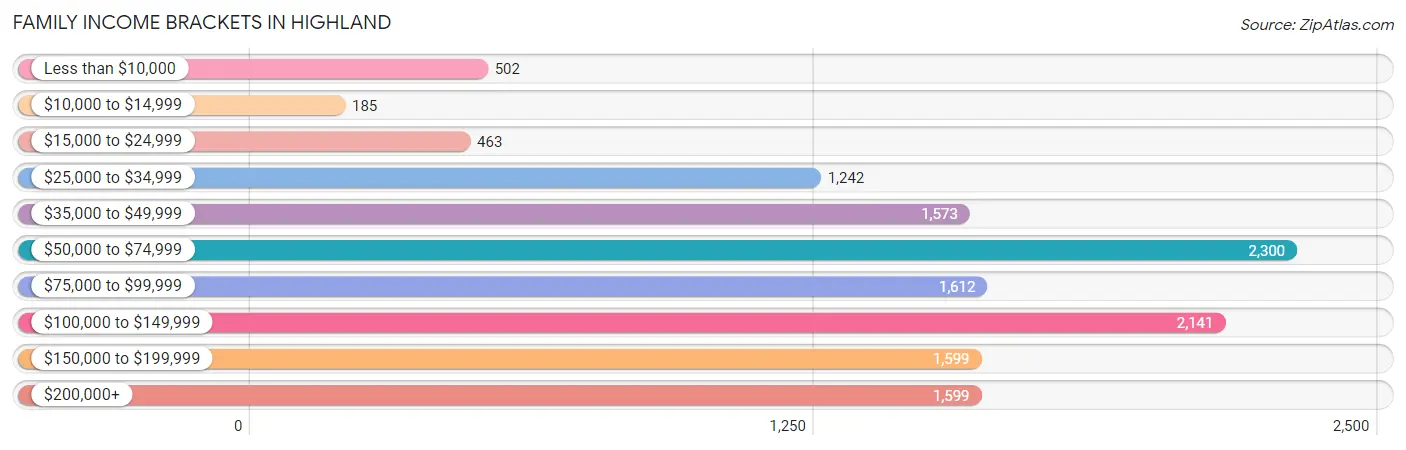
| Income Bracket | # Families | % Families |
| Less than $10,000 | 502 | 3.8% |
| $10,000 to $14,999 | 185 | 1.4% |
| $15,000 to $24,999 | 463 | 3.5% |
| $25,000 to $34,999 | 1,242 | 9.4% |
| $35,000 to $49,999 | 1,573 | 11.9% |
| $50,000 to $74,999 | 2,300 | 17.4% |
| $75,000 to $99,999 | 1,612 | 12.2% |
| $100,000 to $149,999 | 2,141 | 16.2% |
| $150,000 to $199,999 | 1,599 | 12.1% |
| $200,000+ | 1,599 | 12.1% |
Family Income by Famaliy Size in Highland
6-person families (437 | 3.3%) account for the highest median family income in Highland with $102,375 per family, while 2-person families (4,384 | 33.2%) have the highest median income of $38,255 per family member.
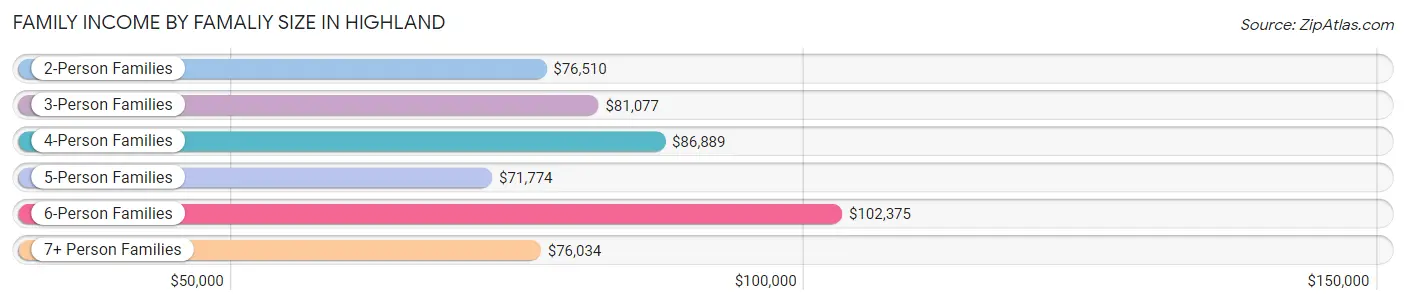
| Income Bracket | # Families | Median Income |
| 2-Person Families | 4,384 (33.2%) | $76,510 |
| 3-Person Families | 3,254 (24.6%) | $81,077 |
| 4-Person Families | 2,578 (19.5%) | $86,889 |
| 5-Person Families | 1,828 (13.8%) | $71,774 |
| 6-Person Families | 437 (3.3%) | $102,375 |
| 7+ Person Families | 736 (5.6%) | $76,034 |
| Total | 13,217 (100.0%) | $80,073 |
Family Income by Number of Earners in Highland
The median family income in Highland is $80,073, with families comprising 3+ earners (2,060) having the highest median family income of $130,625, while families with no earners (1,677) have the lowest median family income of $38,860, accounting for 15.6% and 12.7% of families, respectively.
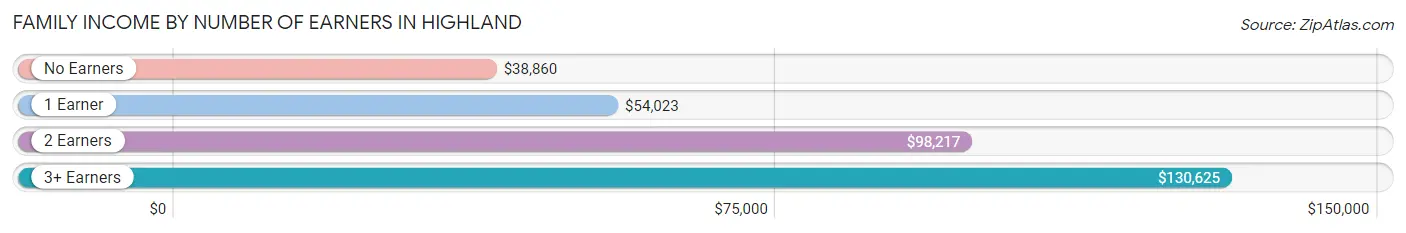
| Number of Earners | # Families | Median Income |
| No Earners | 1,677 (12.7%) | $38,860 |
| 1 Earner | 4,373 (33.1%) | $54,023 |
| 2 Earners | 5,107 (38.6%) | $98,217 |
| 3+ Earners | 2,060 (15.6%) | $130,625 |
| Total | 13,217 (100.0%) | $80,073 |
Household Income in Highland
Household Income Brackets in Highland
With 2,980 households falling in the category, the $50,000 to $74,999 income range is the most frequent in Highland, accounting for 18.1% of all households. In contrast, only 609 households (3.7%) fall into the $10,000 to $14,999 income bracket, making it the least populous group.
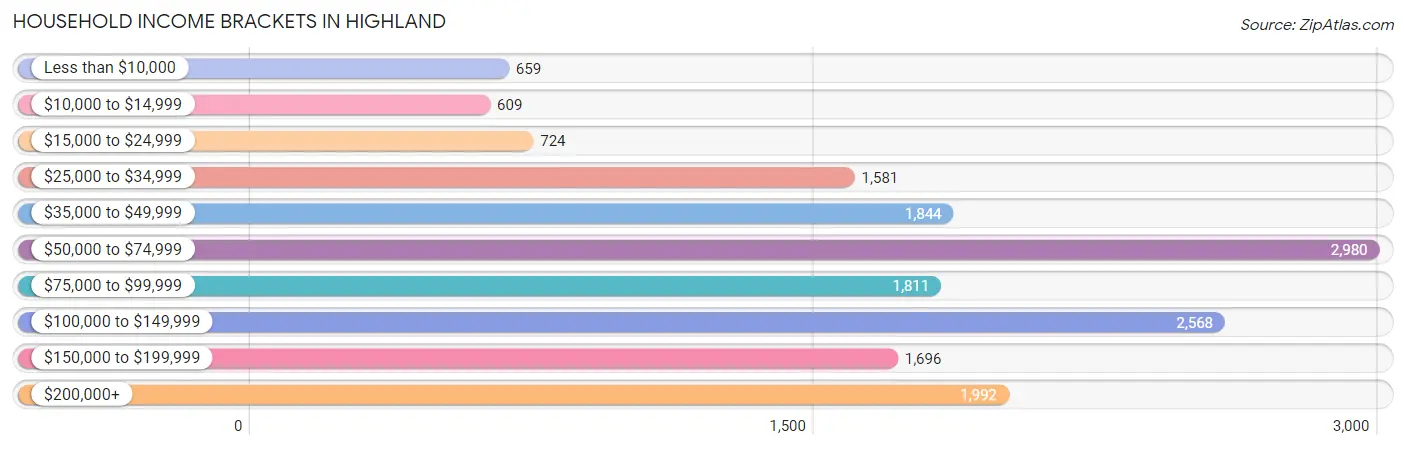
| Income Bracket | # Households | % Households |
| Less than $10,000 | 659 | 4.0% |
| $10,000 to $14,999 | 609 | 3.7% |
| $15,000 to $24,999 | 724 | 4.4% |
| $25,000 to $34,999 | 1,581 | 9.6% |
| $35,000 to $49,999 | 1,844 | 11.2% |
| $50,000 to $74,999 | 2,980 | 18.1% |
| $75,000 to $99,999 | 1,811 | 11.0% |
| $100,000 to $149,999 | 2,568 | 15.6% |
| $150,000 to $199,999 | 1,696 | 10.3% |
| $200,000+ | 1,992 | 12.1% |
Household Income by Householder Age in Highland
The median household income in Highland is $72,222, with the highest median household income of $91,144 found in the 45 to 64 years age bracket for the primary householder. A total of 6,707 households (40.7%) fall into this category. Meanwhile, the 15 to 24 years age bracket for the primary householder has the lowest median household income of $50,913, with 448 households (2.7%) in this group.
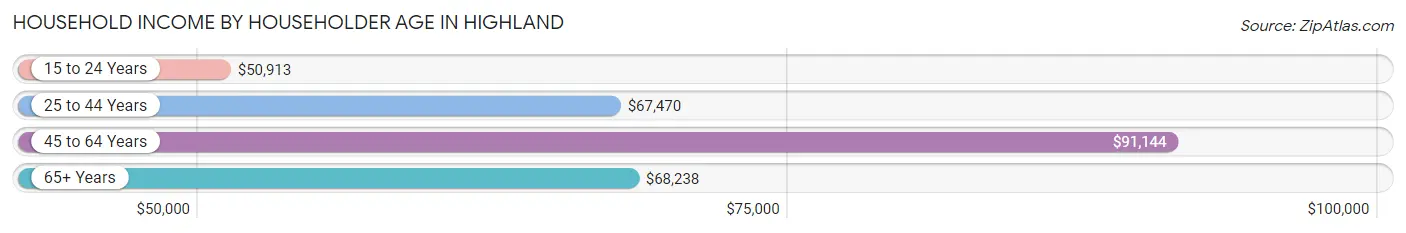
| Income Bracket | # Households | Median Income |
| 15 to 24 Years | 448 (2.7%) | $50,913 |
| 25 to 44 Years | 5,833 (35.4%) | $67,470 |
| 45 to 64 Years | 6,707 (40.7%) | $91,144 |
| 65+ Years | 3,476 (21.1%) | $68,238 |
| Total | 16,464 (100.0%) | $72,222 |
Poverty in Highland
Income Below Poverty by Sex and Age in Highland
With 15.4% poverty level for males and 16.5% for females among the residents of Highland, 15 year old males and 5 year old females are the most vulnerable to poverty, with 84 males (26.5%) and 131 females (31.7%) in their respective age groups living below the poverty level.
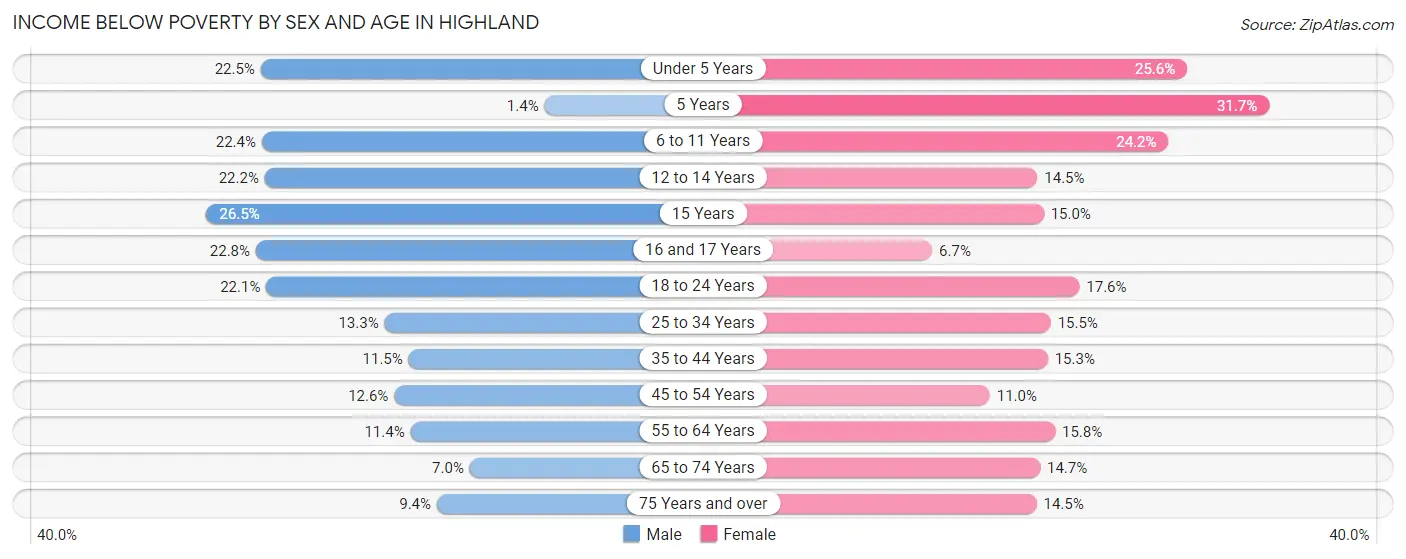
| Age Bracket | Male | Female |
| Under 5 Years | 466 (22.5%) | 570 (25.6%) |
| 5 Years | 6 (1.4%) | 131 (31.7%) |
| 6 to 11 Years | 532 (22.4%) | 551 (24.2%) |
| 12 to 14 Years | 366 (22.2%) | 193 (14.5%) |
| 15 Years | 84 (26.5%) | 61 (15.0%) |
| 16 and 17 Years | 168 (22.8%) | 71 (6.7%) |
| 18 to 24 Years | 713 (22.1%) | 534 (17.6%) |
| 25 to 34 Years | 526 (13.3%) | 624 (15.5%) |
| 35 to 44 Years | 412 (11.5%) | 569 (15.3%) |
| 45 to 54 Years | 477 (12.6%) | 369 (11.0%) |
| 55 to 64 Years | 326 (11.4%) | 522 (15.8%) |
| 65 to 74 Years | 123 (7.0%) | 279 (14.7%) |
| 75 Years and over | 102 (9.4%) | 200 (14.5%) |
| Total | 4,301 (15.4%) | 4,674 (16.5%) |
Income Above Poverty by Sex and Age in Highland
According to the poverty statistics in Highland, males aged 5 years and females aged 16 and 17 years are the age groups that are most secure financially, with 98.6% of males and 93.3% of females in these age groups living above the poverty line.
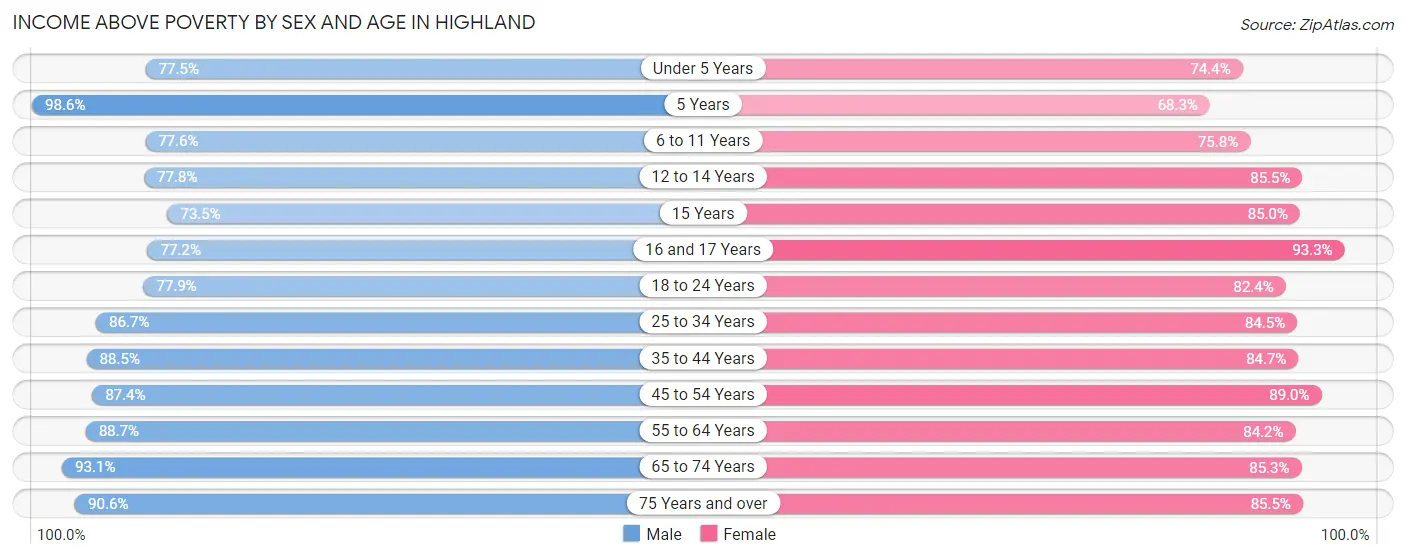
| Age Bracket | Male | Female |
| Under 5 Years | 1,608 (77.5%) | 1,654 (74.4%) |
| 5 Years | 422 (98.6%) | 282 (68.3%) |
| 6 to 11 Years | 1,844 (77.6%) | 1,722 (75.8%) |
| 12 to 14 Years | 1,285 (77.8%) | 1,136 (85.5%) |
| 15 Years | 233 (73.5%) | 346 (85.0%) |
| 16 and 17 Years | 568 (77.2%) | 987 (93.3%) |
| 18 to 24 Years | 2,519 (77.9%) | 2,494 (82.4%) |
| 25 to 34 Years | 3,434 (86.7%) | 3,400 (84.5%) |
| 35 to 44 Years | 3,175 (88.5%) | 3,152 (84.7%) |
| 45 to 54 Years | 3,320 (87.4%) | 2,990 (89.0%) |
| 55 to 64 Years | 2,545 (88.6%) | 2,776 (84.2%) |
| 65 to 74 Years | 1,647 (93.0%) | 1,616 (85.3%) |
| 75 Years and over | 984 (90.6%) | 1,183 (85.5%) |
| Total | 23,584 (84.6%) | 23,738 (83.6%) |
Income Below Poverty Among Married-Couple Families in Highland
The poverty statistics for married-couple families in Highland show that 6.5% or 544 of the total 8,337 families live below the poverty line. Families with 3 or 4 children have the highest poverty rate of 20.8%, comprising of 253 families. On the other hand, families with 5 or more children have the lowest poverty rate of 0.0%, which includes 0 families.
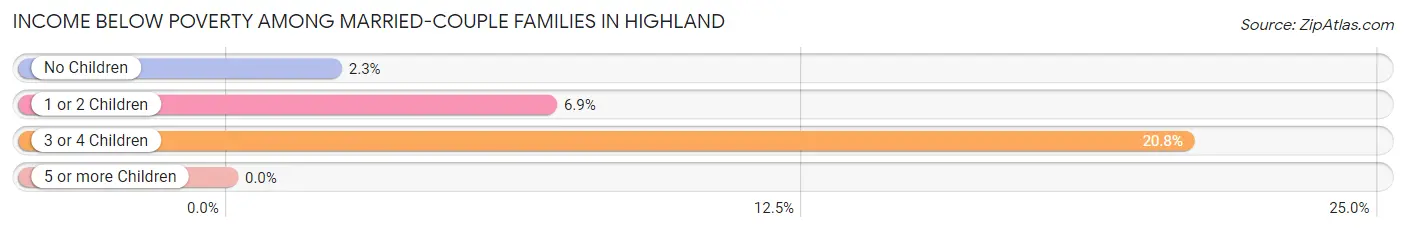
| Children | Above Poverty | Below Poverty |
| No Children | 4,148 (97.7%) | 96 (2.3%) |
| 1 or 2 Children | 2,614 (93.1%) | 195 (6.9%) |
| 3 or 4 Children | 962 (79.2%) | 253 (20.8%) |
| 5 or more Children | 69 (100.0%) | 0 (0.0%) |
| Total | 7,793 (93.5%) | 544 (6.5%) |
Income Below Poverty Among Single-Parent Households in Highland
According to the poverty data in Highland, 15.7% or 288 single-father households and 23.4% or 711 single-mother households are living below the poverty line. Among single-father households, those with 3 or 4 children have the highest poverty rate, with 95 households (62.5%) experiencing poverty. Likewise, among single-mother households, those with 3 or 4 children have the highest poverty rate, with 204 households (54.3%) falling below the poverty line.
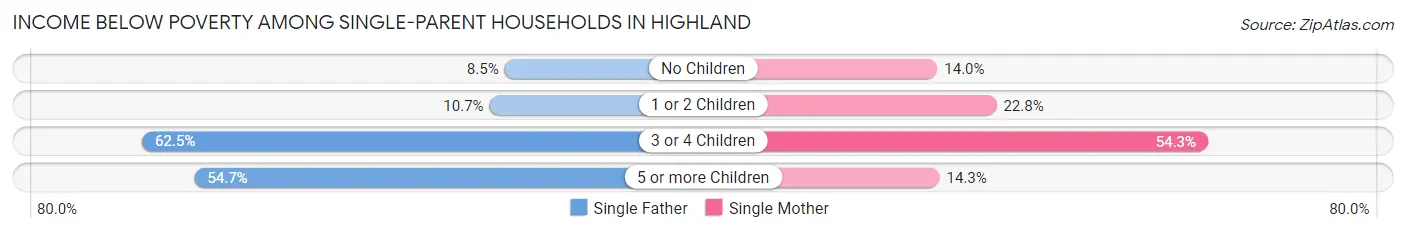
| Children | Single Father | Single Mother |
| No Children | 62 (8.5%) | 143 (14.0%) |
| 1 or 2 Children | 96 (10.7%) | 348 (22.8%) |
| 3 or 4 Children | 95 (62.5%) | 204 (54.3%) |
| 5 or more Children | 35 (54.7%) | 16 (14.3%) |
| Total | 288 (15.7%) | 711 (23.4%) |
Income Below Poverty Among Married-Couple vs Single-Parent Households in Highland
The poverty data for Highland shows that 544 of the married-couple family households (6.5%) and 999 of the single-parent households (20.5%) are living below the poverty level. Within the married-couple family households, those with 3 or 4 children have the highest poverty rate, with 253 households (20.8%) falling below the poverty line. Among the single-parent households, those with 3 or 4 children have the highest poverty rate, with 299 household (56.6%) living below poverty.
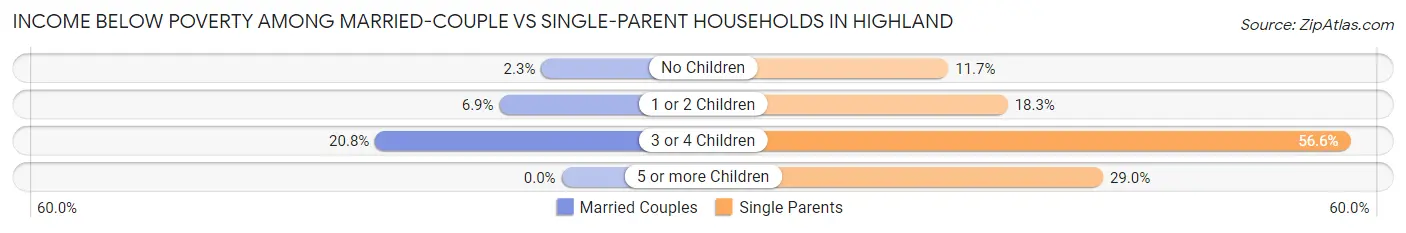
| Children | Married-Couple Families | Single-Parent Households |
| No Children | 96 (2.3%) | 205 (11.7%) |
| 1 or 2 Children | 195 (6.9%) | 444 (18.3%) |
| 3 or 4 Children | 253 (20.8%) | 299 (56.6%) |
| 5 or more Children | 0 (0.0%) | 51 (29.0%) |
| Total | 544 (6.5%) | 999 (20.5%) |
Race in Highland
The most populous races in Highland are Hispanic or Latino (33,463 | 58.9%), White / Caucasian (24,933 | 43.9%), and Some other Race (15,675 | 27.6%).
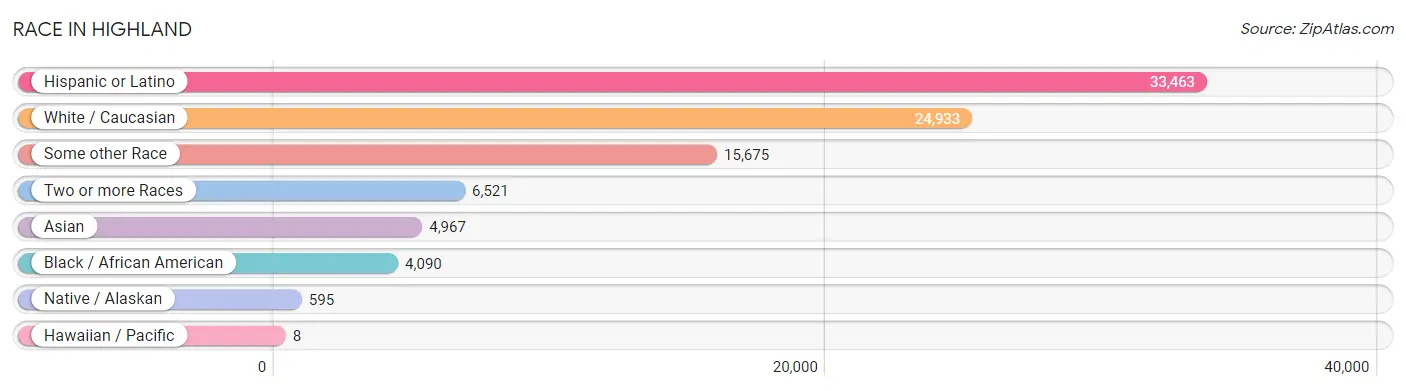
| Race | # Population | % Population |
| Asian | 4,967 | 8.7% |
| Black / African American | 4,090 | 7.2% |
| Hawaiian / Pacific | 8 | 0.0% |
| Hispanic or Latino | 33,463 | 58.9% |
| Native / Alaskan | 595 | 1.1% |
| White / Caucasian | 24,933 | 43.9% |
| Two or more Races | 6,521 | 11.5% |
| Some other Race | 15,675 | 27.6% |
| Total | 56,789 | 100.0% |
Ancestry in Highland
The most populous ancestries reported in Highland are Mexican (28,950 | 51.0%), Irish (2,480 | 4.4%), German (2,398 | 4.2%), English (2,277 | 4.0%), and Central American (2,121 | 3.7%), together accounting for 67.3% of all Highland residents.
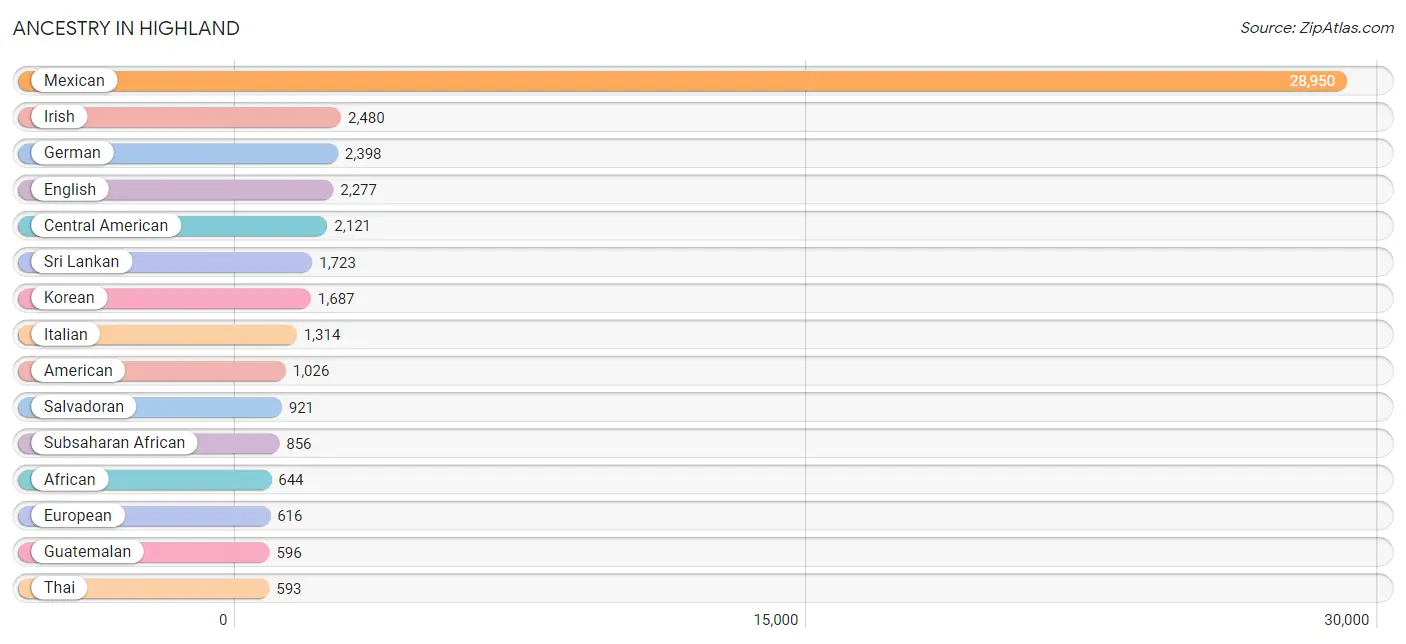
| Ancestry | # Population | % Population |
| African | 644 | 1.1% |
| American | 1,026 | 1.8% |
| Apache | 16 | 0.0% |
| Arab | 413 | 0.7% |
| Argentinean | 223 | 0.4% |
| Armenian | 33 | 0.1% |
| Austrian | 59 | 0.1% |
| Belizean | 108 | 0.2% |
| Bhutanese | 478 | 0.8% |
| Blackfeet | 51 | 0.1% |
| British | 40 | 0.1% |
| Burmese | 116 | 0.2% |
| Canadian | 77 | 0.1% |
| Central American | 2,121 | 3.7% |
| Central American Indian | 56 | 0.1% |
| Cherokee | 9 | 0.0% |
| Cheyenne | 24 | 0.0% |
| Chickasaw | 9 | 0.0% |
| Choctaw | 66 | 0.1% |
| Colombian | 42 | 0.1% |
| Comanche | 79 | 0.1% |
| Croatian | 18 | 0.0% |
| Cuban | 149 | 0.3% |
| Czech | 46 | 0.1% |
| Czechoslovakian | 14 | 0.0% |
| Danish | 99 | 0.2% |
| Dominican | 28 | 0.1% |
| Dutch | 557 | 1.0% |
| Eastern European | 24 | 0.0% |
| Ecuadorian | 141 | 0.3% |
| English | 2,277 | 4.0% |
| Ethiopian | 105 | 0.2% |
| European | 616 | 1.1% |
| Fijian | 8 | 0.0% |
| Filipino | 35 | 0.1% |
| French | 464 | 0.8% |
| French Canadian | 61 | 0.1% |
| German | 2,398 | 4.2% |
| Greek | 110 | 0.2% |
| Guamanian / Chamorro | 1 | 0.0% |
| Guatemalan | 596 | 1.1% |
| Honduran | 312 | 0.5% |
| Hungarian | 118 | 0.2% |
| Indian (Asian) | 326 | 0.6% |
| Irish | 2,480 | 4.4% |
| Italian | 1,314 | 2.3% |
| Japanese | 302 | 0.5% |
| Korean | 1,687 | 3.0% |
| Laotian | 138 | 0.2% |
| Latvian | 9 | 0.0% |
| Lebanese | 312 | 0.5% |
| Lithuanian | 39 | 0.1% |
| Mexican | 28,950 | 51.0% |
| Mexican American Indian | 264 | 0.5% |
| Moroccan | 19 | 0.0% |
| Native Hawaiian | 43 | 0.1% |
| Navajo | 121 | 0.2% |
| Nicaraguan | 263 | 0.5% |
| Nigerian | 107 | 0.2% |
| Norwegian | 135 | 0.2% |
| Pakistani | 248 | 0.4% |
| Palestinian | 45 | 0.1% |
| Panamanian | 29 | 0.1% |
| Peruvian | 2 | 0.0% |
| Polish | 494 | 0.9% |
| Portuguese | 43 | 0.1% |
| Puerto Rican | 329 | 0.6% |
| Romanian | 87 | 0.2% |
| Russian | 132 | 0.2% |
| Salvadoran | 921 | 1.6% |
| Scandinavian | 7 | 0.0% |
| Scotch-Irish | 88 | 0.2% |
| Scottish | 280 | 0.5% |
| Sioux | 28 | 0.1% |
| South American | 587 | 1.0% |
| Soviet Union | 8 | 0.0% |
| Spaniard | 207 | 0.4% |
| Spanish | 81 | 0.1% |
| Spanish American Indian | 7 | 0.0% |
| Sri Lankan | 1,723 | 3.0% |
| Subsaharan African | 856 | 1.5% |
| Swedish | 211 | 0.4% |
| Swiss | 23 | 0.0% |
| Syrian | 23 | 0.0% |
| Thai | 593 | 1.0% |
| Trinidadian and Tobagonian | 12 | 0.0% |
| Ukrainian | 36 | 0.1% |
| Venezuelan | 179 | 0.3% |
| Vietnamese | 39 | 0.1% |
| Welsh | 35 | 0.1% |
| Yaqui | 42 | 0.1% | View All 91 Rows |
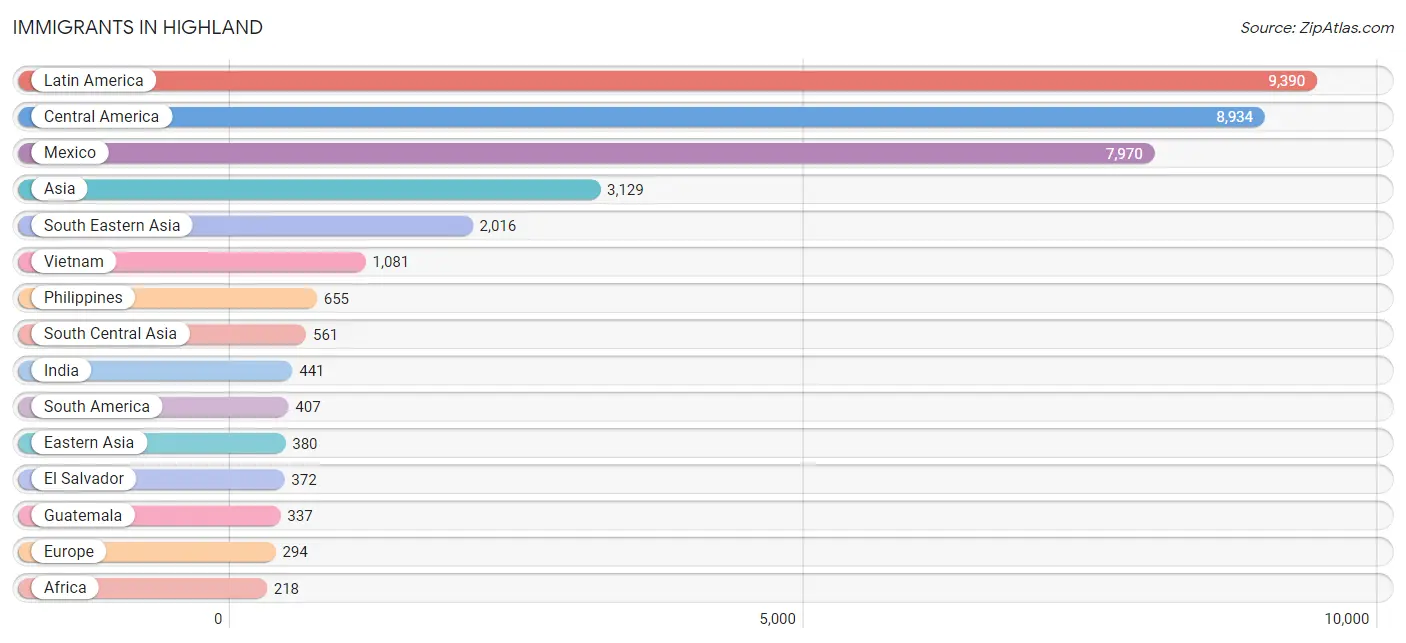
Immigrants in Highland
The most numerous immigrant groups reported in Highland came from Latin America (9,390 | 16.5%), Central America (8,934 | 15.7%), Mexico (7,970 | 14.0%), Asia (3,129 | 5.5%), and South Eastern Asia (2,016 | 3.5%), together accounting for 55.3% of all Highland residents.
| Immigration Origin | # Population | % Population |
| Africa | 218 | 0.4% |
| Argentina | 151 | 0.3% |
| Asia | 3,129 | 5.5% |
| Austria | 12 | 0.0% |
| Bangladesh | 29 | 0.1% |
| Belgium | 18 | 0.0% |
| Belize | 28 | 0.1% |
| Cambodia | 42 | 0.1% |
| Canada | 79 | 0.1% |
| Caribbean | 49 | 0.1% |
| Central America | 8,934 | 15.7% |
| Chile | 15 | 0.0% |
| China | 120 | 0.2% |
| Colombia | 78 | 0.1% |
| Cuba | 49 | 0.1% |
| Eastern Africa | 43 | 0.1% |
| Eastern Asia | 380 | 0.7% |
| Eastern Europe | 83 | 0.2% |
| Ecuador | 10 | 0.0% |
| El Salvador | 372 | 0.7% |
| England | 51 | 0.1% |
| Ethiopia | 43 | 0.1% |
| Europe | 294 | 0.5% |
| Germany | 77 | 0.1% |
| Guatemala | 337 | 0.6% |
| Honduras | 77 | 0.1% |
| Hungary | 18 | 0.0% |
| India | 441 | 0.8% |
| Indonesia | 94 | 0.2% |
| Japan | 156 | 0.3% |
| Korea | 104 | 0.2% |
| Latin America | 9,390 | 16.5% |
| Lebanon | 77 | 0.1% |
| Malaysia | 12 | 0.0% |
| Mexico | 7,970 | 14.0% |
| Morocco | 19 | 0.0% |
| Nepal | 36 | 0.1% |
| Netherlands | 3 | 0.0% |
| Nicaragua | 131 | 0.2% |
| Nigeria | 156 | 0.3% |
| Northern Africa | 19 | 0.0% |
| Northern Europe | 101 | 0.2% |
| Pakistan | 13 | 0.0% |
| Panama | 19 | 0.0% |
| Peru | 2 | 0.0% |
| Philippines | 655 | 1.1% |
| Romania | 57 | 0.1% |
| Saudi Arabia | 43 | 0.1% |
| Scotland | 50 | 0.1% |
| South America | 407 | 0.7% |
| South Central Asia | 561 | 1.0% |
| South Eastern Asia | 2,016 | 3.5% |
| Sri Lanka | 42 | 0.1% |
| Syria | 23 | 0.0% |
| Taiwan | 56 | 0.1% |
| Thailand | 132 | 0.2% |
| Venezuela | 151 | 0.3% |
| Vietnam | 1,081 | 1.9% |
| Western Africa | 156 | 0.3% |
| Western Asia | 143 | 0.3% |
| Western Europe | 110 | 0.2% | View All 61 Rows |
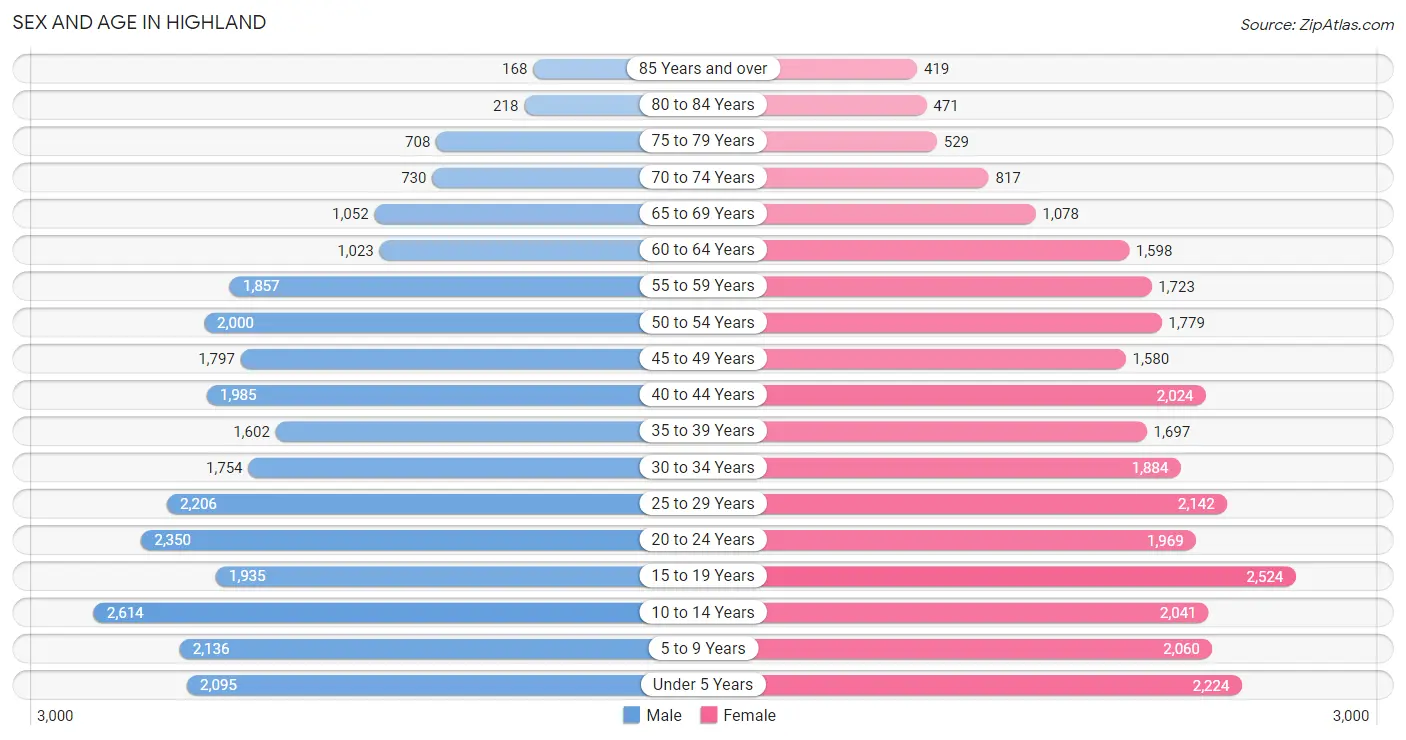
Sex and Age in Highland
Sex and Age in Highland
The most populous age groups in Highland are 10 to 14 Years (2,614 | 9.3%) for men and 15 to 19 Years (2,524 | 8.8%) for women.
| Age Bracket | Male | Female |
| Under 5 Years | 2,095 (7.4%) | 2,224 (7.8%) |
| 5 to 9 Years | 2,136 (7.6%) | 2,060 (7.2%) |
| 10 to 14 Years | 2,614 (9.3%) | 2,041 (7.1%) |
| 15 to 19 Years | 1,935 (6.9%) | 2,524 (8.8%) |
| 20 to 24 Years | 2,350 (8.3%) | 1,969 (6.9%) |
| 25 to 29 Years | 2,206 (7.8%) | 2,142 (7.5%) |
| 30 to 34 Years | 1,754 (6.2%) | 1,884 (6.6%) |
| 35 to 39 Years | 1,602 (5.7%) | 1,697 (5.9%) |
| 40 to 44 Years | 1,985 (7.0%) | 2,024 (7.1%) |
| 45 to 49 Years | 1,797 (6.4%) | 1,580 (5.5%) |
| 50 to 54 Years | 2,000 (7.1%) | 1,779 (6.2%) |
| 55 to 59 Years | 1,857 (6.6%) | 1,723 (6.0%) |
| 60 to 64 Years | 1,023 (3.6%) | 1,598 (5.6%) |
| 65 to 69 Years | 1,052 (3.7%) | 1,078 (3.8%) |
| 70 to 74 Years | 730 (2.6%) | 817 (2.9%) |
| 75 to 79 Years | 708 (2.5%) | 529 (1.8%) |
| 80 to 84 Years | 218 (0.8%) | 471 (1.7%) |
| 85 Years and over | 168 (0.6%) | 419 (1.5%) |
| Total | 28,230 (100.0%) | 28,559 (100.0%) |
Families and Households in Highland
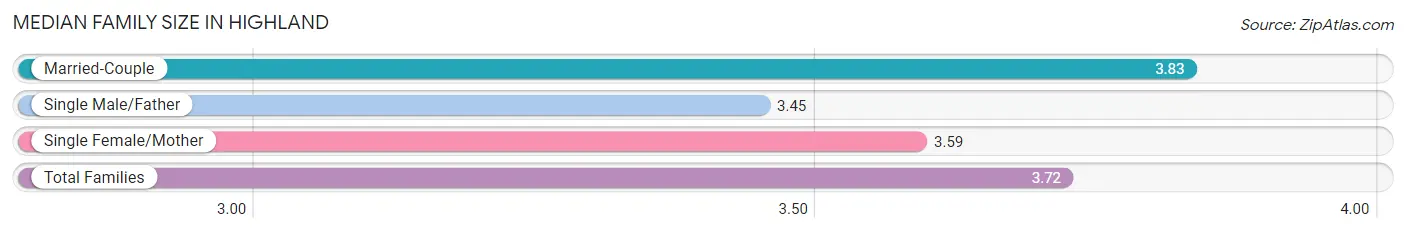
Median Family Size in Highland
The median family size in Highland is 3.72 persons per family, with married-couple families (8,337 | 63.1%) accounting for the largest median family size of 3.83 persons per family. On the other hand, single male/father families (1,840 | 13.9%) represent the smallest median family size with 3.45 persons per family.
| Family Type | # Families | Family Size |
| Married-Couple | 8,337 (63.1%) | 3.83 |
| Single Male/Father | 1,840 (13.9%) | 3.45 |
| Single Female/Mother | 3,040 (23.0%) | 3.59 |
| Total Families | 13,217 (100.0%) | 3.72 |
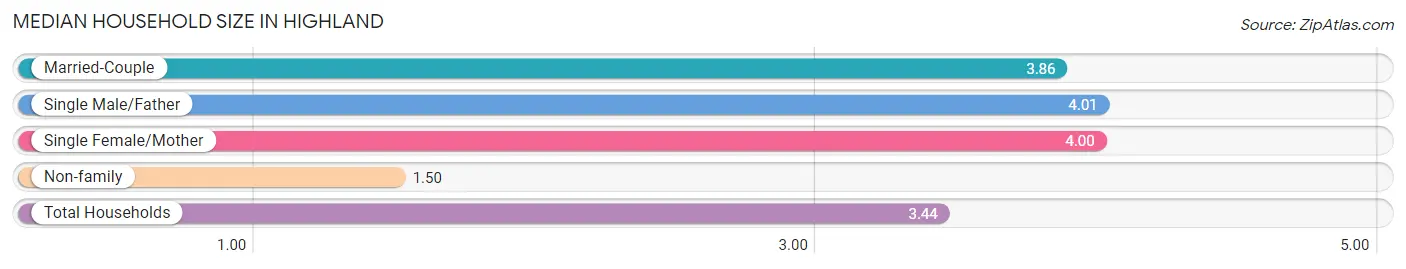
Median Household Size in Highland
The median household size in Highland is 3.44 persons per household, with single male/father households (1,840 | 11.2%) accounting for the largest median household size of 4.01 persons per household. non-family households (3,247 | 19.7%) represent the smallest median household size with 1.50 persons per household.
| Household Type | # Households | Household Size |
| Married-Couple | 8,337 (50.6%) | 3.86 |
| Single Male/Father | 1,840 (11.2%) | 4.01 |
| Single Female/Mother | 3,040 (18.5%) | 4.00 |
| Non-family | 3,247 (19.7%) | 1.50 |
| Total Households | 16,464 (100.0%) | 3.44 |
Household Size by Marriage Status in Highland
Out of a total of 16,464 households in Highland, 13,217 (80.3%) are family households, while 3,247 (19.7%) are nonfamily households. The most numerous type of family households are 2-person households, comprising 3,900, and the most common type of nonfamily households are 1-person households, comprising 2,310.
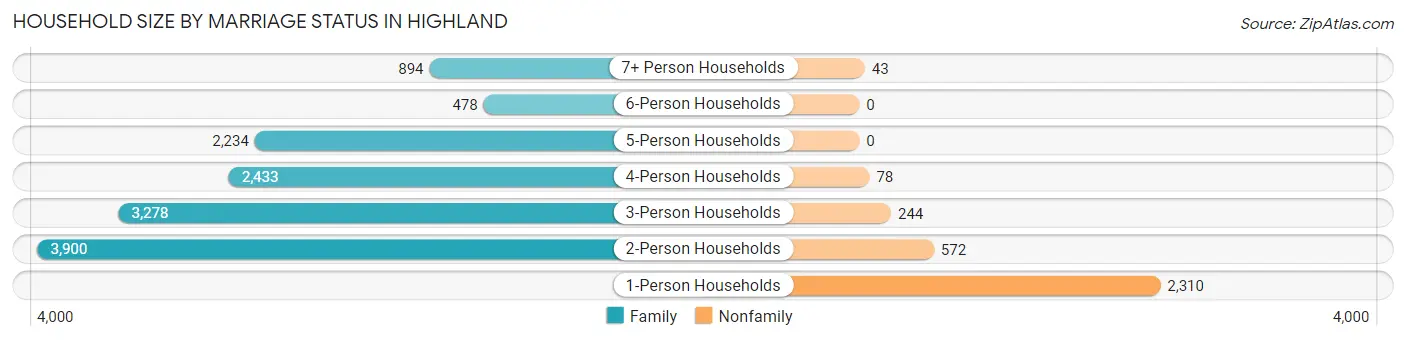
| Household Size | Family Households | Nonfamily Households |
| 1-Person Households | - | 2,310 (14.0%) |
| 2-Person Households | 3,900 (23.7%) | 572 (3.5%) |
| 3-Person Households | 3,278 (19.9%) | 244 (1.5%) |
| 4-Person Households | 2,433 (14.8%) | 78 (0.5%) |
| 5-Person Households | 2,234 (13.6%) | 0 (0.0%) |
| 6-Person Households | 478 (2.9%) | 0 (0.0%) |
| 7+ Person Households | 894 (5.4%) | 43 (0.3%) |
| Total | 13,217 (80.3%) | 3,247 (19.7%) |
Female Fertility in Highland
Fertility by Age in Highland
Average fertility rate in Highland is 62.0 births per 1,000 women. Women in the age bracket of 20 to 34 years have the highest fertility rate with 132.0 births per 1,000 women. Women in the age bracket of 20 to 34 years acount for 90.3% of all women with births.
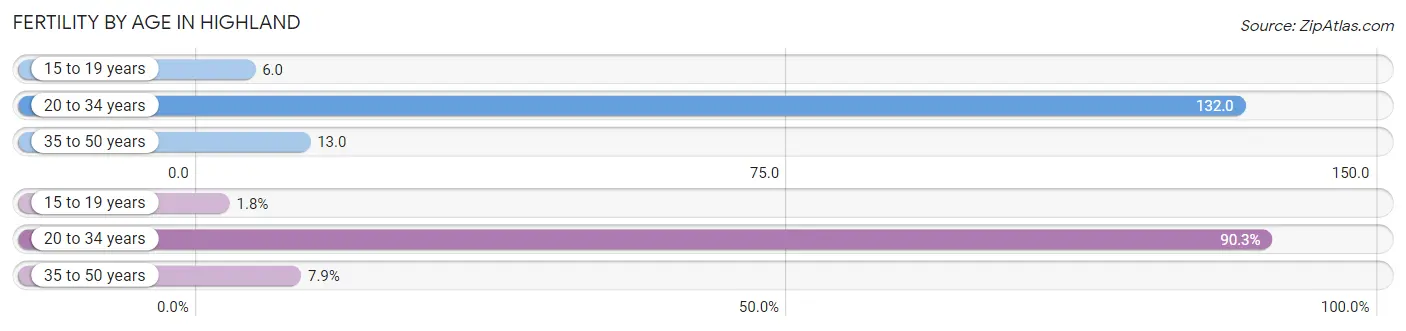
| Age Bracket | Women with Births | Births / 1,000 Women |
| 15 to 19 years | 16 (1.8%) | 6.0 |
| 20 to 34 years | 790 (90.3%) | 132.0 |
| 35 to 50 years | 69 (7.9%) | 13.0 |
| Total | 875 (100.0%) | 62.0 |
Fertility by Age by Marriage Status in Highland
55.2% of women with births (875) in Highland are married. The highest percentage of unmarried women with births falls into 35 to 50 years age bracket with 50.7% of them unmarried at the time of birth, while the lowest percentage of unmarried women with births belong to 15 to 19 years age bracket with 0.0% of them unmarried.
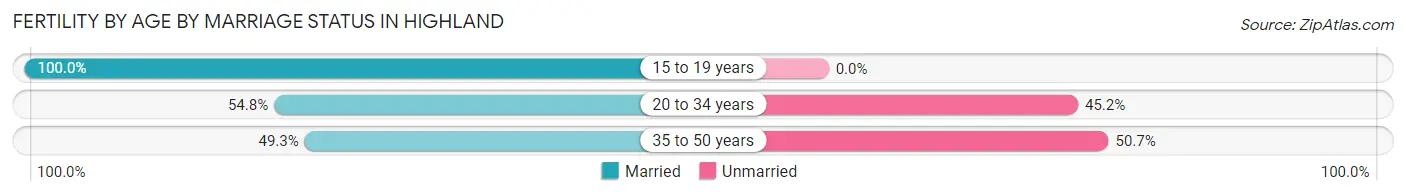
| Age Bracket | Married | Unmarried |
| 15 to 19 years | 16 (100.0%) | 0 (0.0%) |
| 20 to 34 years | 433 (54.8%) | 357 (45.2%) |
| 35 to 50 years | 34 (49.3%) | 35 (50.7%) |
| Total | 483 (55.2%) | 392 (44.8%) |
Fertility by Education in Highland
Average fertility rate in Highland is 62.0 births per 1,000 women. Women with the education attainment of college or associate's degree have the highest fertility rate of 88.0 births per 1,000 women, while women with the education attainment of less than high school have the lowest fertility at 31.0 births per 1,000 women. Women with the education attainment of college or associate's degree represent 40.2% of all women with births.
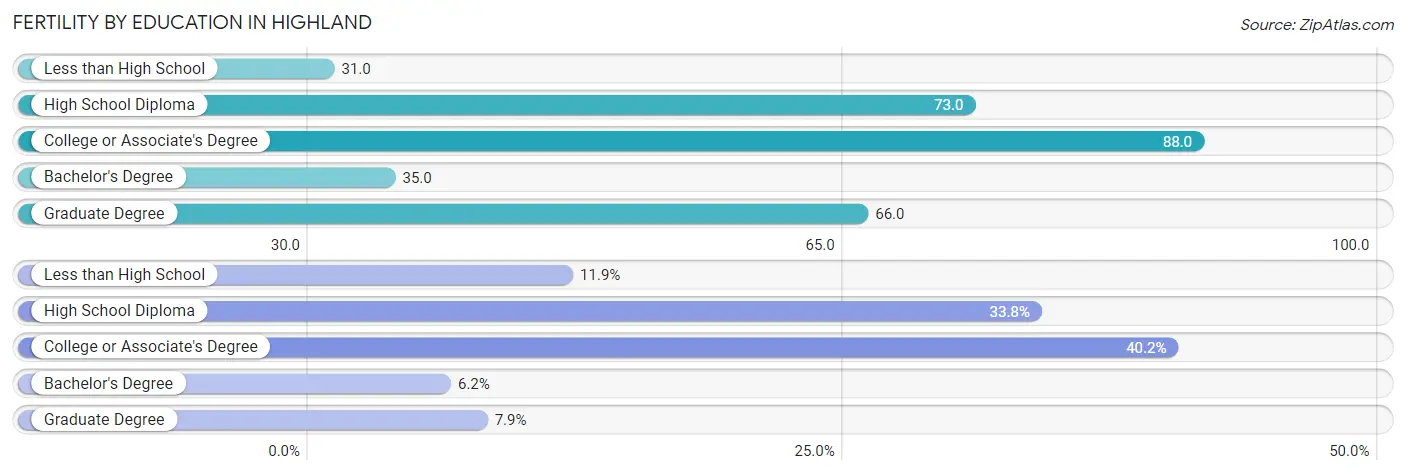
| Educational Attainment | Women with Births | Births / 1,000 Women |
| Less than High School | 104 (11.9%) | 31.0 |
| High School Diploma | 296 (33.8%) | 73.0 |
| College or Associate's Degree | 352 (40.2%) | 88.0 |
| Bachelor's Degree | 54 (6.2%) | 35.0 |
| Graduate Degree | 69 (7.9%) | 66.0 |
| Total | 875 (100.0%) | 62.0 |
Fertility by Education by Marriage Status in Highland
44.8% of women with births in Highland are unmarried. Women with the educational attainment of graduate degree are most likely to be married with 82.6% of them married at childbirth, while women with the educational attainment of bachelor's degree are least likely to be married with 100.0% of them unmarried at childbirth.
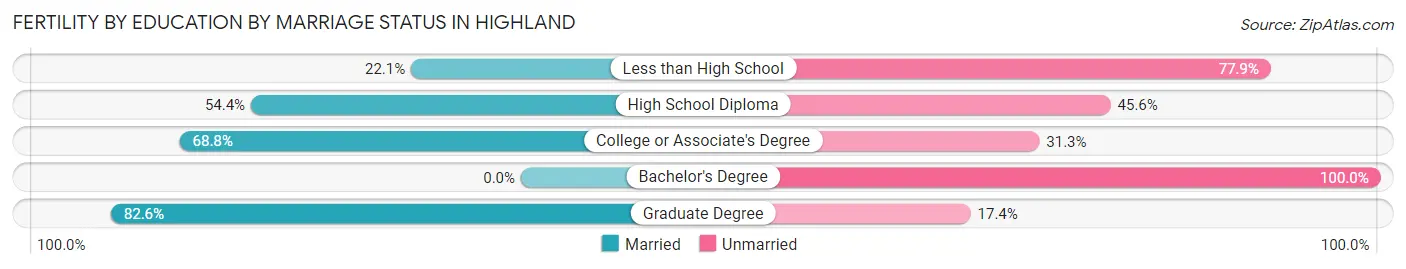
| Educational Attainment | Married | Unmarried |
| Less than High School | 23 (22.1%) | 81 (77.9%) |
| High School Diploma | 161 (54.4%) | 135 (45.6%) |
| College or Associate's Degree | 242 (68.8%) | 110 (31.2%) |
| Bachelor's Degree | 0 (0.0%) | 54 (100.0%) |
| Graduate Degree | 57 (82.6%) | 12 (17.4%) |
| Total | 483 (55.2%) | 392 (44.8%) |
Employment Characteristics in Highland
Employment by Class of Employer in Highland
Among the 24,878 employed individuals in Highland, private company employees (16,546 | 66.5%), local government employees (2,681 | 10.8%), and not-for-profit organizations (1,634 | 6.6%) make up the most common classes of employment.
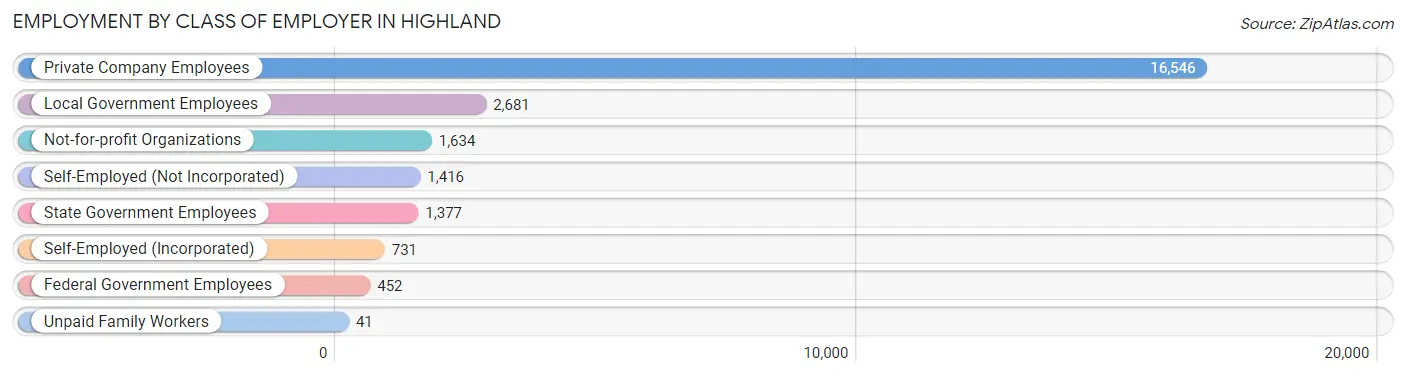
| Employer Class | # Employees | % Employees |
| Private Company Employees | 16,546 | 66.5% |
| Self-Employed (Incorporated) | 731 | 2.9% |
| Self-Employed (Not Incorporated) | 1,416 | 5.7% |
| Not-for-profit Organizations | 1,634 | 6.6% |
| Local Government Employees | 2,681 | 10.8% |
| State Government Employees | 1,377 | 5.5% |
| Federal Government Employees | 452 | 1.8% |
| Unpaid Family Workers | 41 | 0.2% |
| Total | 24,878 | 100.0% |
Employment Status by Age in Highland
According to the labor force statistics for Highland, out of the total population over 16 years of age (42,895), 63.0% or 27,024 individuals are in the labor force, with 6.0% or 1,621 of them unemployed. The age group with the highest labor force participation rate is 35 to 44 years, with 83.7% or 6,117 individuals in the labor force. Within the labor force, the 16 to 19 years age range has the highest percentage of unemployed individuals, with 17.5% or 241 of them being unemployed.
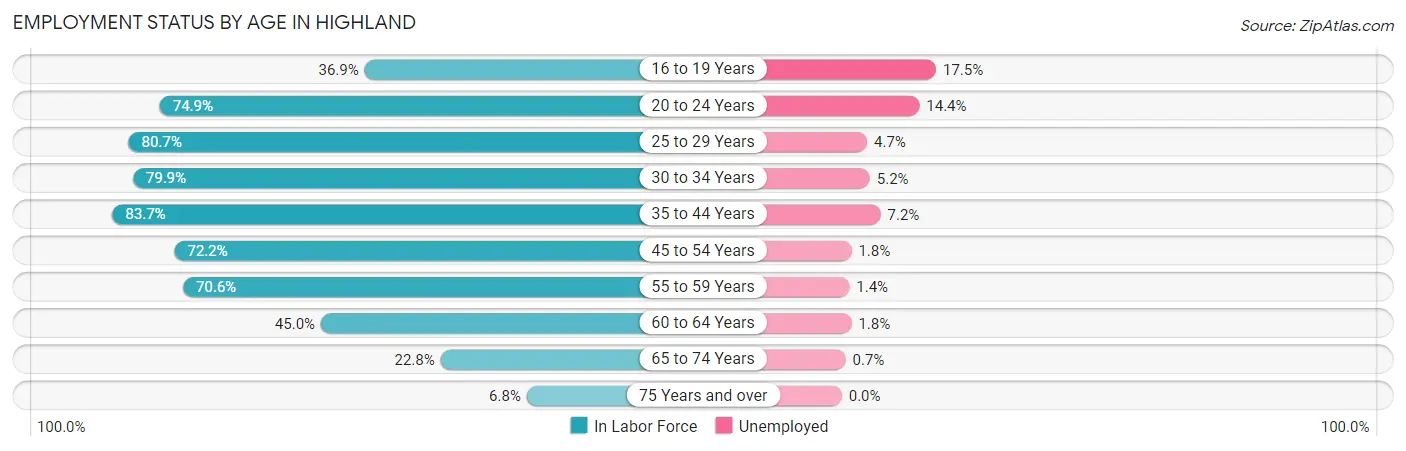
| Age Bracket | In Labor Force | Unemployed |
| 16 to 19 Years | 1,378 (36.9%) | 241 (17.5%) |
| 20 to 24 Years | 3,235 (74.9%) | 466 (14.4%) |
| 25 to 29 Years | 3,509 (80.7%) | 165 (4.7%) |
| 30 to 34 Years | 2,907 (79.9%) | 151 (5.2%) |
| 35 to 44 Years | 6,117 (83.7%) | 440 (7.2%) |
| 45 to 54 Years | 5,167 (72.2%) | 93 (1.8%) |
| 55 to 59 Years | 2,527 (70.6%) | 35 (1.4%) |
| 60 to 64 Years | 1,179 (45.0%) | 21 (1.8%) |
| 65 to 74 Years | 838 (22.8%) | 6 (0.7%) |
| 75 Years and over | 171 (6.8%) | 0 (0.0%) |
| Total | 27,024 (63.0%) | 1,621 (6.0%) |
Employment Status by Educational Attainment in Highland
According to labor force statistics for Highland, 74.7% of individuals (21,402) out of the total population between 25 and 64 years of age (28,651) are in the labor force, with 4.2% or 899 of them being unemployed. The group with the highest labor force participation rate are those with the educational attainment of bachelor's degree or higher, with 84.5% or 4,856 individuals in the labor force. Within the labor force, individuals with less than high school education have the highest percentage of unemployment, with 6.8% or 303 of them being unemployed.
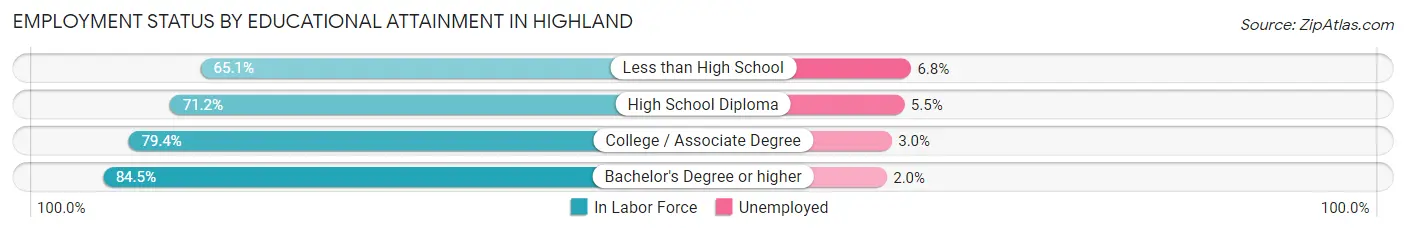
| Educational Attainment | In Labor Force | Unemployed |
| Less than High School | 4,461 (65.1%) | 466 (6.8%) |
| High School Diploma | 5,719 (71.2%) | 442 (5.5%) |
| College / Associate Degree | 6,367 (79.4%) | 241 (3.0%) |
| Bachelor's Degree or higher | 4,856 (84.5%) | 115 (2.0%) |
| Total | 21,402 (74.7%) | 1,203 (4.2%) |
Employment Occupations by Sex in Highland
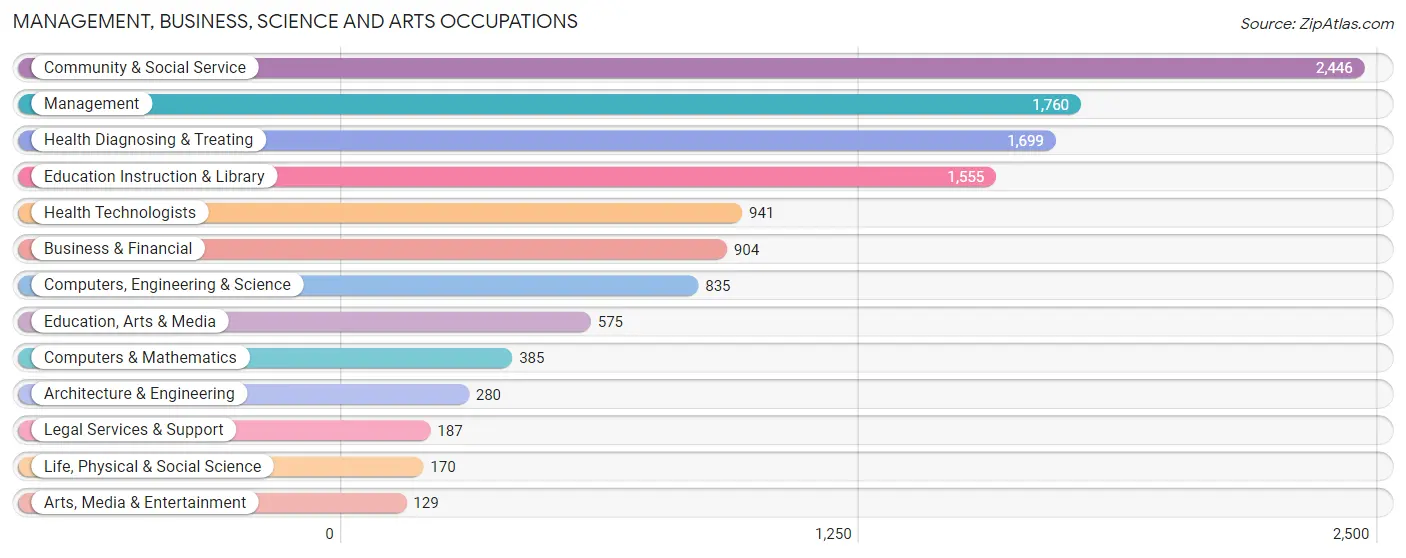
Management, Business, Science and Arts Occupations
The most common Management, Business, Science and Arts occupations in Highland are Community & Social Service (2,446 | 9.7%), Management (1,760 | 7.0%), Health Diagnosing & Treating (1,699 | 6.7%), Education Instruction & Library (1,555 | 6.1%), and Health Technologists (941 | 3.7%).
Management, Business, Science and Arts Occupations by Sex
Within the Management, Business, Science and Arts occupations in Highland, the most male-oriented occupations are Architecture & Engineering (90.0%), Computers, Engineering & Science (78.6%), and Arts, Media & Entertainment (78.3%), while the most female-oriented occupations are Education, Arts & Media (75.3%), Health Diagnosing & Treating (72.9%), and Health Technologists (71.9%).
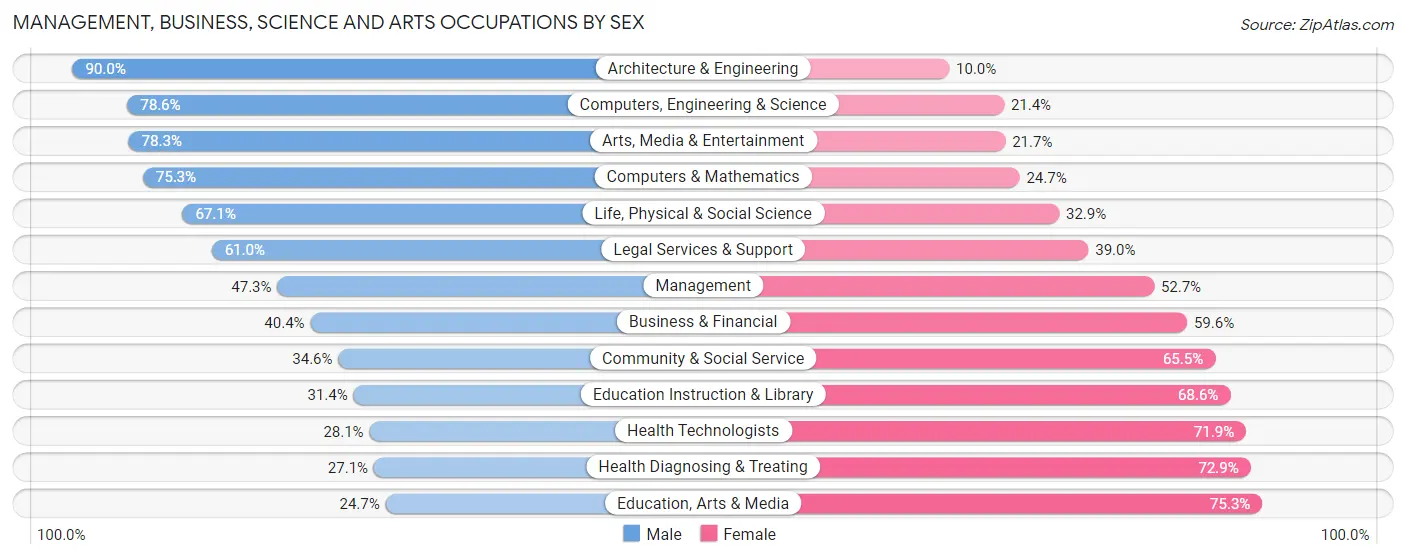
| Occupation | Male | Female |
| Management | 832 (47.3%) | 928 (52.7%) |
| Business & Financial | 365 (40.4%) | 539 (59.6%) |
| Computers, Engineering & Science | 656 (78.6%) | 179 (21.4%) |
| Computers & Mathematics | 290 (75.3%) | 95 (24.7%) |
| Architecture & Engineering | 252 (90.0%) | 28 (10.0%) |
| Life, Physical & Social Science | 114 (67.1%) | 56 (32.9%) |
| Community & Social Service | 845 (34.5%) | 1,601 (65.4%) |
| Education, Arts & Media | 142 (24.7%) | 433 (75.3%) |
| Legal Services & Support | 114 (61.0%) | 73 (39.0%) |
| Education Instruction & Library | 488 (31.4%) | 1,067 (68.6%) |
| Arts, Media & Entertainment | 101 (78.3%) | 28 (21.7%) |
| Health Diagnosing & Treating | 461 (27.1%) | 1,238 (72.9%) |
| Health Technologists | 264 (28.1%) | 677 (71.9%) |
| Total (Category) | 3,159 (41.3%) | 4,485 (58.7%) |
| Total (Overall) | 13,871 (54.8%) | 11,457 (45.2%) |
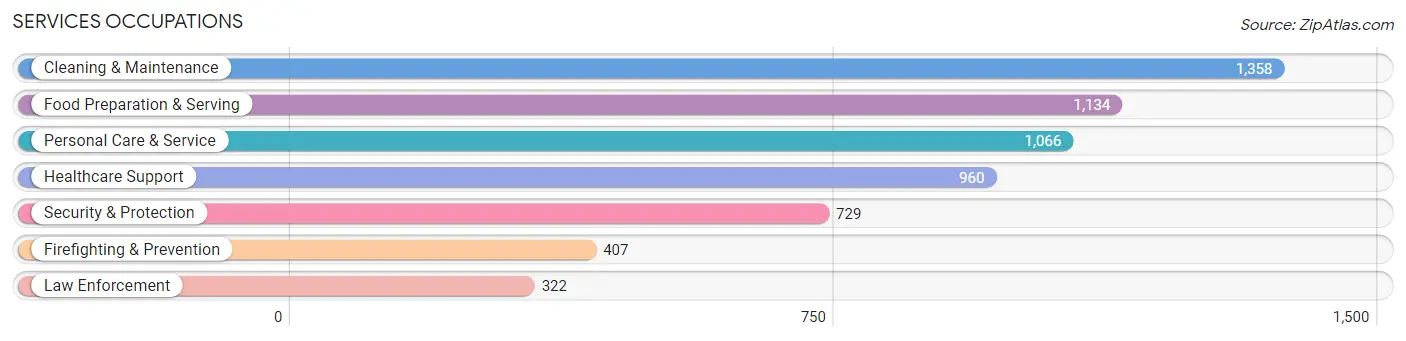
Services Occupations
The most common Services occupations in Highland are Cleaning & Maintenance (1,358 | 5.4%), Food Preparation & Serving (1,134 | 4.5%), Personal Care & Service (1,066 | 4.2%), Healthcare Support (960 | 3.8%), and Security & Protection (729 | 2.9%).
Services Occupations by Sex
Within the Services occupations in Highland, the most male-oriented occupations are Law Enforcement (86.7%), Security & Protection (81.3%), and Firefighting & Prevention (77.1%), while the most female-oriented occupations are Healthcare Support (79.9%), Personal Care & Service (70.5%), and Food Preparation & Serving (58.2%).
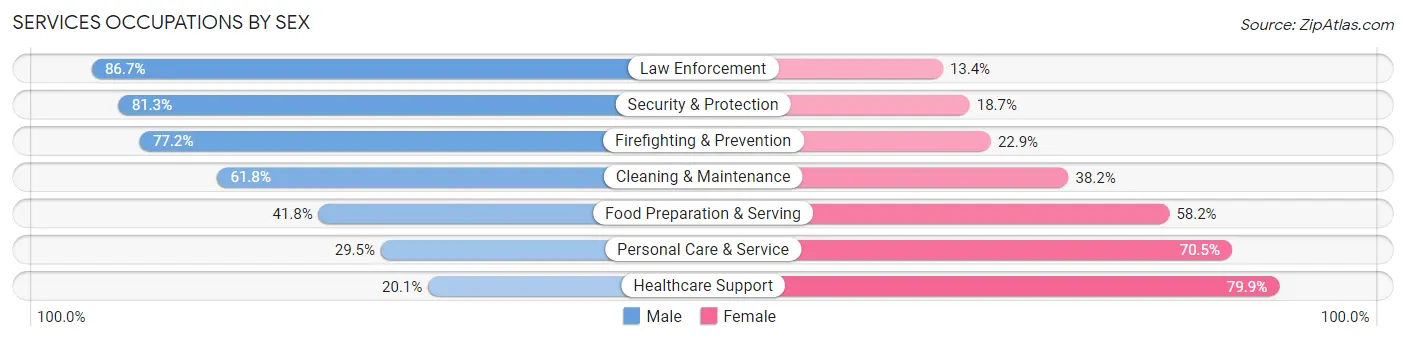
| Occupation | Male | Female |
| Healthcare Support | 193 (20.1%) | 767 (79.9%) |
| Security & Protection | 593 (81.3%) | 136 (18.7%) |
| Firefighting & Prevention | 314 (77.1%) | 93 (22.9%) |
| Law Enforcement | 279 (86.7%) | 43 (13.4%) |
| Food Preparation & Serving | 474 (41.8%) | 660 (58.2%) |
| Cleaning & Maintenance | 839 (61.8%) | 519 (38.2%) |
| Personal Care & Service | 314 (29.5%) | 752 (70.5%) |
| Total (Category) | 2,413 (46.0%) | 2,834 (54.0%) |
| Total (Overall) | 13,871 (54.8%) | 11,457 (45.2%) |
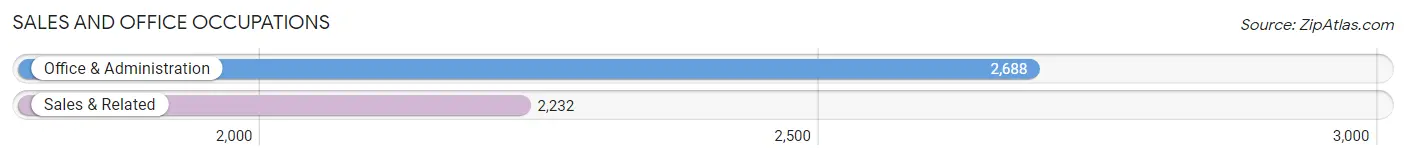
Sales and Office Occupations
The most common Sales and Office occupations in Highland are Office & Administration (2,688 | 10.6%), and Sales & Related (2,232 | 8.8%).
Sales and Office Occupations by Sex
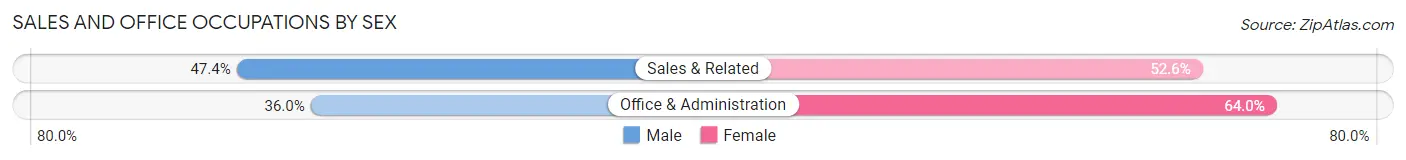
| Occupation | Male | Female |
| Sales & Related | 1,058 (47.4%) | 1,174 (52.6%) |
| Office & Administration | 968 (36.0%) | 1,720 (64.0%) |
| Total (Category) | 2,026 (41.2%) | 2,894 (58.8%) |
| Total (Overall) | 13,871 (54.8%) | 11,457 (45.2%) |
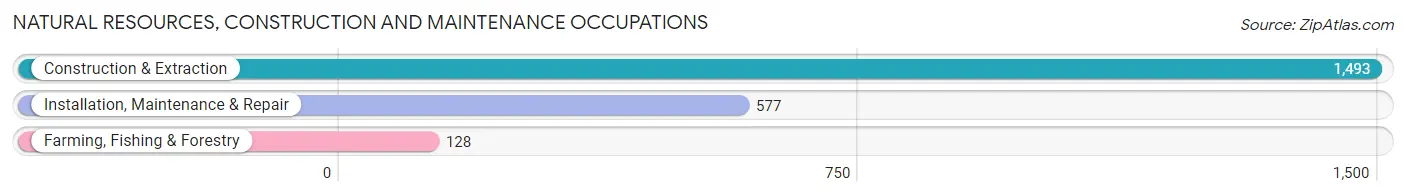
Natural Resources, Construction and Maintenance Occupations
The most common Natural Resources, Construction and Maintenance occupations in Highland are Construction & Extraction (1,493 | 5.9%), Installation, Maintenance & Repair (577 | 2.3%), and Farming, Fishing & Forestry (128 | 0.5%).
Natural Resources, Construction and Maintenance Occupations by Sex
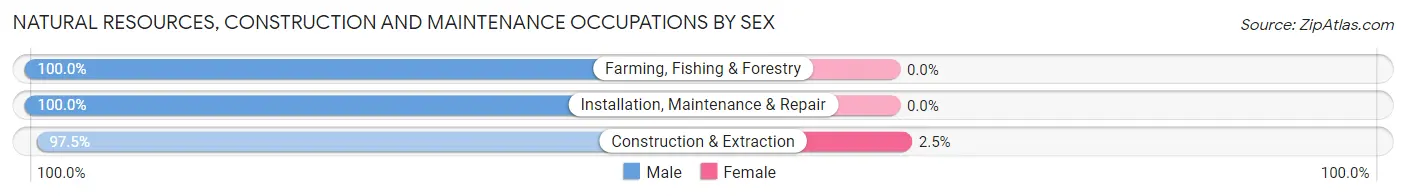
| Occupation | Male | Female |
| Farming, Fishing & Forestry | 128 (100.0%) | 0 (0.0%) |
| Construction & Extraction | 1,456 (97.5%) | 37 (2.5%) |
| Installation, Maintenance & Repair | 577 (100.0%) | 0 (0.0%) |
| Total (Category) | 2,161 (98.3%) | 37 (1.7%) |
| Total (Overall) | 13,871 (54.8%) | 11,457 (45.2%) |
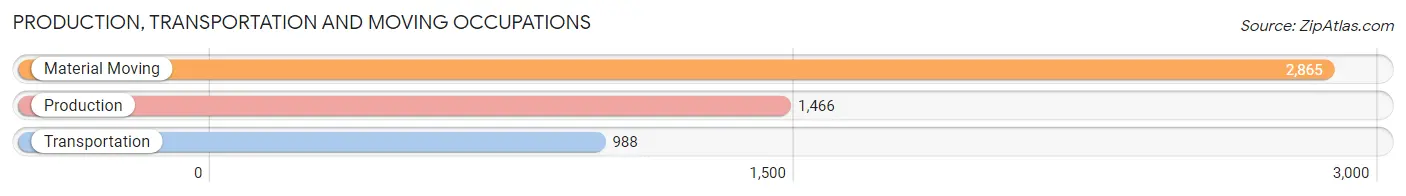
Production, Transportation and Moving Occupations
The most common Production, Transportation and Moving occupations in Highland are Material Moving (2,865 | 11.3%), Production (1,466 | 5.8%), and Transportation (988 | 3.9%).
Production, Transportation and Moving Occupations by Sex
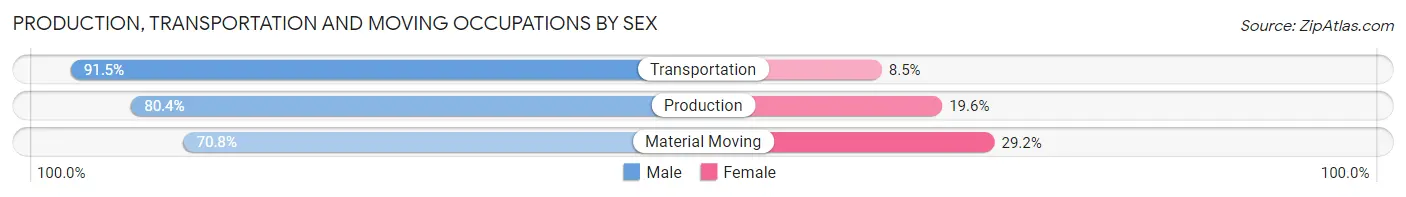
| Occupation | Male | Female |
| Production | 1,179 (80.4%) | 287 (19.6%) |
| Transportation | 904 (91.5%) | 84 (8.5%) |
| Material Moving | 2,029 (70.8%) | 836 (29.2%) |
| Total (Category) | 4,112 (77.3%) | 1,207 (22.7%) |
| Total (Overall) | 13,871 (54.8%) | 11,457 (45.2%) |
Employment Industries by Sex in Highland
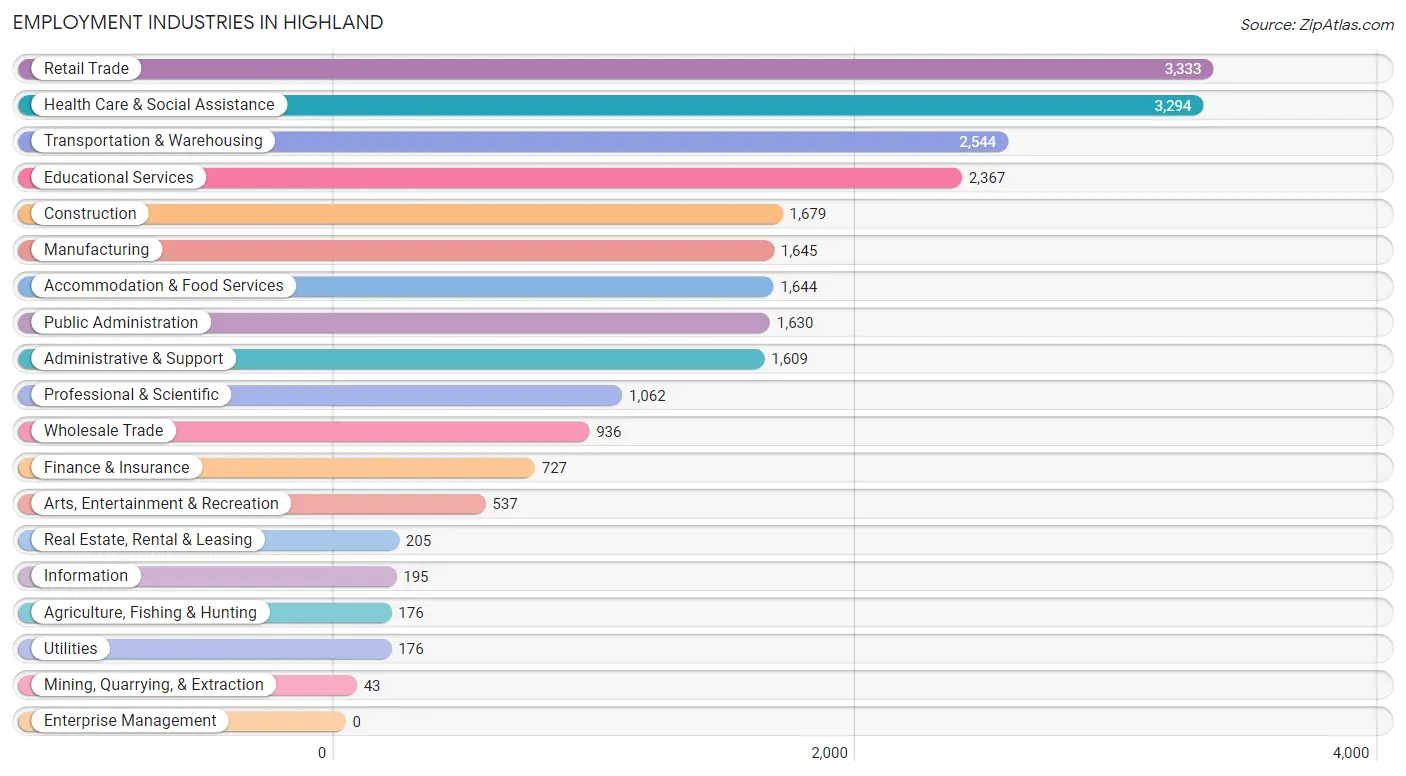
Employment Industries in Highland
The major employment industries in Highland include Retail Trade (3,333 | 13.2%), Health Care & Social Assistance (3,294 | 13.0%), Transportation & Warehousing (2,544 | 10.0%), Educational Services (2,367 | 9.3%), and Construction (1,679 | 6.6%).
Employment Industries by Sex in Highland
The Highland industries that see more men than women are Mining, Quarrying, & Extraction (100.0%), Agriculture, Fishing & Hunting (93.8%), and Construction (90.9%), whereas the industries that tend to have a higher number of women are Health Care & Social Assistance (77.5%), Real Estate, Rental & Leasing (70.2%), and Educational Services (66.1%).
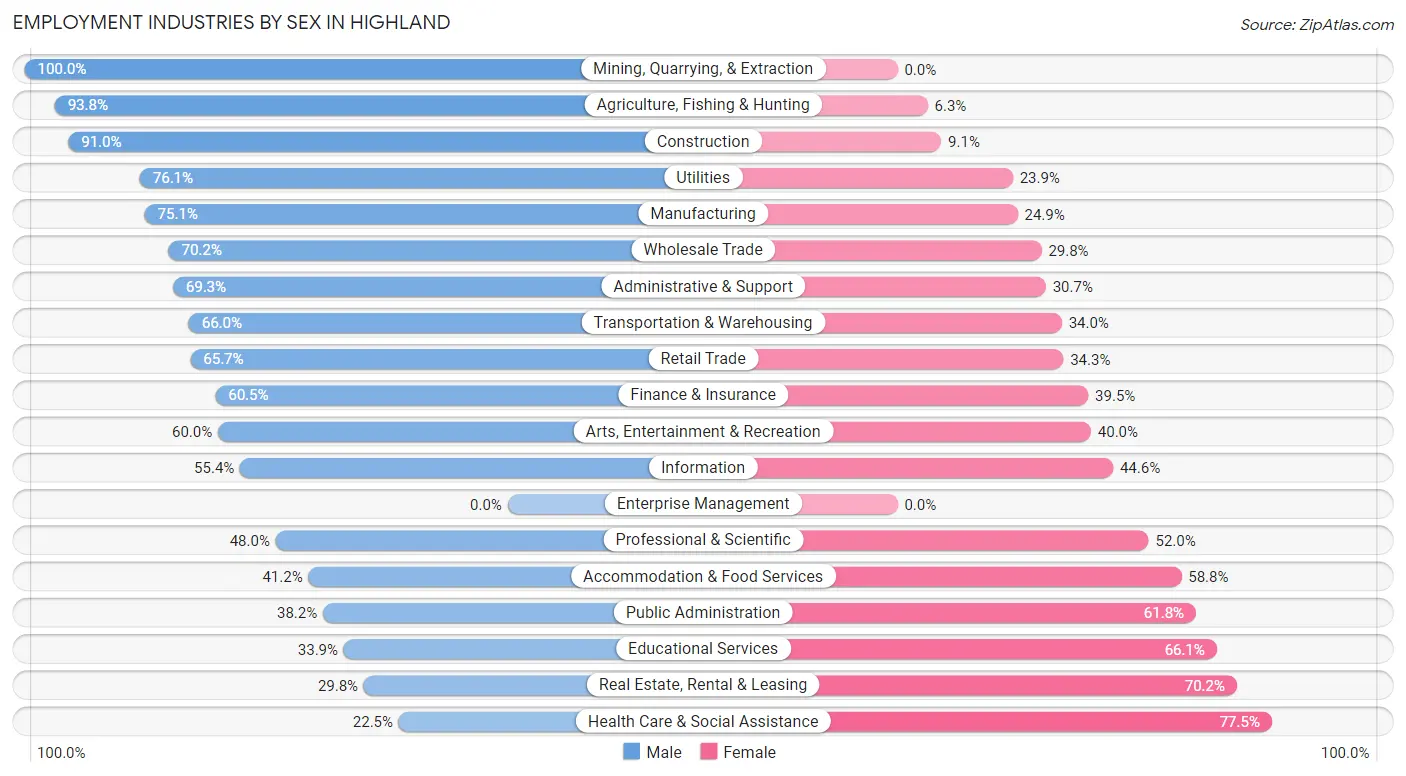
| Industry | Male | Female |
| Agriculture, Fishing & Hunting | 165 (93.8%) | 11 (6.2%) |
| Mining, Quarrying, & Extraction | 43 (100.0%) | 0 (0.0%) |
| Construction | 1,527 (90.9%) | 152 (9.0%) |
| Manufacturing | 1,236 (75.1%) | 409 (24.9%) |
| Wholesale Trade | 657 (70.2%) | 279 (29.8%) |
| Retail Trade | 2,189 (65.7%) | 1,144 (34.3%) |
| Transportation & Warehousing | 1,679 (66.0%) | 865 (34.0%) |
| Utilities | 134 (76.1%) | 42 (23.9%) |
| Information | 108 (55.4%) | 87 (44.6%) |
| Finance & Insurance | 440 (60.5%) | 287 (39.5%) |
| Real Estate, Rental & Leasing | 61 (29.8%) | 144 (70.2%) |
| Professional & Scientific | 510 (48.0%) | 552 (52.0%) |
| Enterprise Management | 0 (0.0%) | 0 (0.0%) |
| Administrative & Support | 1,115 (69.3%) | 494 (30.7%) |
| Educational Services | 803 (33.9%) | 1,564 (66.1%) |
| Health Care & Social Assistance | 742 (22.5%) | 2,552 (77.5%) |
| Arts, Entertainment & Recreation | 322 (60.0%) | 215 (40.0%) |
| Accommodation & Food Services | 678 (41.2%) | 966 (58.8%) |
| Public Administration | 623 (38.2%) | 1,007 (61.8%) |
| Total | 13,871 (54.8%) | 11,457 (45.2%) |
Education in Highland
School Enrollment in Highland
The most common levels of schooling among the 15,562 students in Highland are middle school (3,467 | 22.3%), high school (3,464 | 22.3%), and elementary school (3,314 | 21.3%).
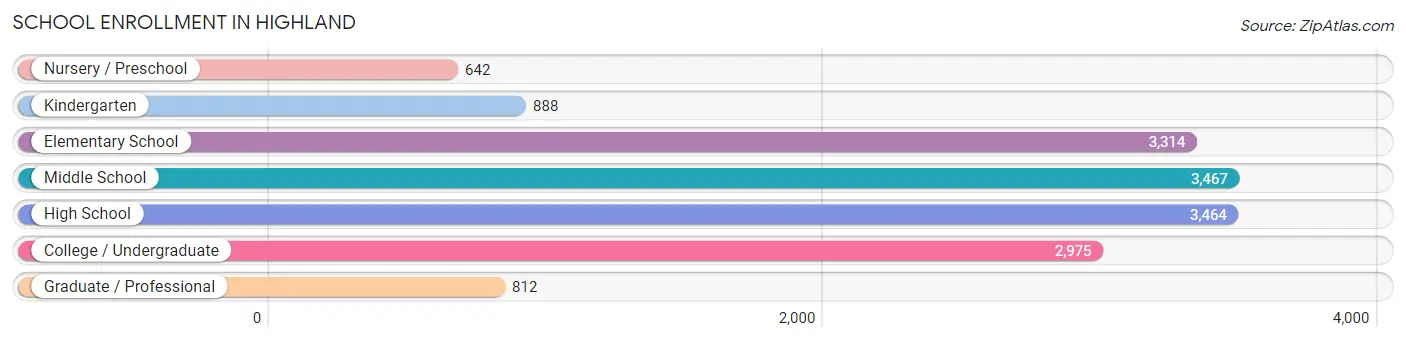
| School Level | # Students | % Students |
| Nursery / Preschool | 642 | 4.1% |
| Kindergarten | 888 | 5.7% |
| Elementary School | 3,314 | 21.3% |
| Middle School | 3,467 | 22.3% |
| High School | 3,464 | 22.3% |
| College / Undergraduate | 2,975 | 19.1% |
| Graduate / Professional | 812 | 5.2% |
| Total | 15,562 | 100.0% |
School Enrollment by Age by Funding Source in Highland
Out of a total of 15,562 students who are enrolled in schools in Highland, 1,385 (8.9%) attend a private institution, while the remaining 14,177 (91.1%) are enrolled in public schools. The age group of 25 to 34 year olds has the highest likelihood of being enrolled in private schools, with 330 (37.9% in the age bracket) enrolled. Conversely, the age group of 10 to 14 year olds has the lowest likelihood of being enrolled in a private school, with 4,232 (97.2% in the age bracket) attending a public institution.
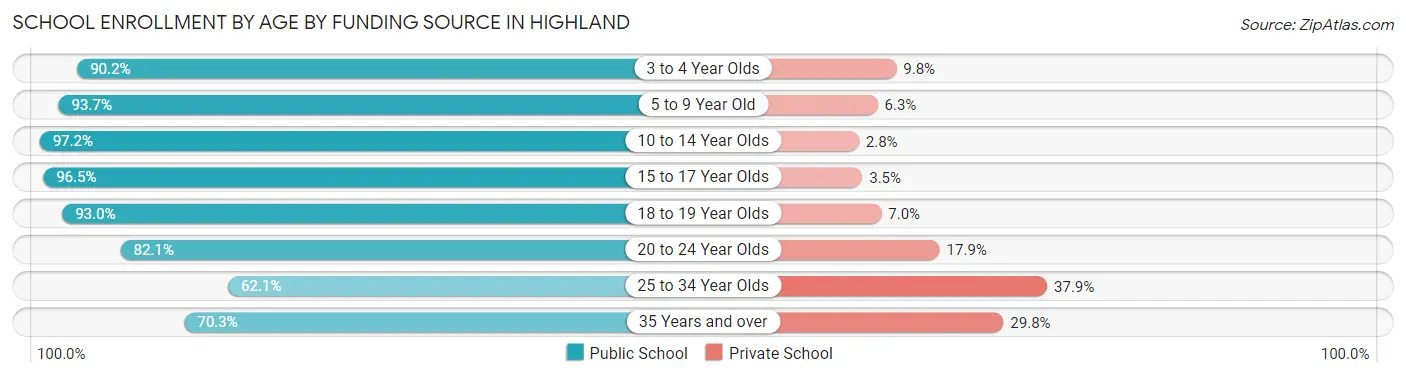
| Age Bracket | Public School | Private School |
| 3 to 4 Year Olds | 487 (90.2%) | 53 (9.8%) |
| 5 to 9 Year Old | 3,689 (93.7%) | 249 (6.3%) |
| 10 to 14 Year Olds | 4,232 (97.2%) | 123 (2.8%) |
| 15 to 17 Year Olds | 2,340 (96.5%) | 84 (3.5%) |
| 18 to 19 Year Olds | 1,192 (93.0%) | 90 (7.0%) |
| 20 to 24 Year Olds | 1,240 (82.1%) | 270 (17.9%) |
| 25 to 34 Year Olds | 541 (62.1%) | 330 (37.9%) |
| 35 Years and over | 451 (70.3%) | 191 (29.7%) |
| Total | 14,177 (91.1%) | 1,385 (8.9%) |
Educational Attainment by Field of Study in Highland
Business (1,433 | 18.6%), education (897 | 11.7%), arts & humanities (822 | 10.7%), science & technology (745 | 9.7%), and bio, nature & agricultural (615 | 8.0%) are the most common fields of study among 7,694 individuals in Highland who have obtained a bachelor's degree or higher.
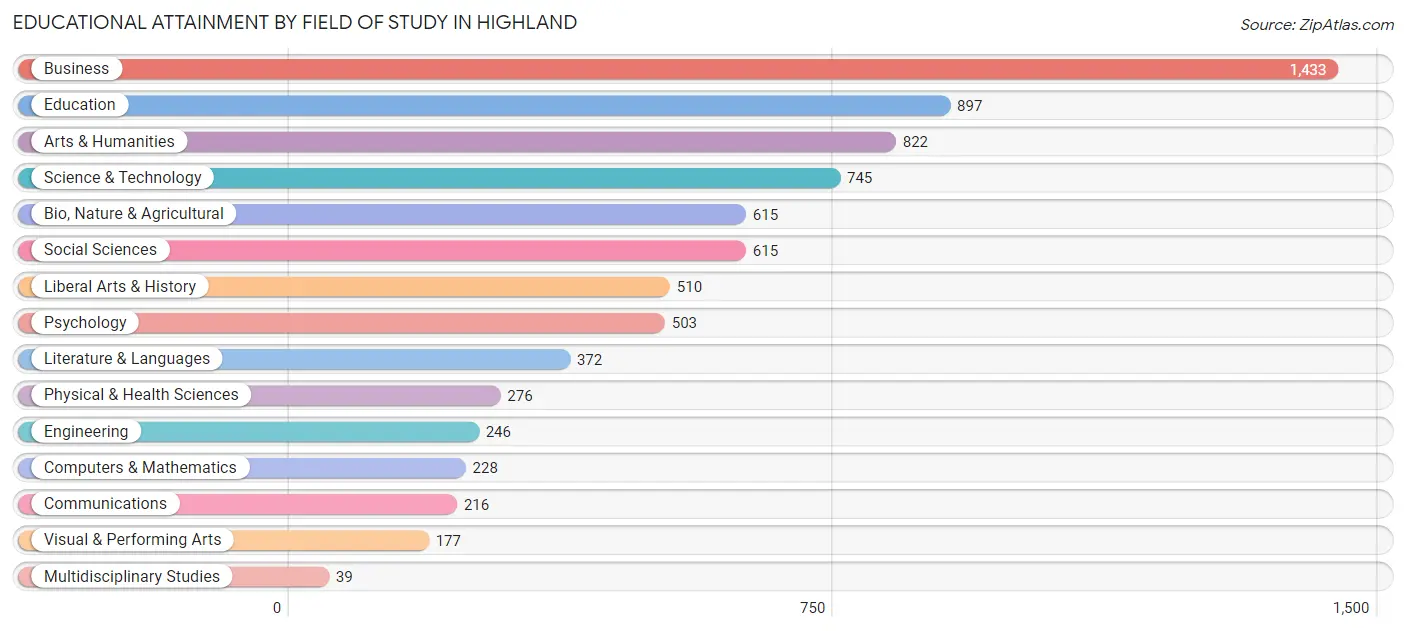
| Field of Study | # Graduates | % Graduates |
| Computers & Mathematics | 228 | 3.0% |
| Bio, Nature & Agricultural | 615 | 8.0% |
| Physical & Health Sciences | 276 | 3.6% |
| Psychology | 503 | 6.5% |
| Social Sciences | 615 | 8.0% |
| Engineering | 246 | 3.2% |
| Multidisciplinary Studies | 39 | 0.5% |
| Science & Technology | 745 | 9.7% |
| Business | 1,433 | 18.6% |
| Education | 897 | 11.7% |
| Literature & Languages | 372 | 4.8% |
| Liberal Arts & History | 510 | 6.6% |
| Visual & Performing Arts | 177 | 2.3% |
| Communications | 216 | 2.8% |
| Arts & Humanities | 822 | 10.7% |
| Total | 7,694 | 100.0% |
Transportation & Commute in Highland
Vehicle Availability by Sex in Highland
The most prevalent vehicle ownership categories in Highland are males with 2 vehicles (4,743, accounting for 34.6%) and females with 2 vehicles (4,613, making up 42.5%).
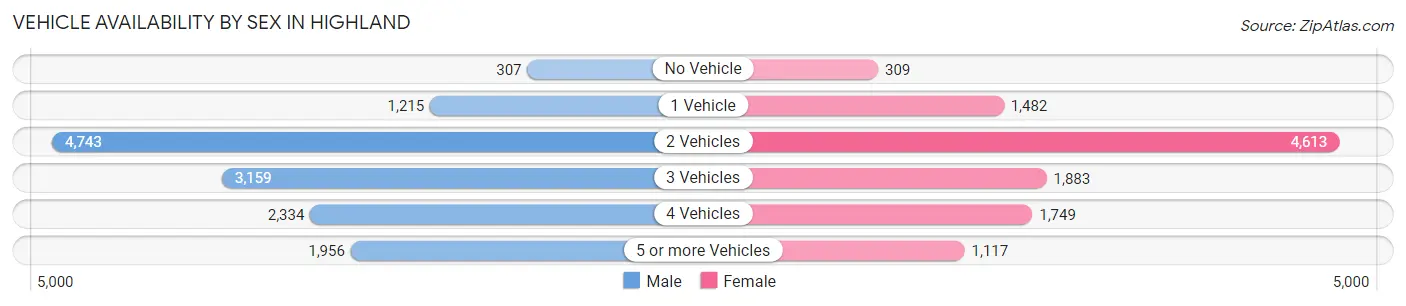
| Vehicles Available | Male | Female |
| No Vehicle | 307 (2.2%) | 309 (2.8%) |
| 1 Vehicle | 1,215 (8.9%) | 1,482 (13.3%) |
| 2 Vehicles | 4,743 (34.6%) | 4,613 (41.4%) |
| 3 Vehicles | 3,159 (23.0%) | 1,883 (16.9%) |
| 4 Vehicles | 2,334 (17.0%) | 1,749 (15.7%) |
| 5 or more Vehicles | 1,956 (14.3%) | 1,117 (10.0%) |
| Total | 13,714 (100.0%) | 11,153 (100.0%) |
Commute Time in Highland
The most frequently occuring commute durations in Highland are 15 to 19 minutes (4,688 commuters, 20.0%), 10 to 14 minutes (3,670 commuters, 15.7%), and 20 to 24 minutes (3,379 commuters, 14.4%).
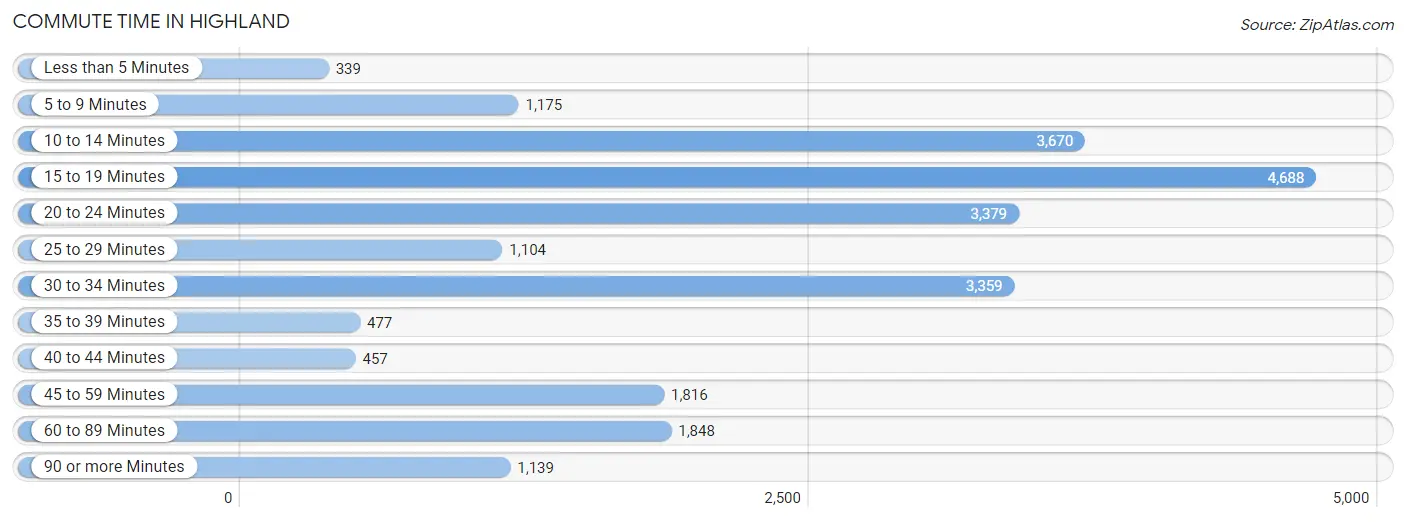
| Commute Time | # Commuters | % Commuters |
| Less than 5 Minutes | 339 | 1.5% |
| 5 to 9 Minutes | 1,175 | 5.0% |
| 10 to 14 Minutes | 3,670 | 15.7% |
| 15 to 19 Minutes | 4,688 | 20.0% |
| 20 to 24 Minutes | 3,379 | 14.4% |
| 25 to 29 Minutes | 1,104 | 4.7% |
| 30 to 34 Minutes | 3,359 | 14.3% |
| 35 to 39 Minutes | 477 | 2.0% |
| 40 to 44 Minutes | 457 | 1.9% |
| 45 to 59 Minutes | 1,816 | 7.7% |
| 60 to 89 Minutes | 1,848 | 7.9% |
| 90 or more Minutes | 1,139 | 4.9% |
Commute Time by Sex in Highland
The most common commute times in Highland are 15 to 19 minutes (2,561 commuters, 19.6%) for males and 15 to 19 minutes (2,127 commuters, 20.5%) for females.
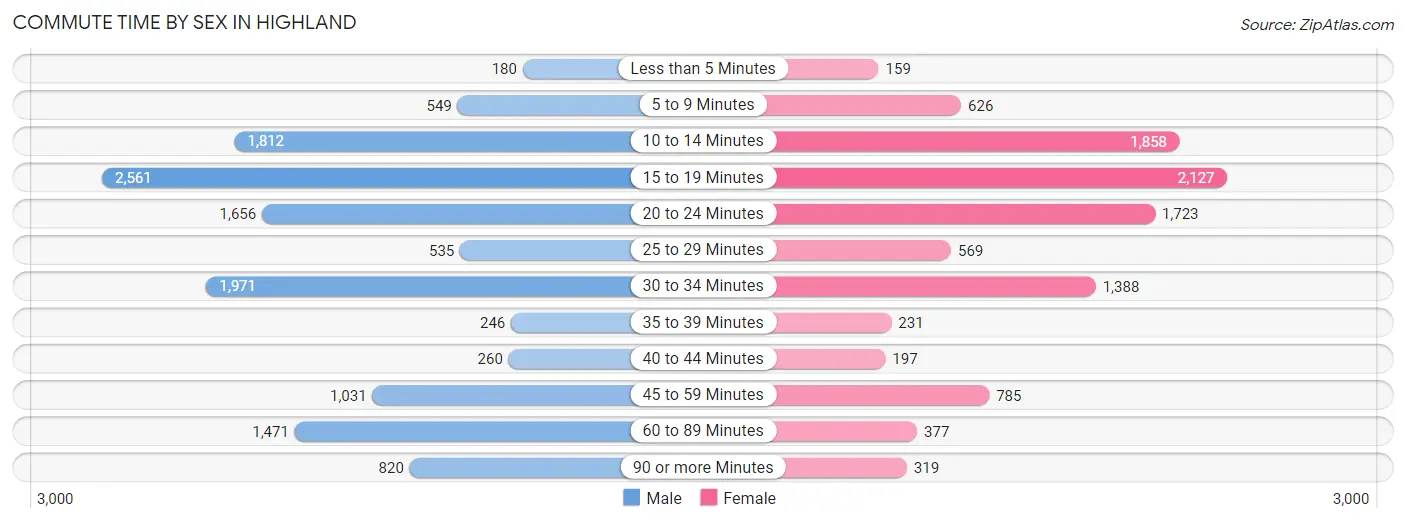
| Commute Time | Male | Female |
| Less than 5 Minutes | 180 (1.4%) | 159 (1.5%) |
| 5 to 9 Minutes | 549 (4.2%) | 626 (6.0%) |
| 10 to 14 Minutes | 1,812 (13.8%) | 1,858 (17.9%) |
| 15 to 19 Minutes | 2,561 (19.6%) | 2,127 (20.5%) |
| 20 to 24 Minutes | 1,656 (12.7%) | 1,723 (16.6%) |
| 25 to 29 Minutes | 535 (4.1%) | 569 (5.5%) |
| 30 to 34 Minutes | 1,971 (15.0%) | 1,388 (13.4%) |
| 35 to 39 Minutes | 246 (1.9%) | 231 (2.2%) |
| 40 to 44 Minutes | 260 (2.0%) | 197 (1.9%) |
| 45 to 59 Minutes | 1,031 (7.9%) | 785 (7.6%) |
| 60 to 89 Minutes | 1,471 (11.2%) | 377 (3.6%) |
| 90 or more Minutes | 820 (6.3%) | 319 (3.1%) |
Time of Departure to Work by Sex in Highland
The most frequent times of departure to work in Highland are 7:00 AM to 7:29 AM (2,001, 15.3%) for males and 7:00 AM to 7:29 AM (1,558, 15.0%) for females.
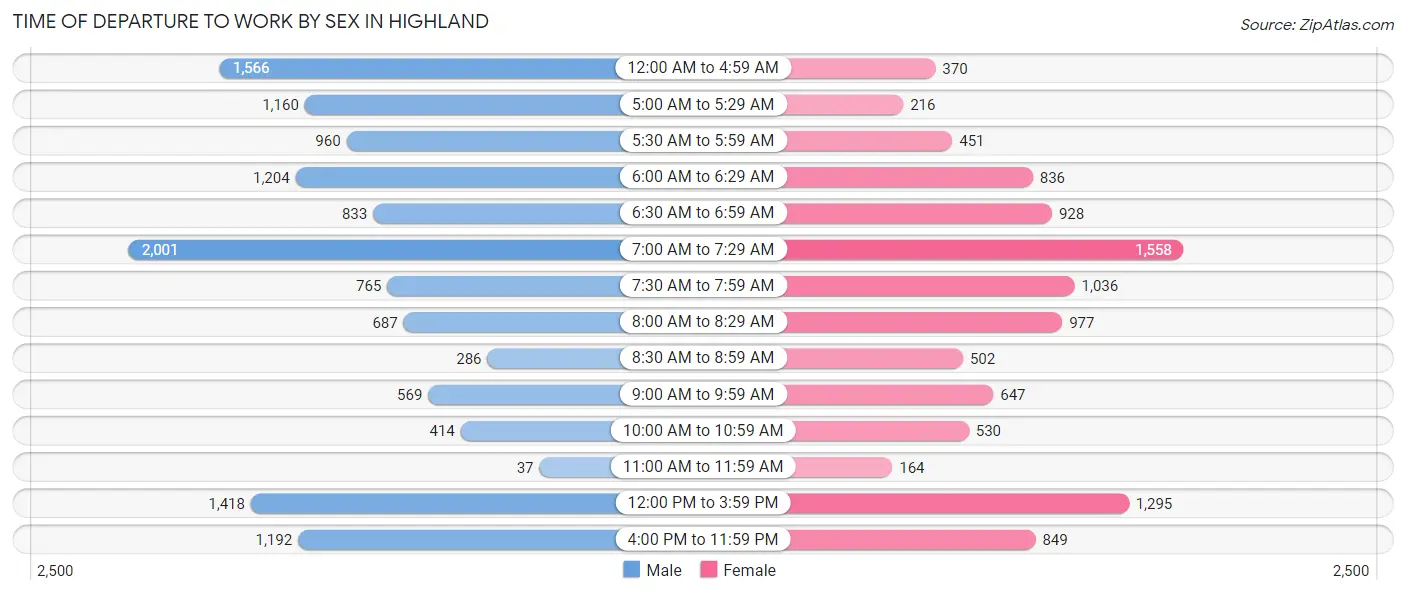
| Time of Departure | Male | Female |
| 12:00 AM to 4:59 AM | 1,566 (12.0%) | 370 (3.6%) |
| 5:00 AM to 5:29 AM | 1,160 (8.9%) | 216 (2.1%) |
| 5:30 AM to 5:59 AM | 960 (7.3%) | 451 (4.3%) |
| 6:00 AM to 6:29 AM | 1,204 (9.2%) | 836 (8.1%) |
| 6:30 AM to 6:59 AM | 833 (6.4%) | 928 (9.0%) |
| 7:00 AM to 7:29 AM | 2,001 (15.3%) | 1,558 (15.0%) |
| 7:30 AM to 7:59 AM | 765 (5.8%) | 1,036 (10.0%) |
| 8:00 AM to 8:29 AM | 687 (5.2%) | 977 (9.4%) |
| 8:30 AM to 8:59 AM | 286 (2.2%) | 502 (4.9%) |
| 9:00 AM to 9:59 AM | 569 (4.3%) | 647 (6.2%) |
| 10:00 AM to 10:59 AM | 414 (3.2%) | 530 (5.1%) |
| 11:00 AM to 11:59 AM | 37 (0.3%) | 164 (1.6%) |
| 12:00 PM to 3:59 PM | 1,418 (10.8%) | 1,295 (12.5%) |
| 4:00 PM to 11:59 PM | 1,192 (9.1%) | 849 (8.2%) |
| Total | 13,092 (100.0%) | 10,359 (100.0%) |
Housing Occupancy in Highland
Occupancy by Ownership in Highland
Of the total 16,464 dwellings in Highland, owner-occupied units account for 10,923 (66.3%), while renter-occupied units make up 5,541 (33.7%).
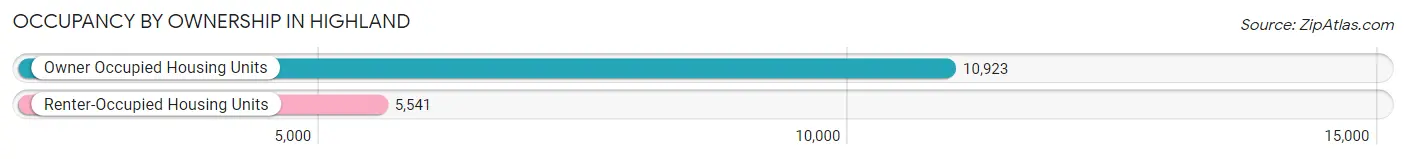
| Occupancy | # Housing Units | % Housing Units |
| Owner Occupied Housing Units | 10,923 | 66.3% |
| Renter-Occupied Housing Units | 5,541 | 33.7% |
| Total Occupied Housing Units | 16,464 | 100.0% |
Occupancy by Household Size in Highland
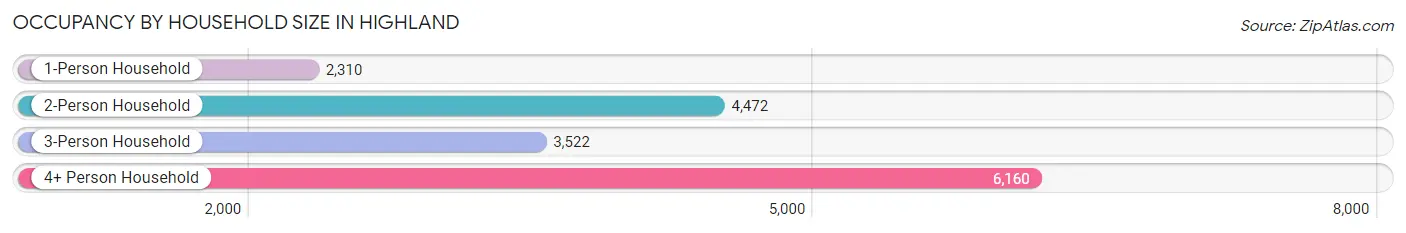
| Household Size | # Housing Units | % Housing Units |
| 1-Person Household | 2,310 | 14.0% |
| 2-Person Household | 4,472 | 27.2% |
| 3-Person Household | 3,522 | 21.4% |
| 4+ Person Household | 6,160 | 37.4% |
| Total Housing Units | 16,464 | 100.0% |
Occupancy by Ownership by Household Size in Highland
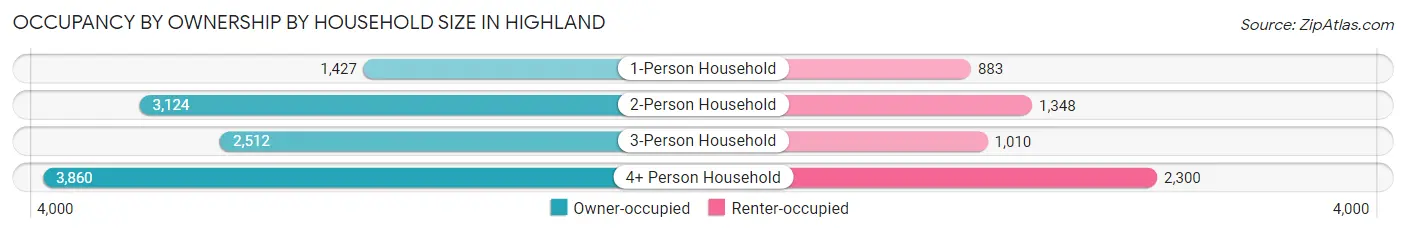
| Household Size | Owner-occupied | Renter-occupied |
| 1-Person Household | 1,427 (61.8%) | 883 (38.2%) |
| 2-Person Household | 3,124 (69.9%) | 1,348 (30.1%) |
| 3-Person Household | 2,512 (71.3%) | 1,010 (28.7%) |
| 4+ Person Household | 3,860 (62.7%) | 2,300 (37.3%) |
| Total Housing Units | 10,923 (66.3%) | 5,541 (33.7%) |
Occupancy by Educational Attainment in Highland
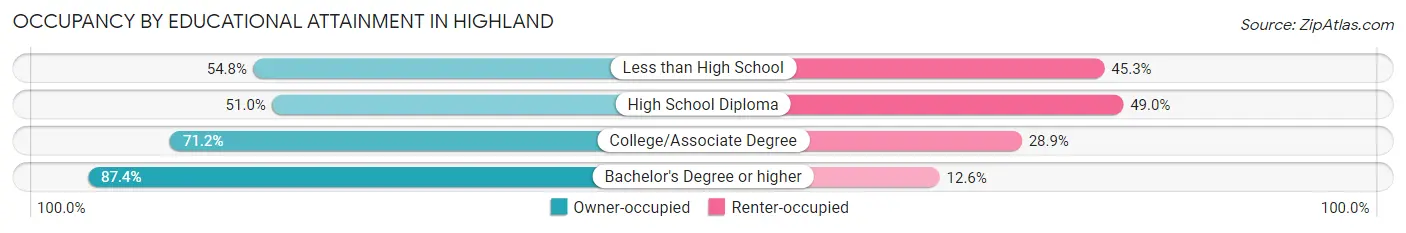
| Household Size | Owner-occupied | Renter-occupied |
| Less than High School | 1,907 (54.7%) | 1,576 (45.3%) |
| High School Diploma | 2,175 (51.0%) | 2,088 (49.0%) |
| College/Associate Degree | 3,414 (71.2%) | 1,384 (28.8%) |
| Bachelor's Degree or higher | 3,427 (87.4%) | 493 (12.6%) |
Occupancy by Age of Householder in Highland
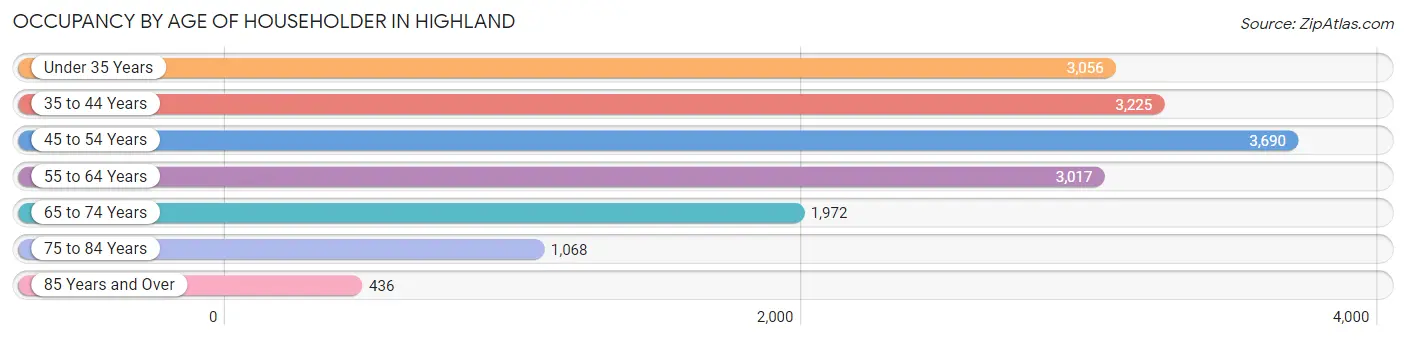
| Age Bracket | # Households | % Households |
| Under 35 Years | 3,056 | 18.6% |
| 35 to 44 Years | 3,225 | 19.6% |
| 45 to 54 Years | 3,690 | 22.4% |
| 55 to 64 Years | 3,017 | 18.3% |
| 65 to 74 Years | 1,972 | 12.0% |
| 75 to 84 Years | 1,068 | 6.5% |
| 85 Years and Over | 436 | 2.6% |
| Total | 16,464 | 100.0% |
Housing Finances in Highland
Median Income by Occupancy in Highland
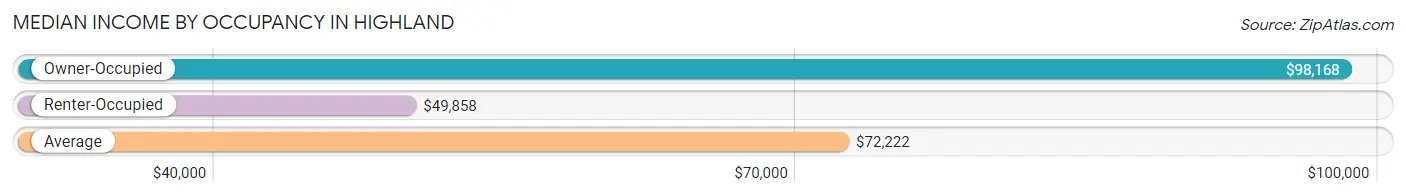
| Occupancy Type | # Households | Median Income |
| Owner-Occupied | 10,923 (66.3%) | $98,168 |
| Renter-Occupied | 5,541 (33.7%) | $49,858 |
| Average | 16,464 (100.0%) | $72,222 |
Occupancy by Householder Income Bracket in Highland
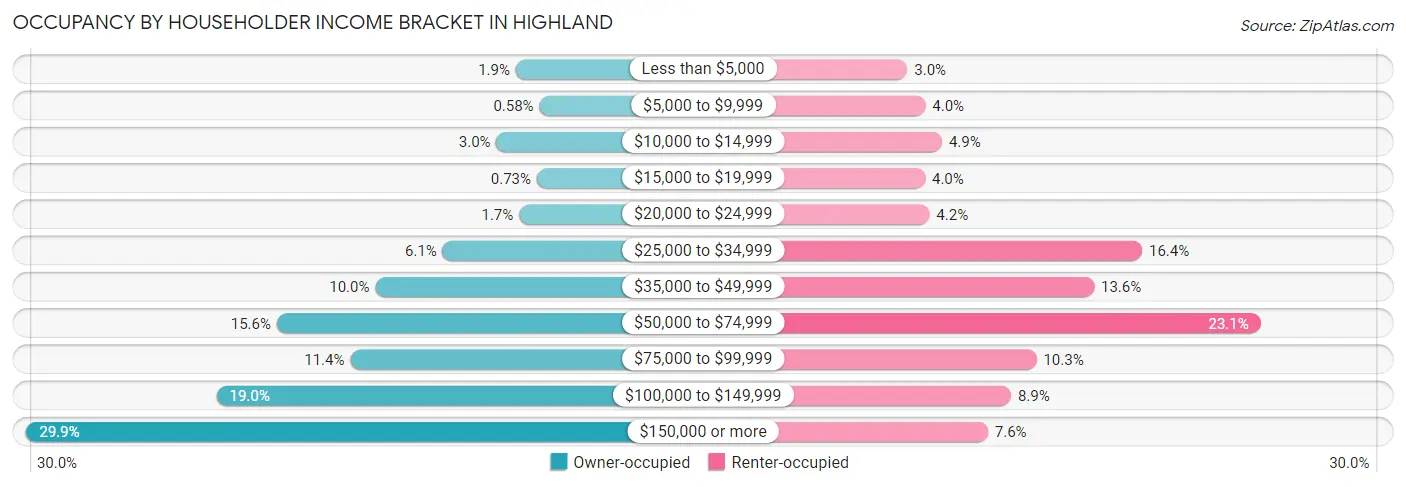
| Income Bracket | Owner-occupied | Renter-occupied |
| Less than $5,000 | 211 (1.9%) | 164 (3.0%) |
| $5,000 to $9,999 | 63 (0.6%) | 221 (4.0%) |
| $10,000 to $14,999 | 332 (3.0%) | 274 (4.9%) |
| $15,000 to $19,999 | 80 (0.7%) | 220 (4.0%) |
| $20,000 to $24,999 | 190 (1.7%) | 234 (4.2%) |
| $25,000 to $34,999 | 667 (6.1%) | 907 (16.4%) |
| $35,000 to $49,999 | 1,088 (10.0%) | 755 (13.6%) |
| $50,000 to $74,999 | 1,703 (15.6%) | 1,282 (23.1%) |
| $75,000 to $99,999 | 1,244 (11.4%) | 573 (10.3%) |
| $100,000 to $149,999 | 2,079 (19.0%) | 492 (8.9%) |
| $150,000 or more | 3,266 (29.9%) | 419 (7.6%) |
| Total | 10,923 (100.0%) | 5,541 (100.0%) |
Monthly Housing Cost Tiers in Highland
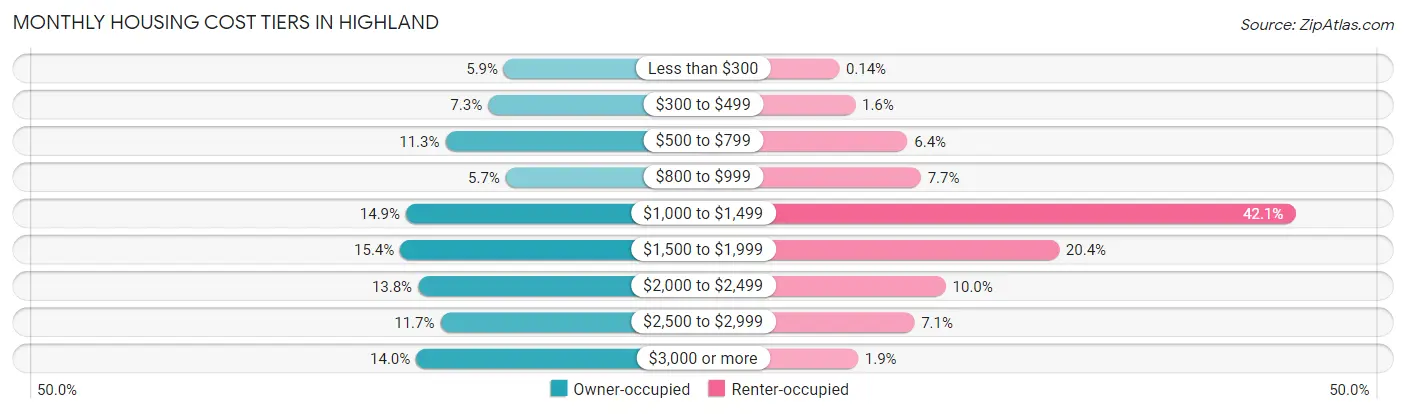
| Monthly Cost | Owner-occupied | Renter-occupied |
| Less than $300 | 642 (5.9%) | 8 (0.1%) |
| $300 to $499 | 802 (7.3%) | 90 (1.6%) |
| $500 to $799 | 1,231 (11.3%) | 357 (6.4%) |
| $800 to $999 | 624 (5.7%) | 425 (7.7%) |
| $1,000 to $1,499 | 1,627 (14.9%) | 2,335 (42.1%) |
| $1,500 to $1,999 | 1,685 (15.4%) | 1,130 (20.4%) |
| $2,000 to $2,499 | 1,506 (13.8%) | 552 (10.0%) |
| $2,500 to $2,999 | 1,281 (11.7%) | 392 (7.1%) |
| $3,000 or more | 1,525 (14.0%) | 104 (1.9%) |
| Total | 10,923 (100.0%) | 5,541 (100.0%) |
Physical Housing Characteristics in Highland
Housing Structures in Highland
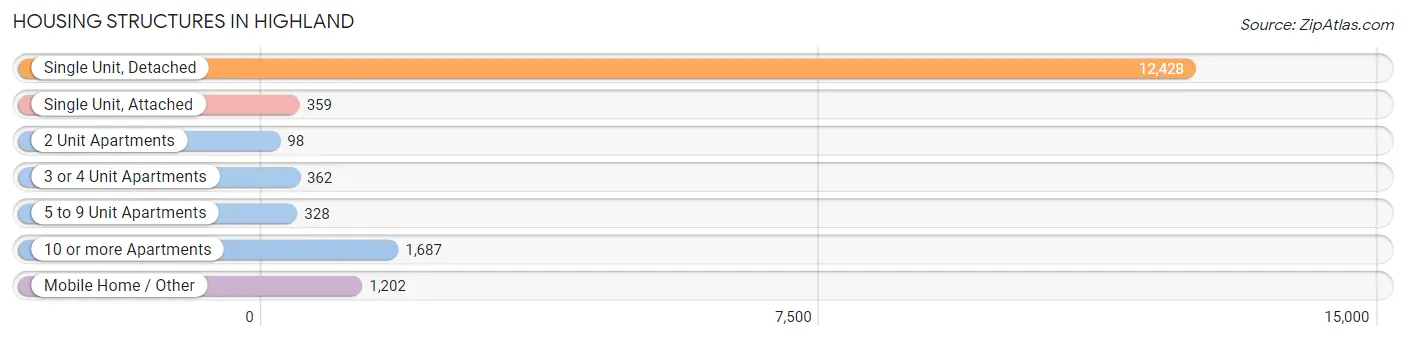
| Structure Type | # Housing Units | % Housing Units |
| Single Unit, Detached | 12,428 | 75.5% |
| Single Unit, Attached | 359 | 2.2% |
| 2 Unit Apartments | 98 | 0.6% |
| 3 or 4 Unit Apartments | 362 | 2.2% |
| 5 to 9 Unit Apartments | 328 | 2.0% |
| 10 or more Apartments | 1,687 | 10.2% |
| Mobile Home / Other | 1,202 | 7.3% |
| Total | 16,464 | 100.0% |
Housing Structures by Occupancy in Highland
| Structure Type | Owner-occupied | Renter-occupied |
| Single Unit, Detached | 9,794 (78.8%) | 2,634 (21.2%) |
| Single Unit, Attached | 176 (49.0%) | 183 (51.0%) |
| 2 Unit Apartments | 0 (0.0%) | 98 (100.0%) |
| 3 or 4 Unit Apartments | 9 (2.5%) | 353 (97.5%) |
| 5 to 9 Unit Apartments | 0 (0.0%) | 328 (100.0%) |
| 10 or more Apartments | 16 (0.9%) | 1,671 (99.1%) |
| Mobile Home / Other | 928 (77.2%) | 274 (22.8%) |
| Total | 10,923 (66.3%) | 5,541 (33.7%) |
Housing Structures by Number of Rooms in Highland
| Number of Rooms | Owner-occupied | Renter-occupied |
| 1 Room | 34 (0.3%) | 160 (2.9%) |
| 2 or 3 Rooms | 361 (3.3%) | 1,056 (19.1%) |
| 4 or 5 Rooms | 3,687 (33.8%) | 2,950 (53.2%) |
| 6 or 7 Rooms | 4,358 (39.9%) | 1,073 (19.4%) |
| 8 or more Rooms | 2,483 (22.7%) | 302 (5.4%) |
| Total | 10,923 (100.0%) | 5,541 (100.0%) |
Housing Structure by Heating Type in Highland
| Heating Type | Owner-occupied | Renter-occupied |
| Utility Gas | 8,468 (77.5%) | 3,222 (58.2%) |
| Bottled, Tank, or LP Gas | 169 (1.5%) | 92 (1.7%) |
| Electricity | 1,926 (17.6%) | 1,848 (33.4%) |
| Fuel Oil or Kerosene | 0 (0.0%) | 0 (0.0%) |
| Coal or Coke | 27 (0.3%) | 0 (0.0%) |
| All other Fuels | 172 (1.6%) | 12 (0.2%) |
| No Fuel Used | 161 (1.5%) | 367 (6.6%) |
| Total | 10,923 (100.0%) | 5,541 (100.0%) |
Household Vehicle Usage in Highland
| Vehicles per Household | Owner-occupied | Renter-occupied |
| No Vehicle | 241 (2.2%) | 440 (7.9%) |
| 1 Vehicle | 1,788 (16.4%) | 1,879 (33.9%) |
| 2 Vehicles | 4,520 (41.4%) | 1,980 (35.7%) |
| 3 or more Vehicles | 4,374 (40.0%) | 1,242 (22.4%) |
| Total | 10,923 (100.0%) | 5,541 (100.0%) |
Real Estate & Mortgages in Highland
Real Estate and Mortgage Overview in Highland
| Characteristic | Without Mortgage | With Mortgage |
| Housing Units | 3,388 | 7,535 |
| Median Property Value | $315,900 | $445,400 |
| Median Household Income | $75,227 | $2,683 |
| Monthly Housing Costs | $563 | $1,512 |
| Real Estate Taxes | $1,887 | $342 |
Property Value by Mortgage Status in Highland
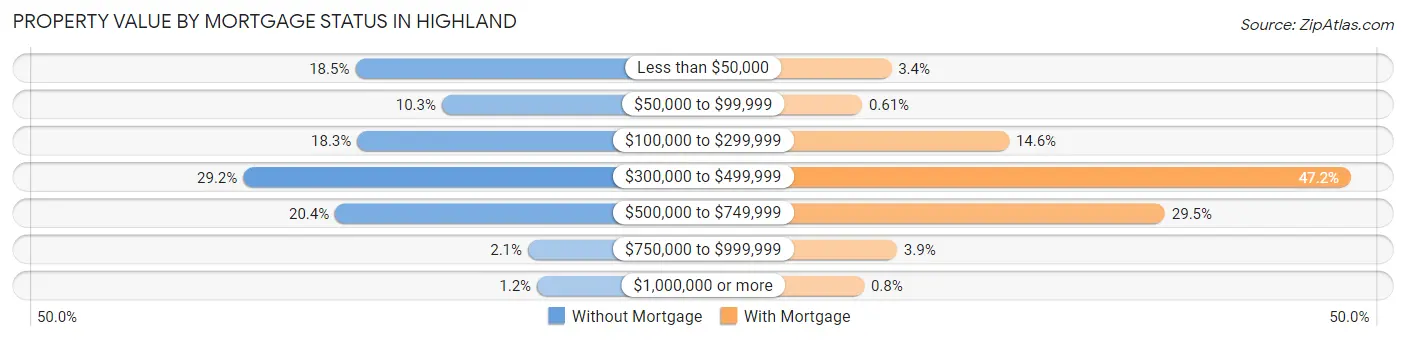
| Property Value | Without Mortgage | With Mortgage |
| Less than $50,000 | 627 (18.5%) | 256 (3.4%) |
| $50,000 to $99,999 | 348 (10.3%) | 46 (0.6%) |
| $100,000 to $299,999 | 621 (18.3%) | 1,101 (14.6%) |
| $300,000 to $499,999 | 989 (29.2%) | 3,555 (47.2%) |
| $500,000 to $749,999 | 692 (20.4%) | 2,220 (29.5%) |
| $750,000 to $999,999 | 70 (2.1%) | 297 (3.9%) |
| $1,000,000 or more | 41 (1.2%) | 60 (0.8%) |
| Total | 3,388 (100.0%) | 7,535 (100.0%) |
Household Income by Mortgage Status in Highland
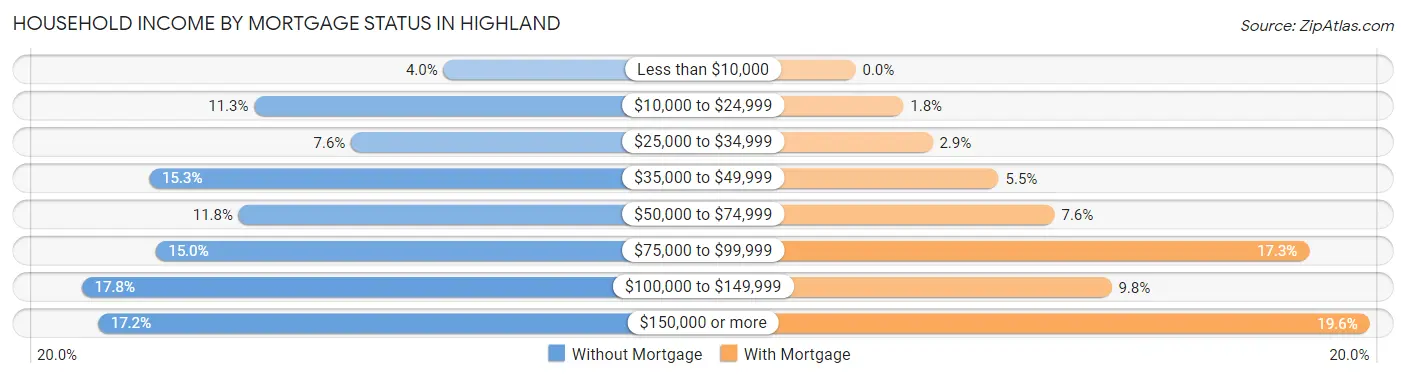
| Household Income | Without Mortgage | With Mortgage |
| Less than $10,000 | 137 (4.0%) | 0 (0.0%) |
| $10,000 to $24,999 | 381 (11.3%) | 137 (1.8%) |
| $25,000 to $34,999 | 256 (7.6%) | 221 (2.9%) |
| $35,000 to $49,999 | 517 (15.3%) | 411 (5.4%) |
| $50,000 to $74,999 | 401 (11.8%) | 571 (7.6%) |
| $75,000 to $99,999 | 509 (15.0%) | 1,302 (17.3%) |
| $100,000 to $149,999 | 604 (17.8%) | 735 (9.8%) |
| $150,000 or more | 583 (17.2%) | 1,475 (19.6%) |
| Total | 3,388 (100.0%) | 7,535 (100.0%) |
Property Value to Household Income Ratio in Highland
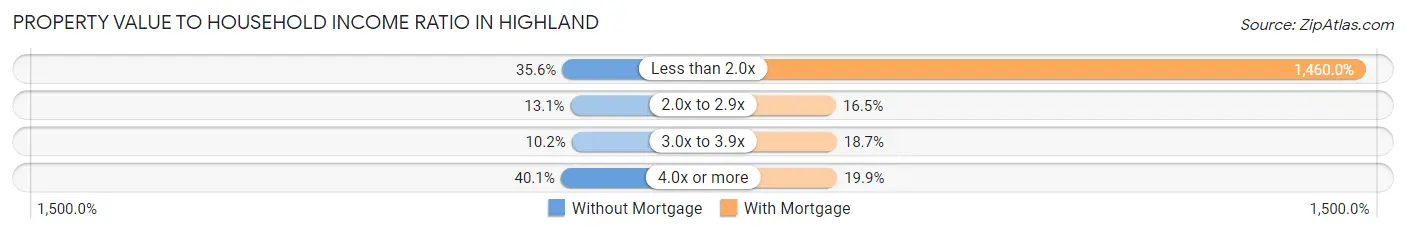
| Value-to-Income Ratio | Without Mortgage | With Mortgage |
| Less than 2.0x | 1,207 (35.6%) | 110,011 (1,460.0%) |
| 2.0x to 2.9x | 445 (13.1%) | 1,240 (16.5%) |
| 3.0x to 3.9x | 346 (10.2%) | 1,412 (18.7%) |
| 4.0x or more | 1,358 (40.1%) | 1,499 (19.9%) |
| Total | 3,388 (100.0%) | 7,535 (100.0%) |
Real Estate Taxes by Mortgage Status in Highland
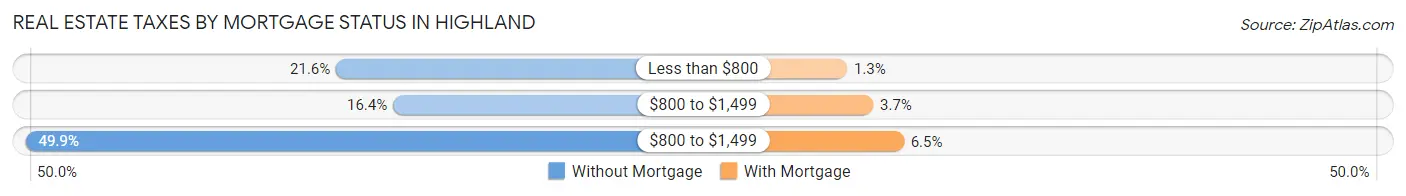
| Property Taxes | Without Mortgage | With Mortgage |
| Less than $800 | 730 (21.5%) | 96 (1.3%) |
| $800 to $1,499 | 554 (16.4%) | 276 (3.7%) |
| $800 to $1,499 | 1,691 (49.9%) | 486 (6.5%) |
| Total | 3,388 (100.0%) | 7,535 (100.0%) |
Health & Disability in Highland
Health Insurance Coverage by Age in Highland
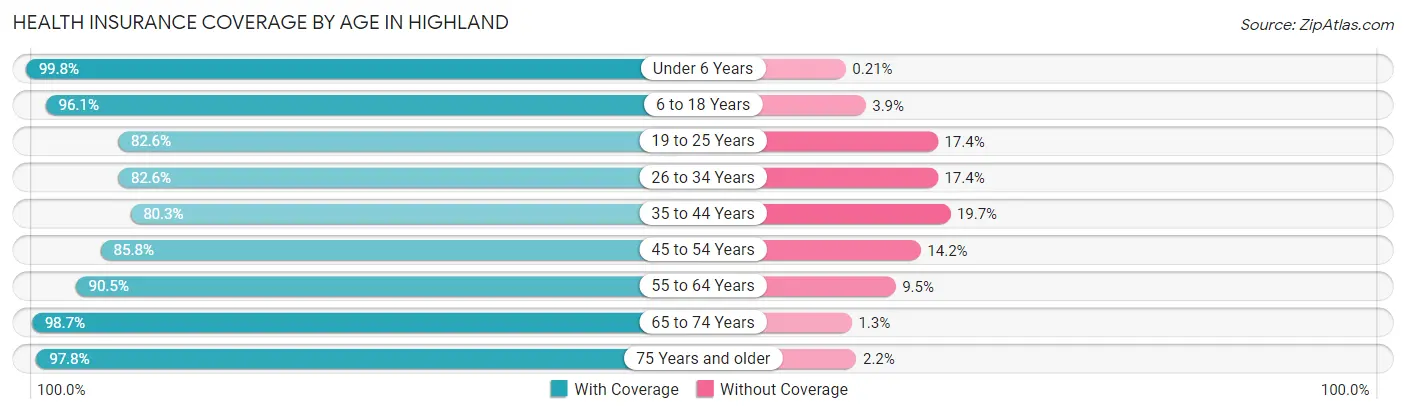
| Age Bracket | With Coverage | Without Coverage |
| Under 6 Years | 5,168 (99.8%) | 11 (0.2%) |
| 6 to 18 Years | 10,836 (96.1%) | 441 (3.9%) |
| 19 to 25 Years | 5,229 (82.6%) | 1,100 (17.4%) |
| 26 to 34 Years | 5,882 (82.6%) | 1,237 (17.4%) |
| 35 to 44 Years | 5,832 (80.3%) | 1,431 (19.7%) |
| 45 to 54 Years | 6,134 (85.8%) | 1,014 (14.2%) |
| 55 to 64 Years | 5,583 (90.5%) | 586 (9.5%) |
| 65 to 74 Years | 3,616 (98.7%) | 49 (1.3%) |
| 75 Years and older | 2,415 (97.8%) | 54 (2.2%) |
| Total | 50,695 (89.5%) | 5,923 (10.5%) |
Health Insurance Coverage by Citizenship Status in Highland
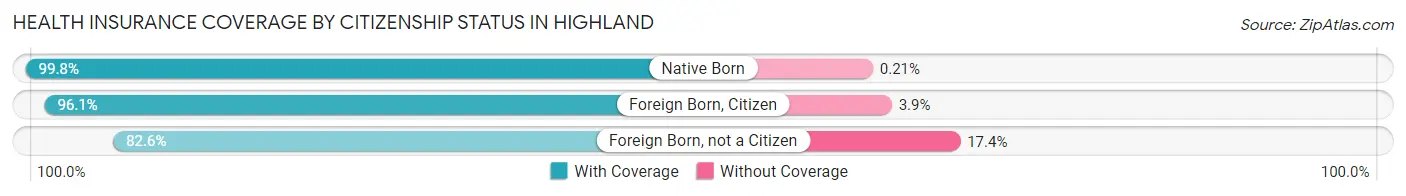
| Citizenship Status | With Coverage | Without Coverage |
| Native Born | 5,168 (99.8%) | 11 (0.2%) |
| Foreign Born, Citizen | 10,836 (96.1%) | 441 (3.9%) |
| Foreign Born, not a Citizen | 5,229 (82.6%) | 1,100 (17.4%) |
Health Insurance Coverage by Household Income in Highland
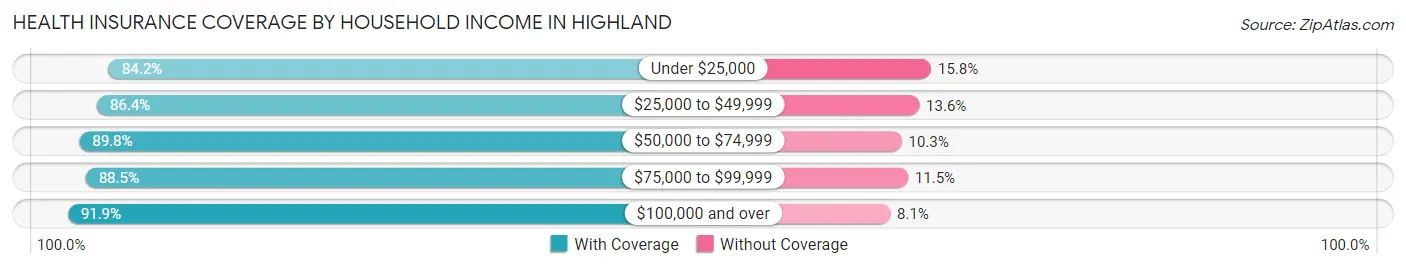
| Household Income | With Coverage | Without Coverage |
| Under $25,000 | 3,752 (84.2%) | 704 (15.8%) |
| $25,000 to $49,999 | 8,969 (86.4%) | 1,407 (13.6%) |
| $50,000 to $74,999 | 9,592 (89.7%) | 1,095 (10.2%) |
| $75,000 to $99,999 | 5,391 (88.5%) | 698 (11.5%) |
| $100,000 and over | 22,889 (91.9%) | 2,019 (8.1%) |
Public vs Private Health Insurance Coverage by Age in Highland
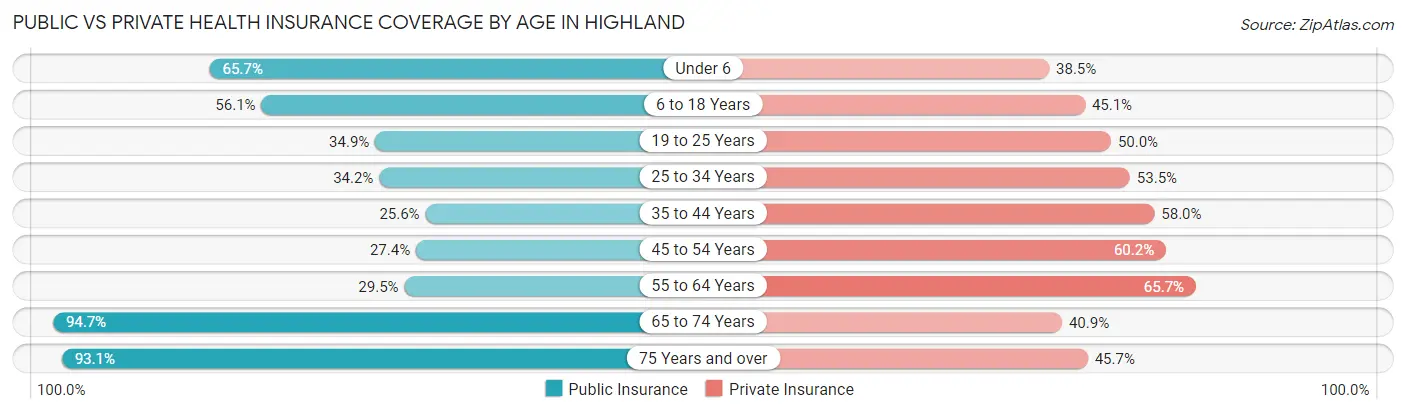
| Age Bracket | Public Insurance | Private Insurance |
| Under 6 | 3,401 (65.7%) | 1,993 (38.5%) |
| 6 to 18 Years | 6,321 (56.0%) | 5,089 (45.1%) |
| 19 to 25 Years | 2,211 (34.9%) | 3,162 (50.0%) |
| 25 to 34 Years | 2,433 (34.2%) | 3,807 (53.5%) |
| 35 to 44 Years | 1,859 (25.6%) | 4,214 (58.0%) |
| 45 to 54 Years | 1,955 (27.4%) | 4,301 (60.2%) |
| 55 to 64 Years | 1,820 (29.5%) | 4,054 (65.7%) |
| 65 to 74 Years | 3,472 (94.7%) | 1,498 (40.9%) |
| 75 Years and over | 2,299 (93.1%) | 1,127 (45.7%) |
| Total | 25,771 (45.5%) | 29,245 (51.6%) |
Disability Status by Sex by Age in Highland
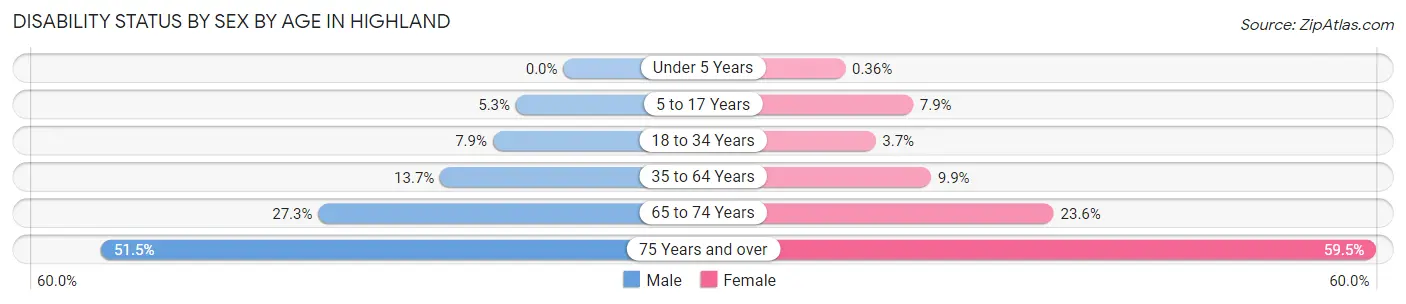
| Age Bracket | Male | Female |
| Under 5 Years | 0 (0.0%) | 8 (0.4%) |
| 5 to 17 Years | 307 (5.3%) | 440 (7.9%) |
| 18 to 34 Years | 565 (7.9%) | 263 (3.7%) |
| 35 to 64 Years | 1,400 (13.7%) | 1,029 (9.9%) |
| 65 to 74 Years | 483 (27.3%) | 447 (23.6%) |
| 75 Years and over | 559 (51.5%) | 823 (59.5%) |
Disability Class by Sex by Age in Highland
Disability Class: Hearing Difficulty
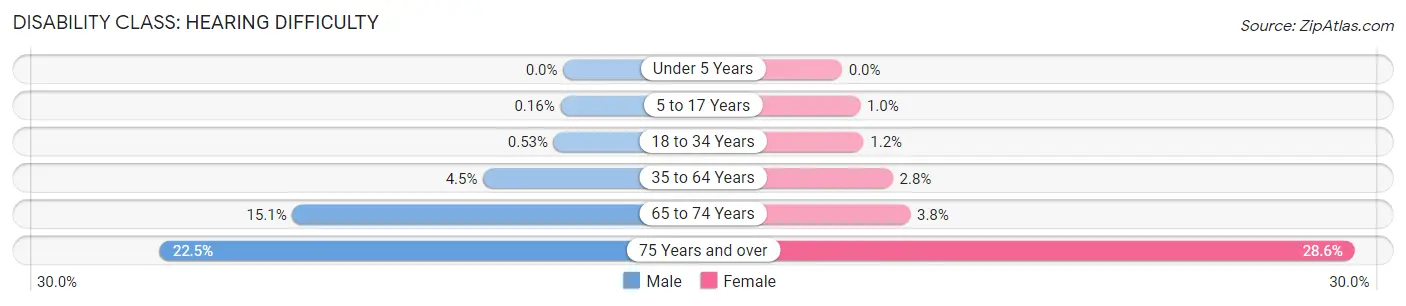
| Age Bracket | Male | Female |
| Under 5 Years | 0 (0.0%) | 0 (0.0%) |
| 5 to 17 Years | 9 (0.2%) | 56 (1.0%) |
| 18 to 34 Years | 38 (0.5%) | 84 (1.2%) |
| 35 to 64 Years | 455 (4.5%) | 294 (2.8%) |
| 65 to 74 Years | 267 (15.1%) | 72 (3.8%) |
| 75 Years and over | 244 (22.5%) | 395 (28.6%) |
Disability Class: Vision Difficulty
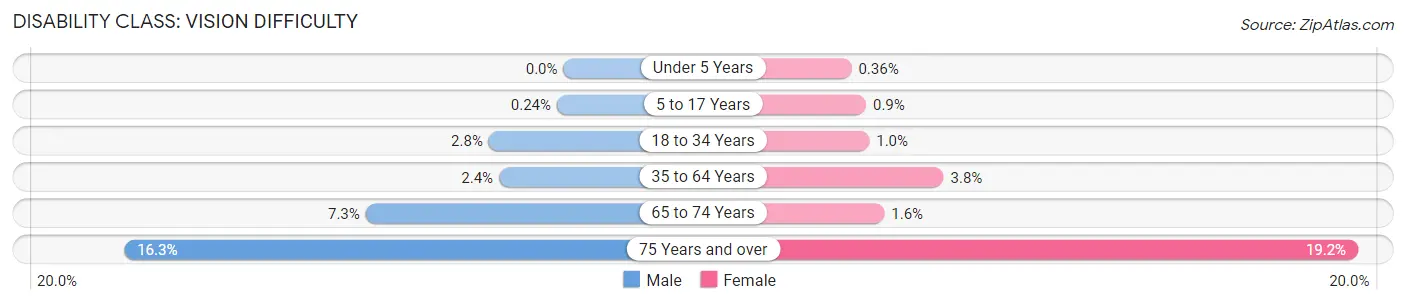
| Age Bracket | Male | Female |
| Under 5 Years | 0 (0.0%) | 8 (0.4%) |
| 5 to 17 Years | 14 (0.2%) | 50 (0.9%) |
| 18 to 34 Years | 199 (2.8%) | 72 (1.0%) |
| 35 to 64 Years | 244 (2.4%) | 392 (3.8%) |
| 65 to 74 Years | 130 (7.3%) | 30 (1.6%) |
| 75 Years and over | 177 (16.3%) | 265 (19.2%) |
Disability Class: Cognitive Difficulty
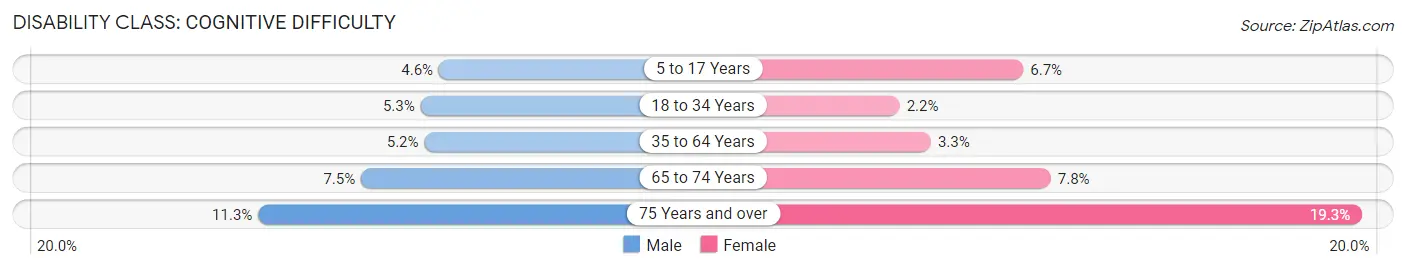
| Age Bracket | Male | Female |
| 5 to 17 Years | 268 (4.6%) | 375 (6.7%) |
| 18 to 34 Years | 381 (5.3%) | 151 (2.1%) |
| 35 to 64 Years | 526 (5.2%) | 344 (3.3%) |
| 65 to 74 Years | 133 (7.5%) | 147 (7.8%) |
| 75 Years and over | 123 (11.3%) | 267 (19.3%) |
Disability Class: Ambulatory Difficulty
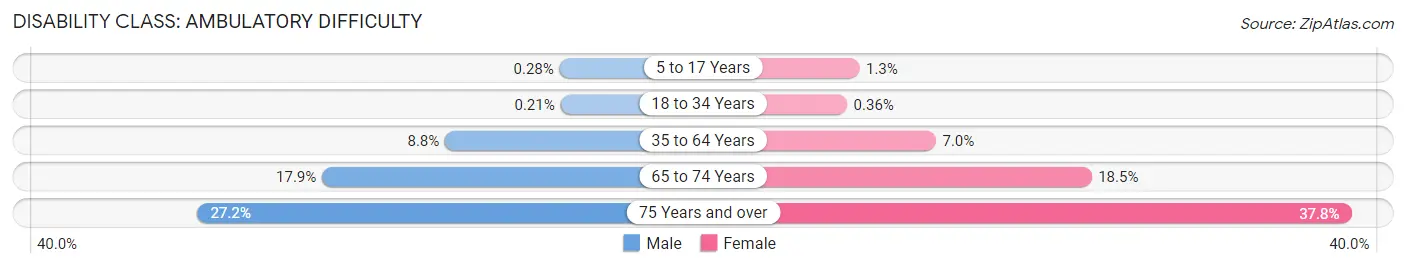
| Age Bracket | Male | Female |
| 5 to 17 Years | 16 (0.3%) | 71 (1.3%) |
| 18 to 34 Years | 15 (0.2%) | 25 (0.4%) |
| 35 to 64 Years | 896 (8.8%) | 722 (7.0%) |
| 65 to 74 Years | 317 (17.9%) | 351 (18.5%) |
| 75 Years and over | 295 (27.2%) | 523 (37.8%) |
Disability Class: Self-Care Difficulty
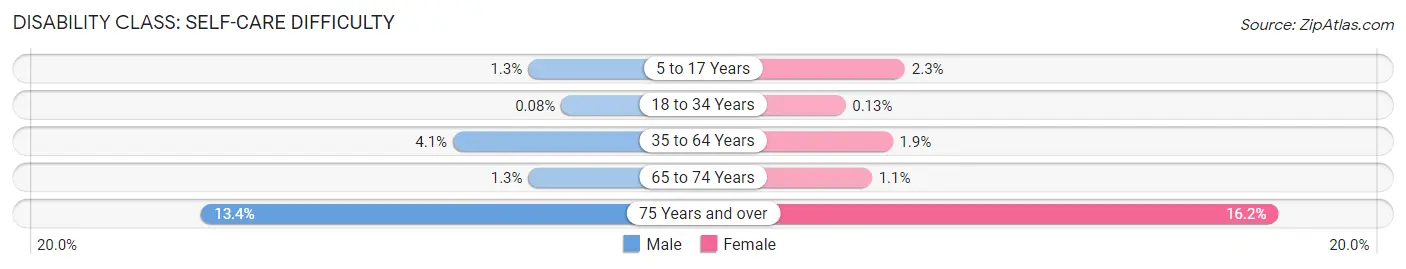
| Age Bracket | Male | Female |
| 5 to 17 Years | 76 (1.3%) | 130 (2.3%) |
| 18 to 34 Years | 6 (0.1%) | 9 (0.1%) |
| 35 to 64 Years | 418 (4.1%) | 195 (1.9%) |
| 65 to 74 Years | 23 (1.3%) | 21 (1.1%) |
| 75 Years and over | 146 (13.4%) | 224 (16.2%) |
Technology Access in Highland
Computing Device Access in Highland
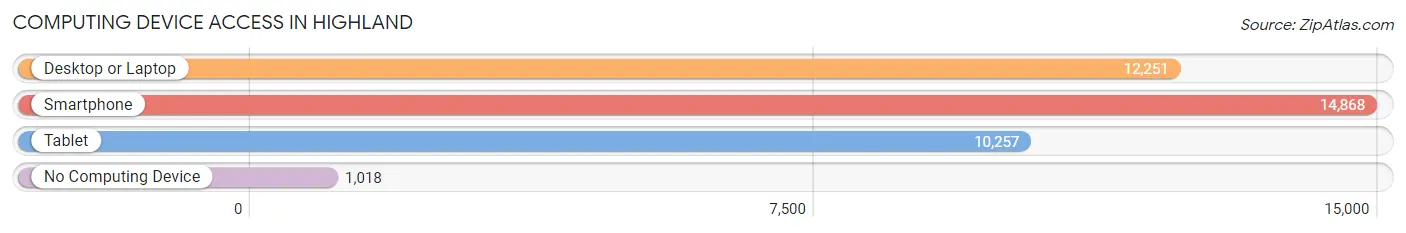
| Device Type | # Households | % Households |
| Desktop or Laptop | 12,251 | 74.4% |
| Smartphone | 14,868 | 90.3% |
| Tablet | 10,257 | 62.3% |
| No Computing Device | 1,018 | 6.2% |
| Total | 16,464 | 100.0% |
Internet Access in Highland
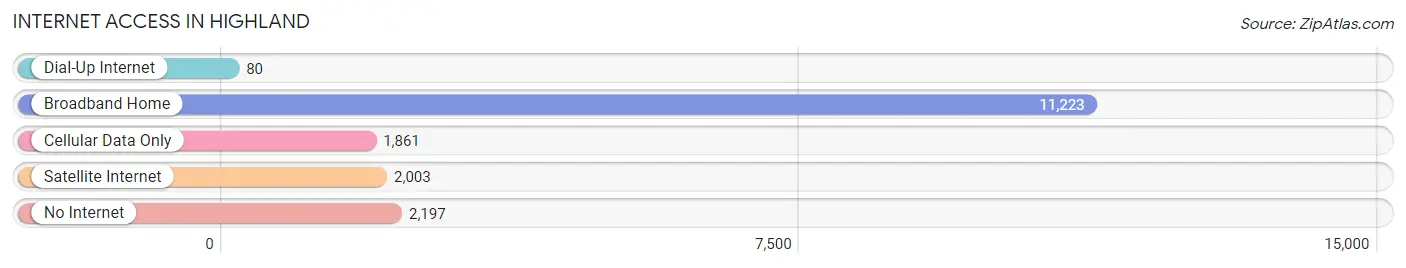
| Internet Type | # Households | % Households |
| Dial-Up Internet | 80 | 0.5% |
| Broadband Home | 11,223 | 68.2% |
| Cellular Data Only | 1,861 | 11.3% |
| Satellite Internet | 2,003 | 12.2% |
| No Internet | 2,197 | 13.3% |
| Total | 16,464 | 100.0% |
Highland Summary
Highland is a city located in San Bernardino County, California, United States. The city is situated at the eastern edge of the San Bernardino Mountains, and is part of the Inland Empire region. As of the 2010 census, the city had a population of 53,104, up from 44,605 at the 2000 census.
Geography
Highland is located at 34°7′6″N 117°12′9″W (34.118333, -117.202500). According to the United States Census Bureau, the city has a total area of 18.9 square miles (49.0 km2), all of it land.
Highland is located at the eastern edge of the San Bernardino Mountains. The city is bordered by the cities of Redlands to the east, San Bernardino to the south, and Loma Linda to the west. The city is also bordered by the San Bernardino National Forest to the north.
Economy
Highland is home to a variety of businesses, including retail stores, restaurants, and professional services. The city is also home to several industrial parks, which provide employment opportunities for many of the city’s residents.
The city is also home to the San Manuel Indian Bingo and Casino, which is one of the largest employers in the city. The casino is owned and operated by the San Manuel Band of Mission Indians, and is located on the San Manuel Indian Reservation.
Demographics
As of the 2010 census, there were 53,104 people, 17,844 households, and 13,845 families residing in the city. The population density was 2,811.2 people per square mile (1,086.7/km2). There were 19,068 housing units at an average density of 1,001.3 per square mile (386.2/km2). The racial makeup of the city was 68.2% White, 4.2% African American, 1.2% Native American, 2.4% Asian, 0.3% Pacific Islander, 20.3% from other races, and 3.5% from two or more races. Hispanic or Latino of any race were 44.2% of the population.
There were 17,844 households, out of which 40.2% had children under the age of 18 living with them, 54.2% were married couples living together, 14.7% had a female householder with no husband present, and 24.2% were non-families. 19.2% of all households were made up of individuals, and 6.2% had someone living alone who was 65 years of age or older. The average household size was 2.97 and the average family size was 3.41.
In the city, the population was spread out, with 30.2% under the age of 18, 9.3% from 18 to 24, 30.6% from 25 to 44, 20.3% from 45 to 64, and 9.6% who were 65 years of age or older. The median age was 32 years. For every 100 females, there were 95.1 males. For every 100 females age 18 and over, there were 91.3 males.
The median income for a household in the city was $45,902, and the median income for a family was $50,945. Males had a median income of $37,853 versus $30,917 for females. The per capita income for the city was $19,945. About 10.2% of families and 12.7% of the population were below the poverty line, including 17.2% of those under age 18 and 7.2% of those age 65 or over.
Common Questions
What is Per Capita Income in Highland?
Per Capita income in Highland is $33,187.
What is the Median Family Income in Highland?
Median Family Income in Highland is $80,073.
What is the Median Household income in Highland?
Median Household Income in Highland is $72,222.
What is Income or Wage Gap in Highland?
Income or Wage Gap in Highland is 22.4%.
Women in Highland earn 77.6 cents for every dollar earned by a man.
What is Family Income Deficit in Highland?
Family Income Deficit in Highland is $12,752.
Families that are below poverty line in Highland earn $12,752 less on average than the poverty threshold level.
What is Inequality or Gini Index in Highland?
Inequality or Gini Index in Highland is 0.46.
What is the Total Population of Highland?
Total Population of Highland is 56,789.
What is the Total Male Population of Highland?
Total Male Population of Highland is 28,230.
What is the Total Female Population of Highland?
Total Female Population of Highland is 28,559.
What is the Ratio of Males per 100 Females in Highland?
There are 98.85 Males per 100 Females in Highland.
What is the Ratio of Females per 100 Males in Highland?
There are 101.17 Females per 100 Males in Highland.
What is the Median Population Age in Highland?
Median Population Age in Highland is 33.0 Years.
What is the Average Family Size in Highland
Average Family Size in Highland is 3.7 People.
What is the Average Household Size in Highland
Average Household Size in Highland is 3.4 People.
How Large is the Labor Force in Highland?
There are 27,024 People in the Labor Forcein in Highland.
What is the Percentage of People in the Labor Force in Highland?
63.0% of People are in the Labor Force in Highland.
What is the Unemployment Rate in Highland?
Unemployment Rate in Highland is 6.0%.