Healdsburg, CA Map & Demographics
Healdsburg Map
Healdsburg Overview
$56,833
PER CAPITA INCOME
$116,849
AVG FAMILY INCOME
$94,799
AVG HOUSEHOLD INCOME
26.6%
WAGE / INCOME GAP [ % ]
73.4¢/ $1
WAGE / INCOME GAP [ $ ]
0.48
INEQUALITY / GINI INDEX
11,481
TOTAL POPULATION
5,381
MALE POPULATION
6,100
FEMALE POPULATION
88.21
MALES / 100 FEMALES
113.36
FEMALES / 100 MALES
48.5
MEDIAN AGE
2.8
AVG FAMILY SIZE
2.4
AVG HOUSEHOLD SIZE
5,872
LABOR FORCE [ PEOPLE ]
59.3%
PERCENT IN LABOR FORCE
6.1%
UNEMPLOYMENT RATE
Healdsburg Zip Codes
Healdsburg Area Codes
Income in Healdsburg
Income Overview in Healdsburg
Per Capita Income in Healdsburg is $56,833, while median incomes of families and households are $116,849 and $94,799 respectively.
| Characteristic | Number | Measure |
| Per Capita Income | 11,481 | $56,833 |
| Median Family Income | 3,149 | $116,849 |
| Mean Family Income | 3,149 | $151,501 |
| Median Household Income | 4,838 | $94,799 |
| Mean Household Income | 4,838 | $131,460 |
| Income Deficit | 3,149 | $0 |
| Wage / Income Gap (%) | 11,481 | 26.61% |
| Wage / Income Gap ($) | 11,481 | 73.39¢ per $1 |
| Gini / Inequality Index | 11,481 | 0.48 |
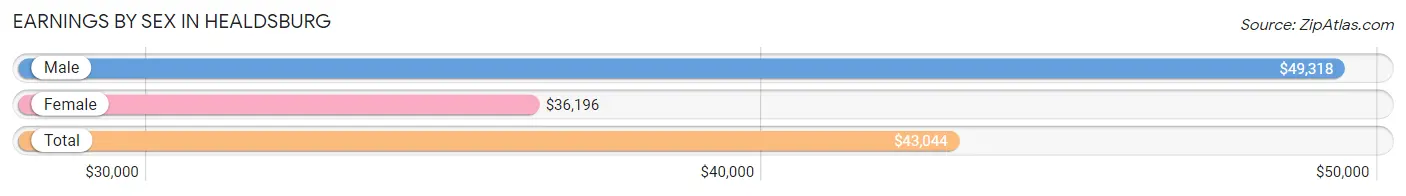
Earnings by Sex in Healdsburg
Average Earnings in Healdsburg are $43,044, $49,318 for men and $36,196 for women, a difference of 26.6%.
| Sex | Number | Average Earnings |
| Male | 3,148 (51.1%) | $49,318 |
| Female | 3,013 (48.9%) | $36,196 |
| Total | 6,161 (100.0%) | $43,044 |
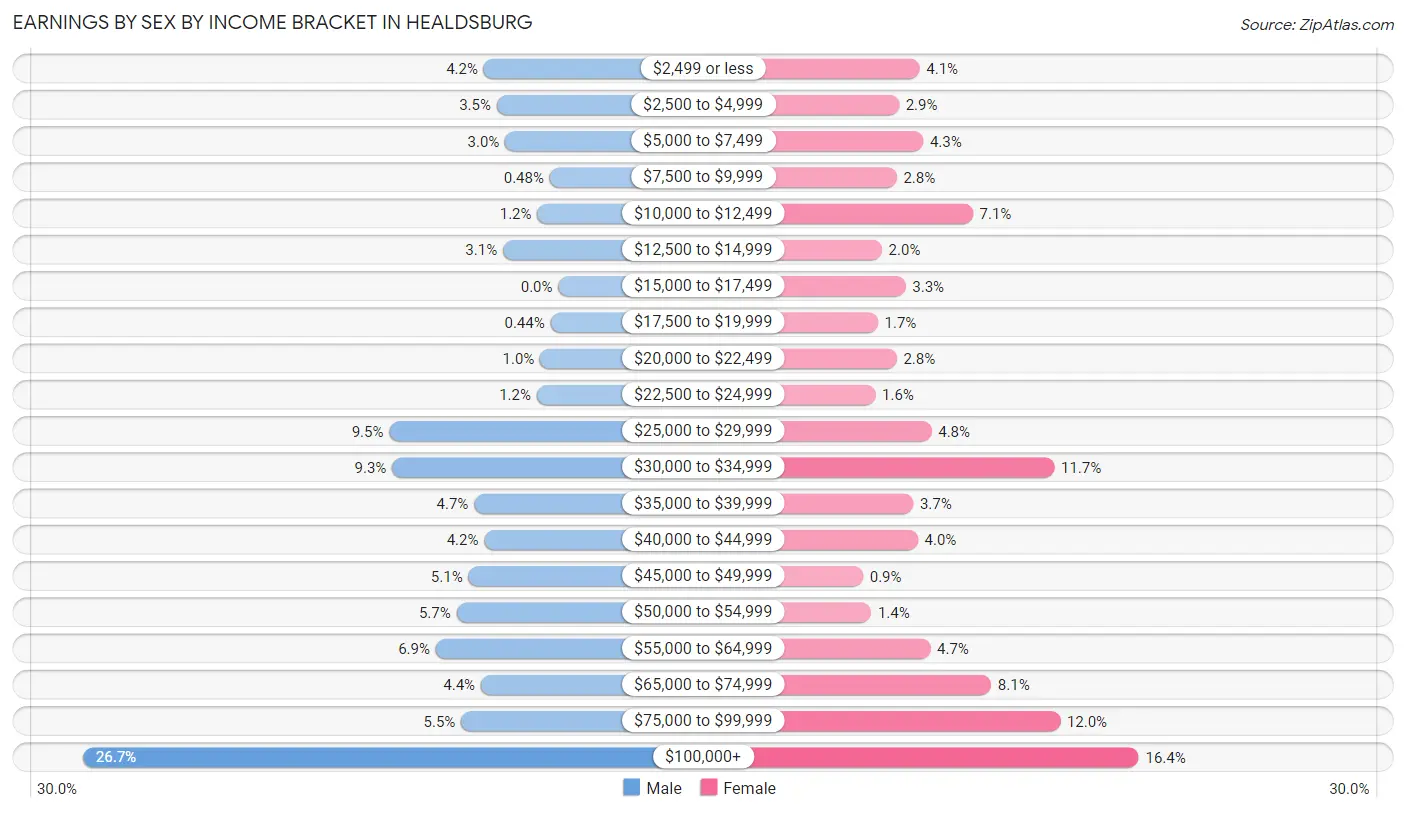
Earnings by Sex by Income Bracket in Healdsburg
The most common earnings brackets in Healdsburg are $100,000+ for men (841 | 26.7%) and $100,000+ for women (494 | 16.4%).
| Income | Male | Female |
| $2,499 or less | 132 (4.2%) | 123 (4.1%) |
| $2,500 to $4,999 | 109 (3.5%) | 88 (2.9%) |
| $5,000 to $7,499 | 94 (3.0%) | 129 (4.3%) |
| $7,500 to $9,999 | 15 (0.5%) | 84 (2.8%) |
| $10,000 to $12,499 | 37 (1.2%) | 213 (7.1%) |
| $12,500 to $14,999 | 98 (3.1%) | 59 (2.0%) |
| $15,000 to $17,499 | 0 (0.0%) | 99 (3.3%) |
| $17,500 to $19,999 | 14 (0.4%) | 52 (1.7%) |
| $20,000 to $22,499 | 32 (1.0%) | 84 (2.8%) |
| $22,500 to $24,999 | 38 (1.2%) | 48 (1.6%) |
| $25,000 to $29,999 | 299 (9.5%) | 143 (4.8%) |
| $30,000 to $34,999 | 294 (9.3%) | 351 (11.7%) |
| $35,000 to $39,999 | 149 (4.7%) | 112 (3.7%) |
| $40,000 to $44,999 | 131 (4.2%) | 120 (4.0%) |
| $45,000 to $49,999 | 159 (5.1%) | 27 (0.9%) |
| $50,000 to $54,999 | 180 (5.7%) | 41 (1.4%) |
| $55,000 to $64,999 | 217 (6.9%) | 141 (4.7%) |
| $65,000 to $74,999 | 137 (4.3%) | 244 (8.1%) |
| $75,000 to $99,999 | 172 (5.5%) | 361 (12.0%) |
| $100,000+ | 841 (26.7%) | 494 (16.4%) |
| Total | 3,148 (100.0%) | 3,013 (100.0%) |
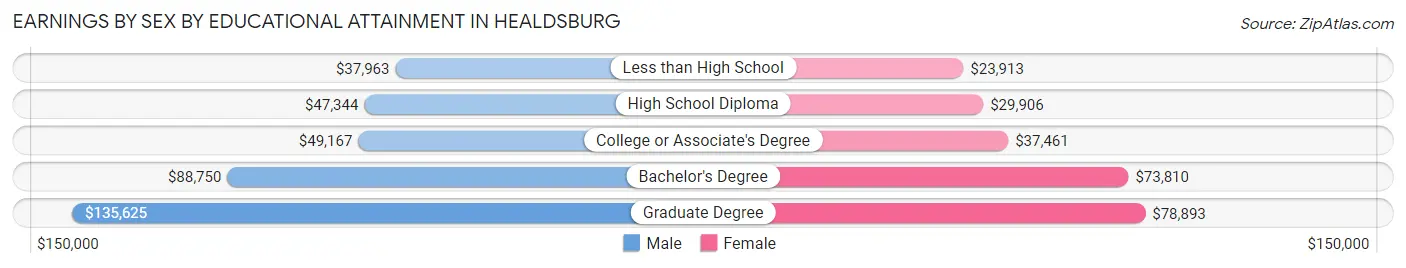
Earnings by Sex by Educational Attainment in Healdsburg
Average earnings in Healdsburg are $53,938 for men and $51,042 for women, a difference of 5.4%. Men with an educational attainment of graduate degree enjoy the highest average annual earnings of $135,625, while those with less than high school education earn the least with $37,963. Women with an educational attainment of graduate degree earn the most with the average annual earnings of $78,893, while those with less than high school education have the smallest earnings of $23,913.
| Educational Attainment | Male Income | Female Income |
| Less than High School | $37,963 | $23,913 |
| High School Diploma | $47,344 | $29,906 |
| College or Associate's Degree | $49,167 | $37,461 |
| Bachelor's Degree | $88,750 | $73,810 |
| Graduate Degree | $135,625 | $78,893 |
| Total | $53,938 | $51,042 |
Family Income in Healdsburg
Family Income Brackets in Healdsburg
According to the Healdsburg family income data, there are 709 families falling into the $200,000+ income range, which is the most common income bracket and makes up 22.5% of all families. Conversely, the $10,000 to $14,999 income bracket is the least frequent group with only 9 families (0.3%) belonging to this category.
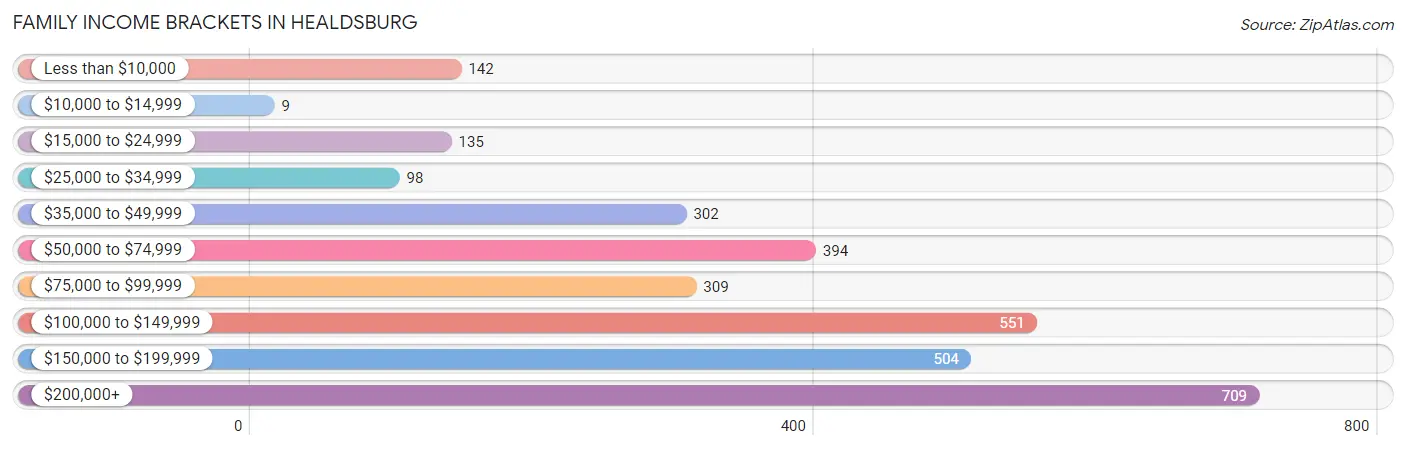
| Income Bracket | # Families | % Families |
| Less than $10,000 | 142 | 4.5% |
| $10,000 to $14,999 | 9 | 0.3% |
| $15,000 to $24,999 | 135 | 4.3% |
| $25,000 to $34,999 | 98 | 3.1% |
| $35,000 to $49,999 | 302 | 9.6% |
| $50,000 to $74,999 | 394 | 12.5% |
| $75,000 to $99,999 | 309 | 9.8% |
| $100,000 to $149,999 | 551 | 17.5% |
| $150,000 to $199,999 | 504 | 16.0% |
| $200,000+ | 709 | 22.5% |
Family Income by Famaliy Size in Healdsburg
4-person families (547 | 17.4%) account for the highest median family income in Healdsburg with $134,297 per family, while 2-person families (1,830 | 58.1%) have the highest median income of $56,979 per family member.
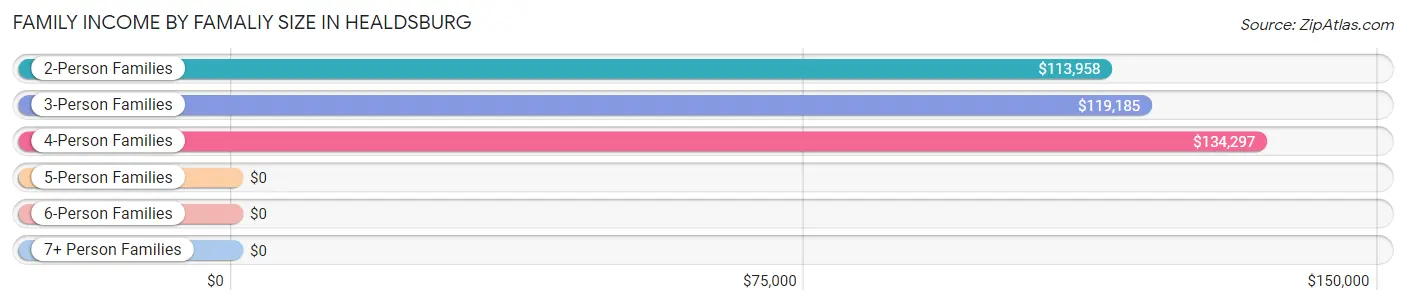
| Income Bracket | # Families | Median Income |
| 2-Person Families | 1,830 (58.1%) | $113,958 |
| 3-Person Families | 559 (17.7%) | $119,185 |
| 4-Person Families | 547 (17.4%) | $134,297 |
| 5-Person Families | 183 (5.8%) | $0 |
| 6-Person Families | 20 (0.6%) | $0 |
| 7+ Person Families | 10 (0.3%) | $0 |
| Total | 3,149 (100.0%) | $116,849 |
Family Income by Number of Earners in Healdsburg
The median family income in Healdsburg is $116,849, with families comprising 3+ earners (322) having the highest median family income of $151,400, while families with no earners (605) have the lowest median family income of $67,718, accounting for 10.2% and 19.2% of families, respectively.
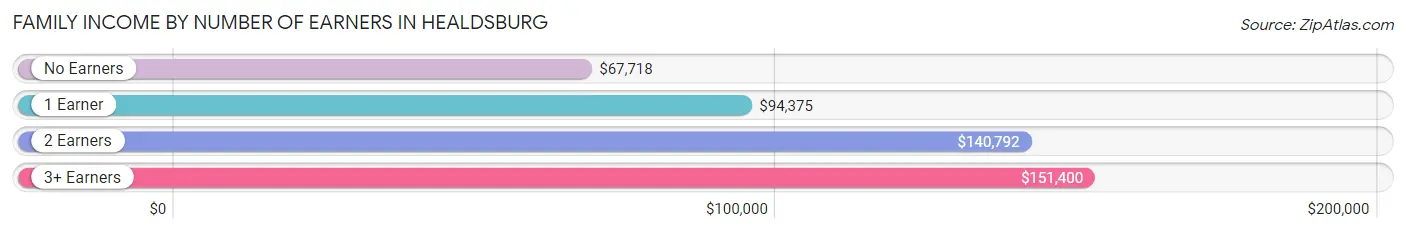
| Number of Earners | # Families | Median Income |
| No Earners | 605 (19.2%) | $67,718 |
| 1 Earner | 1,055 (33.5%) | $94,375 |
| 2 Earners | 1,167 (37.1%) | $140,792 |
| 3+ Earners | 322 (10.2%) | $151,400 |
| Total | 3,149 (100.0%) | $116,849 |
Household Income in Healdsburg
Household Income Brackets in Healdsburg
With 847 households falling in the category, the $200,000+ income range is the most frequent in Healdsburg, accounting for 17.5% of all households. In contrast, only 82 households (1.7%) fall into the $10,000 to $14,999 income bracket, making it the least populous group.
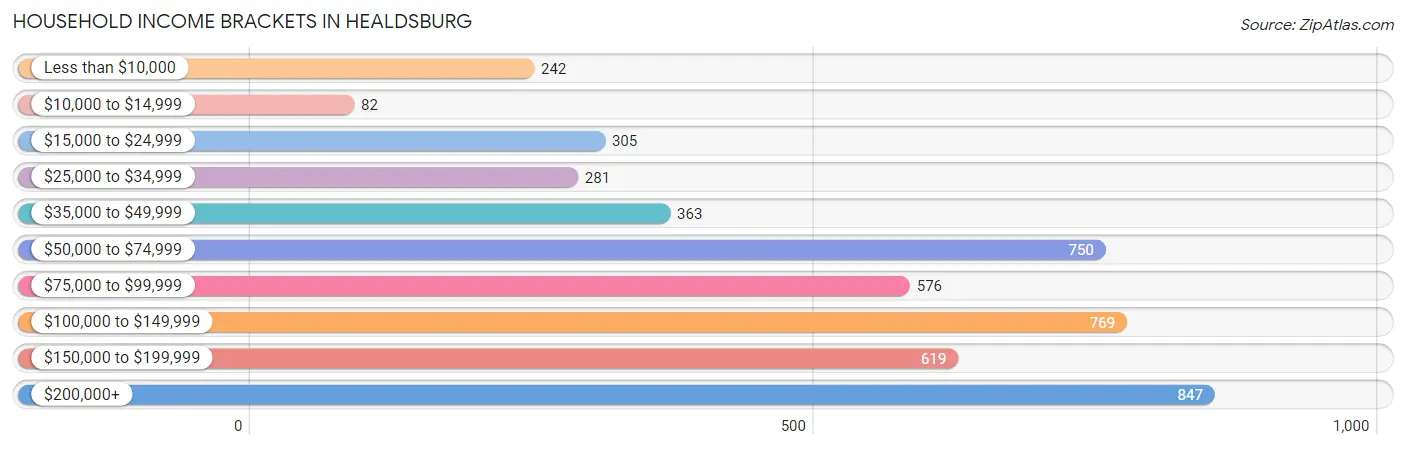
| Income Bracket | # Households | % Households |
| Less than $10,000 | 242 | 5.0% |
| $10,000 to $14,999 | 82 | 1.7% |
| $15,000 to $24,999 | 305 | 6.3% |
| $25,000 to $34,999 | 281 | 5.8% |
| $35,000 to $49,999 | 363 | 7.5% |
| $50,000 to $74,999 | 750 | 15.5% |
| $75,000 to $99,999 | 576 | 11.9% |
| $100,000 to $149,999 | 769 | 15.9% |
| $150,000 to $199,999 | 619 | 12.8% |
| $200,000+ | 847 | 17.5% |
Household Income by Householder Age in Healdsburg
The median household income in Healdsburg is $94,799, with the highest median household income of $124,167 found in the 45 to 64 years age bracket for the primary householder. A total of 1,652 households (34.2%) fall into this category. Meanwhile, the 15 to 24 years age bracket for the primary householder has the lowest median household income of $0, with 229 households (4.7%) in this group.
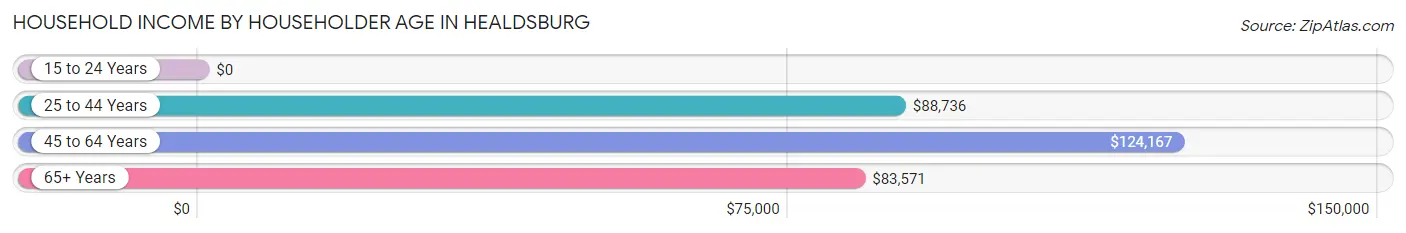
| Income Bracket | # Households | Median Income |
| 15 to 24 Years | 229 (4.7%) | $0 |
| 25 to 44 Years | 1,045 (21.6%) | $88,736 |
| 45 to 64 Years | 1,652 (34.2%) | $124,167 |
| 65+ Years | 1,912 (39.5%) | $83,571 |
| Total | 4,838 (100.0%) | $94,799 |
Poverty in Healdsburg
Income Below Poverty by Sex and Age in Healdsburg
With 8.4% poverty level for males and 12.9% for females among the residents of Healdsburg, 55 to 64 year old males and 5 year old females are the most vulnerable to poverty, with 222 males (28.4%) and 55 females (87.3%) in their respective age groups living below the poverty level.
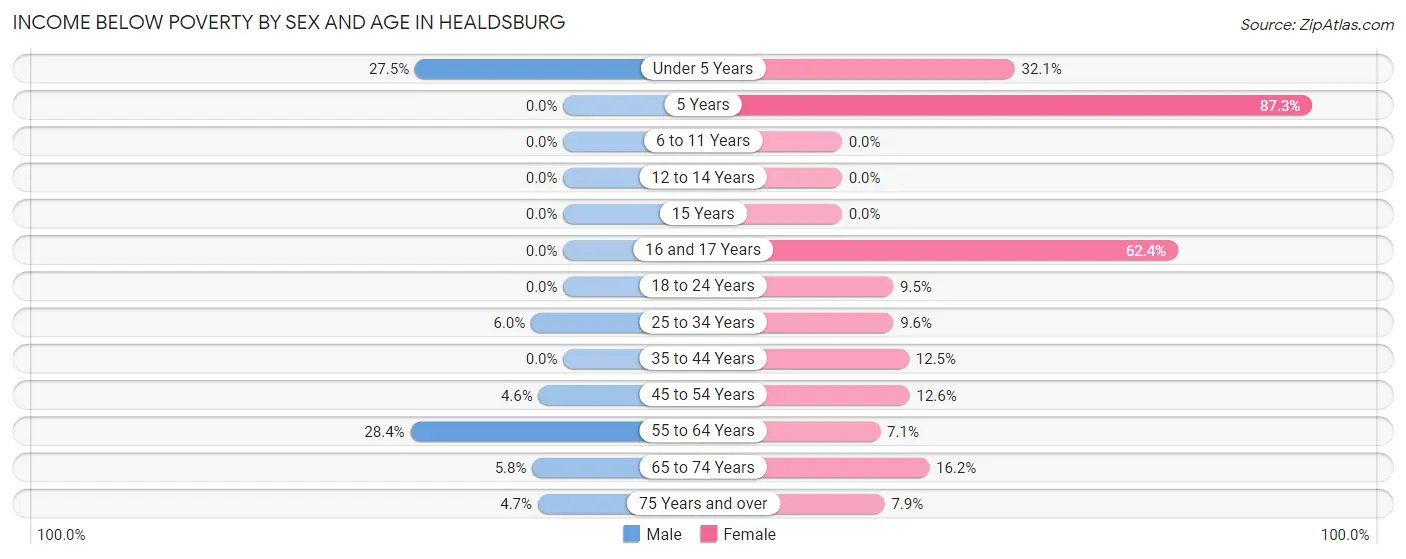
| Age Bracket | Male | Female |
| Under 5 Years | 76 (27.5%) | 84 (32.1%) |
| 5 Years | 0 (0.0%) | 55 (87.3%) |
| 6 to 11 Years | 0 (0.0%) | 0 (0.0%) |
| 12 to 14 Years | 0 (0.0%) | 0 (0.0%) |
| 15 Years | 0 (0.0%) | 0 (0.0%) |
| 16 and 17 Years | 0 (0.0%) | 73 (62.4%) |
| 18 to 24 Years | 0 (0.0%) | 54 (9.5%) |
| 25 to 34 Years | 44 (6.0%) | 37 (9.6%) |
| 35 to 44 Years | 0 (0.0%) | 101 (12.4%) |
| 45 to 54 Years | 26 (4.6%) | 90 (12.6%) |
| 55 to 64 Years | 222 (28.4%) | 64 (7.1%) |
| 65 to 74 Years | 64 (5.8%) | 180 (16.2%) |
| 75 Years and over | 16 (4.7%) | 46 (7.9%) |
| Total | 448 (8.4%) | 784 (12.9%) |
Income Above Poverty by Sex and Age in Healdsburg
According to the poverty statistics in Healdsburg, males aged 5 years and females aged 6 to 11 years are the age groups that are most secure financially, with 100.0% of males and 100.0% of females in these age groups living above the poverty line.
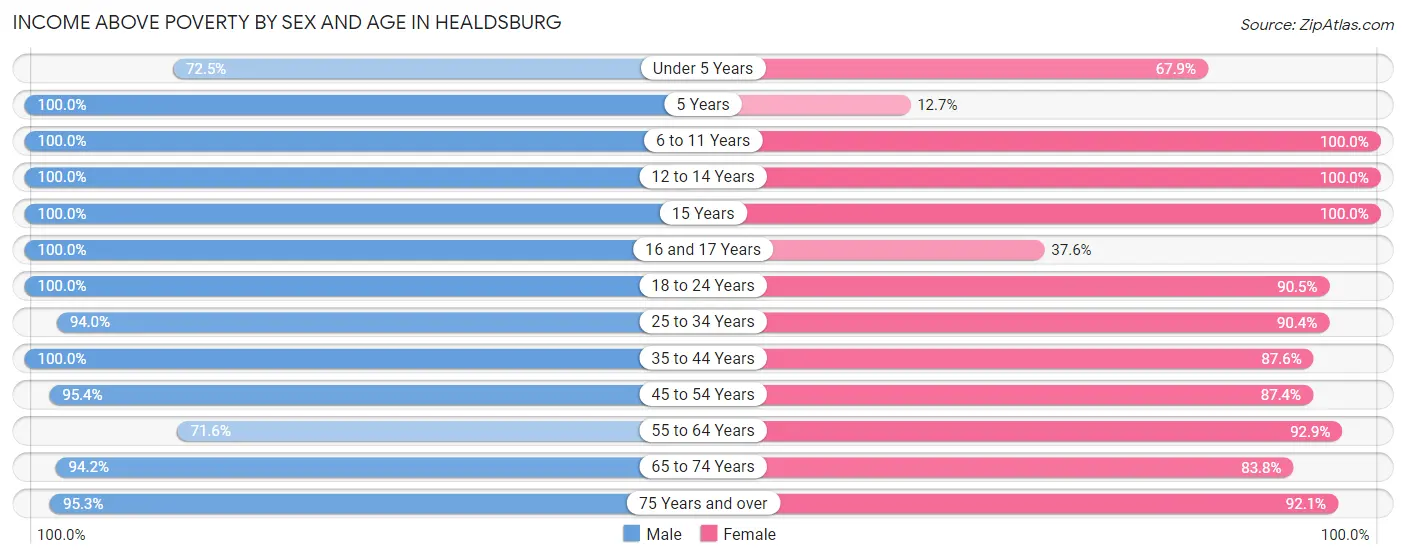
| Age Bracket | Male | Female |
| Under 5 Years | 200 (72.5%) | 178 (67.9%) |
| 5 Years | 57 (100.0%) | 8 (12.7%) |
| 6 to 11 Years | 143 (100.0%) | 271 (100.0%) |
| 12 to 14 Years | 163 (100.0%) | 200 (100.0%) |
| 15 Years | 51 (100.0%) | 92 (100.0%) |
| 16 and 17 Years | 104 (100.0%) | 44 (37.6%) |
| 18 to 24 Years | 485 (100.0%) | 513 (90.5%) |
| 25 to 34 Years | 692 (94.0%) | 350 (90.4%) |
| 35 to 44 Years | 537 (100.0%) | 710 (87.5%) |
| 45 to 54 Years | 540 (95.4%) | 626 (87.4%) |
| 55 to 64 Years | 560 (71.6%) | 835 (92.9%) |
| 65 to 74 Years | 1,046 (94.2%) | 931 (83.8%) |
| 75 Years and over | 322 (95.3%) | 535 (92.1%) |
| Total | 4,900 (91.6%) | 5,293 (87.1%) |
Income Below Poverty Among Married-Couple Families in Healdsburg
The poverty statistics for married-couple families in Healdsburg show that 3.6% or 79 of the total 2,217 families live below the poverty line. Families with no children have the highest poverty rate of 4.9%, comprising of 79 families. On the other hand, families with 1 or 2 children have the lowest poverty rate of 0.0%, which includes 0 families.
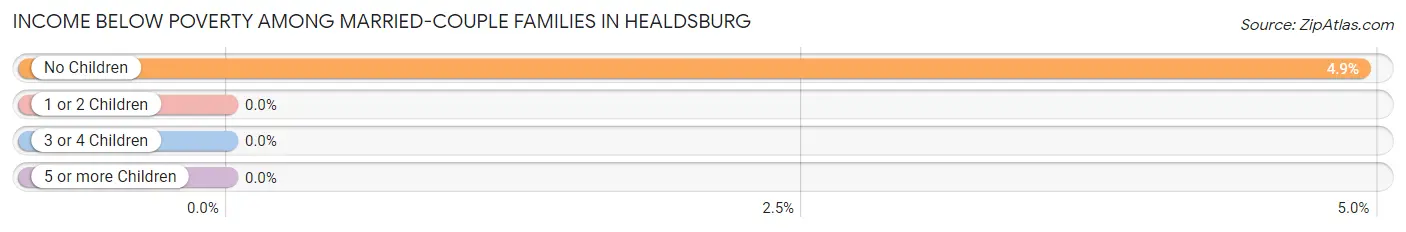
| Children | Above Poverty | Below Poverty |
| No Children | 1,522 (95.1%) | 79 (4.9%) |
| 1 or 2 Children | 594 (100.0%) | 0 (0.0%) |
| 3 or 4 Children | 22 (100.0%) | 0 (0.0%) |
| 5 or more Children | 0 (0.0%) | 0 (0.0%) |
| Total | 2,138 (96.4%) | 79 (3.6%) |
Income Below Poverty Among Single-Parent Households in Healdsburg
According to the poverty data in Healdsburg, 17.7% or 73 single-father households and 16.4% or 85 single-mother households are living below the poverty line. Among single-father households, those with 3 or 4 children have the highest poverty rate, with 73 households (100.0%) experiencing poverty. Likewise, among single-mother households, those with 1 or 2 children have the highest poverty rate, with 64 households (23.5%) falling below the poverty line.
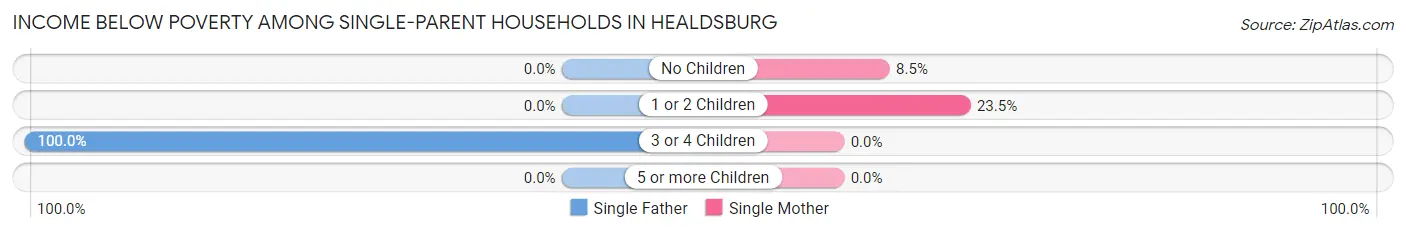
| Children | Single Father | Single Mother |
| No Children | 0 (0.0%) | 21 (8.5%) |
| 1 or 2 Children | 0 (0.0%) | 64 (23.5%) |
| 3 or 4 Children | 73 (100.0%) | 0 (0.0%) |
| 5 or more Children | 0 (0.0%) | 0 (0.0%) |
| Total | 73 (17.7%) | 85 (16.4%) |
Income Below Poverty Among Married-Couple vs Single-Parent Households in Healdsburg
The poverty data for Healdsburg shows that 79 of the married-couple family households (3.6%) and 158 of the single-parent households (17.0%) are living below the poverty level. Within the married-couple family households, those with no children have the highest poverty rate, with 79 households (4.9%) falling below the poverty line. Among the single-parent households, those with 3 or 4 children have the highest poverty rate, with 73 household (100.0%) living below poverty.
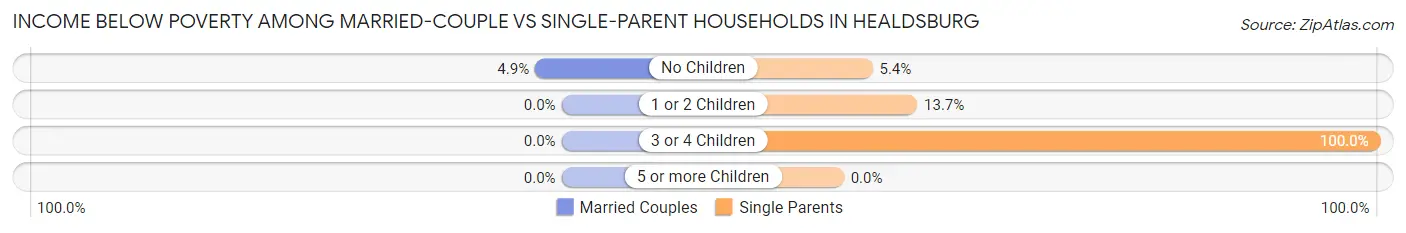
| Children | Married-Couple Families | Single-Parent Households |
| No Children | 79 (4.9%) | 21 (5.4%) |
| 1 or 2 Children | 0 (0.0%) | 64 (13.7%) |
| 3 or 4 Children | 0 (0.0%) | 73 (100.0%) |
| 5 or more Children | 0 (0.0%) | 0 (0.0%) |
| Total | 79 (3.6%) | 158 (17.0%) |
Race in Healdsburg
The most populous races in Healdsburg are White / Caucasian (8,272 | 72.1%), Hispanic or Latino (3,194 | 27.8%), and Some other Race (2,088 | 18.2%).
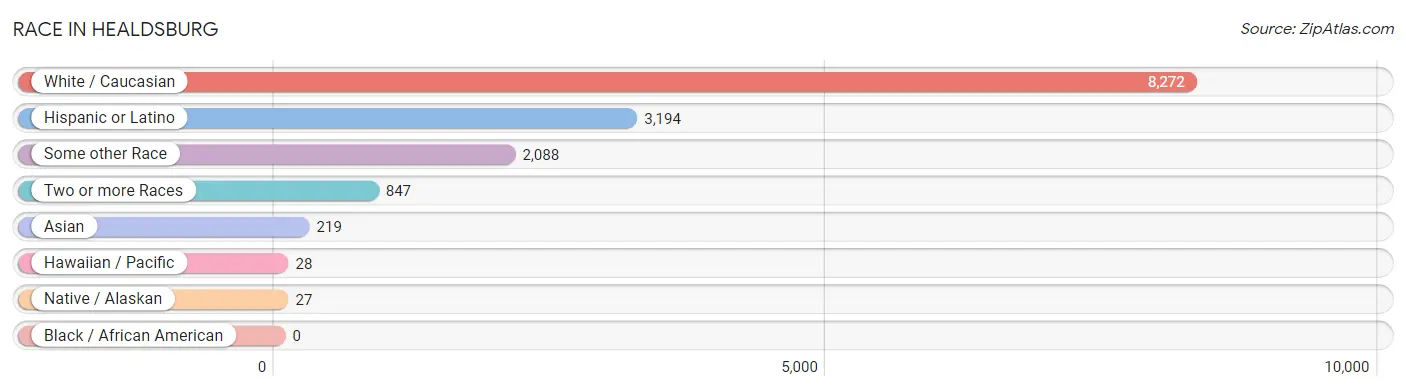
| Race | # Population | % Population |
| Asian | 219 | 1.9% |
| Black / African American | 0 | 0.0% |
| Hawaiian / Pacific | 28 | 0.2% |
| Hispanic or Latino | 3,194 | 27.8% |
| Native / Alaskan | 27 | 0.2% |
| White / Caucasian | 8,272 | 72.1% |
| Two or more Races | 847 | 7.4% |
| Some other Race | 2,088 | 18.2% |
| Total | 11,481 | 100.0% |
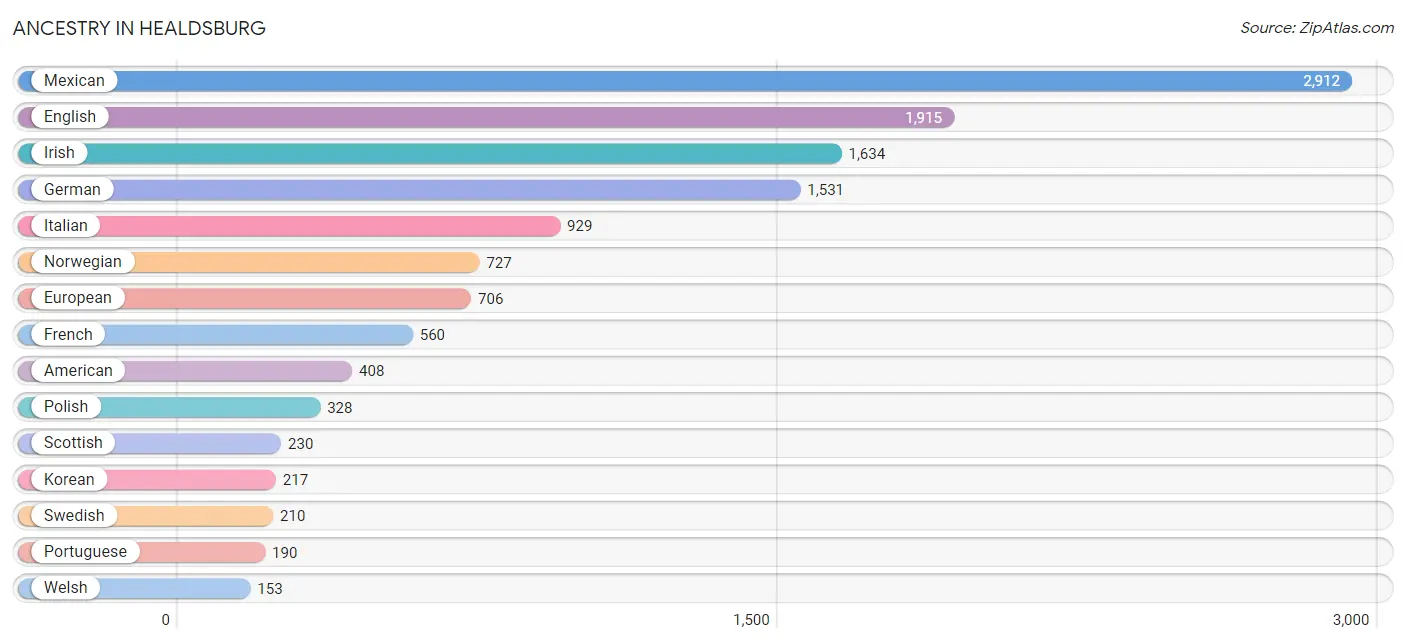
Ancestry in Healdsburg
The most populous ancestries reported in Healdsburg are Mexican (2,912 | 25.4%), English (1,915 | 16.7%), Irish (1,634 | 14.2%), German (1,531 | 13.3%), and Italian (929 | 8.1%), together accounting for 77.7% of all Healdsburg residents.
| Ancestry | # Population | % Population |
| American | 408 | 3.5% |
| Argentinean | 12 | 0.1% |
| Armenian | 9 | 0.1% |
| Austrian | 8 | 0.1% |
| Basque | 9 | 0.1% |
| Bhutanese | 26 | 0.2% |
| Brazilian | 8 | 0.1% |
| British | 63 | 0.5% |
| Burmese | 36 | 0.3% |
| Canadian | 25 | 0.2% |
| Central American | 41 | 0.4% |
| Central American Indian | 27 | 0.2% |
| Cherokee | 45 | 0.4% |
| Chilean | 44 | 0.4% |
| Choctaw | 8 | 0.1% |
| Cuban | 32 | 0.3% |
| Czech | 36 | 0.3% |
| Danish | 130 | 1.1% |
| Dutch | 119 | 1.0% |
| Eastern European | 17 | 0.2% |
| English | 1,915 | 16.7% |
| European | 706 | 6.1% |
| Finnish | 43 | 0.4% |
| French | 560 | 4.9% |
| French Canadian | 11 | 0.1% |
| German | 1,531 | 13.3% |
| Greek | 22 | 0.2% |
| Hungarian | 19 | 0.2% |
| Icelander | 31 | 0.3% |
| Indian (Asian) | 106 | 0.9% |
| Irish | 1,634 | 14.2% |
| Italian | 929 | 8.1% |
| Korean | 217 | 1.9% |
| Mexican | 2,912 | 25.4% |
| Mexican American Indian | 13 | 0.1% |
| Native Hawaiian | 28 | 0.2% |
| Nicaraguan | 23 | 0.2% |
| Northern European | 115 | 1.0% |
| Norwegian | 727 | 6.3% |
| Osage | 10 | 0.1% |
| Pakistani | 117 | 1.0% |
| Panamanian | 18 | 0.2% |
| Polish | 328 | 2.9% |
| Portuguese | 190 | 1.7% |
| Puerto Rican | 39 | 0.3% |
| Russian | 90 | 0.8% |
| Scandinavian | 43 | 0.4% |
| Scotch-Irish | 126 | 1.1% |
| Scottish | 230 | 2.0% |
| Serbian | 5 | 0.0% |
| South American | 56 | 0.5% |
| South American Indian | 8 | 0.1% |
| Spaniard | 19 | 0.2% |
| Spanish | 49 | 0.4% |
| Sri Lankan | 17 | 0.2% |
| Swedish | 210 | 1.8% |
| Swiss | 152 | 1.3% |
| Thai | 98 | 0.9% |
| Turkish | 13 | 0.1% |
| Ukrainian | 10 | 0.1% |
| Welsh | 153 | 1.3% |
| Yugoslavian | 6 | 0.1% | View All 62 Rows |
Immigrants in Healdsburg
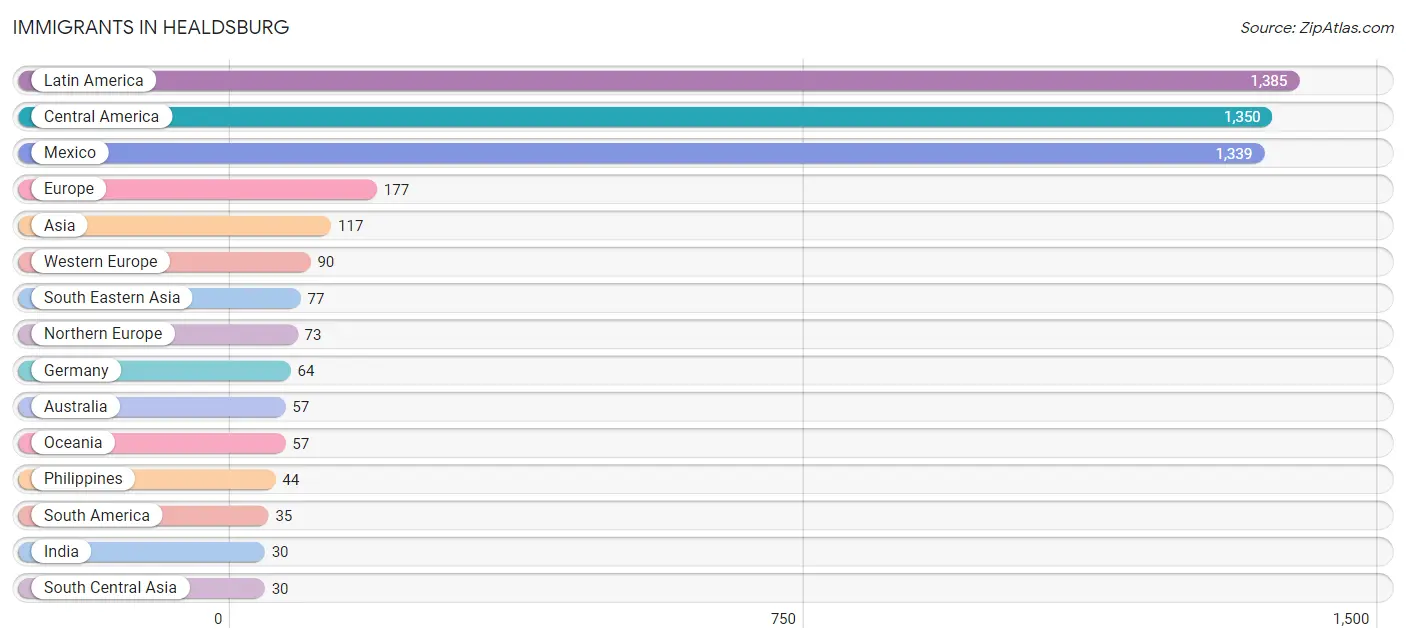
The most numerous immigrant groups reported in Healdsburg came from Latin America (1,385 | 12.1%), Central America (1,350 | 11.8%), Mexico (1,339 | 11.7%), Europe (177 | 1.5%), and Asia (117 | 1.0%), together accounting for 38.0% of all Healdsburg residents.
| Immigration Origin | # Population | % Population |
| Argentina | 12 | 0.1% |
| Asia | 117 | 1.0% |
| Australia | 57 | 0.5% |
| Brazil | 8 | 0.1% |
| Canada | 12 | 0.1% |
| Central America | 1,350 | 11.8% |
| Chile | 15 | 0.1% |
| Costa Rica | 7 | 0.1% |
| Eastern Asia | 10 | 0.1% |
| Europe | 177 | 1.5% |
| Germany | 64 | 0.6% |
| India | 30 | 0.3% |
| Italy | 14 | 0.1% |
| Korea | 10 | 0.1% |
| Latin America | 1,385 | 12.1% |
| Mexico | 1,339 | 11.7% |
| Netherlands | 12 | 0.1% |
| Nicaragua | 4 | 0.0% |
| Northern Europe | 73 | 0.6% |
| Oceania | 57 | 0.5% |
| Philippines | 44 | 0.4% |
| South America | 35 | 0.3% |
| South Central Asia | 30 | 0.3% |
| South Eastern Asia | 77 | 0.7% |
| Southern Europe | 14 | 0.1% |
| Switzerland | 14 | 0.1% |
| Thailand | 26 | 0.2% |
| Vietnam | 7 | 0.1% |
| Western Europe | 90 | 0.8% | View All 29 Rows |
Sex and Age in Healdsburg
Sex and Age in Healdsburg
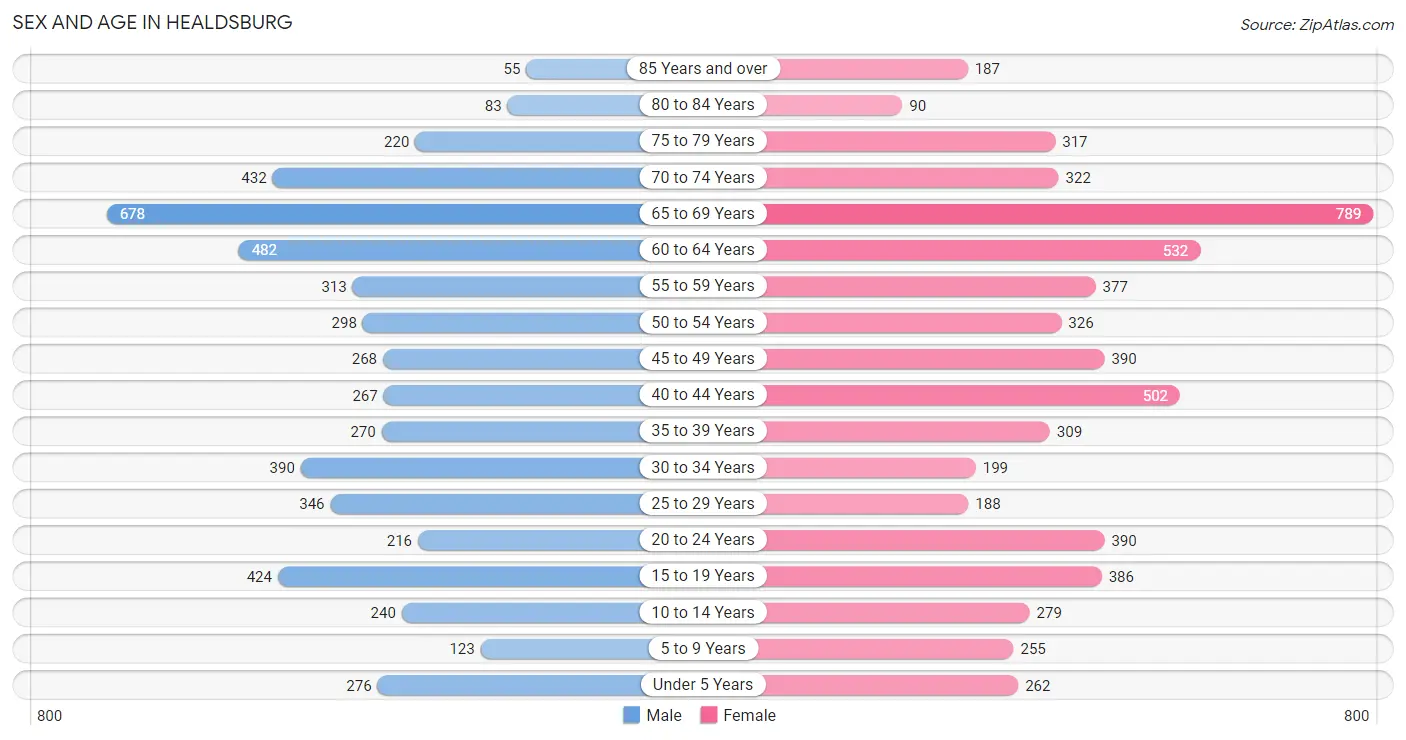
The most populous age groups in Healdsburg are 65 to 69 Years (678 | 12.6%) for men and 65 to 69 Years (789 | 12.9%) for women.
| Age Bracket | Male | Female |
| Under 5 Years | 276 (5.1%) | 262 (4.3%) |
| 5 to 9 Years | 123 (2.3%) | 255 (4.2%) |
| 10 to 14 Years | 240 (4.5%) | 279 (4.6%) |
| 15 to 19 Years | 424 (7.9%) | 386 (6.3%) |
| 20 to 24 Years | 216 (4.0%) | 390 (6.4%) |
| 25 to 29 Years | 346 (6.4%) | 188 (3.1%) |
| 30 to 34 Years | 390 (7.2%) | 199 (3.3%) |
| 35 to 39 Years | 270 (5.0%) | 309 (5.1%) |
| 40 to 44 Years | 267 (5.0%) | 502 (8.2%) |
| 45 to 49 Years | 268 (5.0%) | 390 (6.4%) |
| 50 to 54 Years | 298 (5.5%) | 326 (5.3%) |
| 55 to 59 Years | 313 (5.8%) | 377 (6.2%) |
| 60 to 64 Years | 482 (9.0%) | 532 (8.7%) |
| 65 to 69 Years | 678 (12.6%) | 789 (12.9%) |
| 70 to 74 Years | 432 (8.0%) | 322 (5.3%) |
| 75 to 79 Years | 220 (4.1%) | 317 (5.2%) |
| 80 to 84 Years | 83 (1.5%) | 90 (1.5%) |
| 85 Years and over | 55 (1.0%) | 187 (3.1%) |
| Total | 5,381 (100.0%) | 6,100 (100.0%) |
Families and Households in Healdsburg
Median Family Size in Healdsburg
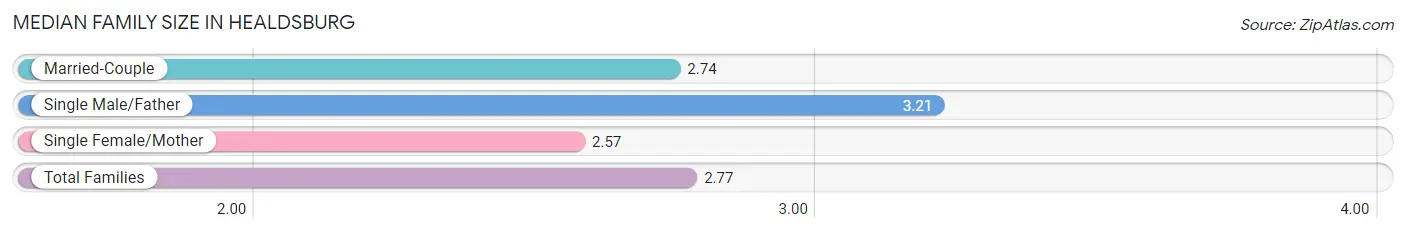
The median family size in Healdsburg is 2.77 persons per family, with single male/father families (412 | 13.1%) accounting for the largest median family size of 3.21 persons per family. On the other hand, single female/mother families (520 | 16.5%) represent the smallest median family size with 2.57 persons per family.
| Family Type | # Families | Family Size |
| Married-Couple | 2,217 (70.4%) | 2.74 |
| Single Male/Father | 412 (13.1%) | 3.21 |
| Single Female/Mother | 520 (16.5%) | 2.57 |
| Total Families | 3,149 (100.0%) | 2.77 |
Median Household Size in Healdsburg
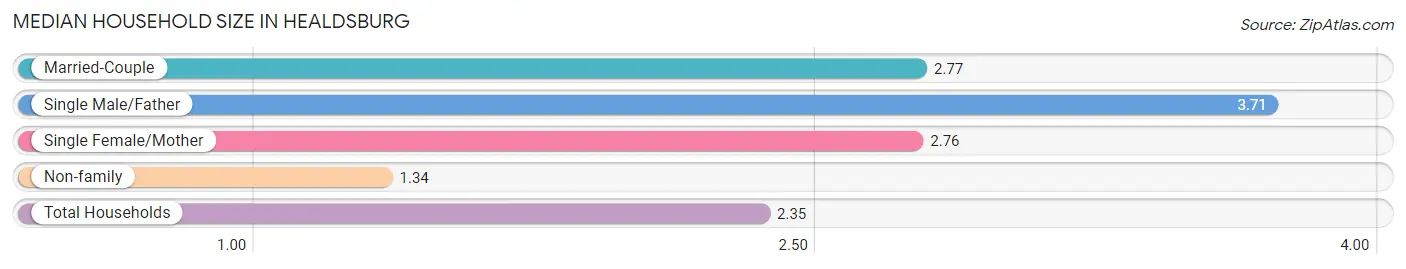
The median household size in Healdsburg is 2.35 persons per household, with single male/father households (412 | 8.5%) accounting for the largest median household size of 3.71 persons per household. non-family households (1,689 | 34.9%) represent the smallest median household size with 1.34 persons per household.
| Household Type | # Households | Household Size |
| Married-Couple | 2,217 (45.8%) | 2.77 |
| Single Male/Father | 412 (8.5%) | 3.71 |
| Single Female/Mother | 520 (10.7%) | 2.76 |
| Non-family | 1,689 (34.9%) | 1.34 |
| Total Households | 4,838 (100.0%) | 2.35 |
Household Size by Marriage Status in Healdsburg
Out of a total of 4,838 households in Healdsburg, 3,149 (65.1%) are family households, while 1,689 (34.9%) are nonfamily households. The most numerous type of family households are 2-person households, comprising 1,665, and the most common type of nonfamily households are 1-person households, comprising 1,082.
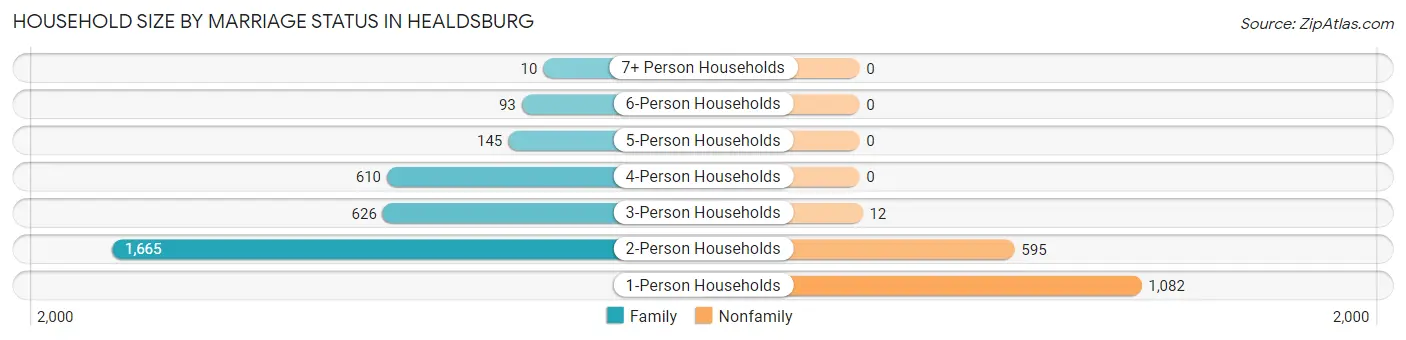
| Household Size | Family Households | Nonfamily Households |
| 1-Person Households | - | 1,082 (22.4%) |
| 2-Person Households | 1,665 (34.4%) | 595 (12.3%) |
| 3-Person Households | 626 (12.9%) | 12 (0.3%) |
| 4-Person Households | 610 (12.6%) | 0 (0.0%) |
| 5-Person Households | 145 (3.0%) | 0 (0.0%) |
| 6-Person Households | 93 (1.9%) | 0 (0.0%) |
| 7+ Person Households | 10 (0.2%) | 0 (0.0%) |
| Total | 3,149 (65.1%) | 1,689 (34.9%) |
Female Fertility in Healdsburg
Fertility by Age in Healdsburg
Average fertility rate in Healdsburg is 17.0 births per 1,000 women. Women in the age bracket of 20 to 34 years have the highest fertility rate with 51.0 births per 1,000 women. Women in the age bracket of 20 to 34 years acount for 100.0% of all women with births.
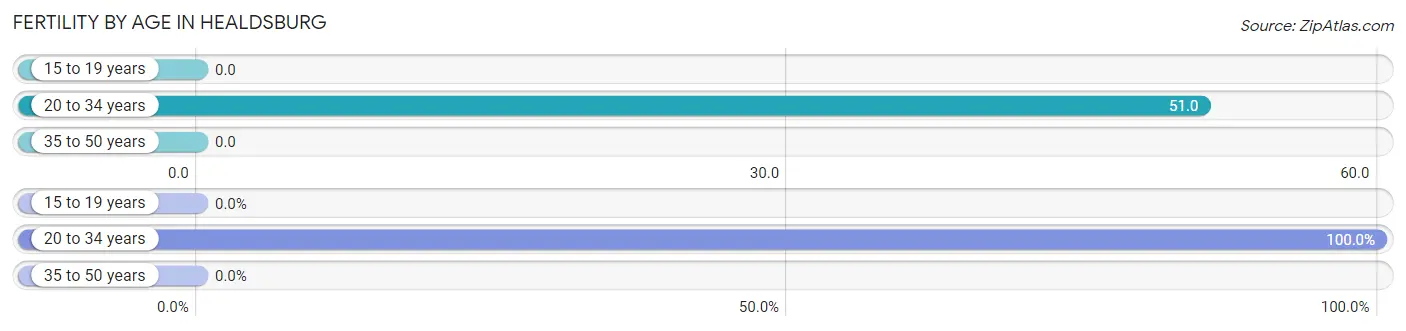
| Age Bracket | Women with Births | Births / 1,000 Women |
| 15 to 19 years | 0 (0.0%) | 0.0 |
| 20 to 34 years | 40 (100.0%) | 51.0 |
| 35 to 50 years | 0 (0.0%) | 0.0 |
| Total | 40 (100.0%) | 17.0 |
Fertility by Age by Marriage Status in Healdsburg
42.5% of women with births (40) in Healdsburg are married. The highest percentage of unmarried women with births falls into 20 to 34 years age bracket with 57.5% of them unmarried at the time of birth, while the lowest percentage of unmarried women with births belong to 20 to 34 years age bracket with 57.5% of them unmarried.
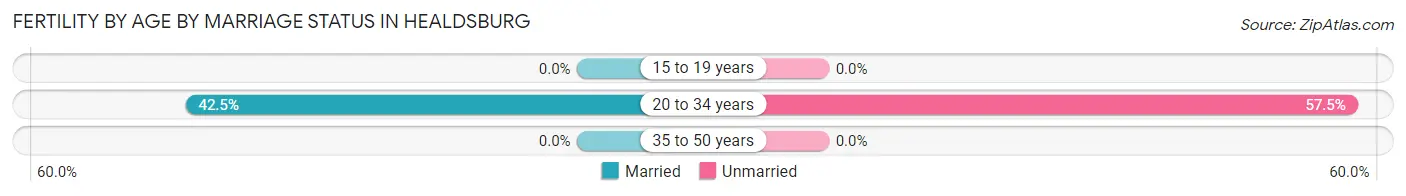
| Age Bracket | Married | Unmarried |
| 15 to 19 years | 0 (0.0%) | 0 (0.0%) |
| 20 to 34 years | 17 (42.5%) | 23 (57.5%) |
| 35 to 50 years | 0 (0.0%) | 0 (0.0%) |
| Total | 17 (42.5%) | 23 (57.5%) |
Fertility by Education in Healdsburg
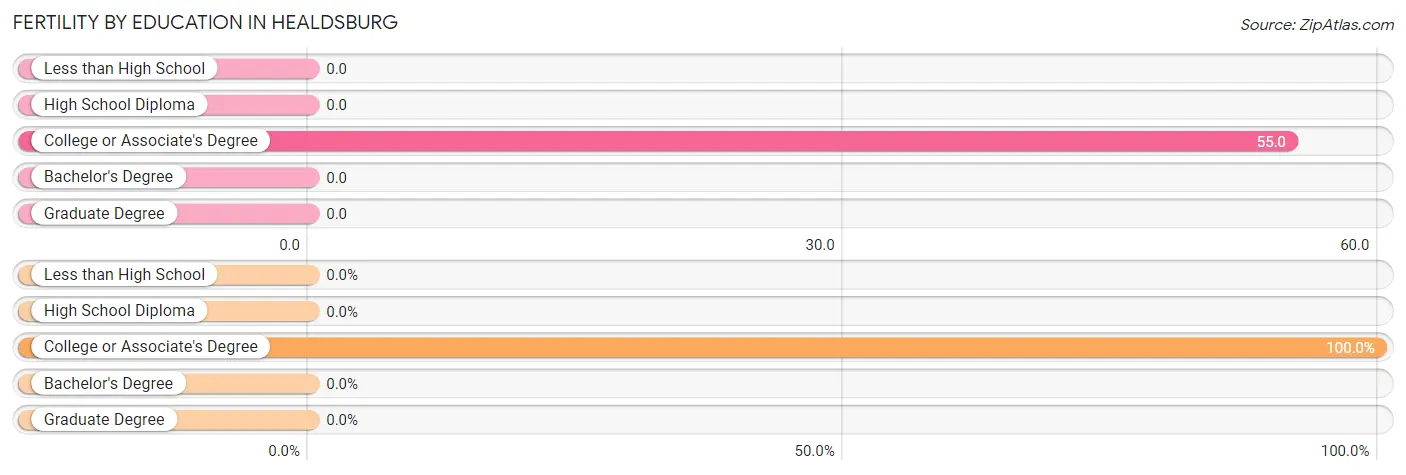
| Educational Attainment | Women with Births | Births / 1,000 Women |
| Less than High School | 0 (0.0%) | 0.0 |
| High School Diploma | 0 (0.0%) | 0.0 |
| College or Associate's Degree | 40 (100.0%) | 55.0 |
| Bachelor's Degree | 0 (0.0%) | 0.0 |
| Graduate Degree | 0 (0.0%) | 0.0 |
| Total | 40 (100.0%) | 17.0 |
Fertility by Education by Marriage Status in Healdsburg
57.5% of women with births in Healdsburg are unmarried. Women with the educational attainment of college or associate's degree are most likely to be married with 42.5% of them married at childbirth, while women with the educational attainment of college or associate's degree are least likely to be married with 57.5% of them unmarried at childbirth.
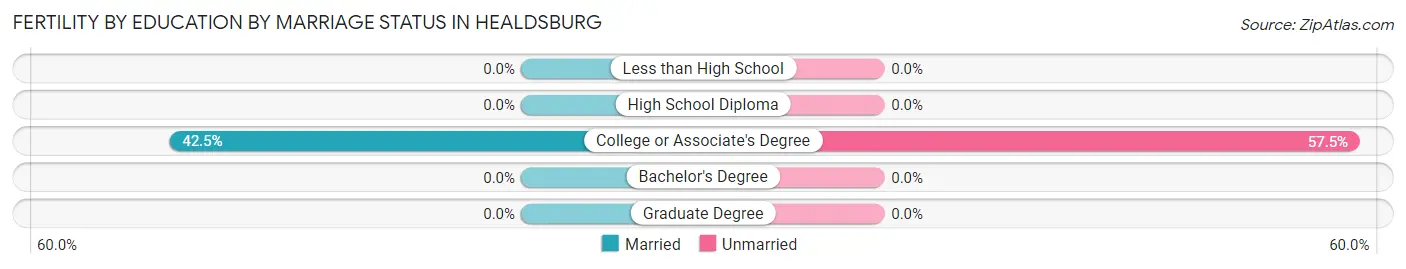
| Educational Attainment | Married | Unmarried |
| Less than High School | 0 (0.0%) | 0 (0.0%) |
| High School Diploma | 0 (0.0%) | 0 (0.0%) |
| College or Associate's Degree | 17 (42.5%) | 23 (57.5%) |
| Bachelor's Degree | 0 (0.0%) | 0 (0.0%) |
| Graduate Degree | 0 (0.0%) | 0 (0.0%) |
| Total | 17 (42.5%) | 23 (57.5%) |
Employment Characteristics in Healdsburg
Employment by Class of Employer in Healdsburg
Among the 5,399 employed individuals in Healdsburg, private company employees (3,657 | 67.7%), self-employed (not incorporated) (484 | 9.0%), and local government employees (474 | 8.8%) make up the most common classes of employment.
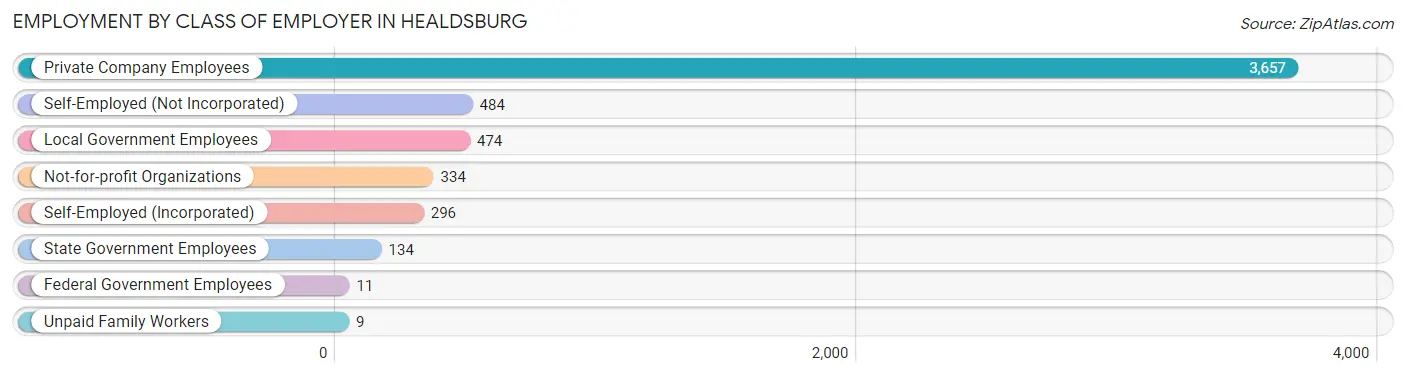
| Employer Class | # Employees | % Employees |
| Private Company Employees | 3,657 | 67.7% |
| Self-Employed (Incorporated) | 296 | 5.5% |
| Self-Employed (Not Incorporated) | 484 | 9.0% |
| Not-for-profit Organizations | 334 | 6.2% |
| Local Government Employees | 474 | 8.8% |
| State Government Employees | 134 | 2.5% |
| Federal Government Employees | 11 | 0.2% |
| Unpaid Family Workers | 9 | 0.2% |
| Total | 5,399 | 100.0% |
Employment Status by Age in Healdsburg
According to the labor force statistics for Healdsburg, out of the total population over 16 years of age (9,903), 59.3% or 5,872 individuals are in the labor force, with 6.1% or 358 of them unemployed. The age group with the highest labor force participation rate is 30 to 34 years, with 98.5% or 580 individuals in the labor force. Within the labor force, the 16 to 19 years age range has the highest percentage of unemployed individuals, with 23.7% or 45 of them being unemployed.
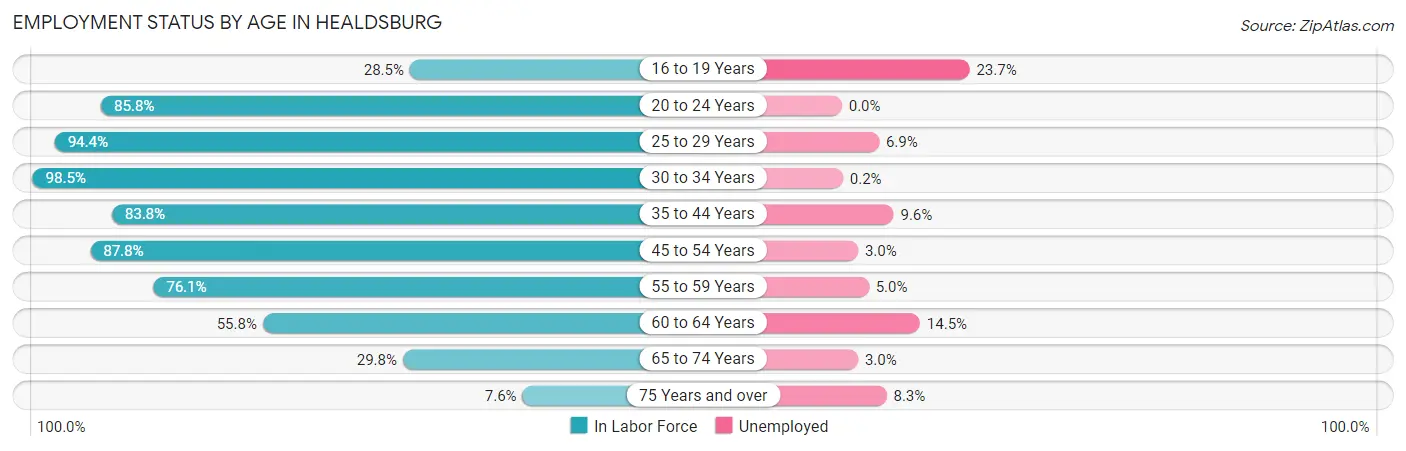
| Age Bracket | In Labor Force | Unemployed |
| 16 to 19 Years | 190 (28.5%) | 45 (23.7%) |
| 20 to 24 Years | 520 (85.8%) | 0 (0.0%) |
| 25 to 29 Years | 504 (94.4%) | 35 (6.9%) |
| 30 to 34 Years | 580 (98.5%) | 1 (0.2%) |
| 35 to 44 Years | 1,130 (83.8%) | 108 (9.6%) |
| 45 to 54 Years | 1,126 (87.8%) | 34 (3.0%) |
| 55 to 59 Years | 525 (76.1%) | 26 (5.0%) |
| 60 to 64 Years | 566 (55.8%) | 82 (14.5%) |
| 65 to 74 Years | 662 (29.8%) | 20 (3.0%) |
| 75 Years and over | 72 (7.6%) | 6 (8.3%) |
| Total | 5,872 (59.3%) | 358 (6.1%) |
Employment Status by Educational Attainment in Healdsburg
According to labor force statistics for Healdsburg, 81.2% of individuals (4,431) out of the total population between 25 and 64 years of age (5,457) are in the labor force, with 6.5% or 288 of them being unemployed. The group with the highest labor force participation rate are those with the educational attainment of bachelor's degree or higher, with 86.8% or 1,942 individuals in the labor force. Within the labor force, individuals with college / associate degree education have the highest percentage of unemployment, with 9.2% or 122 of them being unemployed.
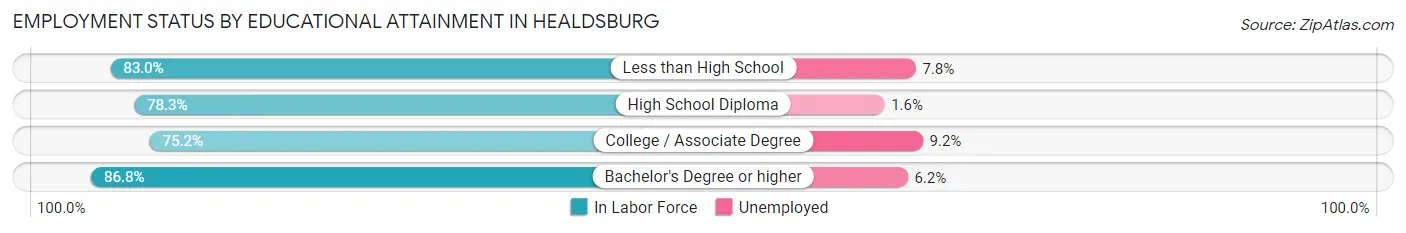
| Educational Attainment | In Labor Force | Unemployed |
| Less than High School | 396 (83.0%) | 37 (7.8%) |
| High School Diploma | 770 (78.3%) | 16 (1.6%) |
| College / Associate Degree | 1,323 (75.2%) | 162 (9.2%) |
| Bachelor's Degree or higher | 1,942 (86.8%) | 139 (6.2%) |
| Total | 4,431 (81.2%) | 355 (6.5%) |
Employment Occupations by Sex in Healdsburg
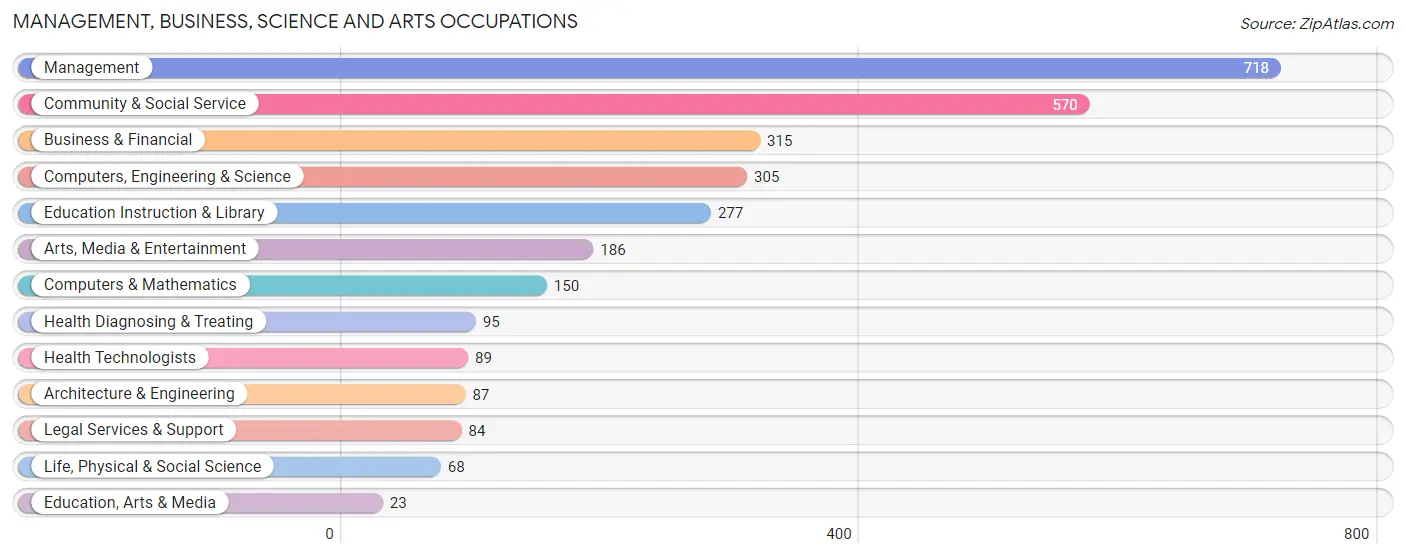
Management, Business, Science and Arts Occupations
The most common Management, Business, Science and Arts occupations in Healdsburg are Management (718 | 13.0%), Community & Social Service (570 | 10.3%), Business & Financial (315 | 5.7%), Computers, Engineering & Science (305 | 5.5%), and Education Instruction & Library (277 | 5.0%).
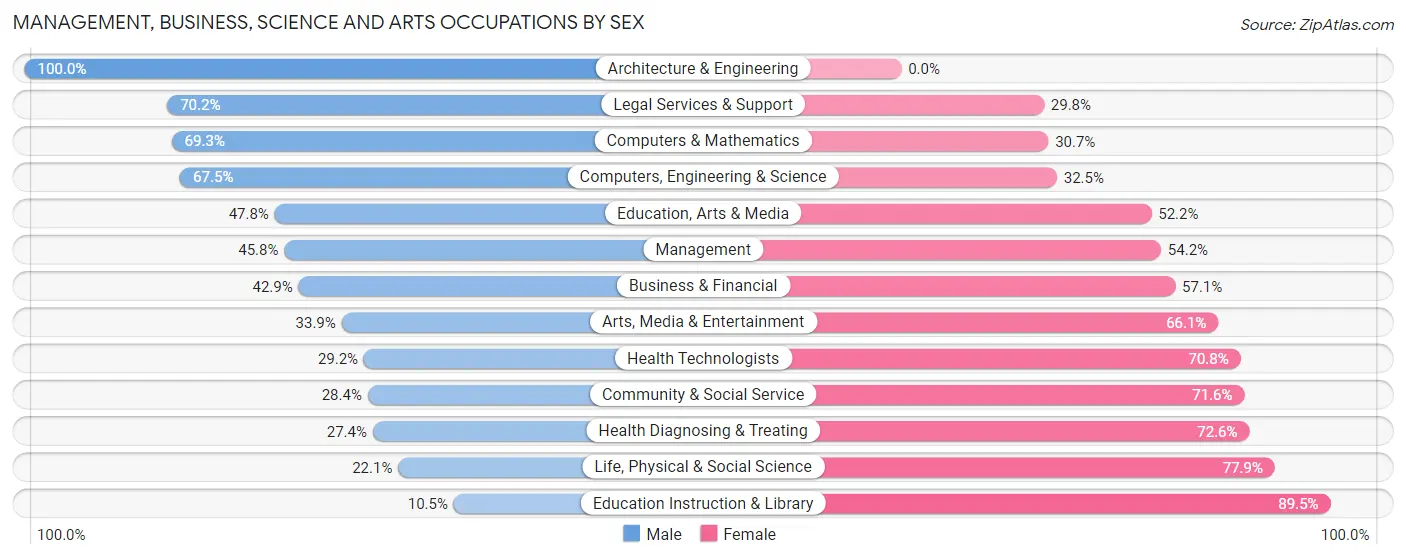
Management, Business, Science and Arts Occupations by Sex
Within the Management, Business, Science and Arts occupations in Healdsburg, the most male-oriented occupations are Architecture & Engineering (100.0%), Legal Services & Support (70.2%), and Computers & Mathematics (69.3%), while the most female-oriented occupations are Education Instruction & Library (89.5%), Life, Physical & Social Science (77.9%), and Health Diagnosing & Treating (72.6%).
| Occupation | Male | Female |
| Management | 329 (45.8%) | 389 (54.2%) |
| Business & Financial | 135 (42.9%) | 180 (57.1%) |
| Computers, Engineering & Science | 206 (67.5%) | 99 (32.5%) |
| Computers & Mathematics | 104 (69.3%) | 46 (30.7%) |
| Architecture & Engineering | 87 (100.0%) | 0 (0.0%) |
| Life, Physical & Social Science | 15 (22.1%) | 53 (77.9%) |
| Community & Social Service | 162 (28.4%) | 408 (71.6%) |
| Education, Arts & Media | 11 (47.8%) | 12 (52.2%) |
| Legal Services & Support | 59 (70.2%) | 25 (29.8%) |
| Education Instruction & Library | 29 (10.5%) | 248 (89.5%) |
| Arts, Media & Entertainment | 63 (33.9%) | 123 (66.1%) |
| Health Diagnosing & Treating | 26 (27.4%) | 69 (72.6%) |
| Health Technologists | 26 (29.2%) | 63 (70.8%) |
| Total (Category) | 858 (42.8%) | 1,145 (57.2%) |
| Total (Overall) | 2,783 (50.4%) | 2,734 (49.6%) |
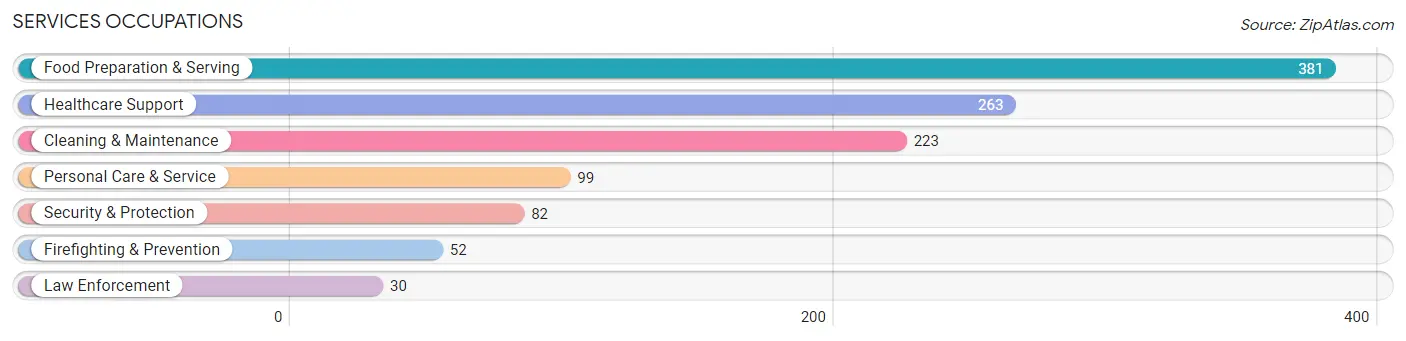
Services Occupations
The most common Services occupations in Healdsburg are Food Preparation & Serving (381 | 6.9%), Healthcare Support (263 | 4.8%), Cleaning & Maintenance (223 | 4.0%), Personal Care & Service (99 | 1.8%), and Security & Protection (82 | 1.5%).
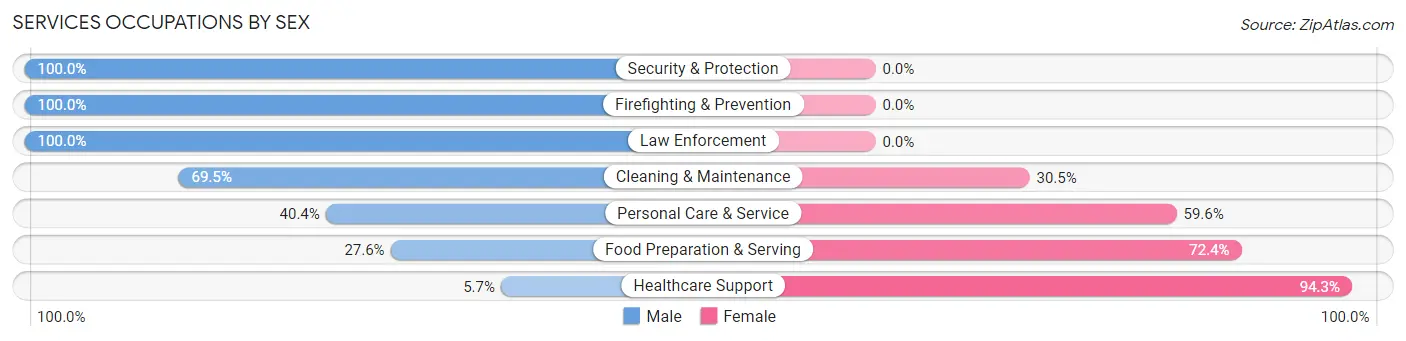
Services Occupations by Sex
Within the Services occupations in Healdsburg, the most male-oriented occupations are Security & Protection (100.0%), Firefighting & Prevention (100.0%), and Law Enforcement (100.0%), while the most female-oriented occupations are Healthcare Support (94.3%), Food Preparation & Serving (72.4%), and Personal Care & Service (59.6%).
| Occupation | Male | Female |
| Healthcare Support | 15 (5.7%) | 248 (94.3%) |
| Security & Protection | 82 (100.0%) | 0 (0.0%) |
| Firefighting & Prevention | 52 (100.0%) | 0 (0.0%) |
| Law Enforcement | 30 (100.0%) | 0 (0.0%) |
| Food Preparation & Serving | 105 (27.6%) | 276 (72.4%) |
| Cleaning & Maintenance | 155 (69.5%) | 68 (30.5%) |
| Personal Care & Service | 40 (40.4%) | 59 (59.6%) |
| Total (Category) | 397 (37.9%) | 651 (62.1%) |
| Total (Overall) | 2,783 (50.4%) | 2,734 (49.6%) |
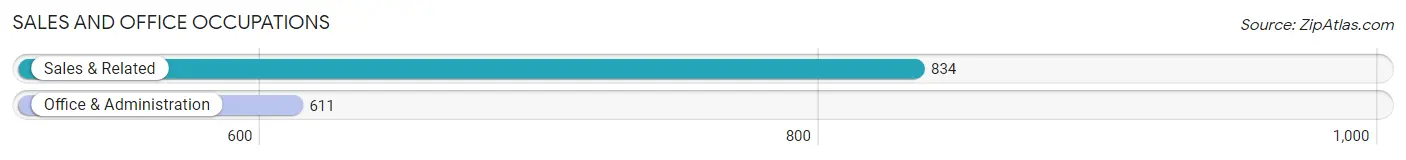
Sales and Office Occupations
The most common Sales and Office occupations in Healdsburg are Sales & Related (834 | 15.1%), and Office & Administration (611 | 11.1%).
Sales and Office Occupations by Sex
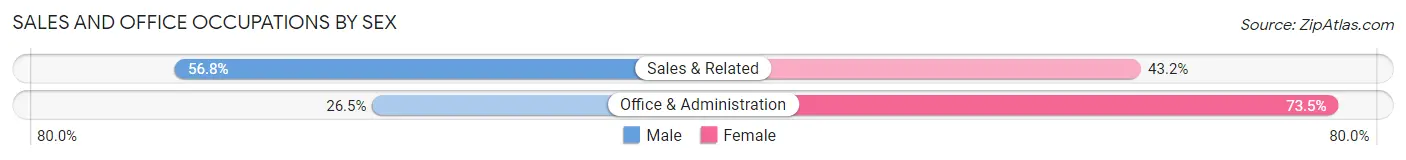
| Occupation | Male | Female |
| Sales & Related | 474 (56.8%) | 360 (43.2%) |
| Office & Administration | 162 (26.5%) | 449 (73.5%) |
| Total (Category) | 636 (44.0%) | 809 (56.0%) |
| Total (Overall) | 2,783 (50.4%) | 2,734 (49.6%) |
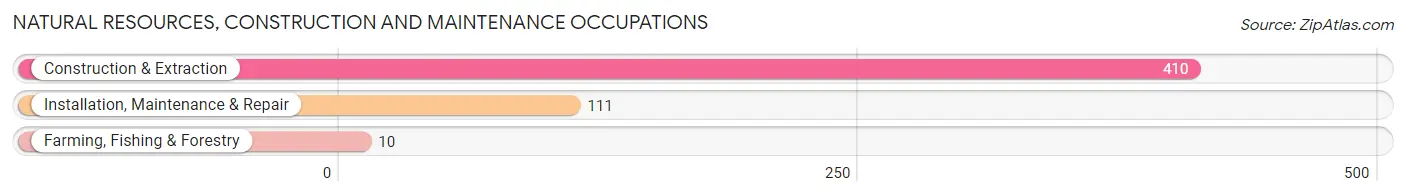
Natural Resources, Construction and Maintenance Occupations
The most common Natural Resources, Construction and Maintenance occupations in Healdsburg are Construction & Extraction (410 | 7.4%), Installation, Maintenance & Repair (111 | 2.0%), and Farming, Fishing & Forestry (10 | 0.2%).
Natural Resources, Construction and Maintenance Occupations by Sex
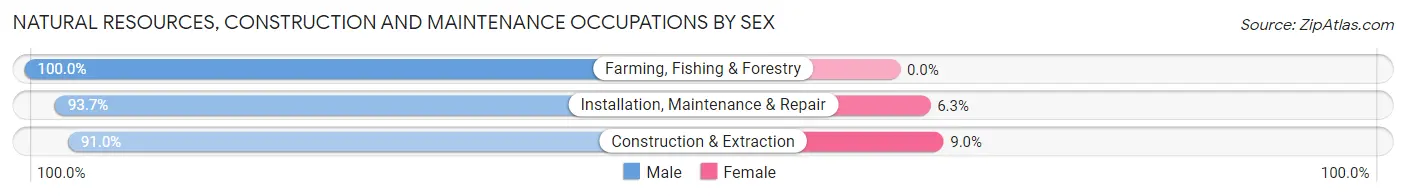
| Occupation | Male | Female |
| Farming, Fishing & Forestry | 10 (100.0%) | 0 (0.0%) |
| Construction & Extraction | 373 (91.0%) | 37 (9.0%) |
| Installation, Maintenance & Repair | 104 (93.7%) | 7 (6.3%) |
| Total (Category) | 487 (91.7%) | 44 (8.3%) |
| Total (Overall) | 2,783 (50.4%) | 2,734 (49.6%) |
Production, Transportation and Moving Occupations
The most common Production, Transportation and Moving occupations in Healdsburg are Production (236 | 4.3%), Transportation (172 | 3.1%), and Material Moving (82 | 1.5%).
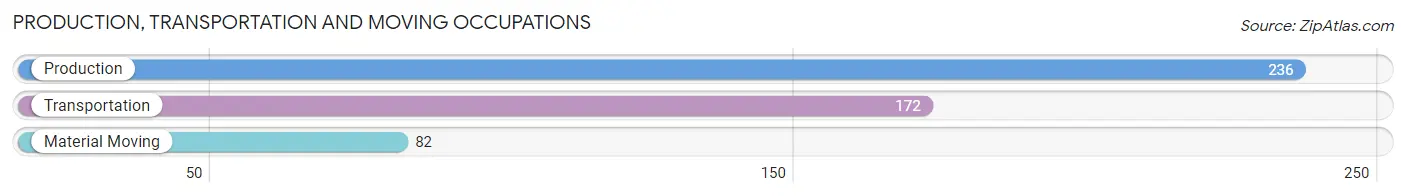
Production, Transportation and Moving Occupations by Sex
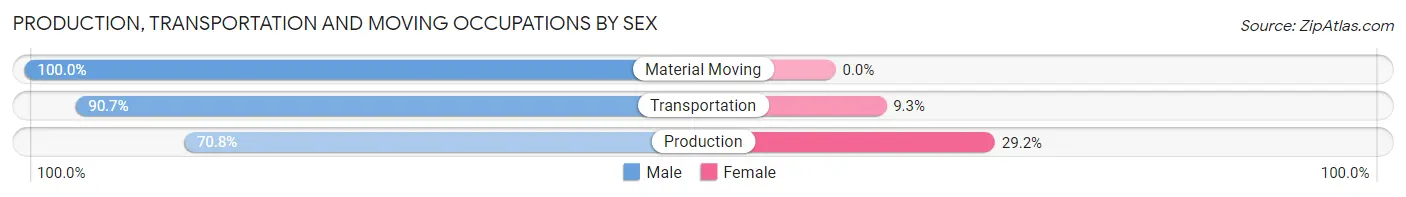
| Occupation | Male | Female |
| Production | 167 (70.8%) | 69 (29.2%) |
| Transportation | 156 (90.7%) | 16 (9.3%) |
| Material Moving | 82 (100.0%) | 0 (0.0%) |
| Total (Category) | 405 (82.7%) | 85 (17.3%) |
| Total (Overall) | 2,783 (50.4%) | 2,734 (49.6%) |
Employment Industries by Sex in Healdsburg
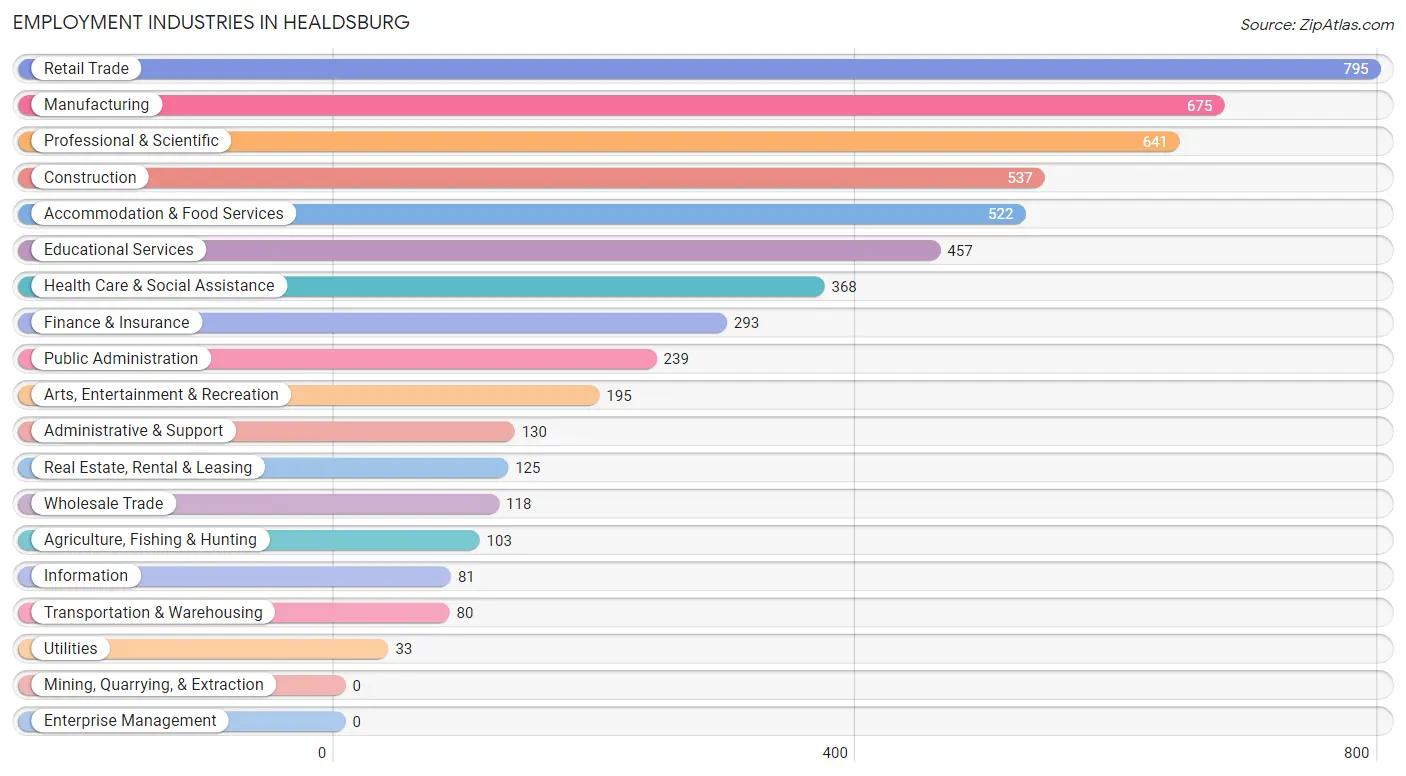
Employment Industries in Healdsburg
The major employment industries in Healdsburg include Retail Trade (795 | 14.4%), Manufacturing (675 | 12.2%), Professional & Scientific (641 | 11.6%), Construction (537 | 9.7%), and Accommodation & Food Services (522 | 9.5%).
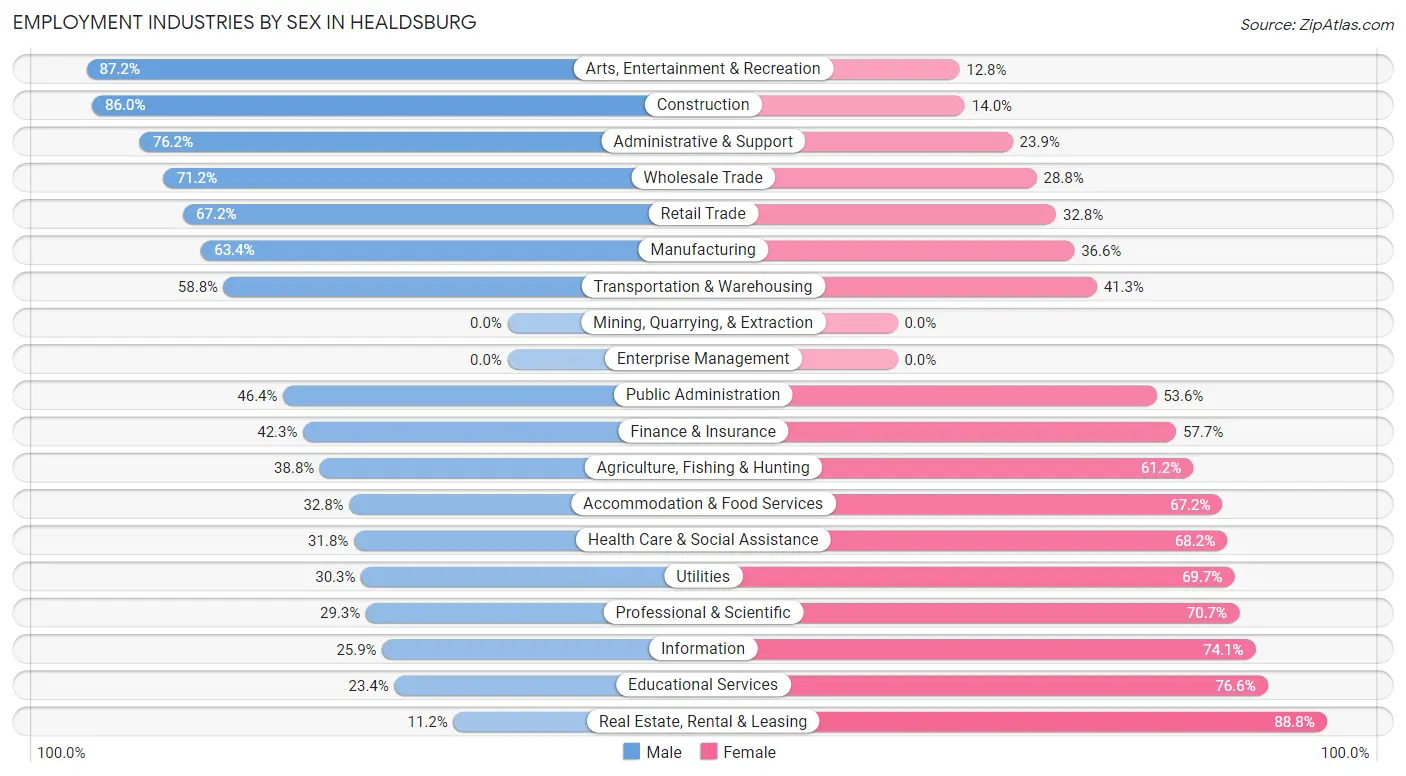
Employment Industries by Sex in Healdsburg
The Healdsburg industries that see more men than women are Arts, Entertainment & Recreation (87.2%), Construction (86.0%), and Administrative & Support (76.1%), whereas the industries that tend to have a higher number of women are Real Estate, Rental & Leasing (88.8%), Educational Services (76.6%), and Information (74.1%).
| Industry | Male | Female |
| Agriculture, Fishing & Hunting | 40 (38.8%) | 63 (61.2%) |
| Mining, Quarrying, & Extraction | 0 (0.0%) | 0 (0.0%) |
| Construction | 462 (86.0%) | 75 (14.0%) |
| Manufacturing | 428 (63.4%) | 247 (36.6%) |
| Wholesale Trade | 84 (71.2%) | 34 (28.8%) |
| Retail Trade | 534 (67.2%) | 261 (32.8%) |
| Transportation & Warehousing | 47 (58.8%) | 33 (41.2%) |
| Utilities | 10 (30.3%) | 23 (69.7%) |
| Information | 21 (25.9%) | 60 (74.1%) |
| Finance & Insurance | 124 (42.3%) | 169 (57.7%) |
| Real Estate, Rental & Leasing | 14 (11.2%) | 111 (88.8%) |
| Professional & Scientific | 188 (29.3%) | 453 (70.7%) |
| Enterprise Management | 0 (0.0%) | 0 (0.0%) |
| Administrative & Support | 99 (76.1%) | 31 (23.8%) |
| Educational Services | 107 (23.4%) | 350 (76.6%) |
| Health Care & Social Assistance | 117 (31.8%) | 251 (68.2%) |
| Arts, Entertainment & Recreation | 170 (87.2%) | 25 (12.8%) |
| Accommodation & Food Services | 171 (32.8%) | 351 (67.2%) |
| Public Administration | 111 (46.4%) | 128 (53.6%) |
| Total | 2,783 (50.4%) | 2,734 (49.6%) |
Education in Healdsburg
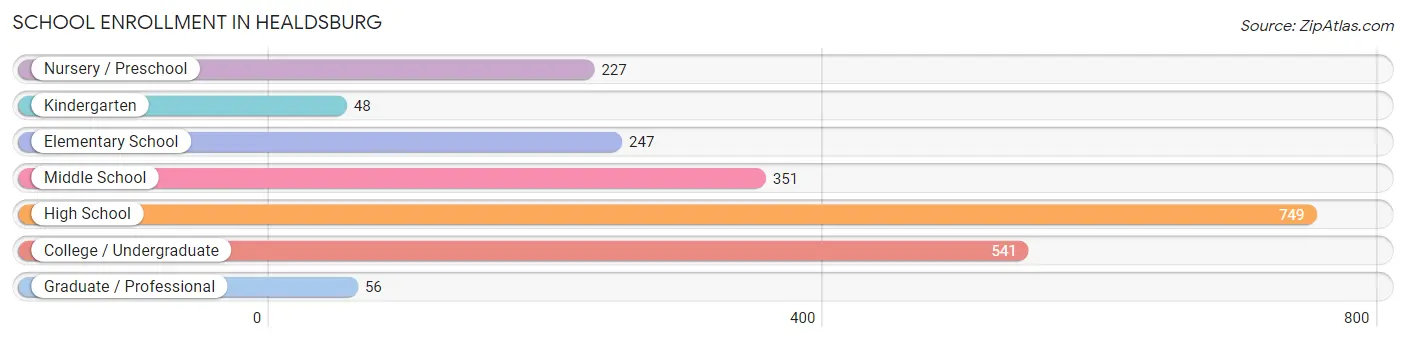
School Enrollment in Healdsburg
The most common levels of schooling among the 2,219 students in Healdsburg are high school (749 | 33.8%), college / undergraduate (541 | 24.4%), and middle school (351 | 15.8%).
| School Level | # Students | % Students |
| Nursery / Preschool | 227 | 10.2% |
| Kindergarten | 48 | 2.2% |
| Elementary School | 247 | 11.1% |
| Middle School | 351 | 15.8% |
| High School | 749 | 33.8% |
| College / Undergraduate | 541 | 24.4% |
| Graduate / Professional | 56 | 2.5% |
| Total | 2,219 | 100.0% |
School Enrollment by Age by Funding Source in Healdsburg
Out of a total of 2,219 students who are enrolled in schools in Healdsburg, 604 (27.2%) attend a private institution, while the remaining 1,615 (72.8%) are enrolled in public schools. The age group of 3 to 4 year olds has the highest likelihood of being enrolled in private schools, with 82 (58.6% in the age bracket) enrolled. Conversely, the age group of 18 to 19 year olds has the lowest likelihood of being enrolled in a private school, with 380 (94.5% in the age bracket) attending a public institution.
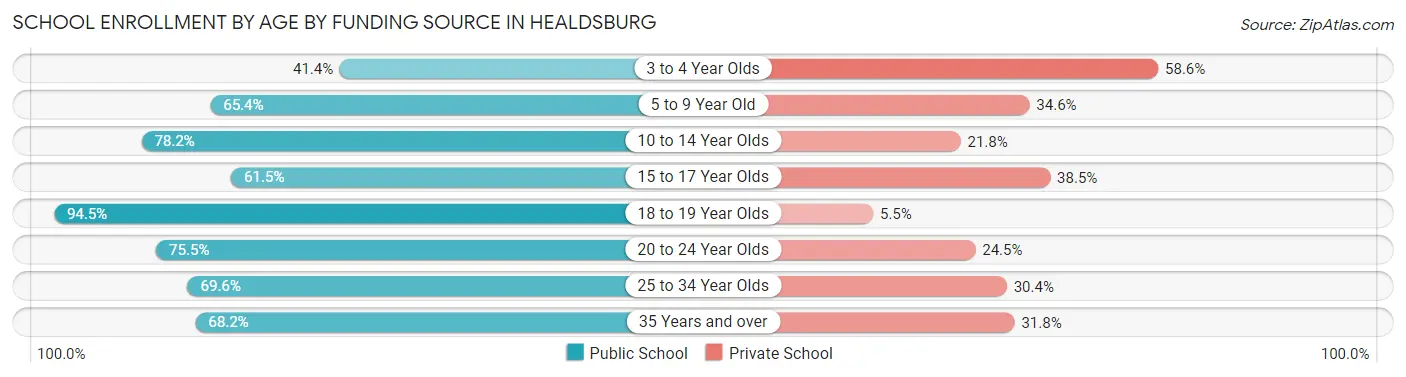
| Age Bracket | Public School | Private School |
| 3 to 4 Year Olds | 58 (41.4%) | 82 (58.6%) |
| 5 to 9 Year Old | 240 (65.4%) | 127 (34.6%) |
| 10 to 14 Year Olds | 406 (78.2%) | 113 (21.8%) |
| 15 to 17 Year Olds | 224 (61.5%) | 140 (38.5%) |
| 18 to 19 Year Olds | 380 (94.5%) | 22 (5.5%) |
| 20 to 24 Year Olds | 154 (75.5%) | 50 (24.5%) |
| 25 to 34 Year Olds | 94 (69.6%) | 41 (30.4%) |
| 35 Years and over | 60 (68.2%) | 28 (31.8%) |
| Total | 1,615 (72.8%) | 604 (27.2%) |
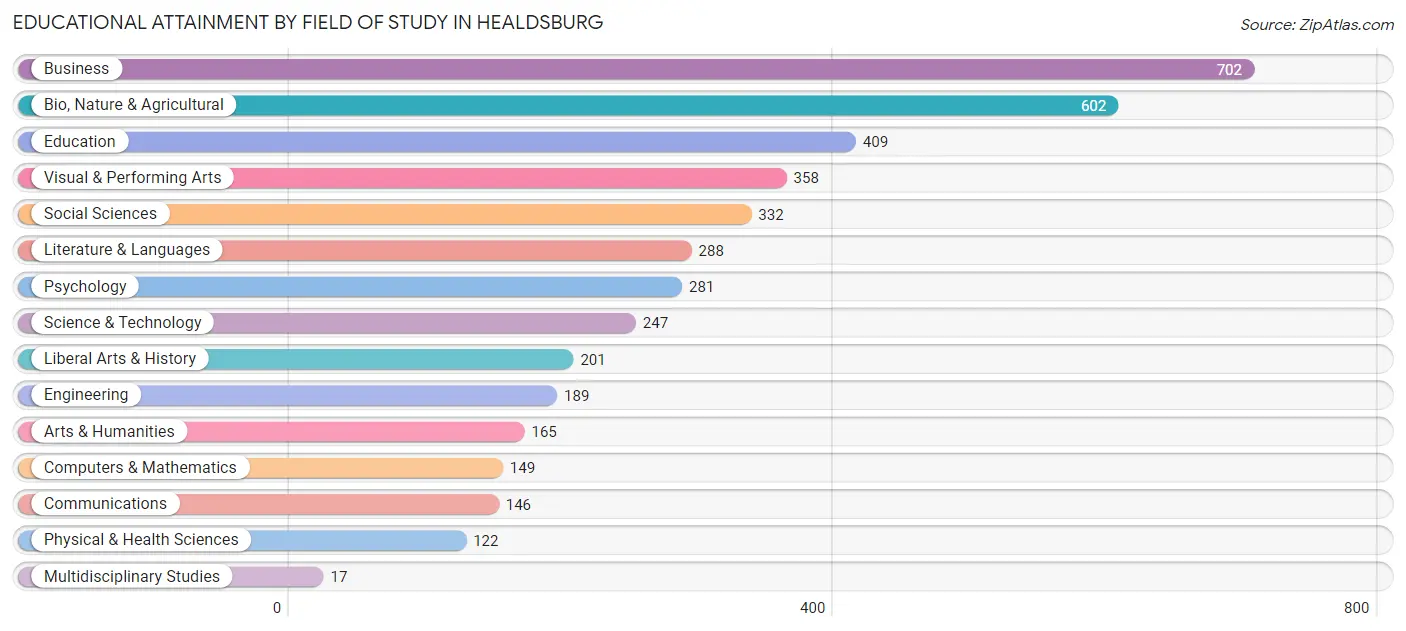
Educational Attainment by Field of Study in Healdsburg
Business (702 | 16.7%), bio, nature & agricultural (602 | 14.3%), education (409 | 9.7%), visual & performing arts (358 | 8.5%), and social sciences (332 | 7.9%) are the most common fields of study among 4,208 individuals in Healdsburg who have obtained a bachelor's degree or higher.
| Field of Study | # Graduates | % Graduates |
| Computers & Mathematics | 149 | 3.5% |
| Bio, Nature & Agricultural | 602 | 14.3% |
| Physical & Health Sciences | 122 | 2.9% |
| Psychology | 281 | 6.7% |
| Social Sciences | 332 | 7.9% |
| Engineering | 189 | 4.5% |
| Multidisciplinary Studies | 17 | 0.4% |
| Science & Technology | 247 | 5.9% |
| Business | 702 | 16.7% |
| Education | 409 | 9.7% |
| Literature & Languages | 288 | 6.8% |
| Liberal Arts & History | 201 | 4.8% |
| Visual & Performing Arts | 358 | 8.5% |
| Communications | 146 | 3.5% |
| Arts & Humanities | 165 | 3.9% |
| Total | 4,208 | 100.0% |
Transportation & Commute in Healdsburg
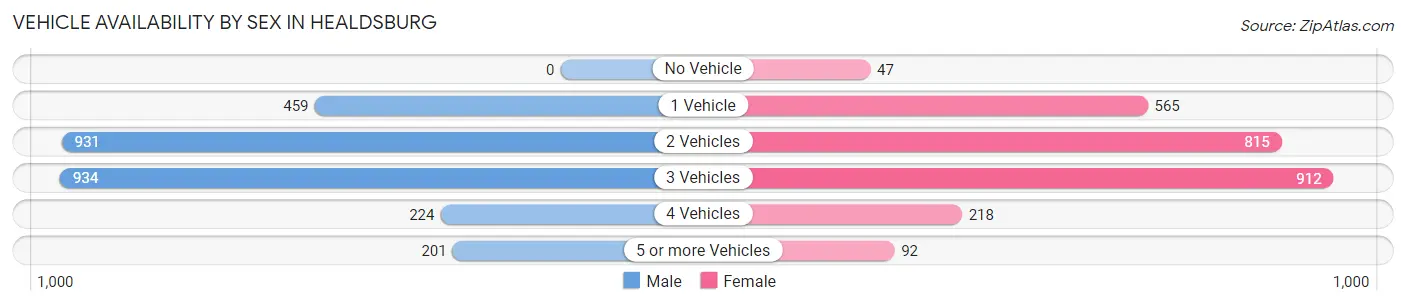
Vehicle Availability by Sex in Healdsburg
The most prevalent vehicle ownership categories in Healdsburg are males with 3 vehicles (934, accounting for 34.0%) and females with 3 vehicles (912, making up 35.3%).
| Vehicles Available | Male | Female |
| No Vehicle | 0 (0.0%) | 47 (1.8%) |
| 1 Vehicle | 459 (16.7%) | 565 (21.3%) |
| 2 Vehicles | 931 (33.9%) | 815 (30.8%) |
| 3 Vehicles | 934 (34.0%) | 912 (34.4%) |
| 4 Vehicles | 224 (8.2%) | 218 (8.2%) |
| 5 or more Vehicles | 201 (7.3%) | 92 (3.5%) |
| Total | 2,749 (100.0%) | 2,649 (100.0%) |
Commute Time in Healdsburg
The most frequently occuring commute durations in Healdsburg are 5 to 9 minutes (955 commuters, 22.4%), 10 to 14 minutes (898 commuters, 21.0%), and 20 to 24 minutes (630 commuters, 14.8%).
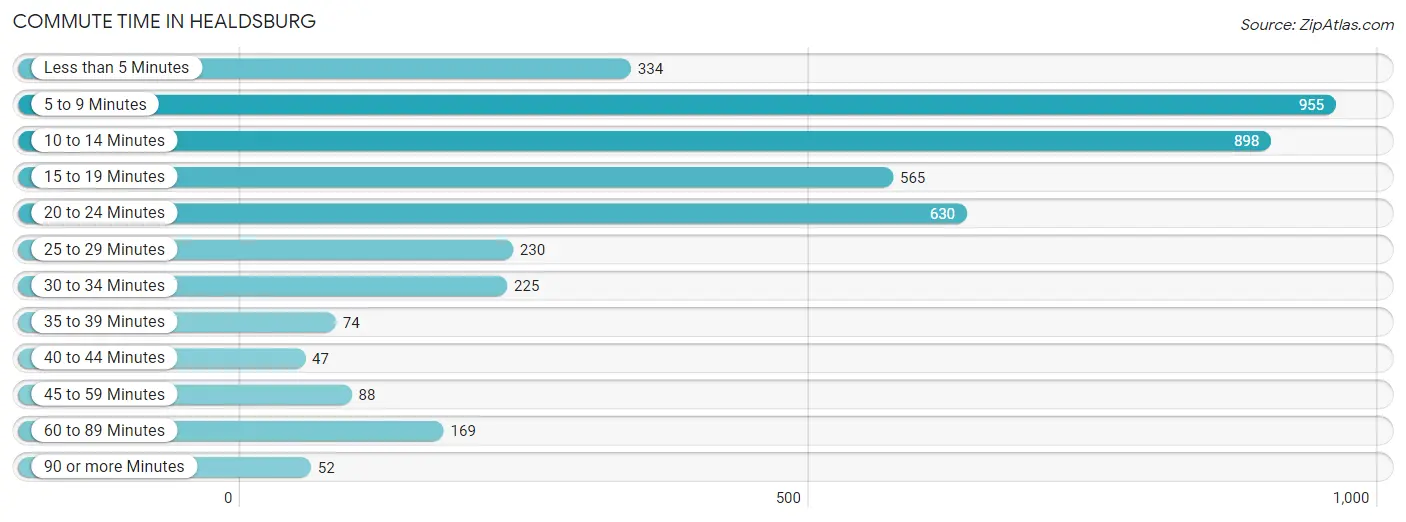
| Commute Time | # Commuters | % Commuters |
| Less than 5 Minutes | 334 | 7.8% |
| 5 to 9 Minutes | 955 | 22.4% |
| 10 to 14 Minutes | 898 | 21.0% |
| 15 to 19 Minutes | 565 | 13.2% |
| 20 to 24 Minutes | 630 | 14.8% |
| 25 to 29 Minutes | 230 | 5.4% |
| 30 to 34 Minutes | 225 | 5.3% |
| 35 to 39 Minutes | 74 | 1.7% |
| 40 to 44 Minutes | 47 | 1.1% |
| 45 to 59 Minutes | 88 | 2.1% |
| 60 to 89 Minutes | 169 | 4.0% |
| 90 or more Minutes | 52 | 1.2% |
Commute Time by Sex in Healdsburg
The most common commute times in Healdsburg are 5 to 9 minutes (616 commuters, 26.0%) for males and 10 to 14 minutes (468 commuters, 24.7%) for females.
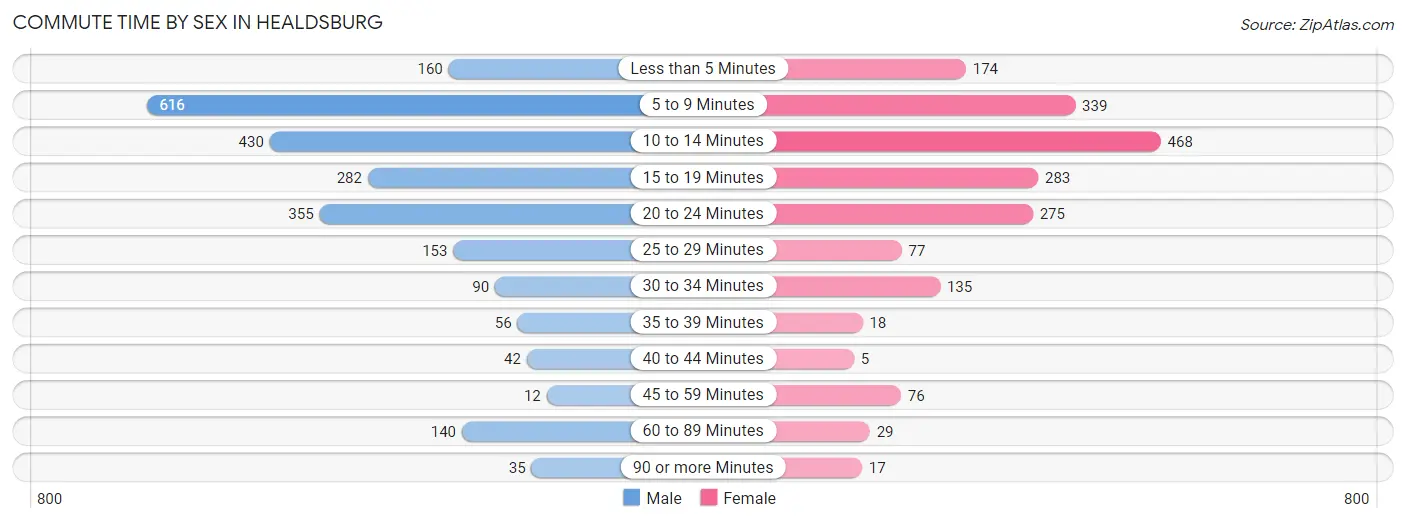
| Commute Time | Male | Female |
| Less than 5 Minutes | 160 (6.8%) | 174 (9.2%) |
| 5 to 9 Minutes | 616 (26.0%) | 339 (17.9%) |
| 10 to 14 Minutes | 430 (18.1%) | 468 (24.7%) |
| 15 to 19 Minutes | 282 (11.9%) | 283 (14.9%) |
| 20 to 24 Minutes | 355 (15.0%) | 275 (14.5%) |
| 25 to 29 Minutes | 153 (6.5%) | 77 (4.1%) |
| 30 to 34 Minutes | 90 (3.8%) | 135 (7.1%) |
| 35 to 39 Minutes | 56 (2.4%) | 18 (0.9%) |
| 40 to 44 Minutes | 42 (1.8%) | 5 (0.3%) |
| 45 to 59 Minutes | 12 (0.5%) | 76 (4.0%) |
| 60 to 89 Minutes | 140 (5.9%) | 29 (1.5%) |
| 90 or more Minutes | 35 (1.5%) | 17 (0.9%) |
Time of Departure to Work by Sex in Healdsburg
The most frequent times of departure to work in Healdsburg are 7:30 AM to 7:59 AM (415, 17.5%) for males and 8:00 AM to 8:29 AM (554, 29.2%) for females.
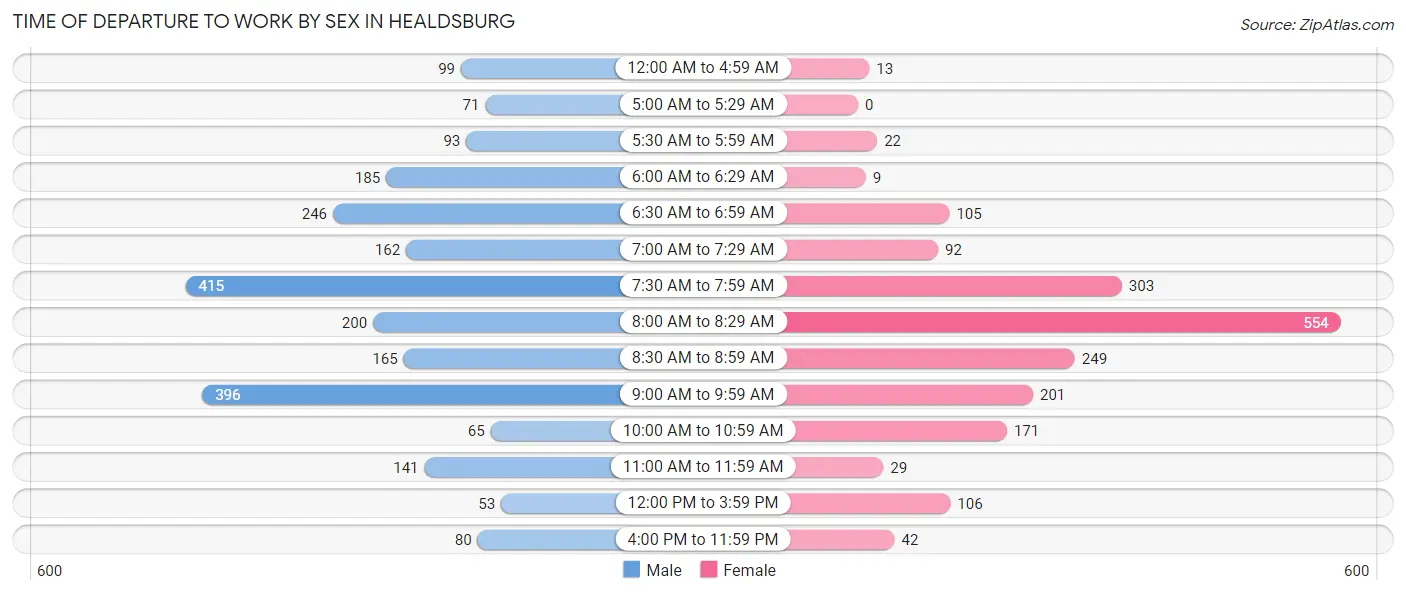
| Time of Departure | Male | Female |
| 12:00 AM to 4:59 AM | 99 (4.2%) | 13 (0.7%) |
| 5:00 AM to 5:29 AM | 71 (3.0%) | 0 (0.0%) |
| 5:30 AM to 5:59 AM | 93 (3.9%) | 22 (1.2%) |
| 6:00 AM to 6:29 AM | 185 (7.8%) | 9 (0.5%) |
| 6:30 AM to 6:59 AM | 246 (10.4%) | 105 (5.5%) |
| 7:00 AM to 7:29 AM | 162 (6.8%) | 92 (4.9%) |
| 7:30 AM to 7:59 AM | 415 (17.5%) | 303 (16.0%) |
| 8:00 AM to 8:29 AM | 200 (8.4%) | 554 (29.2%) |
| 8:30 AM to 8:59 AM | 165 (7.0%) | 249 (13.1%) |
| 9:00 AM to 9:59 AM | 396 (16.7%) | 201 (10.6%) |
| 10:00 AM to 10:59 AM | 65 (2.7%) | 171 (9.0%) |
| 11:00 AM to 11:59 AM | 141 (5.9%) | 29 (1.5%) |
| 12:00 PM to 3:59 PM | 53 (2.2%) | 106 (5.6%) |
| 4:00 PM to 11:59 PM | 80 (3.4%) | 42 (2.2%) |
| Total | 2,371 (100.0%) | 1,896 (100.0%) |
Housing Occupancy in Healdsburg
Occupancy by Ownership in Healdsburg
Of the total 4,838 dwellings in Healdsburg, owner-occupied units account for 2,765 (57.2%), while renter-occupied units make up 2,073 (42.8%).
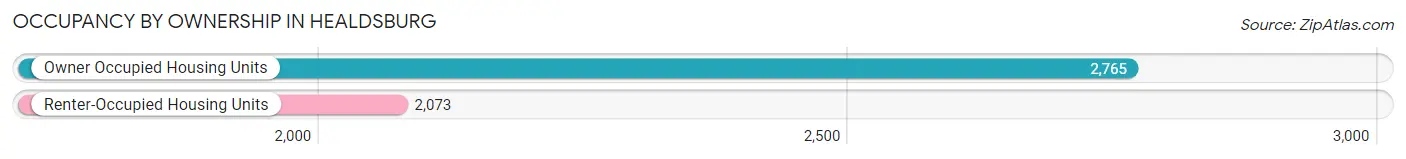
| Occupancy | # Housing Units | % Housing Units |
| Owner Occupied Housing Units | 2,765 | 57.2% |
| Renter-Occupied Housing Units | 2,073 | 42.8% |
| Total Occupied Housing Units | 4,838 | 100.0% |
Occupancy by Household Size in Healdsburg
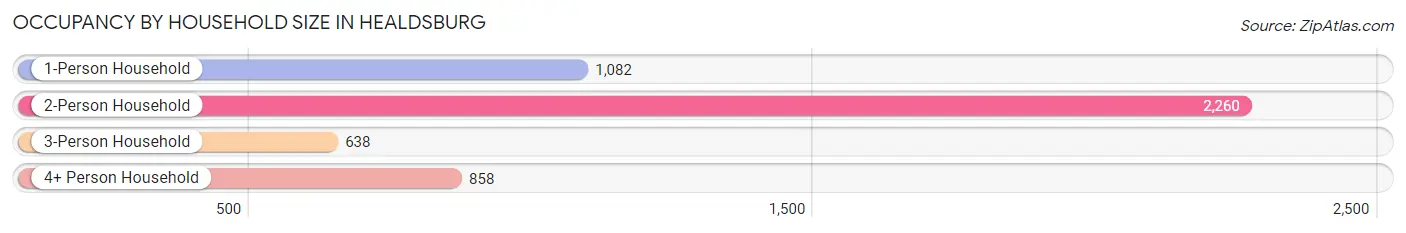
| Household Size | # Housing Units | % Housing Units |
| 1-Person Household | 1,082 | 22.4% |
| 2-Person Household | 2,260 | 46.7% |
| 3-Person Household | 638 | 13.2% |
| 4+ Person Household | 858 | 17.7% |
| Total Housing Units | 4,838 | 100.0% |
Occupancy by Ownership by Household Size in Healdsburg
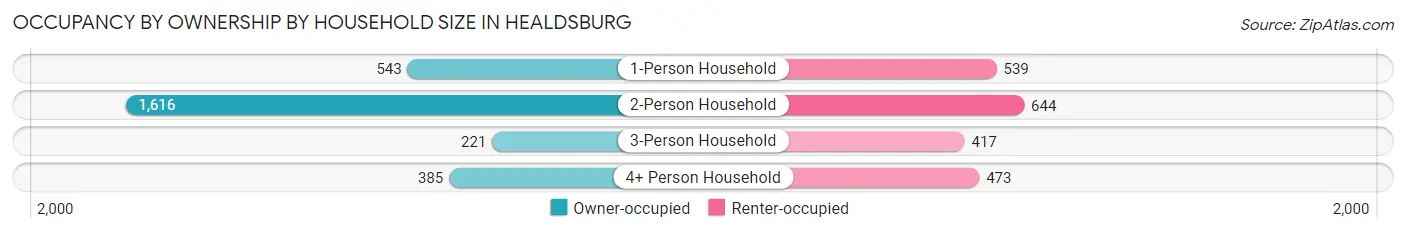
| Household Size | Owner-occupied | Renter-occupied |
| 1-Person Household | 543 (50.2%) | 539 (49.8%) |
| 2-Person Household | 1,616 (71.5%) | 644 (28.5%) |
| 3-Person Household | 221 (34.6%) | 417 (65.4%) |
| 4+ Person Household | 385 (44.9%) | 473 (55.1%) |
| Total Housing Units | 2,765 (57.2%) | 2,073 (42.8%) |
Occupancy by Educational Attainment in Healdsburg
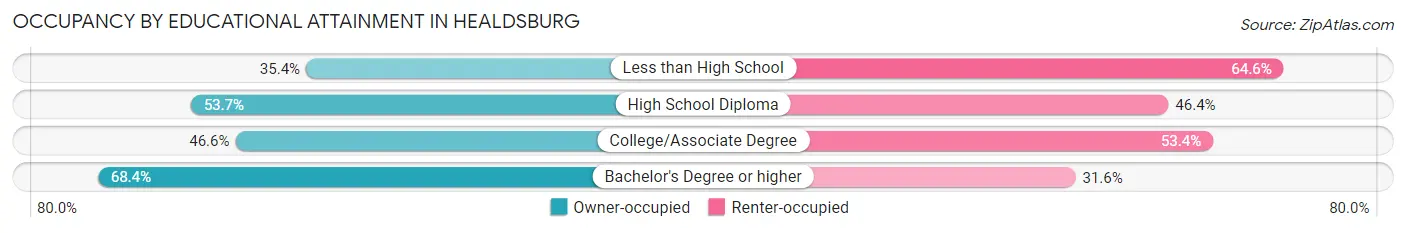
| Household Size | Owner-occupied | Renter-occupied |
| Less than High School | 92 (35.4%) | 168 (64.6%) |
| High School Diploma | 331 (53.6%) | 286 (46.4%) |
| College/Associate Degree | 783 (46.6%) | 898 (53.4%) |
| Bachelor's Degree or higher | 1,559 (68.4%) | 721 (31.6%) |
Occupancy by Age of Householder in Healdsburg
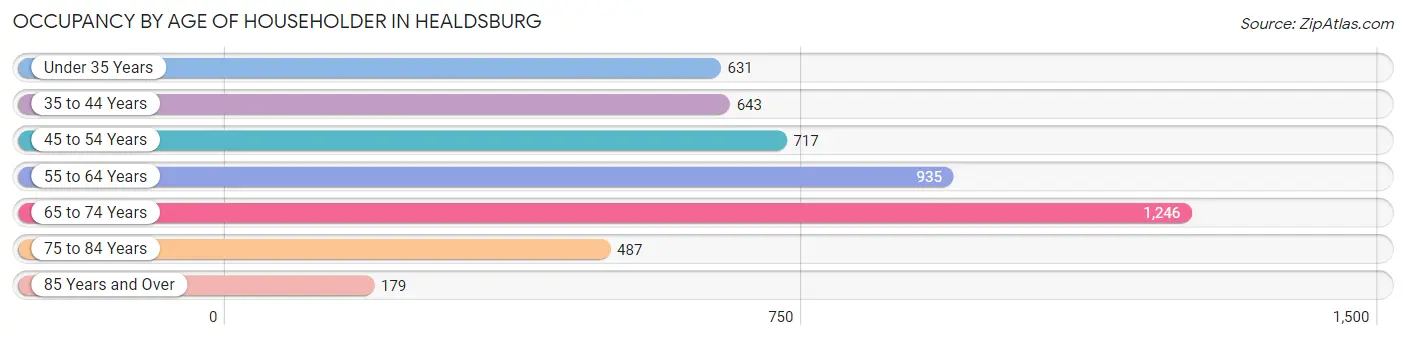
| Age Bracket | # Households | % Households |
| Under 35 Years | 631 | 13.0% |
| 35 to 44 Years | 643 | 13.3% |
| 45 to 54 Years | 717 | 14.8% |
| 55 to 64 Years | 935 | 19.3% |
| 65 to 74 Years | 1,246 | 25.8% |
| 75 to 84 Years | 487 | 10.1% |
| 85 Years and Over | 179 | 3.7% |
| Total | 4,838 | 100.0% |
Housing Finances in Healdsburg
Median Income by Occupancy in Healdsburg
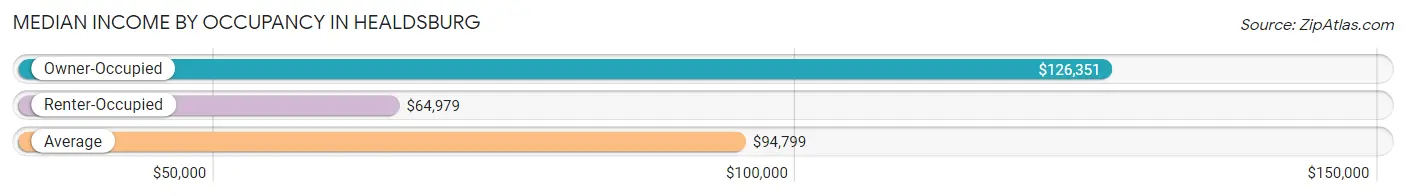
| Occupancy Type | # Households | Median Income |
| Owner-Occupied | 2,765 (57.2%) | $126,351 |
| Renter-Occupied | 2,073 (42.8%) | $64,979 |
| Average | 4,838 (100.0%) | $94,799 |
Occupancy by Householder Income Bracket in Healdsburg
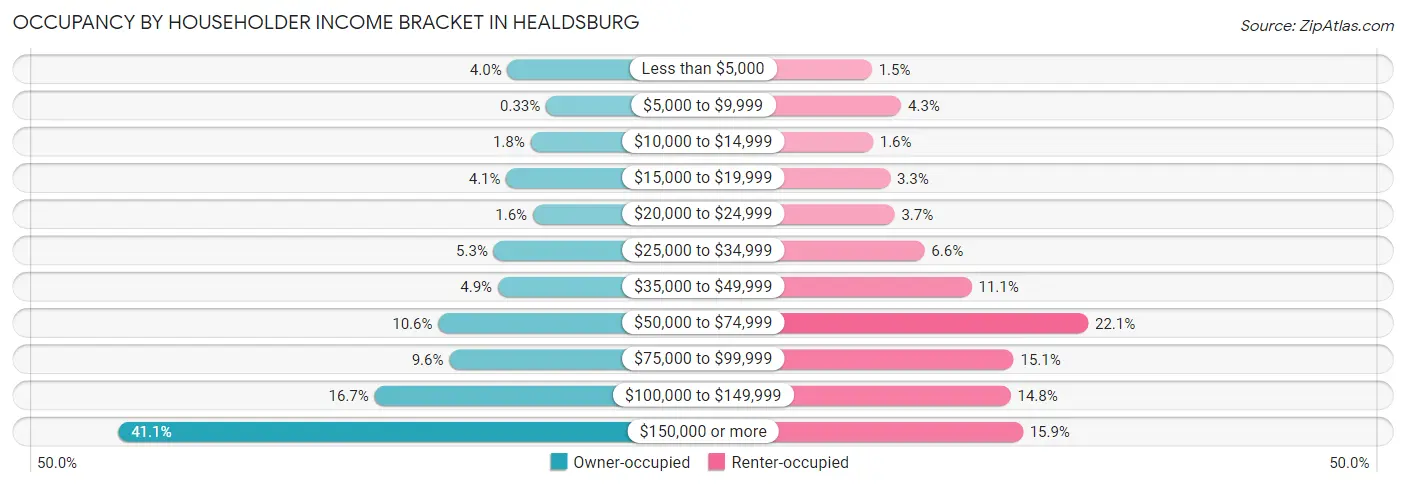
| Income Bracket | Owner-occupied | Renter-occupied |
| Less than $5,000 | 111 (4.0%) | 32 (1.5%) |
| $5,000 to $9,999 | 9 (0.3%) | 90 (4.3%) |
| $10,000 to $14,999 | 50 (1.8%) | 34 (1.6%) |
| $15,000 to $19,999 | 114 (4.1%) | 68 (3.3%) |
| $20,000 to $24,999 | 44 (1.6%) | 77 (3.7%) |
| $25,000 to $34,999 | 147 (5.3%) | 136 (6.6%) |
| $35,000 to $49,999 | 136 (4.9%) | 229 (11.1%) |
| $50,000 to $74,999 | 293 (10.6%) | 459 (22.1%) |
| $75,000 to $99,999 | 264 (9.6%) | 312 (15.0%) |
| $100,000 to $149,999 | 461 (16.7%) | 306 (14.8%) |
| $150,000 or more | 1,136 (41.1%) | 330 (15.9%) |
| Total | 2,765 (100.0%) | 2,073 (100.0%) |
Monthly Housing Cost Tiers in Healdsburg
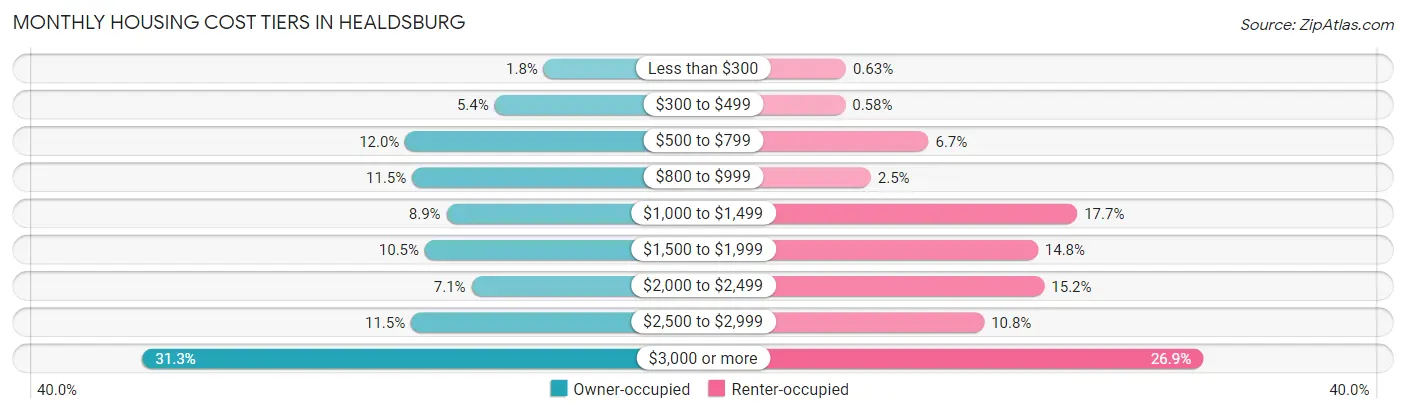
| Monthly Cost | Owner-occupied | Renter-occupied |
| Less than $300 | 49 (1.8%) | 13 (0.6%) |
| $300 to $499 | 149 (5.4%) | 12 (0.6%) |
| $500 to $799 | 331 (12.0%) | 139 (6.7%) |
| $800 to $999 | 317 (11.5%) | 51 (2.5%) |
| $1,000 to $1,499 | 247 (8.9%) | 366 (17.7%) |
| $1,500 to $1,999 | 291 (10.5%) | 306 (14.8%) |
| $2,000 to $2,499 | 196 (7.1%) | 316 (15.2%) |
| $2,500 to $2,999 | 319 (11.5%) | 224 (10.8%) |
| $3,000 or more | 866 (31.3%) | 558 (26.9%) |
| Total | 2,765 (100.0%) | 2,073 (100.0%) |
Physical Housing Characteristics in Healdsburg
Housing Structures in Healdsburg
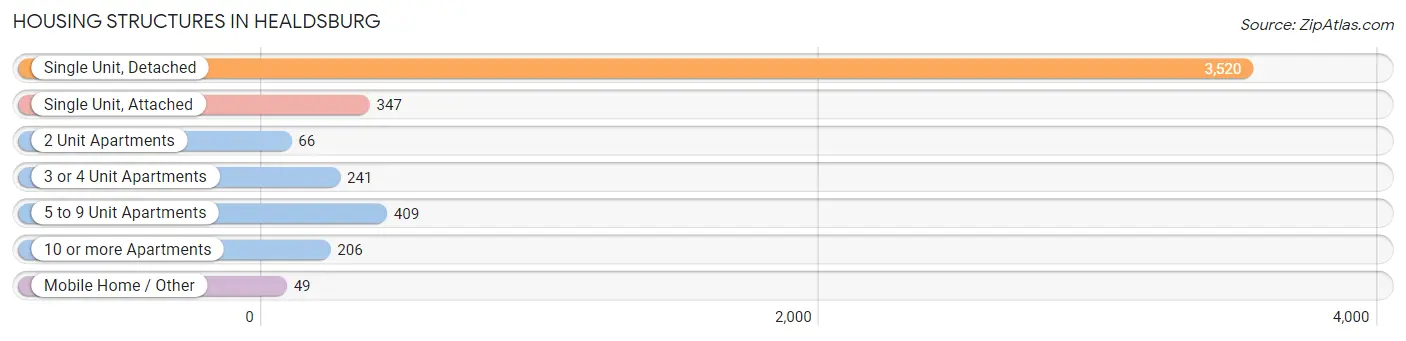
| Structure Type | # Housing Units | % Housing Units |
| Single Unit, Detached | 3,520 | 72.8% |
| Single Unit, Attached | 347 | 7.2% |
| 2 Unit Apartments | 66 | 1.4% |
| 3 or 4 Unit Apartments | 241 | 5.0% |
| 5 to 9 Unit Apartments | 409 | 8.5% |
| 10 or more Apartments | 206 | 4.3% |
| Mobile Home / Other | 49 | 1.0% |
| Total | 4,838 | 100.0% |
Housing Structures by Occupancy in Healdsburg
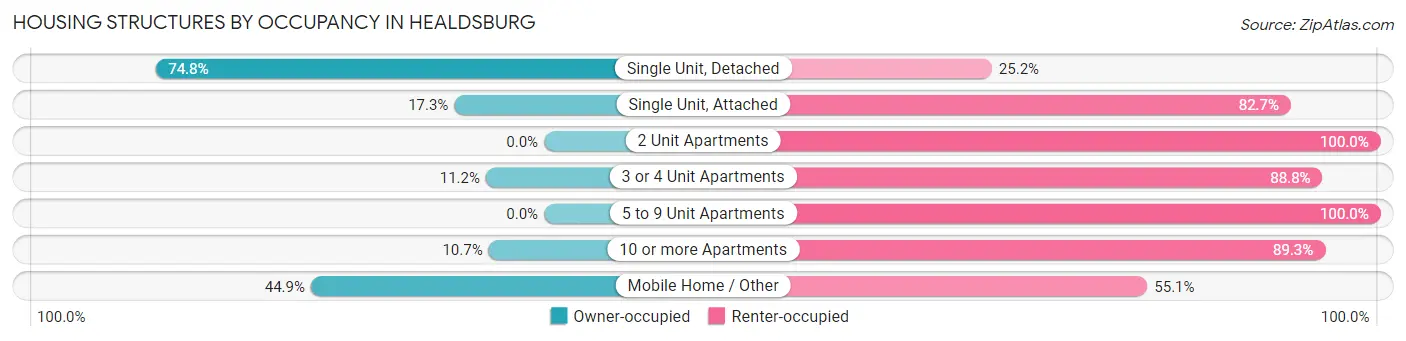
| Structure Type | Owner-occupied | Renter-occupied |
| Single Unit, Detached | 2,634 (74.8%) | 886 (25.2%) |
| Single Unit, Attached | 60 (17.3%) | 287 (82.7%) |
| 2 Unit Apartments | 0 (0.0%) | 66 (100.0%) |
| 3 or 4 Unit Apartments | 27 (11.2%) | 214 (88.8%) |
| 5 to 9 Unit Apartments | 0 (0.0%) | 409 (100.0%) |
| 10 or more Apartments | 22 (10.7%) | 184 (89.3%) |
| Mobile Home / Other | 22 (44.9%) | 27 (55.1%) |
| Total | 2,765 (57.2%) | 2,073 (42.8%) |
Housing Structures by Number of Rooms in Healdsburg
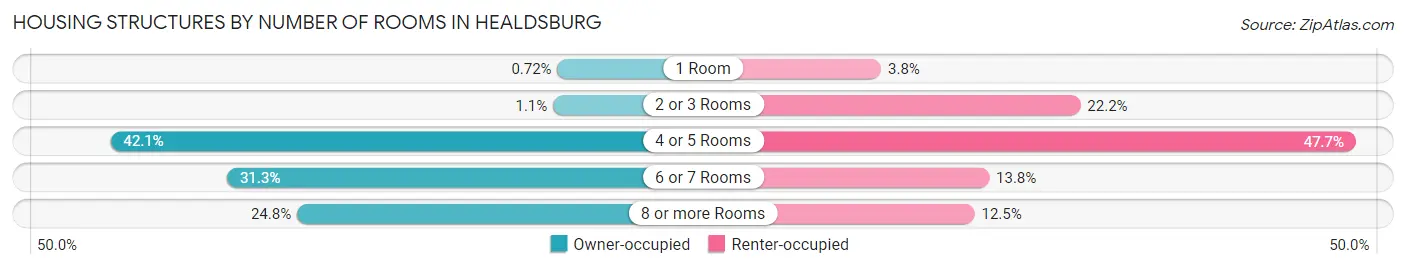
| Number of Rooms | Owner-occupied | Renter-occupied |
| 1 Room | 20 (0.7%) | 79 (3.8%) |
| 2 or 3 Rooms | 31 (1.1%) | 461 (22.2%) |
| 4 or 5 Rooms | 1,163 (42.1%) | 989 (47.7%) |
| 6 or 7 Rooms | 865 (31.3%) | 286 (13.8%) |
| 8 or more Rooms | 686 (24.8%) | 258 (12.4%) |
| Total | 2,765 (100.0%) | 2,073 (100.0%) |
Housing Structure by Heating Type in Healdsburg
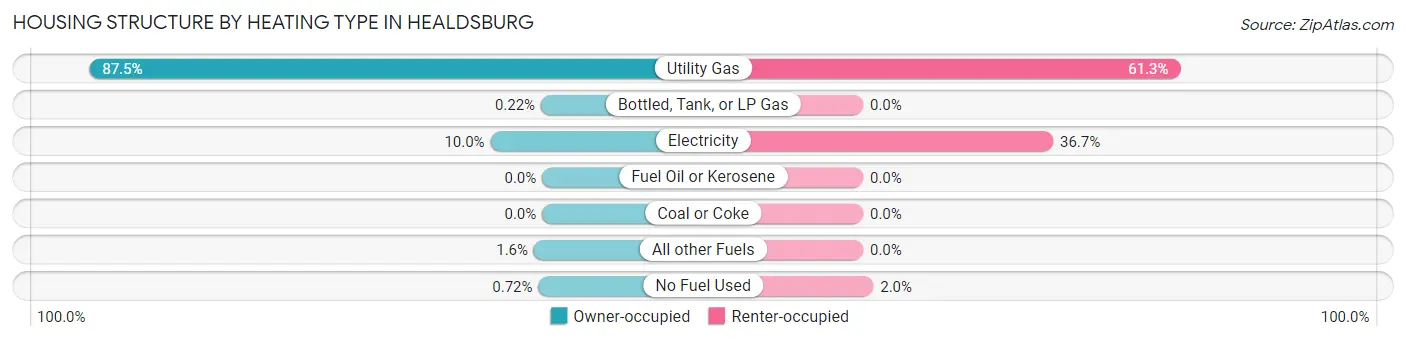
| Heating Type | Owner-occupied | Renter-occupied |
| Utility Gas | 2,419 (87.5%) | 1,271 (61.3%) |
| Bottled, Tank, or LP Gas | 6 (0.2%) | 0 (0.0%) |
| Electricity | 276 (10.0%) | 761 (36.7%) |
| Fuel Oil or Kerosene | 0 (0.0%) | 0 (0.0%) |
| Coal or Coke | 0 (0.0%) | 0 (0.0%) |
| All other Fuels | 44 (1.6%) | 0 (0.0%) |
| No Fuel Used | 20 (0.7%) | 41 (2.0%) |
| Total | 2,765 (100.0%) | 2,073 (100.0%) |
Household Vehicle Usage in Healdsburg
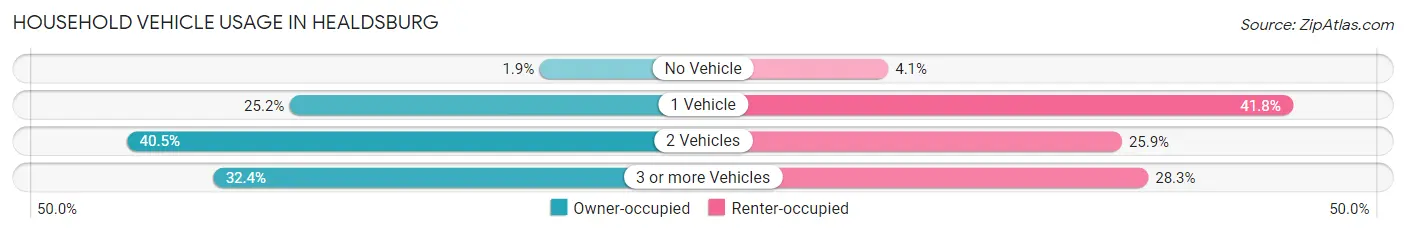
| Vehicles per Household | Owner-occupied | Renter-occupied |
| No Vehicle | 52 (1.9%) | 84 (4.1%) |
| 1 Vehicle | 697 (25.2%) | 866 (41.8%) |
| 2 Vehicles | 1,119 (40.5%) | 536 (25.9%) |
| 3 or more Vehicles | 897 (32.4%) | 587 (28.3%) |
| Total | 2,765 (100.0%) | 2,073 (100.0%) |
Real Estate & Mortgages in Healdsburg
Real Estate and Mortgage Overview in Healdsburg
| Characteristic | Without Mortgage | With Mortgage |
| Housing Units | 1,167 | 1,598 |
| Median Property Value | $914,200 | $955,300 |
| Median Household Income | $95,744 | $824 |
| Monthly Housing Costs | $847 | $866 |
| Real Estate Taxes | $4,441 | $0 |
Property Value by Mortgage Status in Healdsburg
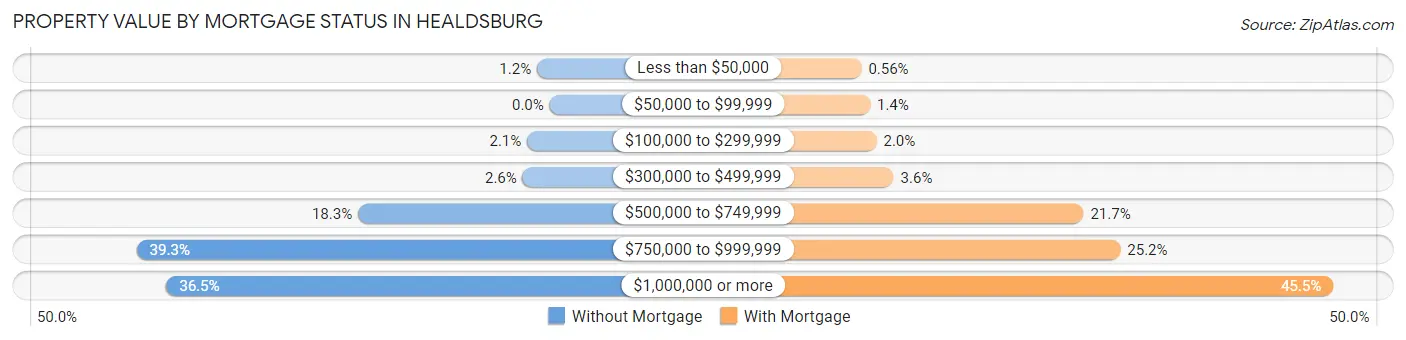
| Property Value | Without Mortgage | With Mortgage |
| Less than $50,000 | 14 (1.2%) | 9 (0.6%) |
| $50,000 to $99,999 | 0 (0.0%) | 22 (1.4%) |
| $100,000 to $299,999 | 25 (2.1%) | 32 (2.0%) |
| $300,000 to $499,999 | 30 (2.6%) | 58 (3.6%) |
| $500,000 to $749,999 | 213 (18.2%) | 347 (21.7%) |
| $750,000 to $999,999 | 459 (39.3%) | 403 (25.2%) |
| $1,000,000 or more | 426 (36.5%) | 727 (45.5%) |
| Total | 1,167 (100.0%) | 1,598 (100.0%) |
Household Income by Mortgage Status in Healdsburg
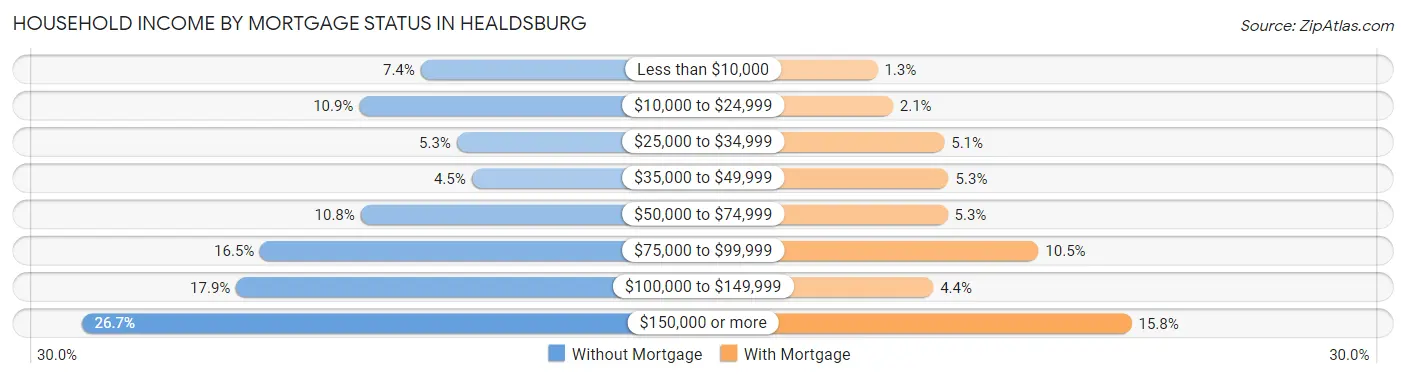
| Household Income | Without Mortgage | With Mortgage |
| Less than $10,000 | 86 (7.4%) | 20 (1.3%) |
| $10,000 to $24,999 | 127 (10.9%) | 34 (2.1%) |
| $25,000 to $34,999 | 62 (5.3%) | 81 (5.1%) |
| $35,000 to $49,999 | 52 (4.5%) | 85 (5.3%) |
| $50,000 to $74,999 | 126 (10.8%) | 84 (5.3%) |
| $75,000 to $99,999 | 193 (16.5%) | 167 (10.4%) |
| $100,000 to $149,999 | 209 (17.9%) | 71 (4.4%) |
| $150,000 or more | 312 (26.7%) | 252 (15.8%) |
| Total | 1,167 (100.0%) | 1,598 (100.0%) |
Property Value to Household Income Ratio in Healdsburg
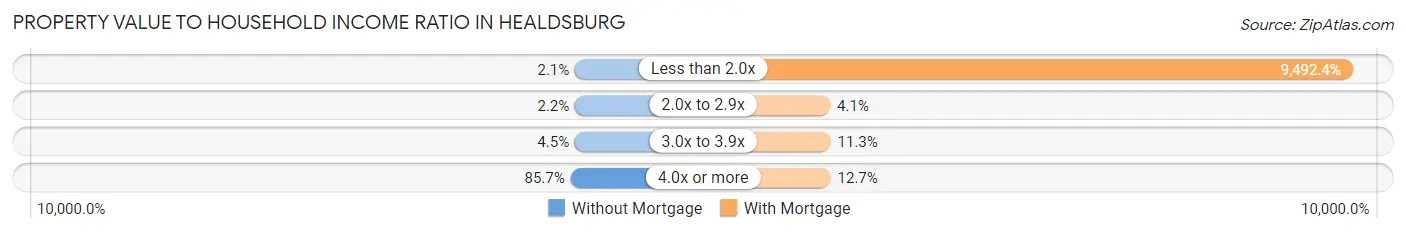
| Value-to-Income Ratio | Without Mortgage | With Mortgage |
| Less than 2.0x | 25 (2.1%) | 151,689 (9,492.4%) |
| 2.0x to 2.9x | 26 (2.2%) | 65 (4.1%) |
| 3.0x to 3.9x | 52 (4.5%) | 180 (11.3%) |
| 4.0x or more | 1,000 (85.7%) | 203 (12.7%) |
| Total | 1,167 (100.0%) | 1,598 (100.0%) |
Real Estate Taxes by Mortgage Status in Healdsburg
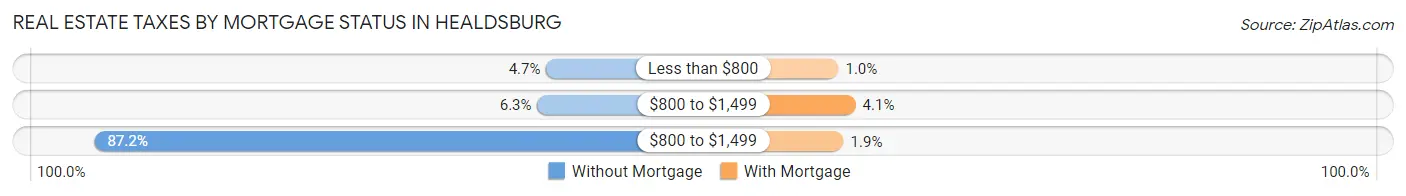
| Property Taxes | Without Mortgage | With Mortgage |
| Less than $800 | 55 (4.7%) | 16 (1.0%) |
| $800 to $1,499 | 74 (6.3%) | 66 (4.1%) |
| $800 to $1,499 | 1,018 (87.2%) | 31 (1.9%) |
| Total | 1,167 (100.0%) | 1,598 (100.0%) |
Health & Disability in Healdsburg
Health Insurance Coverage by Age in Healdsburg
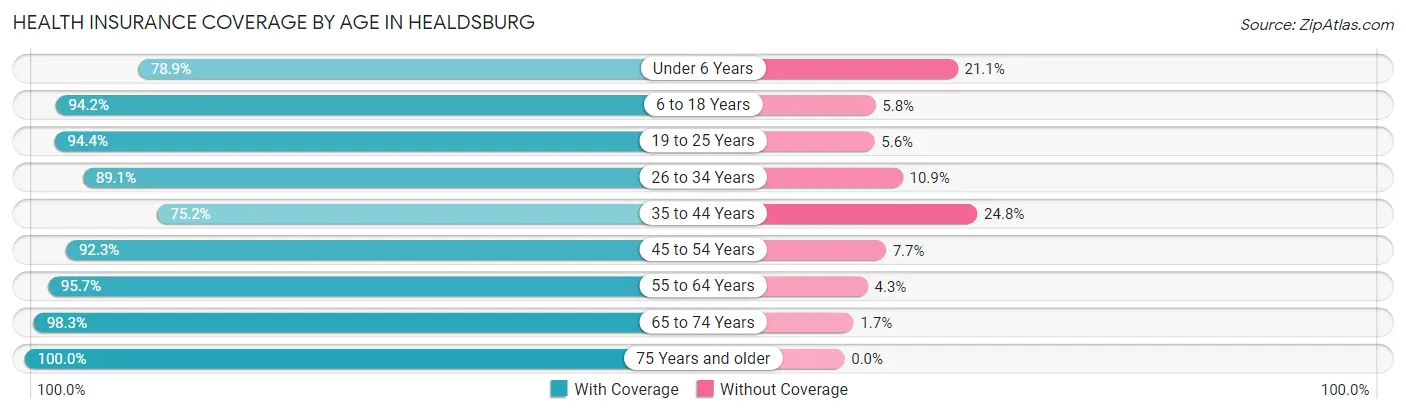
| Age Bracket | With Coverage | Without Coverage |
| Under 6 Years | 519 (78.9%) | 139 (21.1%) |
| 6 to 18 Years | 1,383 (94.2%) | 85 (5.8%) |
| 19 to 25 Years | 858 (94.4%) | 51 (5.6%) |
| 26 to 34 Years | 837 (89.1%) | 102 (10.9%) |
| 35 to 44 Years | 1,014 (75.2%) | 334 (24.8%) |
| 45 to 54 Years | 1,183 (92.3%) | 99 (7.7%) |
| 55 to 64 Years | 1,608 (95.7%) | 73 (4.3%) |
| 65 to 74 Years | 2,183 (98.3%) | 38 (1.7%) |
| 75 Years and older | 919 (100.0%) | 0 (0.0%) |
| Total | 10,504 (91.9%) | 921 (8.1%) |
Health Insurance Coverage by Citizenship Status in Healdsburg
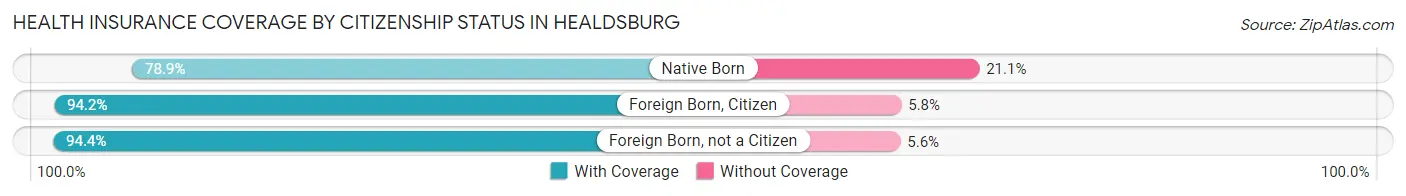
| Citizenship Status | With Coverage | Without Coverage |
| Native Born | 519 (78.9%) | 139 (21.1%) |
| Foreign Born, Citizen | 1,383 (94.2%) | 85 (5.8%) |
| Foreign Born, not a Citizen | 858 (94.4%) | 51 (5.6%) |
Health Insurance Coverage by Household Income in Healdsburg
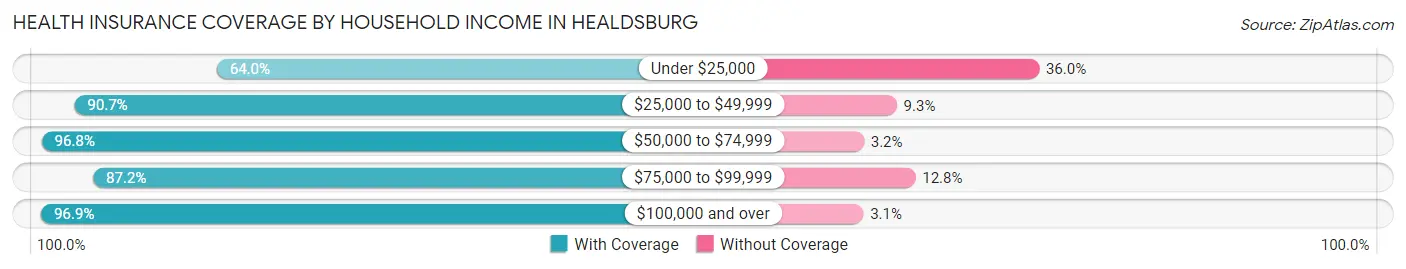
| Household Income | With Coverage | Without Coverage |
| Under $25,000 | 686 (64.0%) | 386 (36.0%) |
| $25,000 to $49,999 | 1,214 (90.7%) | 125 (9.3%) |
| $50,000 to $74,999 | 1,553 (96.8%) | 51 (3.2%) |
| $75,000 to $99,999 | 1,182 (87.2%) | 174 (12.8%) |
| $100,000 and over | 5,819 (96.9%) | 185 (3.1%) |
Public vs Private Health Insurance Coverage by Age in Healdsburg
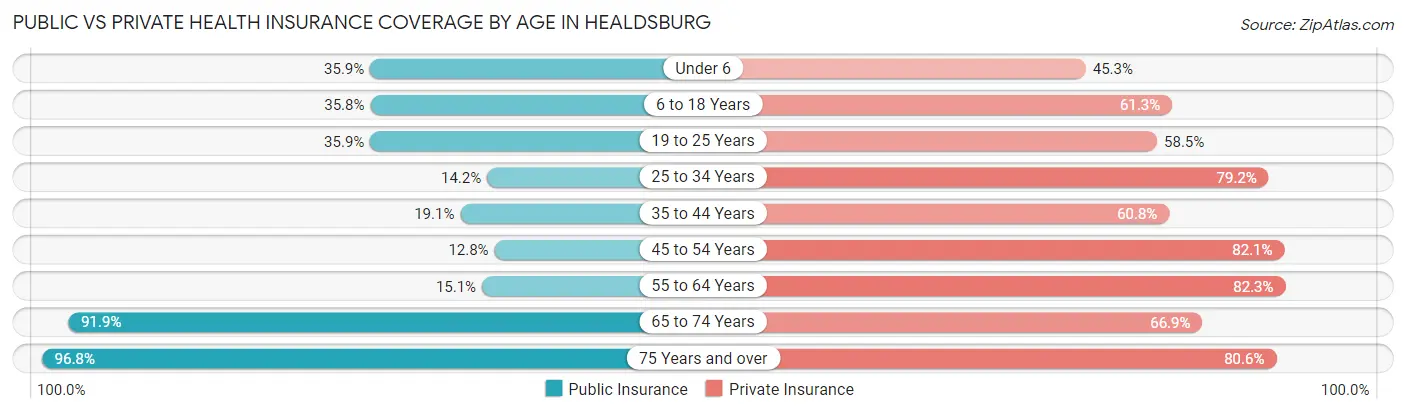
| Age Bracket | Public Insurance | Private Insurance |
| Under 6 | 236 (35.9%) | 298 (45.3%) |
| 6 to 18 Years | 526 (35.8%) | 900 (61.3%) |
| 19 to 25 Years | 326 (35.9%) | 532 (58.5%) |
| 25 to 34 Years | 133 (14.2%) | 744 (79.2%) |
| 35 to 44 Years | 258 (19.1%) | 819 (60.8%) |
| 45 to 54 Years | 164 (12.8%) | 1,053 (82.1%) |
| 55 to 64 Years | 254 (15.1%) | 1,384 (82.3%) |
| 65 to 74 Years | 2,042 (91.9%) | 1,486 (66.9%) |
| 75 Years and over | 890 (96.8%) | 741 (80.6%) |
| Total | 4,829 (42.3%) | 7,957 (69.7%) |
Disability Status by Sex by Age in Healdsburg
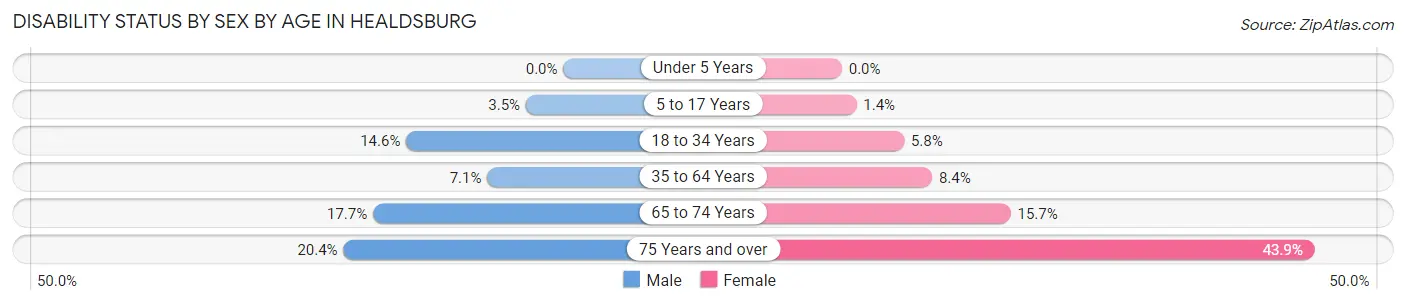
| Age Bracket | Male | Female |
| Under 5 Years | 0 (0.0%) | 0 (0.0%) |
| 5 to 17 Years | 18 (3.5%) | 10 (1.3%) |
| 18 to 34 Years | 178 (14.6%) | 55 (5.8%) |
| 35 to 64 Years | 133 (7.1%) | 203 (8.4%) |
| 65 to 74 Years | 196 (17.7%) | 174 (15.7%) |
| 75 Years and over | 69 (20.4%) | 255 (43.9%) |
Disability Class by Sex by Age in Healdsburg
Disability Class: Hearing Difficulty
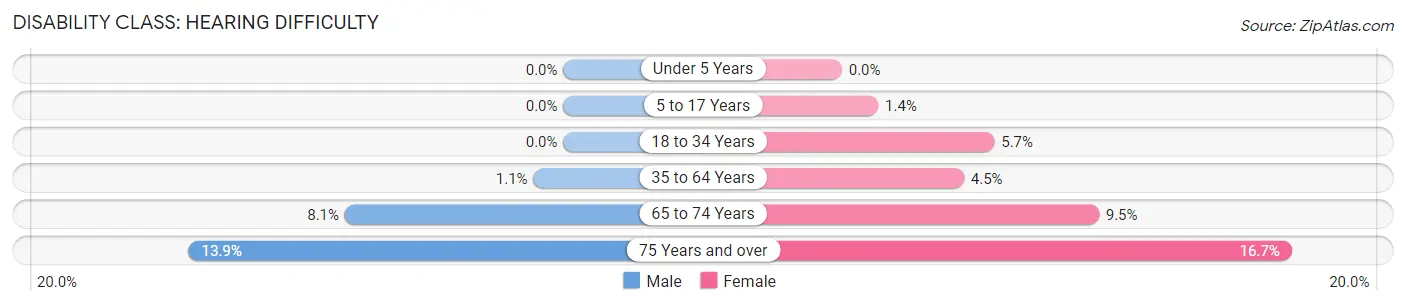
| Age Bracket | Male | Female |
| Under 5 Years | 0 (0.0%) | 0 (0.0%) |
| 5 to 17 Years | 0 (0.0%) | 10 (1.3%) |
| 18 to 34 Years | 0 (0.0%) | 54 (5.7%) |
| 35 to 64 Years | 21 (1.1%) | 110 (4.5%) |
| 65 to 74 Years | 90 (8.1%) | 106 (9.5%) |
| 75 Years and over | 47 (13.9%) | 97 (16.7%) |
Disability Class: Vision Difficulty
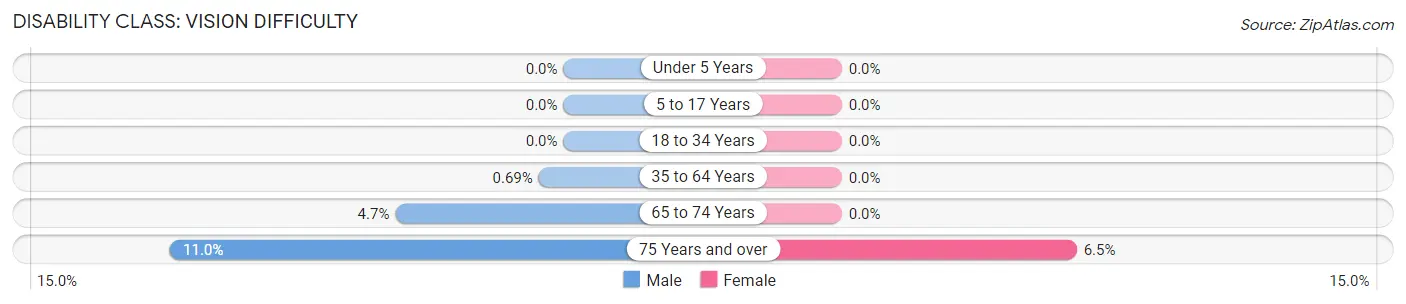
| Age Bracket | Male | Female |
| Under 5 Years | 0 (0.0%) | 0 (0.0%) |
| 5 to 17 Years | 0 (0.0%) | 0 (0.0%) |
| 18 to 34 Years | 0 (0.0%) | 0 (0.0%) |
| 35 to 64 Years | 13 (0.7%) | 0 (0.0%) |
| 65 to 74 Years | 52 (4.7%) | 0 (0.0%) |
| 75 Years and over | 37 (11.0%) | 38 (6.5%) |
Disability Class: Cognitive Difficulty
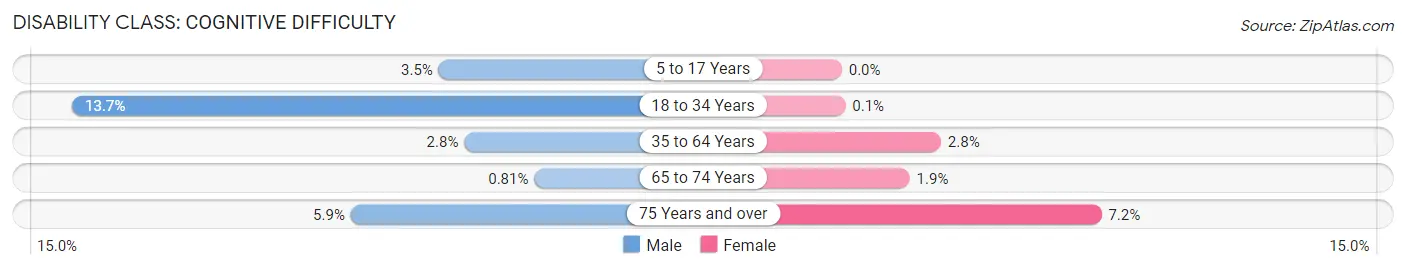
| Age Bracket | Male | Female |
| 5 to 17 Years | 18 (3.5%) | 0 (0.0%) |
| 18 to 34 Years | 167 (13.7%) | 1 (0.1%) |
| 35 to 64 Years | 52 (2.8%) | 67 (2.8%) |
| 65 to 74 Years | 9 (0.8%) | 21 (1.9%) |
| 75 Years and over | 20 (5.9%) | 42 (7.2%) |
Disability Class: Ambulatory Difficulty
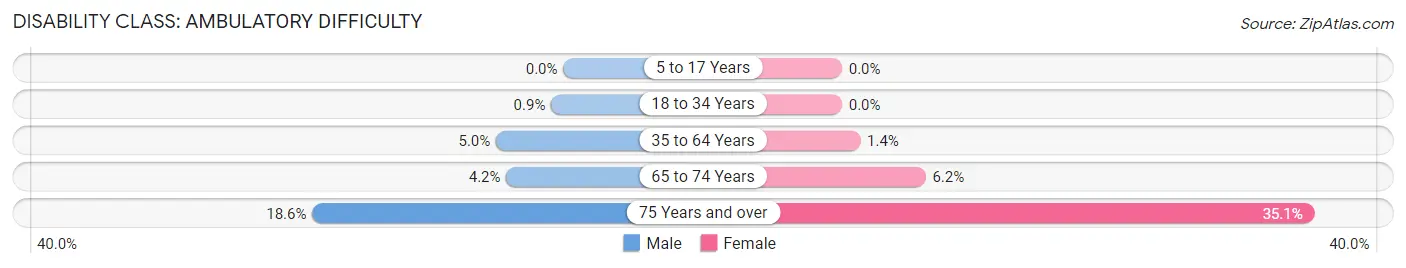
| Age Bracket | Male | Female |
| 5 to 17 Years | 0 (0.0%) | 0 (0.0%) |
| 18 to 34 Years | 11 (0.9%) | 0 (0.0%) |
| 35 to 64 Years | 94 (5.0%) | 33 (1.4%) |
| 65 to 74 Years | 47 (4.2%) | 69 (6.2%) |
| 75 Years and over | 63 (18.6%) | 204 (35.1%) |
Disability Class: Self-Care Difficulty
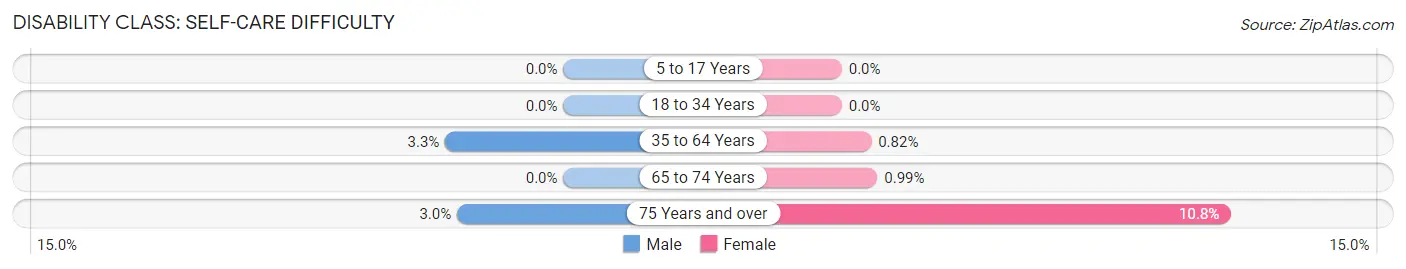
| Age Bracket | Male | Female |
| 5 to 17 Years | 0 (0.0%) | 0 (0.0%) |
| 18 to 34 Years | 0 (0.0%) | 0 (0.0%) |
| 35 to 64 Years | 62 (3.3%) | 20 (0.8%) |
| 65 to 74 Years | 0 (0.0%) | 11 (1.0%) |
| 75 Years and over | 10 (3.0%) | 63 (10.8%) |
Technology Access in Healdsburg
Computing Device Access in Healdsburg
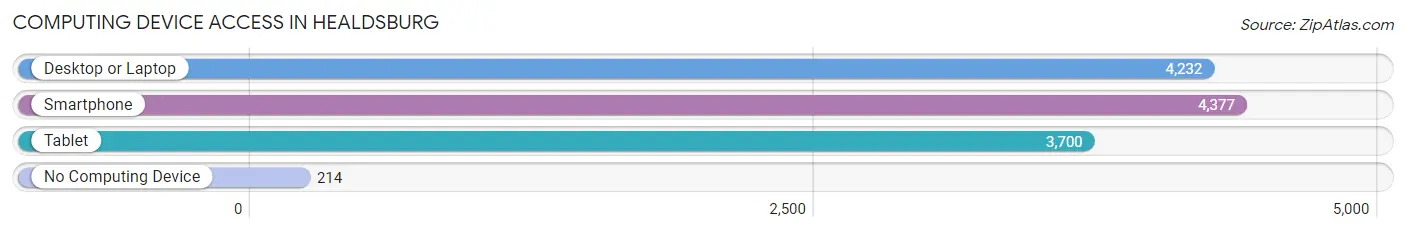
| Device Type | # Households | % Households |
| Desktop or Laptop | 4,232 | 87.5% |
| Smartphone | 4,377 | 90.5% |
| Tablet | 3,700 | 76.5% |
| No Computing Device | 214 | 4.4% |
| Total | 4,838 | 100.0% |
Internet Access in Healdsburg
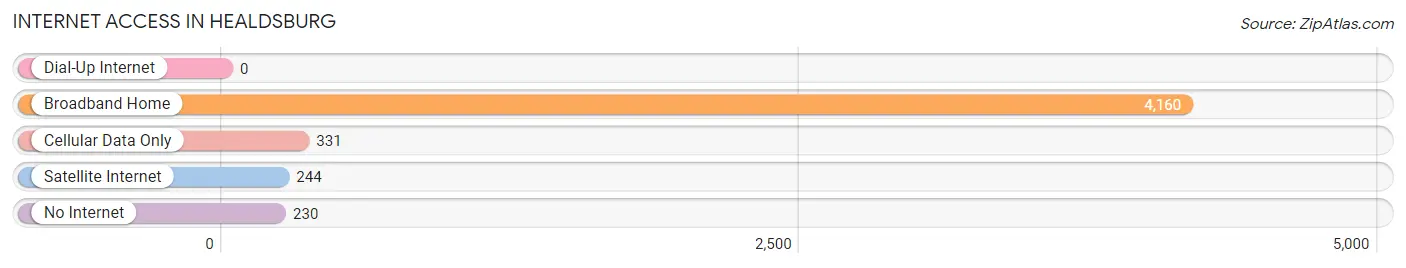
| Internet Type | # Households | % Households |
| Dial-Up Internet | 0 | 0.0% |
| Broadband Home | 4,160 | 86.0% |
| Cellular Data Only | 331 | 6.8% |
| Satellite Internet | 244 | 5.0% |
| No Internet | 230 | 4.8% |
| Total | 4,838 | 100.0% |
Healdsburg Summary
Healdsburg, California is a small city located in Sonoma County, in the heart of the North Bay region of the San Francisco Bay Area. It is situated on the Russian River, about 70 miles north of San Francisco. Healdsburg is known for its wineries, its small-town charm, and its proximity to the Pacific Coast.
History
Healdsburg was founded in 1867 by Harmon Heald, a former Union Army officer who had served in the Civil War. Heald purchased the land from the Pomo Indians and named the town after himself. Healdsburg quickly became a popular destination for travelers, and the town grew rapidly. By the late 19th century, Healdsburg had become a major agricultural center, with vineyards, orchards, and dairies.
In the early 20th century, Healdsburg became a popular tourist destination, with many visitors coming to enjoy the town’s natural beauty and its proximity to the Pacific Coast. The town was also known for its hot springs, which were believed to have healing properties.
In the 1950s, Healdsburg began to experience a decline in population as many of its residents moved away to larger cities. However, in the late 1970s, the town began to experience a resurgence as people began to move back to the area. Today, Healdsburg is a popular tourist destination, with many visitors coming to enjoy the town’s wineries, restaurants, and natural beauty.
Geography
Healdsburg is located in the heart of Sonoma County, in the North Bay region of the San Francisco Bay Area. It is situated on the Russian River, about 70 miles north of San Francisco. The city is surrounded by rolling hills and vineyards, and is known for its mild climate and natural beauty.
The city covers an area of about 4.5 square miles, and has a population of about 11,000 people. The city is divided into four distinct neighborhoods: Downtown, Westside, Eastside, and Northside.
Economy
Healdsburg’s economy is largely based on tourism and agriculture. The city is home to many wineries, and is a popular destination for wine-tasting tours. The city is also home to many restaurants, shops, and art galleries.
Agriculture is also an important part of the local economy. The city is home to many vineyards, orchards, and dairies. The city is also home to many farms, which produce a variety of fruits and vegetables.
Demographics
As of the 2010 census, Healdsburg had a population of 11,254 people. The racial makeup of the city was 79.2% White, 0.7% African American, 0.7% Native American, 1.2% Asian, 0.1% Pacific Islander, 15.2% from other races, and 3.0% from two or more races. Hispanic or Latino of any race were 28.2% of the population.
The median household income in Healdsburg was $60,945, and the median family income was $71,917. The per capita income for the city was $35,945. About 11.2% of families and 14.3% of the population were below the poverty line, including 19.2% of those under age 18 and 6.2% of those age 65 or over.
Common Questions
What is Per Capita Income in Healdsburg?
Per Capita income in Healdsburg is $56,833.
What is the Median Family Income in Healdsburg?
Median Family Income in Healdsburg is $116,849.
What is the Median Household income in Healdsburg?
Median Household Income in Healdsburg is $94,799.
What is Income or Wage Gap in Healdsburg?
Income or Wage Gap in Healdsburg is 26.6%.
Women in Healdsburg earn 73.4 cents for every dollar earned by a man.
What is Inequality or Gini Index in Healdsburg?
Inequality or Gini Index in Healdsburg is 0.48.
What is the Total Population of Healdsburg?
Total Population of Healdsburg is 11,481.
What is the Total Male Population of Healdsburg?
Total Male Population of Healdsburg is 5,381.
What is the Total Female Population of Healdsburg?
Total Female Population of Healdsburg is 6,100.
What is the Ratio of Males per 100 Females in Healdsburg?
There are 88.21 Males per 100 Females in Healdsburg.
What is the Ratio of Females per 100 Males in Healdsburg?
There are 113.36 Females per 100 Males in Healdsburg.
What is the Median Population Age in Healdsburg?
Median Population Age in Healdsburg is 48.5 Years.
What is the Average Family Size in Healdsburg
Average Family Size in Healdsburg is 2.8 People.
What is the Average Household Size in Healdsburg
Average Household Size in Healdsburg is 2.4 People.
How Large is the Labor Force in Healdsburg?
There are 5,872 People in the Labor Forcein in Healdsburg.
What is the Percentage of People in the Labor Force in Healdsburg?
59.3% of People are in the Labor Force in Healdsburg.
What is the Unemployment Rate in Healdsburg?
Unemployment Rate in Healdsburg is 6.1%.