Guerneville, CA Map & Demographics
Guerneville Map
Guerneville Overview
$56,895
PER CAPITA INCOME
$112,431
AVG FAMILY INCOME
$80,159
AVG HOUSEHOLD INCOME
12.1%
WAGE / INCOME GAP [ % ]
87.9¢/ $1
WAGE / INCOME GAP [ $ ]
0.49
INEQUALITY / GINI INDEX
4,764
TOTAL POPULATION
2,640
MALE POPULATION
2,124
FEMALE POPULATION
124.29
MALES / 100 FEMALES
80.45
FEMALES / 100 MALES
53.4
MEDIAN AGE
2.6
AVG FAMILY SIZE
1.9
AVG HOUSEHOLD SIZE
2,517
LABOR FORCE [ PEOPLE ]
57.3%
PERCENT IN LABOR FORCE
9.0%
UNEMPLOYMENT RATE
Guerneville Zip Codes
Guerneville Area Codes
Income in Guerneville
Income Overview in Guerneville
Per Capita Income in Guerneville is $56,895, while median incomes of families and households are $112,431 and $80,159 respectively.
| Characteristic | Number | Measure |
| Per Capita Income | 4,764 | $56,895 |
| Median Family Income | 1,069 | $112,431 |
| Mean Family Income | 1,069 | $153,991 |
| Median Household Income | 2,453 | $80,159 |
| Mean Household Income | 2,453 | $110,469 |
| Income Deficit | 1,069 | $0 |
| Wage / Income Gap (%) | 4,764 | 12.15% |
| Wage / Income Gap ($) | 4,764 | 87.85¢ per $1 |
| Gini / Inequality Index | 4,764 | 0.49 |
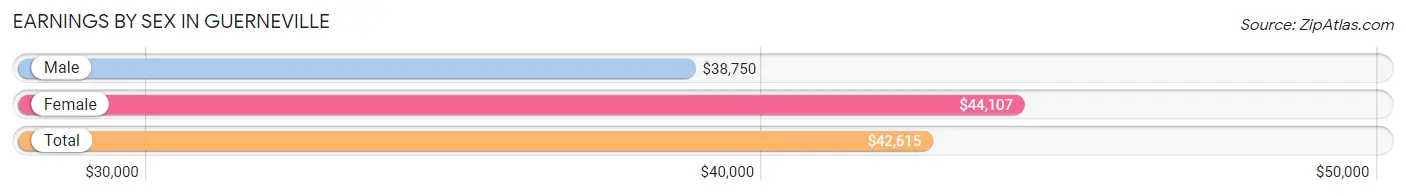
Earnings by Sex in Guerneville
Average Earnings in Guerneville are $42,615, $38,750 for men and $44,107 for women, a difference of 12.1%.
| Sex | Number | Average Earnings |
| Male | 1,464 (55.0%) | $38,750 |
| Female | 1,199 (45.0%) | $44,107 |
| Total | 2,663 (100.0%) | $42,615 |
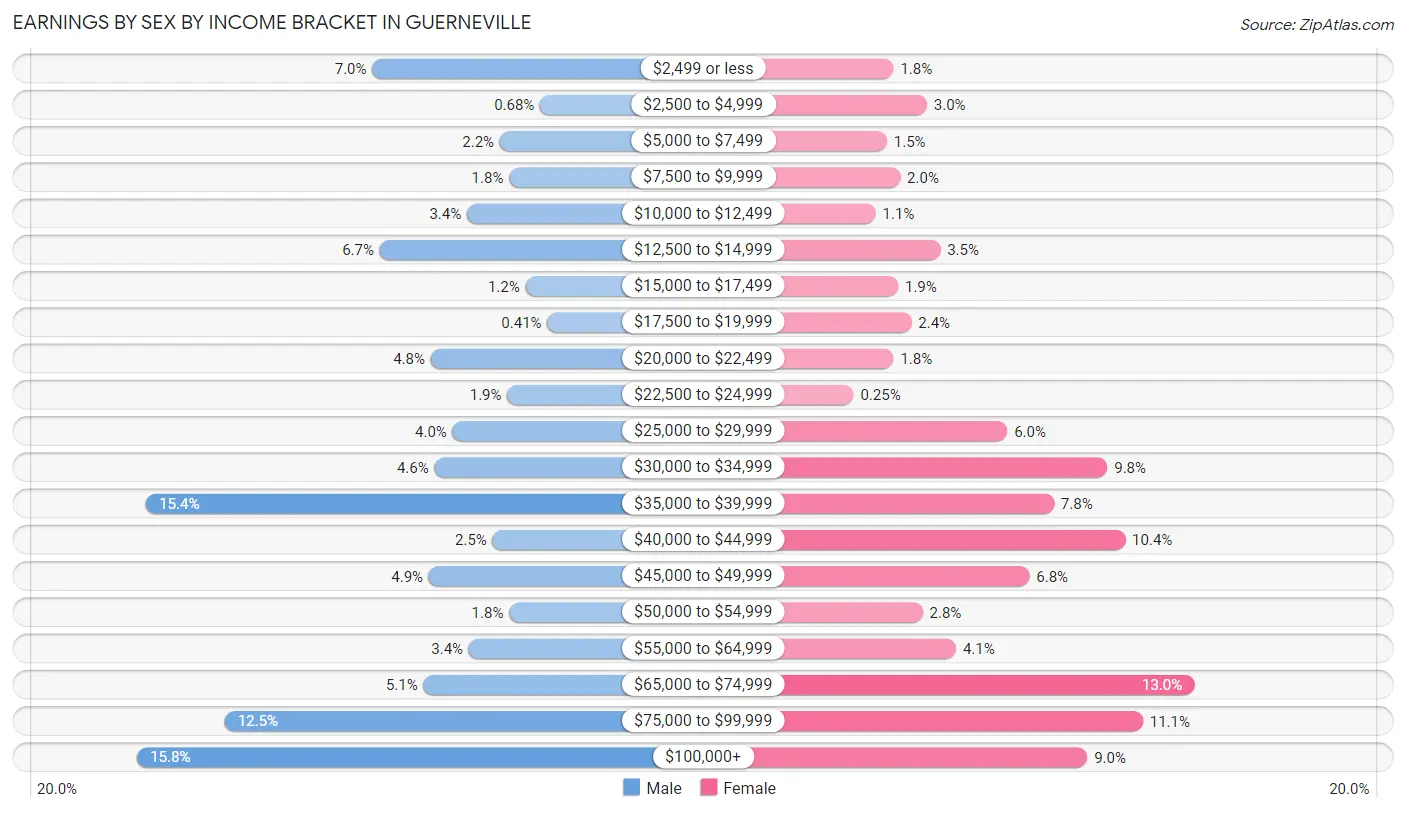
Earnings by Sex by Income Bracket in Guerneville
The most common earnings brackets in Guerneville are $100,000+ for men (231 | 15.8%) and $65,000 to $74,999 for women (156 | 13.0%).
| Income | Male | Female |
| $2,499 or less | 102 (7.0%) | 21 (1.8%) |
| $2,500 to $4,999 | 10 (0.7%) | 36 (3.0%) |
| $5,000 to $7,499 | 32 (2.2%) | 18 (1.5%) |
| $7,500 to $9,999 | 27 (1.8%) | 24 (2.0%) |
| $10,000 to $12,499 | 50 (3.4%) | 13 (1.1%) |
| $12,500 to $14,999 | 98 (6.7%) | 42 (3.5%) |
| $15,000 to $17,499 | 18 (1.2%) | 23 (1.9%) |
| $17,500 to $19,999 | 6 (0.4%) | 29 (2.4%) |
| $20,000 to $22,499 | 70 (4.8%) | 21 (1.8%) |
| $22,500 to $24,999 | 28 (1.9%) | 3 (0.3%) |
| $25,000 to $29,999 | 58 (4.0%) | 72 (6.0%) |
| $30,000 to $34,999 | 68 (4.6%) | 117 (9.8%) |
| $35,000 to $39,999 | 226 (15.4%) | 93 (7.8%) |
| $40,000 to $44,999 | 36 (2.5%) | 125 (10.4%) |
| $45,000 to $49,999 | 71 (4.9%) | 82 (6.8%) |
| $50,000 to $54,999 | 27 (1.8%) | 34 (2.8%) |
| $55,000 to $64,999 | 49 (3.4%) | 49 (4.1%) |
| $65,000 to $74,999 | 74 (5.1%) | 156 (13.0%) |
| $75,000 to $99,999 | 183 (12.5%) | 133 (11.1%) |
| $100,000+ | 231 (15.8%) | 108 (9.0%) |
| Total | 1,464 (100.0%) | 1,199 (100.0%) |
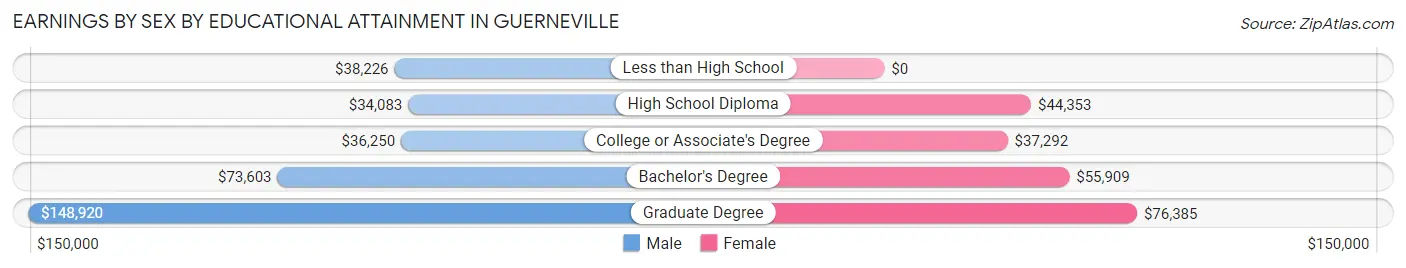
Earnings by Sex by Educational Attainment in Guerneville
Average earnings in Guerneville are $39,826 for men and $45,231 for women, a difference of 11.9%. Men with an educational attainment of graduate degree enjoy the highest average annual earnings of $148,920, while those with high school diploma education earn the least with $34,083. Women with an educational attainment of graduate degree earn the most with the average annual earnings of $76,385, while those with college or associate's degree education have the smallest earnings of $37,292.
| Educational Attainment | Male Income | Female Income |
| Less than High School | $38,226 | $0 |
| High School Diploma | $34,083 | $44,353 |
| College or Associate's Degree | $36,250 | $37,292 |
| Bachelor's Degree | $73,603 | $55,909 |
| Graduate Degree | $148,920 | $76,385 |
| Total | $39,826 | $45,231 |
Family Income in Guerneville
Family Income Brackets in Guerneville
According to the Guerneville family income data, there are 243 families falling into the $200,000+ income range, which is the most common income bracket and makes up 22.7% of all families.
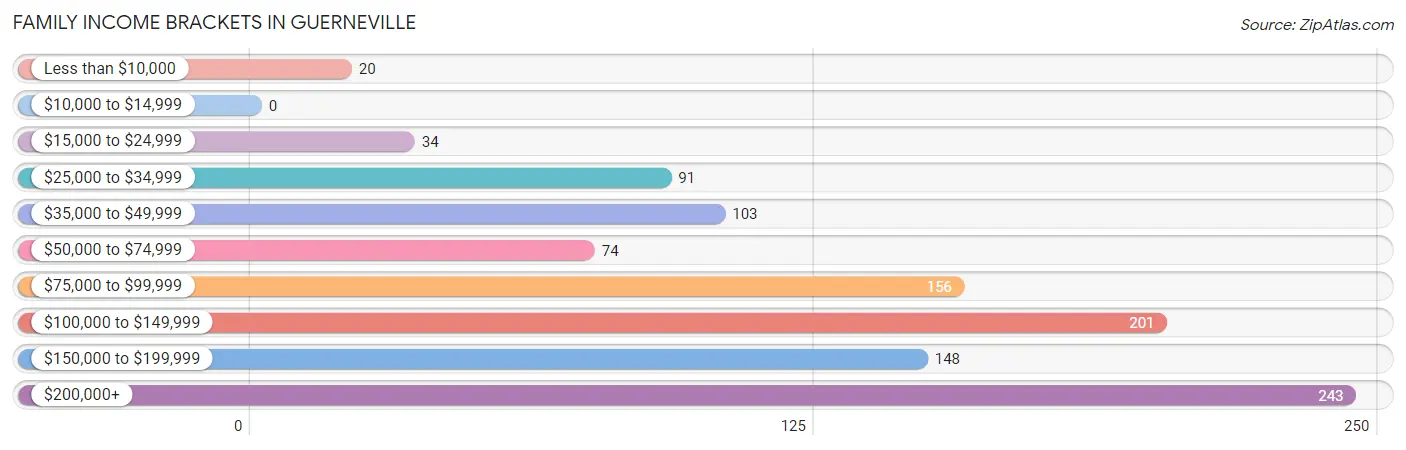
| Income Bracket | # Families | % Families |
| Less than $10,000 | 20 | 1.9% |
| $10,000 to $14,999 | 0 | 0.0% |
| $15,000 to $24,999 | 34 | 3.2% |
| $25,000 to $34,999 | 91 | 8.5% |
| $35,000 to $49,999 | 103 | 9.6% |
| $50,000 to $74,999 | 74 | 6.9% |
| $75,000 to $99,999 | 156 | 14.6% |
| $100,000 to $149,999 | 201 | 18.8% |
| $150,000 to $199,999 | 148 | 13.8% |
| $200,000+ | 243 | 22.7% |
Family Income by Famaliy Size in Guerneville
4-person families (130 | 12.2%) account for the highest median family income in Guerneville with $195,000 per family, while 2-person families (731 | 68.4%) have the highest median income of $53,729 per family member.
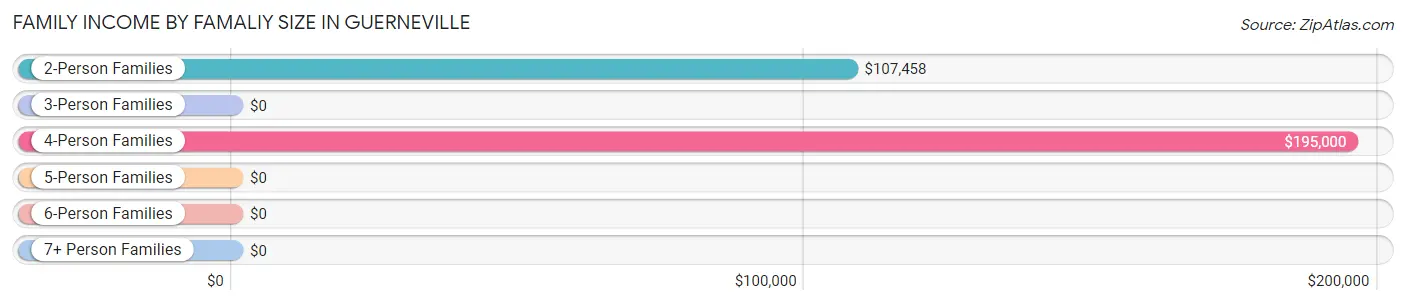
| Income Bracket | # Families | Median Income |
| 2-Person Families | 731 (68.4%) | $107,458 |
| 3-Person Families | 173 (16.2%) | $0 |
| 4-Person Families | 130 (12.2%) | $195,000 |
| 5-Person Families | 10 (0.9%) | $0 |
| 6-Person Families | 18 (1.7%) | $0 |
| 7+ Person Families | 7 (0.6%) | $0 |
| Total | 1,069 (100.0%) | $112,431 |
Family Income by Number of Earners in Guerneville
The median family income in Guerneville is $112,431, with families comprising 3+ earners (129) having the highest median family income of $187,472, while families with 1 earner (347) have the lowest median family income of $62,431, accounting for 12.1% and 32.5% of families, respectively.
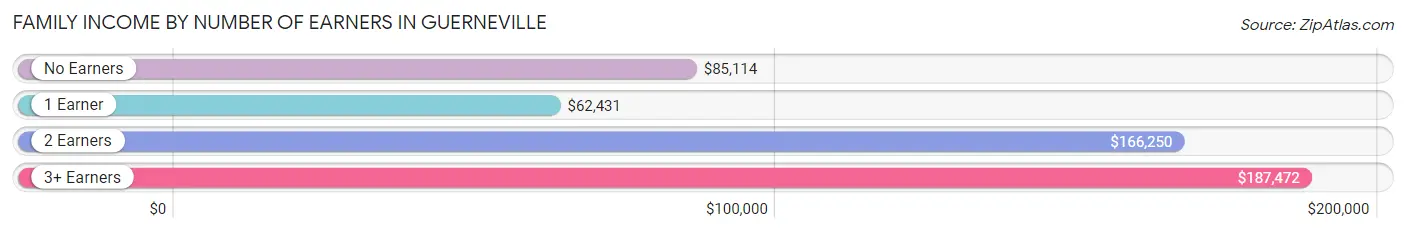
| Number of Earners | # Families | Median Income |
| No Earners | 253 (23.7%) | $85,114 |
| 1 Earner | 347 (32.5%) | $62,431 |
| 2 Earners | 340 (31.8%) | $166,250 |
| 3+ Earners | 129 (12.1%) | $187,472 |
| Total | 1,069 (100.0%) | $112,431 |
Household Income in Guerneville
Household Income Brackets in Guerneville
With 427 households falling in the category, the $75,000 to $99,999 income range is the most frequent in Guerneville, accounting for 17.4% of all households. In contrast, only 120 households (4.9%) fall into the $10,000 to $14,999 income bracket, making it the least populous group.
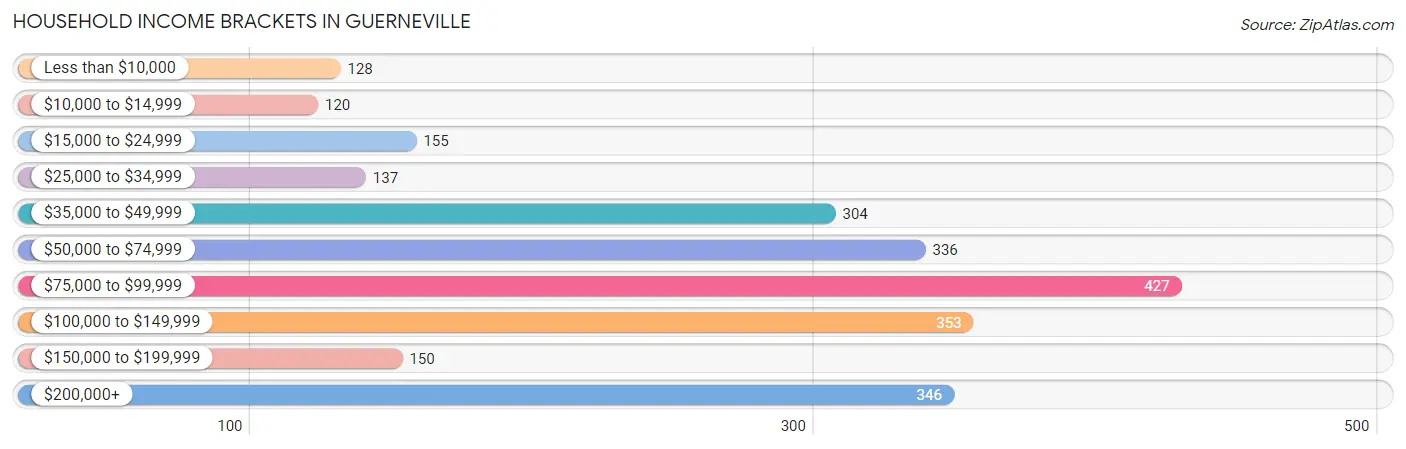
| Income Bracket | # Households | % Households |
| Less than $10,000 | 128 | 5.2% |
| $10,000 to $14,999 | 120 | 4.9% |
| $15,000 to $24,999 | 155 | 6.3% |
| $25,000 to $34,999 | 137 | 5.6% |
| $35,000 to $49,999 | 304 | 12.4% |
| $50,000 to $74,999 | 336 | 13.7% |
| $75,000 to $99,999 | 427 | 17.4% |
| $100,000 to $149,999 | 353 | 14.4% |
| $150,000 to $199,999 | 150 | 6.1% |
| $200,000+ | 346 | 14.1% |
Household Income by Householder Age in Guerneville
The median household income in Guerneville is $80,159, with the highest median household income of $91,250 found in the 15 to 24 years age bracket for the primary householder. A total of 20 households (0.8%) fall into this category. Meanwhile, the 65+ years age bracket for the primary householder has the lowest median household income of $67,500, with 896 households (36.5%) in this group.
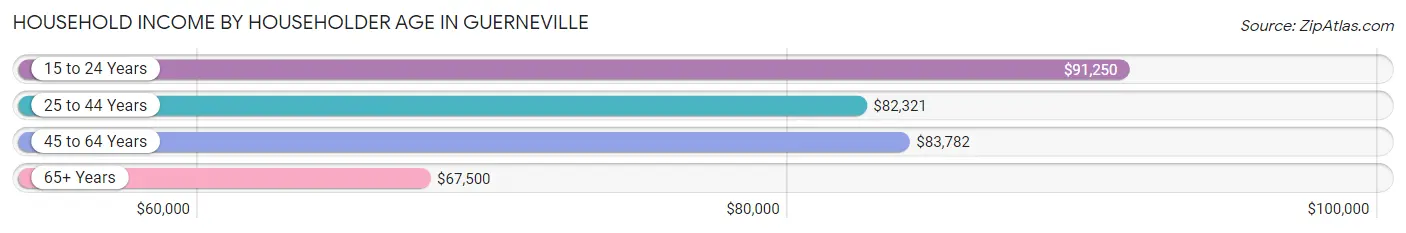
| Income Bracket | # Households | Median Income |
| 15 to 24 Years | 20 (0.8%) | $91,250 |
| 25 to 44 Years | 519 (21.2%) | $82,321 |
| 45 to 64 Years | 1,018 (41.5%) | $83,782 |
| 65+ Years | 896 (36.5%) | $67,500 |
| Total | 2,453 (100.0%) | $80,159 |
Poverty in Guerneville
Income Below Poverty by Sex and Age in Guerneville
With 13.1% poverty level for males and 3.6% for females among the residents of Guerneville, 75 year old and over males and 18 to 24 year old females are the most vulnerable to poverty, with 76 males (38.2%) and 14 females (10.4%) in their respective age groups living below the poverty level.
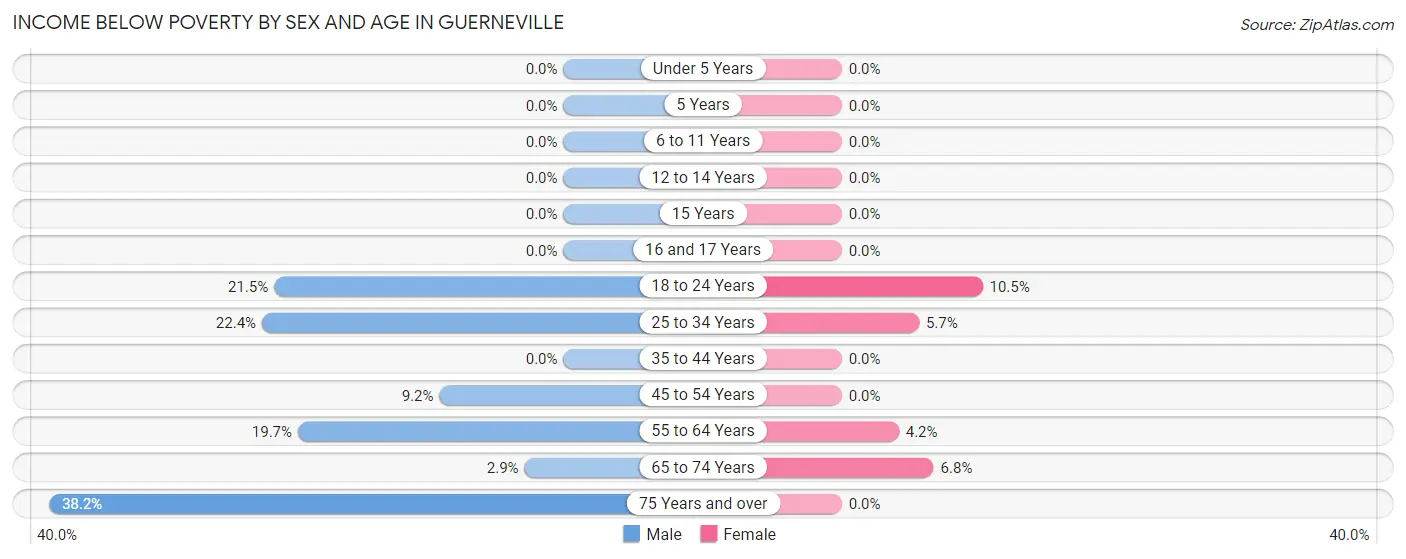
| Age Bracket | Male | Female |
| Under 5 Years | 0 (0.0%) | 0 (0.0%) |
| 5 Years | 0 (0.0%) | 0 (0.0%) |
| 6 to 11 Years | 0 (0.0%) | 0 (0.0%) |
| 12 to 14 Years | 0 (0.0%) | 0 (0.0%) |
| 15 Years | 0 (0.0%) | 0 (0.0%) |
| 16 and 17 Years | 0 (0.0%) | 0 (0.0%) |
| 18 to 24 Years | 32 (21.5%) | 14 (10.4%) |
| 25 to 34 Years | 79 (22.4%) | 20 (5.7%) |
| 35 to 44 Years | 0 (0.0%) | 0 (0.0%) |
| 45 to 54 Years | 35 (9.2%) | 0 (0.0%) |
| 55 to 64 Years | 108 (19.7%) | 14 (4.2%) |
| 65 to 74 Years | 16 (2.9%) | 27 (6.8%) |
| 75 Years and over | 76 (38.2%) | 0 (0.0%) |
| Total | 346 (13.1%) | 75 (3.6%) |
Income Above Poverty by Sex and Age in Guerneville
According to the poverty statistics in Guerneville, males aged under 5 years and females aged under 5 years are the age groups that are most secure financially, with 100.0% of males and 100.0% of females in these age groups living above the poverty line.
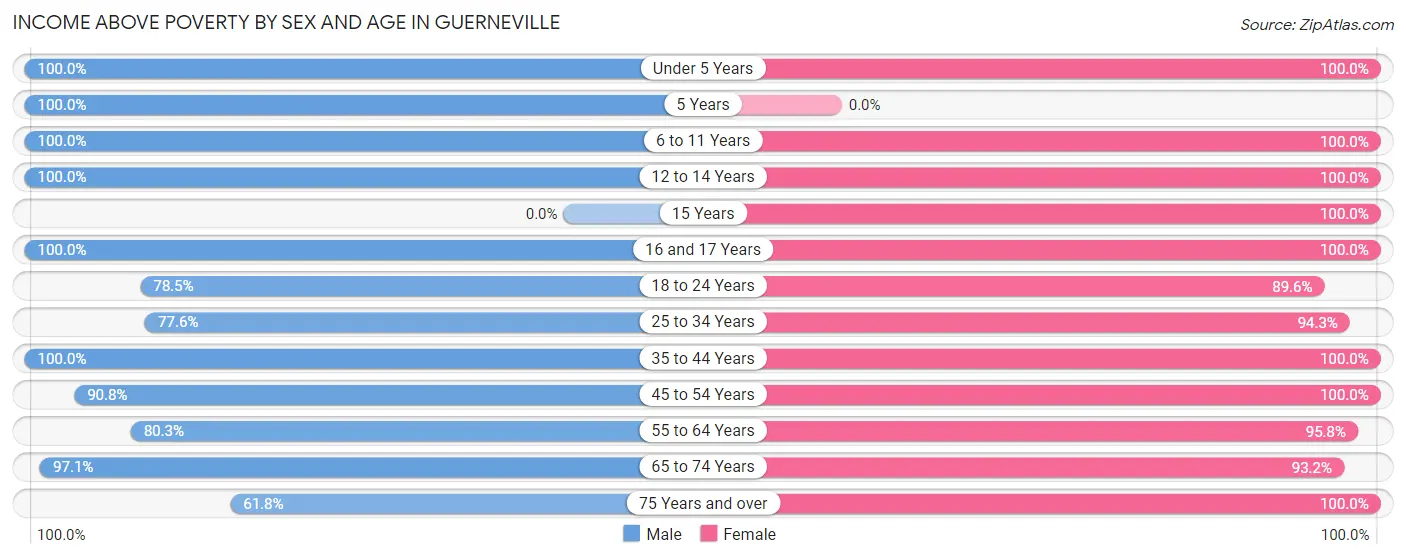
| Age Bracket | Male | Female |
| Under 5 Years | 30 (100.0%) | 26 (100.0%) |
| 5 Years | 21 (100.0%) | 0 (0.0%) |
| 6 to 11 Years | 11 (100.0%) | 42 (100.0%) |
| 12 to 14 Years | 78 (100.0%) | 114 (100.0%) |
| 15 Years | 0 (0.0%) | 22 (100.0%) |
| 16 and 17 Years | 62 (100.0%) | 40 (100.0%) |
| 18 to 24 Years | 117 (78.5%) | 120 (89.5%) |
| 25 to 34 Years | 274 (77.6%) | 329 (94.3%) |
| 35 to 44 Years | 256 (100.0%) | 178 (100.0%) |
| 45 to 54 Years | 345 (90.8%) | 249 (100.0%) |
| 55 to 64 Years | 440 (80.3%) | 317 (95.8%) |
| 65 to 74 Years | 537 (97.1%) | 369 (93.2%) |
| 75 Years and over | 123 (61.8%) | 216 (100.0%) |
| Total | 2,294 (86.9%) | 2,022 (96.4%) |
Income Below Poverty Among Married-Couple Families in Guerneville
The poverty statistics for married-couple families in Guerneville show that 1.0% or 8 of the total 828 families live below the poverty line. Families with no children have the highest poverty rate of 1.3%, comprising of 8 families. On the other hand, families with 1 or 2 children have the lowest poverty rate of 0.0%, which includes 0 families.
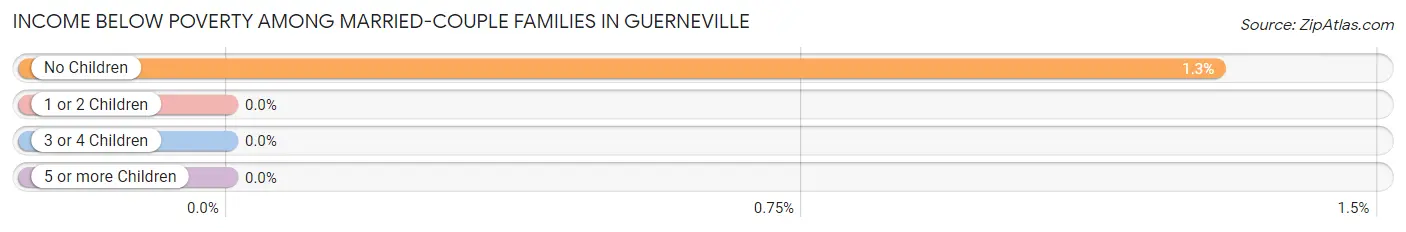
| Children | Above Poverty | Below Poverty |
| No Children | 614 (98.7%) | 8 (1.3%) |
| 1 or 2 Children | 199 (100.0%) | 0 (0.0%) |
| 3 or 4 Children | 0 (0.0%) | 0 (0.0%) |
| 5 or more Children | 7 (100.0%) | 0 (0.0%) |
| Total | 820 (99.0%) | 8 (1.0%) |
Income Below Poverty Among Single-Parent Households in Guerneville
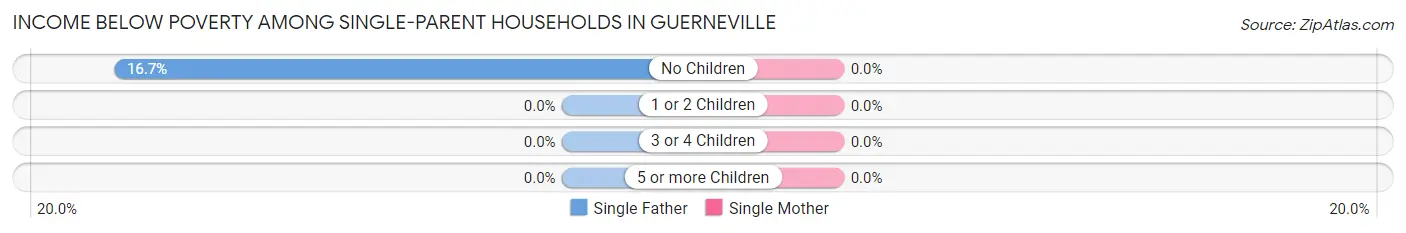
| Children | Single Father | Single Mother |
| No Children | 12 (16.7%) | 0 (0.0%) |
| 1 or 2 Children | 0 (0.0%) | 0 (0.0%) |
| 3 or 4 Children | 0 (0.0%) | 0 (0.0%) |
| 5 or more Children | 0 (0.0%) | 0 (0.0%) |
| Total | 12 (15.0%) | 0 (0.0%) |
Income Below Poverty Among Married-Couple vs Single-Parent Households in Guerneville
The poverty data for Guerneville shows that 8 of the married-couple family households (1.0%) and 12 of the single-parent households (5.0%) are living below the poverty level. Within the married-couple family households, those with no children have the highest poverty rate, with 8 households (1.3%) falling below the poverty line. Among the single-parent households, those with no children have the highest poverty rate, with 12 household (12.4%) living below poverty.
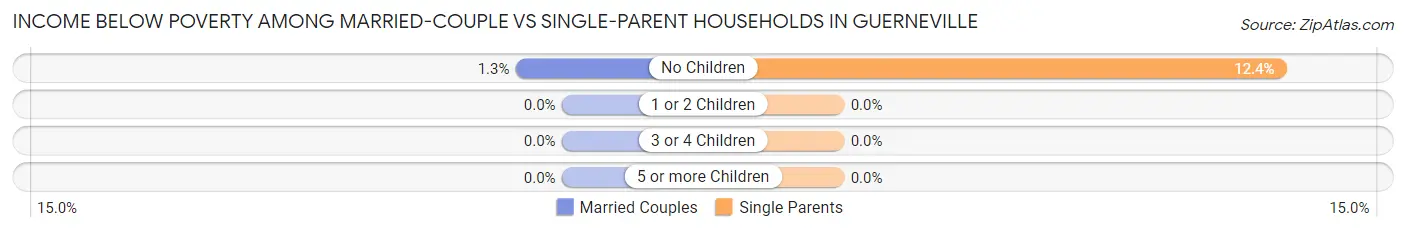
| Children | Married-Couple Families | Single-Parent Households |
| No Children | 8 (1.3%) | 12 (12.4%) |
| 1 or 2 Children | 0 (0.0%) | 0 (0.0%) |
| 3 or 4 Children | 0 (0.0%) | 0 (0.0%) |
| 5 or more Children | 0 (0.0%) | 0 (0.0%) |
| Total | 8 (1.0%) | 12 (5.0%) |
Race in Guerneville
The most populous races in Guerneville are White / Caucasian (3,804 | 79.8%), Hispanic or Latino (765 | 16.1%), and Two or more Races (586 | 12.3%).
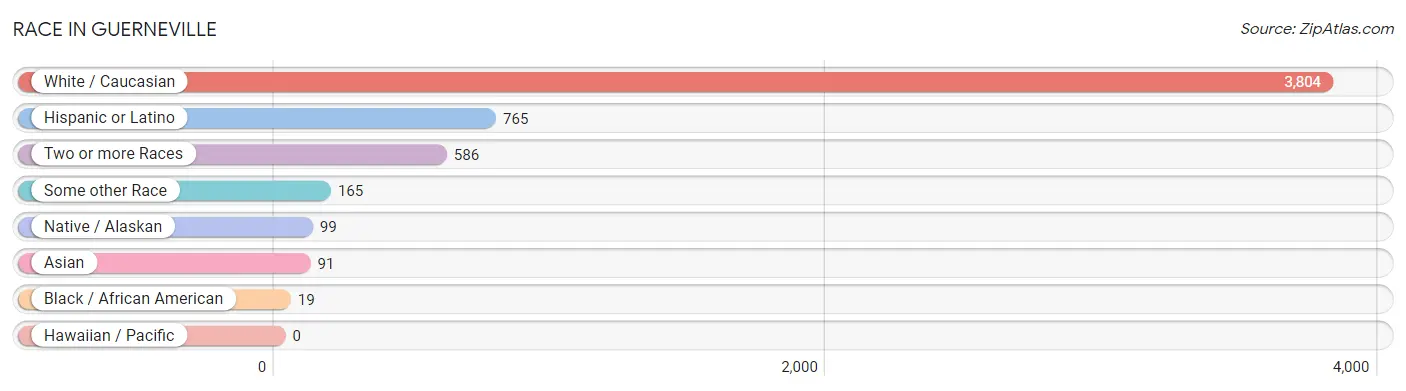
| Race | # Population | % Population |
| Asian | 91 | 1.9% |
| Black / African American | 19 | 0.4% |
| Hawaiian / Pacific | 0 | 0.0% |
| Hispanic or Latino | 765 | 16.1% |
| Native / Alaskan | 99 | 2.1% |
| White / Caucasian | 3,804 | 79.8% |
| Two or more Races | 586 | 12.3% |
| Some other Race | 165 | 3.5% |
| Total | 4,764 | 100.0% |
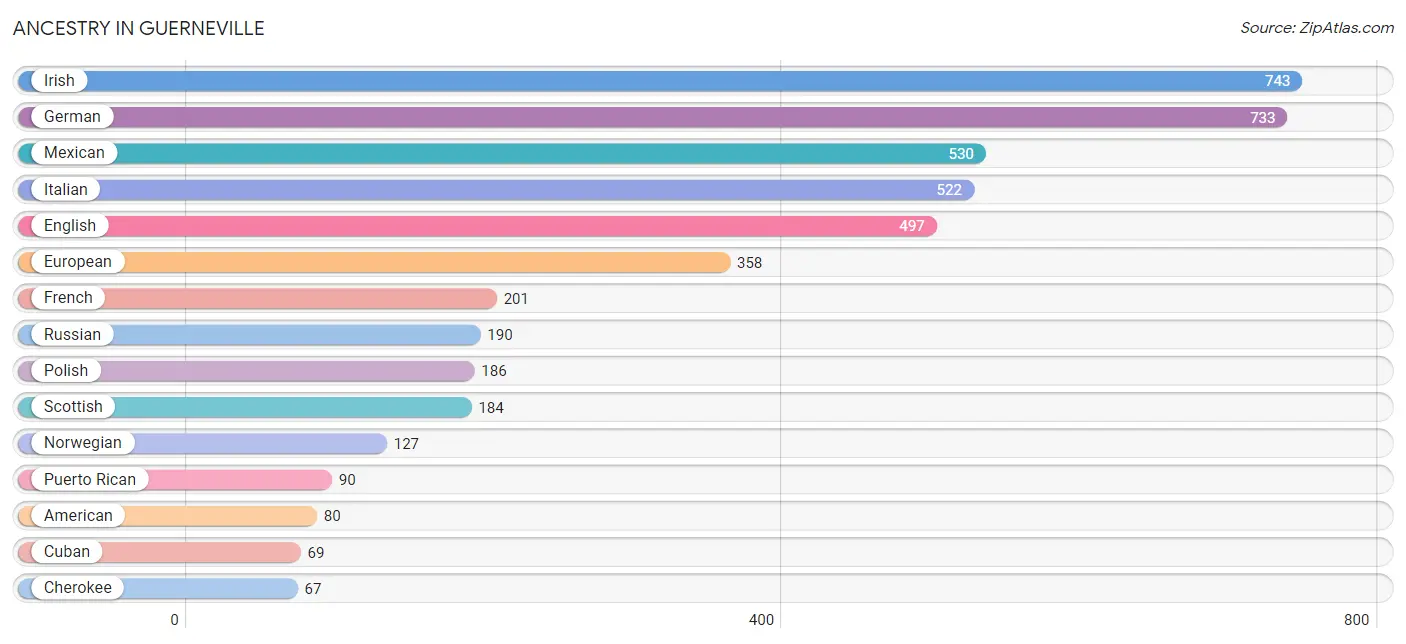
Ancestry in Guerneville
The most populous ancestries reported in Guerneville are Irish (743 | 15.6%), German (733 | 15.4%), Mexican (530 | 11.1%), Italian (522 | 11.0%), and English (497 | 10.4%), together accounting for 63.5% of all Guerneville residents.
| Ancestry | # Population | % Population |
| American | 80 | 1.7% |
| Arab | 11 | 0.2% |
| Armenian | 34 | 0.7% |
| Assyrian / Chaldean / Syriac | 16 | 0.3% |
| Austrian | 18 | 0.4% |
| Bhutanese | 56 | 1.2% |
| Blackfeet | 40 | 0.8% |
| British | 41 | 0.9% |
| Central American | 27 | 0.6% |
| Central American Indian | 27 | 0.6% |
| Cherokee | 67 | 1.4% |
| Choctaw | 8 | 0.2% |
| Croatian | 14 | 0.3% |
| Cuban | 69 | 1.5% |
| Czech | 11 | 0.2% |
| Danish | 61 | 1.3% |
| Dutch | 25 | 0.5% |
| Eastern European | 44 | 0.9% |
| English | 497 | 10.4% |
| European | 358 | 7.5% |
| Finnish | 19 | 0.4% |
| French | 201 | 4.2% |
| French Canadian | 64 | 1.3% |
| German | 733 | 15.4% |
| Guatemalan | 10 | 0.2% |
| Hungarian | 7 | 0.2% |
| Indian (Asian) | 61 | 1.3% |
| Irish | 743 | 15.6% |
| Italian | 522 | 11.0% |
| Korean | 7 | 0.2% |
| Lebanese | 11 | 0.2% |
| Lithuanian | 29 | 0.6% |
| Mexican | 530 | 11.1% |
| Mexican American Indian | 5 | 0.1% |
| Nicaraguan | 10 | 0.2% |
| Northern European | 50 | 1.1% |
| Norwegian | 127 | 2.7% |
| Palestinian | 11 | 0.2% |
| Pennsylvania German | 25 | 0.5% |
| Polish | 186 | 3.9% |
| Portuguese | 38 | 0.8% |
| Puerto Rican | 90 | 1.9% |
| Romanian | 10 | 0.2% |
| Russian | 190 | 4.0% |
| Salvadoran | 7 | 0.2% |
| Scandinavian | 12 | 0.3% |
| Scotch-Irish | 32 | 0.7% |
| Scottish | 184 | 3.9% |
| Shoshone | 40 | 0.8% |
| Slovak | 20 | 0.4% |
| Spaniard | 31 | 0.6% |
| Spanish | 18 | 0.4% |
| Sri Lankan | 17 | 0.4% |
| Swedish | 25 | 0.5% |
| Swiss | 60 | 1.3% |
| Thai | 32 | 0.7% |
| Ukrainian | 20 | 0.4% |
| Welsh | 22 | 0.5% |
| West Indian | 14 | 0.3% |
| Yugoslavian | 17 | 0.4% | View All 60 Rows |
Immigrants in Guerneville
The most numerous immigrant groups reported in Guerneville came from Latin America (122 | 2.6%), Central America (119 | 2.5%), Mexico (112 | 2.4%), Europe (88 | 1.8%), and Asia (68 | 1.4%), together accounting for 10.7% of all Guerneville residents.
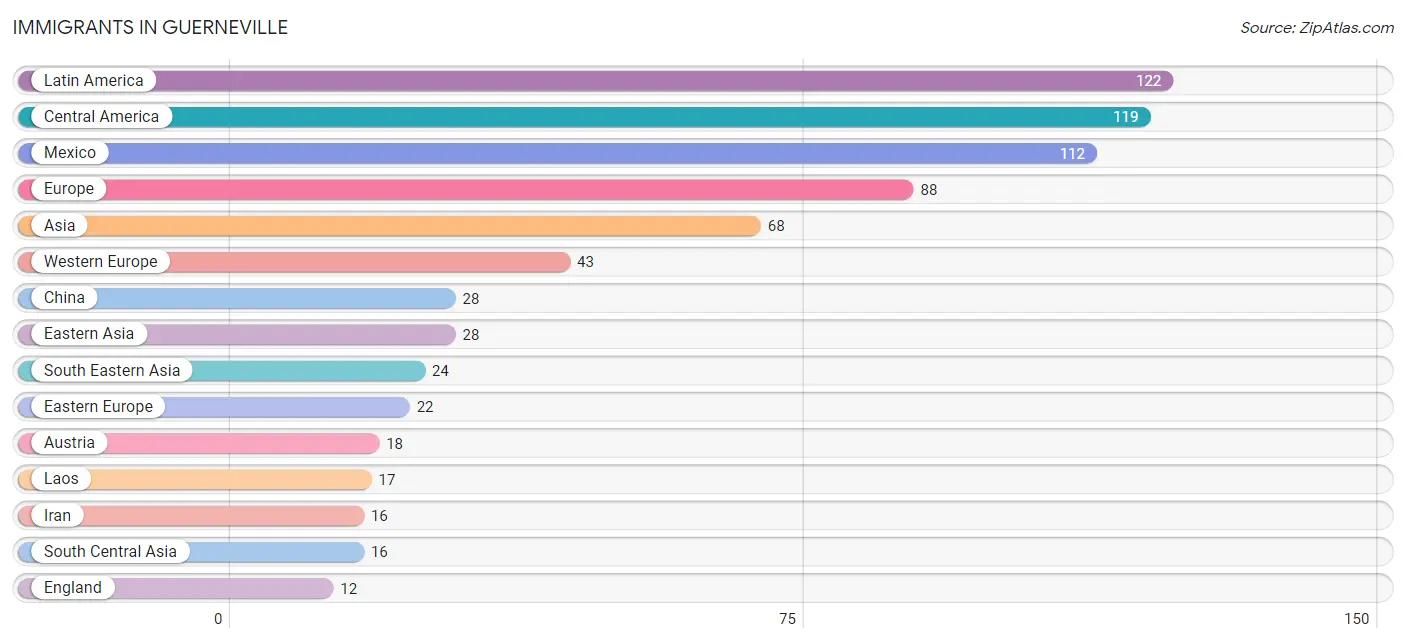
| Immigration Origin | # Population | % Population |
| Asia | 68 | 1.4% |
| Austria | 18 | 0.4% |
| Canada | 8 | 0.2% |
| Caribbean | 3 | 0.1% |
| Central America | 119 | 2.5% |
| China | 28 | 0.6% |
| Cuba | 3 | 0.1% |
| Eastern Asia | 28 | 0.6% |
| Eastern Europe | 22 | 0.5% |
| El Salvador | 7 | 0.2% |
| England | 12 | 0.3% |
| Europe | 88 | 1.8% |
| France | 8 | 0.2% |
| Germany | 8 | 0.2% |
| Iran | 16 | 0.3% |
| Italy | 11 | 0.2% |
| Laos | 17 | 0.4% |
| Latin America | 122 | 2.6% |
| Mexico | 112 | 2.4% |
| Northern Europe | 12 | 0.3% |
| South Central Asia | 16 | 0.3% |
| South Eastern Asia | 24 | 0.5% |
| Southern Europe | 11 | 0.2% |
| Switzerland | 9 | 0.2% |
| Thailand | 7 | 0.2% |
| Ukraine | 11 | 0.2% |
| Western Europe | 43 | 0.9% | View All 27 Rows |
Sex and Age in Guerneville
Sex and Age in Guerneville
The most populous age groups in Guerneville are 65 to 69 Years (365 | 13.8%) for men and 60 to 64 Years (216 | 10.2%) for women.
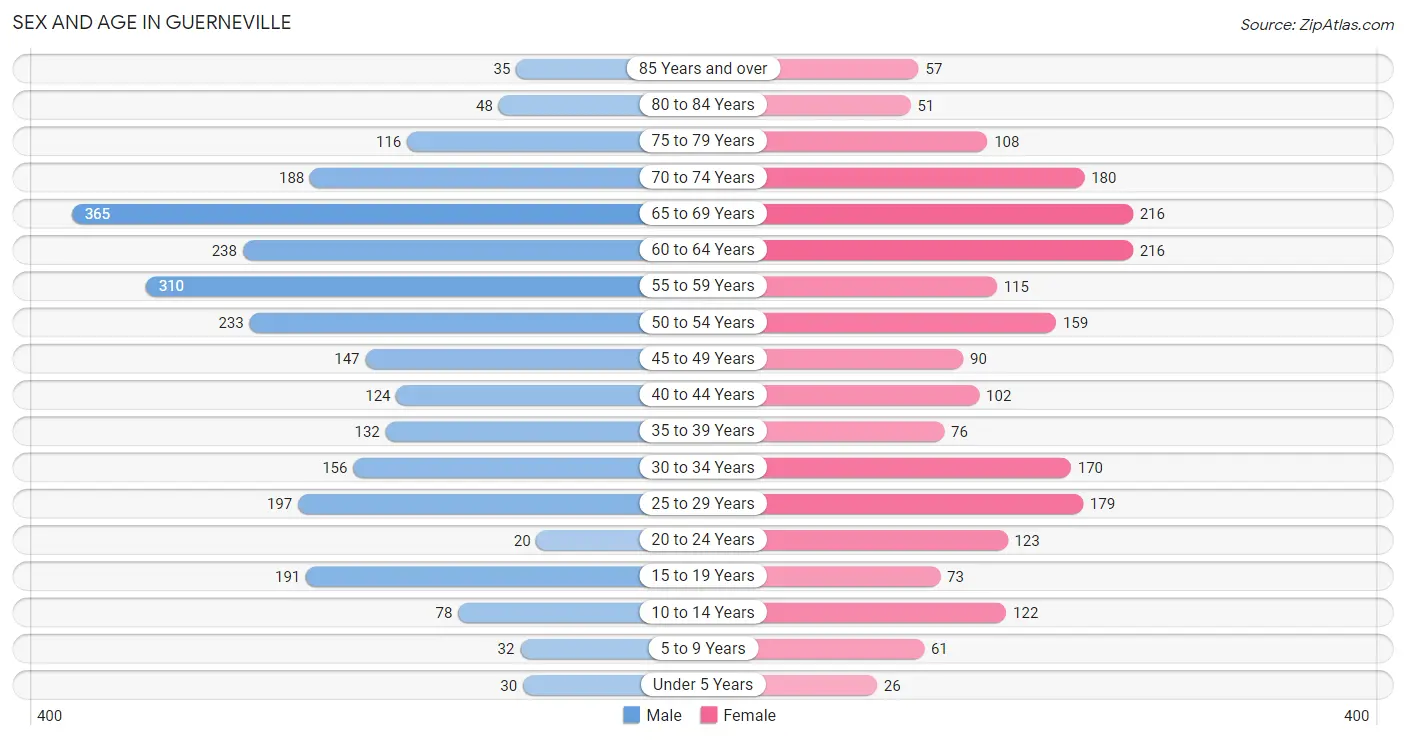
| Age Bracket | Male | Female |
| Under 5 Years | 30 (1.1%) | 26 (1.2%) |
| 5 to 9 Years | 32 (1.2%) | 61 (2.9%) |
| 10 to 14 Years | 78 (2.9%) | 122 (5.7%) |
| 15 to 19 Years | 191 (7.2%) | 73 (3.4%) |
| 20 to 24 Years | 20 (0.8%) | 123 (5.8%) |
| 25 to 29 Years | 197 (7.5%) | 179 (8.4%) |
| 30 to 34 Years | 156 (5.9%) | 170 (8.0%) |
| 35 to 39 Years | 132 (5.0%) | 76 (3.6%) |
| 40 to 44 Years | 124 (4.7%) | 102 (4.8%) |
| 45 to 49 Years | 147 (5.6%) | 90 (4.2%) |
| 50 to 54 Years | 233 (8.8%) | 159 (7.5%) |
| 55 to 59 Years | 310 (11.7%) | 115 (5.4%) |
| 60 to 64 Years | 238 (9.0%) | 216 (10.2%) |
| 65 to 69 Years | 365 (13.8%) | 216 (10.2%) |
| 70 to 74 Years | 188 (7.1%) | 180 (8.5%) |
| 75 to 79 Years | 116 (4.4%) | 108 (5.1%) |
| 80 to 84 Years | 48 (1.8%) | 51 (2.4%) |
| 85 Years and over | 35 (1.3%) | 57 (2.7%) |
| Total | 2,640 (100.0%) | 2,124 (100.0%) |
Families and Households in Guerneville
Median Family Size in Guerneville
The median family size in Guerneville is 2.57 persons per family, with married-couple families (828 | 77.5%) accounting for the largest median family size of 2.63 persons per family. On the other hand, single male/father families (80 | 7.5%) represent the smallest median family size with 2.09 persons per family.
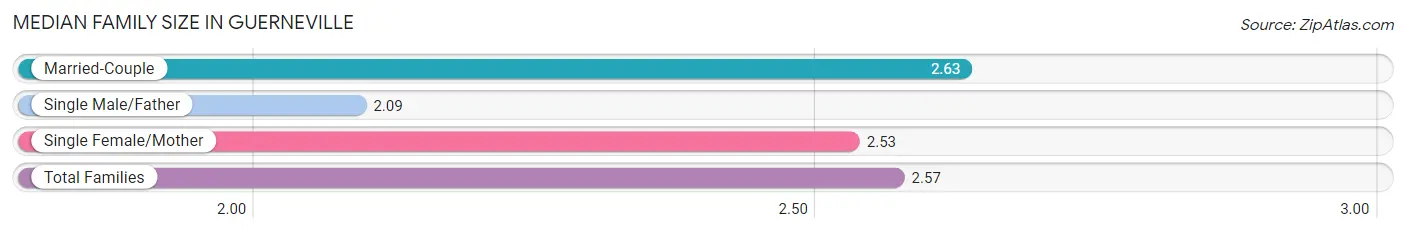
| Family Type | # Families | Family Size |
| Married-Couple | 828 (77.5%) | 2.63 |
| Single Male/Father | 80 (7.5%) | 2.09 |
| Single Female/Mother | 161 (15.1%) | 2.53 |
| Total Families | 1,069 (100.0%) | 2.57 |
Median Household Size in Guerneville
The median household size in Guerneville is 1.94 persons per household, with single female/mother households (161 | 6.6%) accounting for the largest median household size of 3.02 persons per household. non-family households (1,384 | 56.4%) represent the smallest median household size with 1.35 persons per household.
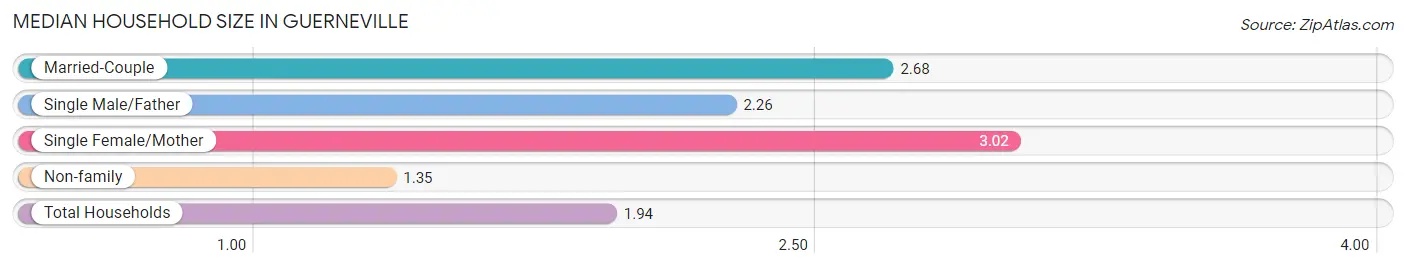
| Household Type | # Households | Household Size |
| Married-Couple | 828 (33.8%) | 2.68 |
| Single Male/Father | 80 (3.3%) | 2.26 |
| Single Female/Mother | 161 (6.6%) | 3.02 |
| Non-family | 1,384 (56.4%) | 1.35 |
| Total Households | 2,453 (100.0%) | 1.94 |
Household Size by Marriage Status in Guerneville
Out of a total of 2,453 households in Guerneville, 1,069 (43.6%) are family households, while 1,384 (56.4%) are nonfamily households. The most numerous type of family households are 2-person households, comprising 662, and the most common type of nonfamily households are 1-person households, comprising 1,028.
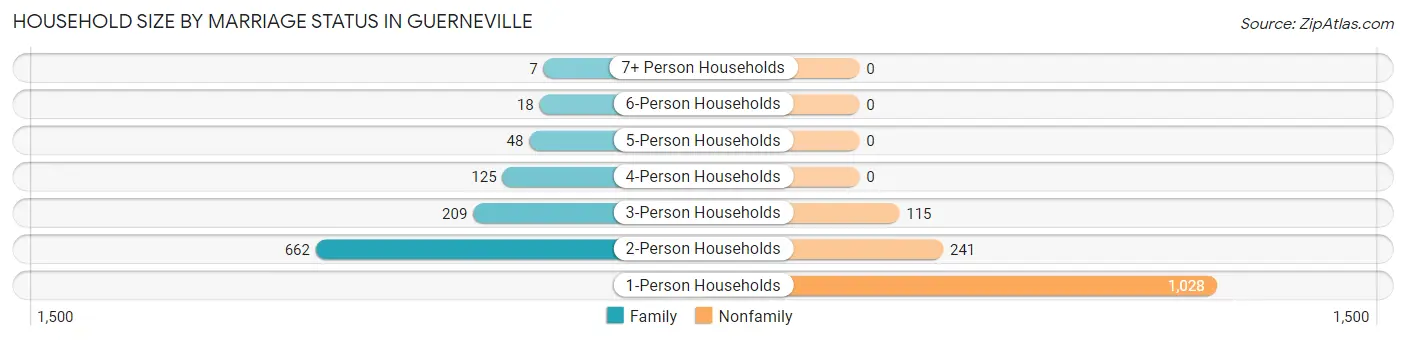
| Household Size | Family Households | Nonfamily Households |
| 1-Person Households | - | 1,028 (41.9%) |
| 2-Person Households | 662 (27.0%) | 241 (9.8%) |
| 3-Person Households | 209 (8.5%) | 115 (4.7%) |
| 4-Person Households | 125 (5.1%) | 0 (0.0%) |
| 5-Person Households | 48 (2.0%) | 0 (0.0%) |
| 6-Person Households | 18 (0.7%) | 0 (0.0%) |
| 7+ Person Households | 7 (0.3%) | 0 (0.0%) |
| Total | 1,069 (43.6%) | 1,384 (56.4%) |
Female Fertility in Guerneville
Fertility by Age in Guerneville
| Age Bracket | Women with Births | Births / 1,000 Women |
| 15 to 19 years | 0 (0.0%) | 0.0 |
| 20 to 34 years | 0 (0.0%) | 0.0 |
| 35 to 50 years | 0 (0.0%) | 0.0 |
| Total | 0 (0.0%) | 0.0 |
Fertility by Age by Marriage Status in Guerneville
| Age Bracket | Married | Unmarried |
| 15 to 19 years | 0 (0.0%) | 0 (0.0%) |
| 20 to 34 years | 0 (0.0%) | 0 (0.0%) |
| 35 to 50 years | 0 (0.0%) | 0 (0.0%) |
| Total | 0 (0.0%) | 0 (0.0%) |
Fertility by Education in Guerneville
| Educational Attainment | Women with Births | Births / 1,000 Women |
| Less than High School | 0 (0.0%) | 0.0 |
| High School Diploma | 0 (0.0%) | 0.0 |
| College or Associate's Degree | 0 (0.0%) | 0.0 |
| Bachelor's Degree | 0 (0.0%) | 0.0 |
| Graduate Degree | 0 (0.0%) | 0.0 |
| Total | 0 (0.0%) | 0.0 |
Fertility by Education by Marriage Status in Guerneville
| Educational Attainment | Married | Unmarried |
| Less than High School | 0 (0.0%) | 0 (0.0%) |
| High School Diploma | 0 (0.0%) | 0 (0.0%) |
| College or Associate's Degree | 0 (0.0%) | 0 (0.0%) |
| Bachelor's Degree | 0 (0.0%) | 0 (0.0%) |
| Graduate Degree | 0 (0.0%) | 0 (0.0%) |
| Total | 0 (0.0%) | 0 (0.0%) |
Employment Characteristics in Guerneville
Employment by Class of Employer in Guerneville
Among the 2,154 employed individuals in Guerneville, private company employees (1,537 | 71.4%), not-for-profit organizations (227 | 10.5%), and self-employed (not incorporated) (226 | 10.5%) make up the most common classes of employment.
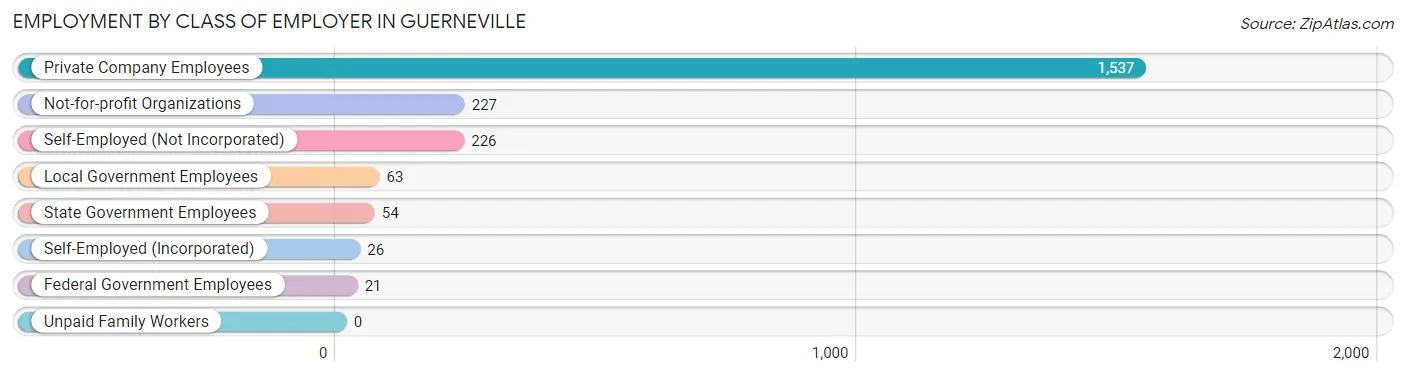
| Employer Class | # Employees | % Employees |
| Private Company Employees | 1,537 | 71.4% |
| Self-Employed (Incorporated) | 26 | 1.2% |
| Self-Employed (Not Incorporated) | 226 | 10.5% |
| Not-for-profit Organizations | 227 | 10.5% |
| Local Government Employees | 63 | 2.9% |
| State Government Employees | 54 | 2.5% |
| Federal Government Employees | 21 | 1.0% |
| Unpaid Family Workers | 0 | 0.0% |
| Total | 2,154 | 100.0% |
Employment Status by Age in Guerneville
According to the labor force statistics for Guerneville, out of the total population over 16 years of age (4,393), 57.3% or 2,517 individuals are in the labor force, with 9.0% or 227 of them unemployed. The age group with the highest labor force participation rate is 25 to 29 years, with 93.6% or 352 individuals in the labor force. Within the labor force, the 55 to 59 years age range has the highest percentage of unemployed individuals, with 15.7% or 61 of them being unemployed.
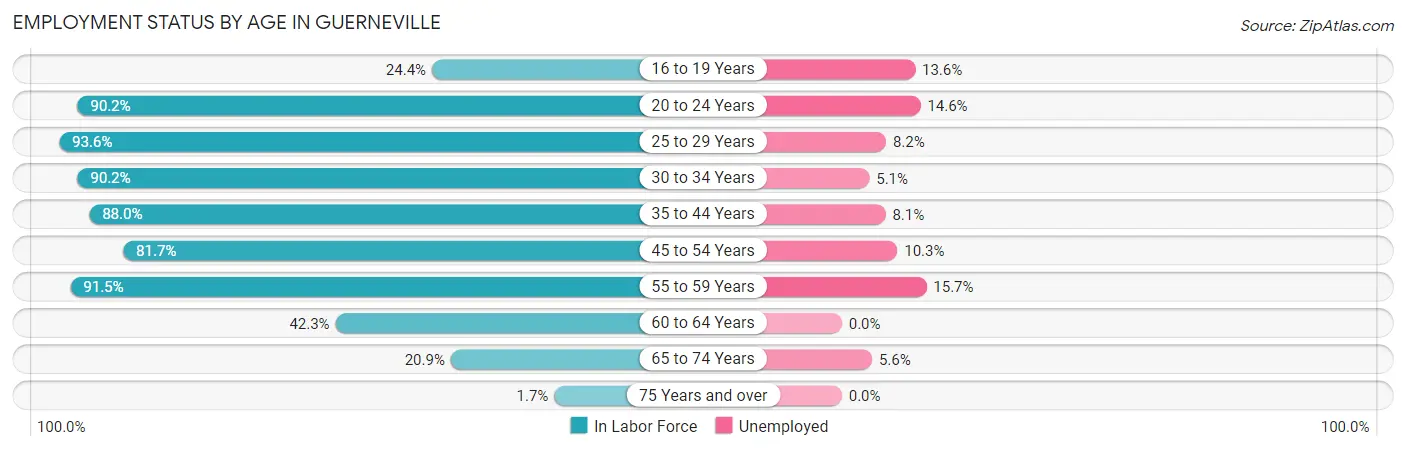
| Age Bracket | In Labor Force | Unemployed |
| 16 to 19 Years | 59 (24.4%) | 8 (13.6%) |
| 20 to 24 Years | 129 (90.2%) | 19 (14.6%) |
| 25 to 29 Years | 352 (93.6%) | 29 (8.2%) |
| 30 to 34 Years | 294 (90.2%) | 15 (5.1%) |
| 35 to 44 Years | 382 (88.0%) | 31 (8.1%) |
| 45 to 54 Years | 514 (81.7%) | 53 (10.3%) |
| 55 to 59 Years | 389 (91.5%) | 61 (15.7%) |
| 60 to 64 Years | 192 (42.3%) | 0 (0.0%) |
| 65 to 74 Years | 198 (20.9%) | 11 (5.6%) |
| 75 Years and over | 7 (1.7%) | 0 (0.0%) |
| Total | 2,517 (57.3%) | 227 (9.0%) |
Employment Status by Educational Attainment in Guerneville
According to labor force statistics for Guerneville, 80.3% of individuals (2,123) out of the total population between 25 and 64 years of age (2,644) are in the labor force, with 8.9% or 189 of them being unemployed. The group with the highest labor force participation rate are those with the educational attainment of college / associate degree, with 84.4% or 926 individuals in the labor force. Within the labor force, individuals with less than high school education have the highest percentage of unemployment, with 18.7% or 17 of them being unemployed.
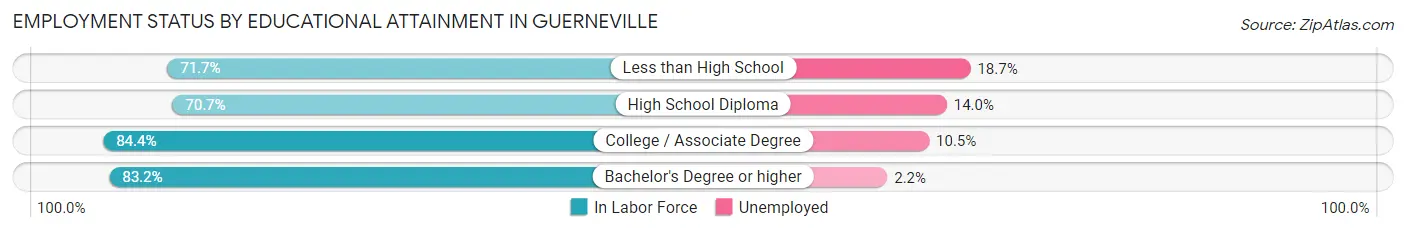
| Educational Attainment | In Labor Force | Unemployed |
| Less than High School | 91 (71.7%) | 24 (18.7%) |
| High School Diploma | 428 (70.7%) | 85 (14.0%) |
| College / Associate Degree | 926 (84.4%) | 115 (10.5%) |
| Bachelor's Degree or higher | 678 (83.2%) | 18 (2.2%) |
| Total | 2,123 (80.3%) | 235 (8.9%) |
Employment Occupations by Sex in Guerneville
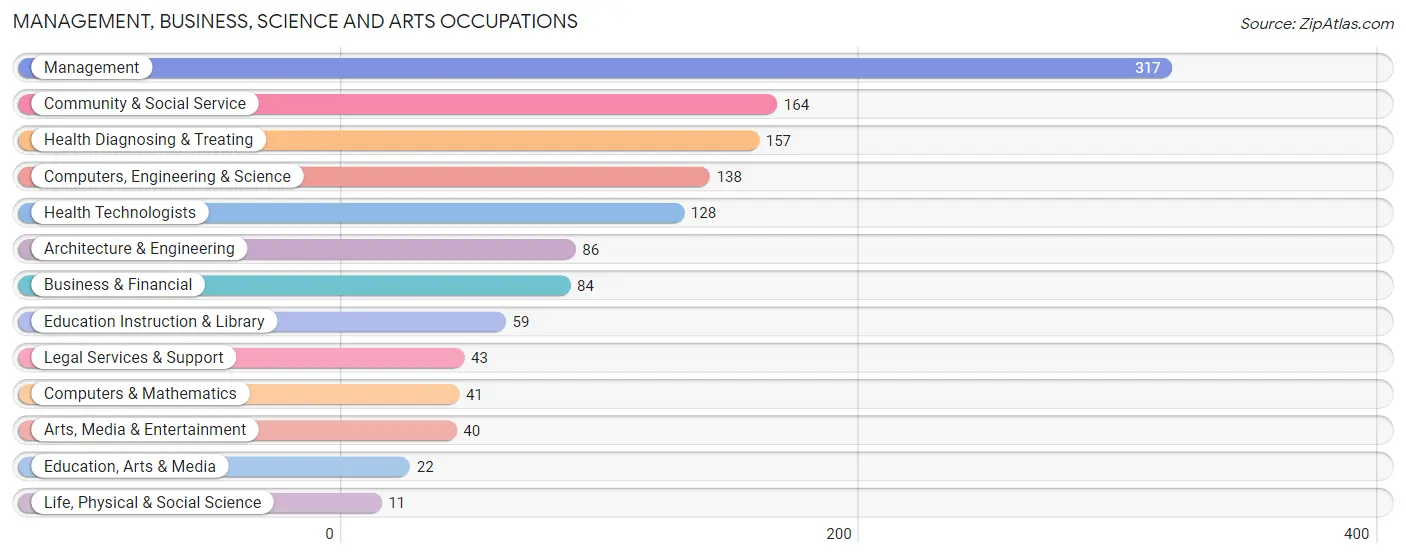
Management, Business, Science and Arts Occupations
The most common Management, Business, Science and Arts occupations in Guerneville are Management (317 | 13.9%), Community & Social Service (164 | 7.2%), Health Diagnosing & Treating (157 | 6.9%), Computers, Engineering & Science (138 | 6.0%), and Health Technologists (128 | 5.6%).
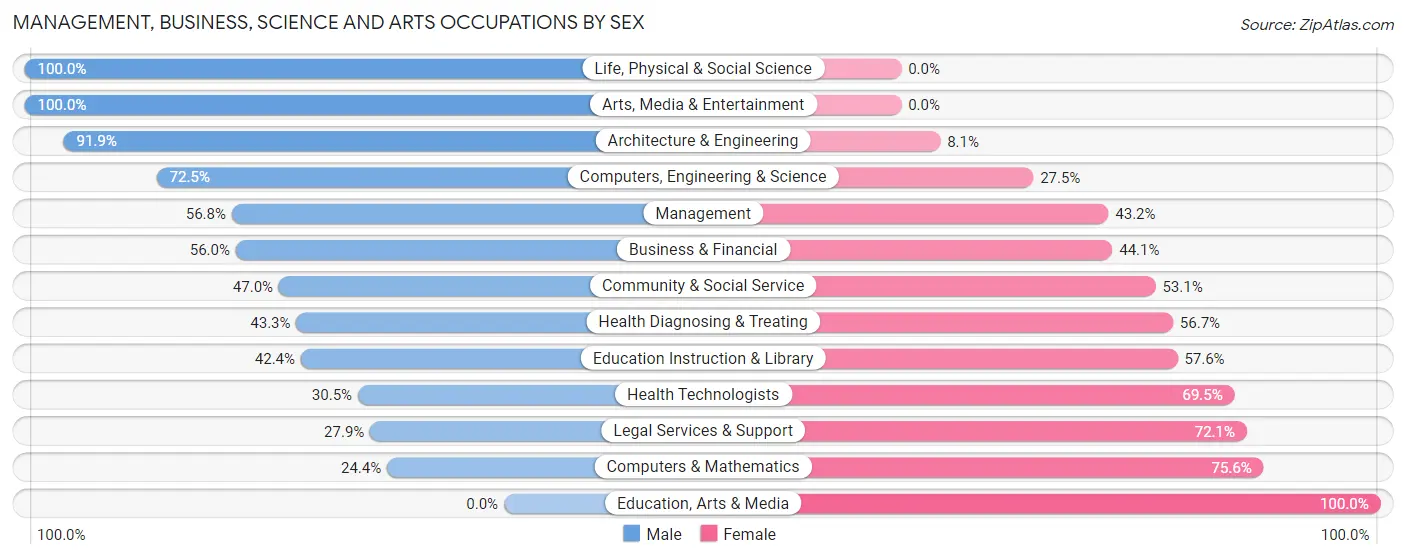
Management, Business, Science and Arts Occupations by Sex
Within the Management, Business, Science and Arts occupations in Guerneville, the most male-oriented occupations are Life, Physical & Social Science (100.0%), Arts, Media & Entertainment (100.0%), and Architecture & Engineering (91.9%), while the most female-oriented occupations are Education, Arts & Media (100.0%), Computers & Mathematics (75.6%), and Legal Services & Support (72.1%).
| Occupation | Male | Female |
| Management | 180 (56.8%) | 137 (43.2%) |
| Business & Financial | 47 (55.9%) | 37 (44.1%) |
| Computers, Engineering & Science | 100 (72.5%) | 38 (27.5%) |
| Computers & Mathematics | 10 (24.4%) | 31 (75.6%) |
| Architecture & Engineering | 79 (91.9%) | 7 (8.1%) |
| Life, Physical & Social Science | 11 (100.0%) | 0 (0.0%) |
| Community & Social Service | 77 (46.9%) | 87 (53.0%) |
| Education, Arts & Media | 0 (0.0%) | 22 (100.0%) |
| Legal Services & Support | 12 (27.9%) | 31 (72.1%) |
| Education Instruction & Library | 25 (42.4%) | 34 (57.6%) |
| Arts, Media & Entertainment | 40 (100.0%) | 0 (0.0%) |
| Health Diagnosing & Treating | 68 (43.3%) | 89 (56.7%) |
| Health Technologists | 39 (30.5%) | 89 (69.5%) |
| Total (Category) | 472 (54.9%) | 388 (45.1%) |
| Total (Overall) | 1,195 (52.3%) | 1,089 (47.7%) |
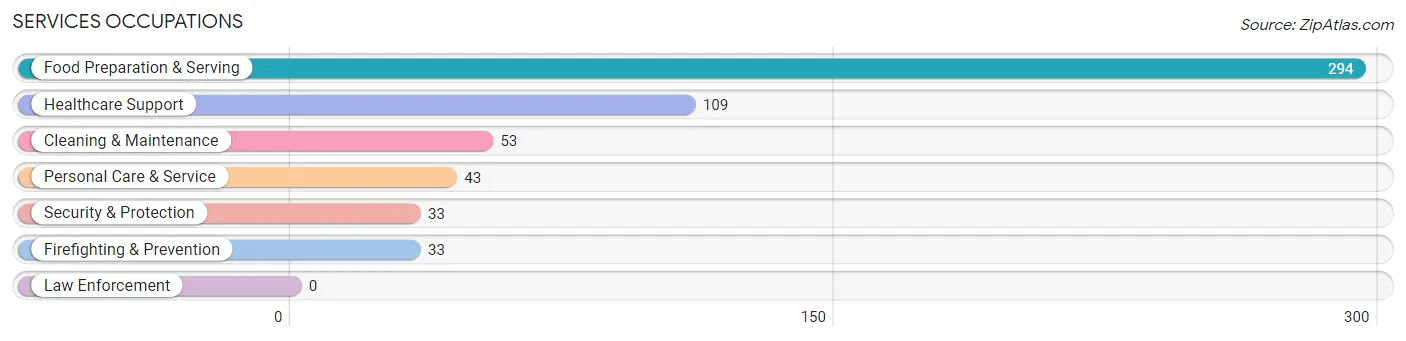
Services Occupations
The most common Services occupations in Guerneville are Food Preparation & Serving (294 | 12.9%), Healthcare Support (109 | 4.8%), Cleaning & Maintenance (53 | 2.3%), Personal Care & Service (43 | 1.9%), and Security & Protection (33 | 1.4%).
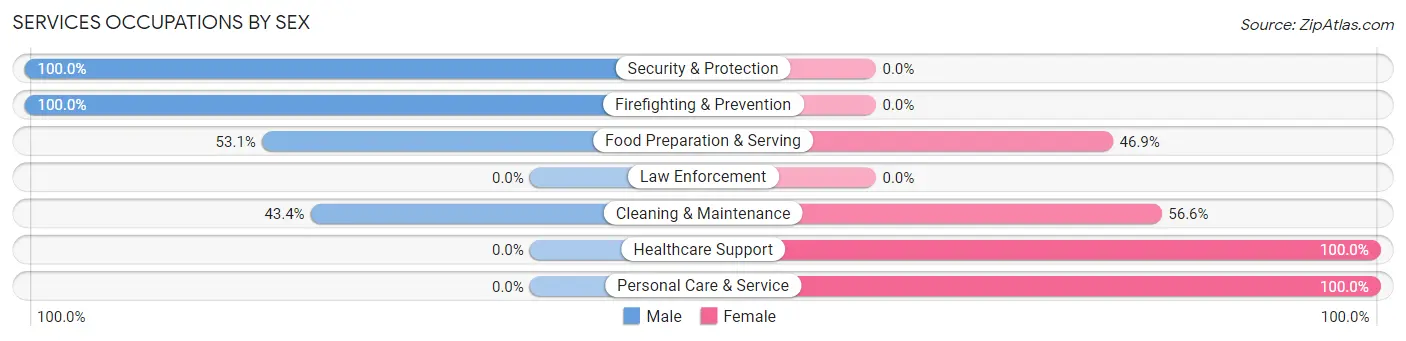
Services Occupations by Sex
Within the Services occupations in Guerneville, the most male-oriented occupations are Security & Protection (100.0%), Firefighting & Prevention (100.0%), and Food Preparation & Serving (53.1%), while the most female-oriented occupations are Healthcare Support (100.0%), Personal Care & Service (100.0%), and Cleaning & Maintenance (56.6%).
| Occupation | Male | Female |
| Healthcare Support | 0 (0.0%) | 109 (100.0%) |
| Security & Protection | 33 (100.0%) | 0 (0.0%) |
| Firefighting & Prevention | 33 (100.0%) | 0 (0.0%) |
| Law Enforcement | 0 (0.0%) | 0 (0.0%) |
| Food Preparation & Serving | 156 (53.1%) | 138 (46.9%) |
| Cleaning & Maintenance | 23 (43.4%) | 30 (56.6%) |
| Personal Care & Service | 0 (0.0%) | 43 (100.0%) |
| Total (Category) | 212 (39.9%) | 320 (60.2%) |
| Total (Overall) | 1,195 (52.3%) | 1,089 (47.7%) |
Sales and Office Occupations
The most common Sales and Office occupations in Guerneville are Office & Administration (252 | 11.0%), and Sales & Related (249 | 10.9%).

Sales and Office Occupations by Sex
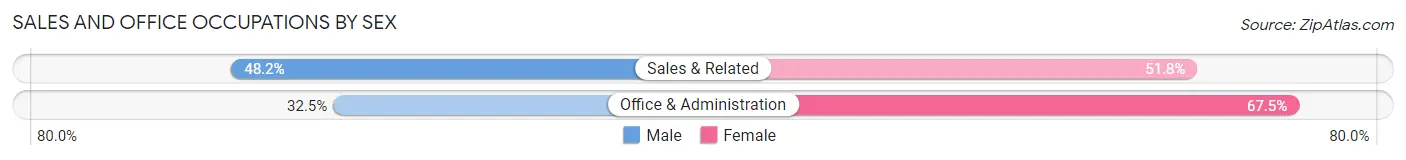
| Occupation | Male | Female |
| Sales & Related | 120 (48.2%) | 129 (51.8%) |
| Office & Administration | 82 (32.5%) | 170 (67.5%) |
| Total (Category) | 202 (40.3%) | 299 (59.7%) |
| Total (Overall) | 1,195 (52.3%) | 1,089 (47.7%) |
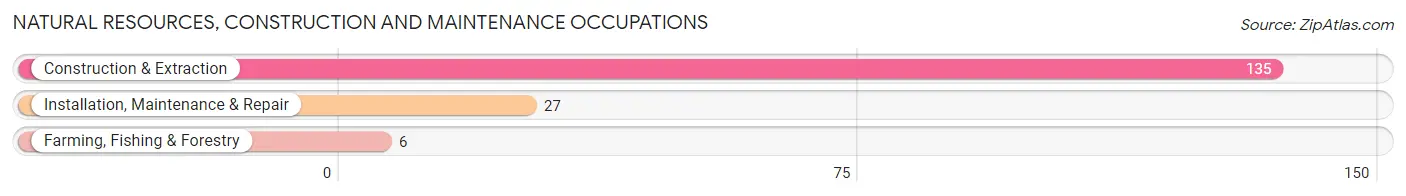
Natural Resources, Construction and Maintenance Occupations
The most common Natural Resources, Construction and Maintenance occupations in Guerneville are Construction & Extraction (135 | 5.9%), Installation, Maintenance & Repair (27 | 1.2%), and Farming, Fishing & Forestry (6 | 0.3%).
Natural Resources, Construction and Maintenance Occupations by Sex
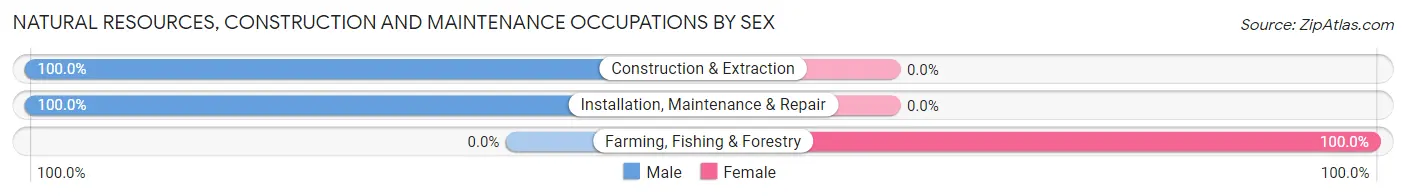
| Occupation | Male | Female |
| Farming, Fishing & Forestry | 0 (0.0%) | 6 (100.0%) |
| Construction & Extraction | 135 (100.0%) | 0 (0.0%) |
| Installation, Maintenance & Repair | 27 (100.0%) | 0 (0.0%) |
| Total (Category) | 162 (96.4%) | 6 (3.6%) |
| Total (Overall) | 1,195 (52.3%) | 1,089 (47.7%) |
Production, Transportation and Moving Occupations
The most common Production, Transportation and Moving occupations in Guerneville are Material Moving (95 | 4.2%), Production (85 | 3.7%), and Transportation (43 | 1.9%).
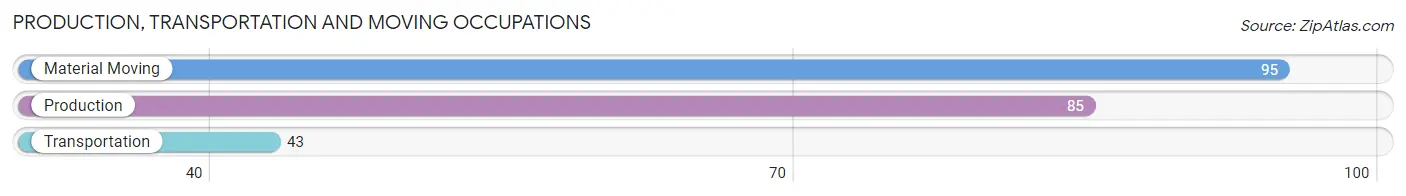
Production, Transportation and Moving Occupations by Sex
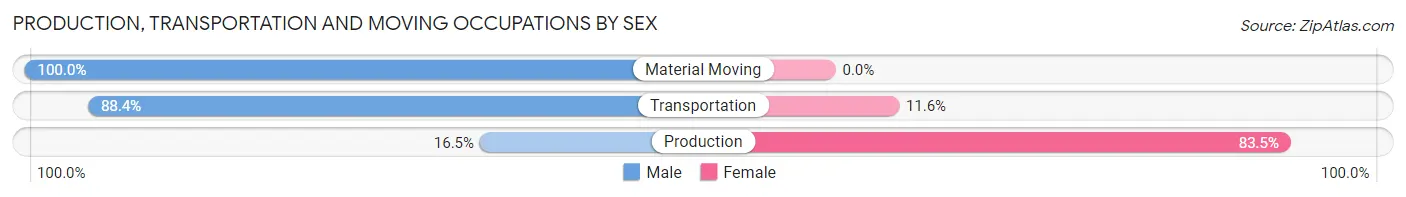
| Occupation | Male | Female |
| Production | 14 (16.5%) | 71 (83.5%) |
| Transportation | 38 (88.4%) | 5 (11.6%) |
| Material Moving | 95 (100.0%) | 0 (0.0%) |
| Total (Category) | 147 (65.9%) | 76 (34.1%) |
| Total (Overall) | 1,195 (52.3%) | 1,089 (47.7%) |
Employment Industries by Sex in Guerneville
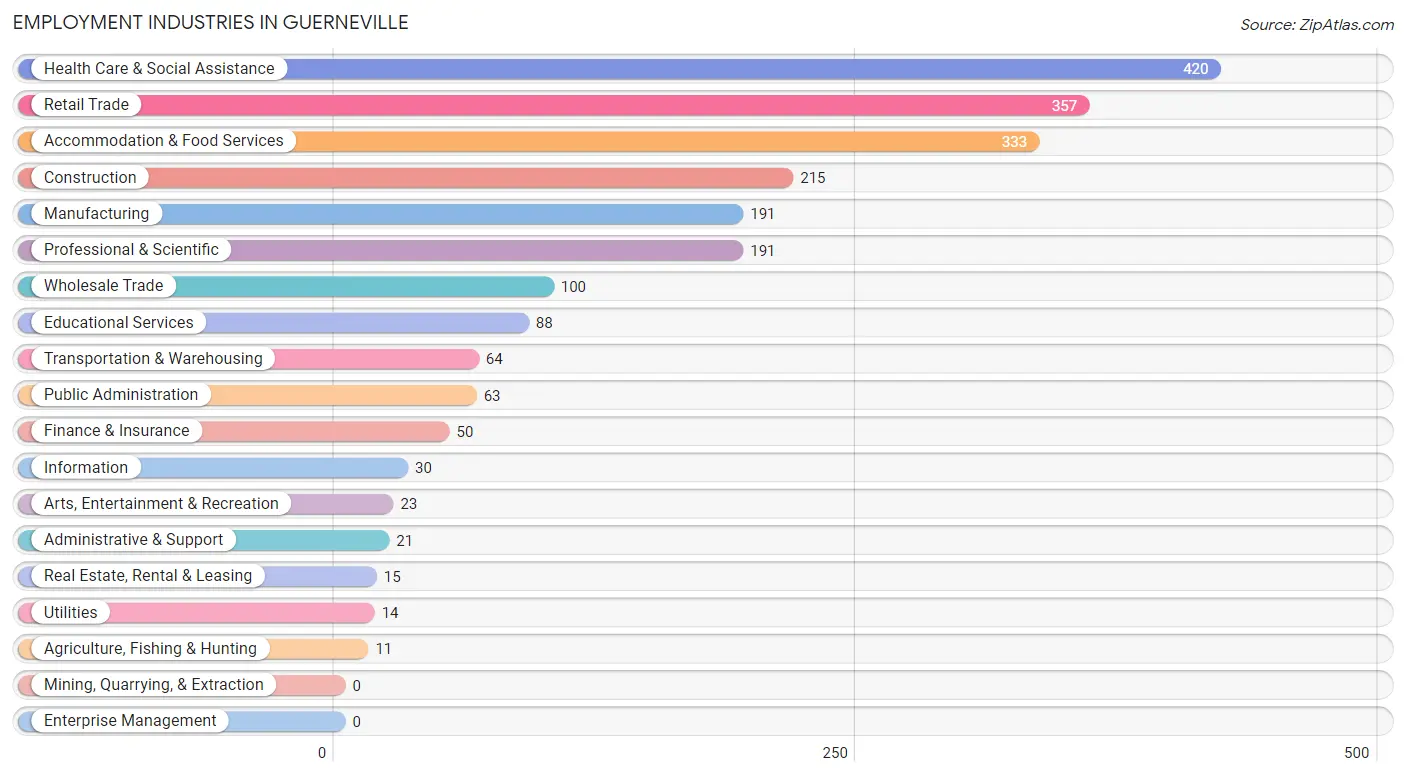
Employment Industries in Guerneville
The major employment industries in Guerneville include Health Care & Social Assistance (420 | 18.4%), Retail Trade (357 | 15.6%), Accommodation & Food Services (333 | 14.6%), Construction (215 | 9.4%), and Manufacturing (191 | 8.4%).
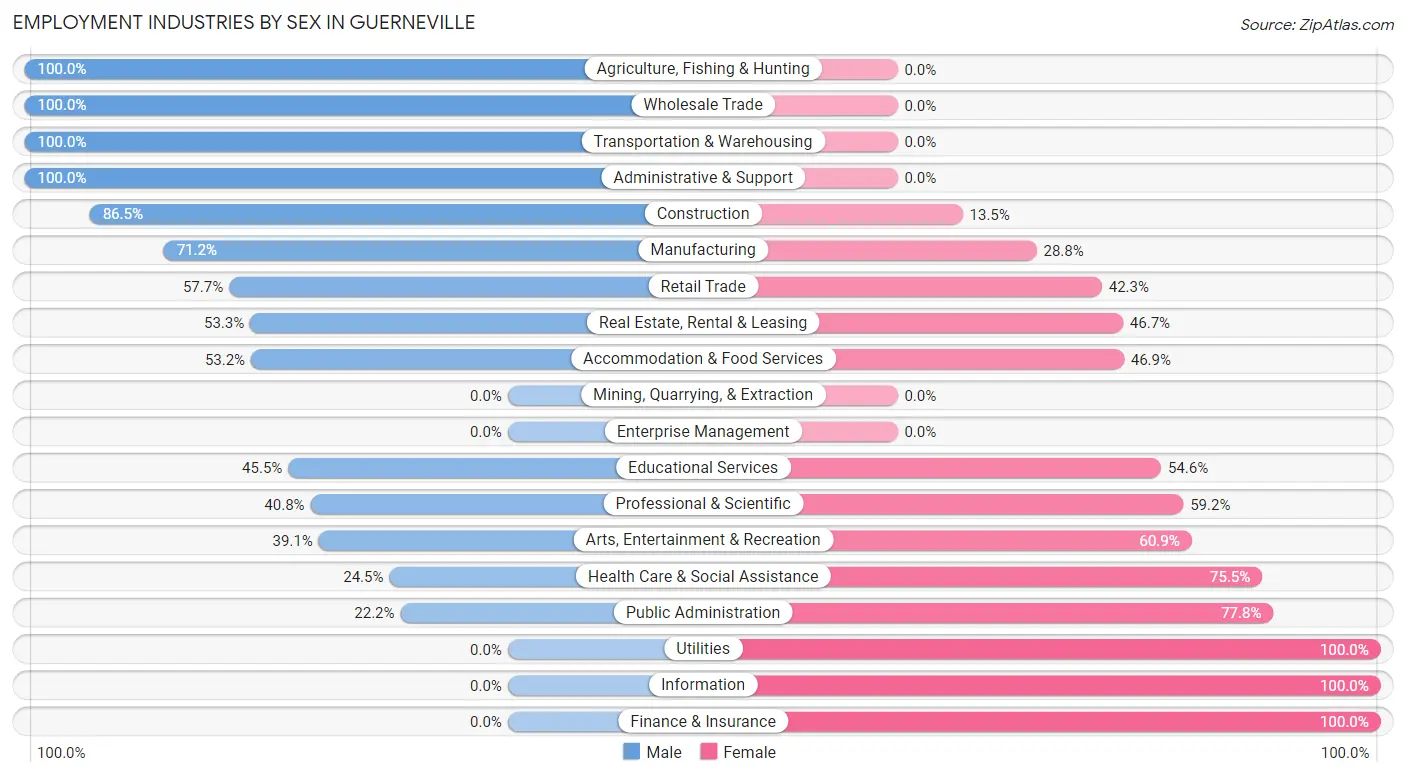
Employment Industries by Sex in Guerneville
The Guerneville industries that see more men than women are Agriculture, Fishing & Hunting (100.0%), Wholesale Trade (100.0%), and Transportation & Warehousing (100.0%), whereas the industries that tend to have a higher number of women are Utilities (100.0%), Information (100.0%), and Finance & Insurance (100.0%).
| Industry | Male | Female |
| Agriculture, Fishing & Hunting | 11 (100.0%) | 0 (0.0%) |
| Mining, Quarrying, & Extraction | 0 (0.0%) | 0 (0.0%) |
| Construction | 186 (86.5%) | 29 (13.5%) |
| Manufacturing | 136 (71.2%) | 55 (28.8%) |
| Wholesale Trade | 100 (100.0%) | 0 (0.0%) |
| Retail Trade | 206 (57.7%) | 151 (42.3%) |
| Transportation & Warehousing | 64 (100.0%) | 0 (0.0%) |
| Utilities | 0 (0.0%) | 14 (100.0%) |
| Information | 0 (0.0%) | 30 (100.0%) |
| Finance & Insurance | 0 (0.0%) | 50 (100.0%) |
| Real Estate, Rental & Leasing | 8 (53.3%) | 7 (46.7%) |
| Professional & Scientific | 78 (40.8%) | 113 (59.2%) |
| Enterprise Management | 0 (0.0%) | 0 (0.0%) |
| Administrative & Support | 21 (100.0%) | 0 (0.0%) |
| Educational Services | 40 (45.5%) | 48 (54.5%) |
| Health Care & Social Assistance | 103 (24.5%) | 317 (75.5%) |
| Arts, Entertainment & Recreation | 9 (39.1%) | 14 (60.9%) |
| Accommodation & Food Services | 177 (53.1%) | 156 (46.9%) |
| Public Administration | 14 (22.2%) | 49 (77.8%) |
| Total | 1,195 (52.3%) | 1,089 (47.7%) |
Education in Guerneville
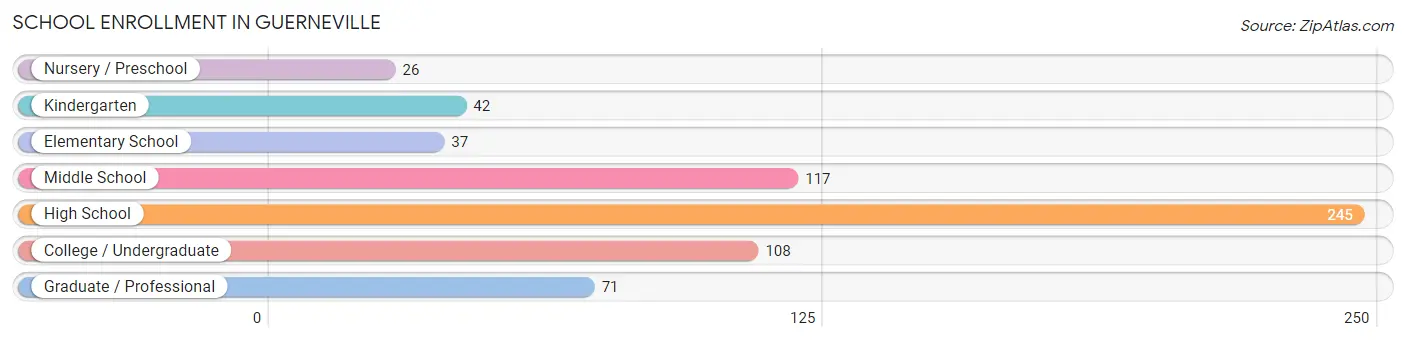
School Enrollment in Guerneville
The most common levels of schooling among the 646 students in Guerneville are high school (245 | 37.9%), middle school (117 | 18.1%), and college / undergraduate (108 | 16.7%).
| School Level | # Students | % Students |
| Nursery / Preschool | 26 | 4.0% |
| Kindergarten | 42 | 6.5% |
| Elementary School | 37 | 5.7% |
| Middle School | 117 | 18.1% |
| High School | 245 | 37.9% |
| College / Undergraduate | 108 | 16.7% |
| Graduate / Professional | 71 | 11.0% |
| Total | 646 | 100.0% |
School Enrollment by Age by Funding Source in Guerneville
Out of a total of 646 students who are enrolled in schools in Guerneville, 61 (9.4%) attend a private institution, while the remaining 585 (90.6%) are enrolled in public schools. The age group of 3 to 4 year olds has the highest likelihood of being enrolled in private schools, with 26 (100.0% in the age bracket) enrolled. Conversely, the age group of 15 to 17 year olds has the lowest likelihood of being enrolled in a private school, with 124 (100.0% in the age bracket) attending a public institution.
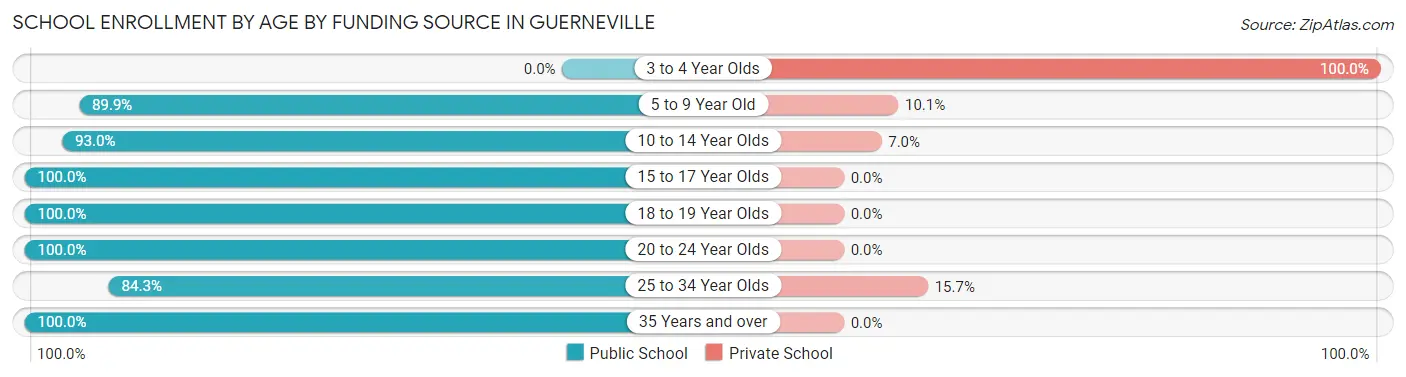
| Age Bracket | Public School | Private School |
| 3 to 4 Year Olds | 0 (0.0%) | 26 (100.0%) |
| 5 to 9 Year Old | 71 (89.9%) | 8 (10.1%) |
| 10 to 14 Year Olds | 186 (93.0%) | 14 (7.0%) |
| 15 to 17 Year Olds | 124 (100.0%) | 0 (0.0%) |
| 18 to 19 Year Olds | 75 (100.0%) | 0 (0.0%) |
| 20 to 24 Year Olds | 21 (100.0%) | 0 (0.0%) |
| 25 to 34 Year Olds | 70 (84.3%) | 13 (15.7%) |
| 35 Years and over | 38 (100.0%) | 0 (0.0%) |
| Total | 585 (90.6%) | 61 (9.4%) |
Educational Attainment by Field of Study in Guerneville
Liberal arts & history (245 | 14.2%), bio, nature & agricultural (202 | 11.7%), education (174 | 10.1%), business (155 | 9.0%), and science & technology (144 | 8.4%) are the most common fields of study among 1,722 individuals in Guerneville who have obtained a bachelor's degree or higher.
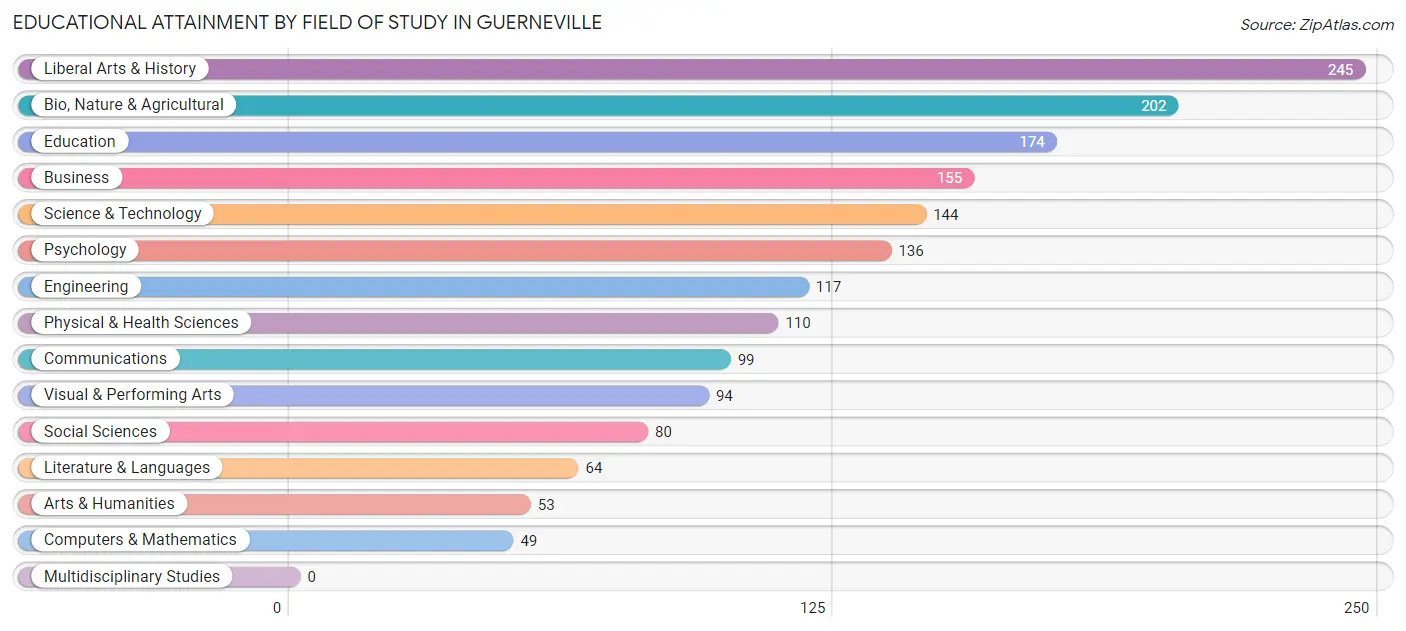
| Field of Study | # Graduates | % Graduates |
| Computers & Mathematics | 49 | 2.9% |
| Bio, Nature & Agricultural | 202 | 11.7% |
| Physical & Health Sciences | 110 | 6.4% |
| Psychology | 136 | 7.9% |
| Social Sciences | 80 | 4.6% |
| Engineering | 117 | 6.8% |
| Multidisciplinary Studies | 0 | 0.0% |
| Science & Technology | 144 | 8.4% |
| Business | 155 | 9.0% |
| Education | 174 | 10.1% |
| Literature & Languages | 64 | 3.7% |
| Liberal Arts & History | 245 | 14.2% |
| Visual & Performing Arts | 94 | 5.5% |
| Communications | 99 | 5.8% |
| Arts & Humanities | 53 | 3.1% |
| Total | 1,722 | 100.0% |
Transportation & Commute in Guerneville
Vehicle Availability by Sex in Guerneville
The most prevalent vehicle ownership categories in Guerneville are males with 2 vehicles (595, accounting for 52.4%) and females with 2 vehicles (416, making up 58.5%).
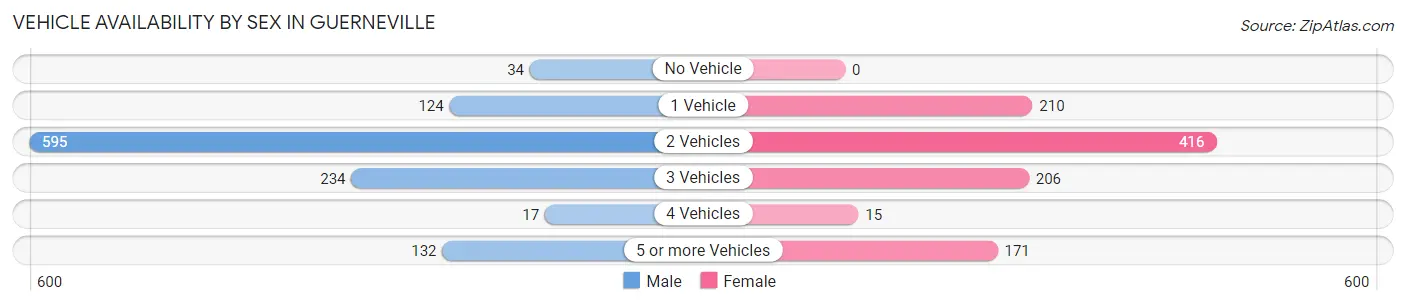
| Vehicles Available | Male | Female |
| No Vehicle | 34 (3.0%) | 0 (0.0%) |
| 1 Vehicle | 124 (10.9%) | 210 (20.6%) |
| 2 Vehicles | 595 (52.4%) | 416 (40.9%) |
| 3 Vehicles | 234 (20.6%) | 206 (20.2%) |
| 4 Vehicles | 17 (1.5%) | 15 (1.5%) |
| 5 or more Vehicles | 132 (11.6%) | 171 (16.8%) |
| Total | 1,136 (100.0%) | 1,018 (100.0%) |
Commute Time in Guerneville
The most frequently occuring commute durations in Guerneville are 30 to 34 minutes (554 commuters, 32.1%), 45 to 59 minutes (240 commuters, 13.9%), and 5 to 9 minutes (206 commuters, 11.9%).
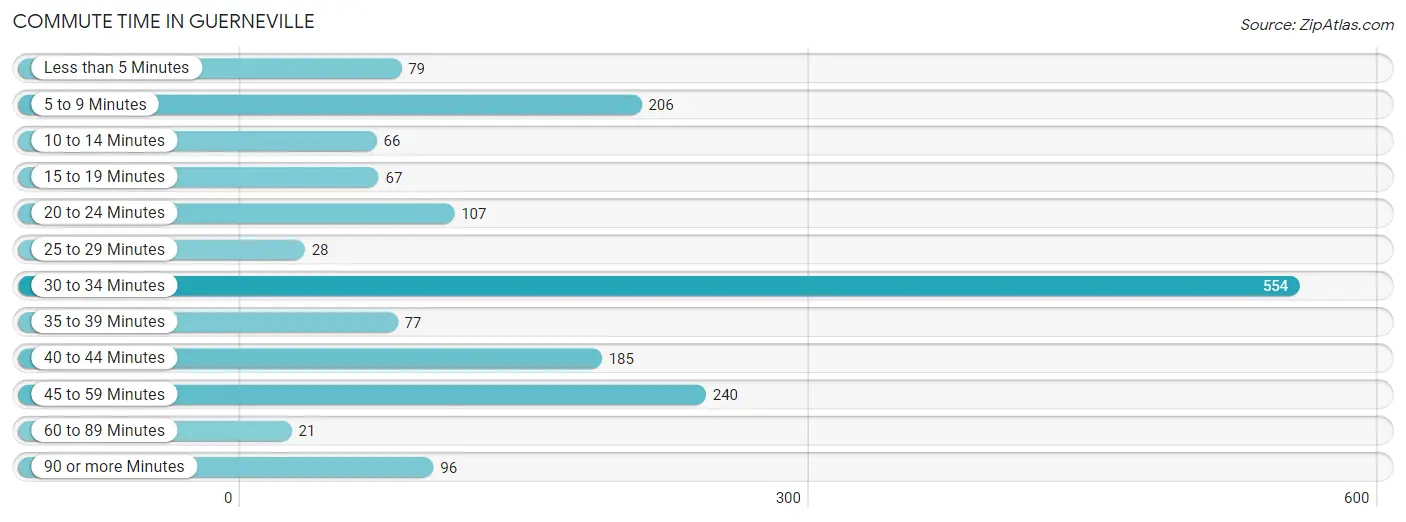
| Commute Time | # Commuters | % Commuters |
| Less than 5 Minutes | 79 | 4.6% |
| 5 to 9 Minutes | 206 | 11.9% |
| 10 to 14 Minutes | 66 | 3.8% |
| 15 to 19 Minutes | 67 | 3.9% |
| 20 to 24 Minutes | 107 | 6.2% |
| 25 to 29 Minutes | 28 | 1.6% |
| 30 to 34 Minutes | 554 | 32.1% |
| 35 to 39 Minutes | 77 | 4.5% |
| 40 to 44 Minutes | 185 | 10.7% |
| 45 to 59 Minutes | 240 | 13.9% |
| 60 to 89 Minutes | 21 | 1.2% |
| 90 or more Minutes | 96 | 5.6% |
Commute Time by Sex in Guerneville
The most common commute times in Guerneville are 30 to 34 minutes (303 commuters, 33.2%) for males and 30 to 34 minutes (251 commuters, 30.8%) for females.
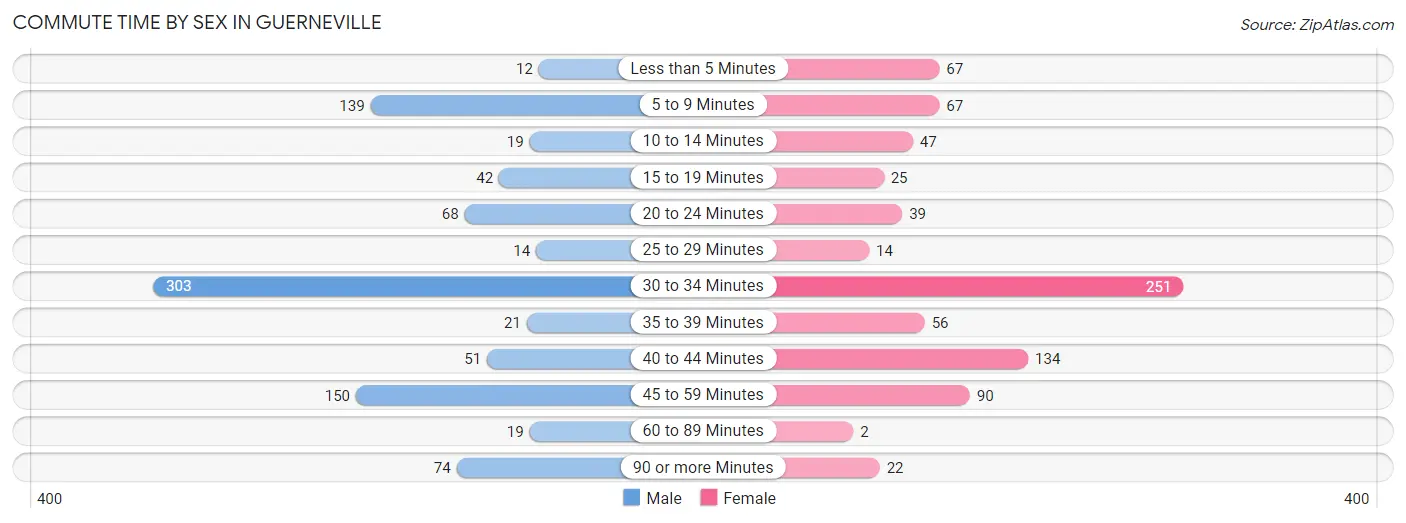
| Commute Time | Male | Female |
| Less than 5 Minutes | 12 (1.3%) | 67 (8.2%) |
| 5 to 9 Minutes | 139 (15.2%) | 67 (8.2%) |
| 10 to 14 Minutes | 19 (2.1%) | 47 (5.8%) |
| 15 to 19 Minutes | 42 (4.6%) | 25 (3.1%) |
| 20 to 24 Minutes | 68 (7.5%) | 39 (4.8%) |
| 25 to 29 Minutes | 14 (1.5%) | 14 (1.7%) |
| 30 to 34 Minutes | 303 (33.2%) | 251 (30.8%) |
| 35 to 39 Minutes | 21 (2.3%) | 56 (6.9%) |
| 40 to 44 Minutes | 51 (5.6%) | 134 (16.5%) |
| 45 to 59 Minutes | 150 (16.5%) | 90 (11.1%) |
| 60 to 89 Minutes | 19 (2.1%) | 2 (0.3%) |
| 90 or more Minutes | 74 (8.1%) | 22 (2.7%) |
Time of Departure to Work by Sex in Guerneville
The most frequent times of departure to work in Guerneville are 7:00 AM to 7:29 AM (172, 18.9%) for males and 7:00 AM to 7:29 AM (252, 31.0%) for females.
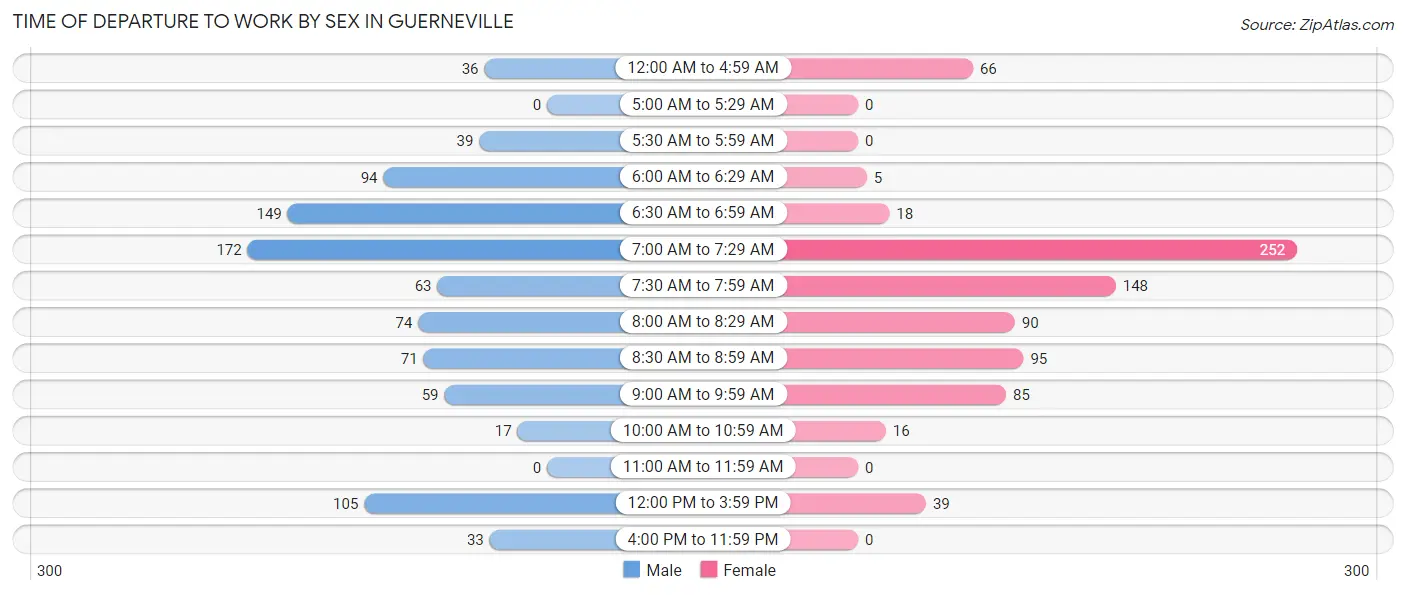
| Time of Departure | Male | Female |
| 12:00 AM to 4:59 AM | 36 (4.0%) | 66 (8.1%) |
| 5:00 AM to 5:29 AM | 0 (0.0%) | 0 (0.0%) |
| 5:30 AM to 5:59 AM | 39 (4.3%) | 0 (0.0%) |
| 6:00 AM to 6:29 AM | 94 (10.3%) | 5 (0.6%) |
| 6:30 AM to 6:59 AM | 149 (16.3%) | 18 (2.2%) |
| 7:00 AM to 7:29 AM | 172 (18.9%) | 252 (31.0%) |
| 7:30 AM to 7:59 AM | 63 (6.9%) | 148 (18.2%) |
| 8:00 AM to 8:29 AM | 74 (8.1%) | 90 (11.1%) |
| 8:30 AM to 8:59 AM | 71 (7.8%) | 95 (11.7%) |
| 9:00 AM to 9:59 AM | 59 (6.5%) | 85 (10.4%) |
| 10:00 AM to 10:59 AM | 17 (1.9%) | 16 (2.0%) |
| 11:00 AM to 11:59 AM | 0 (0.0%) | 0 (0.0%) |
| 12:00 PM to 3:59 PM | 105 (11.5%) | 39 (4.8%) |
| 4:00 PM to 11:59 PM | 33 (3.6%) | 0 (0.0%) |
| Total | 912 (100.0%) | 814 (100.0%) |
Housing Occupancy in Guerneville
Occupancy by Ownership in Guerneville
Of the total 2,453 dwellings in Guerneville, owner-occupied units account for 1,684 (68.6%), while renter-occupied units make up 769 (31.4%).
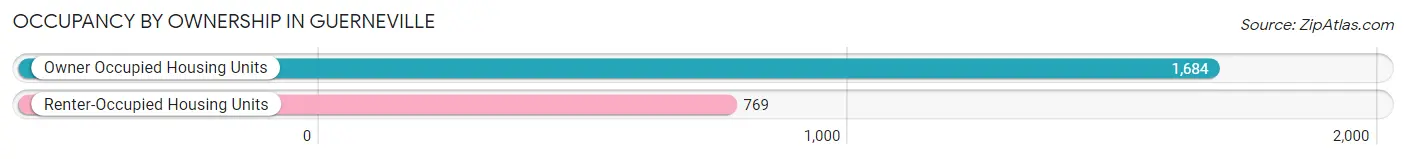
| Occupancy | # Housing Units | % Housing Units |
| Owner Occupied Housing Units | 1,684 | 68.6% |
| Renter-Occupied Housing Units | 769 | 31.4% |
| Total Occupied Housing Units | 2,453 | 100.0% |
Occupancy by Household Size in Guerneville
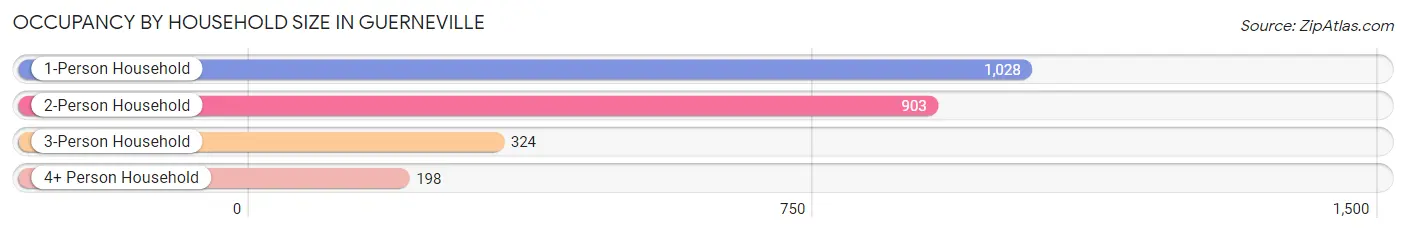
| Household Size | # Housing Units | % Housing Units |
| 1-Person Household | 1,028 | 41.9% |
| 2-Person Household | 903 | 36.8% |
| 3-Person Household | 324 | 13.2% |
| 4+ Person Household | 198 | 8.1% |
| Total Housing Units | 2,453 | 100.0% |
Occupancy by Ownership by Household Size in Guerneville
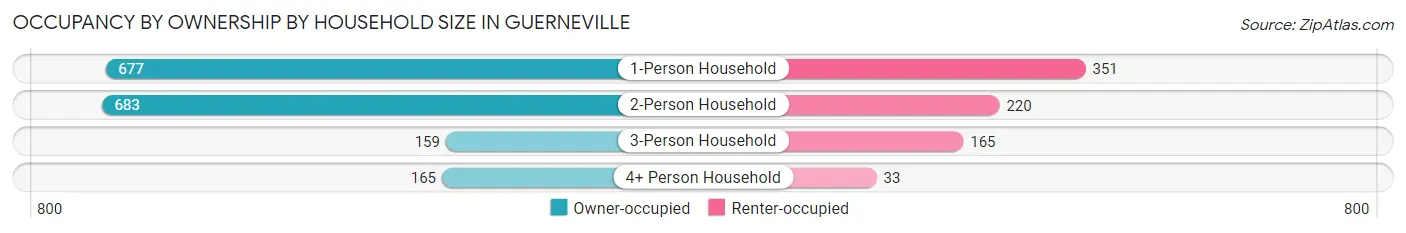
| Household Size | Owner-occupied | Renter-occupied |
| 1-Person Household | 677 (65.9%) | 351 (34.1%) |
| 2-Person Household | 683 (75.6%) | 220 (24.4%) |
| 3-Person Household | 159 (49.1%) | 165 (50.9%) |
| 4+ Person Household | 165 (83.3%) | 33 (16.7%) |
| Total Housing Units | 1,684 (68.6%) | 769 (31.4%) |
Occupancy by Educational Attainment in Guerneville
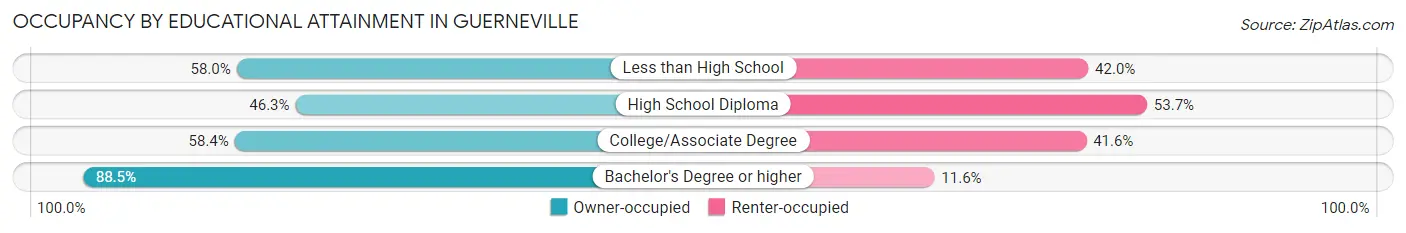
| Household Size | Owner-occupied | Renter-occupied |
| Less than High School | 40 (58.0%) | 29 (42.0%) |
| High School Diploma | 151 (46.3%) | 175 (53.7%) |
| College/Associate Degree | 635 (58.4%) | 453 (41.6%) |
| Bachelor's Degree or higher | 858 (88.4%) | 112 (11.6%) |
Occupancy by Age of Householder in Guerneville
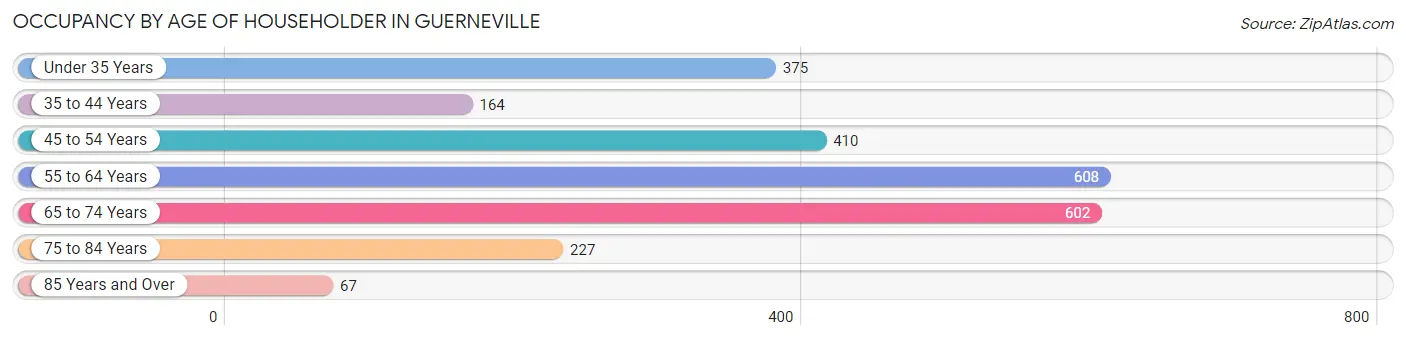
| Age Bracket | # Households | % Households |
| Under 35 Years | 375 | 15.3% |
| 35 to 44 Years | 164 | 6.7% |
| 45 to 54 Years | 410 | 16.7% |
| 55 to 64 Years | 608 | 24.8% |
| 65 to 74 Years | 602 | 24.5% |
| 75 to 84 Years | 227 | 9.2% |
| 85 Years and Over | 67 | 2.7% |
| Total | 2,453 | 100.0% |
Housing Finances in Guerneville
Median Income by Occupancy in Guerneville
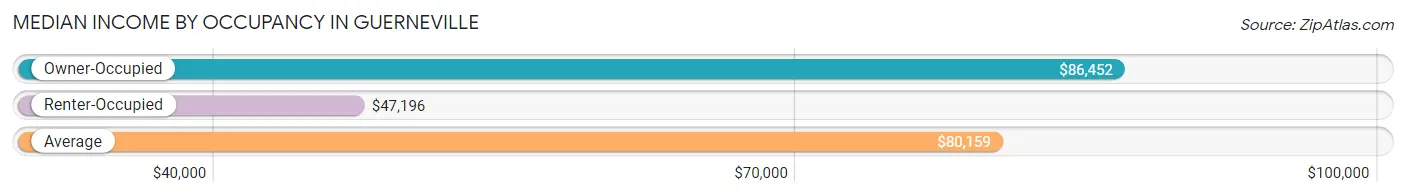
| Occupancy Type | # Households | Median Income |
| Owner-Occupied | 1,684 (68.6%) | $86,452 |
| Renter-Occupied | 769 (31.4%) | $47,196 |
| Average | 2,453 (100.0%) | $80,159 |
Occupancy by Householder Income Bracket in Guerneville
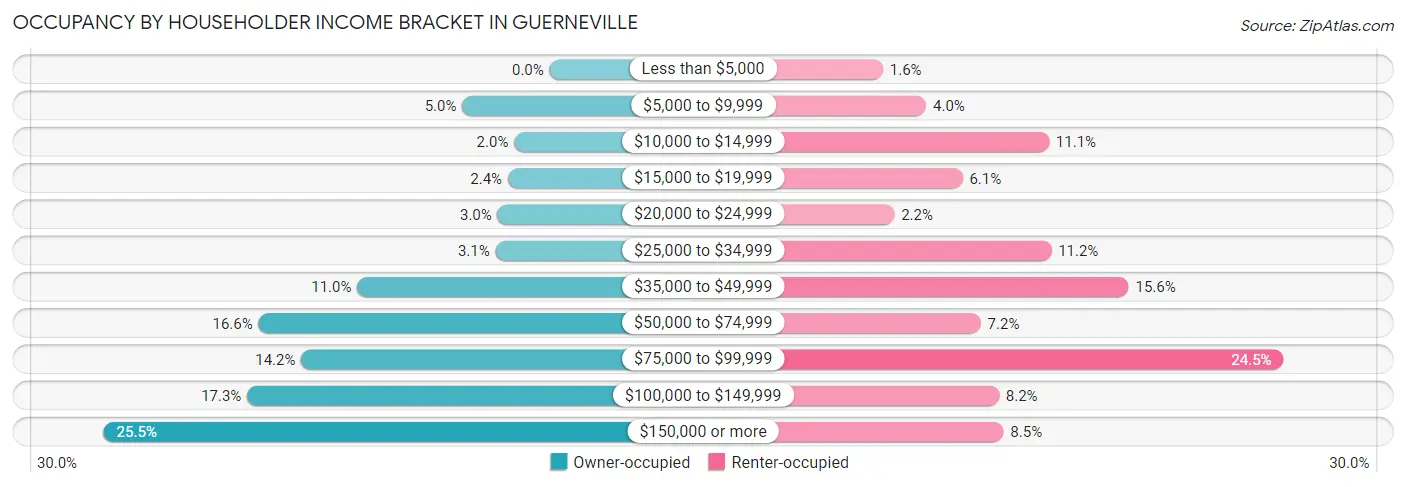
| Income Bracket | Owner-occupied | Renter-occupied |
| Less than $5,000 | 0 (0.0%) | 12 (1.6%) |
| $5,000 to $9,999 | 84 (5.0%) | 31 (4.0%) |
| $10,000 to $14,999 | 34 (2.0%) | 85 (11.1%) |
| $15,000 to $19,999 | 40 (2.4%) | 47 (6.1%) |
| $20,000 to $24,999 | 50 (3.0%) | 17 (2.2%) |
| $25,000 to $34,999 | 52 (3.1%) | 86 (11.2%) |
| $35,000 to $49,999 | 185 (11.0%) | 120 (15.6%) |
| $50,000 to $74,999 | 280 (16.6%) | 55 (7.1%) |
| $75,000 to $99,999 | 239 (14.2%) | 188 (24.4%) |
| $100,000 to $149,999 | 291 (17.3%) | 63 (8.2%) |
| $150,000 or more | 429 (25.5%) | 65 (8.5%) |
| Total | 1,684 (100.0%) | 769 (100.0%) |
Monthly Housing Cost Tiers in Guerneville
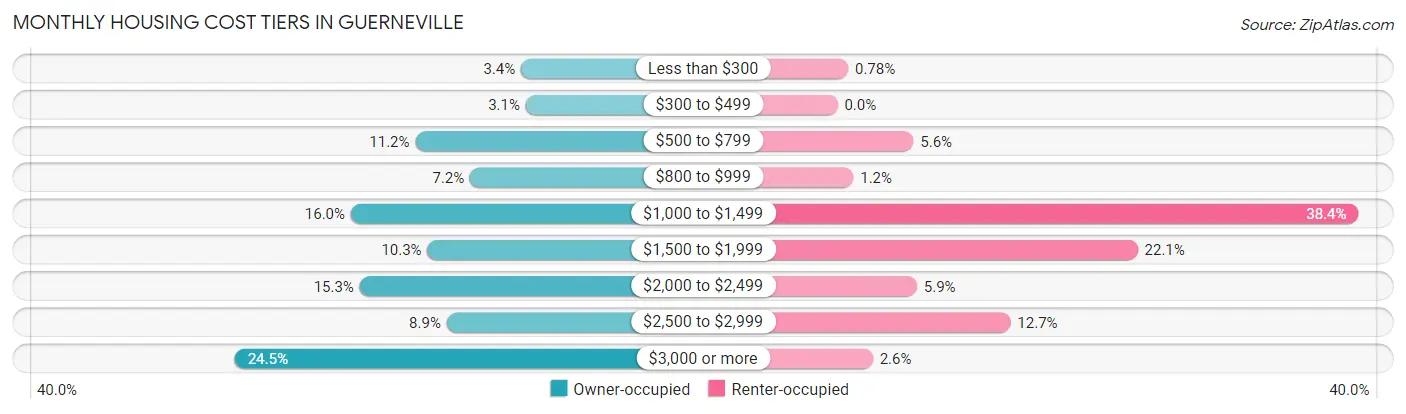
| Monthly Cost | Owner-occupied | Renter-occupied |
| Less than $300 | 58 (3.4%) | 6 (0.8%) |
| $300 to $499 | 52 (3.1%) | 0 (0.0%) |
| $500 to $799 | 189 (11.2%) | 43 (5.6%) |
| $800 to $999 | 121 (7.2%) | 9 (1.2%) |
| $1,000 to $1,499 | 269 (16.0%) | 295 (38.4%) |
| $1,500 to $1,999 | 174 (10.3%) | 170 (22.1%) |
| $2,000 to $2,499 | 258 (15.3%) | 45 (5.9%) |
| $2,500 to $2,999 | 150 (8.9%) | 98 (12.7%) |
| $3,000 or more | 413 (24.5%) | 20 (2.6%) |
| Total | 1,684 (100.0%) | 769 (100.0%) |
Physical Housing Characteristics in Guerneville
Housing Structures in Guerneville
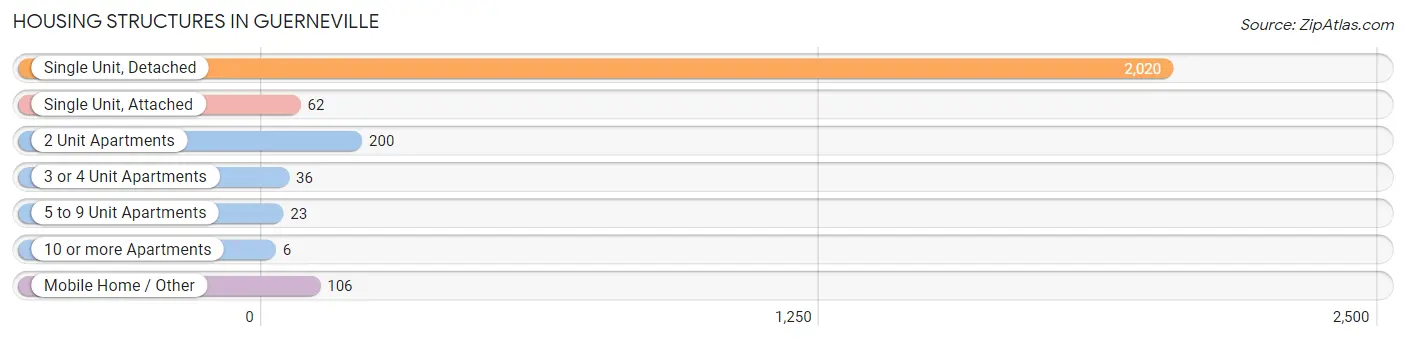
| Structure Type | # Housing Units | % Housing Units |
| Single Unit, Detached | 2,020 | 82.4% |
| Single Unit, Attached | 62 | 2.5% |
| 2 Unit Apartments | 200 | 8.2% |
| 3 or 4 Unit Apartments | 36 | 1.5% |
| 5 to 9 Unit Apartments | 23 | 0.9% |
| 10 or more Apartments | 6 | 0.2% |
| Mobile Home / Other | 106 | 4.3% |
| Total | 2,453 | 100.0% |
Housing Structures by Occupancy in Guerneville
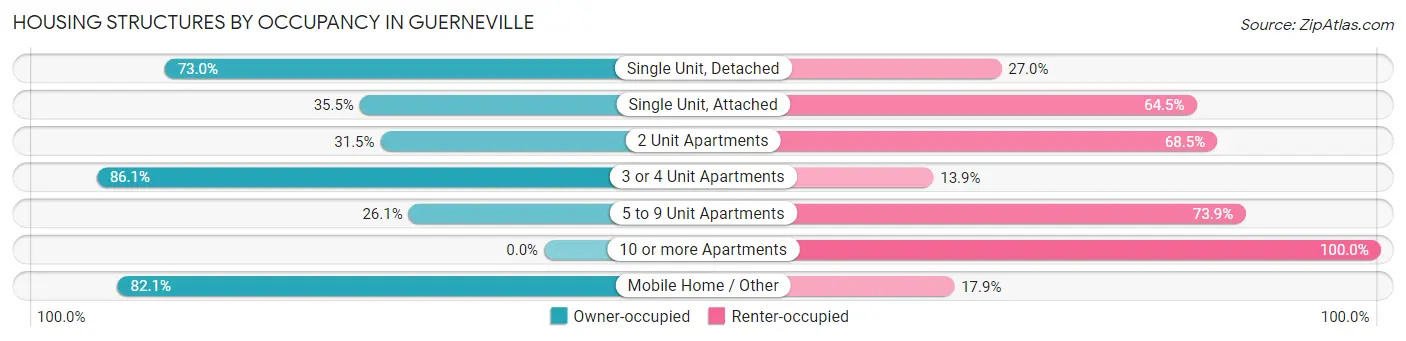
| Structure Type | Owner-occupied | Renter-occupied |
| Single Unit, Detached | 1,475 (73.0%) | 545 (27.0%) |
| Single Unit, Attached | 22 (35.5%) | 40 (64.5%) |
| 2 Unit Apartments | 63 (31.5%) | 137 (68.5%) |
| 3 or 4 Unit Apartments | 31 (86.1%) | 5 (13.9%) |
| 5 to 9 Unit Apartments | 6 (26.1%) | 17 (73.9%) |
| 10 or more Apartments | 0 (0.0%) | 6 (100.0%) |
| Mobile Home / Other | 87 (82.1%) | 19 (17.9%) |
| Total | 1,684 (68.6%) | 769 (31.4%) |
Housing Structures by Number of Rooms in Guerneville
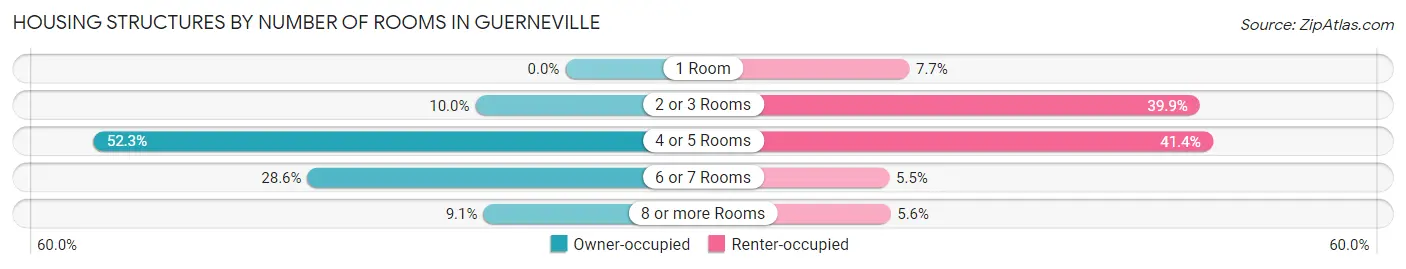
| Number of Rooms | Owner-occupied | Renter-occupied |
| 1 Room | 0 (0.0%) | 59 (7.7%) |
| 2 or 3 Rooms | 168 (10.0%) | 307 (39.9%) |
| 4 or 5 Rooms | 881 (52.3%) | 318 (41.3%) |
| 6 or 7 Rooms | 482 (28.6%) | 42 (5.5%) |
| 8 or more Rooms | 153 (9.1%) | 43 (5.6%) |
| Total | 1,684 (100.0%) | 769 (100.0%) |
Housing Structure by Heating Type in Guerneville
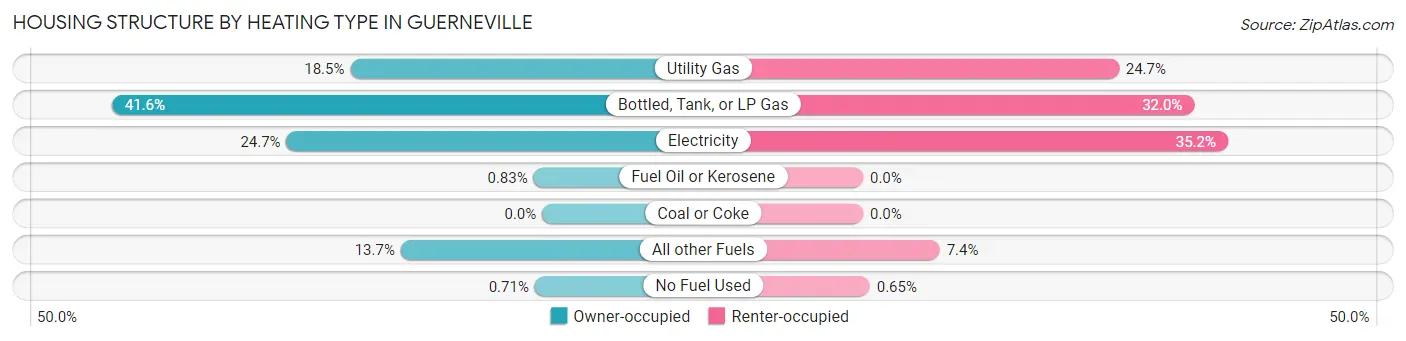
| Heating Type | Owner-occupied | Renter-occupied |
| Utility Gas | 312 (18.5%) | 190 (24.7%) |
| Bottled, Tank, or LP Gas | 700 (41.6%) | 246 (32.0%) |
| Electricity | 416 (24.7%) | 271 (35.2%) |
| Fuel Oil or Kerosene | 14 (0.8%) | 0 (0.0%) |
| Coal or Coke | 0 (0.0%) | 0 (0.0%) |
| All other Fuels | 230 (13.7%) | 57 (7.4%) |
| No Fuel Used | 12 (0.7%) | 5 (0.6%) |
| Total | 1,684 (100.0%) | 769 (100.0%) |
Household Vehicle Usage in Guerneville
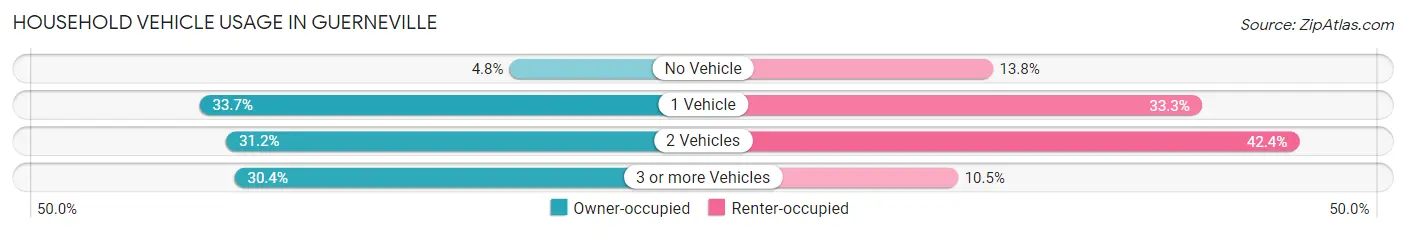
| Vehicles per Household | Owner-occupied | Renter-occupied |
| No Vehicle | 80 (4.8%) | 106 (13.8%) |
| 1 Vehicle | 567 (33.7%) | 256 (33.3%) |
| 2 Vehicles | 525 (31.2%) | 326 (42.4%) |
| 3 or more Vehicles | 512 (30.4%) | 81 (10.5%) |
| Total | 1,684 (100.0%) | 769 (100.0%) |
Real Estate & Mortgages in Guerneville
Real Estate and Mortgage Overview in Guerneville
| Characteristic | Without Mortgage | With Mortgage |
| Housing Units | 584 | 1,100 |
| Median Property Value | $598,900 | $589,100 |
| Median Household Income | $75,789 | $354 |
| Monthly Housing Costs | $850 | $413 |
| Real Estate Taxes | $5,134 | $49 |
Property Value by Mortgage Status in Guerneville
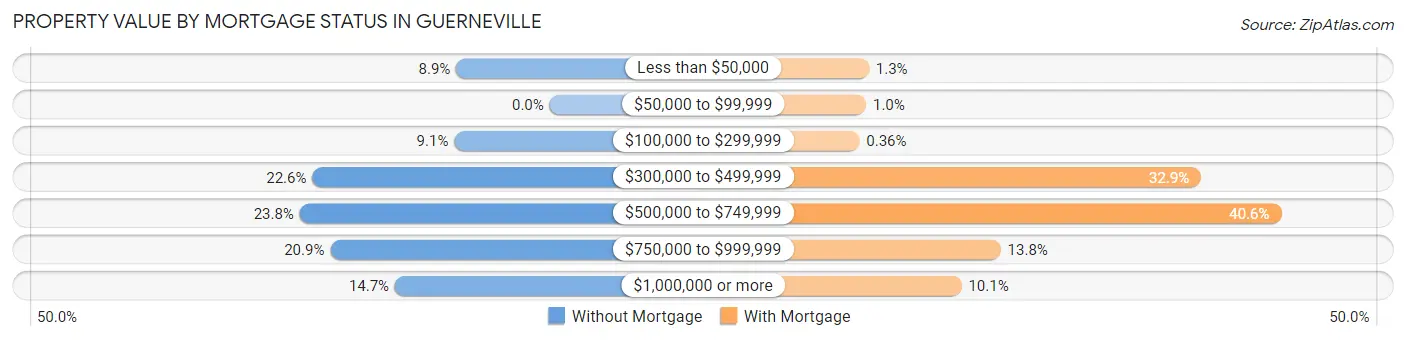
| Property Value | Without Mortgage | With Mortgage |
| Less than $50,000 | 52 (8.9%) | 14 (1.3%) |
| $50,000 to $99,999 | 0 (0.0%) | 11 (1.0%) |
| $100,000 to $299,999 | 53 (9.1%) | 4 (0.4%) |
| $300,000 to $499,999 | 132 (22.6%) | 362 (32.9%) |
| $500,000 to $749,999 | 139 (23.8%) | 446 (40.6%) |
| $750,000 to $999,999 | 122 (20.9%) | 152 (13.8%) |
| $1,000,000 or more | 86 (14.7%) | 111 (10.1%) |
| Total | 584 (100.0%) | 1,100 (100.0%) |
Household Income by Mortgage Status in Guerneville
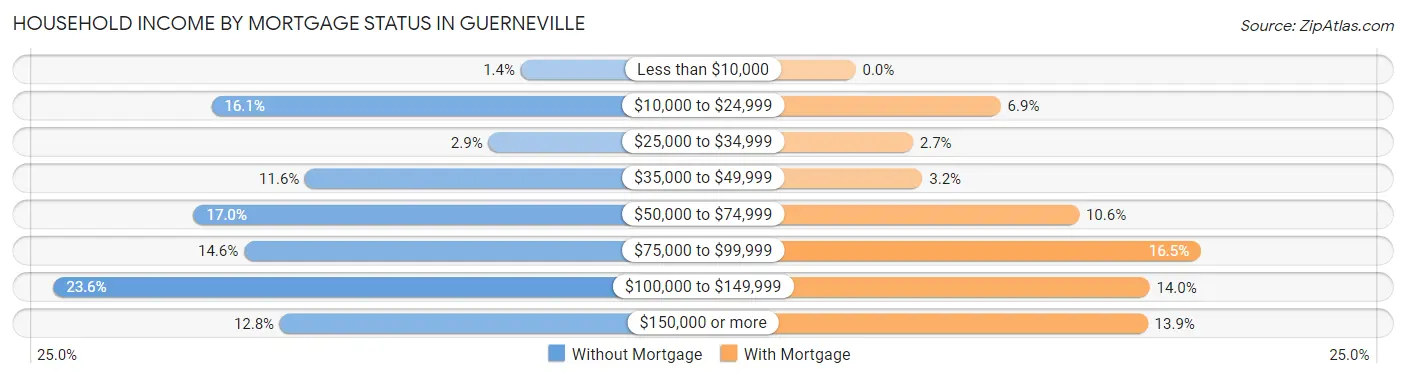
| Household Income | Without Mortgage | With Mortgage |
| Less than $10,000 | 8 (1.4%) | 0 (0.0%) |
| $10,000 to $24,999 | 94 (16.1%) | 76 (6.9%) |
| $25,000 to $34,999 | 17 (2.9%) | 30 (2.7%) |
| $35,000 to $49,999 | 68 (11.6%) | 35 (3.2%) |
| $50,000 to $74,999 | 99 (17.0%) | 117 (10.6%) |
| $75,000 to $99,999 | 85 (14.5%) | 181 (16.5%) |
| $100,000 to $149,999 | 138 (23.6%) | 154 (14.0%) |
| $150,000 or more | 75 (12.8%) | 153 (13.9%) |
| Total | 584 (100.0%) | 1,100 (100.0%) |
Property Value to Household Income Ratio in Guerneville
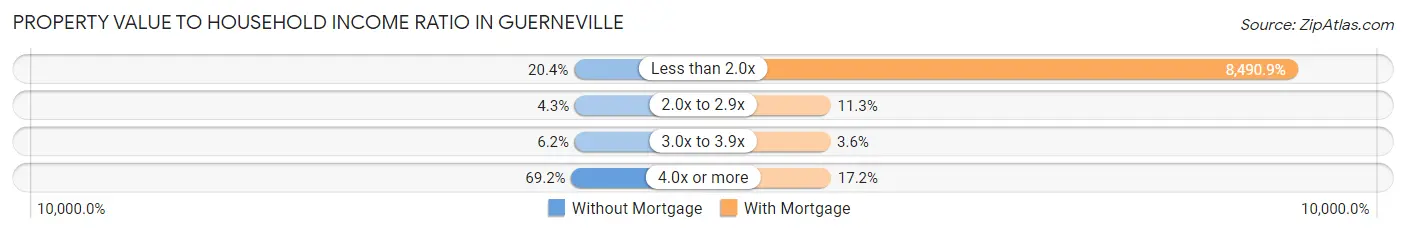
| Value-to-Income Ratio | Without Mortgage | With Mortgage |
| Less than 2.0x | 119 (20.4%) | 93,400 (8,490.9%) |
| 2.0x to 2.9x | 25 (4.3%) | 124 (11.3%) |
| 3.0x to 3.9x | 36 (6.2%) | 39 (3.5%) |
| 4.0x or more | 404 (69.2%) | 189 (17.2%) |
| Total | 584 (100.0%) | 1,100 (100.0%) |
Real Estate Taxes by Mortgage Status in Guerneville
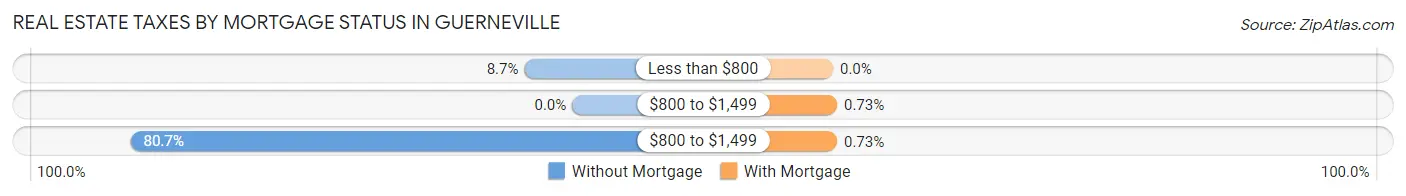
| Property Taxes | Without Mortgage | With Mortgage |
| Less than $800 | 51 (8.7%) | 0 (0.0%) |
| $800 to $1,499 | 0 (0.0%) | 8 (0.7%) |
| $800 to $1,499 | 471 (80.6%) | 8 (0.7%) |
| Total | 584 (100.0%) | 1,100 (100.0%) |
Health & Disability in Guerneville
Health Insurance Coverage by Age in Guerneville
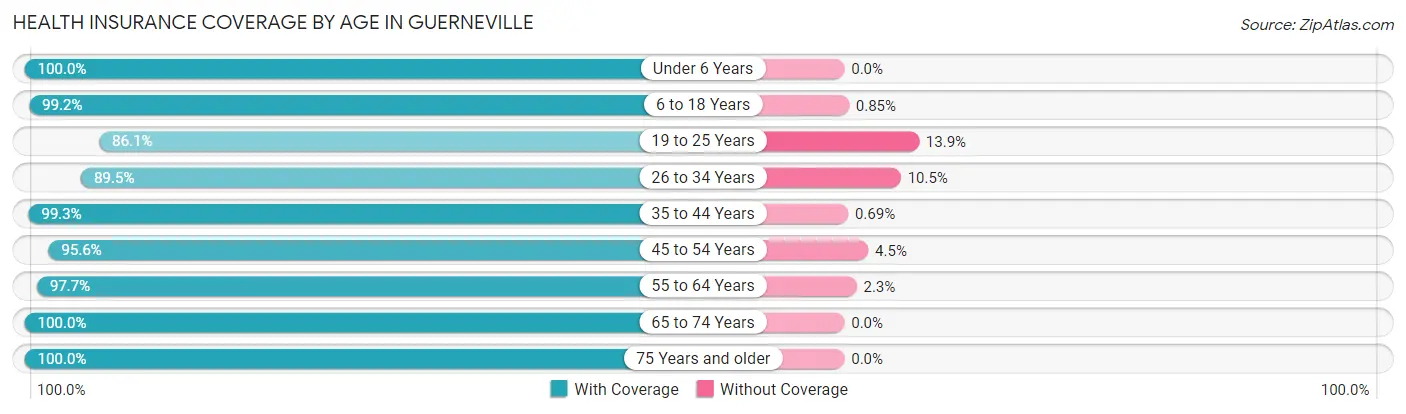
| Age Bracket | With Coverage | Without Coverage |
| Under 6 Years | 77 (100.0%) | 0 (0.0%) |
| 6 to 18 Years | 468 (99.2%) | 4 (0.9%) |
| 19 to 25 Years | 229 (86.1%) | 37 (13.9%) |
| 26 to 34 Years | 570 (89.5%) | 67 (10.5%) |
| 35 to 44 Years | 431 (99.3%) | 3 (0.7%) |
| 45 to 54 Years | 601 (95.6%) | 28 (4.4%) |
| 55 to 64 Years | 859 (97.7%) | 20 (2.3%) |
| 65 to 74 Years | 949 (100.0%) | 0 (0.0%) |
| 75 Years and older | 415 (100.0%) | 0 (0.0%) |
| Total | 4,599 (96.7%) | 159 (3.3%) |
Health Insurance Coverage by Citizenship Status in Guerneville
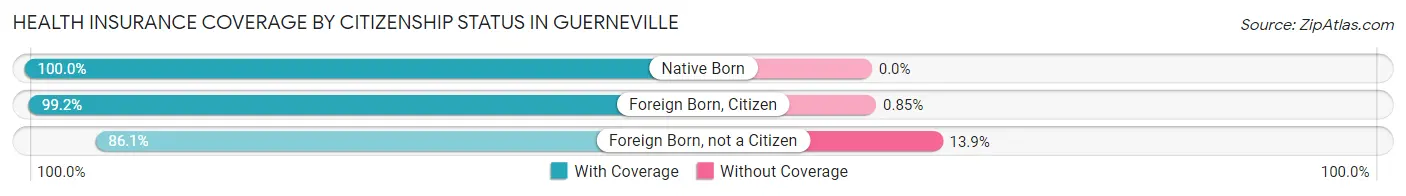
| Citizenship Status | With Coverage | Without Coverage |
| Native Born | 77 (100.0%) | 0 (0.0%) |
| Foreign Born, Citizen | 468 (99.2%) | 4 (0.9%) |
| Foreign Born, not a Citizen | 229 (86.1%) | 37 (13.9%) |
Health Insurance Coverage by Household Income in Guerneville
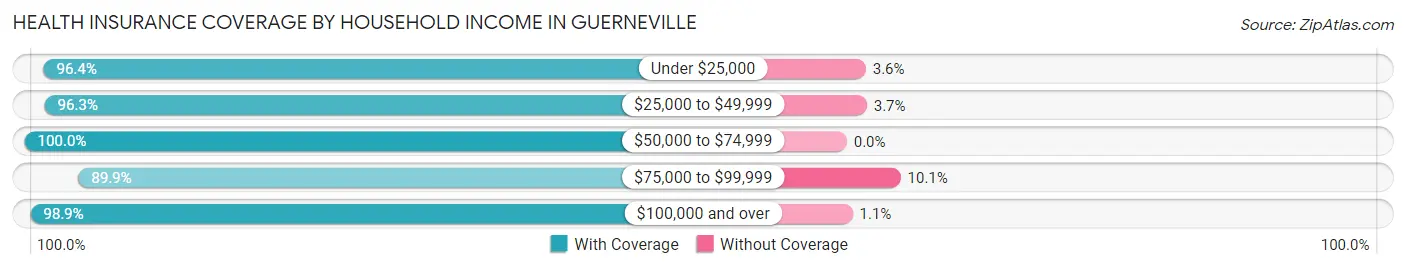
| Household Income | With Coverage | Without Coverage |
| Under $25,000 | 433 (96.4%) | 16 (3.6%) |
| $25,000 to $49,999 | 669 (96.3%) | 26 (3.7%) |
| $50,000 to $74,999 | 538 (100.0%) | 0 (0.0%) |
| $75,000 to $99,999 | 839 (89.9%) | 94 (10.1%) |
| $100,000 and over | 2,110 (98.9%) | 23 (1.1%) |
Public vs Private Health Insurance Coverage by Age in Guerneville
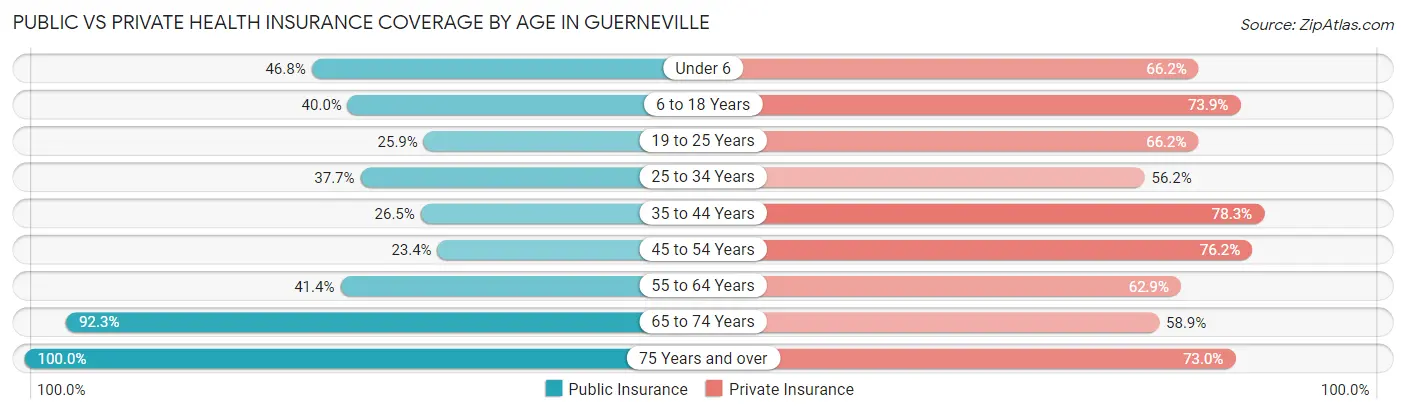
| Age Bracket | Public Insurance | Private Insurance |
| Under 6 | 36 (46.8%) | 51 (66.2%) |
| 6 to 18 Years | 189 (40.0%) | 349 (73.9%) |
| 19 to 25 Years | 69 (25.9%) | 176 (66.2%) |
| 25 to 34 Years | 240 (37.7%) | 358 (56.2%) |
| 35 to 44 Years | 115 (26.5%) | 340 (78.3%) |
| 45 to 54 Years | 147 (23.4%) | 479 (76.1%) |
| 55 to 64 Years | 364 (41.4%) | 553 (62.9%) |
| 65 to 74 Years | 876 (92.3%) | 559 (58.9%) |
| 75 Years and over | 415 (100.0%) | 303 (73.0%) |
| Total | 2,451 (51.5%) | 3,168 (66.6%) |
Disability Status by Sex by Age in Guerneville
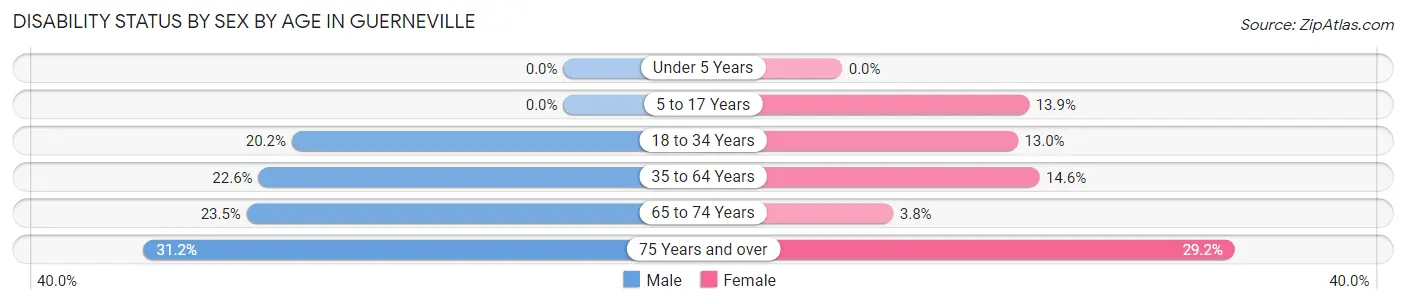
| Age Bracket | Male | Female |
| Under 5 Years | 0 (0.0%) | 0 (0.0%) |
| 5 to 17 Years | 0 (0.0%) | 34 (13.9%) |
| 18 to 34 Years | 100 (20.2%) | 63 (13.0%) |
| 35 to 64 Years | 268 (22.6%) | 111 (14.6%) |
| 65 to 74 Years | 130 (23.5%) | 15 (3.8%) |
| 75 Years and over | 62 (31.2%) | 63 (29.2%) |
Disability Class by Sex by Age in Guerneville
Disability Class: Hearing Difficulty
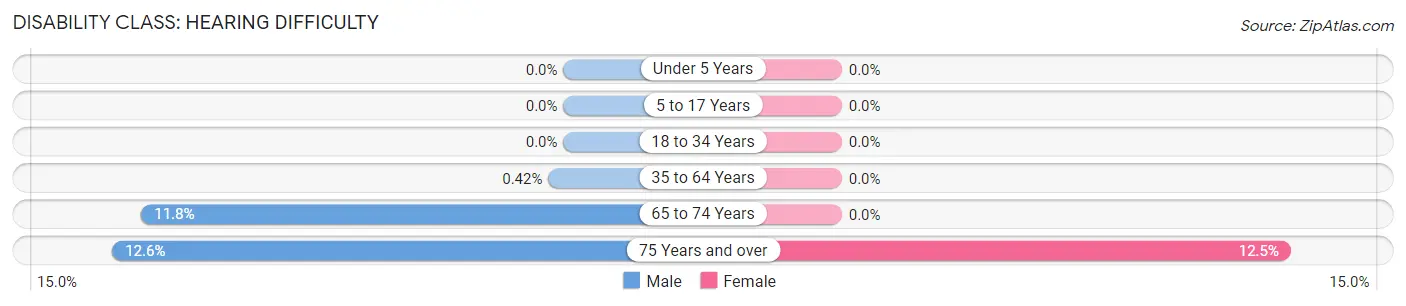
| Age Bracket | Male | Female |
| Under 5 Years | 0 (0.0%) | 0 (0.0%) |
| 5 to 17 Years | 0 (0.0%) | 0 (0.0%) |
| 18 to 34 Years | 0 (0.0%) | 0 (0.0%) |
| 35 to 64 Years | 5 (0.4%) | 0 (0.0%) |
| 65 to 74 Years | 65 (11.7%) | 0 (0.0%) |
| 75 Years and over | 25 (12.6%) | 27 (12.5%) |
Disability Class: Vision Difficulty
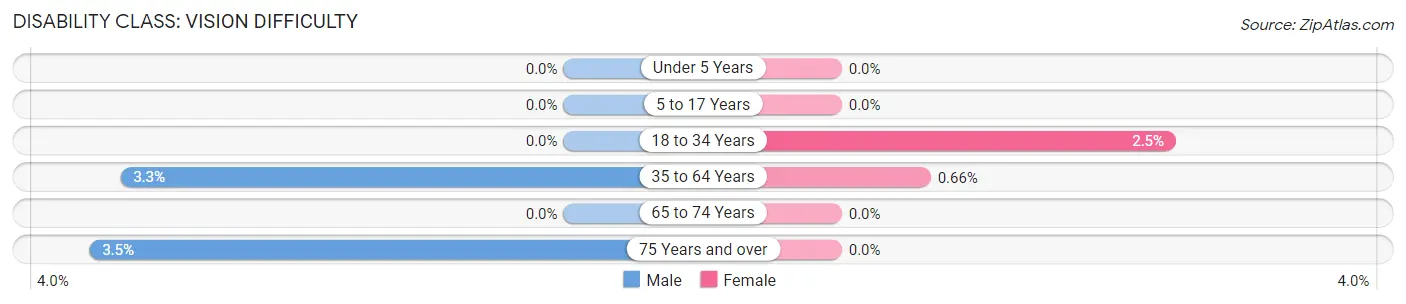
| Age Bracket | Male | Female |
| Under 5 Years | 0 (0.0%) | 0 (0.0%) |
| 5 to 17 Years | 0 (0.0%) | 0 (0.0%) |
| 18 to 34 Years | 0 (0.0%) | 12 (2.5%) |
| 35 to 64 Years | 39 (3.3%) | 5 (0.7%) |
| 65 to 74 Years | 0 (0.0%) | 0 (0.0%) |
| 75 Years and over | 7 (3.5%) | 0 (0.0%) |
Disability Class: Cognitive Difficulty
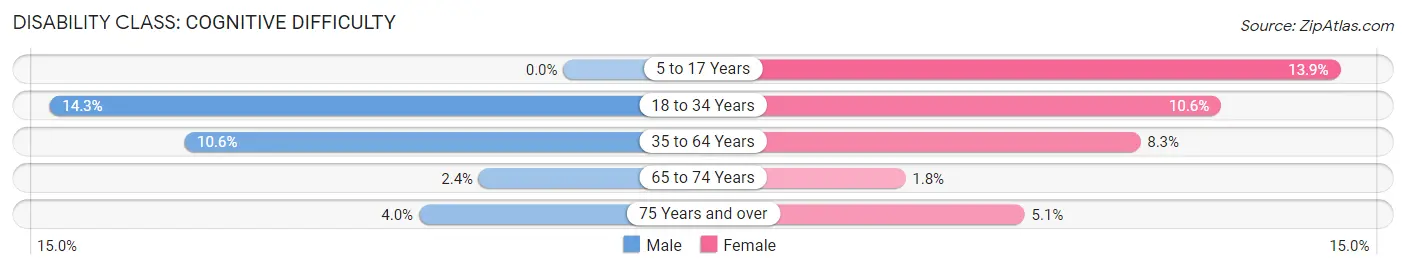
| Age Bracket | Male | Female |
| 5 to 17 Years | 0 (0.0%) | 34 (13.9%) |
| 18 to 34 Years | 71 (14.3%) | 51 (10.6%) |
| 35 to 64 Years | 125 (10.6%) | 63 (8.3%) |
| 65 to 74 Years | 13 (2.4%) | 7 (1.8%) |
| 75 Years and over | 8 (4.0%) | 11 (5.1%) |
Disability Class: Ambulatory Difficulty
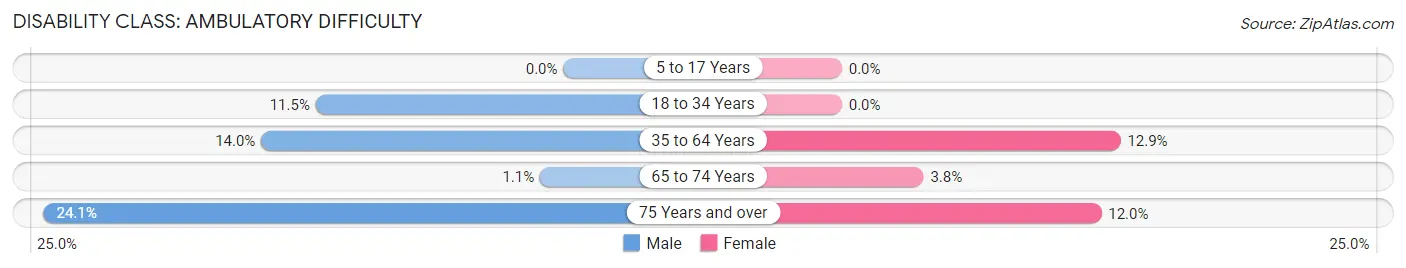
| Age Bracket | Male | Female |
| 5 to 17 Years | 0 (0.0%) | 0 (0.0%) |
| 18 to 34 Years | 57 (11.5%) | 0 (0.0%) |
| 35 to 64 Years | 166 (14.0%) | 98 (12.9%) |
| 65 to 74 Years | 6 (1.1%) | 15 (3.8%) |
| 75 Years and over | 48 (24.1%) | 26 (12.0%) |
Disability Class: Self-Care Difficulty
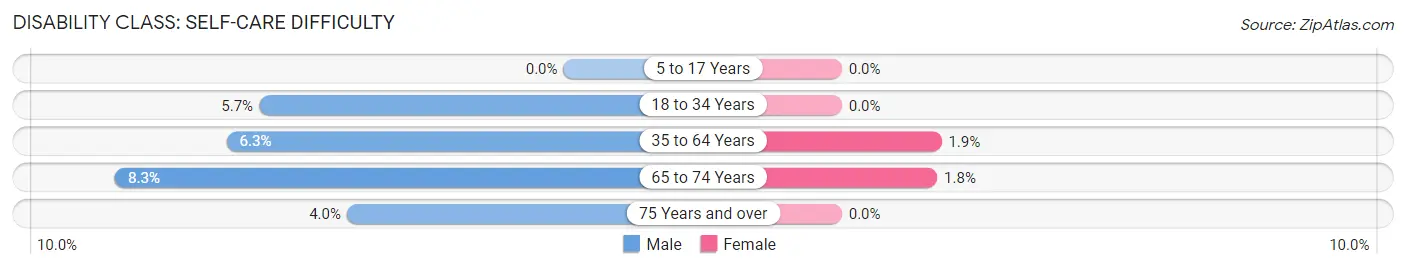
| Age Bracket | Male | Female |
| 5 to 17 Years | 0 (0.0%) | 0 (0.0%) |
| 18 to 34 Years | 28 (5.7%) | 0 (0.0%) |
| 35 to 64 Years | 74 (6.2%) | 14 (1.8%) |
| 65 to 74 Years | 46 (8.3%) | 7 (1.8%) |
| 75 Years and over | 8 (4.0%) | 0 (0.0%) |
Technology Access in Guerneville
Computing Device Access in Guerneville
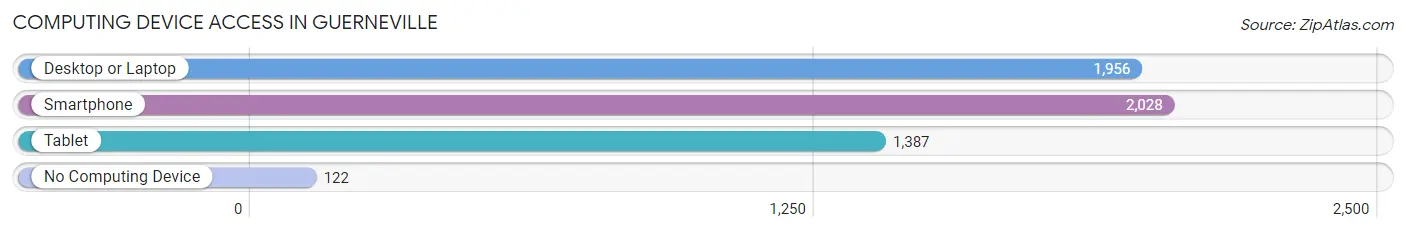
| Device Type | # Households | % Households |
| Desktop or Laptop | 1,956 | 79.7% |
| Smartphone | 2,028 | 82.7% |
| Tablet | 1,387 | 56.5% |
| No Computing Device | 122 | 5.0% |
| Total | 2,453 | 100.0% |
Internet Access in Guerneville
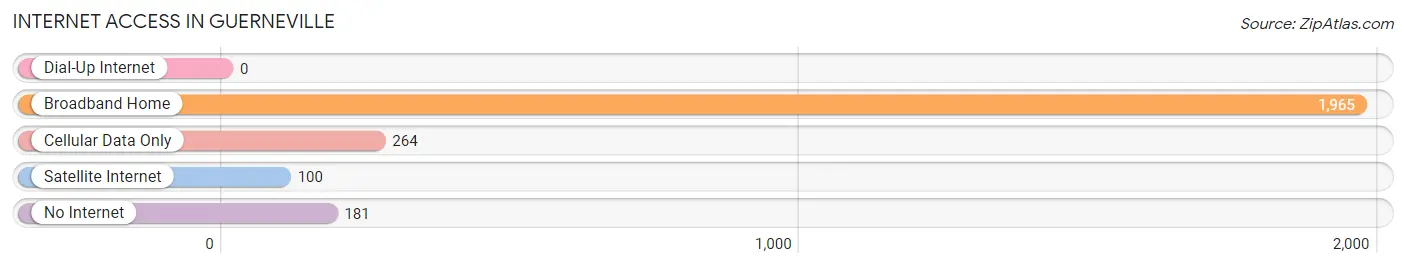
| Internet Type | # Households | % Households |
| Dial-Up Internet | 0 | 0.0% |
| Broadband Home | 1,965 | 80.1% |
| Cellular Data Only | 264 | 10.8% |
| Satellite Internet | 100 | 4.1% |
| No Internet | 181 | 7.4% |
| Total | 2,453 | 100.0% |
Guerneville Summary
Guerneville is a small town located in Sonoma County, California, United States. It is situated in the Russian River Valley, approximately 55 miles (89 km) north of San Francisco. The population was 4,534 at the 2010 census. Guerneville is known for its natural beauty, redwood forests, and its laid-back atmosphere.
History
The area around Guerneville was originally inhabited by the Pomo people, who were hunter-gatherers. The first European settlers arrived in the area in the 1850s, and the town of Guerneville was founded in 1854. The town was named after George Washington Guerne, a Swiss immigrant who owned a local sawmill.
In the late 19th century, the area became a popular vacation destination for wealthy San Franciscans. The town was home to several resorts, including the Russian River Resort, which was built in 1877.
Geography
Guerneville is located in the Russian River Valley, approximately 55 miles (89 km) north of San Francisco. The town is situated on the banks of the Russian River, which flows through the valley. The town is surrounded by redwood forests and is located in a temperate rainforest climate.
The town has a total area of 2 2 square miles 5 7 km2 all of which is land
Economy
The economy of Guerneville is largely based on tourism. The town is a popular destination for outdoor activities such as fishing, camping, and rafting. The town is also home to several wineries and vineyards, as well as several restaurants and shops.
Demographics
As of the 2010 census, there were 4,534 people, 1,945 households, and 1,093 families residing in the town. The population density was 2,062.2 people per square mile (797.2/km2). There were 2,093 housing units at an average density of 945.2 per square mile (364.7/km2). The racial makeup of the town was 79.2% White, 0.7% African American, 1.2% Native American, 1.2% Asian, 0.2% Pacific Islander, 14.2% from other races, and 3.3% from two or more races. Hispanic or Latino of any race were 24.3% of the population.
There were 1,945 households, out of which 24.2% had children under the age of 18 living with them, 40.2% were married couples living together, 11.7% had a female householder with no husband present, and 42.7% were non-families. 34.2% of all households were made up of individuals, and 11.7% had someone living alone who was 65 years of age or older. The average household size was 2.31 and the average family size was 3.02.
In the town, the population was spread out, with 22.7% under the age of 18, 8.2% from 18 to 24, 28.2% from 25 to 44, 27.2% from 45 to 64, and 13.7% who were 65 years of age or older. The median age was 39 years. For every 100 females, there were 97.2 males. For every 100 females age 18 and over, there were 95.2 males.
The median income for a household in the town was $41,944, and the median income for a family was $50,000. Males had a median income of $40,000 versus $30,000 for females. The per capita income for the town was $22,845. About 10.2% of families and 14.2% of the population were below the poverty line, including 18.2% of those under age 18 and 8.2% of those age 65 or over.
Common Questions
What is Per Capita Income in Guerneville?
Per Capita income in Guerneville is $56,895.
What is the Median Family Income in Guerneville?
Median Family Income in Guerneville is $112,431.
What is the Median Household income in Guerneville?
Median Household Income in Guerneville is $80,159.
What is Income or Wage Gap in Guerneville?
Income or Wage Gap in Guerneville is 12.1%.
Women in Guerneville earn 87.9 cents for every dollar earned by a man.
What is Inequality or Gini Index in Guerneville?
Inequality or Gini Index in Guerneville is 0.49.
What is the Total Population of Guerneville?
Total Population of Guerneville is 4,764.
What is the Total Male Population of Guerneville?
Total Male Population of Guerneville is 2,640.
What is the Total Female Population of Guerneville?
Total Female Population of Guerneville is 2,124.
What is the Ratio of Males per 100 Females in Guerneville?
There are 124.29 Males per 100 Females in Guerneville.
What is the Ratio of Females per 100 Males in Guerneville?
There are 80.45 Females per 100 Males in Guerneville.
What is the Median Population Age in Guerneville?
Median Population Age in Guerneville is 53.4 Years.
What is the Average Family Size in Guerneville
Average Family Size in Guerneville is 2.6 People.
What is the Average Household Size in Guerneville
Average Household Size in Guerneville is 1.9 People.
How Large is the Labor Force in Guerneville?
There are 2,517 People in the Labor Forcein in Guerneville.
What is the Percentage of People in the Labor Force in Guerneville?
57.3% of People are in the Labor Force in Guerneville.
What is the Unemployment Rate in Guerneville?
Unemployment Rate in Guerneville is 9.0%.