Zip Codes with the Highest Percentage of Households Heated by Bottled Gas / Liquid Propane in Grass Valley, CA
RELATED REPORTS & OPTIONS
Bottled Gas / LP Heating
Grass Valley
Compare Zip Codes
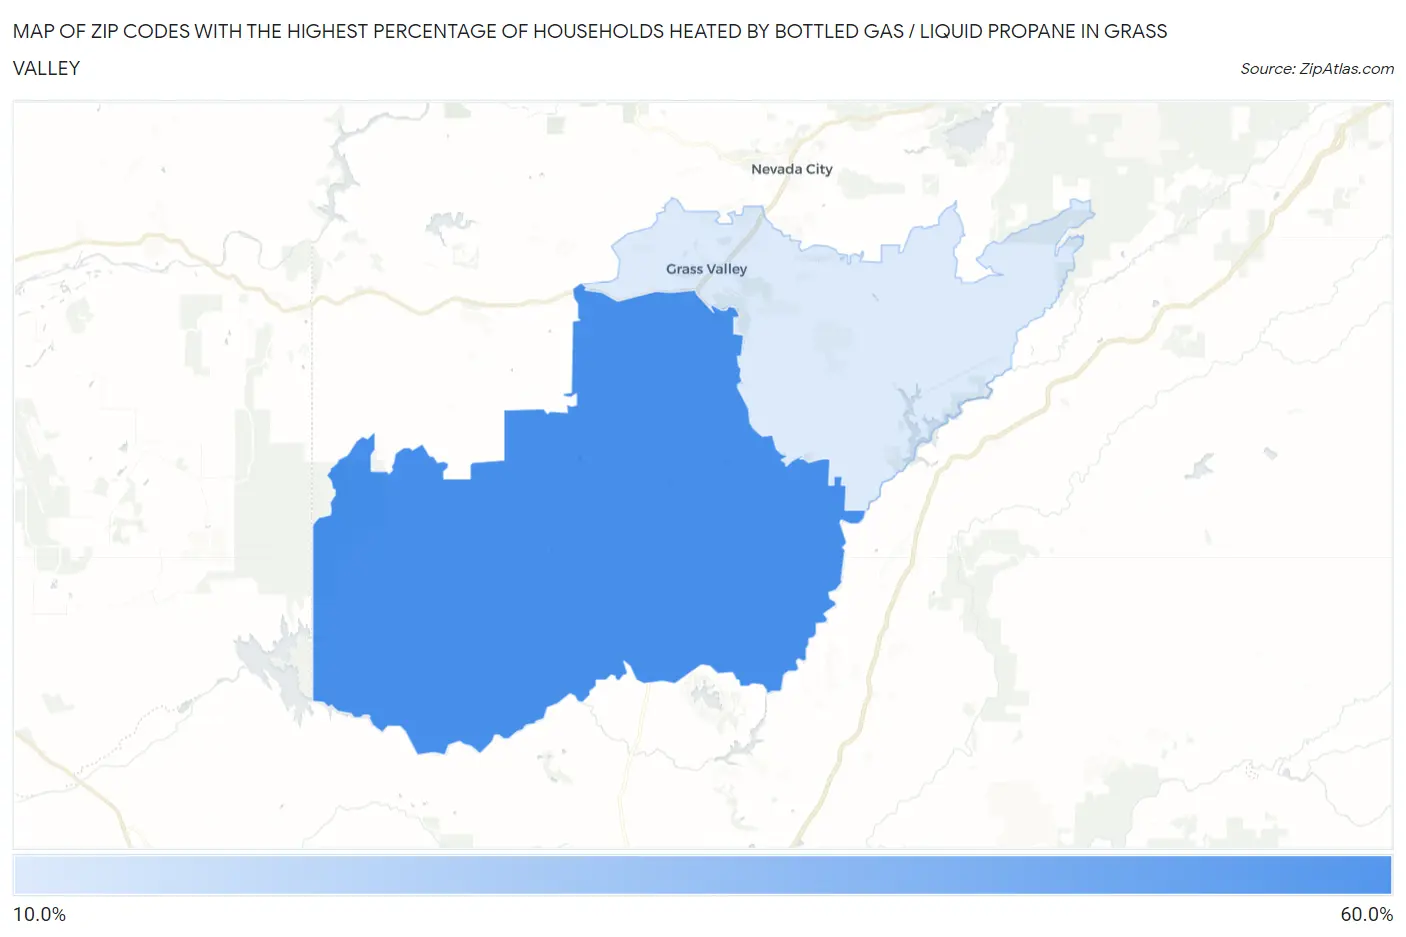
Map of Zip Codes with the Highest Percentage of Households Heated by Bottled Gas / Liquid Propane in Grass Valley
0.0%
60.0%
Zip Codes with the Highest Percentage of Households Heated by Bottled Gas / Liquid Propane in Grass Valley, CA
| Zip Code | Bottled Gas / LP Heating | vs State | vs National | |
| 1. | 95949 | 53.4% | 3.5%(+49.9)#65 | 4.9%(+48.5)#1,953 |
| 2. | 95945 | 16.6% | 3.5%(+13.1)#370 | 4.9%(+11.7)#10,490 |
1
Common Questions
What are the Top Zip Codes with the Highest Percentage of Households Heated by Bottled Gas / Liquid Propane in Grass Valley, CA?
Top Zip Codes with the Highest Percentage of Households Heated by Bottled Gas / Liquid Propane in Grass Valley, CA are:
What zip code has the Highest Percentage of Households Heated by Bottled Gas / Liquid Propane in Grass Valley, CA?
95949 has the Highest Percentage of Households Heated by Bottled Gas / Liquid Propane in Grass Valley, CA with 53.4%.
What is the Percentage of Households Heated by Bottled Gas / Liquid Propane in Grass Valley, CA?
Percentage of Households Heated by Bottled Gas / Liquid Propane in Grass Valley is 0.60%.
What is the Percentage of Households Heated by Bottled Gas / Liquid Propane in California?
Percentage of Households Heated by Bottled Gas / Liquid Propane in California is 3.5%.
What is the Percentage of Households Heated by Bottled Gas / Liquid Propane in the United States?
Percentage of Households Heated by Bottled Gas / Liquid Propane in the United States is 4.9%.