Gasquet, CA Map & Demographics
Gasquet Map
Gasquet Overview
$25,597
PER CAPITA INCOME
$53,700
AVG FAMILY INCOME
$26,736
AVG HOUSEHOLD INCOME
0.44
INEQUALITY / GINI INDEX
366
TOTAL POPULATION
233
MALE POPULATION
133
FEMALE POPULATION
175.19
MALES / 100 FEMALES
57.08
FEMALES / 100 MALES
61.7
MEDIAN AGE
2.4
AVG FAMILY SIZE
1.5
AVG HOUSEHOLD SIZE
159
LABOR FORCE [ PEOPLE ]
46.4%
PERCENT IN LABOR FORCE
4.4%
UNEMPLOYMENT RATE
Gasquet Zip Codes
Gasquet Area Codes
Income in Gasquet
Income Overview in Gasquet
Per Capita Income in Gasquet is $25,597, while median incomes of families and households are $53,700 and $26,736 respectively.
| Characteristic | Number | Measure |
| Per Capita Income | 366 | $25,597 |
| Median Family Income | 86 | $53,700 |
| Mean Family Income | 86 | $64,252 |
| Median Household Income | 250 | $26,736 |
| Mean Household Income | 250 | $37,962 |
| Income Deficit | 86 | $0 |
| Wage / Income Gap (%) | 366 | 0.00% |
| Wage / Income Gap ($) | 366 | 100.00¢ per $1 |
| Gini / Inequality Index | 366 | 0.44 |
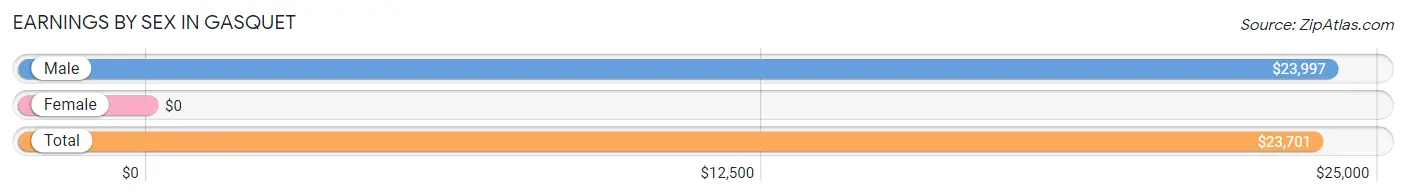
Earnings by Sex in Gasquet
| Sex | Number | Average Earnings |
| Male | 107 (63.3%) | $23,997 |
| Female | 62 (36.7%) | $0 |
| Total | 169 (100.0%) | $23,701 |
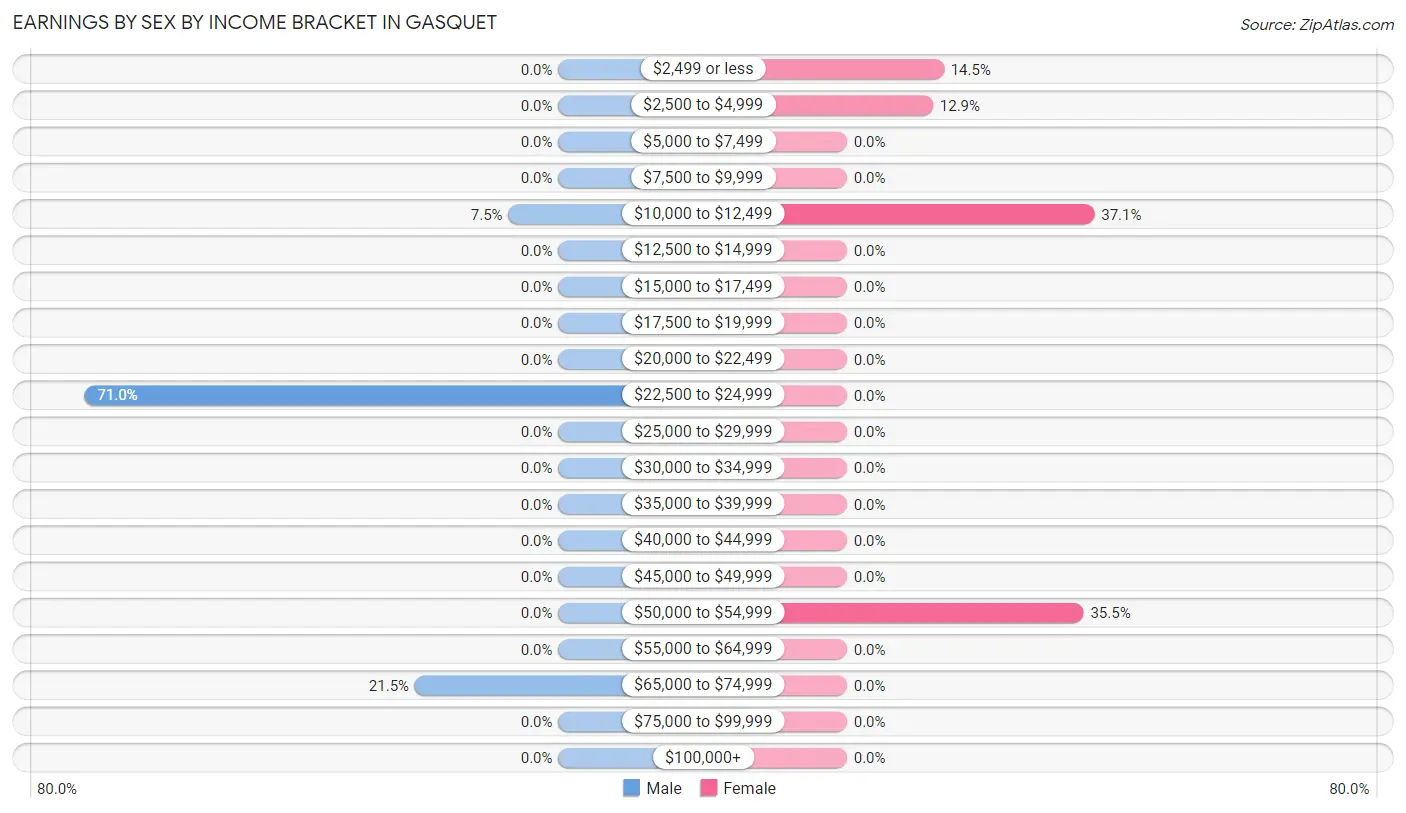
Earnings by Sex by Income Bracket in Gasquet
The most common earnings brackets in Gasquet are $22,500 to $24,999 for men (76 | 71.0%) and $10,000 to $12,499 for women (23 | 37.1%).
| Income | Male | Female |
| $2,499 or less | 0 (0.0%) | 9 (14.5%) |
| $2,500 to $4,999 | 0 (0.0%) | 8 (12.9%) |
| $5,000 to $7,499 | 0 (0.0%) | 0 (0.0%) |
| $7,500 to $9,999 | 0 (0.0%) | 0 (0.0%) |
| $10,000 to $12,499 | 8 (7.5%) | 23 (37.1%) |
| $12,500 to $14,999 | 0 (0.0%) | 0 (0.0%) |
| $15,000 to $17,499 | 0 (0.0%) | 0 (0.0%) |
| $17,500 to $19,999 | 0 (0.0%) | 0 (0.0%) |
| $20,000 to $22,499 | 0 (0.0%) | 0 (0.0%) |
| $22,500 to $24,999 | 76 (71.0%) | 0 (0.0%) |
| $25,000 to $29,999 | 0 (0.0%) | 0 (0.0%) |
| $30,000 to $34,999 | 0 (0.0%) | 0 (0.0%) |
| $35,000 to $39,999 | 0 (0.0%) | 0 (0.0%) |
| $40,000 to $44,999 | 0 (0.0%) | 0 (0.0%) |
| $45,000 to $49,999 | 0 (0.0%) | 0 (0.0%) |
| $50,000 to $54,999 | 0 (0.0%) | 22 (35.5%) |
| $55,000 to $64,999 | 0 (0.0%) | 0 (0.0%) |
| $65,000 to $74,999 | 23 (21.5%) | 0 (0.0%) |
| $75,000 to $99,999 | 0 (0.0%) | 0 (0.0%) |
| $100,000+ | 0 (0.0%) | 0 (0.0%) |
| Total | 107 (100.0%) | 62 (100.0%) |
Earnings by Sex by Educational Attainment in Gasquet
| Educational Attainment | Male Income | Female Income |
| Less than High School | - | - |
| High School Diploma | - | - |
| College or Associate's Degree | - | - |
| Bachelor's Degree | - | - |
| Graduate Degree | - | - |
| Total | $23,997 | $0 |
Family Income in Gasquet
Family Income Brackets in Gasquet
According to the Gasquet family income data, there are 25 families falling into the $50,000 to $74,999 income range, which is the most common income bracket and makes up 29.1% of all families.
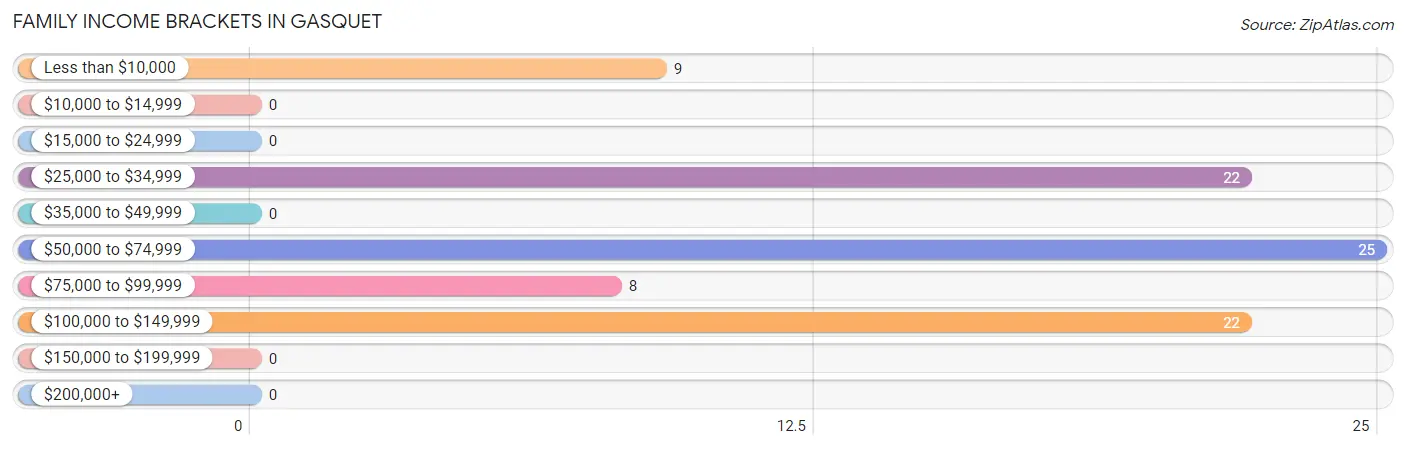
| Income Bracket | # Families | % Families |
| Less than $10,000 | 9 | 10.5% |
| $10,000 to $14,999 | 0 | 0.0% |
| $15,000 to $24,999 | 0 | 0.0% |
| $25,000 to $34,999 | 22 | 25.6% |
| $35,000 to $49,999 | 0 | 0.0% |
| $50,000 to $74,999 | 25 | 29.1% |
| $75,000 to $99,999 | 8 | 9.3% |
| $100,000 to $149,999 | 22 | 25.6% |
| $150,000 to $199,999 | 0 | 0.0% |
| $200,000+ | 0 | 0.0% |
Family Income by Famaliy Size in Gasquet
2-person families (77 | 89.5%) account for the highest median family income in Gasquet with $54,150 per family, while 2-person families (77 | 89.5%) have the highest median income of $27,075 per family member.
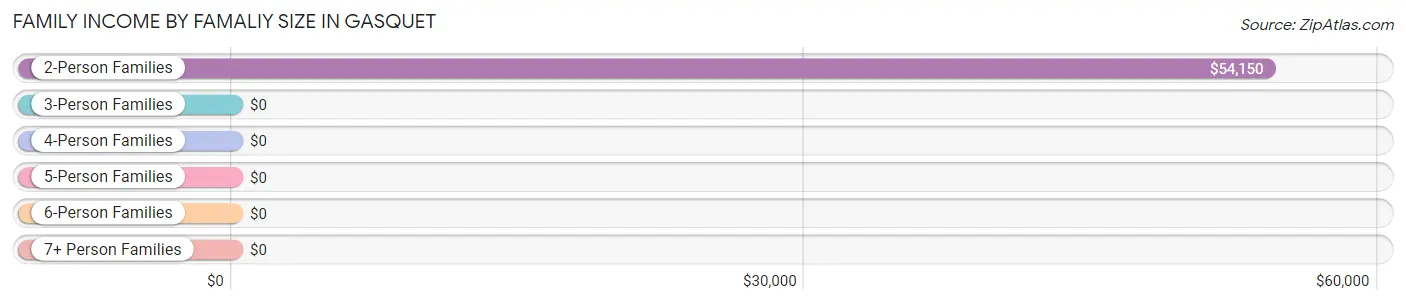
| Income Bracket | # Families | Median Income |
| 2-Person Families | 77 (89.5%) | $54,150 |
| 3-Person Families | 0 (0.0%) | $0 |
| 4-Person Families | 0 (0.0%) | $0 |
| 5-Person Families | 9 (10.5%) | $0 |
| 6-Person Families | 0 (0.0%) | $0 |
| 7+ Person Families | 0 (0.0%) | $0 |
| Total | 86 (100.0%) | $53,700 |
Family Income by Number of Earners in Gasquet
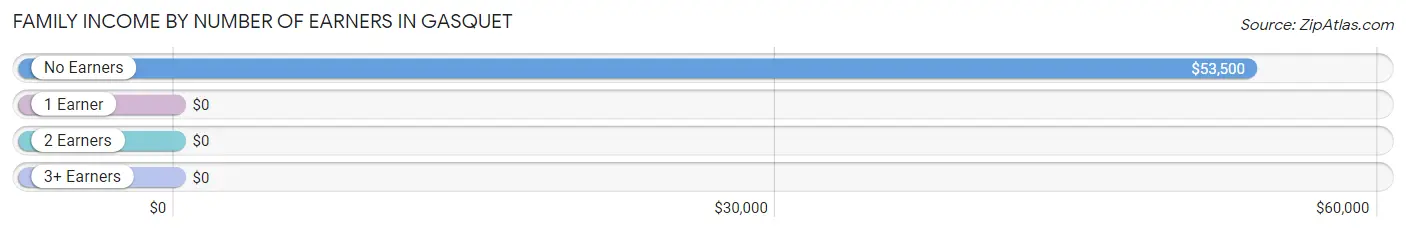
| Number of Earners | # Families | Median Income |
| No Earners | 46 (53.5%) | $53,500 |
| 1 Earner | 18 (20.9%) | $0 |
| 2 Earners | 22 (25.6%) | $0 |
| 3+ Earners | 0 (0.0%) | $0 |
| Total | 86 (100.0%) | $53,700 |
Household Income in Gasquet
Household Income Brackets in Gasquet
With 76 households falling in the category, the $10,000 to $14,999 income range is the most frequent in Gasquet, accounting for 30.4% of all households.
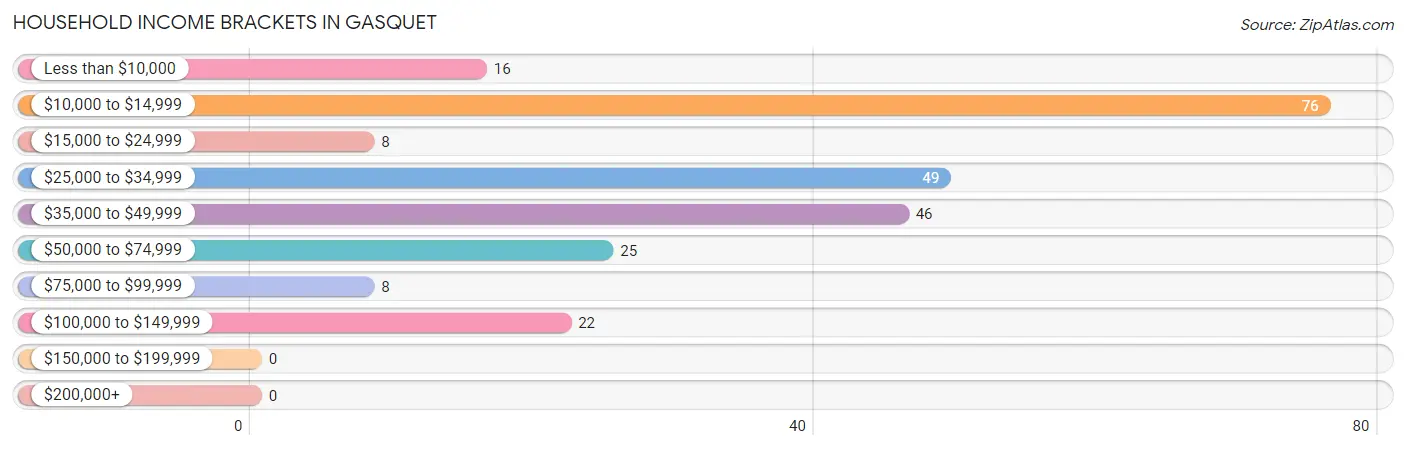
| Income Bracket | # Households | % Households |
| Less than $10,000 | 16 | 6.4% |
| $10,000 to $14,999 | 76 | 30.4% |
| $15,000 to $24,999 | 8 | 3.2% |
| $25,000 to $34,999 | 49 | 19.6% |
| $35,000 to $49,999 | 46 | 18.4% |
| $50,000 to $74,999 | 25 | 10.0% |
| $75,000 to $99,999 | 8 | 3.2% |
| $100,000 to $149,999 | 22 | 8.8% |
| $150,000 to $199,999 | 0 | 0.0% |
| $200,000+ | 0 | 0.0% |
Household Income by Householder Age in Gasquet
The median household income in Gasquet is $26,736, with the highest median household income of $43,696 found in the 65+ years age bracket for the primary householder. A total of 120 households (48.0%) fall into this category.
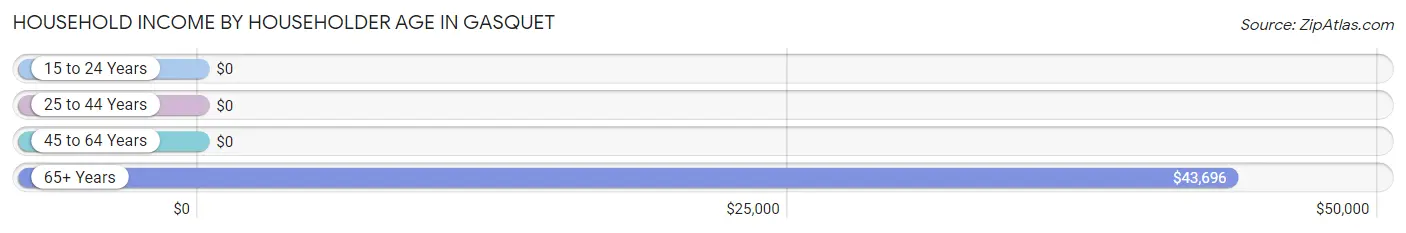
| Income Bracket | # Households | Median Income |
| 15 to 24 Years | 0 (0.0%) | $0 |
| 25 to 44 Years | 76 (30.4%) | $0 |
| 45 to 64 Years | 54 (21.6%) | $0 |
| 65+ Years | 120 (48.0%) | $43,696 |
| Total | 250 (100.0%) | $26,736 |
Poverty in Gasquet
Income Below Poverty by Sex and Age in Gasquet
With 46.4% poverty level for males and 18.8% for females among the residents of Gasquet, under 5 year old males and 35 to 44 year old females are the most vulnerable to poverty, with 11 males (100.0%) and 9 females (100.0%) in their respective age groups living below the poverty level.
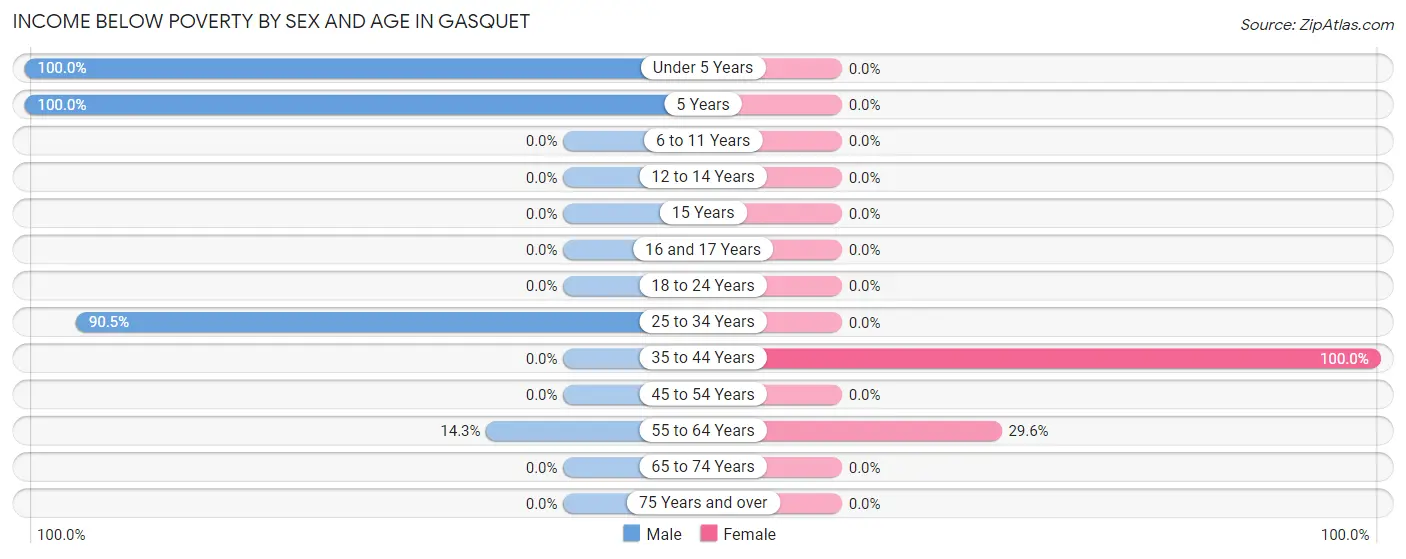
| Age Bracket | Male | Female |
| Under 5 Years | 11 (100.0%) | 0 (0.0%) |
| 5 Years | 12 (100.0%) | 0 (0.0%) |
| 6 to 11 Years | 0 (0.0%) | 0 (0.0%) |
| 12 to 14 Years | 0 (0.0%) | 0 (0.0%) |
| 15 Years | 0 (0.0%) | 0 (0.0%) |
| 16 and 17 Years | 0 (0.0%) | 0 (0.0%) |
| 18 to 24 Years | 0 (0.0%) | 0 (0.0%) |
| 25 to 34 Years | 76 (90.5%) | 0 (0.0%) |
| 35 to 44 Years | 0 (0.0%) | 9 (100.0%) |
| 45 to 54 Years | 0 (0.0%) | 0 (0.0%) |
| 55 to 64 Years | 9 (14.3%) | 16 (29.6%) |
| 65 to 74 Years | 0 (0.0%) | 0 (0.0%) |
| 75 Years and over | 0 (0.0%) | 0 (0.0%) |
| Total | 108 (46.4%) | 25 (18.8%) |
Income Above Poverty by Sex and Age in Gasquet
According to the poverty statistics in Gasquet, males aged 65 to 74 years and females aged 65 to 74 years are the age groups that are most secure financially, with 100.0% of males and 100.0% of females in these age groups living above the poverty line.
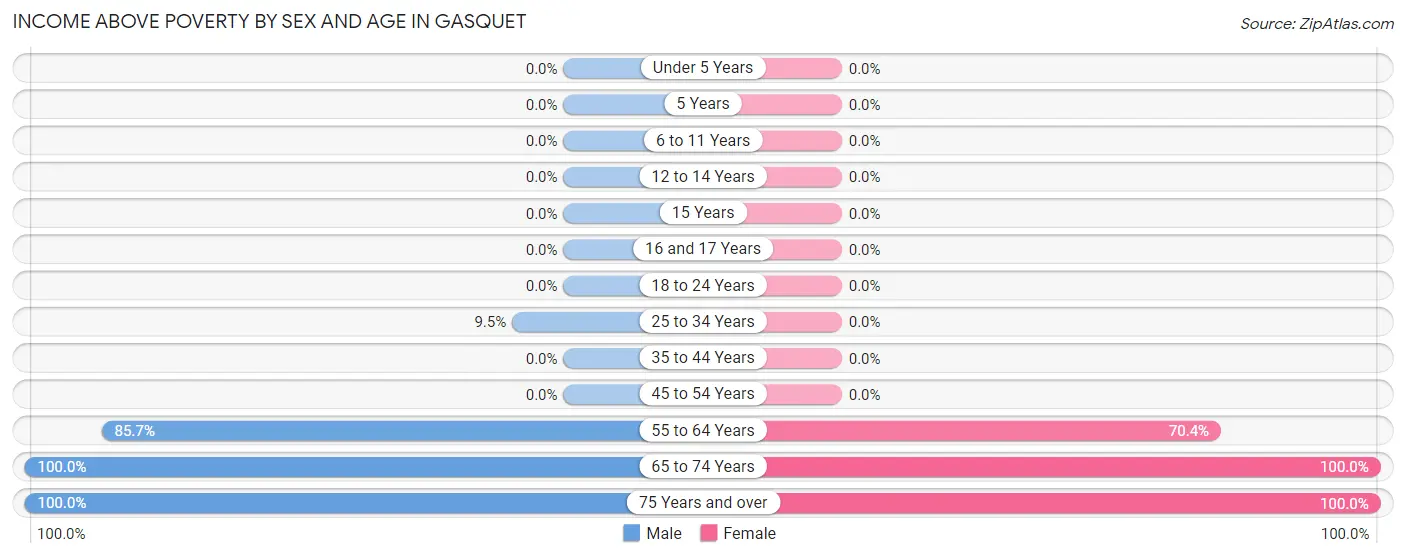
| Age Bracket | Male | Female |
| Under 5 Years | 0 (0.0%) | 0 (0.0%) |
| 5 Years | 0 (0.0%) | 0 (0.0%) |
| 6 to 11 Years | 0 (0.0%) | 0 (0.0%) |
| 12 to 14 Years | 0 (0.0%) | 0 (0.0%) |
| 15 Years | 0 (0.0%) | 0 (0.0%) |
| 16 and 17 Years | 0 (0.0%) | 0 (0.0%) |
| 18 to 24 Years | 0 (0.0%) | 0 (0.0%) |
| 25 to 34 Years | 8 (9.5%) | 0 (0.0%) |
| 35 to 44 Years | 0 (0.0%) | 0 (0.0%) |
| 45 to 54 Years | 0 (0.0%) | 0 (0.0%) |
| 55 to 64 Years | 54 (85.7%) | 38 (70.4%) |
| 65 to 74 Years | 36 (100.0%) | 38 (100.0%) |
| 75 Years and over | 27 (100.0%) | 32 (100.0%) |
| Total | 125 (53.6%) | 108 (81.2%) |
Income Below Poverty Among Married-Couple Families in Gasquet
The poverty statistics for married-couple families in Gasquet show that 11.7% or 9 of the total 77 families live below the poverty line. Families with 1 or 2 children have the highest poverty rate of 100.0%, comprising of 9 families. On the other hand, families with no children have the lowest poverty rate of 0.0%, which includes 0 families.
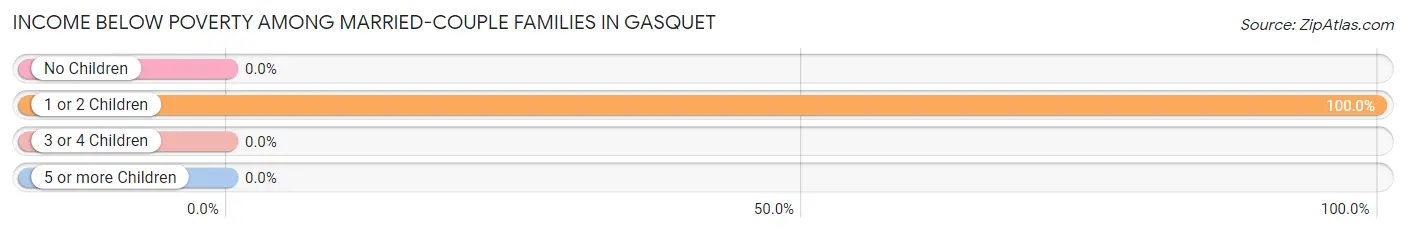
| Children | Above Poverty | Below Poverty |
| No Children | 68 (100.0%) | 0 (0.0%) |
| 1 or 2 Children | 0 (0.0%) | 9 (100.0%) |
| 3 or 4 Children | 0 (0.0%) | 0 (0.0%) |
| 5 or more Children | 0 (0.0%) | 0 (0.0%) |
| Total | 68 (88.3%) | 9 (11.7%) |
Income Below Poverty Among Single-Parent Households in Gasquet
| Children | Single Father | Single Mother |
| No Children | 0 (0.0%) | 0 (0.0%) |
| 1 or 2 Children | 0 (0.0%) | 0 (0.0%) |
| 3 or 4 Children | 0 (0.0%) | 0 (0.0%) |
| 5 or more Children | 0 (0.0%) | 0 (0.0%) |
| Total | 0 (0.0%) | 0 (0.0%) |
Income Below Poverty Among Married-Couple vs Single-Parent Households in Gasquet
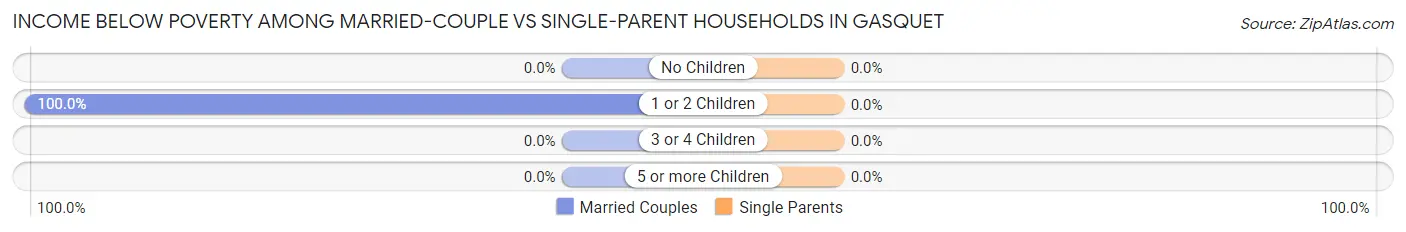
| Children | Married-Couple Families | Single-Parent Households |
| No Children | 0 (0.0%) | 0 (0.0%) |
| 1 or 2 Children | 9 (100.0%) | 0 (0.0%) |
| 3 or 4 Children | 0 (0.0%) | 0 (0.0%) |
| 5 or more Children | 0 (0.0%) | 0 (0.0%) |
| Total | 9 (11.7%) | 0 (0.0%) |
Race in Gasquet
The most populous races in Gasquet are White / Caucasian (252 | 68.9%), Two or more Races (108 | 29.5%), and Hispanic or Latino (6 | 1.6%).
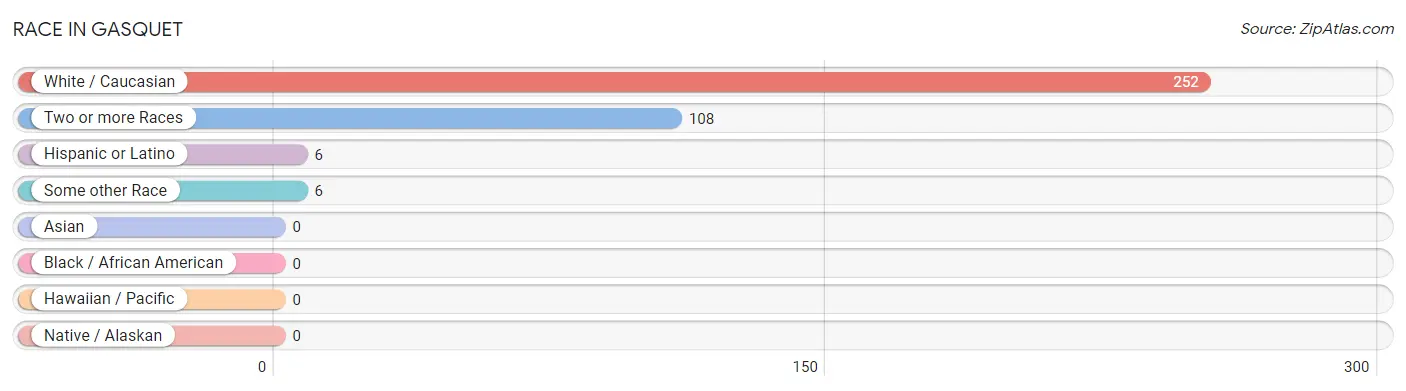
| Race | # Population | % Population |
| Asian | 0 | 0.0% |
| Black / African American | 0 | 0.0% |
| Hawaiian / Pacific | 0 | 0.0% |
| Hispanic or Latino | 6 | 1.6% |
| Native / Alaskan | 0 | 0.0% |
| White / Caucasian | 252 | 68.9% |
| Two or more Races | 108 | 29.5% |
| Some other Race | 6 | 1.6% |
| Total | 366 | 100.0% |
Ancestry in Gasquet
The most populous ancestries reported in Gasquet are African (76 | 20.8%), French (76 | 20.8%), Subsaharan African (76 | 20.8%), German (50 | 13.7%), and English (33 | 9.0%), together accounting for 85.0% of all Gasquet residents.
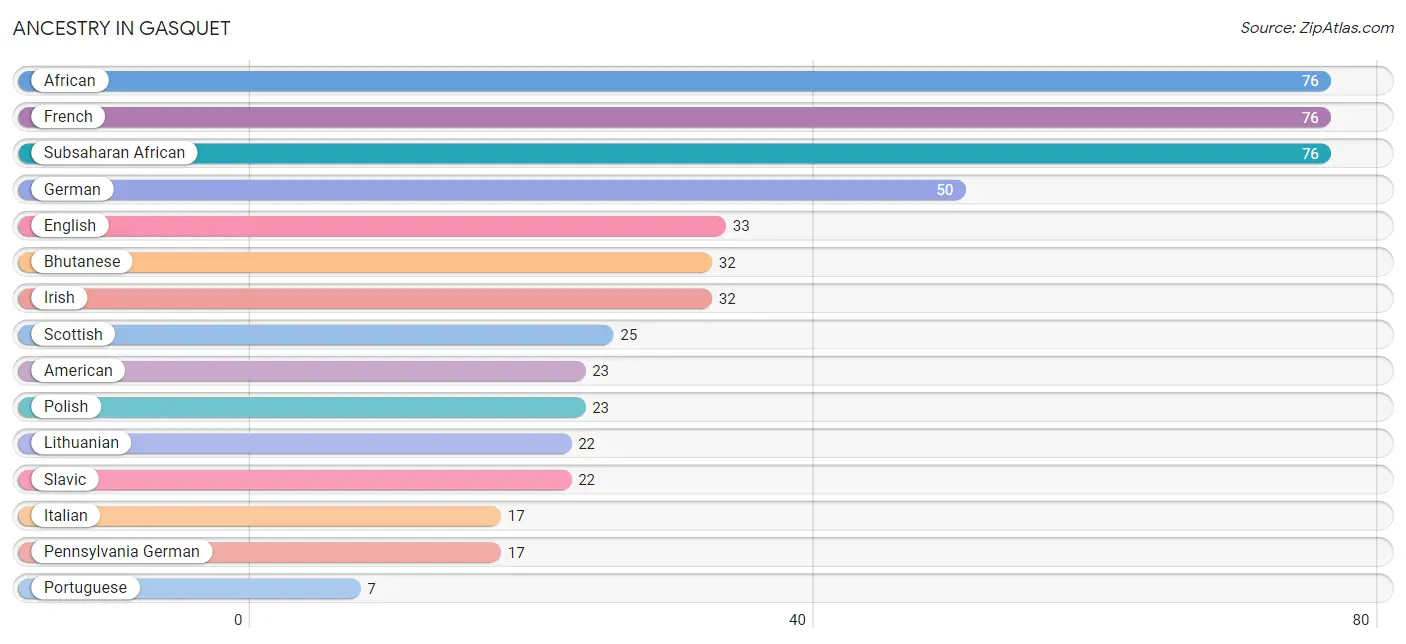
| Ancestry | # Population | % Population |
| African | 76 | 20.8% |
| American | 23 | 6.3% |
| Bhutanese | 32 | 8.7% |
| English | 33 | 9.0% |
| French | 76 | 20.8% |
| German | 50 | 13.7% |
| Irish | 32 | 8.7% |
| Italian | 17 | 4.6% |
| Lithuanian | 22 | 6.0% |
| Mexican | 6 | 1.6% |
| Pennsylvania German | 17 | 4.6% |
| Polish | 23 | 6.3% |
| Portuguese | 7 | 1.9% |
| Scottish | 25 | 6.8% |
| Slavic | 22 | 6.0% |
| Subsaharan African | 76 | 20.8% | View All 16 Rows |
Immigrants in Gasquet

| Immigration Origin | # Population | % Population | View All 0 Rows |
Sex and Age in Gasquet
Sex and Age in Gasquet
The most populous age groups in Gasquet are 30 to 34 Years (84 | 36.0%) for men and 65 to 69 Years (38 | 28.6%) for women.
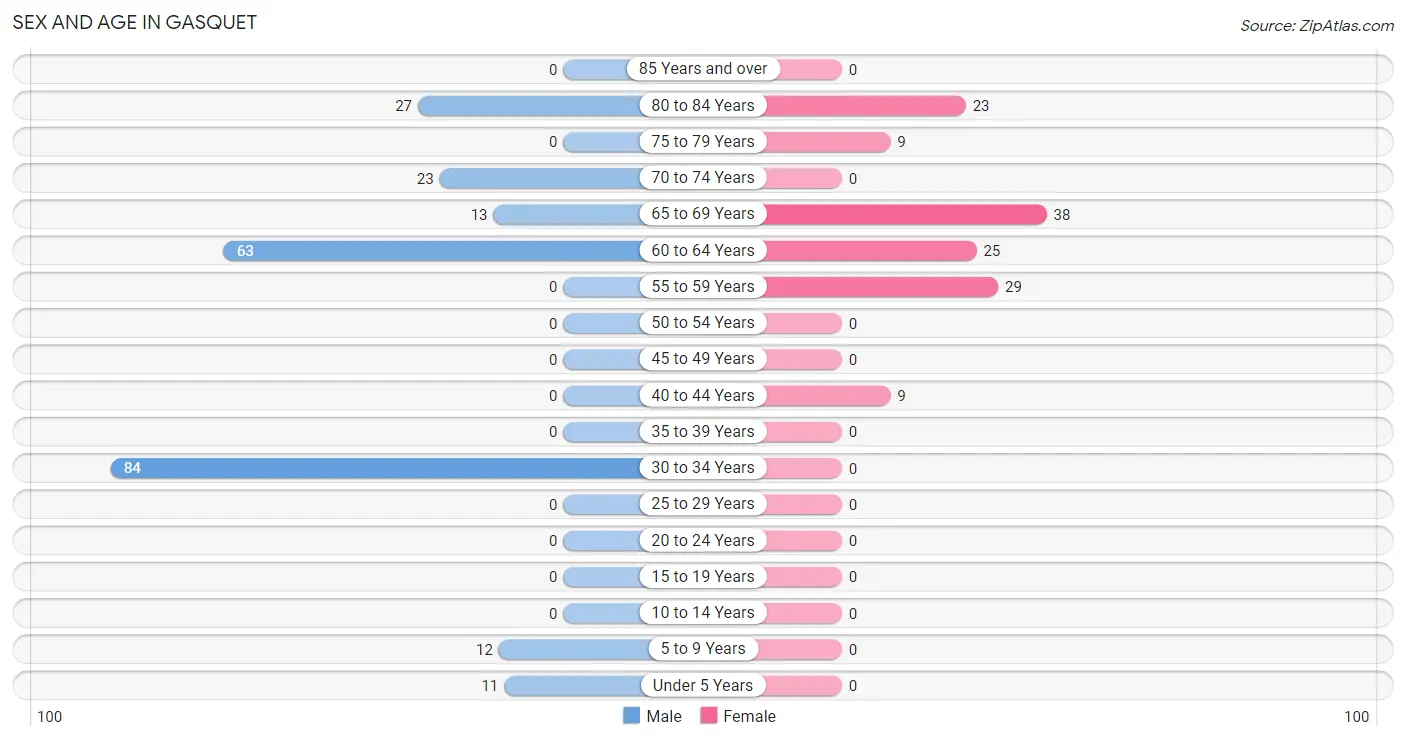
| Age Bracket | Male | Female |
| Under 5 Years | 11 (4.7%) | 0 (0.0%) |
| 5 to 9 Years | 12 (5.1%) | 0 (0.0%) |
| 10 to 14 Years | 0 (0.0%) | 0 (0.0%) |
| 15 to 19 Years | 0 (0.0%) | 0 (0.0%) |
| 20 to 24 Years | 0 (0.0%) | 0 (0.0%) |
| 25 to 29 Years | 0 (0.0%) | 0 (0.0%) |
| 30 to 34 Years | 84 (36.0%) | 0 (0.0%) |
| 35 to 39 Years | 0 (0.0%) | 0 (0.0%) |
| 40 to 44 Years | 0 (0.0%) | 9 (6.8%) |
| 45 to 49 Years | 0 (0.0%) | 0 (0.0%) |
| 50 to 54 Years | 0 (0.0%) | 0 (0.0%) |
| 55 to 59 Years | 0 (0.0%) | 29 (21.8%) |
| 60 to 64 Years | 63 (27.0%) | 25 (18.8%) |
| 65 to 69 Years | 13 (5.6%) | 38 (28.6%) |
| 70 to 74 Years | 23 (9.9%) | 0 (0.0%) |
| 75 to 79 Years | 0 (0.0%) | 9 (6.8%) |
| 80 to 84 Years | 27 (11.6%) | 23 (17.3%) |
| 85 Years and over | 0 (0.0%) | 0 (0.0%) |
| Total | 233 (100.0%) | 133 (100.0%) |
Families and Households in Gasquet
Median Family Size in Gasquet
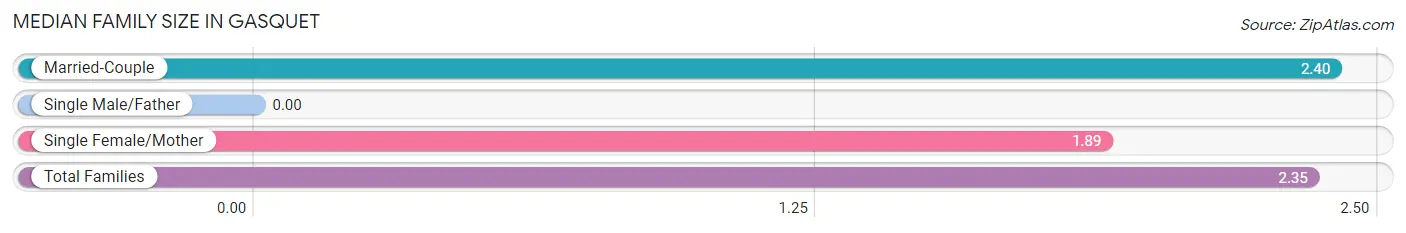
| Family Type | # Families | Family Size |
| Married-Couple | 77 (89.5%) | 2.40 |
| Single Male/Father | 0 (0.0%) | - |
| Single Female/Mother | 9 (10.5%) | 1.89 |
| Total Families | 86 (100.0%) | 2.35 |
Median Household Size in Gasquet
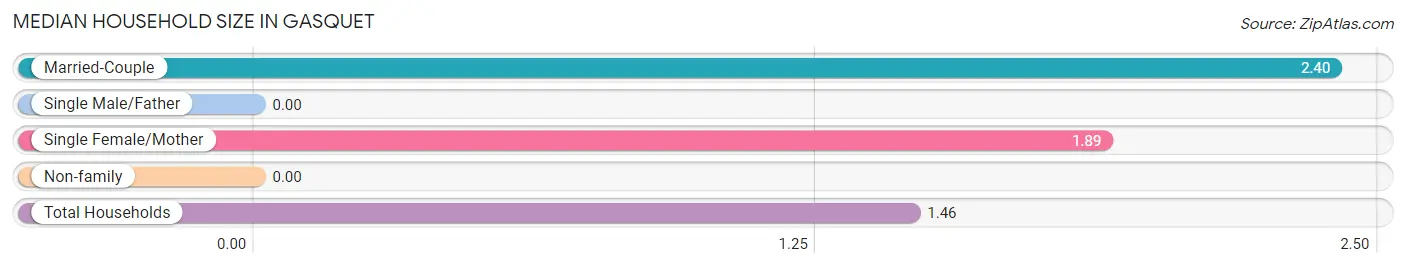
| Household Type | # Households | Household Size |
| Married-Couple | 77 (30.8%) | 2.40 |
| Single Male/Father | 0 (0.0%) | - |
| Single Female/Mother | 9 (3.6%) | 1.89 |
| Non-family | 164 (65.6%) | - |
| Total Households | 250 (100.0%) | 1.46 |
Household Size by Marriage Status in Gasquet
Out of a total of 250 households in Gasquet, 86 (34.4%) are family households, while 164 (65.6%) are nonfamily households. The most numerous type of family households are 2-person households, comprising 77, and the most common type of nonfamily households are 1-person households, comprising 164.
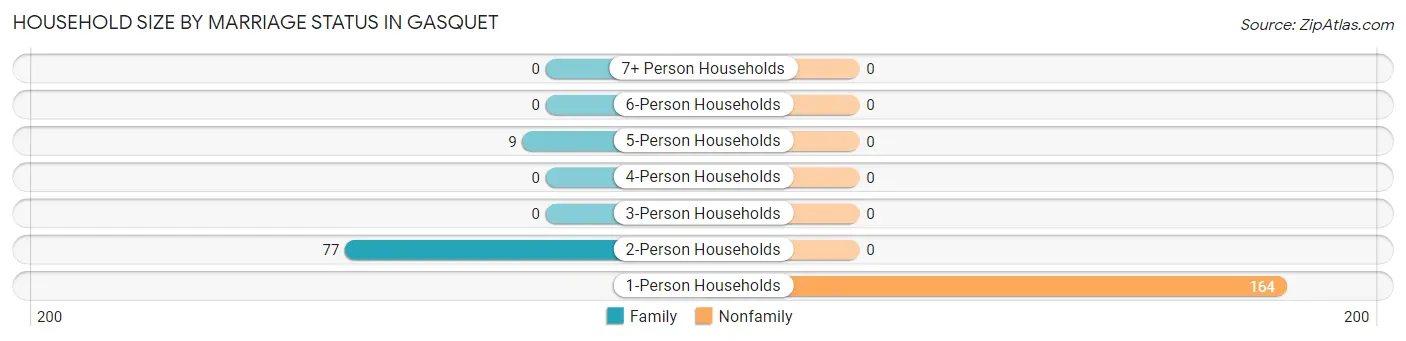
| Household Size | Family Households | Nonfamily Households |
| 1-Person Households | - | 164 (65.6%) |
| 2-Person Households | 77 (30.8%) | 0 (0.0%) |
| 3-Person Households | 0 (0.0%) | 0 (0.0%) |
| 4-Person Households | 0 (0.0%) | 0 (0.0%) |
| 5-Person Households | 9 (3.6%) | 0 (0.0%) |
| 6-Person Households | 0 (0.0%) | 0 (0.0%) |
| 7+ Person Households | 0 (0.0%) | 0 (0.0%) |
| Total | 86 (34.4%) | 164 (65.6%) |
Female Fertility in Gasquet
Fertility by Age in Gasquet
Average fertility rate in Gasquet is 1,000.0 births per 1,000 women. Women in the age bracket of 35 to 50 years have the highest fertility rate with 1,000.0 births per 1,000 women. Women in the age bracket of 35 to 50 years acount for 100.0% of all women with births.
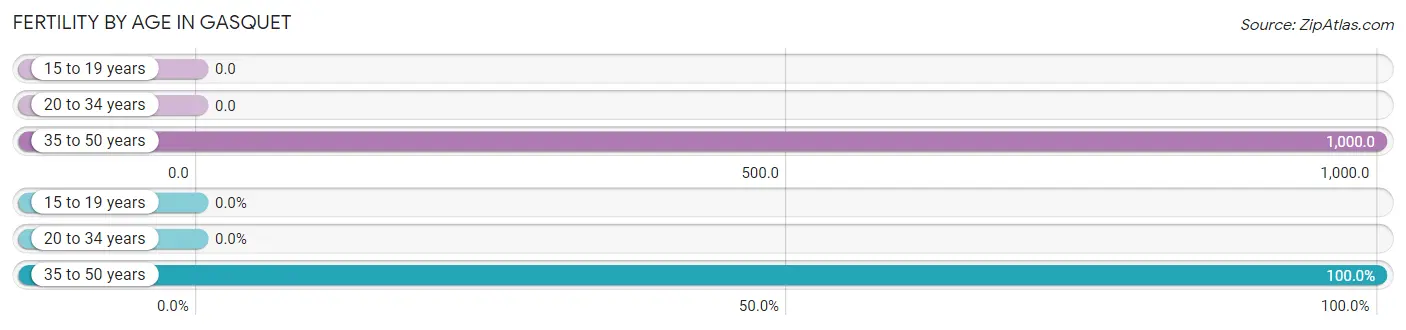
| Age Bracket | Women with Births | Births / 1,000 Women |
| 15 to 19 years | 0 (0.0%) | 0.0 |
| 20 to 34 years | 0 (0.0%) | 0.0 |
| 35 to 50 years | 9 (100.0%) | 1,000.0 |
| Total | 9 (100.0%) | 1,000.0 |
Fertility by Age by Marriage Status in Gasquet
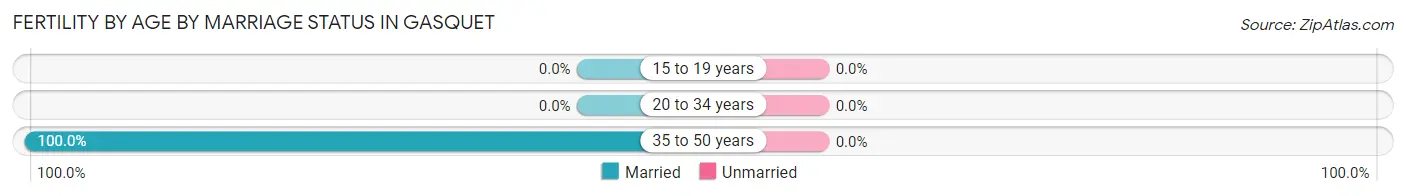
| Age Bracket | Married | Unmarried |
| 15 to 19 years | 0 (0.0%) | 0 (0.0%) |
| 20 to 34 years | 0 (0.0%) | 0 (0.0%) |
| 35 to 50 years | 9 (100.0%) | 0 (0.0%) |
| Total | 9 (100.0%) | 0 (0.0%) |
Fertility by Education in Gasquet
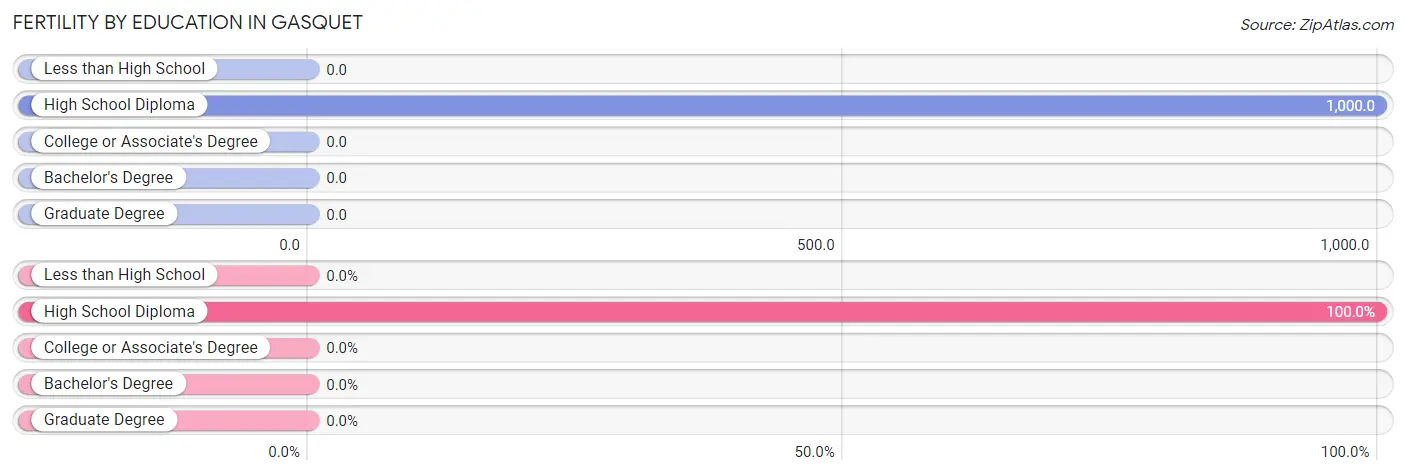
| Educational Attainment | Women with Births | Births / 1,000 Women |
| Less than High School | 0 (0.0%) | 0.0 |
| High School Diploma | 9 (100.0%) | 1,000.0 |
| College or Associate's Degree | 0 (0.0%) | 0.0 |
| Bachelor's Degree | 0 (0.0%) | 0.0 |
| Graduate Degree | 0 (0.0%) | 0.0 |
| Total | 9 (100.0%) | 1,000.0 |
Fertility by Education by Marriage Status in Gasquet
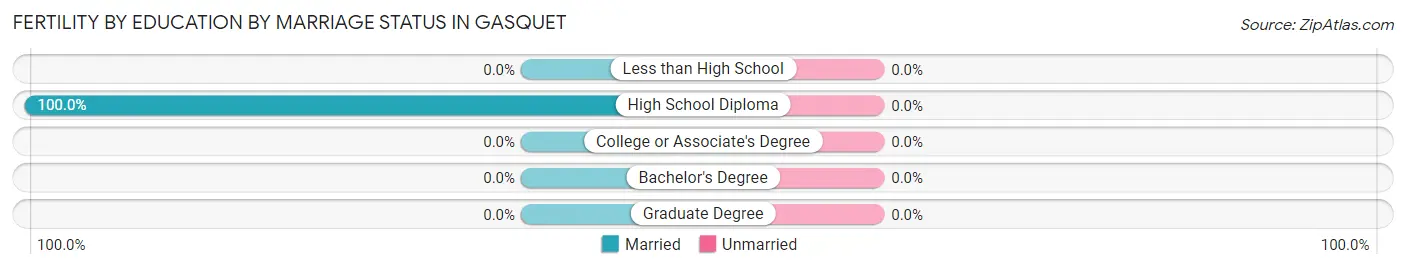
| Educational Attainment | Married | Unmarried |
| Less than High School | 0 (0.0%) | 0 (0.0%) |
| High School Diploma | 9 (100.0%) | 0 (0.0%) |
| College or Associate's Degree | 0 (0.0%) | 0 (0.0%) |
| Bachelor's Degree | 0 (0.0%) | 0 (0.0%) |
| Graduate Degree | 0 (0.0%) | 0 (0.0%) |
| Total | 9 (100.0%) | 0 (0.0%) |
Employment Characteristics in Gasquet
Employment by Class of Employer in Gasquet
Among the 152 employed individuals in Gasquet, self-employed (incorporated) (99 | 65.1%), private company employees (23 | 15.1%), and unpaid family workers (22 | 14.5%) make up the most common classes of employment.
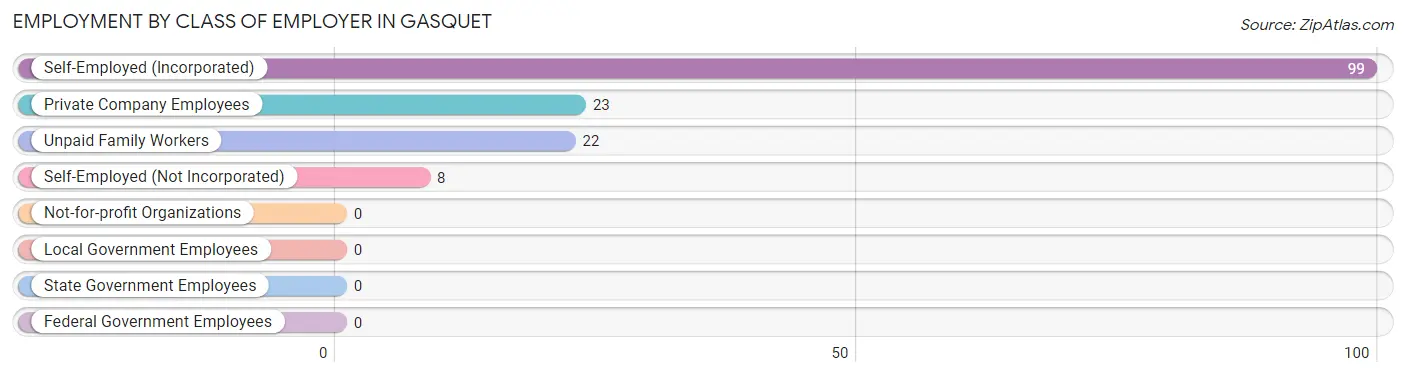
| Employer Class | # Employees | % Employees |
| Private Company Employees | 23 | 15.1% |
| Self-Employed (Incorporated) | 99 | 65.1% |
| Self-Employed (Not Incorporated) | 8 | 5.3% |
| Not-for-profit Organizations | 0 | 0.0% |
| Local Government Employees | 0 | 0.0% |
| State Government Employees | 0 | 0.0% |
| Federal Government Employees | 0 | 0.0% |
| Unpaid Family Workers | 22 | 14.5% |
| Total | 152 | 100.0% |
Employment Status by Age in Gasquet
According to the labor force statistics for Gasquet, out of the total population over 16 years of age (343), 46.4% or 159 individuals are in the labor force, with 4.4% or 7 of them unemployed. The age group with the highest labor force participation rate is 30 to 34 years, with 100.0% or 84 individuals in the labor force. Within the labor force, the 55 to 59 years age range has the highest percentage of unemployed individuals, with 24.1% or 7 of them being unemployed.
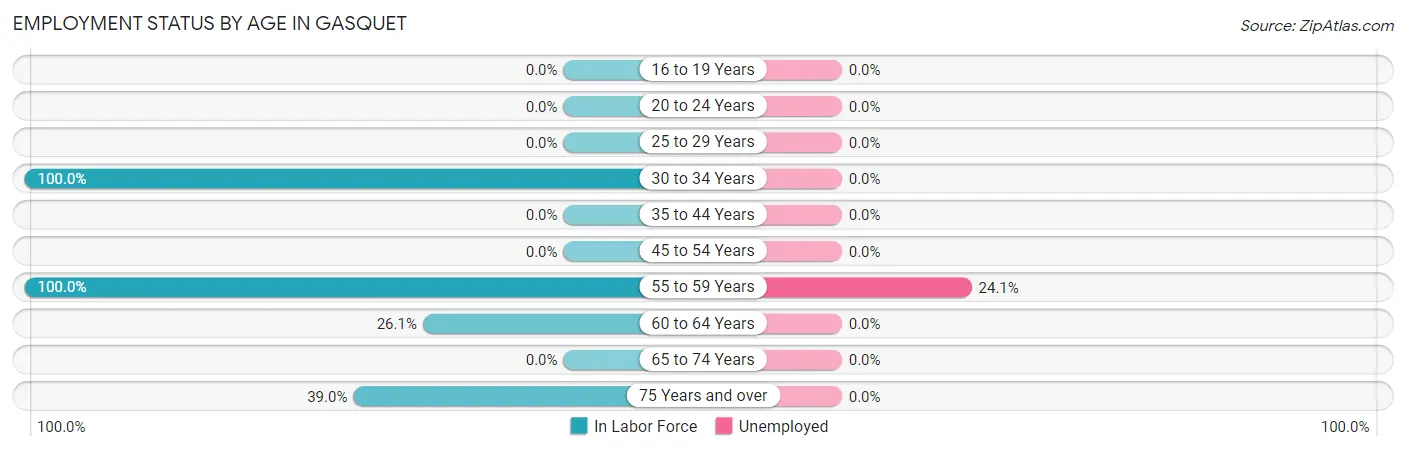
| Age Bracket | In Labor Force | Unemployed |
| 16 to 19 Years | 0 (0.0%) | 0 (0.0%) |
| 20 to 24 Years | 0 (0.0%) | 0 (0.0%) |
| 25 to 29 Years | 0 (0.0%) | 0 (0.0%) |
| 30 to 34 Years | 84 (100.0%) | 0 (0.0%) |
| 35 to 44 Years | 0 (0.0%) | 0 (0.0%) |
| 45 to 54 Years | 0 (0.0%) | 0 (0.0%) |
| 55 to 59 Years | 29 (100.0%) | 7 (24.1%) |
| 60 to 64 Years | 23 (26.1%) | 0 (0.0%) |
| 65 to 74 Years | 0 (0.0%) | 0 (0.0%) |
| 75 Years and over | 23 (39.0%) | 0 (0.0%) |
| Total | 159 (46.4%) | 7 (4.4%) |
Employment Status by Educational Attainment in Gasquet
According to labor force statistics for Gasquet, 64.8% of individuals (136) out of the total population between 25 and 64 years of age (210) are in the labor force, with 5.1% or 7 of them being unemployed. The group with the highest labor force participation rate are those with the educational attainment of less than high school, with 100.0% or 8 individuals in the labor force. Within the labor force, individuals with bachelor's degree or higher education have the highest percentage of unemployment, with 24.1% or 7 of them being unemployed.
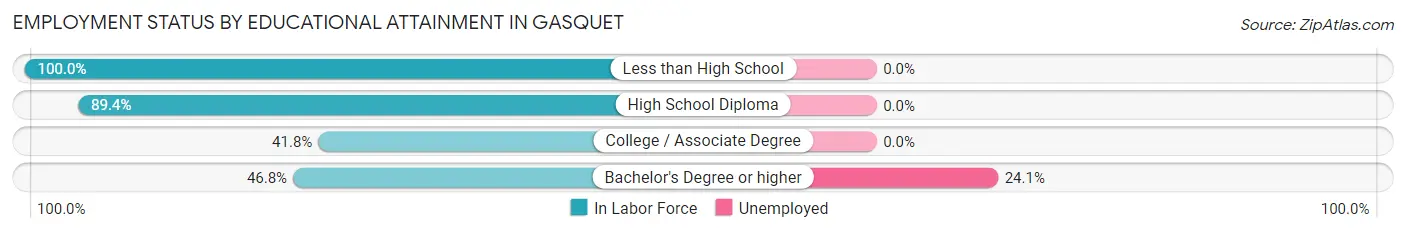
| Educational Attainment | In Labor Force | Unemployed |
| Less than High School | 8 (100.0%) | 0 (0.0%) |
| High School Diploma | 76 (89.4%) | 0 (0.0%) |
| College / Associate Degree | 23 (41.8%) | 0 (0.0%) |
| Bachelor's Degree or higher | 29 (46.8%) | 15 (24.1%) |
| Total | 136 (64.8%) | 11 (5.1%) |
Employment Occupations by Sex in Gasquet
Management, Business, Science and Arts Occupations
Management, Business, Science and Arts Occupations by Sex
| Occupation | Male | Female |
| Management | 0 (0.0%) | 0 (0.0%) |
| Business & Financial | 0 (0.0%) | 0 (0.0%) |
| Computers, Engineering & Science | 0 (0.0%) | 0 (0.0%) |
| Computers & Mathematics | 0 (0.0%) | 0 (0.0%) |
| Architecture & Engineering | 0 (0.0%) | 0 (0.0%) |
| Life, Physical & Social Science | 0 (0.0%) | 0 (0.0%) |
| Community & Social Service | 0 (0.0%) | 0 (0.0%) |
| Education, Arts & Media | 0 (0.0%) | 0 (0.0%) |
| Legal Services & Support | 0 (0.0%) | 0 (0.0%) |
| Education Instruction & Library | 0 (0.0%) | 0 (0.0%) |
| Arts, Media & Entertainment | 0 (0.0%) | 0 (0.0%) |
| Health Diagnosing & Treating | 0 (0.0%) | 0 (0.0%) |
| Health Technologists | 0 (0.0%) | 0 (0.0%) |
| Total (Category) | 0 (0.0%) | 0 (0.0%) |
| Total (Overall) | 107 (70.4%) | 45 (29.6%) |
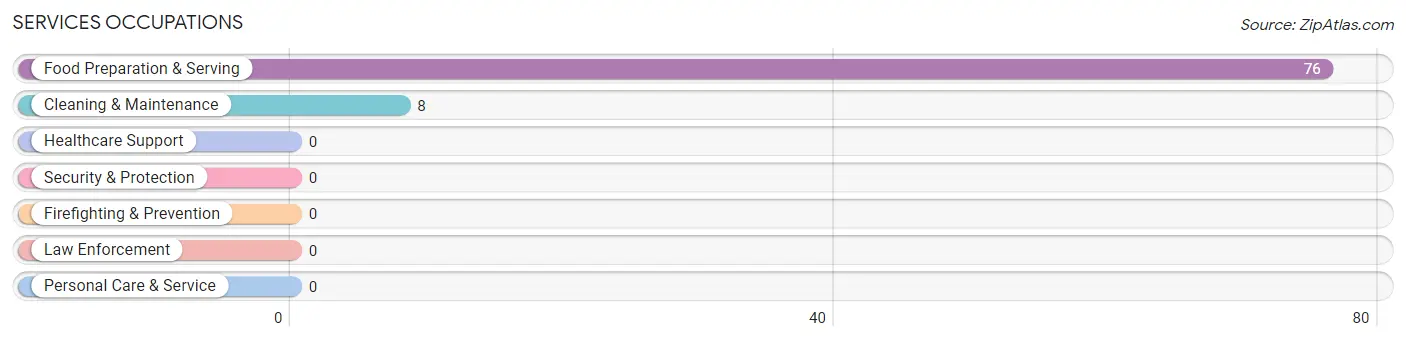
Services Occupations
The most common Services occupations in Gasquet are Food Preparation & Serving (76 | 50.0%), and Cleaning & Maintenance (8 | 5.3%).
Services Occupations by Sex
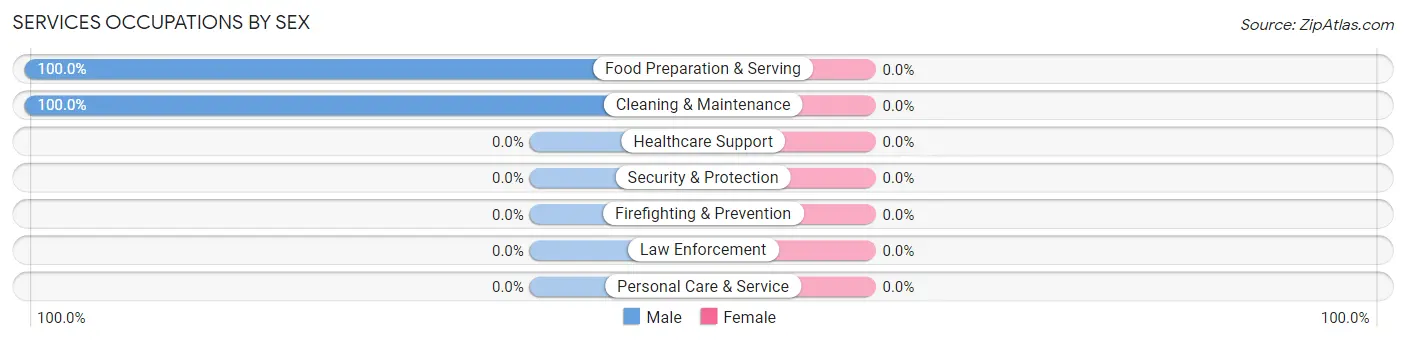
| Occupation | Male | Female |
| Healthcare Support | 0 (0.0%) | 0 (0.0%) |
| Security & Protection | 0 (0.0%) | 0 (0.0%) |
| Firefighting & Prevention | 0 (0.0%) | 0 (0.0%) |
| Law Enforcement | 0 (0.0%) | 0 (0.0%) |
| Food Preparation & Serving | 76 (100.0%) | 0 (0.0%) |
| Cleaning & Maintenance | 8 (100.0%) | 0 (0.0%) |
| Personal Care & Service | 0 (0.0%) | 0 (0.0%) |
| Total (Category) | 84 (100.0%) | 0 (0.0%) |
| Total (Overall) | 107 (70.4%) | 45 (29.6%) |
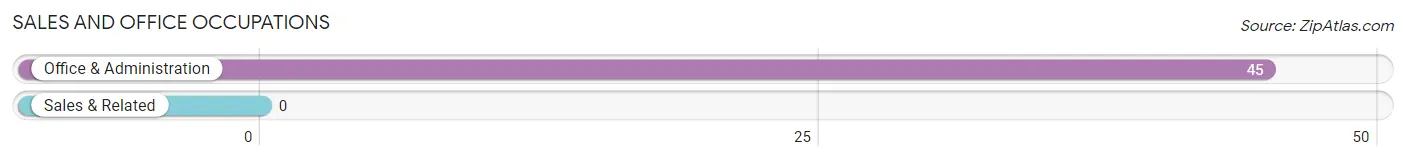
Sales and Office Occupations
The most common Sales and Office occupations in Gasquet are , and Office & Administration (45 | 29.6%).
Sales and Office Occupations by Sex

| Occupation | Male | Female |
| Sales & Related | 0 (0.0%) | 0 (0.0%) |
| Office & Administration | 0 (0.0%) | 45 (100.0%) |
| Total (Category) | 0 (0.0%) | 45 (100.0%) |
| Total (Overall) | 107 (70.4%) | 45 (29.6%) |
Natural Resources, Construction and Maintenance Occupations
Natural Resources, Construction and Maintenance Occupations by Sex
| Occupation | Male | Female |
| Farming, Fishing & Forestry | 0 (0.0%) | 0 (0.0%) |
| Construction & Extraction | 0 (0.0%) | 0 (0.0%) |
| Installation, Maintenance & Repair | 0 (0.0%) | 0 (0.0%) |
| Total (Category) | 0 (0.0%) | 0 (0.0%) |
| Total (Overall) | 107 (70.4%) | 45 (29.6%) |
Production, Transportation and Moving Occupations
The most common Production, Transportation and Moving occupations in Gasquet are , and Transportation (23 | 15.1%).
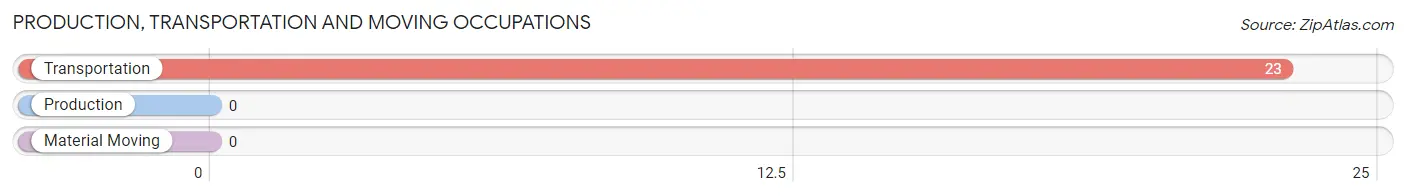
Production, Transportation and Moving Occupations by Sex
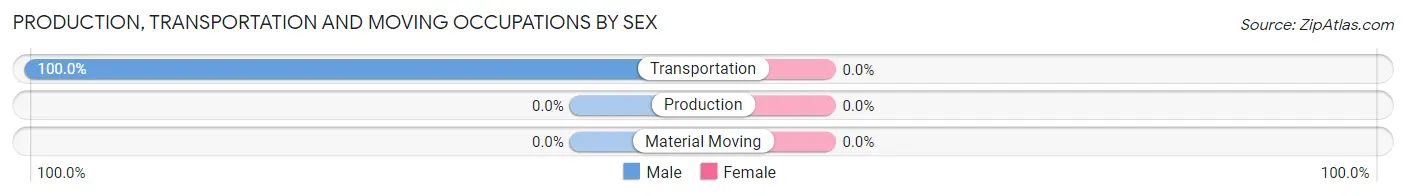
| Occupation | Male | Female |
| Production | 0 (0.0%) | 0 (0.0%) |
| Transportation | 23 (100.0%) | 0 (0.0%) |
| Material Moving | 0 (0.0%) | 0 (0.0%) |
| Total (Category) | 23 (100.0%) | 0 (0.0%) |
| Total (Overall) | 107 (70.4%) | 45 (29.6%) |
Employment Industries by Sex in Gasquet
Employment Industries in Gasquet
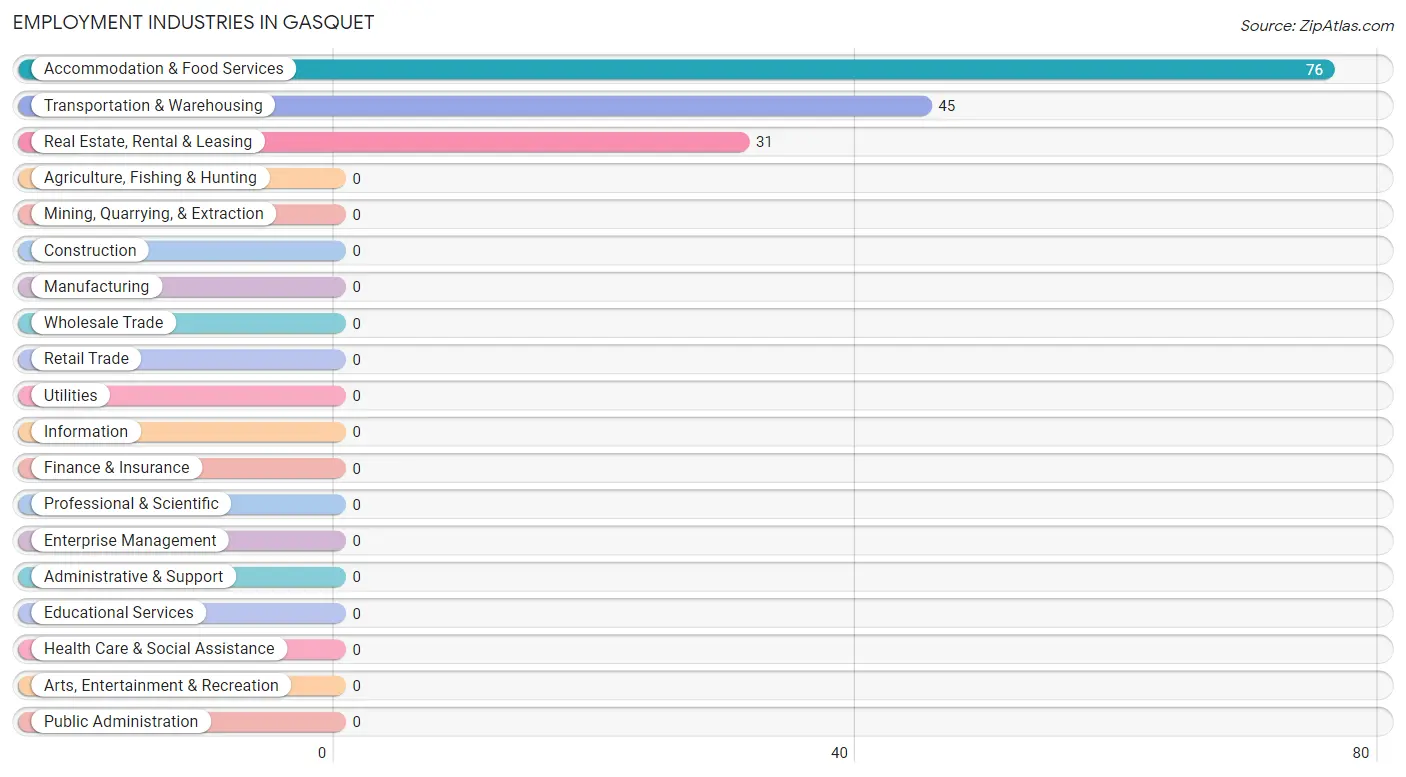
The major employment industries in Gasquet include Accommodation & Food Services (76 | 50.0%), Transportation & Warehousing (45 | 29.6%), and Real Estate, Rental & Leasing (31 | 20.4%).
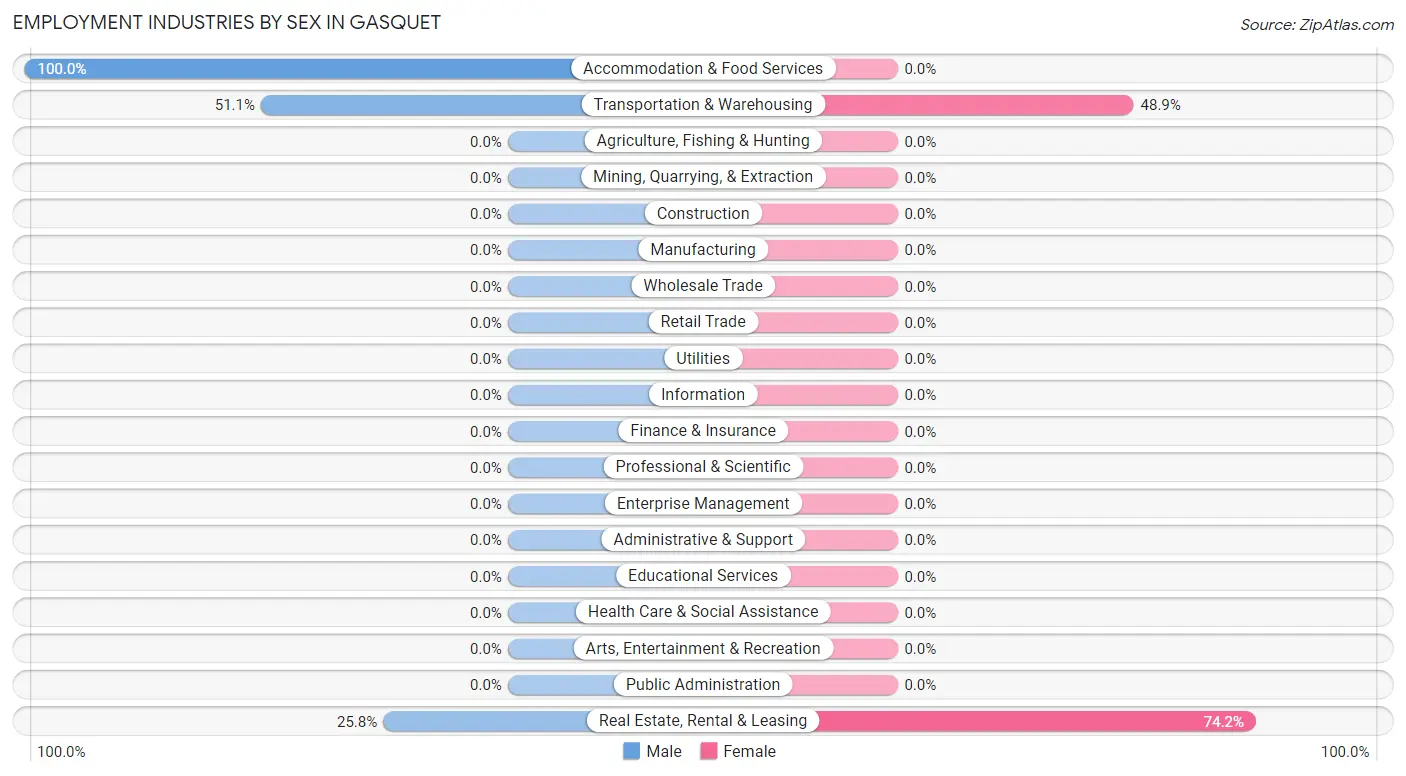
Employment Industries by Sex in Gasquet
The Gasquet industries that see more men than women are Accommodation & Food Services (100.0%), Transportation & Warehousing (51.1%), and Real Estate, Rental & Leasing (25.8%), whereas the industries that tend to have a higher number of women are Real Estate, Rental & Leasing (74.2%), and Transportation & Warehousing (48.9%).
| Industry | Male | Female |
| Agriculture, Fishing & Hunting | 0 (0.0%) | 0 (0.0%) |
| Mining, Quarrying, & Extraction | 0 (0.0%) | 0 (0.0%) |
| Construction | 0 (0.0%) | 0 (0.0%) |
| Manufacturing | 0 (0.0%) | 0 (0.0%) |
| Wholesale Trade | 0 (0.0%) | 0 (0.0%) |
| Retail Trade | 0 (0.0%) | 0 (0.0%) |
| Transportation & Warehousing | 23 (51.1%) | 22 (48.9%) |
| Utilities | 0 (0.0%) | 0 (0.0%) |
| Information | 0 (0.0%) | 0 (0.0%) |
| Finance & Insurance | 0 (0.0%) | 0 (0.0%) |
| Real Estate, Rental & Leasing | 8 (25.8%) | 23 (74.2%) |
| Professional & Scientific | 0 (0.0%) | 0 (0.0%) |
| Enterprise Management | 0 (0.0%) | 0 (0.0%) |
| Administrative & Support | 0 (0.0%) | 0 (0.0%) |
| Educational Services | 0 (0.0%) | 0 (0.0%) |
| Health Care & Social Assistance | 0 (0.0%) | 0 (0.0%) |
| Arts, Entertainment & Recreation | 0 (0.0%) | 0 (0.0%) |
| Accommodation & Food Services | 76 (100.0%) | 0 (0.0%) |
| Public Administration | 0 (0.0%) | 0 (0.0%) |
| Total | 107 (70.4%) | 45 (29.6%) |
Education in Gasquet
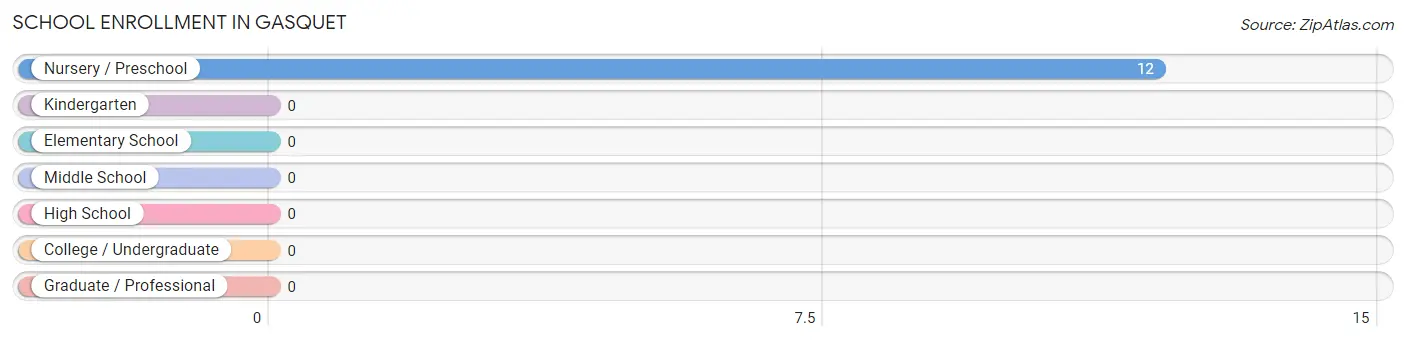
School Enrollment in Gasquet
| School Level | # Students | % Students |
| Nursery / Preschool | 12 | 100.0% |
| Kindergarten | 0 | 0.0% |
| Elementary School | 0 | 0.0% |
| Middle School | 0 | 0.0% |
| High School | 0 | 0.0% |
| College / Undergraduate | 0 | 0.0% |
| Graduate / Professional | 0 | 0.0% |
| Total | 12 | 100.0% |
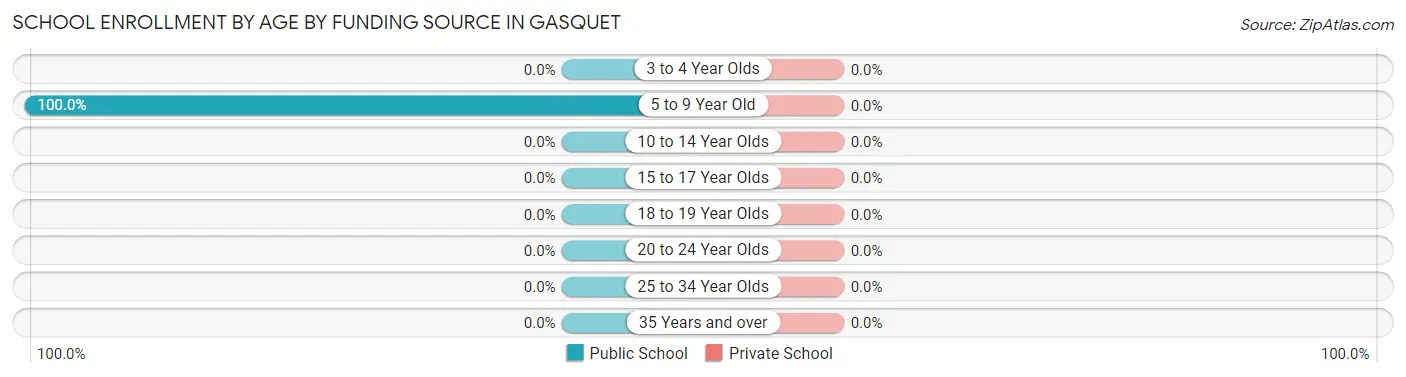
School Enrollment by Age by Funding Source in Gasquet
| Age Bracket | Public School | Private School |
| 3 to 4 Year Olds | 0 (0.0%) | 0 (0.0%) |
| 5 to 9 Year Old | 12 (100.0%) | 0 (0.0%) |
| 10 to 14 Year Olds | 0 (0.0%) | 0 (0.0%) |
| 15 to 17 Year Olds | 0 (0.0%) | 0 (0.0%) |
| 18 to 19 Year Olds | 0 (0.0%) | 0 (0.0%) |
| 20 to 24 Year Olds | 0 (0.0%) | 0 (0.0%) |
| 25 to 34 Year Olds | 0 (0.0%) | 0 (0.0%) |
| 35 Years and over | 0 (0.0%) | 0 (0.0%) |
| Total | 12 (100.0%) | 0 (0.0%) |
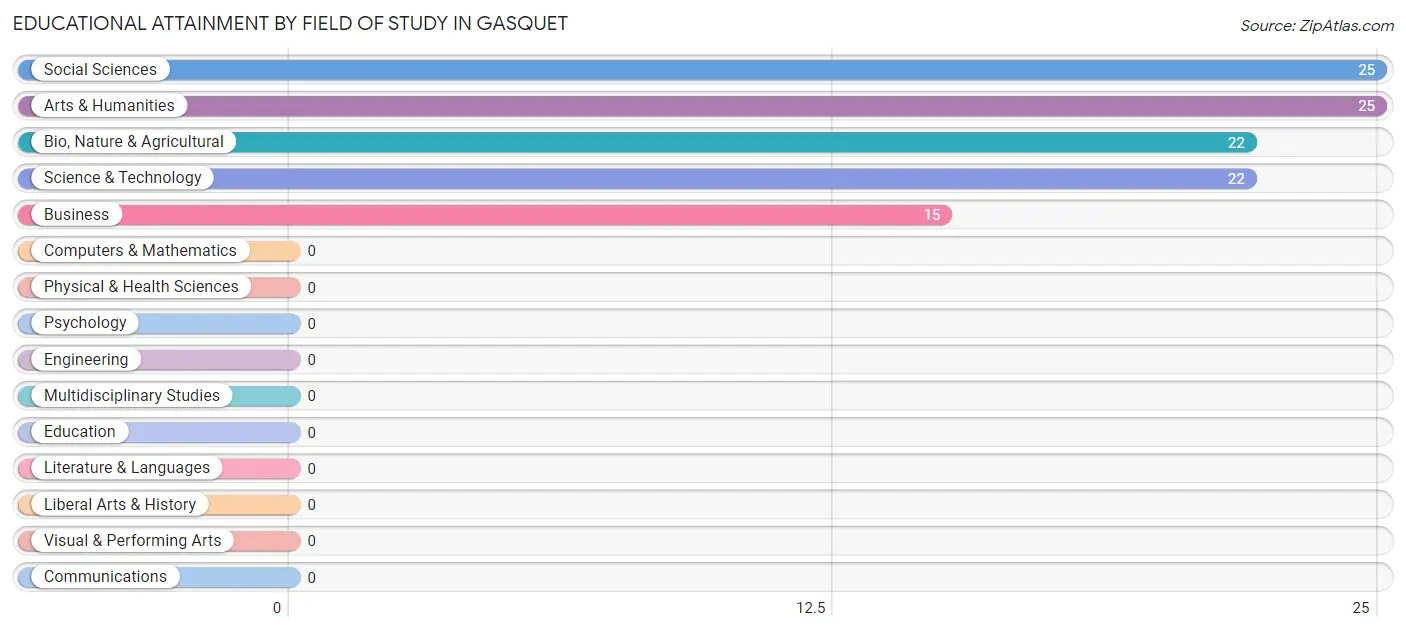
Educational Attainment by Field of Study in Gasquet
Social sciences (25 | 22.9%), arts & humanities (25 | 22.9%), bio, nature & agricultural (22 | 20.2%), science & technology (22 | 20.2%), and business (15 | 13.8%) are the most common fields of study among 109 individuals in Gasquet who have obtained a bachelor's degree or higher.
| Field of Study | # Graduates | % Graduates |
| Computers & Mathematics | 0 | 0.0% |
| Bio, Nature & Agricultural | 22 | 20.2% |
| Physical & Health Sciences | 0 | 0.0% |
| Psychology | 0 | 0.0% |
| Social Sciences | 25 | 22.9% |
| Engineering | 0 | 0.0% |
| Multidisciplinary Studies | 0 | 0.0% |
| Science & Technology | 22 | 20.2% |
| Business | 15 | 13.8% |
| Education | 0 | 0.0% |
| Literature & Languages | 0 | 0.0% |
| Liberal Arts & History | 0 | 0.0% |
| Visual & Performing Arts | 0 | 0.0% |
| Communications | 0 | 0.0% |
| Arts & Humanities | 25 | 22.9% |
| Total | 109 | 100.0% |
Transportation & Commute in Gasquet
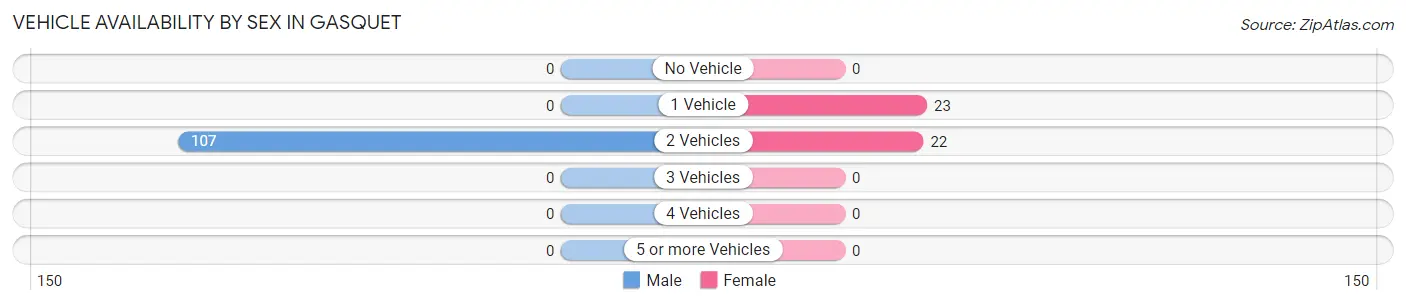
Vehicle Availability by Sex in Gasquet
The most prevalent vehicle ownership categories in Gasquet are males with 2 vehicles (107, accounting for 100.0%) and females with 2 vehicles (22, making up 237.8%).
| Vehicles Available | Male | Female |
| No Vehicle | 0 (0.0%) | 0 (0.0%) |
| 1 Vehicle | 0 (0.0%) | 23 (51.1%) |
| 2 Vehicles | 107 (100.0%) | 22 (48.9%) |
| 3 Vehicles | 0 (0.0%) | 0 (0.0%) |
| 4 Vehicles | 0 (0.0%) | 0 (0.0%) |
| 5 or more Vehicles | 0 (0.0%) | 0 (0.0%) |
| Total | 107 (100.0%) | 45 (100.0%) |
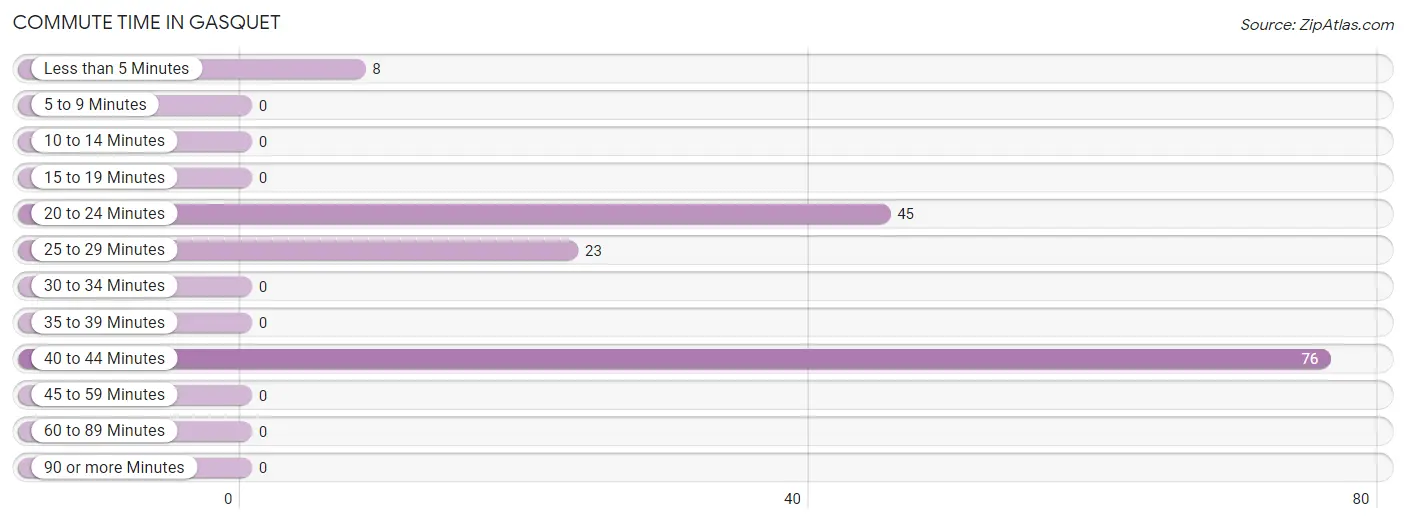
Commute Time in Gasquet
The most frequently occuring commute durations in Gasquet are 40 to 44 minutes (76 commuters, 50.0%), 20 to 24 minutes (45 commuters, 29.6%), and 25 to 29 minutes (23 commuters, 15.1%).
| Commute Time | # Commuters | % Commuters |
| Less than 5 Minutes | 8 | 5.3% |
| 5 to 9 Minutes | 0 | 0.0% |
| 10 to 14 Minutes | 0 | 0.0% |
| 15 to 19 Minutes | 0 | 0.0% |
| 20 to 24 Minutes | 45 | 29.6% |
| 25 to 29 Minutes | 23 | 15.1% |
| 30 to 34 Minutes | 0 | 0.0% |
| 35 to 39 Minutes | 0 | 0.0% |
| 40 to 44 Minutes | 76 | 50.0% |
| 45 to 59 Minutes | 0 | 0.0% |
| 60 to 89 Minutes | 0 | 0.0% |
| 90 or more Minutes | 0 | 0.0% |
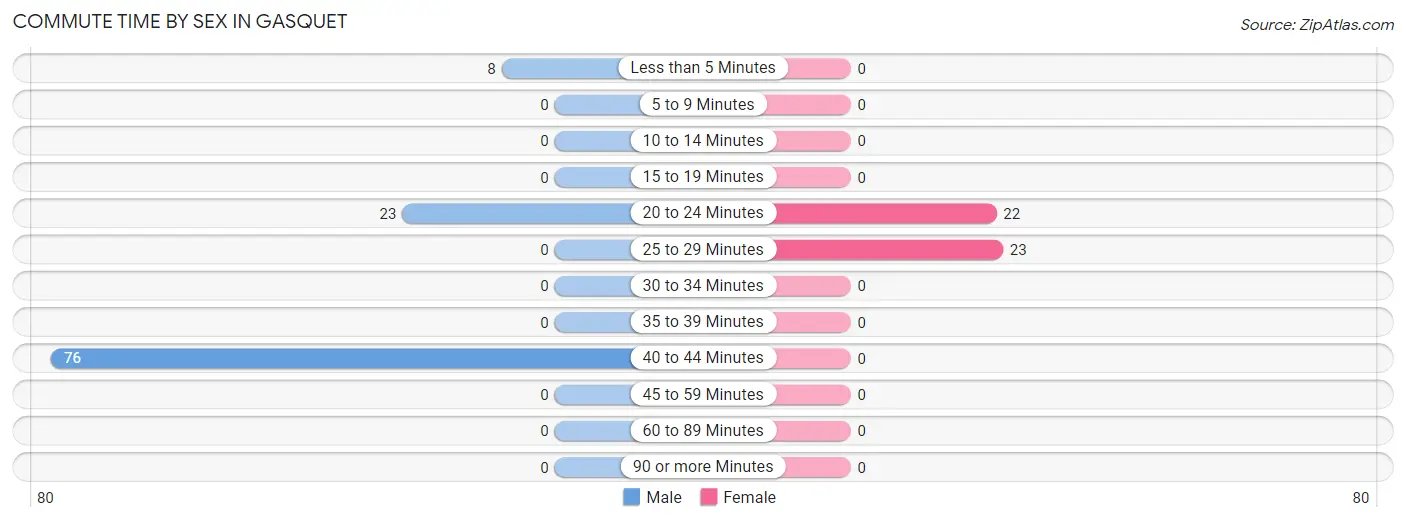
Commute Time by Sex in Gasquet
The most common commute times in Gasquet are 40 to 44 minutes (76 commuters, 71.0%) for males and 25 to 29 minutes (23 commuters, 51.1%) for females.
| Commute Time | Male | Female |
| Less than 5 Minutes | 8 (7.5%) | 0 (0.0%) |
| 5 to 9 Minutes | 0 (0.0%) | 0 (0.0%) |
| 10 to 14 Minutes | 0 (0.0%) | 0 (0.0%) |
| 15 to 19 Minutes | 0 (0.0%) | 0 (0.0%) |
| 20 to 24 Minutes | 23 (21.5%) | 22 (48.9%) |
| 25 to 29 Minutes | 0 (0.0%) | 23 (51.1%) |
| 30 to 34 Minutes | 0 (0.0%) | 0 (0.0%) |
| 35 to 39 Minutes | 0 (0.0%) | 0 (0.0%) |
| 40 to 44 Minutes | 76 (71.0%) | 0 (0.0%) |
| 45 to 59 Minutes | 0 (0.0%) | 0 (0.0%) |
| 60 to 89 Minutes | 0 (0.0%) | 0 (0.0%) |
| 90 or more Minutes | 0 (0.0%) | 0 (0.0%) |
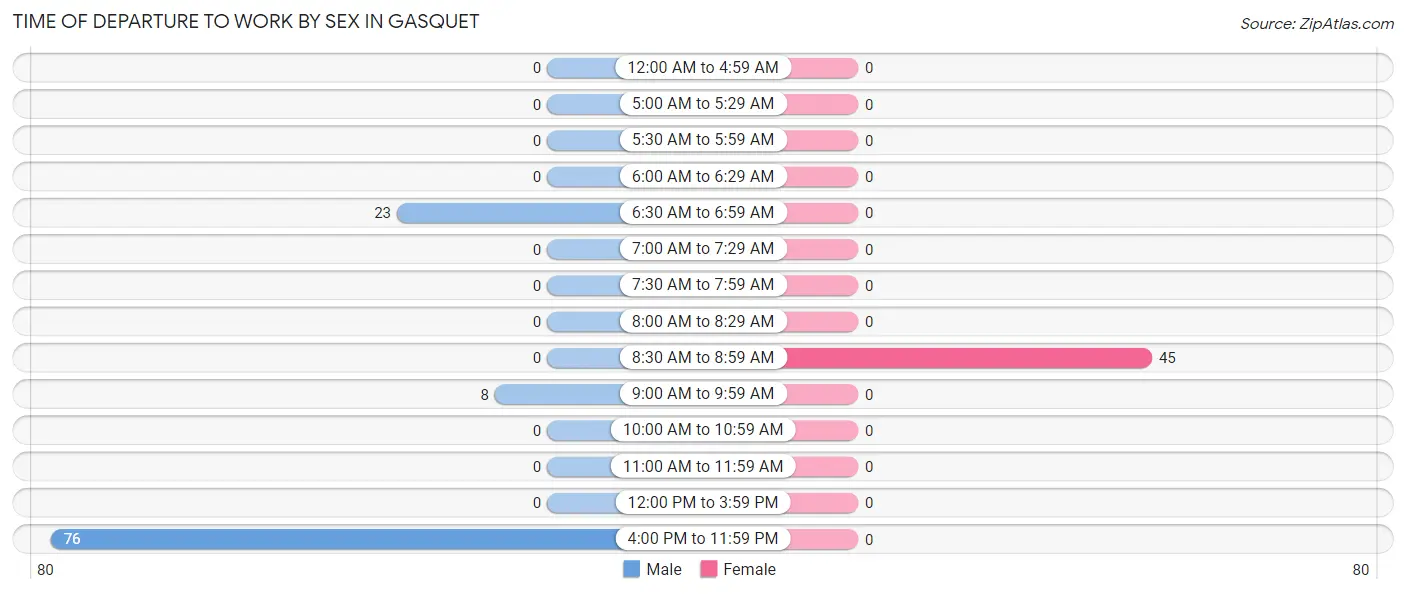
Time of Departure to Work by Sex in Gasquet
The most frequent times of departure to work in Gasquet are 4:00 PM to 11:59 PM (76, 71.0%) for males and 8:30 AM to 8:59 AM (45, 100.0%) for females.
| Time of Departure | Male | Female |
| 12:00 AM to 4:59 AM | 0 (0.0%) | 0 (0.0%) |
| 5:00 AM to 5:29 AM | 0 (0.0%) | 0 (0.0%) |
| 5:30 AM to 5:59 AM | 0 (0.0%) | 0 (0.0%) |
| 6:00 AM to 6:29 AM | 0 (0.0%) | 0 (0.0%) |
| 6:30 AM to 6:59 AM | 23 (21.5%) | 0 (0.0%) |
| 7:00 AM to 7:29 AM | 0 (0.0%) | 0 (0.0%) |
| 7:30 AM to 7:59 AM | 0 (0.0%) | 0 (0.0%) |
| 8:00 AM to 8:29 AM | 0 (0.0%) | 0 (0.0%) |
| 8:30 AM to 8:59 AM | 0 (0.0%) | 45 (100.0%) |
| 9:00 AM to 9:59 AM | 8 (7.5%) | 0 (0.0%) |
| 10:00 AM to 10:59 AM | 0 (0.0%) | 0 (0.0%) |
| 11:00 AM to 11:59 AM | 0 (0.0%) | 0 (0.0%) |
| 12:00 PM to 3:59 PM | 0 (0.0%) | 0 (0.0%) |
| 4:00 PM to 11:59 PM | 76 (71.0%) | 0 (0.0%) |
| Total | 107 (100.0%) | 45 (100.0%) |
Housing Occupancy in Gasquet
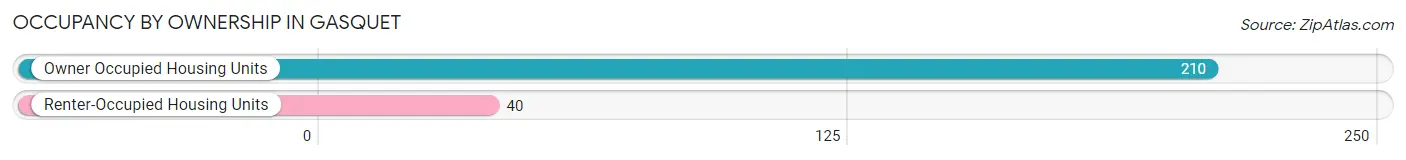
Occupancy by Ownership in Gasquet
Of the total 250 dwellings in Gasquet, owner-occupied units account for 210 (84.0%), while renter-occupied units make up 40 (16.0%).
| Occupancy | # Housing Units | % Housing Units |
| Owner Occupied Housing Units | 210 | 84.0% |
| Renter-Occupied Housing Units | 40 | 16.0% |
| Total Occupied Housing Units | 250 | 100.0% |
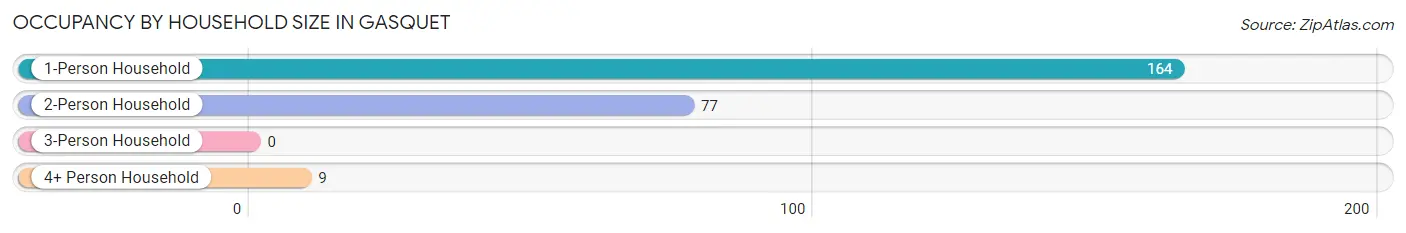
Occupancy by Household Size in Gasquet
| Household Size | # Housing Units | % Housing Units |
| 1-Person Household | 164 | 65.6% |
| 2-Person Household | 77 | 30.8% |
| 3-Person Household | 0 | 0.0% |
| 4+ Person Household | 9 | 3.6% |
| Total Housing Units | 250 | 100.0% |
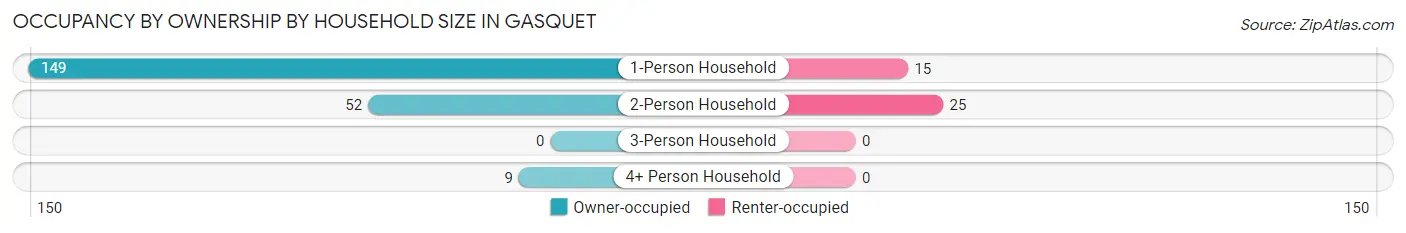
Occupancy by Ownership by Household Size in Gasquet
| Household Size | Owner-occupied | Renter-occupied |
| 1-Person Household | 149 (90.8%) | 15 (9.1%) |
| 2-Person Household | 52 (67.5%) | 25 (32.5%) |
| 3-Person Household | 0 (0.0%) | 0 (0.0%) |
| 4+ Person Household | 9 (100.0%) | 0 (0.0%) |
| Total Housing Units | 210 (84.0%) | 40 (16.0%) |
Occupancy by Educational Attainment in Gasquet
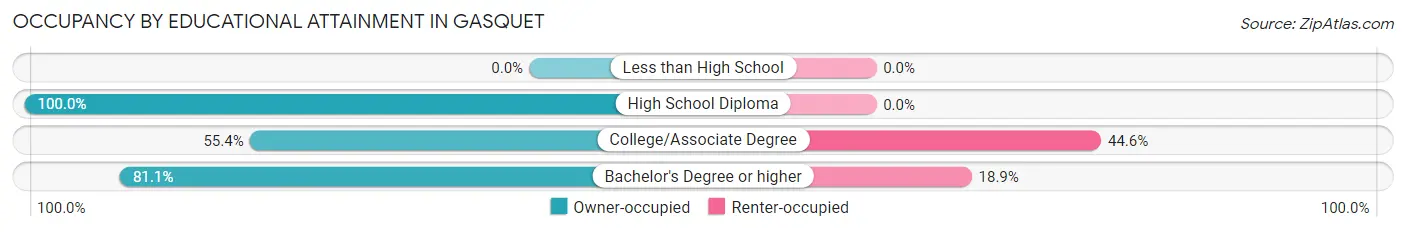
| Household Size | Owner-occupied | Renter-occupied |
| Less than High School | 0 (0.0%) | 0 (0.0%) |
| High School Diploma | 139 (100.0%) | 0 (0.0%) |
| College/Associate Degree | 41 (55.4%) | 33 (44.6%) |
| Bachelor's Degree or higher | 30 (81.1%) | 7 (18.9%) |
Occupancy by Age of Householder in Gasquet
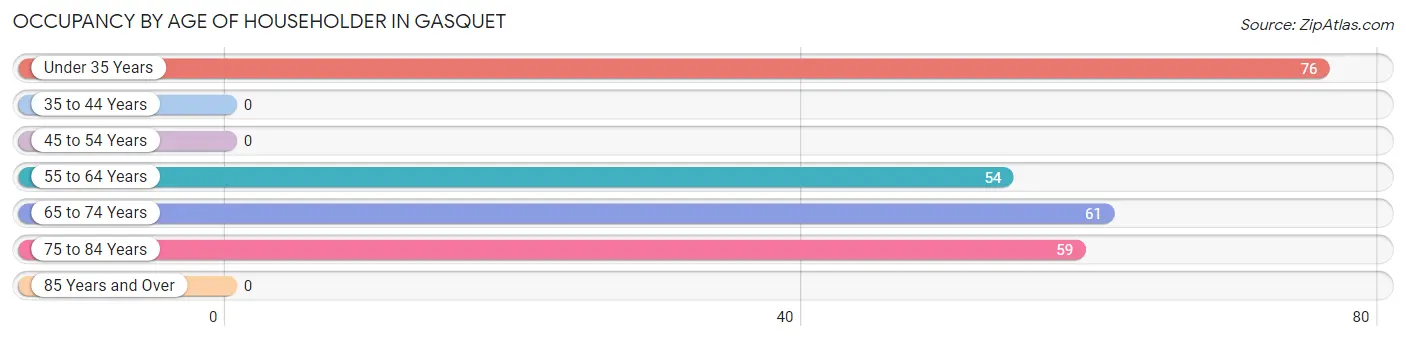
| Age Bracket | # Households | % Households |
| Under 35 Years | 76 | 30.4% |
| 35 to 44 Years | 0 | 0.0% |
| 45 to 54 Years | 0 | 0.0% |
| 55 to 64 Years | 54 | 21.6% |
| 65 to 74 Years | 61 | 24.4% |
| 75 to 84 Years | 59 | 23.6% |
| 85 Years and Over | 0 | 0.0% |
| Total | 250 | 100.0% |
Housing Finances in Gasquet
Median Income by Occupancy in Gasquet
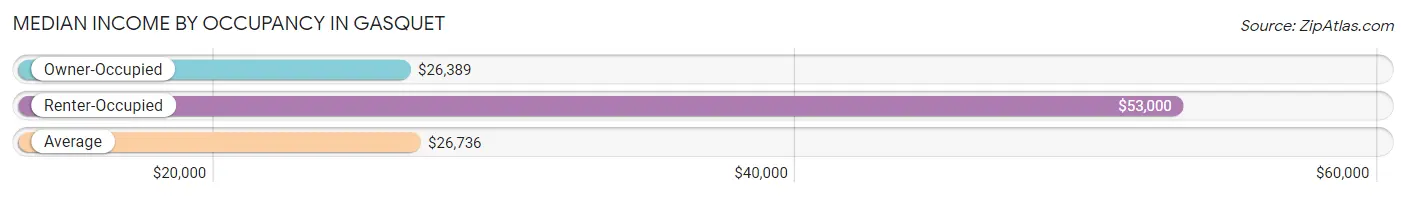
| Occupancy Type | # Households | Median Income |
| Owner-Occupied | 210 (84.0%) | $26,389 |
| Renter-Occupied | 40 (16.0%) | $53,000 |
| Average | 250 (100.0%) | $26,736 |
Occupancy by Householder Income Bracket in Gasquet
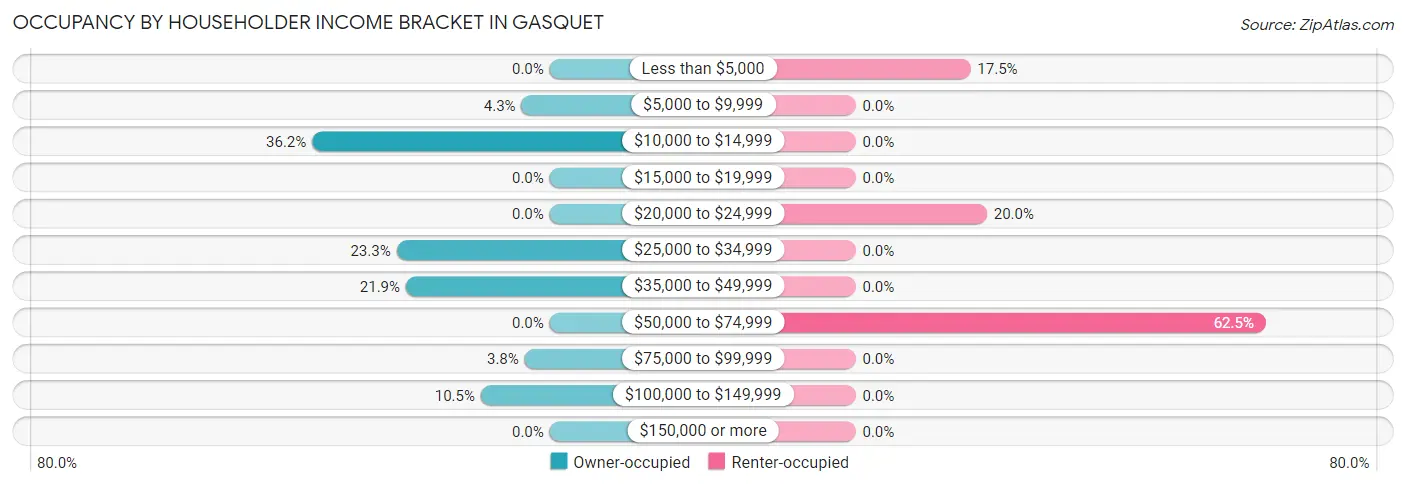
| Income Bracket | Owner-occupied | Renter-occupied |
| Less than $5,000 | 0 (0.0%) | 7 (17.5%) |
| $5,000 to $9,999 | 9 (4.3%) | 0 (0.0%) |
| $10,000 to $14,999 | 76 (36.2%) | 0 (0.0%) |
| $15,000 to $19,999 | 0 (0.0%) | 0 (0.0%) |
| $20,000 to $24,999 | 0 (0.0%) | 8 (20.0%) |
| $25,000 to $34,999 | 49 (23.3%) | 0 (0.0%) |
| $35,000 to $49,999 | 46 (21.9%) | 0 (0.0%) |
| $50,000 to $74,999 | 0 (0.0%) | 25 (62.5%) |
| $75,000 to $99,999 | 8 (3.8%) | 0 (0.0%) |
| $100,000 to $149,999 | 22 (10.5%) | 0 (0.0%) |
| $150,000 or more | 0 (0.0%) | 0 (0.0%) |
| Total | 210 (100.0%) | 40 (100.0%) |
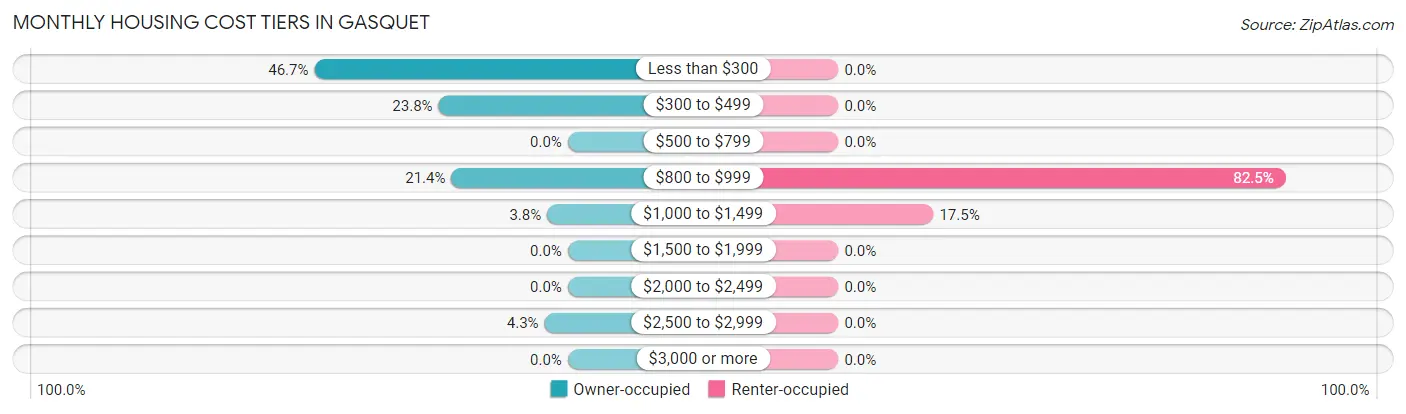
Monthly Housing Cost Tiers in Gasquet
| Monthly Cost | Owner-occupied | Renter-occupied |
| Less than $300 | 98 (46.7%) | 0 (0.0%) |
| $300 to $499 | 50 (23.8%) | 0 (0.0%) |
| $500 to $799 | 0 (0.0%) | 0 (0.0%) |
| $800 to $999 | 45 (21.4%) | 33 (82.5%) |
| $1,000 to $1,499 | 8 (3.8%) | 7 (17.5%) |
| $1,500 to $1,999 | 0 (0.0%) | 0 (0.0%) |
| $2,000 to $2,499 | 0 (0.0%) | 0 (0.0%) |
| $2,500 to $2,999 | 9 (4.3%) | 0 (0.0%) |
| $3,000 or more | 0 (0.0%) | 0 (0.0%) |
| Total | 210 (100.0%) | 40 (100.0%) |
Physical Housing Characteristics in Gasquet
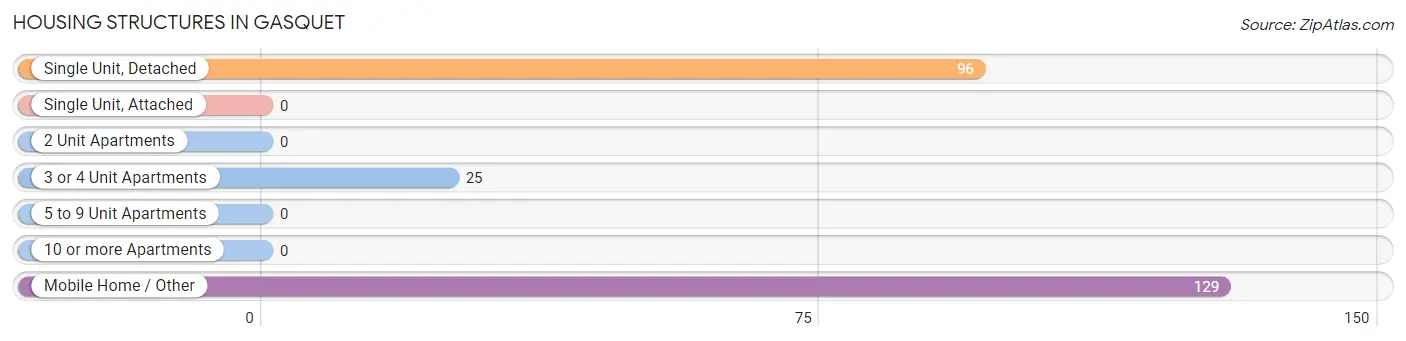
Housing Structures in Gasquet
| Structure Type | # Housing Units | % Housing Units |
| Single Unit, Detached | 96 | 38.4% |
| Single Unit, Attached | 0 | 0.0% |
| 2 Unit Apartments | 0 | 0.0% |
| 3 or 4 Unit Apartments | 25 | 10.0% |
| 5 to 9 Unit Apartments | 0 | 0.0% |
| 10 or more Apartments | 0 | 0.0% |
| Mobile Home / Other | 129 | 51.6% |
| Total | 250 | 100.0% |
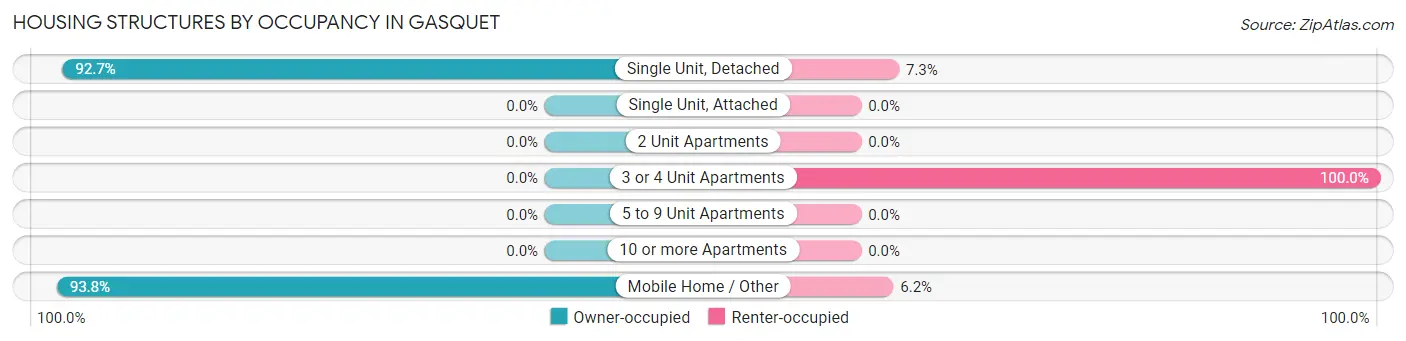
Housing Structures by Occupancy in Gasquet
| Structure Type | Owner-occupied | Renter-occupied |
| Single Unit, Detached | 89 (92.7%) | 7 (7.3%) |
| Single Unit, Attached | 0 (0.0%) | 0 (0.0%) |
| 2 Unit Apartments | 0 (0.0%) | 0 (0.0%) |
| 3 or 4 Unit Apartments | 0 (0.0%) | 25 (100.0%) |
| 5 to 9 Unit Apartments | 0 (0.0%) | 0 (0.0%) |
| 10 or more Apartments | 0 (0.0%) | 0 (0.0%) |
| Mobile Home / Other | 121 (93.8%) | 8 (6.2%) |
| Total | 210 (84.0%) | 40 (16.0%) |
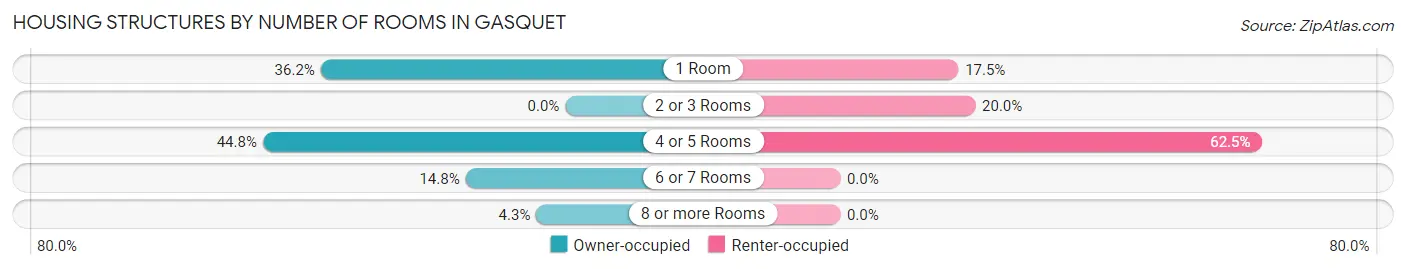
Housing Structures by Number of Rooms in Gasquet
| Number of Rooms | Owner-occupied | Renter-occupied |
| 1 Room | 76 (36.2%) | 7 (17.5%) |
| 2 or 3 Rooms | 0 (0.0%) | 8 (20.0%) |
| 4 or 5 Rooms | 94 (44.8%) | 25 (62.5%) |
| 6 or 7 Rooms | 31 (14.8%) | 0 (0.0%) |
| 8 or more Rooms | 9 (4.3%) | 0 (0.0%) |
| Total | 210 (100.0%) | 40 (100.0%) |
Housing Structure by Heating Type in Gasquet
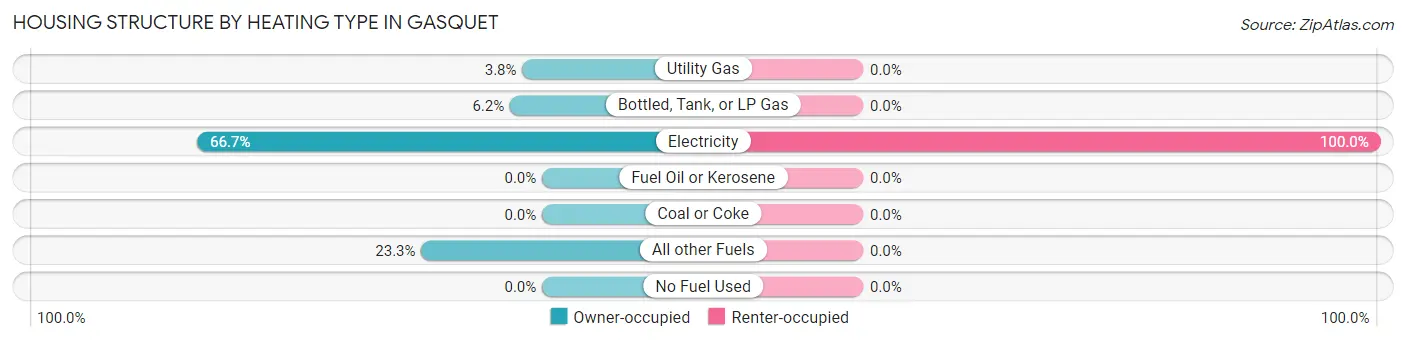
| Heating Type | Owner-occupied | Renter-occupied |
| Utility Gas | 8 (3.8%) | 0 (0.0%) |
| Bottled, Tank, or LP Gas | 13 (6.2%) | 0 (0.0%) |
| Electricity | 140 (66.7%) | 40 (100.0%) |
| Fuel Oil or Kerosene | 0 (0.0%) | 0 (0.0%) |
| Coal or Coke | 0 (0.0%) | 0 (0.0%) |
| All other Fuels | 49 (23.3%) | 0 (0.0%) |
| No Fuel Used | 0 (0.0%) | 0 (0.0%) |
| Total | 210 (100.0%) | 40 (100.0%) |
Household Vehicle Usage in Gasquet
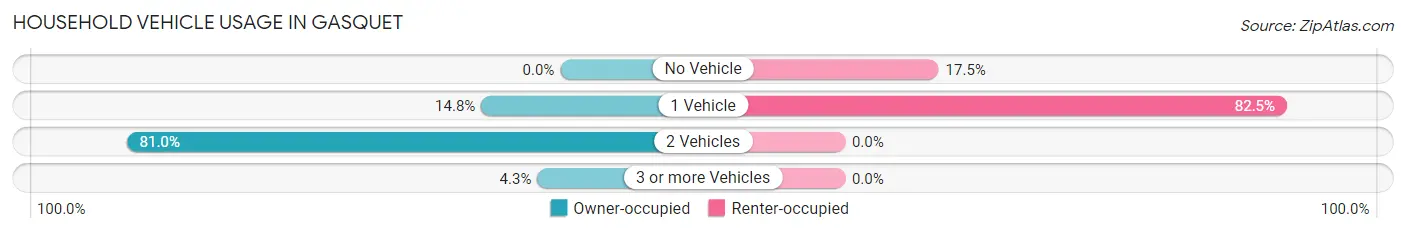
| Vehicles per Household | Owner-occupied | Renter-occupied |
| No Vehicle | 0 (0.0%) | 7 (17.5%) |
| 1 Vehicle | 31 (14.8%) | 33 (82.5%) |
| 2 Vehicles | 170 (80.9%) | 0 (0.0%) |
| 3 or more Vehicles | 9 (4.3%) | 0 (0.0%) |
| Total | 210 (100.0%) | 40 (100.0%) |
Real Estate & Mortgages in Gasquet
Real Estate and Mortgage Overview in Gasquet
| Characteristic | Without Mortgage | With Mortgage |
| Housing Units | 178 | 32 |
| Median Property Value | - | - |
| Median Household Income | $25,903 | $0 |
| Monthly Housing Costs | - | - |
| Real Estate Taxes | $2,087 | $0 |
Property Value by Mortgage Status in Gasquet
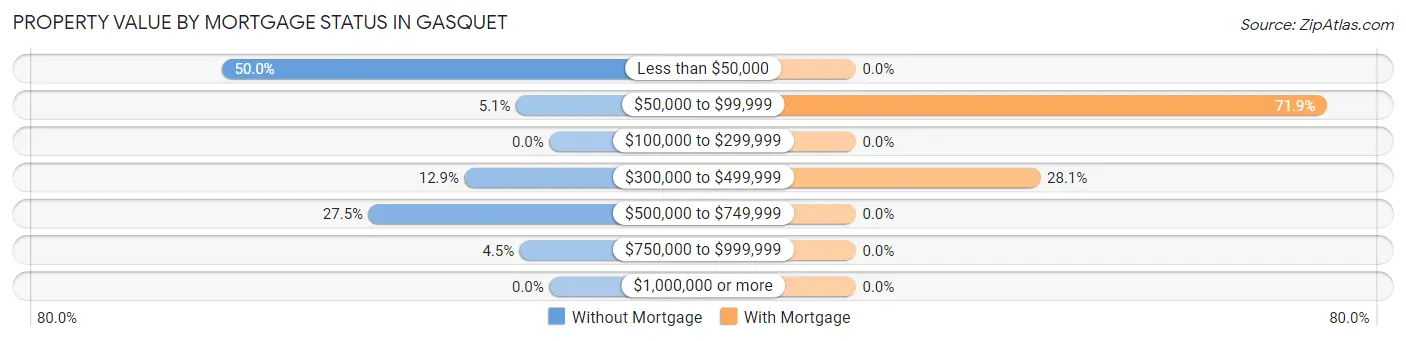
| Property Value | Without Mortgage | With Mortgage |
| Less than $50,000 | 89 (50.0%) | 0 (0.0%) |
| $50,000 to $99,999 | 9 (5.1%) | 23 (71.9%) |
| $100,000 to $299,999 | 0 (0.0%) | 0 (0.0%) |
| $300,000 to $499,999 | 23 (12.9%) | 9 (28.1%) |
| $500,000 to $749,999 | 49 (27.5%) | 0 (0.0%) |
| $750,000 to $999,999 | 8 (4.5%) | 0 (0.0%) |
| $1,000,000 or more | 0 (0.0%) | 0 (0.0%) |
| Total | 178 (100.0%) | 32 (100.0%) |
Household Income by Mortgage Status in Gasquet
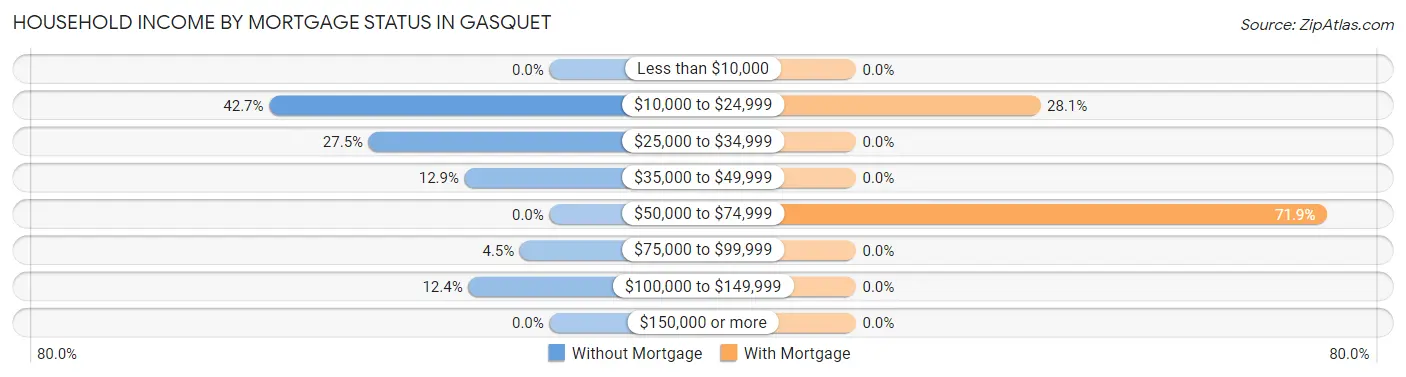
| Household Income | Without Mortgage | With Mortgage |
| Less than $10,000 | 0 (0.0%) | 0 (0.0%) |
| $10,000 to $24,999 | 76 (42.7%) | 9 (28.1%) |
| $25,000 to $34,999 | 49 (27.5%) | 0 (0.0%) |
| $35,000 to $49,999 | 23 (12.9%) | 0 (0.0%) |
| $50,000 to $74,999 | 0 (0.0%) | 23 (71.9%) |
| $75,000 to $99,999 | 8 (4.5%) | 0 (0.0%) |
| $100,000 to $149,999 | 22 (12.4%) | 0 (0.0%) |
| $150,000 or more | 0 (0.0%) | 0 (0.0%) |
| Total | 178 (100.0%) | 32 (100.0%) |
Property Value to Household Income Ratio in Gasquet
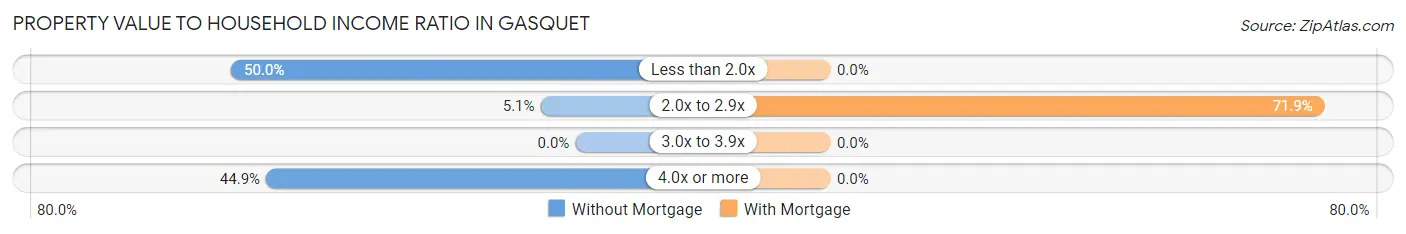
| Value-to-Income Ratio | Without Mortgage | With Mortgage |
| Less than 2.0x | 89 (50.0%) | 0 (0.0%) |
| 2.0x to 2.9x | 9 (5.1%) | 23 (71.9%) |
| 3.0x to 3.9x | 0 (0.0%) | 0 (0.0%) |
| 4.0x or more | 80 (44.9%) | 0 (0.0%) |
| Total | 178 (100.0%) | 32 (100.0%) |
Real Estate Taxes by Mortgage Status in Gasquet
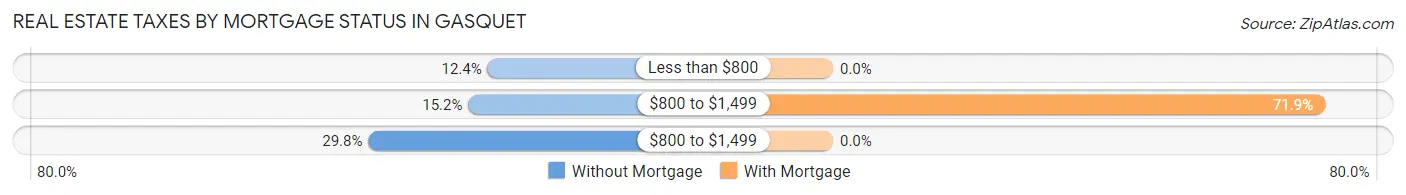
| Property Taxes | Without Mortgage | With Mortgage |
| Less than $800 | 22 (12.4%) | 0 (0.0%) |
| $800 to $1,499 | 27 (15.2%) | 23 (71.9%) |
| $800 to $1,499 | 53 (29.8%) | 0 (0.0%) |
| Total | 178 (100.0%) | 32 (100.0%) |
Health & Disability in Gasquet
Health Insurance Coverage by Age in Gasquet
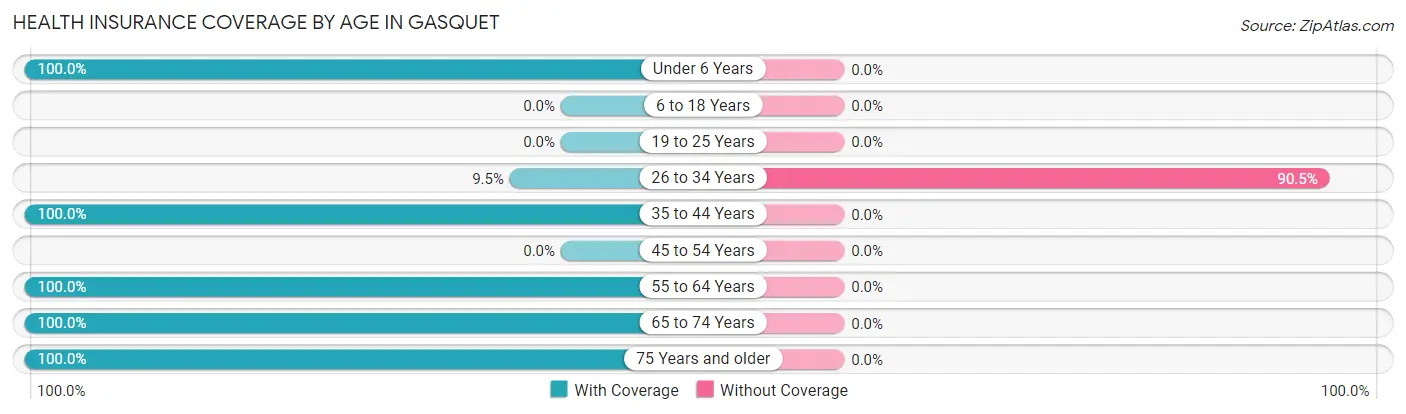
| Age Bracket | With Coverage | Without Coverage |
| Under 6 Years | 23 (100.0%) | 0 (0.0%) |
| 6 to 18 Years | 0 (0.0%) | 0 (0.0%) |
| 19 to 25 Years | 0 (0.0%) | 0 (0.0%) |
| 26 to 34 Years | 8 (9.5%) | 76 (90.5%) |
| 35 to 44 Years | 9 (100.0%) | 0 (0.0%) |
| 45 to 54 Years | 0 (0.0%) | 0 (0.0%) |
| 55 to 64 Years | 117 (100.0%) | 0 (0.0%) |
| 65 to 74 Years | 74 (100.0%) | 0 (0.0%) |
| 75 Years and older | 59 (100.0%) | 0 (0.0%) |
| Total | 290 (79.2%) | 76 (20.8%) |
Health Insurance Coverage by Citizenship Status in Gasquet
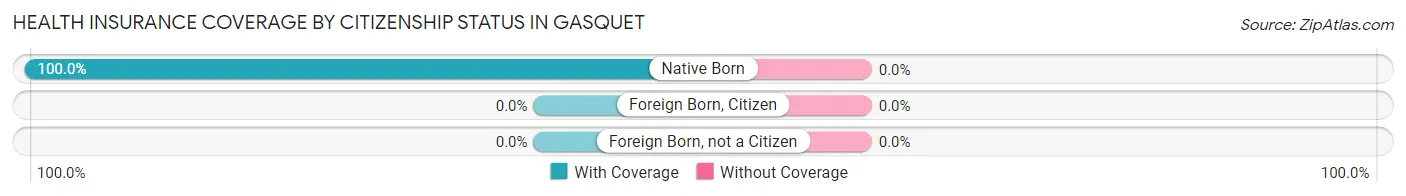
| Citizenship Status | With Coverage | Without Coverage |
| Native Born | 23 (100.0%) | 0 (0.0%) |
| Foreign Born, Citizen | 0 (0.0%) | 0 (0.0%) |
| Foreign Born, not a Citizen | 0 (0.0%) | 0 (0.0%) |
Health Insurance Coverage by Household Income in Gasquet
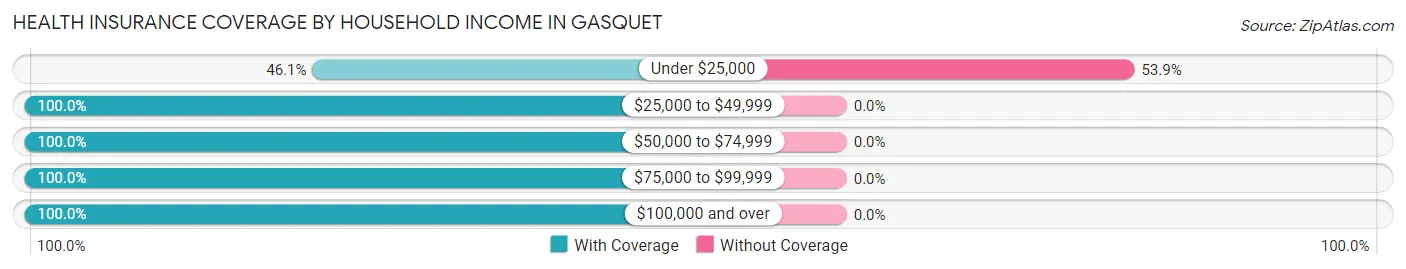
| Household Income | With Coverage | Without Coverage |
| Under $25,000 | 65 (46.1%) | 76 (53.9%) |
| $25,000 to $49,999 | 116 (100.0%) | 0 (0.0%) |
| $50,000 to $74,999 | 50 (100.0%) | 0 (0.0%) |
| $75,000 to $99,999 | 14 (100.0%) | 0 (0.0%) |
| $100,000 and over | 45 (100.0%) | 0 (0.0%) |
Public vs Private Health Insurance Coverage by Age in Gasquet
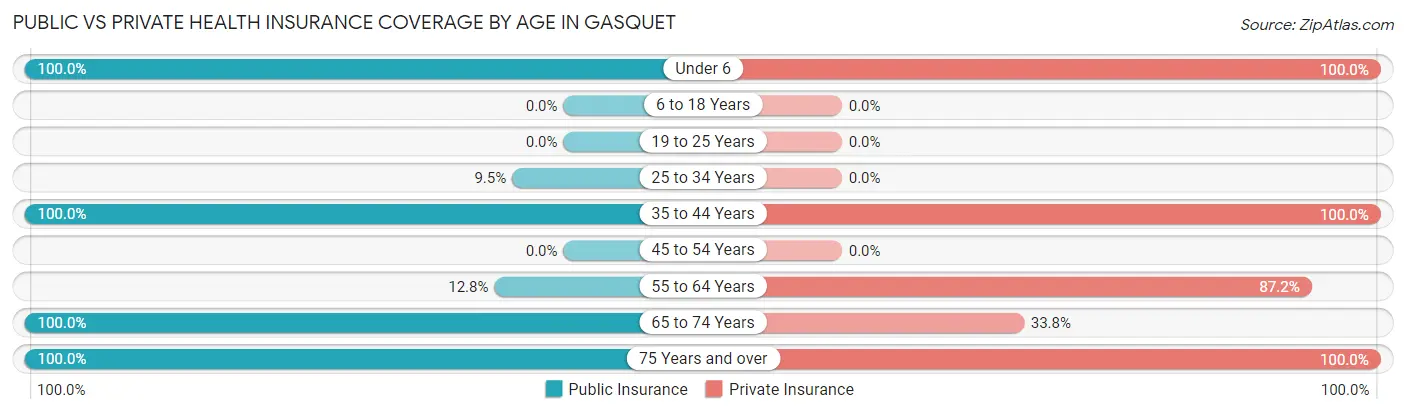
| Age Bracket | Public Insurance | Private Insurance |
| Under 6 | 23 (100.0%) | 23 (100.0%) |
| 6 to 18 Years | 0 (0.0%) | 0 (0.0%) |
| 19 to 25 Years | 0 (0.0%) | 0 (0.0%) |
| 25 to 34 Years | 8 (9.5%) | 0 (0.0%) |
| 35 to 44 Years | 9 (100.0%) | 9 (100.0%) |
| 45 to 54 Years | 0 (0.0%) | 0 (0.0%) |
| 55 to 64 Years | 15 (12.8%) | 102 (87.2%) |
| 65 to 74 Years | 74 (100.0%) | 25 (33.8%) |
| 75 Years and over | 59 (100.0%) | 59 (100.0%) |
| Total | 188 (51.4%) | 218 (59.6%) |
Disability Status by Sex by Age in Gasquet
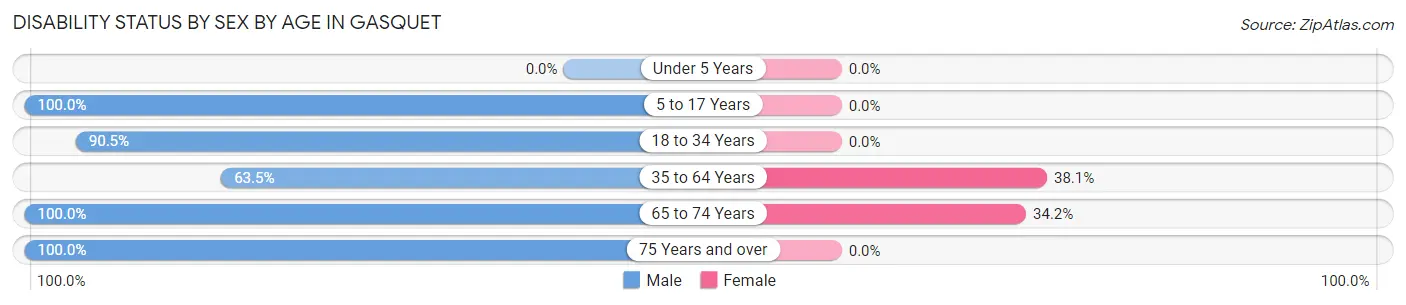
| Age Bracket | Male | Female |
| Under 5 Years | 0 (0.0%) | 0 (0.0%) |
| 5 to 17 Years | 12 (100.0%) | 0 (0.0%) |
| 18 to 34 Years | 76 (90.5%) | 0 (0.0%) |
| 35 to 64 Years | 40 (63.5%) | 24 (38.1%) |
| 65 to 74 Years | 36 (100.0%) | 13 (34.2%) |
| 75 Years and over | 27 (100.0%) | 0 (0.0%) |
Disability Class by Sex by Age in Gasquet
Disability Class: Hearing Difficulty
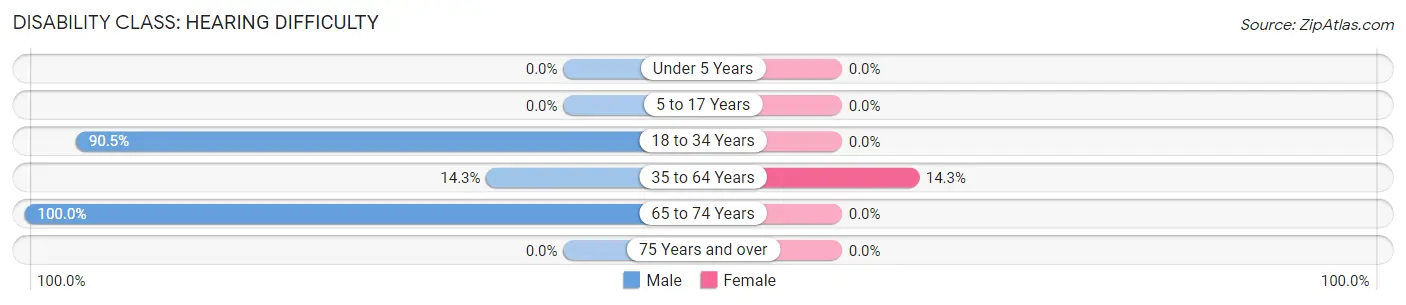
| Age Bracket | Male | Female |
| Under 5 Years | 0 (0.0%) | 0 (0.0%) |
| 5 to 17 Years | 0 (0.0%) | 0 (0.0%) |
| 18 to 34 Years | 76 (90.5%) | 0 (0.0%) |
| 35 to 64 Years | 9 (14.3%) | 9 (14.3%) |
| 65 to 74 Years | 36 (100.0%) | 0 (0.0%) |
| 75 Years and over | 0 (0.0%) | 0 (0.0%) |
Disability Class: Vision Difficulty
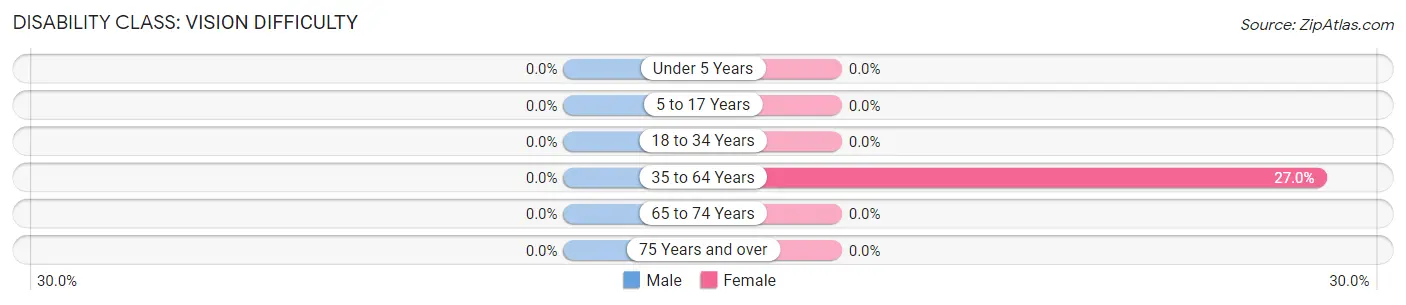
| Age Bracket | Male | Female |
| Under 5 Years | 0 (0.0%) | 0 (0.0%) |
| 5 to 17 Years | 0 (0.0%) | 0 (0.0%) |
| 18 to 34 Years | 0 (0.0%) | 0 (0.0%) |
| 35 to 64 Years | 0 (0.0%) | 17 (27.0%) |
| 65 to 74 Years | 0 (0.0%) | 0 (0.0%) |
| 75 Years and over | 0 (0.0%) | 0 (0.0%) |
Disability Class: Cognitive Difficulty
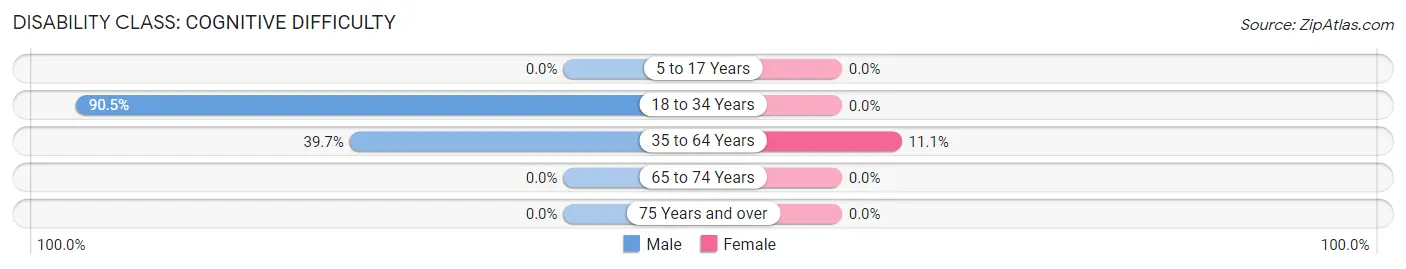
| Age Bracket | Male | Female |
| 5 to 17 Years | 0 (0.0%) | 0 (0.0%) |
| 18 to 34 Years | 76 (90.5%) | 0 (0.0%) |
| 35 to 64 Years | 25 (39.7%) | 7 (11.1%) |
| 65 to 74 Years | 0 (0.0%) | 0 (0.0%) |
| 75 Years and over | 0 (0.0%) | 0 (0.0%) |
Disability Class: Ambulatory Difficulty
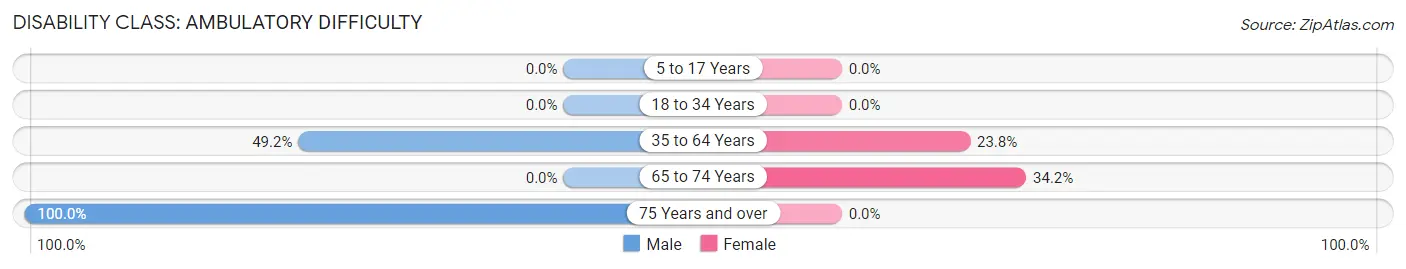
| Age Bracket | Male | Female |
| 5 to 17 Years | 0 (0.0%) | 0 (0.0%) |
| 18 to 34 Years | 0 (0.0%) | 0 (0.0%) |
| 35 to 64 Years | 31 (49.2%) | 15 (23.8%) |
| 65 to 74 Years | 0 (0.0%) | 13 (34.2%) |
| 75 Years and over | 27 (100.0%) | 0 (0.0%) |
Disability Class: Self-Care Difficulty
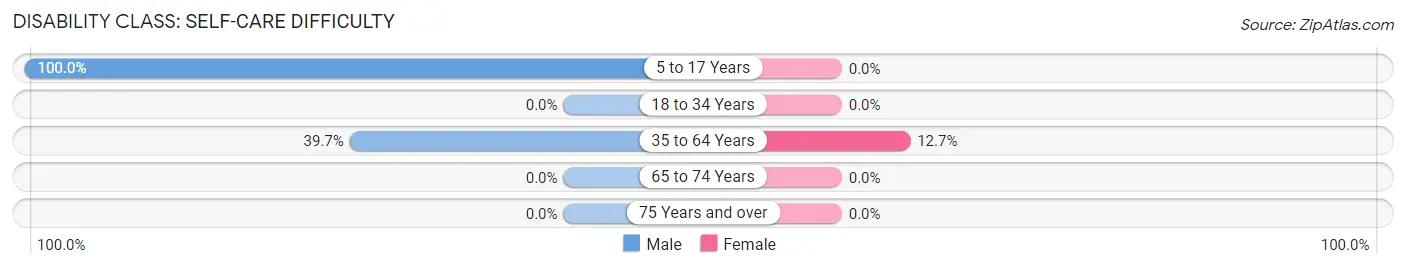
| Age Bracket | Male | Female |
| 5 to 17 Years | 12 (100.0%) | 0 (0.0%) |
| 18 to 34 Years | 0 (0.0%) | 0 (0.0%) |
| 35 to 64 Years | 25 (39.7%) | 8 (12.7%) |
| 65 to 74 Years | 0 (0.0%) | 0 (0.0%) |
| 75 Years and over | 0 (0.0%) | 0 (0.0%) |
Technology Access in Gasquet
Computing Device Access in Gasquet
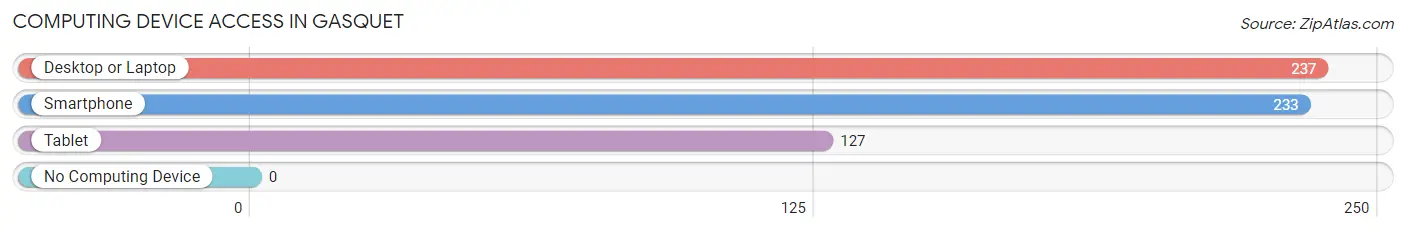
| Device Type | # Households | % Households |
| Desktop or Laptop | 237 | 94.8% |
| Smartphone | 233 | 93.2% |
| Tablet | 127 | 50.8% |
| No Computing Device | 0 | 0.0% |
| Total | 250 | 100.0% |
Internet Access in Gasquet
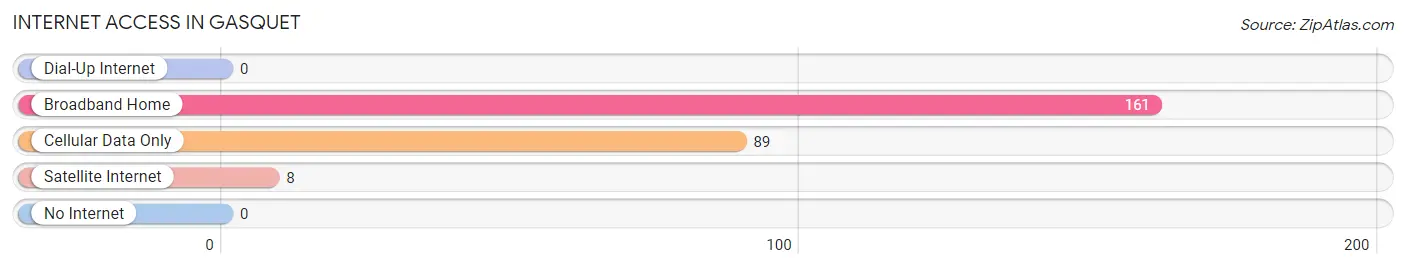
| Internet Type | # Households | % Households |
| Dial-Up Internet | 0 | 0.0% |
| Broadband Home | 161 | 64.4% |
| Cellular Data Only | 89 | 35.6% |
| Satellite Internet | 8 | 3.2% |
| No Internet | 0 | 0.0% |
| Total | 250 | 100.0% |
Gasquet Summary
Richard Gasquet is a small unincorporated community located in Del Norte County, California. It is situated on the Smith River, approximately 20 miles south of Crescent City and the Oregon border. The population of Gasquet was estimated to be around 500 in 2020.
History
The area around Gasquet was first inhabited by the Tolowa people, who lived in the area for thousands of years before the arrival of Europeans. The first Europeans to explore the area were Spanish explorers in the late 1700s. The first permanent settlers in the area were Chinese immigrants who arrived in the late 1800s. They established a small fishing village on the Smith River, which eventually became known as Gasquet.
The town was named after a French-Canadian trapper named Richard Gasquet, who was the first European to settle in the area. He arrived in the area in the late 1800s and established a trading post. The town grew slowly over the years, and by the early 1900s it had become a popular destination for fishermen and hunters.
Geography
Gasquet is located in the Smith River Valley, which is surrounded by the Klamath Mountains to the east and the Coast Range to the west. The Smith River is the main waterway in the area, and it is fed by several smaller creeks and streams. The area is known for its lush forests and abundant wildlife, including black bears, deer, elk, and bald eagles.
The climate in Gasquet is mild and temperate, with warm summers and cool winters. The average annual temperature is around 50°F, and the average annual precipitation is around 40 inches.
Economy
The economy of Gasquet is largely based on tourism and logging. The town is a popular destination for fishing, hunting, and camping, and it is also home to several logging companies. The town also has a small retail sector, with several stores and restaurants.
Demographics
The population of Gasquet was estimated to be around 500 in 2020. The racial makeup of the town is predominantly white (90%), with small percentages of Native American (4%), Asian (2%), and African American (1%) residents. The median household income in Gasquet is around $35,000, and the median home value is around $150,000. The town has a high rate of poverty, with around 25% of the population living below the poverty line.
Common Questions
What is Per Capita Income in Gasquet?
Per Capita income in Gasquet is $25,597.
What is the Median Family Income in Gasquet?
Median Family Income in Gasquet is $53,700.
What is the Median Household income in Gasquet?
Median Household Income in Gasquet is $26,736.
What is Inequality or Gini Index in Gasquet?
Inequality or Gini Index in Gasquet is 0.44.
What is the Total Population of Gasquet?
Total Population of Gasquet is 366.
What is the Total Male Population of Gasquet?
Total Male Population of Gasquet is 233.
What is the Total Female Population of Gasquet?
Total Female Population of Gasquet is 133.
What is the Ratio of Males per 100 Females in Gasquet?
There are 175.19 Males per 100 Females in Gasquet.
What is the Ratio of Females per 100 Males in Gasquet?
There are 57.08 Females per 100 Males in Gasquet.
What is the Median Population Age in Gasquet?
Median Population Age in Gasquet is 61.7 Years.
What is the Average Family Size in Gasquet
Average Family Size in Gasquet is 2.4 People.
What is the Average Household Size in Gasquet
Average Household Size in Gasquet is 1.5 People.
How Large is the Labor Force in Gasquet?
There are 159 People in the Labor Forcein in Gasquet.
What is the Percentage of People in the Labor Force in Gasquet?
46.4% of People are in the Labor Force in Gasquet.
What is the Unemployment Rate in Gasquet?
Unemployment Rate in Gasquet is 4.4%.