Fulton, CA Map & Demographics
Fulton Map
Fulton Overview
$46,126
PER CAPITA INCOME
$151,392
AVG FAMILY INCOME
$159,006
AVG HOUSEHOLD INCOME
0.34
INEQUALITY / GINI INDEX
749
TOTAL POPULATION
386
MALE POPULATION
363
FEMALE POPULATION
106.34
MALES / 100 FEMALES
94.04
FEMALES / 100 MALES
47.3
MEDIAN AGE
3.3
AVG FAMILY SIZE
3.1
AVG HOUSEHOLD SIZE
339
LABOR FORCE [ PEOPLE ]
58.9%
PERCENT IN LABOR FORCE
Fulton Zip Codes
Fulton Area Codes
Income in Fulton
Income Overview in Fulton
Per Capita Income in Fulton is $46,126, while median incomes of families and households are $151,392 and $159,006 respectively.
| Characteristic | Number | Measure |
| Per Capita Income | 749 | $46,126 |
| Median Family Income | 183 | $151,392 |
| Mean Family Income | 183 | $143,890 |
| Median Household Income | 235 | $159,006 |
| Mean Household Income | 235 | $142,969 |
| Income Deficit | 183 | $0 |
| Wage / Income Gap (%) | 749 | 0.00% |
| Wage / Income Gap ($) | 749 | 100.00¢ per $1 |
| Gini / Inequality Index | 749 | 0.34 |
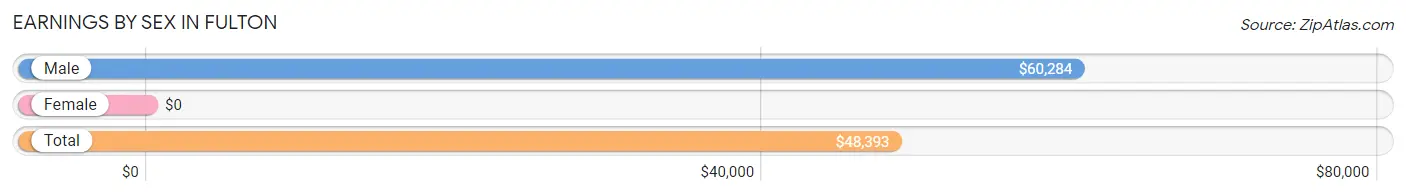
Earnings by Sex in Fulton
| Sex | Number | Average Earnings |
| Male | 201 (52.8%) | $60,284 |
| Female | 180 (47.2%) | $0 |
| Total | 381 (100.0%) | $48,393 |
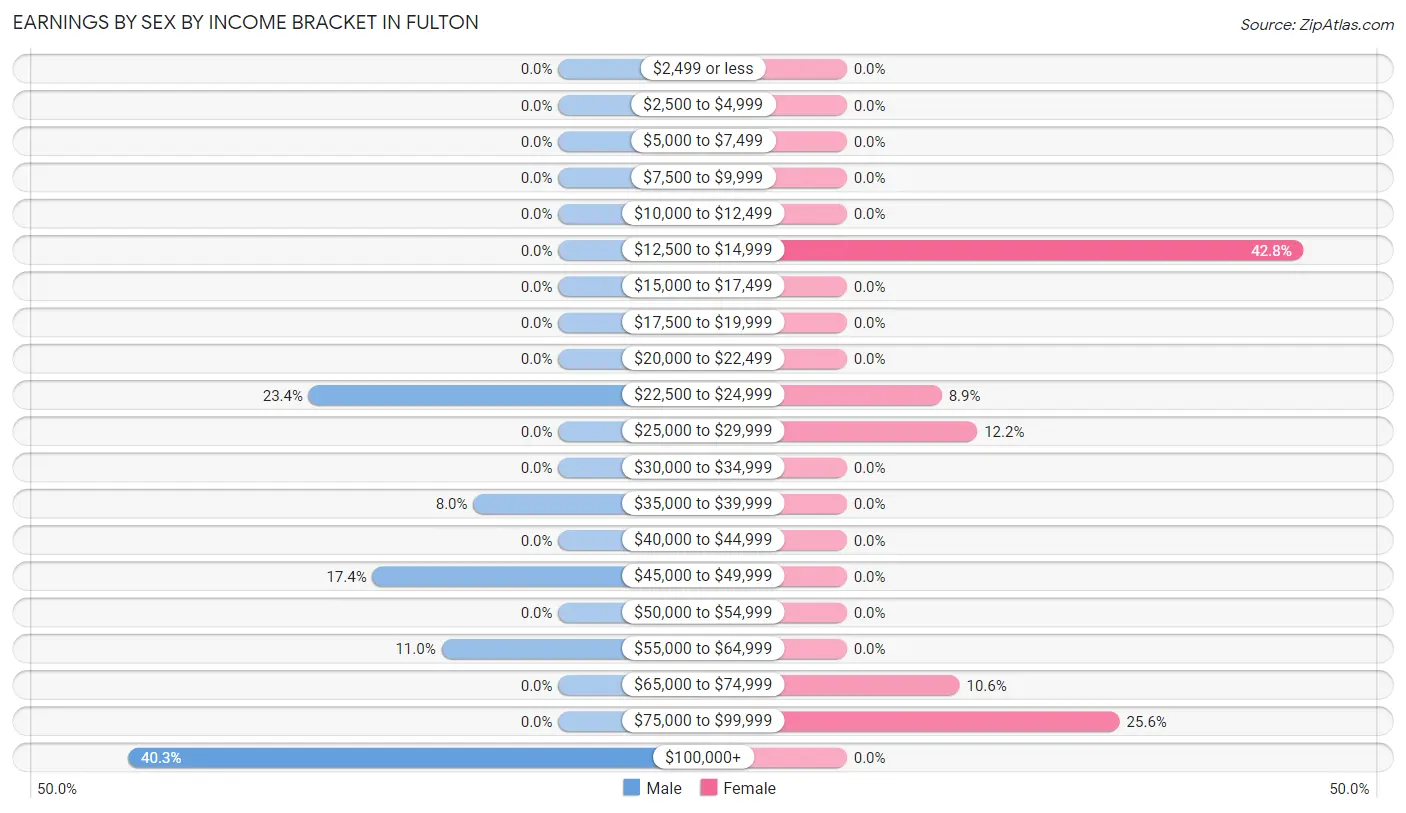
Earnings by Sex by Income Bracket in Fulton
The most common earnings brackets in Fulton are $100,000+ for men (81 | 40.3%) and $12,500 to $14,999 for women (77 | 42.8%).
| Income | Male | Female |
| $2,499 or less | 0 (0.0%) | 0 (0.0%) |
| $2,500 to $4,999 | 0 (0.0%) | 0 (0.0%) |
| $5,000 to $7,499 | 0 (0.0%) | 0 (0.0%) |
| $7,500 to $9,999 | 0 (0.0%) | 0 (0.0%) |
| $10,000 to $12,499 | 0 (0.0%) | 0 (0.0%) |
| $12,500 to $14,999 | 0 (0.0%) | 77 (42.8%) |
| $15,000 to $17,499 | 0 (0.0%) | 0 (0.0%) |
| $17,500 to $19,999 | 0 (0.0%) | 0 (0.0%) |
| $20,000 to $22,499 | 0 (0.0%) | 0 (0.0%) |
| $22,500 to $24,999 | 47 (23.4%) | 16 (8.9%) |
| $25,000 to $29,999 | 0 (0.0%) | 22 (12.2%) |
| $30,000 to $34,999 | 0 (0.0%) | 0 (0.0%) |
| $35,000 to $39,999 | 16 (8.0%) | 0 (0.0%) |
| $40,000 to $44,999 | 0 (0.0%) | 0 (0.0%) |
| $45,000 to $49,999 | 35 (17.4%) | 0 (0.0%) |
| $50,000 to $54,999 | 0 (0.0%) | 0 (0.0%) |
| $55,000 to $64,999 | 22 (11.0%) | 0 (0.0%) |
| $65,000 to $74,999 | 0 (0.0%) | 19 (10.6%) |
| $75,000 to $99,999 | 0 (0.0%) | 46 (25.6%) |
| $100,000+ | 81 (40.3%) | 0 (0.0%) |
| Total | 201 (100.0%) | 180 (100.0%) |
Earnings by Sex by Educational Attainment in Fulton
| Educational Attainment | Male Income | Female Income |
| Less than High School | - | - |
| High School Diploma | - | - |
| College or Associate's Degree | - | - |
| Bachelor's Degree | - | - |
| Graduate Degree | - | - |
| Total | $60,284 | $0 |
Family Income in Fulton
Family Income Brackets in Fulton
According to the Fulton family income data, there are 63 families falling into the $150,000 to $199,999 income range, which is the most common income bracket and makes up 34.4% of all families.
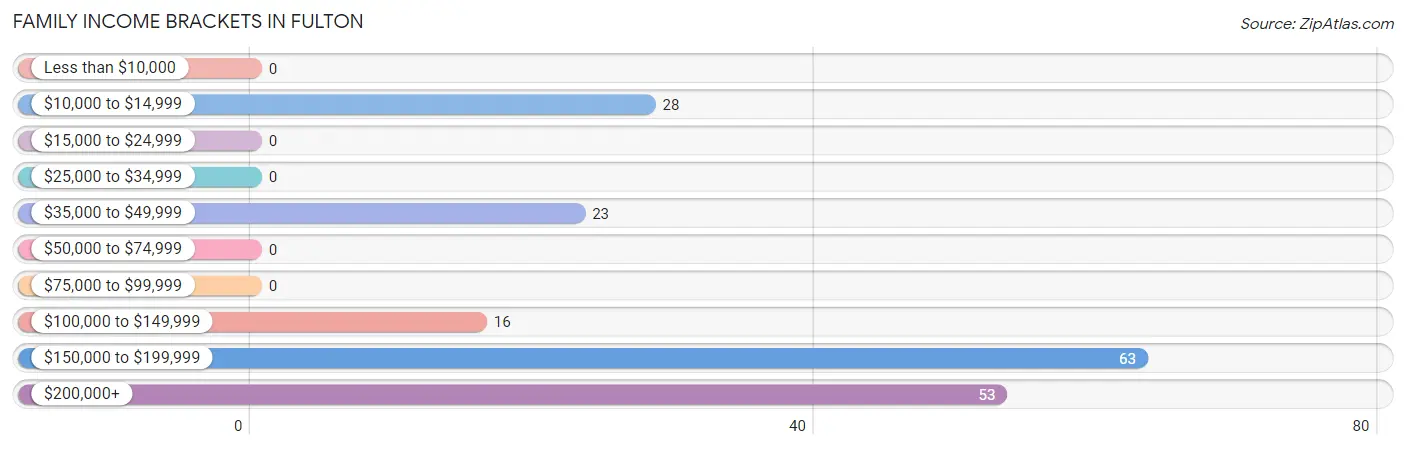
| Income Bracket | # Families | % Families |
| Less than $10,000 | 0 | 0.0% |
| $10,000 to $14,999 | 28 | 15.3% |
| $15,000 to $24,999 | 0 | 0.0% |
| $25,000 to $34,999 | 0 | 0.0% |
| $35,000 to $49,999 | 23 | 12.6% |
| $50,000 to $74,999 | 0 | 0.0% |
| $75,000 to $99,999 | 0 | 0.0% |
| $100,000 to $149,999 | 16 | 8.7% |
| $150,000 to $199,999 | 63 | 34.4% |
| $200,000+ | 53 | 29.0% |
Family Income by Famaliy Size in Fulton
3-person families (142 | 77.6%) account for the highest median family income in Fulton with $151,818 per family, while 3-person families (142 | 77.6%) have the highest median income of $50,606 per family member.
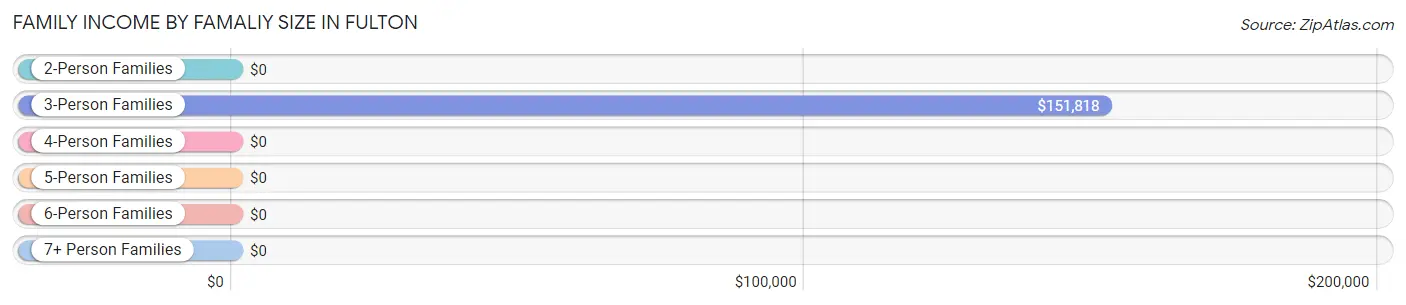
| Income Bracket | # Families | Median Income |
| 2-Person Families | 13 (7.1%) | $0 |
| 3-Person Families | 142 (77.6%) | $151,818 |
| 4-Person Families | 28 (15.3%) | $0 |
| 5-Person Families | 0 (0.0%) | $0 |
| 6-Person Families | 0 (0.0%) | $0 |
| 7+ Person Families | 0 (0.0%) | $0 |
| Total | 183 (100.0%) | $151,392 |
Family Income by Number of Earners in Fulton
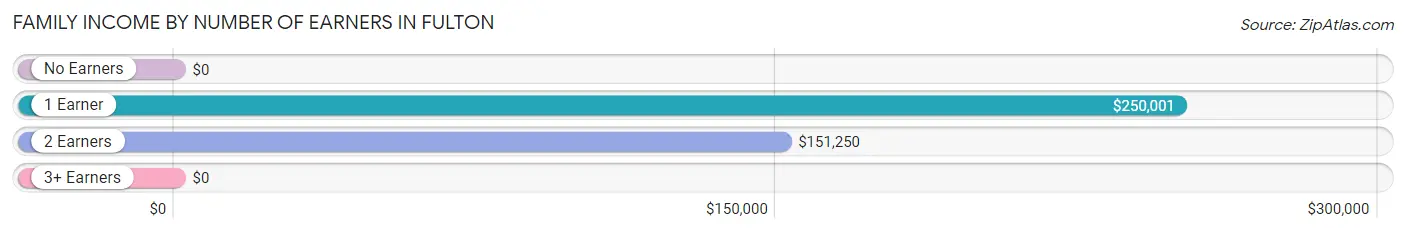
| Number of Earners | # Families | Median Income |
| No Earners | 0 (0.0%) | $0 |
| 1 Earner | 61 (33.3%) | $250,001 |
| 2 Earners | 122 (66.7%) | $151,250 |
| 3+ Earners | 0 (0.0%) | $0 |
| Total | 183 (100.0%) | $151,392 |
Household Income in Fulton
Household Income Brackets in Fulton
With 91 households falling in the category, the $150,000 to $199,999 income range is the most frequent in Fulton, accounting for 38.7% of all households.
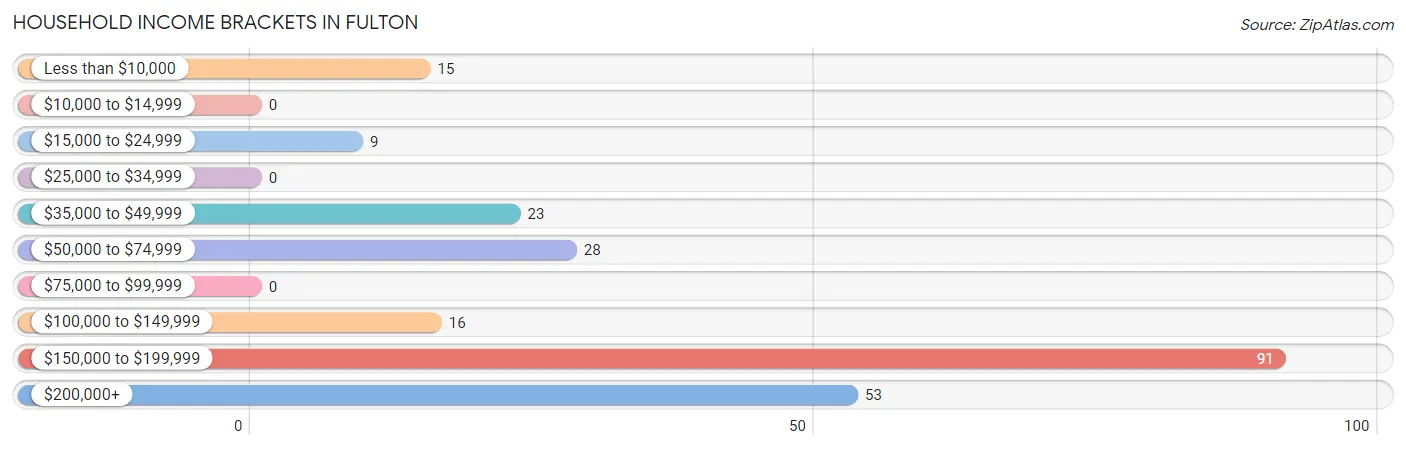
| Income Bracket | # Households | % Households |
| Less than $10,000 | 15 | 6.4% |
| $10,000 to $14,999 | 0 | 0.0% |
| $15,000 to $24,999 | 9 | 3.8% |
| $25,000 to $34,999 | 0 | 0.0% |
| $35,000 to $49,999 | 23 | 9.8% |
| $50,000 to $74,999 | 28 | 11.9% |
| $75,000 to $99,999 | 0 | 0.0% |
| $100,000 to $149,999 | 16 | 6.8% |
| $150,000 to $199,999 | 91 | 38.7% |
| $200,000+ | 53 | 22.6% |
Household Income by Householder Age in Fulton
The median household income in Fulton is $159,006, with the highest median household income of $157,898 found in the 65+ years age bracket for the primary householder. A total of 140 households (59.6%) fall into this category.
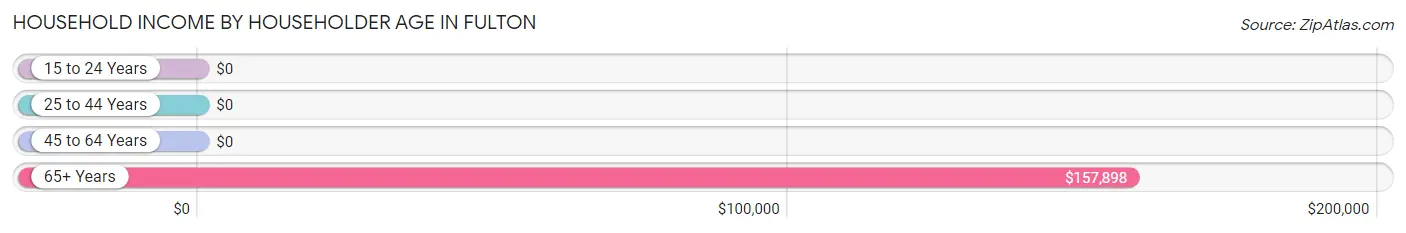
| Income Bracket | # Households | Median Income |
| 15 to 24 Years | 0 (0.0%) | $0 |
| 25 to 44 Years | 67 (28.5%) | $0 |
| 45 to 64 Years | 28 (11.9%) | $0 |
| 65+ Years | 140 (59.6%) | $157,898 |
| Total | 235 (100.0%) | $159,006 |
Poverty in Fulton
Income Below Poverty by Sex and Age in Fulton
With 22.0% poverty level for males and 30.0% for females among the residents of Fulton, 6 to 11 year old males and 12 to 14 year old females are the most vulnerable to poverty, with 32 males (100.0%) and 35 females (100.0%) in their respective age groups living below the poverty level.
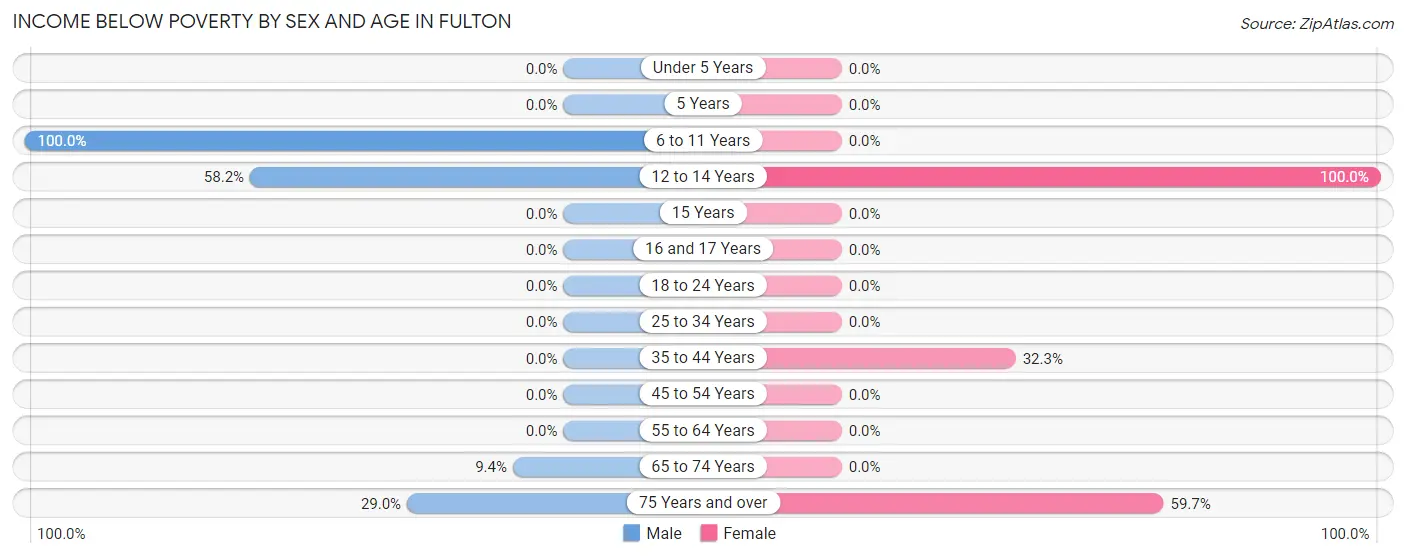
| Age Bracket | Male | Female |
| Under 5 Years | 0 (0.0%) | 0 (0.0%) |
| 5 Years | 0 (0.0%) | 0 (0.0%) |
| 6 to 11 Years | 32 (100.0%) | 0 (0.0%) |
| 12 to 14 Years | 32 (58.2%) | 35 (100.0%) |
| 15 Years | 0 (0.0%) | 0 (0.0%) |
| 16 and 17 Years | 0 (0.0%) | 0 (0.0%) |
| 18 to 24 Years | 0 (0.0%) | 0 (0.0%) |
| 25 to 34 Years | 0 (0.0%) | 0 (0.0%) |
| 35 to 44 Years | 0 (0.0%) | 31 (32.3%) |
| 45 to 54 Years | 0 (0.0%) | 0 (0.0%) |
| 55 to 64 Years | 0 (0.0%) | 0 (0.0%) |
| 65 to 74 Years | 3 (9.4%) | 0 (0.0%) |
| 75 Years and over | 18 (29.0%) | 43 (59.7%) |
| Total | 85 (22.0%) | 109 (30.0%) |
Income Above Poverty by Sex and Age in Fulton
According to the poverty statistics in Fulton, males aged under 5 years and females aged 5 years are the age groups that are most secure financially, with 100.0% of males and 100.0% of females in these age groups living above the poverty line.
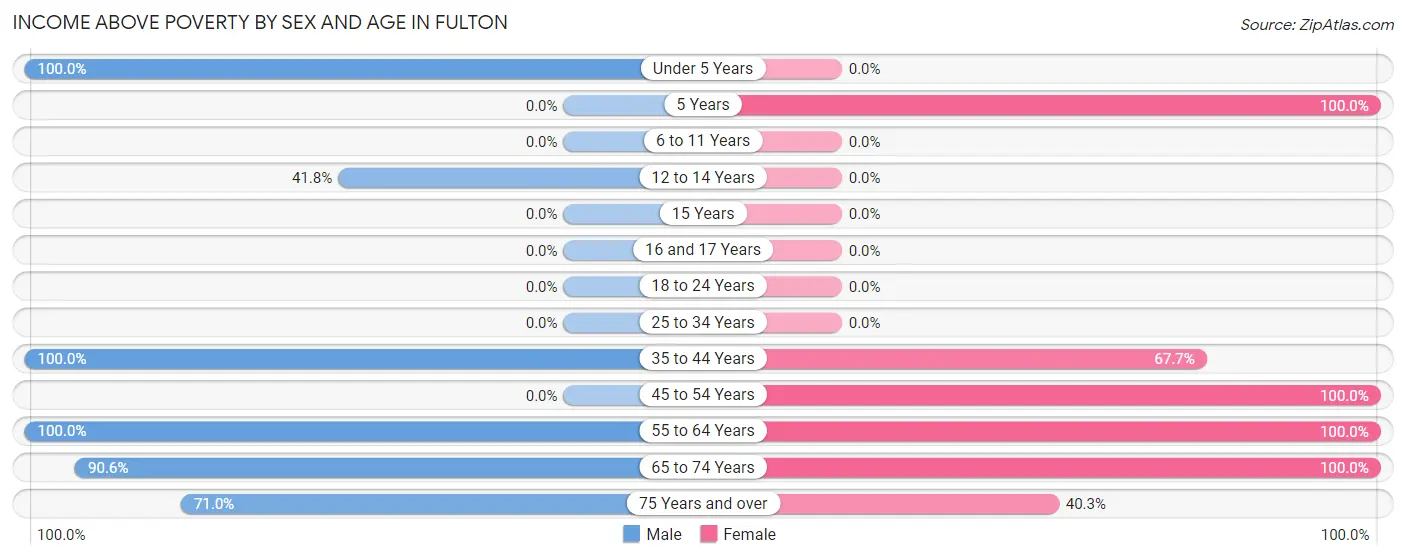
| Age Bracket | Male | Female |
| Under 5 Years | 30 (100.0%) | 0 (0.0%) |
| 5 Years | 0 (0.0%) | 21 (100.0%) |
| 6 to 11 Years | 0 (0.0%) | 0 (0.0%) |
| 12 to 14 Years | 23 (41.8%) | 0 (0.0%) |
| 15 Years | 0 (0.0%) | 0 (0.0%) |
| 16 and 17 Years | 0 (0.0%) | 0 (0.0%) |
| 18 to 24 Years | 0 (0.0%) | 0 (0.0%) |
| 25 to 34 Years | 0 (0.0%) | 0 (0.0%) |
| 35 to 44 Years | 100 (100.0%) | 65 (67.7%) |
| 45 to 54 Years | 0 (0.0%) | 20 (100.0%) |
| 55 to 64 Years | 75 (100.0%) | 68 (100.0%) |
| 65 to 74 Years | 29 (90.6%) | 51 (100.0%) |
| 75 Years and over | 44 (71.0%) | 29 (40.3%) |
| Total | 301 (78.0%) | 254 (70.0%) |
Income Below Poverty Among Married-Couple Families in Fulton
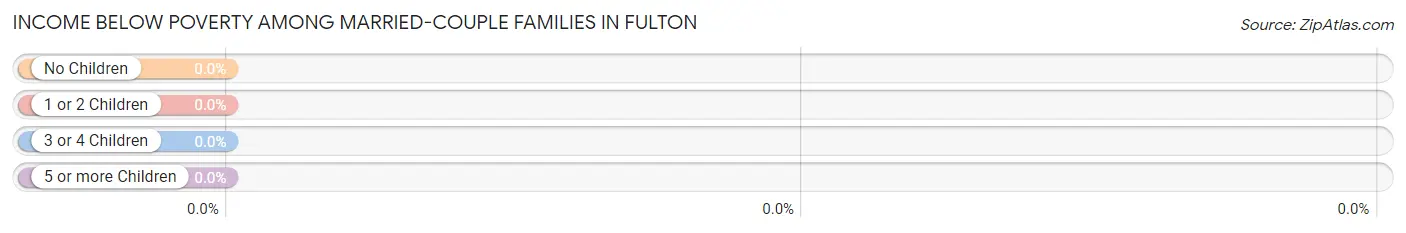
| Children | Above Poverty | Below Poverty |
| No Children | 29 (100.0%) | 0 (0.0%) |
| 1 or 2 Children | 39 (100.0%) | 0 (0.0%) |
| 3 or 4 Children | 0 (0.0%) | 0 (0.0%) |
| 5 or more Children | 0 (0.0%) | 0 (0.0%) |
| Total | 68 (100.0%) | 0 (0.0%) |
Income Below Poverty Among Single-Parent Households in Fulton
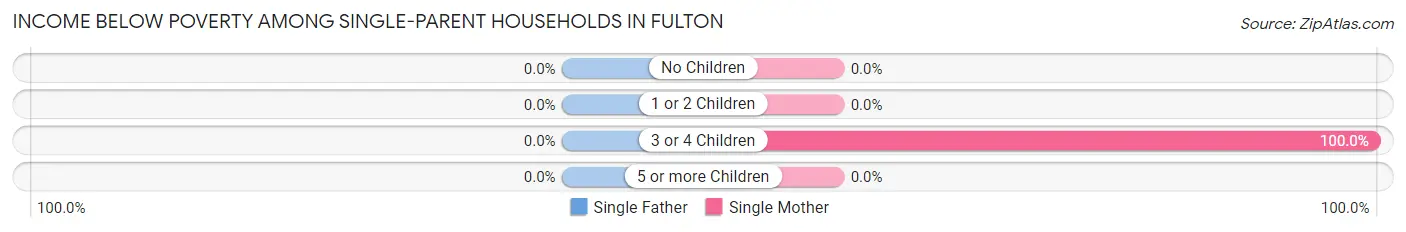
| Children | Single Father | Single Mother |
| No Children | 0 (0.0%) | 0 (0.0%) |
| 1 or 2 Children | 0 (0.0%) | 0 (0.0%) |
| 3 or 4 Children | 0 (0.0%) | 28 (100.0%) |
| 5 or more Children | 0 (0.0%) | 0 (0.0%) |
| Total | 0 (0.0%) | 28 (39.4%) |
Income Below Poverty Among Married-Couple vs Single-Parent Households in Fulton
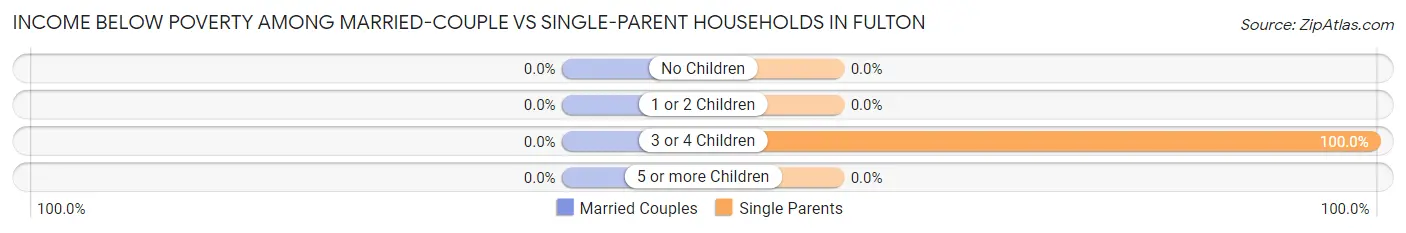
| Children | Married-Couple Families | Single-Parent Households |
| No Children | 0 (0.0%) | 0 (0.0%) |
| 1 or 2 Children | 0 (0.0%) | 0 (0.0%) |
| 3 or 4 Children | 0 (0.0%) | 28 (100.0%) |
| 5 or more Children | 0 (0.0%) | 0 (0.0%) |
| Total | 0 (0.0%) | 28 (24.3%) |
Race in Fulton
The most populous races in Fulton are White / Caucasian (477 | 63.7%), Hispanic or Latino (345 | 46.1%), and Some other Race (229 | 30.6%).
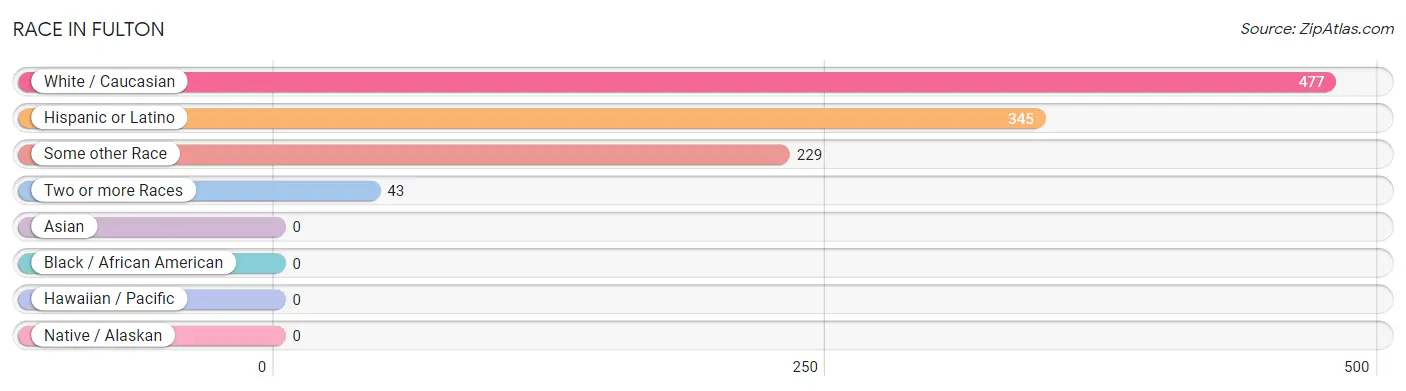
| Race | # Population | % Population |
| Asian | 0 | 0.0% |
| Black / African American | 0 | 0.0% |
| Hawaiian / Pacific | 0 | 0.0% |
| Hispanic or Latino | 345 | 46.1% |
| Native / Alaskan | 0 | 0.0% |
| White / Caucasian | 477 | 63.7% |
| Two or more Races | 43 | 5.7% |
| Some other Race | 229 | 30.6% |
| Total | 749 | 100.0% |
Ancestry in Fulton
The most populous ancestries reported in Fulton are Mexican (342 | 45.7%), Italian (133 | 17.8%), English (88 | 11.7%), German (73 | 9.8%), and European (72 | 9.6%), together accounting for 94.5% of all Fulton residents.
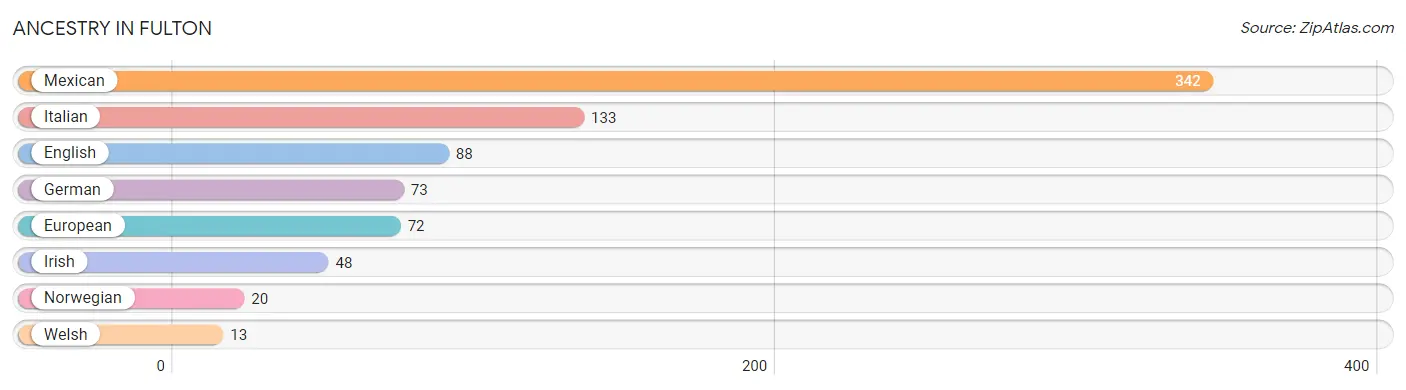
| Ancestry | # Population | % Population |
| English | 88 | 11.7% |
| European | 72 | 9.6% |
| German | 73 | 9.8% |
| Irish | 48 | 6.4% |
| Italian | 133 | 17.8% |
| Mexican | 342 | 45.7% |
| Norwegian | 20 | 2.7% |
| Welsh | 13 | 1.7% | View All 8 Rows |
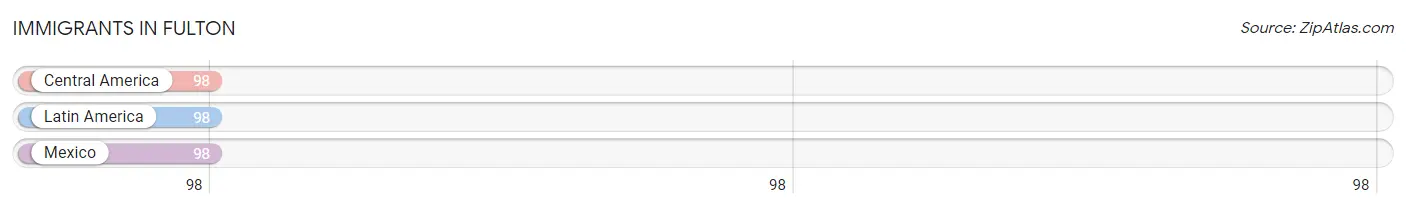
Immigrants in Fulton
The most numerous immigrant groups reported in Fulton came from Central America (98 | 13.1%), Latin America (98 | 13.1%), and Mexico (98 | 13.1%), together accounting for 39.2% of all Fulton residents.
| Immigration Origin | # Population | % Population |
| Central America | 98 | 13.1% |
| Latin America | 98 | 13.1% |
| Mexico | 98 | 13.1% | View All 3 Rows |
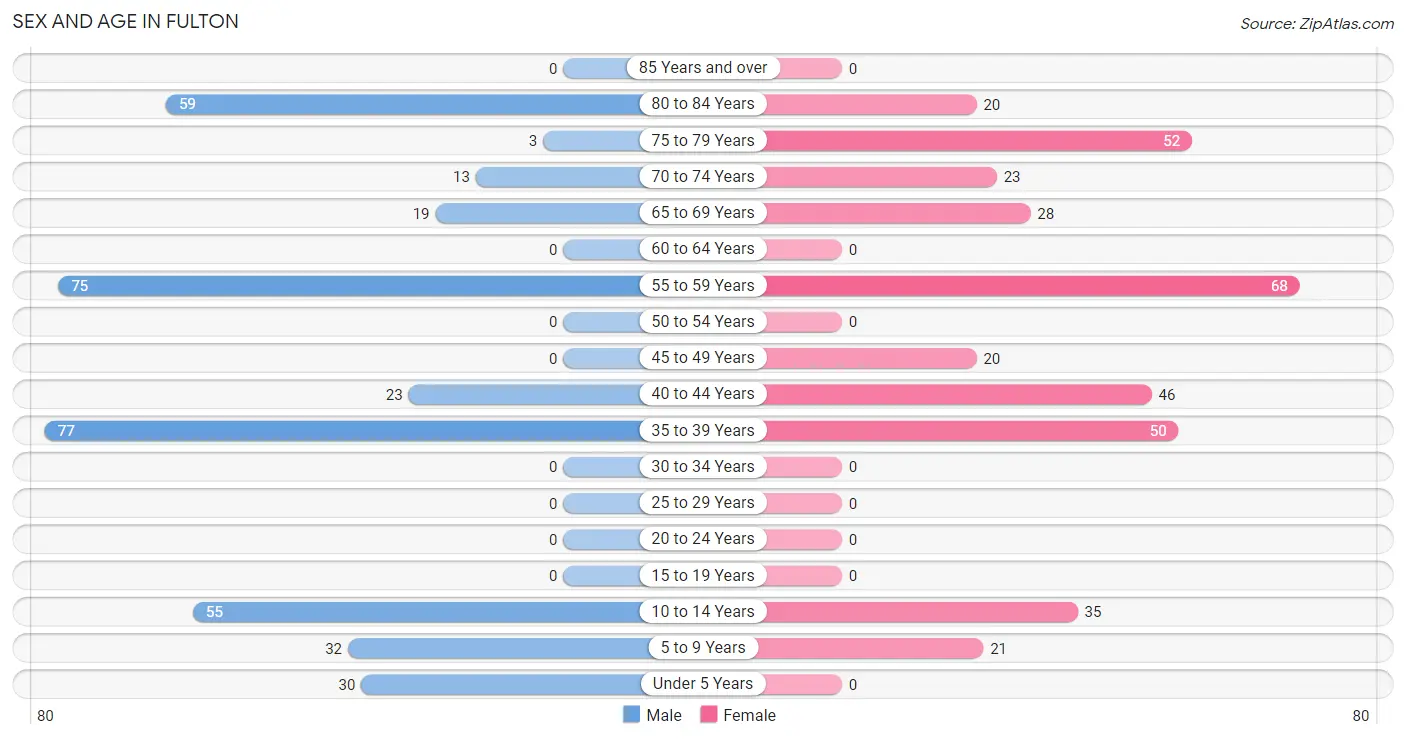
Sex and Age in Fulton
Sex and Age in Fulton
The most populous age groups in Fulton are 35 to 39 Years (77 | 20.0%) for men and 55 to 59 Years (68 | 18.7%) for women.
| Age Bracket | Male | Female |
| Under 5 Years | 30 (7.8%) | 0 (0.0%) |
| 5 to 9 Years | 32 (8.3%) | 21 (5.8%) |
| 10 to 14 Years | 55 (14.2%) | 35 (9.6%) |
| 15 to 19 Years | 0 (0.0%) | 0 (0.0%) |
| 20 to 24 Years | 0 (0.0%) | 0 (0.0%) |
| 25 to 29 Years | 0 (0.0%) | 0 (0.0%) |
| 30 to 34 Years | 0 (0.0%) | 0 (0.0%) |
| 35 to 39 Years | 77 (20.0%) | 50 (13.8%) |
| 40 to 44 Years | 23 (6.0%) | 46 (12.7%) |
| 45 to 49 Years | 0 (0.0%) | 20 (5.5%) |
| 50 to 54 Years | 0 (0.0%) | 0 (0.0%) |
| 55 to 59 Years | 75 (19.4%) | 68 (18.7%) |
| 60 to 64 Years | 0 (0.0%) | 0 (0.0%) |
| 65 to 69 Years | 19 (4.9%) | 28 (7.7%) |
| 70 to 74 Years | 13 (3.4%) | 23 (6.3%) |
| 75 to 79 Years | 3 (0.8%) | 52 (14.3%) |
| 80 to 84 Years | 59 (15.3%) | 20 (5.5%) |
| 85 Years and over | 0 (0.0%) | 0 (0.0%) |
| Total | 386 (100.0%) | 363 (100.0%) |
Families and Households in Fulton
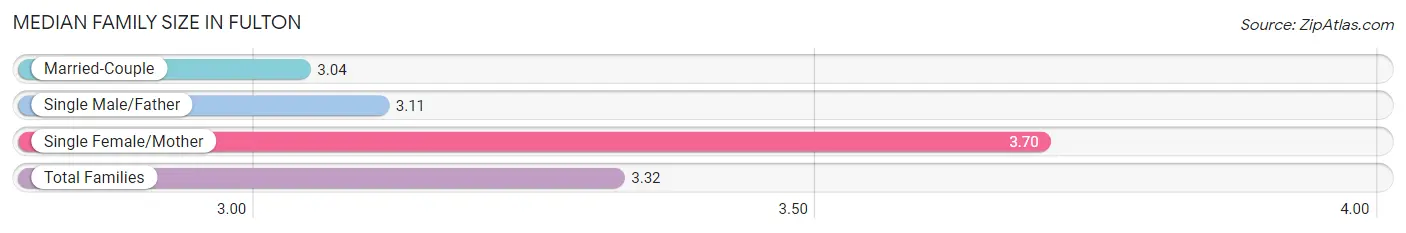
Median Family Size in Fulton
The median family size in Fulton is 3.32 persons per family, with single female/mother families (71 | 38.8%) accounting for the largest median family size of 3.7 persons per family. On the other hand, married-couple families (68 | 37.2%) represent the smallest median family size with 3.04 persons per family.
| Family Type | # Families | Family Size |
| Married-Couple | 68 (37.2%) | 3.04 |
| Single Male/Father | 44 (24.0%) | 3.11 |
| Single Female/Mother | 71 (38.8%) | 3.70 |
| Total Families | 183 (100.0%) | 3.32 |
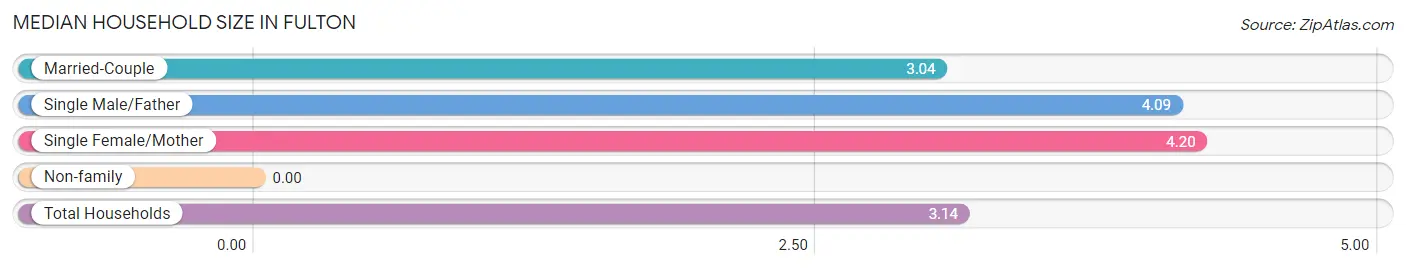
Median Household Size in Fulton
| Household Type | # Households | Household Size |
| Married-Couple | 68 (28.9%) | 3.04 |
| Single Male/Father | 44 (18.7%) | 4.09 |
| Single Female/Mother | 71 (30.2%) | 4.20 |
| Non-family | 52 (22.1%) | - |
| Total Households | 235 (100.0%) | 3.14 |
Household Size by Marriage Status in Fulton
Out of a total of 235 households in Fulton, 183 (77.9%) are family households, while 52 (22.1%) are nonfamily households. The most numerous type of family households are 3-person households, comprising 98, and the most common type of nonfamily households are 1-person households, comprising 52.
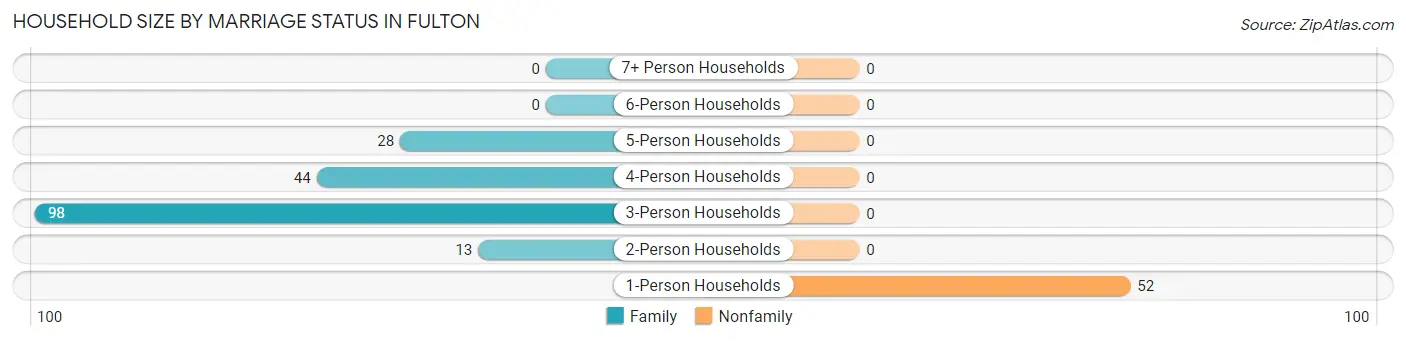
| Household Size | Family Households | Nonfamily Households |
| 1-Person Households | - | 52 (22.1%) |
| 2-Person Households | 13 (5.5%) | 0 (0.0%) |
| 3-Person Households | 98 (41.7%) | 0 (0.0%) |
| 4-Person Households | 44 (18.7%) | 0 (0.0%) |
| 5-Person Households | 28 (11.9%) | 0 (0.0%) |
| 6-Person Households | 0 (0.0%) | 0 (0.0%) |
| 7+ Person Households | 0 (0.0%) | 0 (0.0%) |
| Total | 183 (77.9%) | 52 (22.1%) |
Female Fertility in Fulton
Fertility by Age in Fulton
| Age Bracket | Women with Births | Births / 1,000 Women |
| 15 to 19 years | 0 (0.0%) | 0.0 |
| 20 to 34 years | 0 (0.0%) | 0.0 |
| 35 to 50 years | 0 (0.0%) | 0.0 |
| Total | 0 (0.0%) | 0.0 |
Fertility by Age by Marriage Status in Fulton
| Age Bracket | Married | Unmarried |
| 15 to 19 years | 0 (0.0%) | 0 (0.0%) |
| 20 to 34 years | 0 (0.0%) | 0 (0.0%) |
| 35 to 50 years | 0 (0.0%) | 0 (0.0%) |
| Total | 0 (0.0%) | 0 (0.0%) |
Fertility by Education in Fulton
| Educational Attainment | Women with Births | Births / 1,000 Women |
| Less than High School | 0 (0.0%) | 0.0 |
| High School Diploma | 0 (0.0%) | 0.0 |
| College or Associate's Degree | 0 (0.0%) | 0.0 |
| Bachelor's Degree | 0 (0.0%) | 0.0 |
| Graduate Degree | 0 (0.0%) | 0.0 |
| Total | 0 (0.0%) | 0.0 |
Fertility by Education by Marriage Status in Fulton
| Educational Attainment | Married | Unmarried |
| Less than High School | 0 (0.0%) | 0 (0.0%) |
| High School Diploma | 0 (0.0%) | 0 (0.0%) |
| College or Associate's Degree | 0 (0.0%) | 0 (0.0%) |
| Bachelor's Degree | 0 (0.0%) | 0 (0.0%) |
| Graduate Degree | 0 (0.0%) | 0 (0.0%) |
| Total | 0 (0.0%) | 0 (0.0%) |
Employment Characteristics in Fulton
Employment by Class of Employer in Fulton
Among the 339 employed individuals in Fulton, private company employees (217 | 64.0%), local government employees (42 | 12.4%), and self-employed (not incorporated) (36 | 10.6%) make up the most common classes of employment.
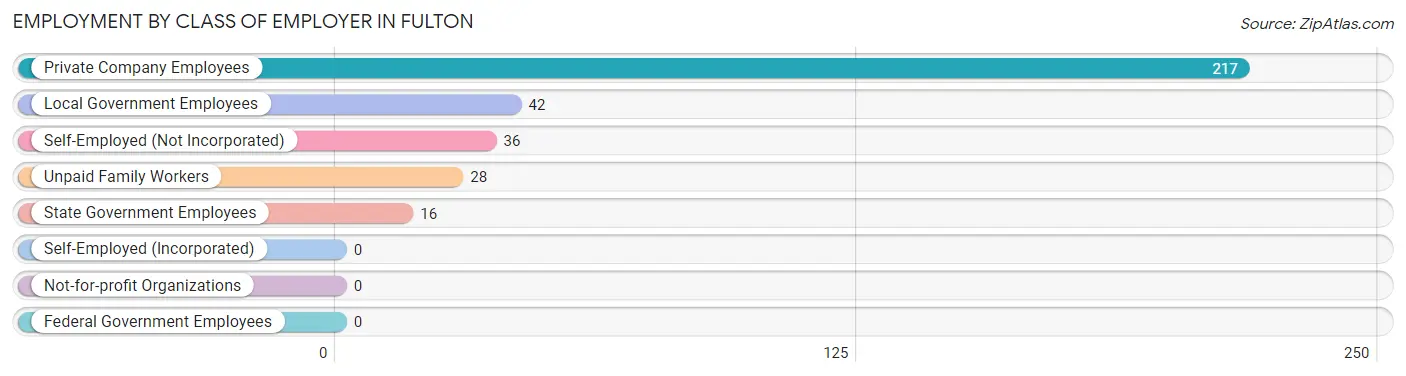
| Employer Class | # Employees | % Employees |
| Private Company Employees | 217 | 64.0% |
| Self-Employed (Incorporated) | 0 | 0.0% |
| Self-Employed (Not Incorporated) | 36 | 10.6% |
| Not-for-profit Organizations | 0 | 0.0% |
| Local Government Employees | 42 | 12.4% |
| State Government Employees | 16 | 4.7% |
| Federal Government Employees | 0 | 0.0% |
| Unpaid Family Workers | 28 | 8.3% |
| Total | 339 | 100.0% |
Employment Status by Age in Fulton
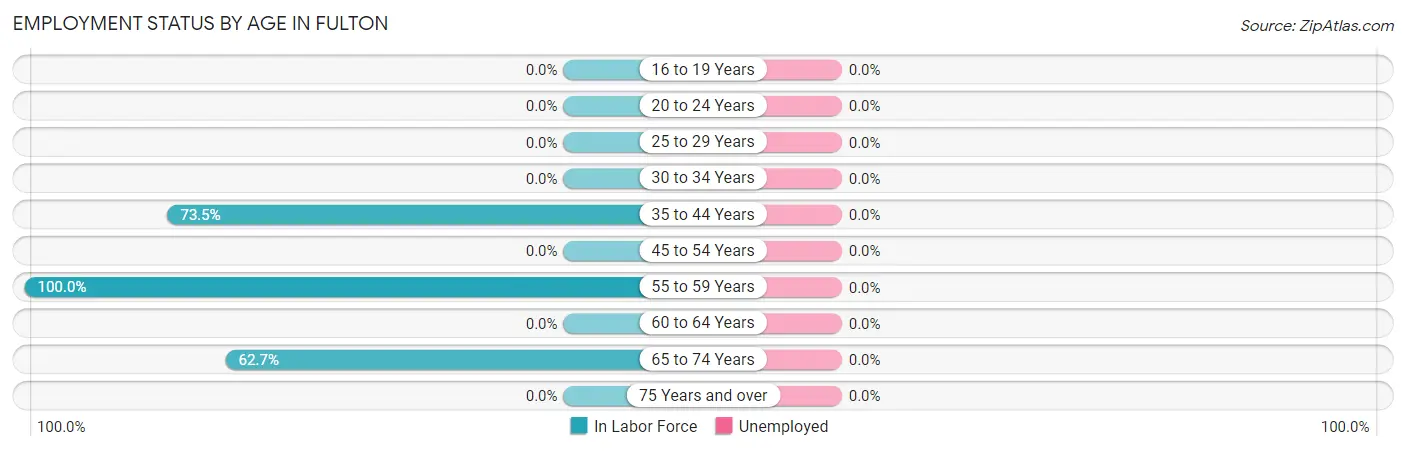
| Age Bracket | In Labor Force | Unemployed |
| 16 to 19 Years | 0 (0.0%) | 0 (0.0%) |
| 20 to 24 Years | 0 (0.0%) | 0 (0.0%) |
| 25 to 29 Years | 0 (0.0%) | 0 (0.0%) |
| 30 to 34 Years | 0 (0.0%) | 0 (0.0%) |
| 35 to 44 Years | 144 (73.5%) | 0 (0.0%) |
| 45 to 54 Years | 0 (0.0%) | 0 (0.0%) |
| 55 to 59 Years | 143 (100.0%) | 0 (0.0%) |
| 60 to 64 Years | 0 (0.0%) | 0 (0.0%) |
| 65 to 74 Years | 52 (62.7%) | 0 (0.0%) |
| 75 Years and over | 0 (0.0%) | 0 (0.0%) |
| Total | 339 (58.9%) | 0 (0.0%) |
Employment Status by Educational Attainment in Fulton
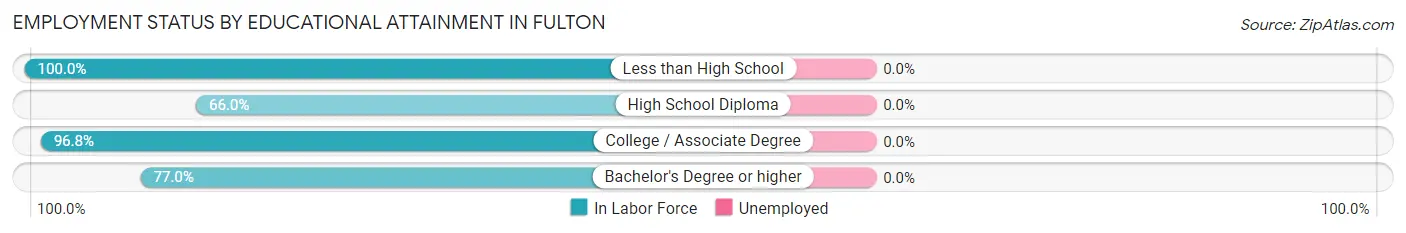
| Educational Attainment | In Labor Force | Unemployed |
| Less than High School | 35 (100.0%) | 0 (0.0%) |
| High School Diploma | 95 (66.0%) | 0 (0.0%) |
| College / Associate Degree | 90 (96.8%) | 0 (0.0%) |
| Bachelor's Degree or higher | 67 (77.0%) | 0 (0.0%) |
| Total | 287 (79.9%) | 0 (0.0%) |
Employment Occupations by Sex in Fulton
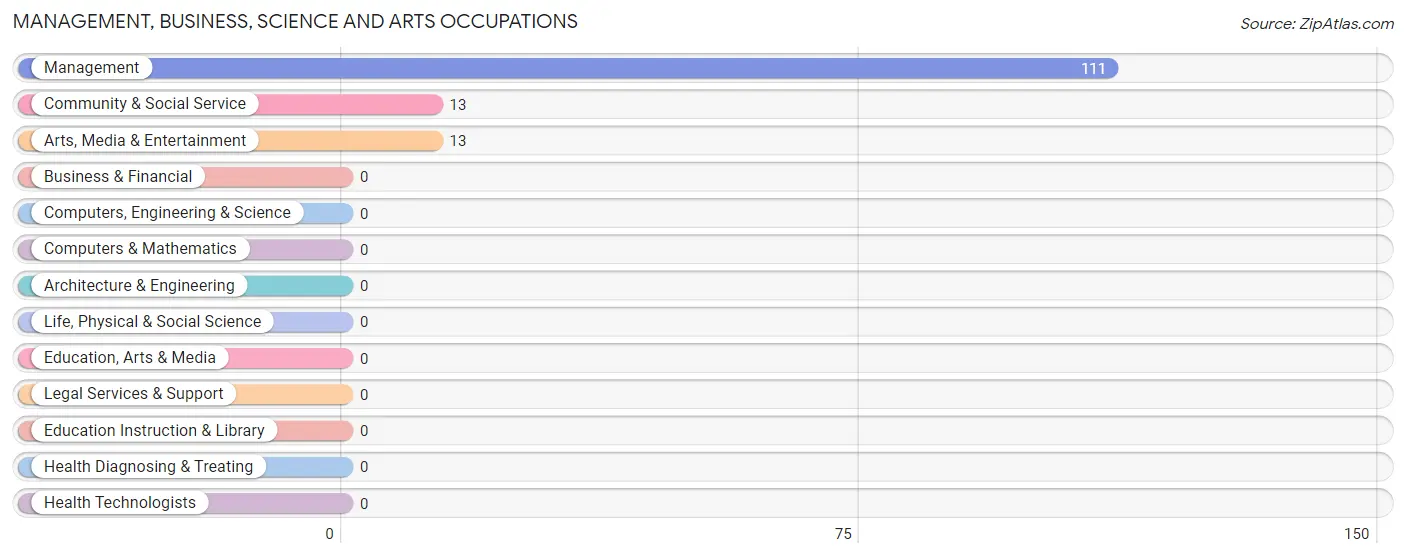
Management, Business, Science and Arts Occupations
The most common Management, Business, Science and Arts occupations in Fulton are Management (111 | 32.7%), Community & Social Service (13 | 3.8%), and Arts, Media & Entertainment (13 | 3.8%).
Management, Business, Science and Arts Occupations by Sex
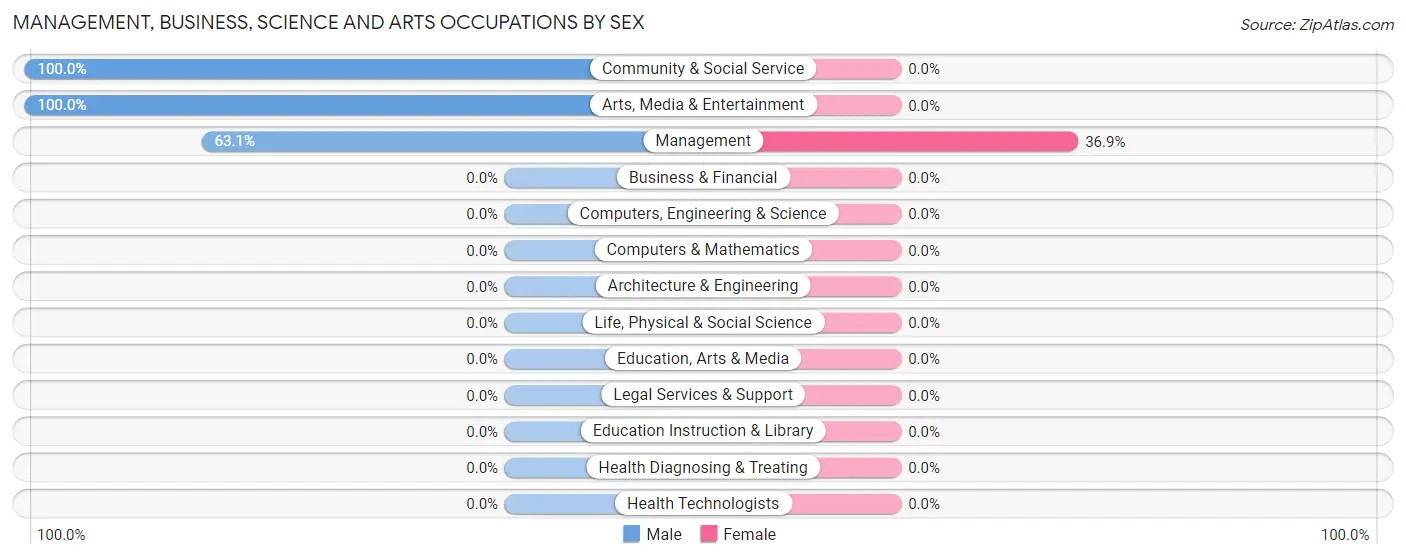
| Occupation | Male | Female |
| Management | 70 (63.1%) | 41 (36.9%) |
| Business & Financial | 0 (0.0%) | 0 (0.0%) |
| Computers, Engineering & Science | 0 (0.0%) | 0 (0.0%) |
| Computers & Mathematics | 0 (0.0%) | 0 (0.0%) |
| Architecture & Engineering | 0 (0.0%) | 0 (0.0%) |
| Life, Physical & Social Science | 0 (0.0%) | 0 (0.0%) |
| Community & Social Service | 13 (100.0%) | 0 (0.0%) |
| Education, Arts & Media | 0 (0.0%) | 0 (0.0%) |
| Legal Services & Support | 0 (0.0%) | 0 (0.0%) |
| Education Instruction & Library | 0 (0.0%) | 0 (0.0%) |
| Arts, Media & Entertainment | 13 (100.0%) | 0 (0.0%) |
| Health Diagnosing & Treating | 0 (0.0%) | 0 (0.0%) |
| Health Technologists | 0 (0.0%) | 0 (0.0%) |
| Total (Category) | 83 (66.9%) | 41 (33.1%) |
| Total (Overall) | 185 (54.6%) | 154 (45.4%) |
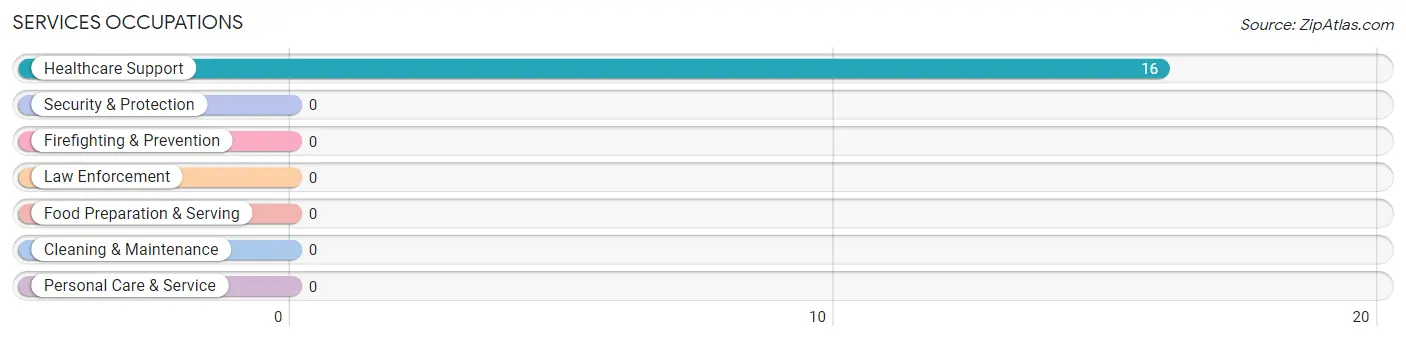
Services Occupations
The most common Services occupations in Fulton are , and Healthcare Support (16 | 4.7%).
Services Occupations by Sex
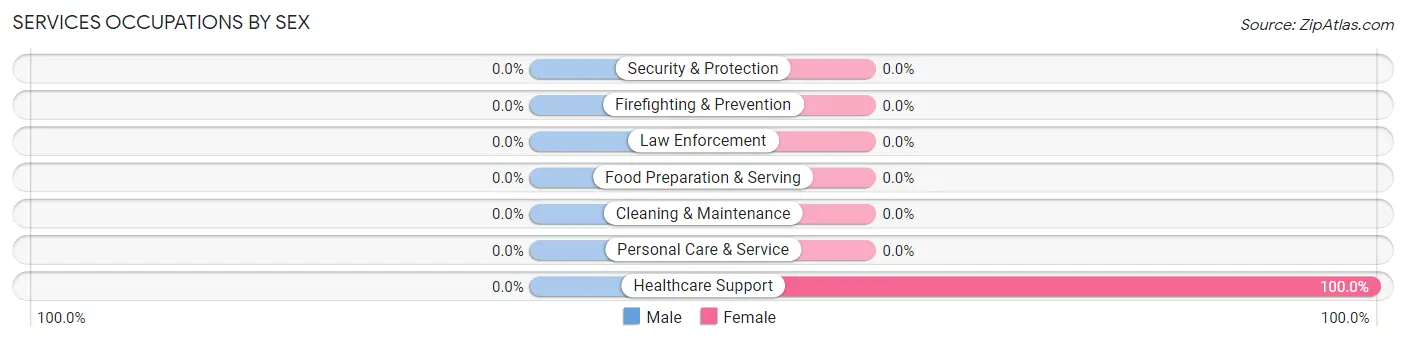
| Occupation | Male | Female |
| Healthcare Support | 0 (0.0%) | 16 (100.0%) |
| Security & Protection | 0 (0.0%) | 0 (0.0%) |
| Firefighting & Prevention | 0 (0.0%) | 0 (0.0%) |
| Law Enforcement | 0 (0.0%) | 0 (0.0%) |
| Food Preparation & Serving | 0 (0.0%) | 0 (0.0%) |
| Cleaning & Maintenance | 0 (0.0%) | 0 (0.0%) |
| Personal Care & Service | 0 (0.0%) | 0 (0.0%) |
| Total (Category) | 0 (0.0%) | 16 (100.0%) |
| Total (Overall) | 185 (54.6%) | 154 (45.4%) |
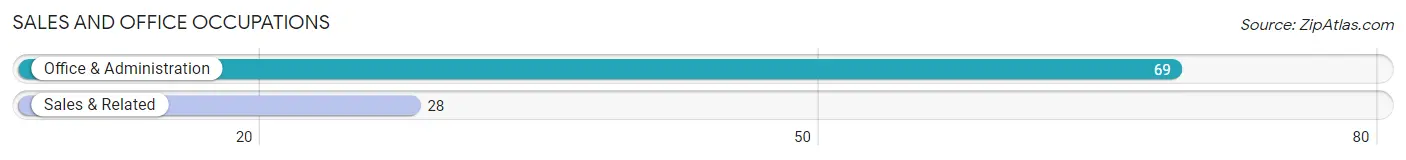
Sales and Office Occupations
The most common Sales and Office occupations in Fulton are Office & Administration (69 | 20.3%), and Sales & Related (28 | 8.3%).
Sales and Office Occupations by Sex
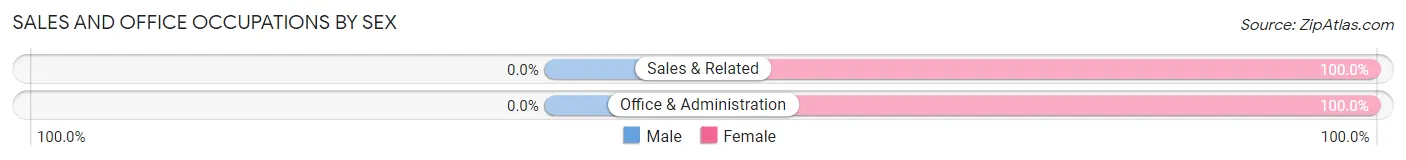
| Occupation | Male | Female |
| Sales & Related | 0 (0.0%) | 28 (100.0%) |
| Office & Administration | 0 (0.0%) | 69 (100.0%) |
| Total (Category) | 0 (0.0%) | 97 (100.0%) |
| Total (Overall) | 185 (54.6%) | 154 (45.4%) |
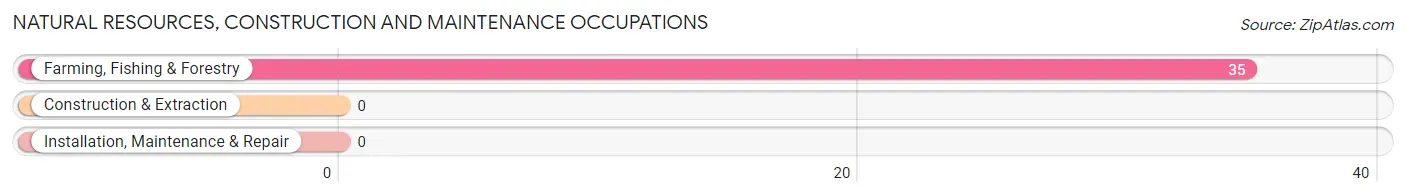
Natural Resources, Construction and Maintenance Occupations
The most common Natural Resources, Construction and Maintenance occupations in Fulton are , and Farming, Fishing & Forestry (35 | 10.3%).
Natural Resources, Construction and Maintenance Occupations by Sex
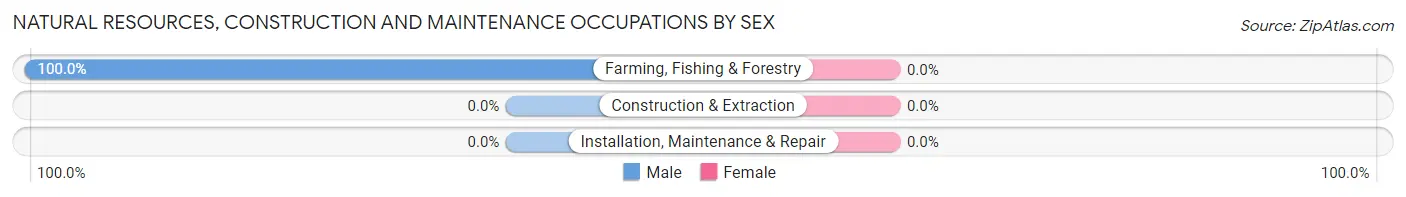
| Occupation | Male | Female |
| Farming, Fishing & Forestry | 35 (100.0%) | 0 (0.0%) |
| Construction & Extraction | 0 (0.0%) | 0 (0.0%) |
| Installation, Maintenance & Repair | 0 (0.0%) | 0 (0.0%) |
| Total (Category) | 35 (100.0%) | 0 (0.0%) |
| Total (Overall) | 185 (54.6%) | 154 (45.4%) |
Production, Transportation and Moving Occupations
The most common Production, Transportation and Moving occupations in Fulton are , and Production (67 | 19.8%).
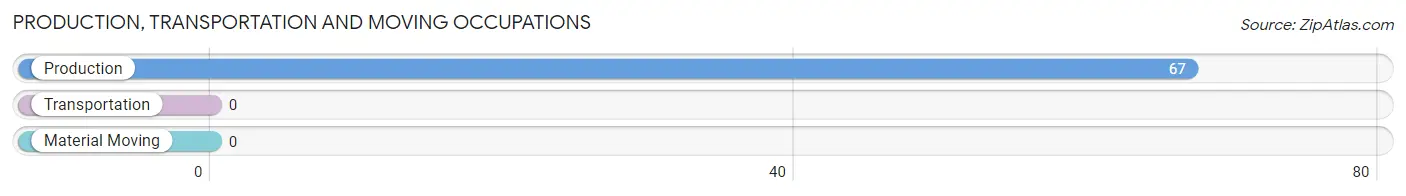
Production, Transportation and Moving Occupations by Sex
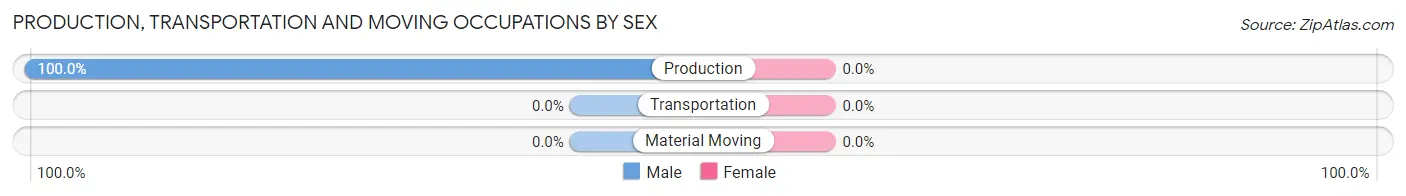
| Occupation | Male | Female |
| Production | 67 (100.0%) | 0 (0.0%) |
| Transportation | 0 (0.0%) | 0 (0.0%) |
| Material Moving | 0 (0.0%) | 0 (0.0%) |
| Total (Category) | 67 (100.0%) | 0 (0.0%) |
| Total (Overall) | 185 (54.6%) | 154 (45.4%) |
Employment Industries by Sex in Fulton
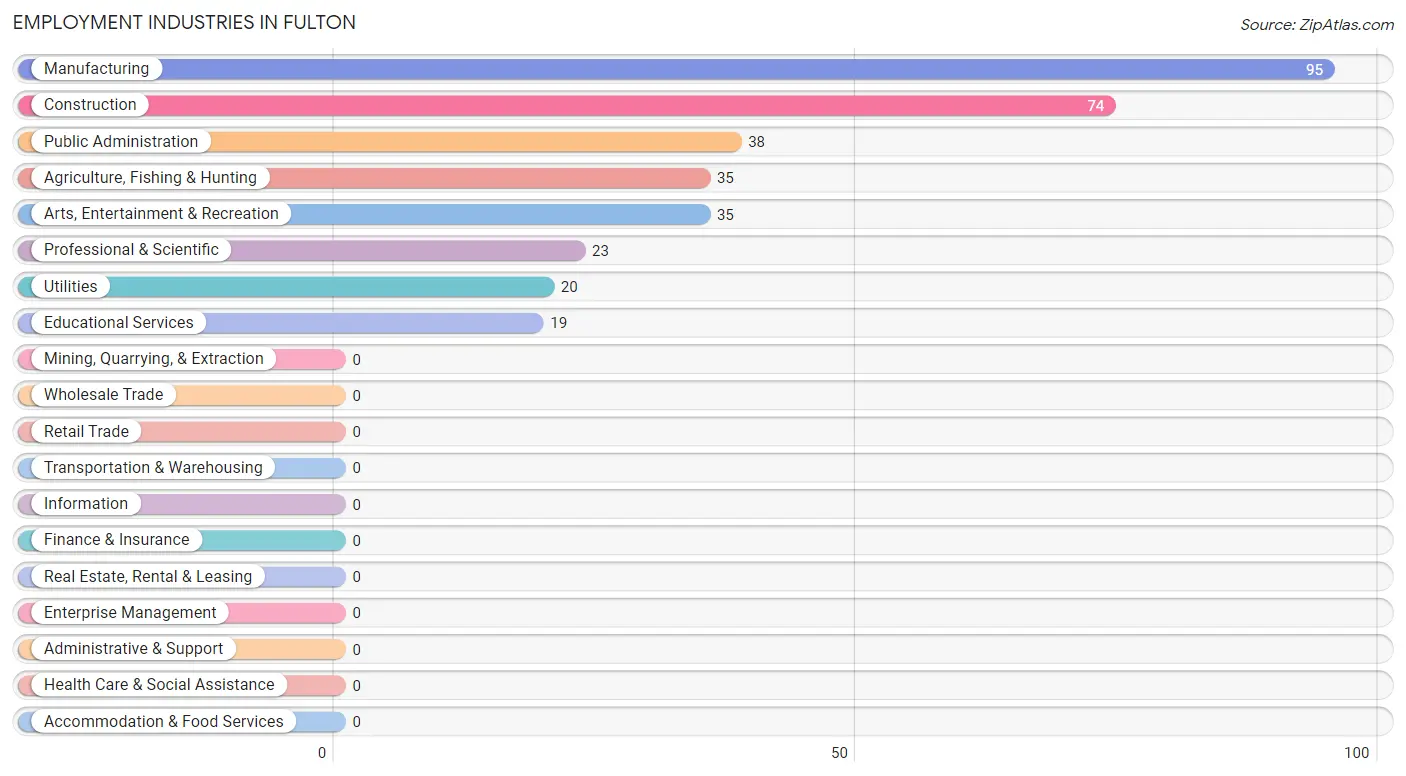
Employment Industries in Fulton
The major employment industries in Fulton include Manufacturing (95 | 28.0%), Construction (74 | 21.8%), Public Administration (38 | 11.2%), Agriculture, Fishing & Hunting (35 | 10.3%), and Arts, Entertainment & Recreation (35 | 10.3%).
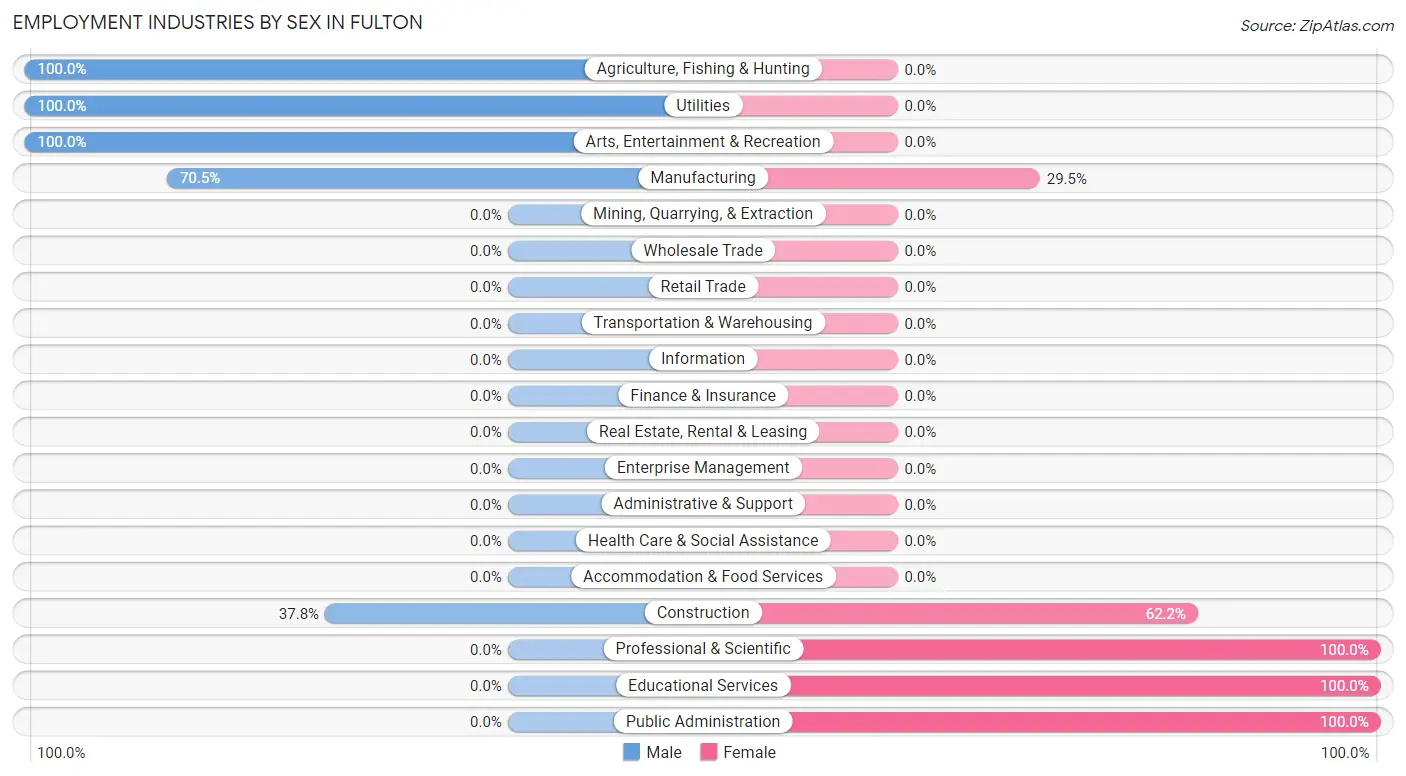
Employment Industries by Sex in Fulton
The Fulton industries that see more men than women are Agriculture, Fishing & Hunting (100.0%), Utilities (100.0%), and Arts, Entertainment & Recreation (100.0%), whereas the industries that tend to have a higher number of women are Professional & Scientific (100.0%), Educational Services (100.0%), and Public Administration (100.0%).
| Industry | Male | Female |
| Agriculture, Fishing & Hunting | 35 (100.0%) | 0 (0.0%) |
| Mining, Quarrying, & Extraction | 0 (0.0%) | 0 (0.0%) |
| Construction | 28 (37.8%) | 46 (62.2%) |
| Manufacturing | 67 (70.5%) | 28 (29.5%) |
| Wholesale Trade | 0 (0.0%) | 0 (0.0%) |
| Retail Trade | 0 (0.0%) | 0 (0.0%) |
| Transportation & Warehousing | 0 (0.0%) | 0 (0.0%) |
| Utilities | 20 (100.0%) | 0 (0.0%) |
| Information | 0 (0.0%) | 0 (0.0%) |
| Finance & Insurance | 0 (0.0%) | 0 (0.0%) |
| Real Estate, Rental & Leasing | 0 (0.0%) | 0 (0.0%) |
| Professional & Scientific | 0 (0.0%) | 23 (100.0%) |
| Enterprise Management | 0 (0.0%) | 0 (0.0%) |
| Administrative & Support | 0 (0.0%) | 0 (0.0%) |
| Educational Services | 0 (0.0%) | 19 (100.0%) |
| Health Care & Social Assistance | 0 (0.0%) | 0 (0.0%) |
| Arts, Entertainment & Recreation | 35 (100.0%) | 0 (0.0%) |
| Accommodation & Food Services | 0 (0.0%) | 0 (0.0%) |
| Public Administration | 0 (0.0%) | 38 (100.0%) |
| Total | 185 (54.6%) | 154 (45.4%) |
Education in Fulton
School Enrollment in Fulton
The most common levels of schooling among the 210 students in Fulton are middle school (67 | 31.9%), college / undergraduate (47 | 22.4%), and elementary school (32 | 15.2%).
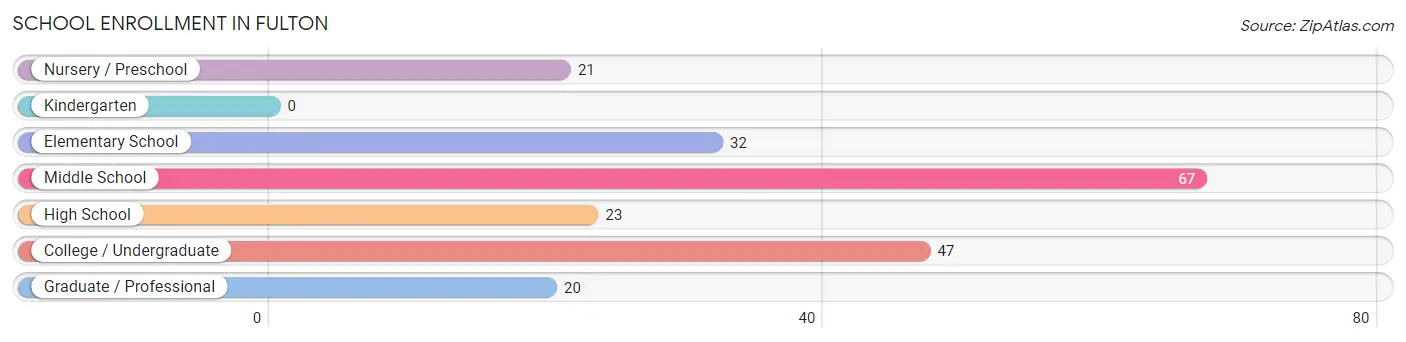
| School Level | # Students | % Students |
| Nursery / Preschool | 21 | 10.0% |
| Kindergarten | 0 | 0.0% |
| Elementary School | 32 | 15.2% |
| Middle School | 67 | 31.9% |
| High School | 23 | 11.0% |
| College / Undergraduate | 47 | 22.4% |
| Graduate / Professional | 20 | 9.5% |
| Total | 210 | 100.0% |
School Enrollment by Age by Funding Source in Fulton
Out of a total of 210 students who are enrolled in schools in Fulton, 67 (31.9%) attend a private institution, while the remaining 143 (68.1%) are enrolled in public schools. The age group of 35 years and over has the highest likelihood of being enrolled in private schools, with 67 (100.0% in the age bracket) enrolled. Conversely, the age group of 5 to 9 year old has the lowest likelihood of being enrolled in a private school, with 53 (100.0% in the age bracket) attending a public institution.
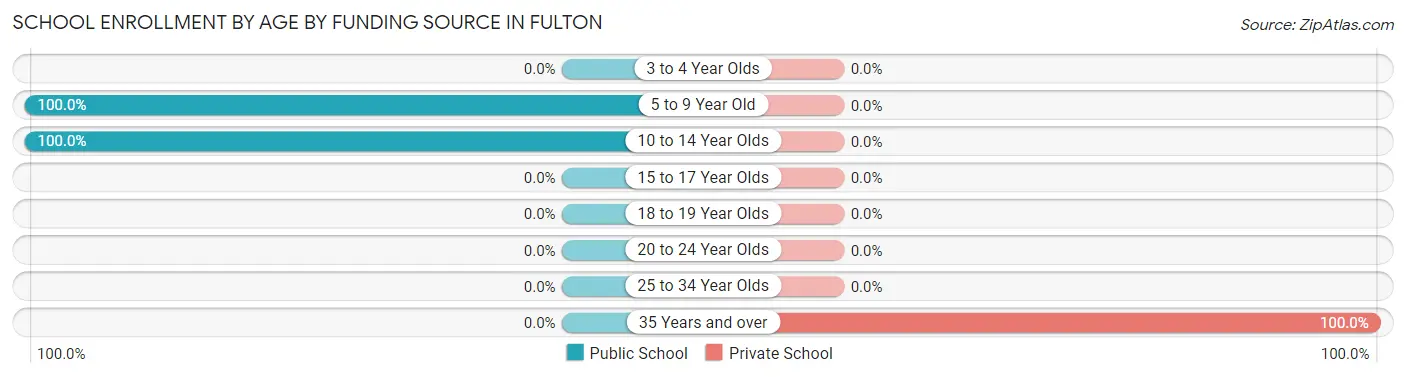
| Age Bracket | Public School | Private School |
| 3 to 4 Year Olds | 0 (0.0%) | 0 (0.0%) |
| 5 to 9 Year Old | 53 (100.0%) | 0 (0.0%) |
| 10 to 14 Year Olds | 90 (100.0%) | 0 (0.0%) |
| 15 to 17 Year Olds | 0 (0.0%) | 0 (0.0%) |
| 18 to 19 Year Olds | 0 (0.0%) | 0 (0.0%) |
| 20 to 24 Year Olds | 0 (0.0%) | 0 (0.0%) |
| 25 to 34 Year Olds | 0 (0.0%) | 0 (0.0%) |
| 35 Years and over | 0 (0.0%) | 67 (100.0%) |
| Total | 143 (68.1%) | 67 (31.9%) |
Educational Attainment by Field of Study in Fulton
Engineering (41 | 27.9%), psychology (39 | 26.5%), bio, nature & agricultural (35 | 23.8%), communications (20 | 13.6%), and visual & performing arts (12 | 8.2%) are the most common fields of study among 147 individuals in Fulton who have obtained a bachelor's degree or higher.
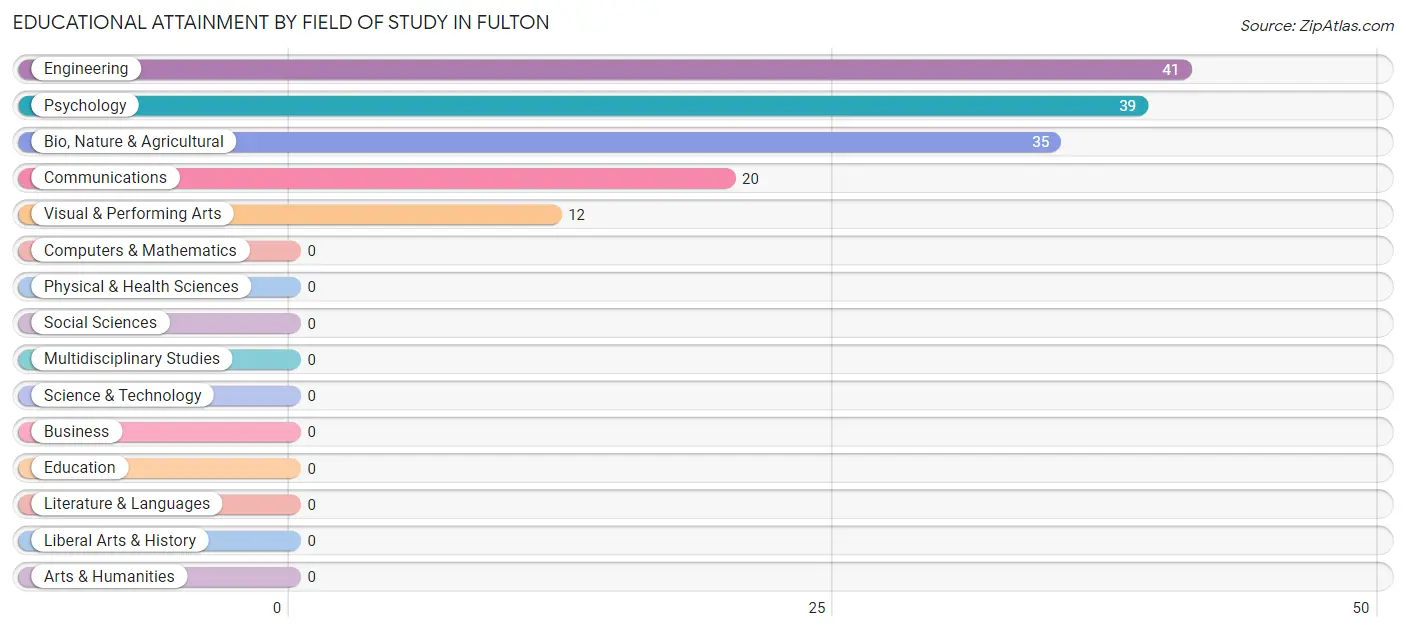
| Field of Study | # Graduates | % Graduates |
| Computers & Mathematics | 0 | 0.0% |
| Bio, Nature & Agricultural | 35 | 23.8% |
| Physical & Health Sciences | 0 | 0.0% |
| Psychology | 39 | 26.5% |
| Social Sciences | 0 | 0.0% |
| Engineering | 41 | 27.9% |
| Multidisciplinary Studies | 0 | 0.0% |
| Science & Technology | 0 | 0.0% |
| Business | 0 | 0.0% |
| Education | 0 | 0.0% |
| Literature & Languages | 0 | 0.0% |
| Liberal Arts & History | 0 | 0.0% |
| Visual & Performing Arts | 12 | 8.2% |
| Communications | 20 | 13.6% |
| Arts & Humanities | 0 | 0.0% |
| Total | 147 | 100.0% |
Transportation & Commute in Fulton
Vehicle Availability by Sex in Fulton
The most prevalent vehicle ownership categories in Fulton are males with 3 vehicles (102, accounting for 55.1%) and females with 3 vehicles (113, making up 66.2%).
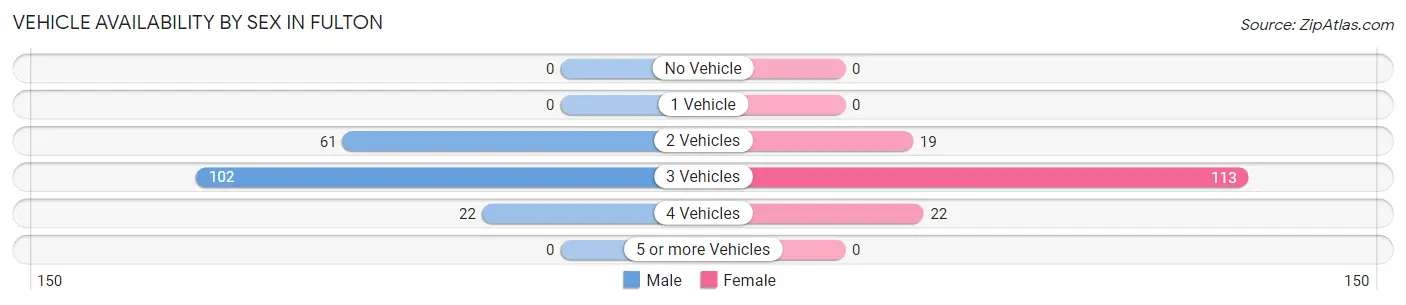
| Vehicles Available | Male | Female |
| No Vehicle | 0 (0.0%) | 0 (0.0%) |
| 1 Vehicle | 0 (0.0%) | 0 (0.0%) |
| 2 Vehicles | 61 (33.0%) | 19 (12.3%) |
| 3 Vehicles | 102 (55.1%) | 113 (73.4%) |
| 4 Vehicles | 22 (11.9%) | 22 (14.3%) |
| 5 or more Vehicles | 0 (0.0%) | 0 (0.0%) |
| Total | 185 (100.0%) | 154 (100.0%) |
Commute Time in Fulton
The most frequently occuring commute durations in Fulton are 15 to 19 minutes (116 commuters, 39.9%), 30 to 34 minutes (50 commuters, 17.2%), and 60 to 89 minutes (47 commuters, 16.2%).
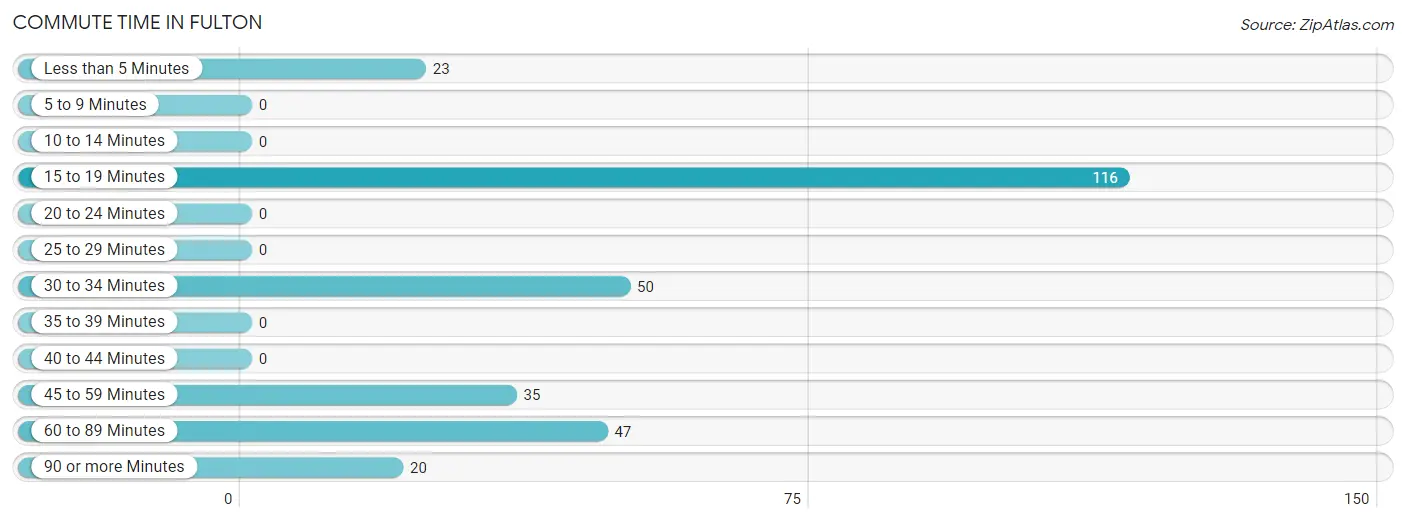
| Commute Time | # Commuters | % Commuters |
| Less than 5 Minutes | 23 | 7.9% |
| 5 to 9 Minutes | 0 | 0.0% |
| 10 to 14 Minutes | 0 | 0.0% |
| 15 to 19 Minutes | 116 | 39.9% |
| 20 to 24 Minutes | 0 | 0.0% |
| 25 to 29 Minutes | 0 | 0.0% |
| 30 to 34 Minutes | 50 | 17.2% |
| 35 to 39 Minutes | 0 | 0.0% |
| 40 to 44 Minutes | 0 | 0.0% |
| 45 to 59 Minutes | 35 | 12.0% |
| 60 to 89 Minutes | 47 | 16.2% |
| 90 or more Minutes | 20 | 6.9% |
Commute Time by Sex in Fulton
The most common commute times in Fulton are 60 to 89 minutes (47 commuters, 27.3%) for males and 15 to 19 minutes (74 commuters, 62.2%) for females.
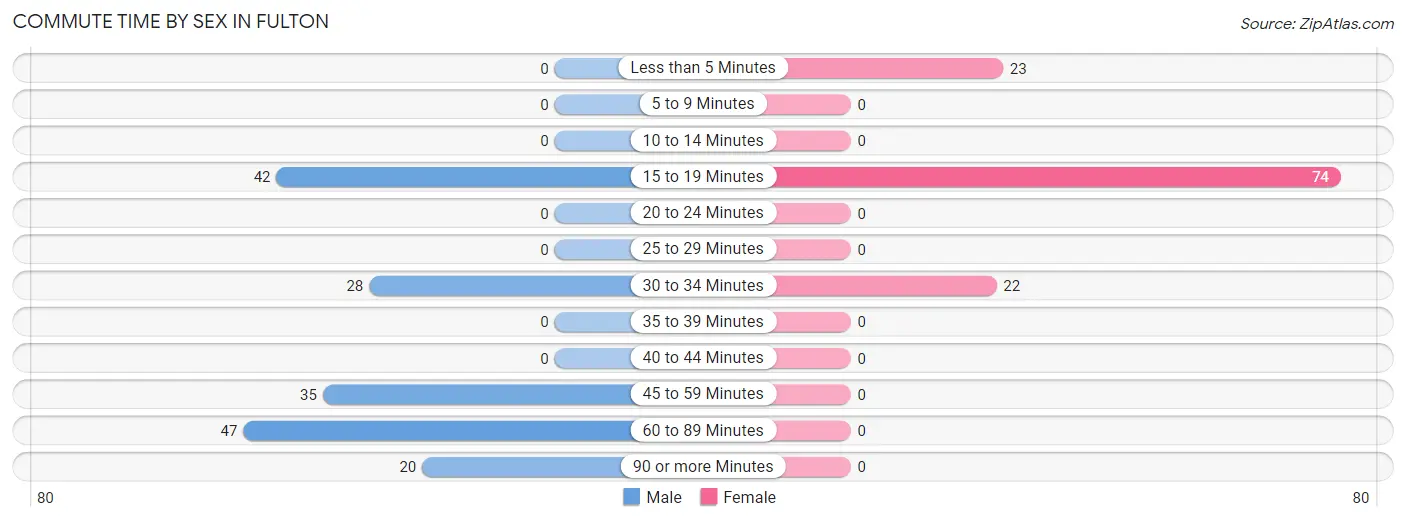
| Commute Time | Male | Female |
| Less than 5 Minutes | 0 (0.0%) | 23 (19.3%) |
| 5 to 9 Minutes | 0 (0.0%) | 0 (0.0%) |
| 10 to 14 Minutes | 0 (0.0%) | 0 (0.0%) |
| 15 to 19 Minutes | 42 (24.4%) | 74 (62.2%) |
| 20 to 24 Minutes | 0 (0.0%) | 0 (0.0%) |
| 25 to 29 Minutes | 0 (0.0%) | 0 (0.0%) |
| 30 to 34 Minutes | 28 (16.3%) | 22 (18.5%) |
| 35 to 39 Minutes | 0 (0.0%) | 0 (0.0%) |
| 40 to 44 Minutes | 0 (0.0%) | 0 (0.0%) |
| 45 to 59 Minutes | 35 (20.3%) | 0 (0.0%) |
| 60 to 89 Minutes | 47 (27.3%) | 0 (0.0%) |
| 90 or more Minutes | 20 (11.6%) | 0 (0.0%) |
Time of Departure to Work by Sex in Fulton
The most frequent times of departure to work in Fulton are 5:30 AM to 5:59 AM (55, 32.0%) for males and 6:30 AM to 6:59 AM (46, 38.7%) for females.
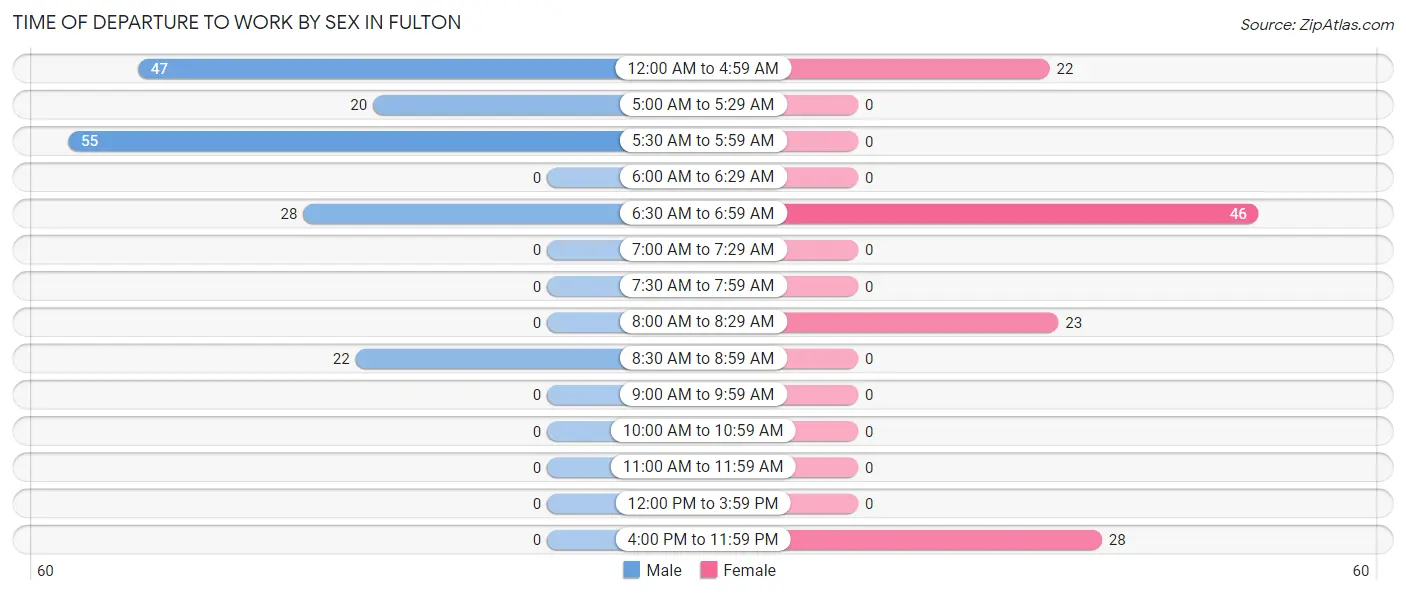
| Time of Departure | Male | Female |
| 12:00 AM to 4:59 AM | 47 (27.3%) | 22 (18.5%) |
| 5:00 AM to 5:29 AM | 20 (11.6%) | 0 (0.0%) |
| 5:30 AM to 5:59 AM | 55 (32.0%) | 0 (0.0%) |
| 6:00 AM to 6:29 AM | 0 (0.0%) | 0 (0.0%) |
| 6:30 AM to 6:59 AM | 28 (16.3%) | 46 (38.7%) |
| 7:00 AM to 7:29 AM | 0 (0.0%) | 0 (0.0%) |
| 7:30 AM to 7:59 AM | 0 (0.0%) | 0 (0.0%) |
| 8:00 AM to 8:29 AM | 0 (0.0%) | 23 (19.3%) |
| 8:30 AM to 8:59 AM | 22 (12.8%) | 0 (0.0%) |
| 9:00 AM to 9:59 AM | 0 (0.0%) | 0 (0.0%) |
| 10:00 AM to 10:59 AM | 0 (0.0%) | 0 (0.0%) |
| 11:00 AM to 11:59 AM | 0 (0.0%) | 0 (0.0%) |
| 12:00 PM to 3:59 PM | 0 (0.0%) | 0 (0.0%) |
| 4:00 PM to 11:59 PM | 0 (0.0%) | 28 (23.5%) |
| Total | 172 (100.0%) | 119 (100.0%) |
Housing Occupancy in Fulton
Occupancy by Ownership in Fulton
Of the total 235 dwellings in Fulton, owner-occupied units account for 207 (88.1%), while renter-occupied units make up 28 (11.9%).
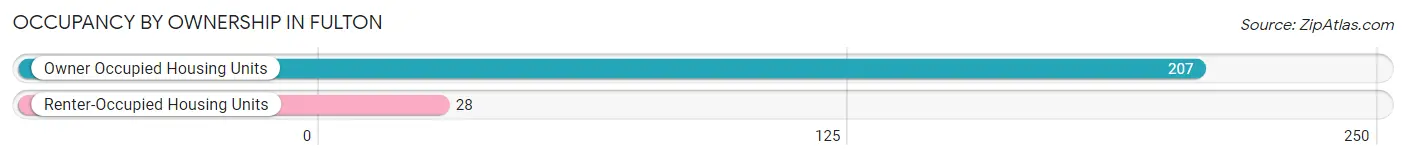
| Occupancy | # Housing Units | % Housing Units |
| Owner Occupied Housing Units | 207 | 88.1% |
| Renter-Occupied Housing Units | 28 | 11.9% |
| Total Occupied Housing Units | 235 | 100.0% |
Occupancy by Household Size in Fulton
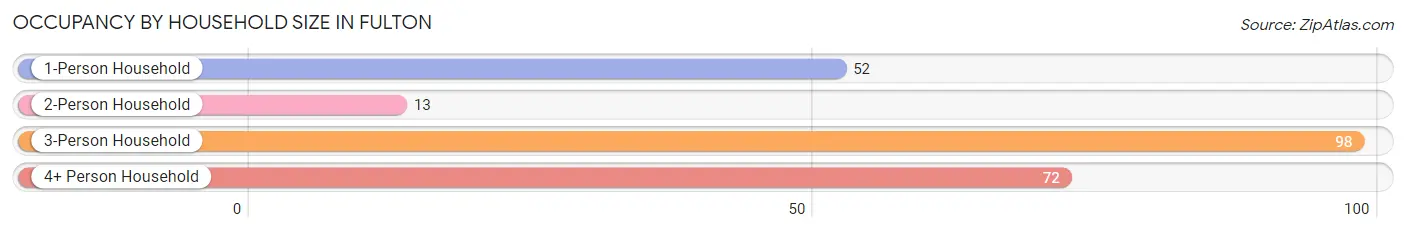
| Household Size | # Housing Units | % Housing Units |
| 1-Person Household | 52 | 22.1% |
| 2-Person Household | 13 | 5.5% |
| 3-Person Household | 98 | 41.7% |
| 4+ Person Household | 72 | 30.6% |
| Total Housing Units | 235 | 100.0% |
Occupancy by Ownership by Household Size in Fulton
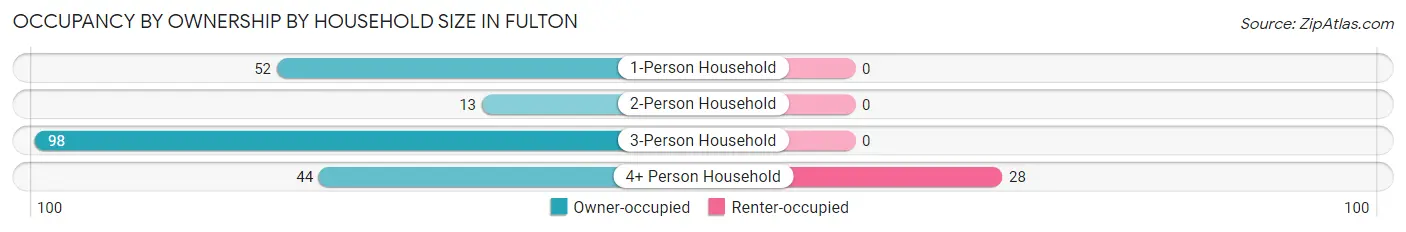
| Household Size | Owner-occupied | Renter-occupied |
| 1-Person Household | 52 (100.0%) | 0 (0.0%) |
| 2-Person Household | 13 (100.0%) | 0 (0.0%) |
| 3-Person Household | 98 (100.0%) | 0 (0.0%) |
| 4+ Person Household | 44 (61.1%) | 28 (38.9%) |
| Total Housing Units | 207 (88.1%) | 28 (11.9%) |
Occupancy by Educational Attainment in Fulton
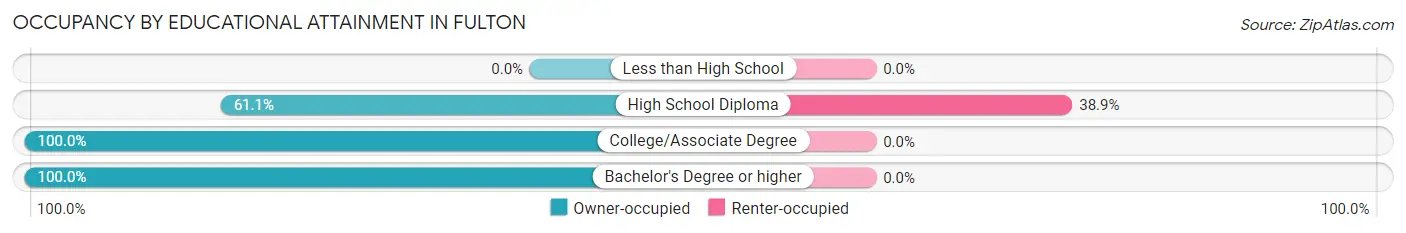
| Household Size | Owner-occupied | Renter-occupied |
| Less than High School | 0 (0.0%) | 0 (0.0%) |
| High School Diploma | 44 (61.1%) | 28 (38.9%) |
| College/Associate Degree | 48 (100.0%) | 0 (0.0%) |
| Bachelor's Degree or higher | 115 (100.0%) | 0 (0.0%) |
Occupancy by Age of Householder in Fulton
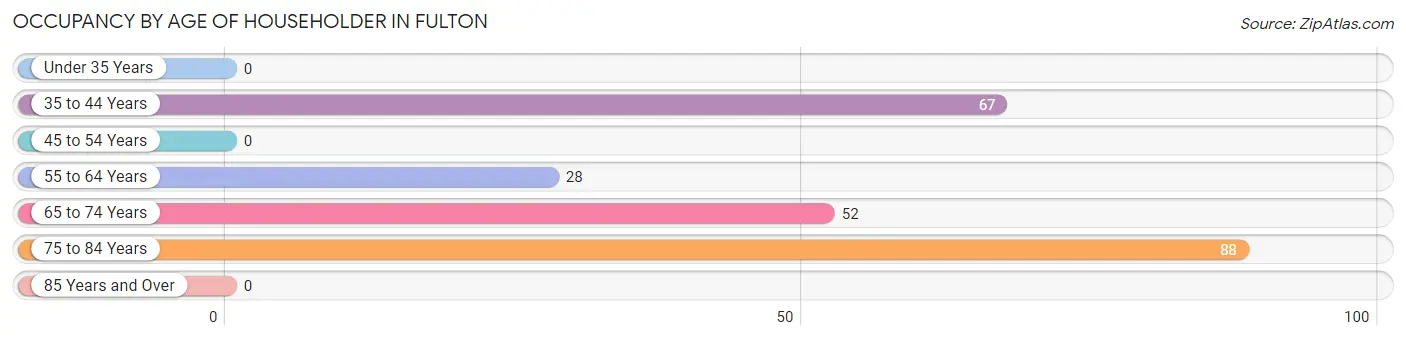
| Age Bracket | # Households | % Households |
| Under 35 Years | 0 | 0.0% |
| 35 to 44 Years | 67 | 28.5% |
| 45 to 54 Years | 0 | 0.0% |
| 55 to 64 Years | 28 | 11.9% |
| 65 to 74 Years | 52 | 22.1% |
| 75 to 84 Years | 88 | 37.4% |
| 85 Years and Over | 0 | 0.0% |
| Total | 235 | 100.0% |
Housing Finances in Fulton
Median Income by Occupancy in Fulton
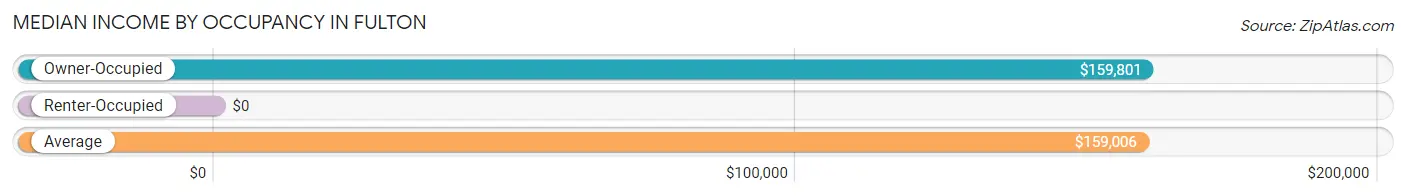
| Occupancy Type | # Households | Median Income |
| Owner-Occupied | 207 (88.1%) | $159,801 |
| Renter-Occupied | 28 (11.9%) | $0 |
| Average | 235 (100.0%) | $159,006 |
Occupancy by Householder Income Bracket in Fulton
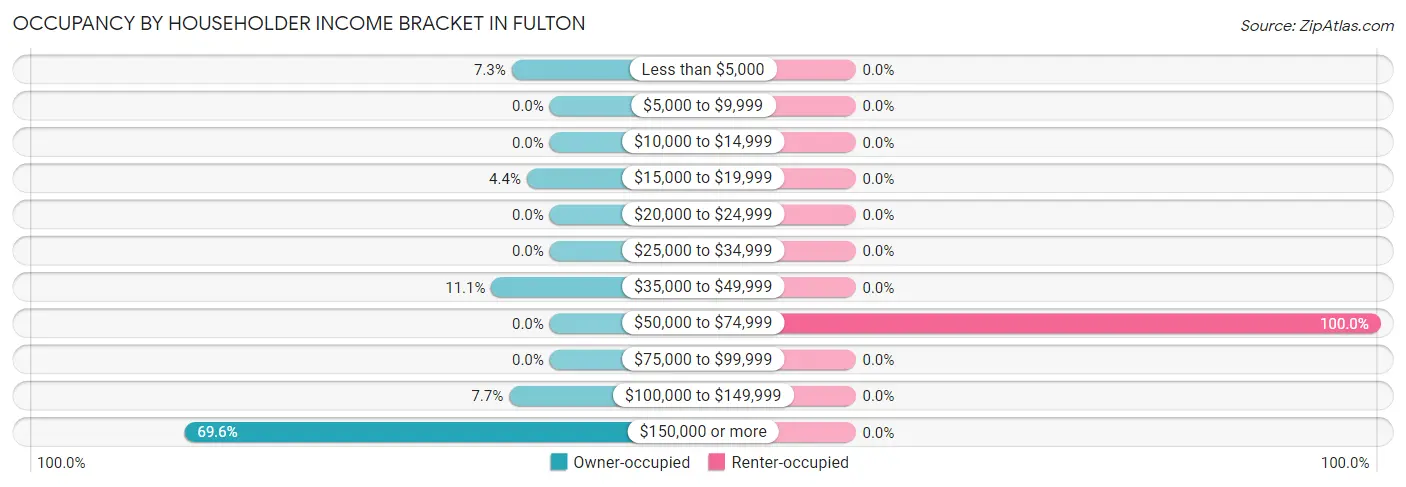
| Income Bracket | Owner-occupied | Renter-occupied |
| Less than $5,000 | 15 (7.2%) | 0 (0.0%) |
| $5,000 to $9,999 | 0 (0.0%) | 0 (0.0%) |
| $10,000 to $14,999 | 0 (0.0%) | 0 (0.0%) |
| $15,000 to $19,999 | 9 (4.3%) | 0 (0.0%) |
| $20,000 to $24,999 | 0 (0.0%) | 0 (0.0%) |
| $25,000 to $34,999 | 0 (0.0%) | 0 (0.0%) |
| $35,000 to $49,999 | 23 (11.1%) | 0 (0.0%) |
| $50,000 to $74,999 | 0 (0.0%) | 28 (100.0%) |
| $75,000 to $99,999 | 0 (0.0%) | 0 (0.0%) |
| $100,000 to $149,999 | 16 (7.7%) | 0 (0.0%) |
| $150,000 or more | 144 (69.6%) | 0 (0.0%) |
| Total | 207 (100.0%) | 28 (100.0%) |
Monthly Housing Cost Tiers in Fulton
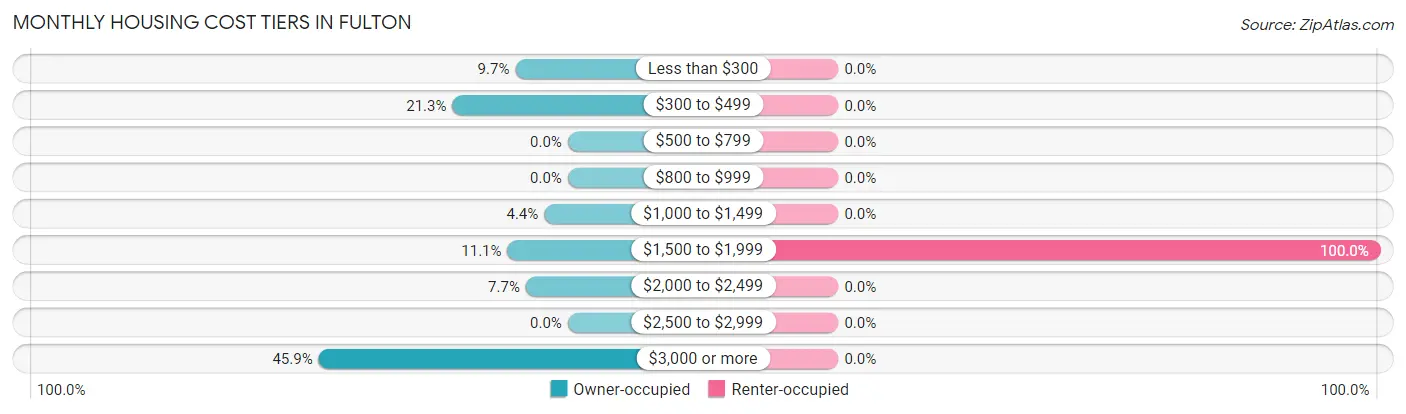
| Monthly Cost | Owner-occupied | Renter-occupied |
| Less than $300 | 20 (9.7%) | 0 (0.0%) |
| $300 to $499 | 44 (21.3%) | 0 (0.0%) |
| $500 to $799 | 0 (0.0%) | 0 (0.0%) |
| $800 to $999 | 0 (0.0%) | 0 (0.0%) |
| $1,000 to $1,499 | 9 (4.3%) | 0 (0.0%) |
| $1,500 to $1,999 | 23 (11.1%) | 28 (100.0%) |
| $2,000 to $2,499 | 16 (7.7%) | 0 (0.0%) |
| $2,500 to $2,999 | 0 (0.0%) | 0 (0.0%) |
| $3,000 or more | 95 (45.9%) | 0 (0.0%) |
| Total | 207 (100.0%) | 28 (100.0%) |
Physical Housing Characteristics in Fulton
Housing Structures in Fulton
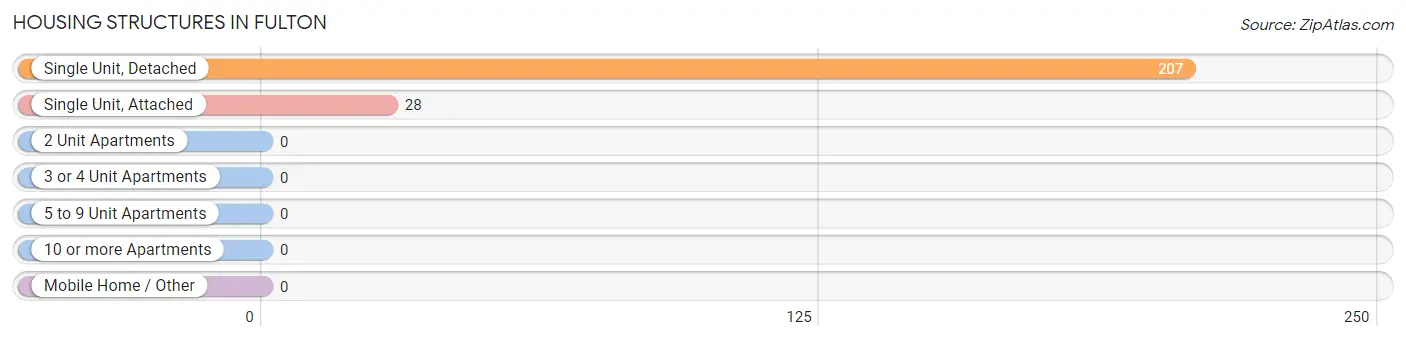
| Structure Type | # Housing Units | % Housing Units |
| Single Unit, Detached | 207 | 88.1% |
| Single Unit, Attached | 28 | 11.9% |
| 2 Unit Apartments | 0 | 0.0% |
| 3 or 4 Unit Apartments | 0 | 0.0% |
| 5 to 9 Unit Apartments | 0 | 0.0% |
| 10 or more Apartments | 0 | 0.0% |
| Mobile Home / Other | 0 | 0.0% |
| Total | 235 | 100.0% |
Housing Structures by Occupancy in Fulton
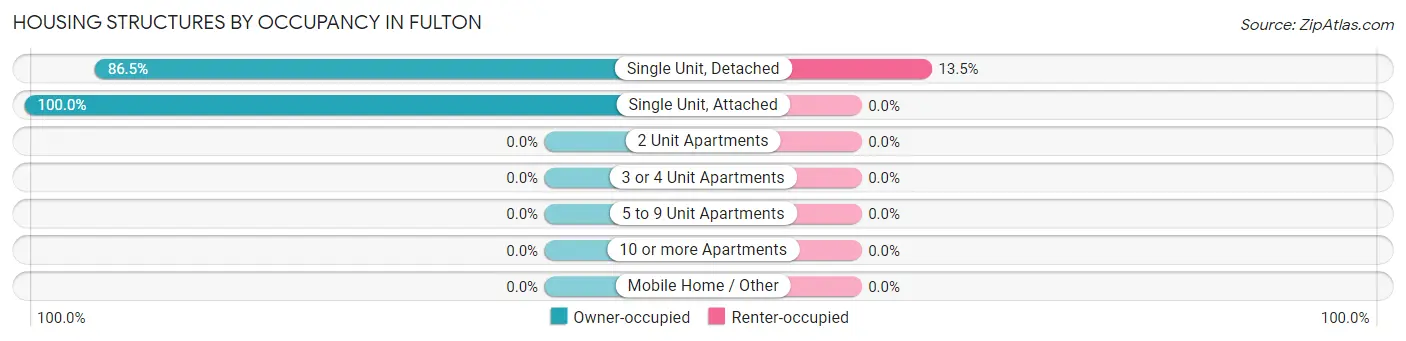
| Structure Type | Owner-occupied | Renter-occupied |
| Single Unit, Detached | 179 (86.5%) | 28 (13.5%) |
| Single Unit, Attached | 28 (100.0%) | 0 (0.0%) |
| 2 Unit Apartments | 0 (0.0%) | 0 (0.0%) |
| 3 or 4 Unit Apartments | 0 (0.0%) | 0 (0.0%) |
| 5 to 9 Unit Apartments | 0 (0.0%) | 0 (0.0%) |
| 10 or more Apartments | 0 (0.0%) | 0 (0.0%) |
| Mobile Home / Other | 0 (0.0%) | 0 (0.0%) |
| Total | 207 (88.1%) | 28 (11.9%) |
Housing Structures by Number of Rooms in Fulton
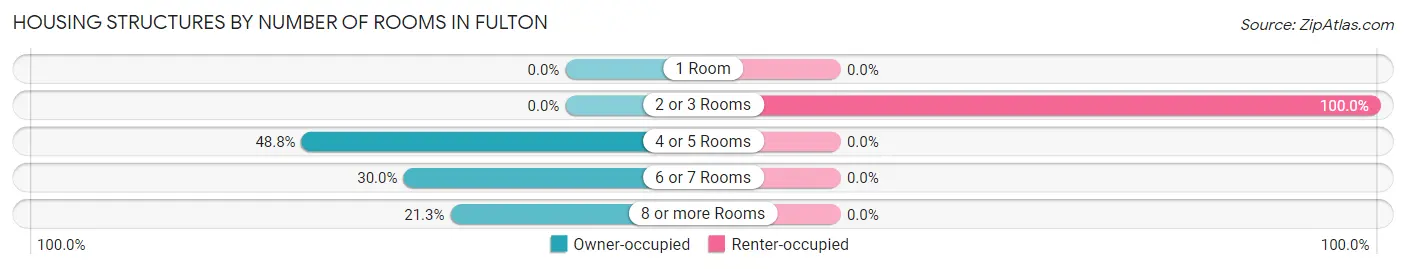
| Number of Rooms | Owner-occupied | Renter-occupied |
| 1 Room | 0 (0.0%) | 0 (0.0%) |
| 2 or 3 Rooms | 0 (0.0%) | 28 (100.0%) |
| 4 or 5 Rooms | 101 (48.8%) | 0 (0.0%) |
| 6 or 7 Rooms | 62 (29.9%) | 0 (0.0%) |
| 8 or more Rooms | 44 (21.3%) | 0 (0.0%) |
| Total | 207 (100.0%) | 28 (100.0%) |
Housing Structure by Heating Type in Fulton
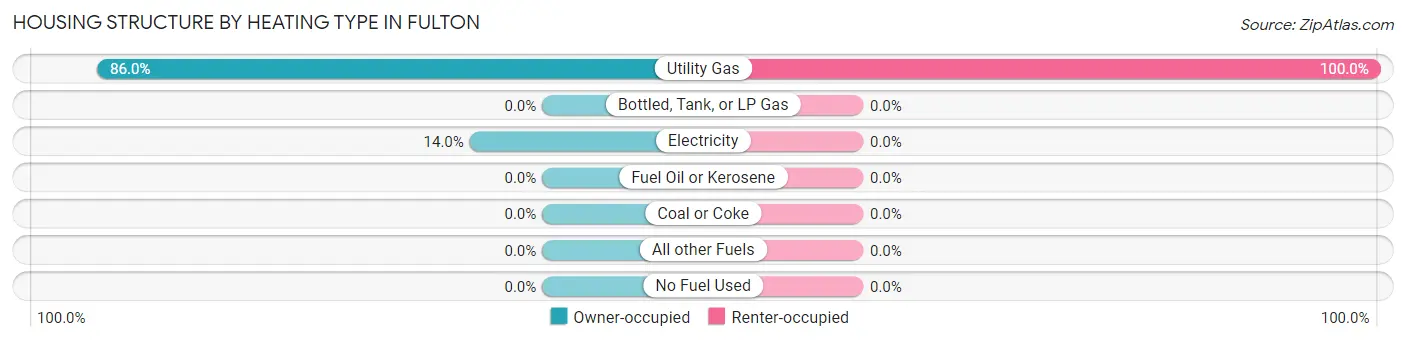
| Heating Type | Owner-occupied | Renter-occupied |
| Utility Gas | 178 (86.0%) | 28 (100.0%) |
| Bottled, Tank, or LP Gas | 0 (0.0%) | 0 (0.0%) |
| Electricity | 29 (14.0%) | 0 (0.0%) |
| Fuel Oil or Kerosene | 0 (0.0%) | 0 (0.0%) |
| Coal or Coke | 0 (0.0%) | 0 (0.0%) |
| All other Fuels | 0 (0.0%) | 0 (0.0%) |
| No Fuel Used | 0 (0.0%) | 0 (0.0%) |
| Total | 207 (100.0%) | 28 (100.0%) |
Household Vehicle Usage in Fulton
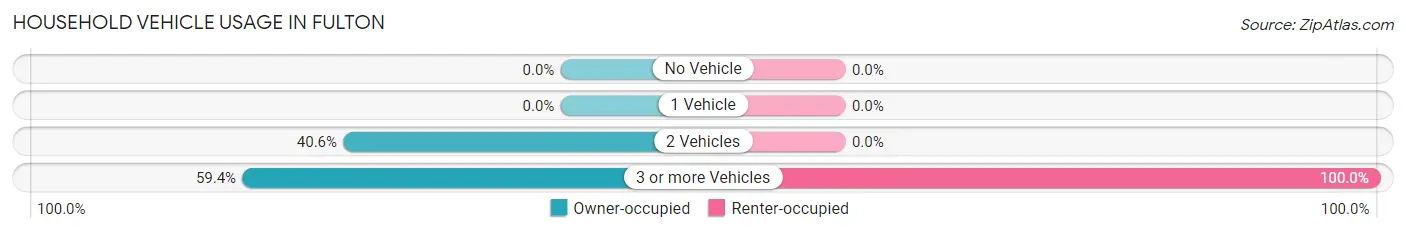
| Vehicles per Household | Owner-occupied | Renter-occupied |
| No Vehicle | 0 (0.0%) | 0 (0.0%) |
| 1 Vehicle | 0 (0.0%) | 0 (0.0%) |
| 2 Vehicles | 84 (40.6%) | 0 (0.0%) |
| 3 or more Vehicles | 123 (59.4%) | 28 (100.0%) |
| Total | 207 (100.0%) | 28 (100.0%) |
Real Estate & Mortgages in Fulton
Real Estate and Mortgage Overview in Fulton
| Characteristic | Without Mortgage | With Mortgage |
| Housing Units | 73 | 134 |
| Median Property Value | $593,800 | $943,000 |
| Median Household Income | $159,063 | $80 |
| Monthly Housing Costs | $438 | $95 |
| Real Estate Taxes | - | - |
Property Value by Mortgage Status in Fulton
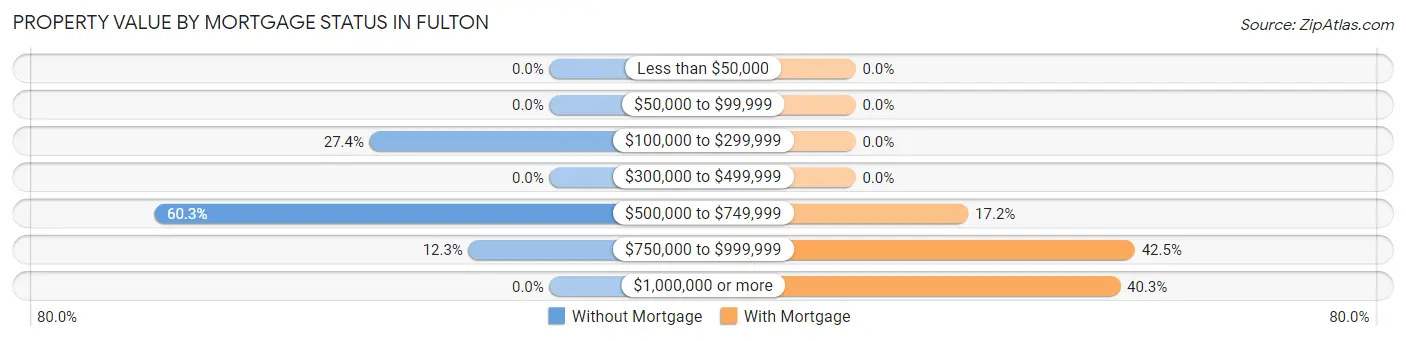
| Property Value | Without Mortgage | With Mortgage |
| Less than $50,000 | 0 (0.0%) | 0 (0.0%) |
| $50,000 to $99,999 | 0 (0.0%) | 0 (0.0%) |
| $100,000 to $299,999 | 20 (27.4%) | 0 (0.0%) |
| $300,000 to $499,999 | 0 (0.0%) | 0 (0.0%) |
| $500,000 to $749,999 | 44 (60.3%) | 23 (17.2%) |
| $750,000 to $999,999 | 9 (12.3%) | 57 (42.5%) |
| $1,000,000 or more | 0 (0.0%) | 54 (40.3%) |
| Total | 73 (100.0%) | 134 (100.0%) |
Household Income by Mortgage Status in Fulton
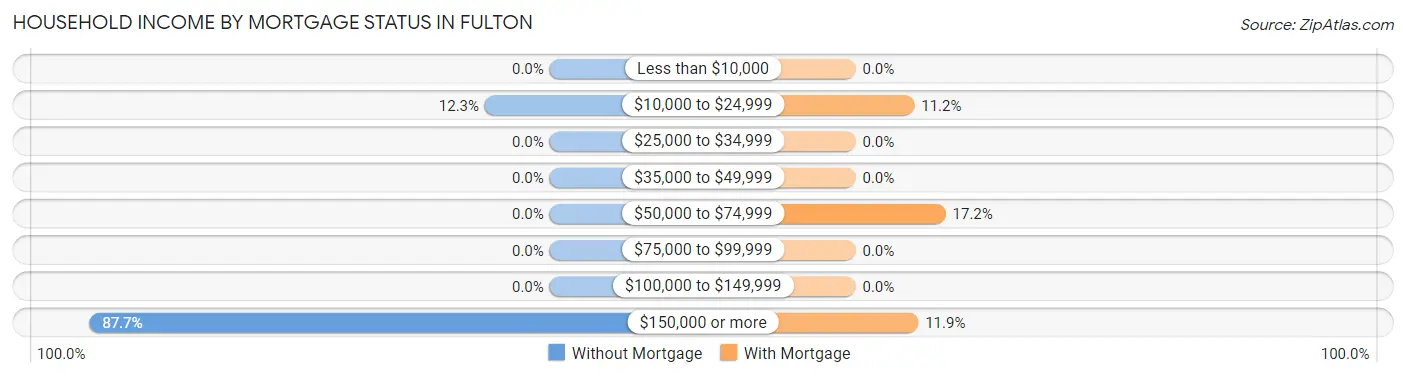
| Household Income | Without Mortgage | With Mortgage |
| Less than $10,000 | 0 (0.0%) | 0 (0.0%) |
| $10,000 to $24,999 | 9 (12.3%) | 15 (11.2%) |
| $25,000 to $34,999 | 0 (0.0%) | 0 (0.0%) |
| $35,000 to $49,999 | 0 (0.0%) | 0 (0.0%) |
| $50,000 to $74,999 | 0 (0.0%) | 23 (17.2%) |
| $75,000 to $99,999 | 0 (0.0%) | 0 (0.0%) |
| $100,000 to $149,999 | 0 (0.0%) | 0 (0.0%) |
| $150,000 or more | 64 (87.7%) | 16 (11.9%) |
| Total | 73 (100.0%) | 134 (100.0%) |
Property Value to Household Income Ratio in Fulton
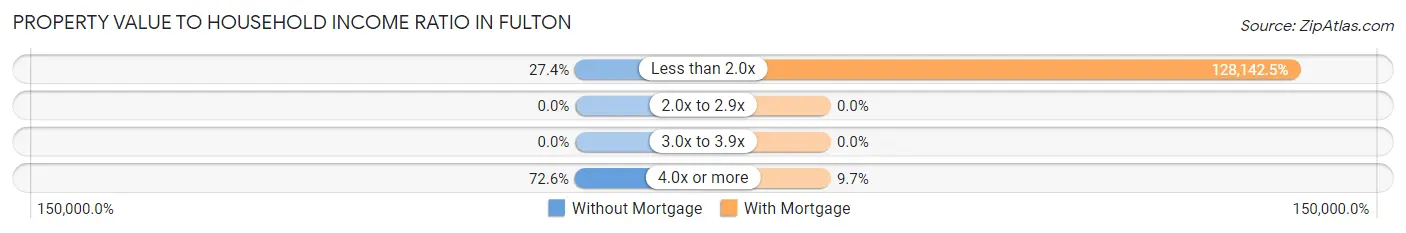
| Value-to-Income Ratio | Without Mortgage | With Mortgage |
| Less than 2.0x | 20 (27.4%) | 171,711 (128,142.5%) |
| 2.0x to 2.9x | 0 (0.0%) | 0 (0.0%) |
| 3.0x to 3.9x | 0 (0.0%) | 0 (0.0%) |
| 4.0x or more | 53 (72.6%) | 13 (9.7%) |
| Total | 73 (100.0%) | 134 (100.0%) |
Real Estate Taxes by Mortgage Status in Fulton
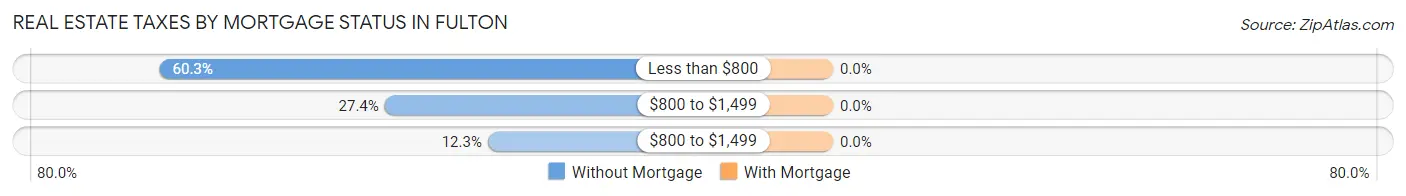
| Property Taxes | Without Mortgage | With Mortgage |
| Less than $800 | 44 (60.3%) | 0 (0.0%) |
| $800 to $1,499 | 20 (27.4%) | 0 (0.0%) |
| $800 to $1,499 | 9 (12.3%) | 0 (0.0%) |
| Total | 73 (100.0%) | 134 (100.0%) |
Health & Disability in Fulton
Health Insurance Coverage by Age in Fulton
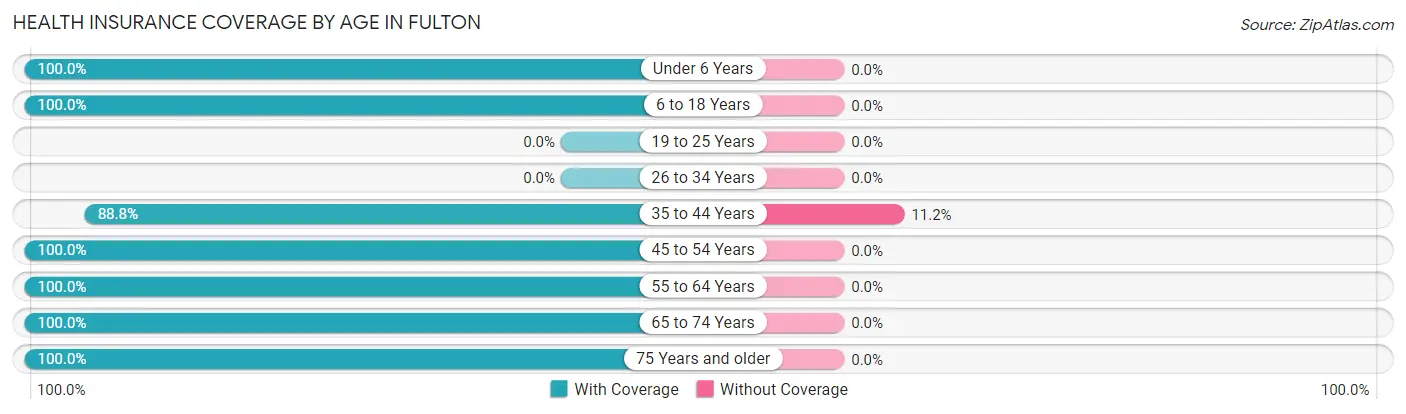
| Age Bracket | With Coverage | Without Coverage |
| Under 6 Years | 51 (100.0%) | 0 (0.0%) |
| 6 to 18 Years | 122 (100.0%) | 0 (0.0%) |
| 19 to 25 Years | 0 (0.0%) | 0 (0.0%) |
| 26 to 34 Years | 0 (0.0%) | 0 (0.0%) |
| 35 to 44 Years | 174 (88.8%) | 22 (11.2%) |
| 45 to 54 Years | 20 (100.0%) | 0 (0.0%) |
| 55 to 64 Years | 143 (100.0%) | 0 (0.0%) |
| 65 to 74 Years | 83 (100.0%) | 0 (0.0%) |
| 75 Years and older | 134 (100.0%) | 0 (0.0%) |
| Total | 727 (97.1%) | 22 (2.9%) |
Health Insurance Coverage by Citizenship Status in Fulton
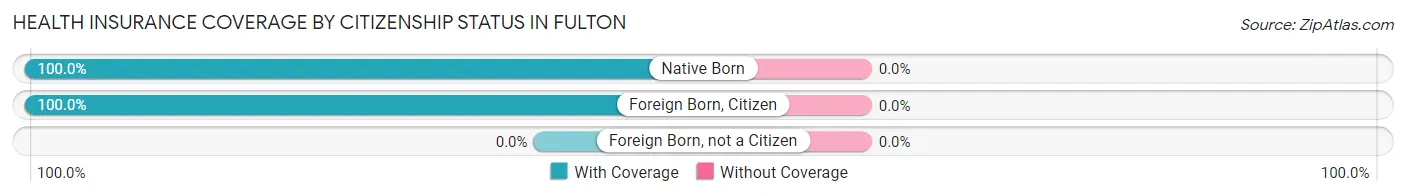
| Citizenship Status | With Coverage | Without Coverage |
| Native Born | 51 (100.0%) | 0 (0.0%) |
| Foreign Born, Citizen | 122 (100.0%) | 0 (0.0%) |
| Foreign Born, not a Citizen | 0 (0.0%) | 0 (0.0%) |
Health Insurance Coverage by Household Income in Fulton
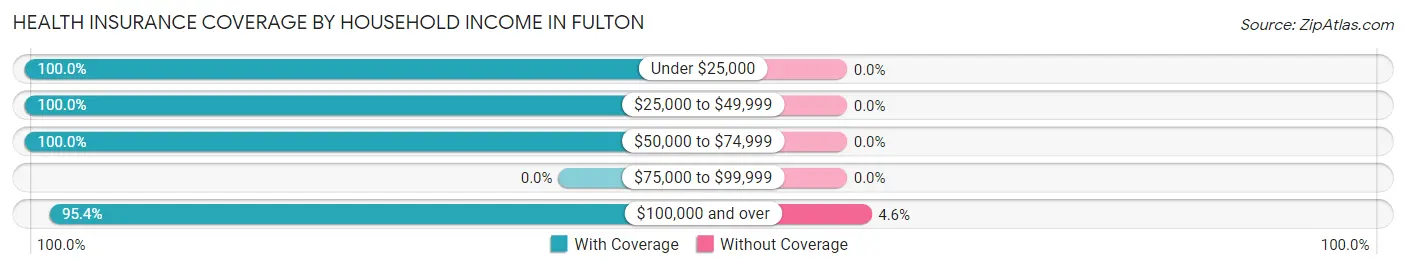
| Household Income | With Coverage | Without Coverage |
| Under $25,000 | 24 (100.0%) | 0 (0.0%) |
| $25,000 to $49,999 | 72 (100.0%) | 0 (0.0%) |
| $50,000 to $74,999 | 162 (100.0%) | 0 (0.0%) |
| $75,000 to $99,999 | 0 (0.0%) | 0 (0.0%) |
| $100,000 and over | 457 (95.4%) | 22 (4.6%) |
Public vs Private Health Insurance Coverage by Age in Fulton
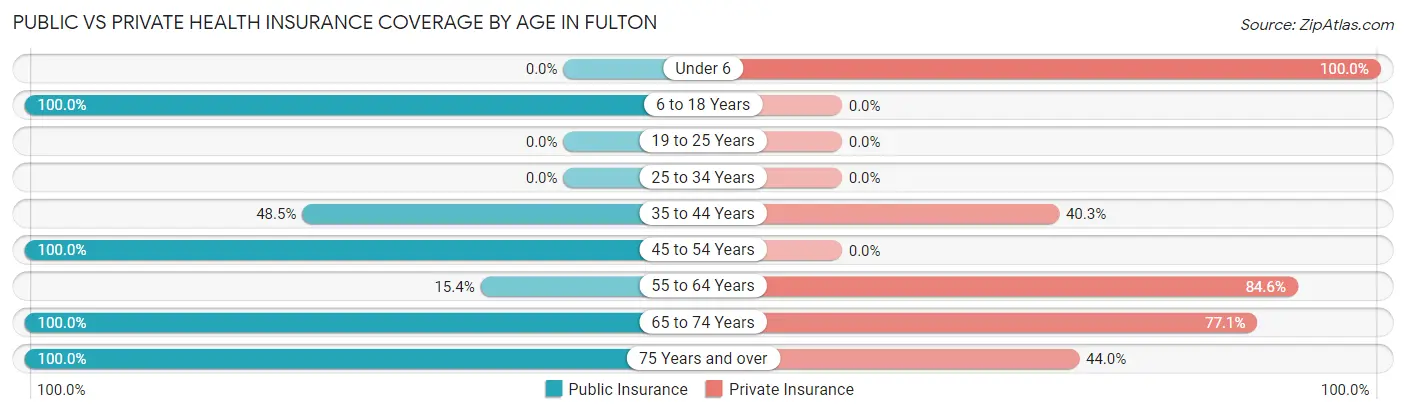
| Age Bracket | Public Insurance | Private Insurance |
| Under 6 | 0 (0.0%) | 51 (100.0%) |
| 6 to 18 Years | 122 (100.0%) | 0 (0.0%) |
| 19 to 25 Years | 0 (0.0%) | 0 (0.0%) |
| 25 to 34 Years | 0 (0.0%) | 0 (0.0%) |
| 35 to 44 Years | 95 (48.5%) | 79 (40.3%) |
| 45 to 54 Years | 20 (100.0%) | 0 (0.0%) |
| 55 to 64 Years | 22 (15.4%) | 121 (84.6%) |
| 65 to 74 Years | 83 (100.0%) | 64 (77.1%) |
| 75 Years and over | 134 (100.0%) | 59 (44.0%) |
| Total | 476 (63.5%) | 374 (49.9%) |
Disability Status by Sex by Age in Fulton
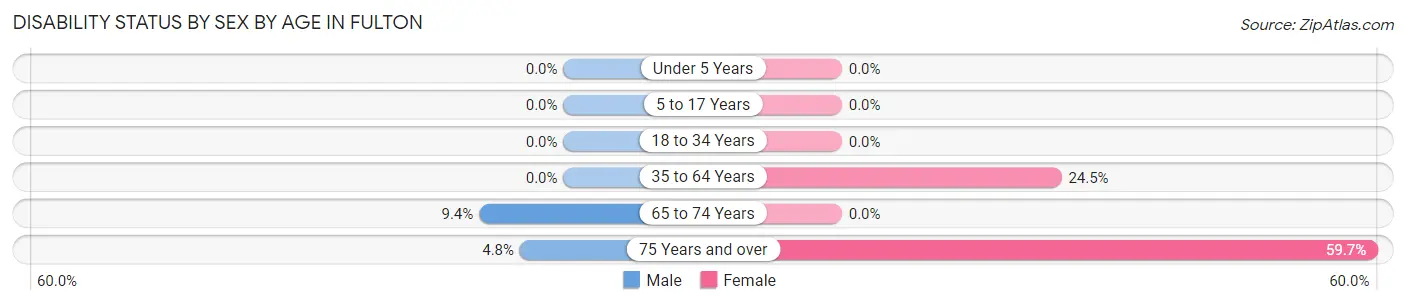
| Age Bracket | Male | Female |
| Under 5 Years | 0 (0.0%) | 0 (0.0%) |
| 5 to 17 Years | 0 (0.0%) | 0 (0.0%) |
| 18 to 34 Years | 0 (0.0%) | 0 (0.0%) |
| 35 to 64 Years | 0 (0.0%) | 45 (24.5%) |
| 65 to 74 Years | 3 (9.4%) | 0 (0.0%) |
| 75 Years and over | 3 (4.8%) | 43 (59.7%) |
Disability Class by Sex by Age in Fulton
Disability Class: Hearing Difficulty
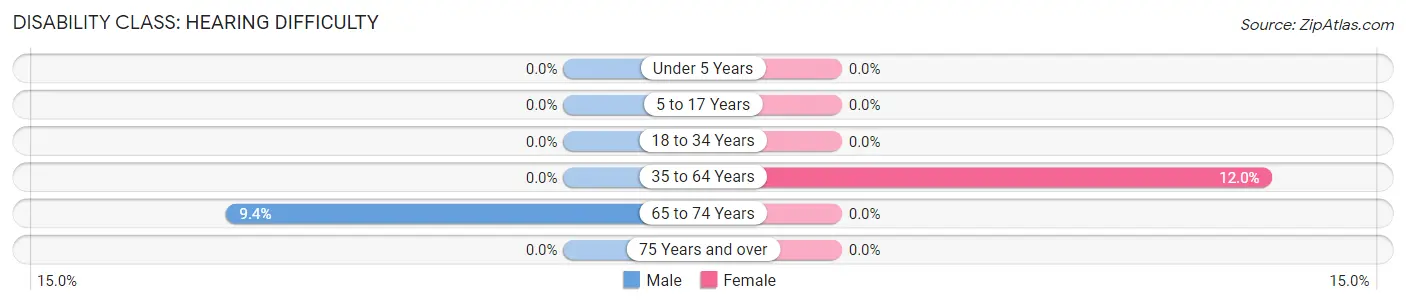
| Age Bracket | Male | Female |
| Under 5 Years | 0 (0.0%) | 0 (0.0%) |
| 5 to 17 Years | 0 (0.0%) | 0 (0.0%) |
| 18 to 34 Years | 0 (0.0%) | 0 (0.0%) |
| 35 to 64 Years | 0 (0.0%) | 22 (12.0%) |
| 65 to 74 Years | 3 (9.4%) | 0 (0.0%) |
| 75 Years and over | 0 (0.0%) | 0 (0.0%) |
Disability Class: Vision Difficulty
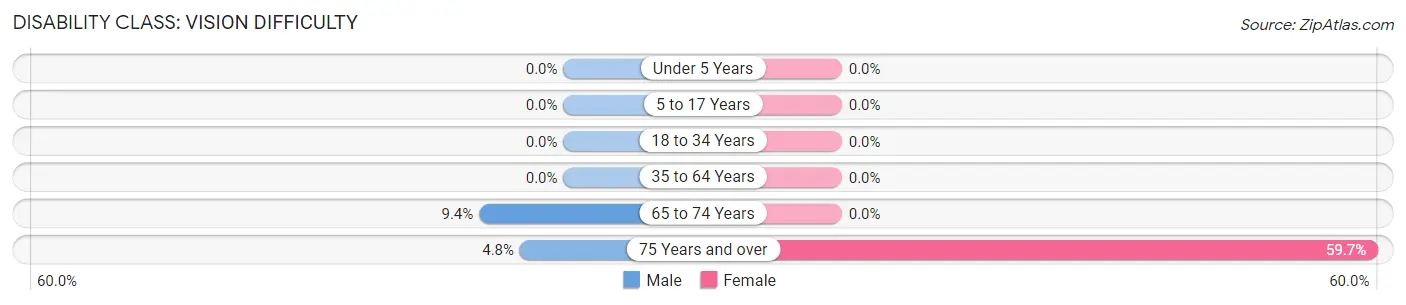
| Age Bracket | Male | Female |
| Under 5 Years | 0 (0.0%) | 0 (0.0%) |
| 5 to 17 Years | 0 (0.0%) | 0 (0.0%) |
| 18 to 34 Years | 0 (0.0%) | 0 (0.0%) |
| 35 to 64 Years | 0 (0.0%) | 0 (0.0%) |
| 65 to 74 Years | 3 (9.4%) | 0 (0.0%) |
| 75 Years and over | 3 (4.8%) | 43 (59.7%) |
Disability Class: Cognitive Difficulty
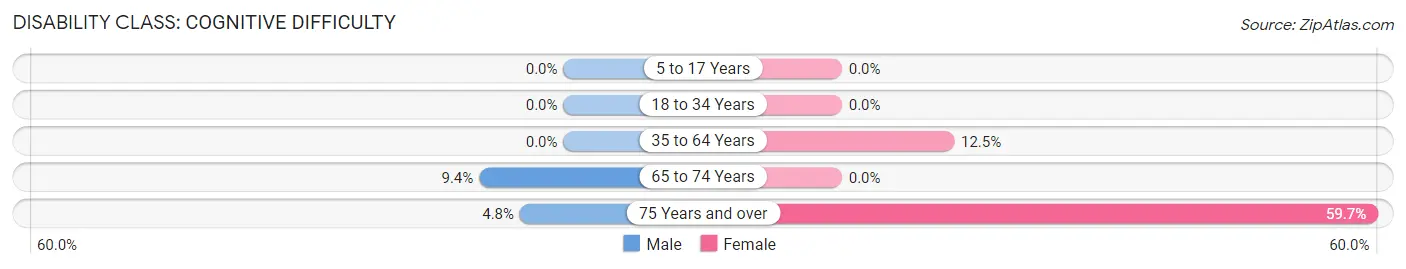
| Age Bracket | Male | Female |
| 5 to 17 Years | 0 (0.0%) | 0 (0.0%) |
| 18 to 34 Years | 0 (0.0%) | 0 (0.0%) |
| 35 to 64 Years | 0 (0.0%) | 23 (12.5%) |
| 65 to 74 Years | 3 (9.4%) | 0 (0.0%) |
| 75 Years and over | 3 (4.8%) | 43 (59.7%) |
Disability Class: Ambulatory Difficulty
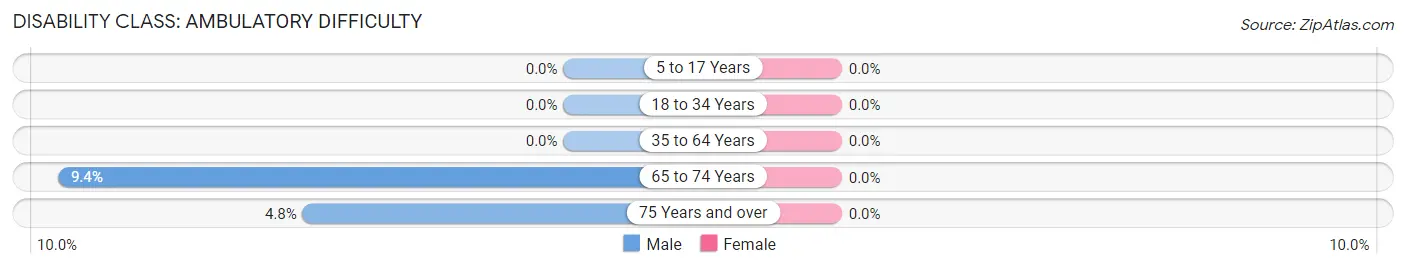
| Age Bracket | Male | Female |
| 5 to 17 Years | 0 (0.0%) | 0 (0.0%) |
| 18 to 34 Years | 0 (0.0%) | 0 (0.0%) |
| 35 to 64 Years | 0 (0.0%) | 0 (0.0%) |
| 65 to 74 Years | 3 (9.4%) | 0 (0.0%) |
| 75 Years and over | 3 (4.8%) | 0 (0.0%) |
Disability Class: Self-Care Difficulty
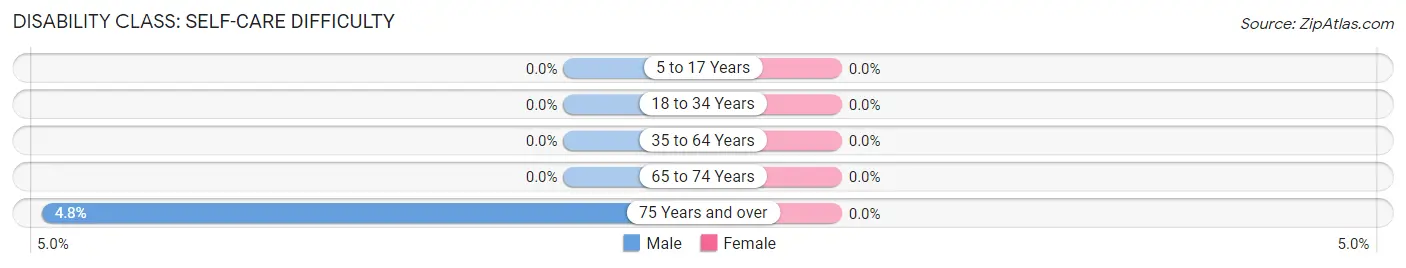
| Age Bracket | Male | Female |
| 5 to 17 Years | 0 (0.0%) | 0 (0.0%) |
| 18 to 34 Years | 0 (0.0%) | 0 (0.0%) |
| 35 to 64 Years | 0 (0.0%) | 0 (0.0%) |
| 65 to 74 Years | 0 (0.0%) | 0 (0.0%) |
| 75 Years and over | 3 (4.8%) | 0 (0.0%) |
Technology Access in Fulton
Computing Device Access in Fulton
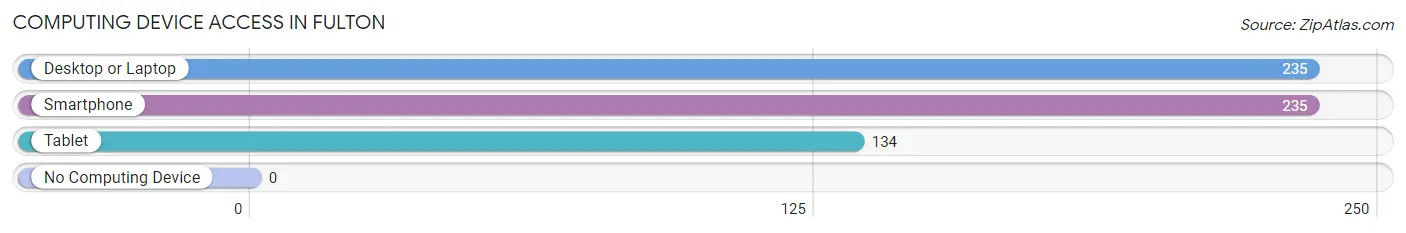
| Device Type | # Households | % Households |
| Desktop or Laptop | 235 | 100.0% |
| Smartphone | 235 | 100.0% |
| Tablet | 134 | 57.0% |
| No Computing Device | 0 | 0.0% |
| Total | 235 | 100.0% |
Internet Access in Fulton
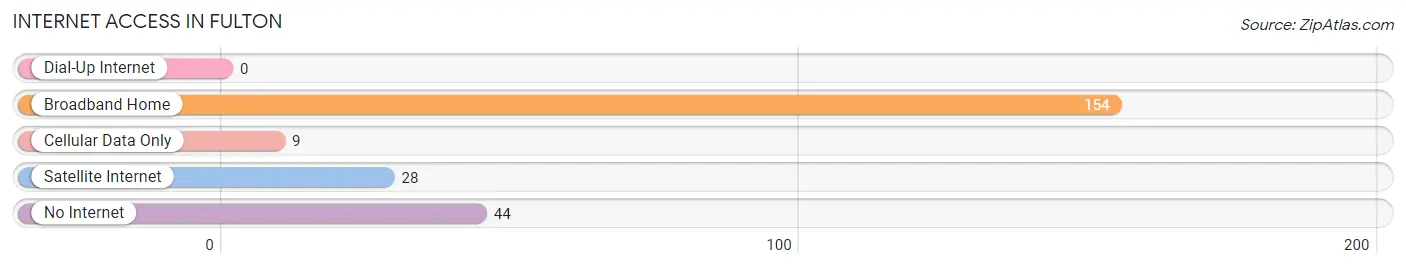
| Internet Type | # Households | % Households |
| Dial-Up Internet | 0 | 0.0% |
| Broadband Home | 154 | 65.5% |
| Cellular Data Only | 9 | 3.8% |
| Satellite Internet | 28 | 11.9% |
| No Internet | 44 | 18.7% |
| Total | 235 | 100.0% |
Fulton Summary
Fulton is a small unincorporated community located in Sonoma County, California. It is situated in the Russian River Valley, approximately 8 miles northwest of the city of Santa Rosa. The population of Fulton was estimated to be 1,845 in 2019.
History
Fulton was originally inhabited by the Pomo people, who lived in the area for thousands of years before the arrival of Europeans. The first Europeans to settle in the area were Russian fur traders, who arrived in the early 19th century. The area was named after John Fulton, an early settler who arrived in 1848.
In the late 19th century, Fulton became a popular destination for vacationers from San Francisco. The area was known for its hot springs, which were believed to have healing properties. The area also became known for its wineries, which began to be established in the late 19th century.
Geography
Fulton is located in the Russian River Valley, approximately 8 miles northwest of the city of Santa Rosa. The area is characterized by rolling hills and vineyards. The climate is Mediterranean, with warm, dry summers and mild, wet winters.
Economy
Fulton is primarily a rural community, with agriculture and tourism being the main sources of income. The area is known for its wineries, which produce a variety of wines, including Chardonnay, Pinot Noir, and Zinfandel. The area is also home to several small businesses, including restaurants, shops, and art galleries.
Demographics
The population of Fulton was estimated to be 1,845 in 2019. The racial makeup of the town was 79.3% White, 0.7% African American, 0.7% Native American, 0.7% Asian, 0.2% Pacific Islander, and 17.5% from other races. The median household income was $63,929, and the median age was 44.
Conclusion
Fulton is a small unincorporated community located in Sonoma County, California. It is situated in the Russian River Valley, approximately 8 miles northwest of the city of Santa Rosa. The population of Fulton was estimated to be 1,845 in 2019. The area is known for its wineries, which produce a variety of wines, and its hot springs, which were believed to have healing properties. The economy of Fulton is primarily based on agriculture and tourism. The racial makeup of the town was 79.3% White, 0.7% African American, 0.7% Native American, 0.7% Asian, 0.2% Pacific Islander, and 17.5% from other races. The median household income was $63,929, and the median age was 44.
Common Questions
What is Per Capita Income in Fulton?
Per Capita income in Fulton is $46,126.
What is the Median Family Income in Fulton?
Median Family Income in Fulton is $151,392.
What is the Median Household income in Fulton?
Median Household Income in Fulton is $159,006.
What is Inequality or Gini Index in Fulton?
Inequality or Gini Index in Fulton is 0.34.
What is the Total Population of Fulton?
Total Population of Fulton is 749.
What is the Total Male Population of Fulton?
Total Male Population of Fulton is 386.
What is the Total Female Population of Fulton?
Total Female Population of Fulton is 363.
What is the Ratio of Males per 100 Females in Fulton?
There are 106.34 Males per 100 Females in Fulton.
What is the Ratio of Females per 100 Males in Fulton?
There are 94.04 Females per 100 Males in Fulton.
What is the Median Population Age in Fulton?
Median Population Age in Fulton is 47.3 Years.
What is the Average Family Size in Fulton
Average Family Size in Fulton is 3.3 People.
What is the Average Household Size in Fulton
Average Household Size in Fulton is 3.1 People.
How Large is the Labor Force in Fulton?
There are 339 People in the Labor Forcein in Fulton.
What is the Percentage of People in the Labor Force in Fulton?
58.9% of People are in the Labor Force in Fulton.