Forestville, CA Map & Demographics
Forestville Map
Forestville Overview
$52,628
PER CAPITA INCOME
$133,333
AVG FAMILY INCOME
$105,536
AVG HOUSEHOLD INCOME
47.2%
WAGE / INCOME GAP [ % ]
52.8¢/ $1
WAGE / INCOME GAP [ $ ]
0.40
INEQUALITY / GINI INDEX
3,632
TOTAL POPULATION
1,830
MALE POPULATION
1,802
FEMALE POPULATION
101.55
MALES / 100 FEMALES
98.47
FEMALES / 100 MALES
45.0
MEDIAN AGE
3.2
AVG FAMILY SIZE
2.4
AVG HOUSEHOLD SIZE
2,068
LABOR FORCE [ PEOPLE ]
66.6%
PERCENT IN LABOR FORCE
3.9%
UNEMPLOYMENT RATE
Forestville Zip Codes
Forestville Area Codes
Income in Forestville
Income Overview in Forestville
Per Capita Income in Forestville is $52,628, while median incomes of families and households are $133,333 and $105,536 respectively.
| Characteristic | Number | Measure |
| Per Capita Income | 3,632 | $52,628 |
| Median Family Income | 800 | $133,333 |
| Mean Family Income | 800 | $143,254 |
| Median Household Income | 1,471 | $105,536 |
| Mean Household Income | 1,471 | $125,475 |
| Income Deficit | 800 | $0 |
| Wage / Income Gap (%) | 3,632 | 47.16% |
| Wage / Income Gap ($) | 3,632 | 52.84¢ per $1 |
| Gini / Inequality Index | 3,632 | 0.40 |
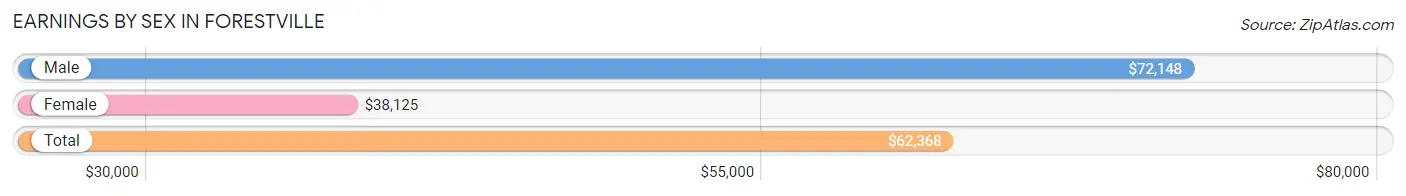
Earnings by Sex in Forestville
Average Earnings in Forestville are $62,368, $72,148 for men and $38,125 for women, a difference of 47.2%.
| Sex | Number | Average Earnings |
| Male | 1,009 (46.8%) | $72,148 |
| Female | 1,145 (53.2%) | $38,125 |
| Total | 2,154 (100.0%) | $62,368 |
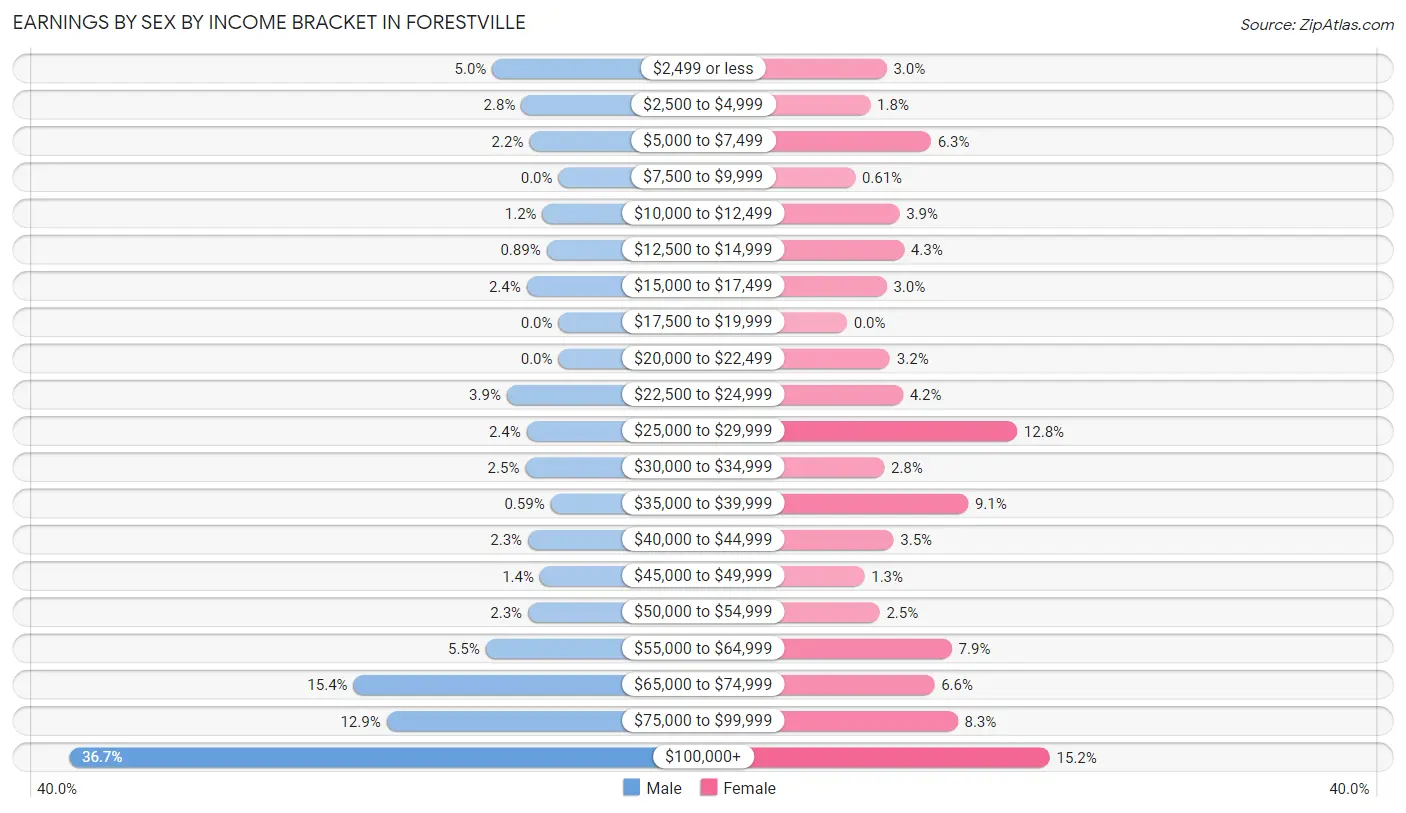
Earnings by Sex by Income Bracket in Forestville
The most common earnings brackets in Forestville are $100,000+ for men (370 | 36.7%) and $100,000+ for women (174 | 15.2%).
| Income | Male | Female |
| $2,499 or less | 50 (5.0%) | 34 (3.0%) |
| $2,500 to $4,999 | 28 (2.8%) | 20 (1.8%) |
| $5,000 to $7,499 | 22 (2.2%) | 72 (6.3%) |
| $7,500 to $9,999 | 0 (0.0%) | 7 (0.6%) |
| $10,000 to $12,499 | 12 (1.2%) | 45 (3.9%) |
| $12,500 to $14,999 | 9 (0.9%) | 49 (4.3%) |
| $15,000 to $17,499 | 24 (2.4%) | 34 (3.0%) |
| $17,500 to $19,999 | 0 (0.0%) | 0 (0.0%) |
| $20,000 to $22,499 | 0 (0.0%) | 37 (3.2%) |
| $22,500 to $24,999 | 39 (3.9%) | 48 (4.2%) |
| $25,000 to $29,999 | 24 (2.4%) | 146 (12.8%) |
| $30,000 to $34,999 | 25 (2.5%) | 32 (2.8%) |
| $35,000 to $39,999 | 6 (0.6%) | 104 (9.1%) |
| $40,000 to $44,999 | 23 (2.3%) | 40 (3.5%) |
| $45,000 to $49,999 | 14 (1.4%) | 15 (1.3%) |
| $50,000 to $54,999 | 23 (2.3%) | 28 (2.5%) |
| $55,000 to $64,999 | 55 (5.4%) | 90 (7.9%) |
| $65,000 to $74,999 | 155 (15.4%) | 75 (6.6%) |
| $75,000 to $99,999 | 130 (12.9%) | 95 (8.3%) |
| $100,000+ | 370 (36.7%) | 174 (15.2%) |
| Total | 1,009 (100.0%) | 1,145 (100.0%) |
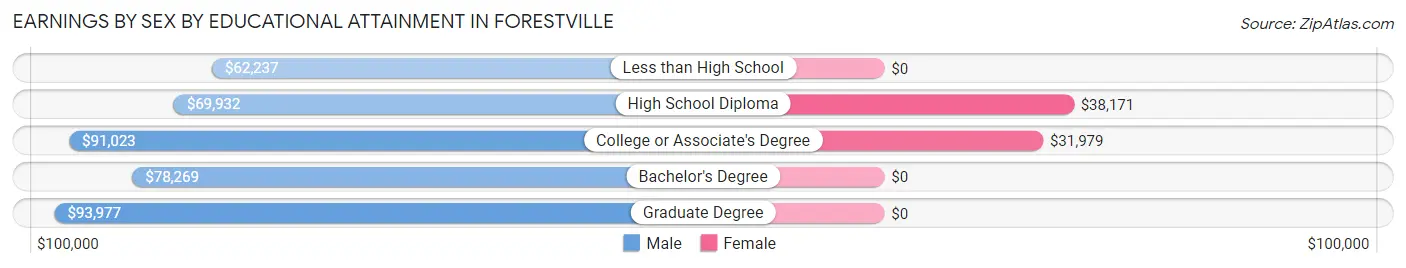
Earnings by Sex by Educational Attainment in Forestville
Average earnings in Forestville are $79,786 for men and $38,159 for women, a difference of 52.2%. Men with an educational attainment of graduate degree enjoy the highest average annual earnings of $93,977, while those with less than high school education earn the least with $62,237. Women with an educational attainment of high school diploma earn the most with the average annual earnings of $38,171, while those with college or associate's degree education have the smallest earnings of $31,979.
| Educational Attainment | Male Income | Female Income |
| Less than High School | $62,237 | $0 |
| High School Diploma | $69,932 | $38,171 |
| College or Associate's Degree | $91,023 | $31,979 |
| Bachelor's Degree | $78,269 | $0 |
| Graduate Degree | $93,977 | $0 |
| Total | $79,786 | $38,159 |
Family Income in Forestville
Family Income Brackets in Forestville
According to the Forestville family income data, there are 180 families falling into the $200,000+ income range, which is the most common income bracket and makes up 22.5% of all families.
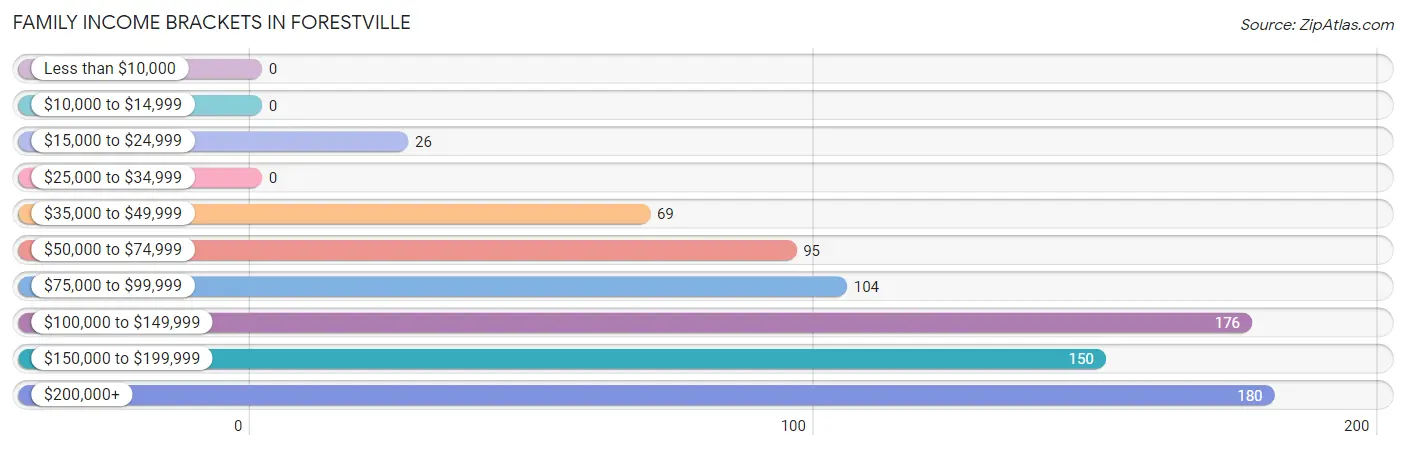
| Income Bracket | # Families | % Families |
| Less than $10,000 | 0 | 0.0% |
| $10,000 to $14,999 | 0 | 0.0% |
| $15,000 to $24,999 | 26 | 3.3% |
| $25,000 to $34,999 | 0 | 0.0% |
| $35,000 to $49,999 | 69 | 8.6% |
| $50,000 to $74,999 | 95 | 11.9% |
| $75,000 to $99,999 | 104 | 13.0% |
| $100,000 to $149,999 | 176 | 22.0% |
| $150,000 to $199,999 | 150 | 18.8% |
| $200,000+ | 180 | 22.5% |
Family Income by Famaliy Size in Forestville
5-person families (104 | 13.0%) account for the highest median family income in Forestville with $158,750 per family, while 2-person families (413 | 51.6%) have the highest median income of $70,052 per family member.
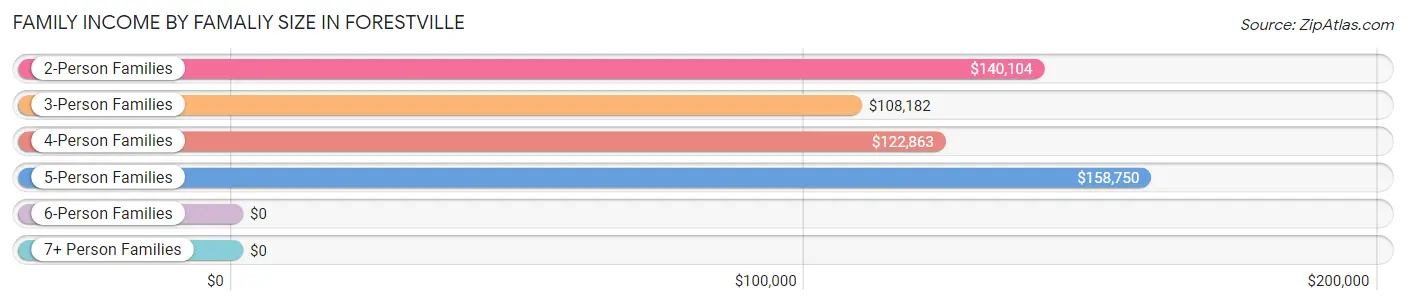
| Income Bracket | # Families | Median Income |
| 2-Person Families | 413 (51.6%) | $140,104 |
| 3-Person Families | 96 (12.0%) | $108,182 |
| 4-Person Families | 165 (20.6%) | $122,863 |
| 5-Person Families | 104 (13.0%) | $158,750 |
| 6-Person Families | 0 (0.0%) | $0 |
| 7+ Person Families | 22 (2.8%) | $0 |
| Total | 800 (100.0%) | $133,333 |
Family Income by Number of Earners in Forestville
The median family income in Forestville is $133,333, with families comprising 3+ earners (140) having the highest median family income of $175,227, while families with no earners (153) have the lowest median family income of $61,008, accounting for 17.5% and 19.1% of families, respectively.
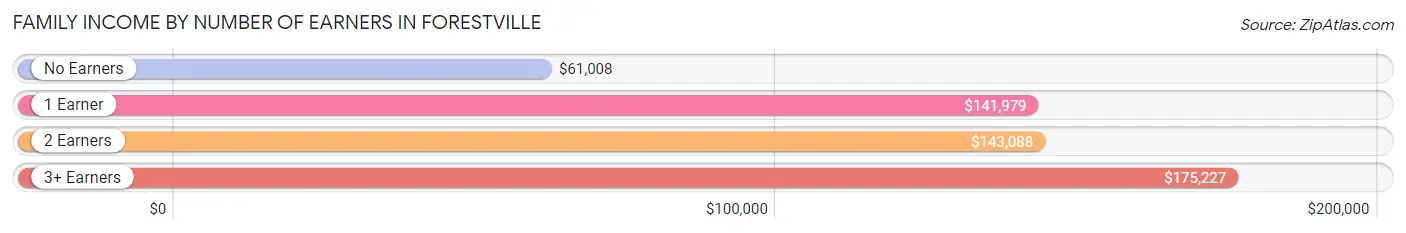
| Number of Earners | # Families | Median Income |
| No Earners | 153 (19.1%) | $61,008 |
| 1 Earner | 83 (10.4%) | $141,979 |
| 2 Earners | 424 (53.0%) | $143,088 |
| 3+ Earners | 140 (17.5%) | $175,227 |
| Total | 800 (100.0%) | $133,333 |
Household Income in Forestville
Household Income Brackets in Forestville
With 297 households falling in the category, the $200,000+ income range is the most frequent in Forestville, accounting for 20.2% of all households. In contrast, only 18 households (1.2%) fall into the less than $10,000 income bracket, making it the least populous group.
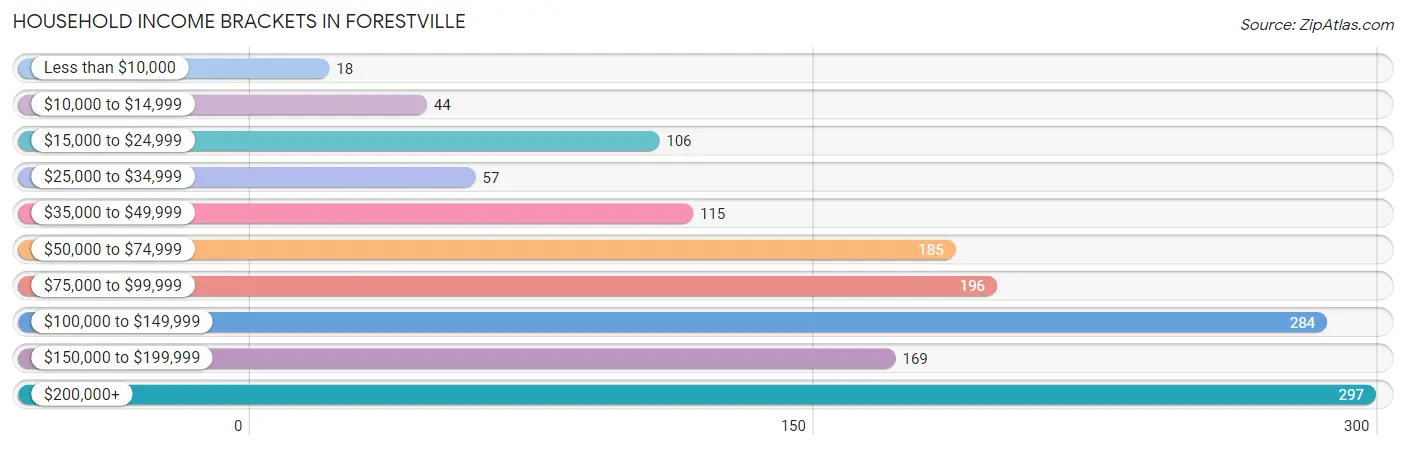
| Income Bracket | # Households | % Households |
| Less than $10,000 | 18 | 1.2% |
| $10,000 to $14,999 | 44 | 3.0% |
| $15,000 to $24,999 | 106 | 7.2% |
| $25,000 to $34,999 | 57 | 3.9% |
| $35,000 to $49,999 | 115 | 7.8% |
| $50,000 to $74,999 | 185 | 12.6% |
| $75,000 to $99,999 | 196 | 13.3% |
| $100,000 to $149,999 | 284 | 19.3% |
| $150,000 to $199,999 | 169 | 11.5% |
| $200,000+ | 297 | 20.2% |
Household Income by Householder Age in Forestville
The median household income in Forestville is $105,536, with the highest median household income of $128,294 found in the 25 to 44 years age bracket for the primary householder. A total of 375 households (25.5%) fall into this category.
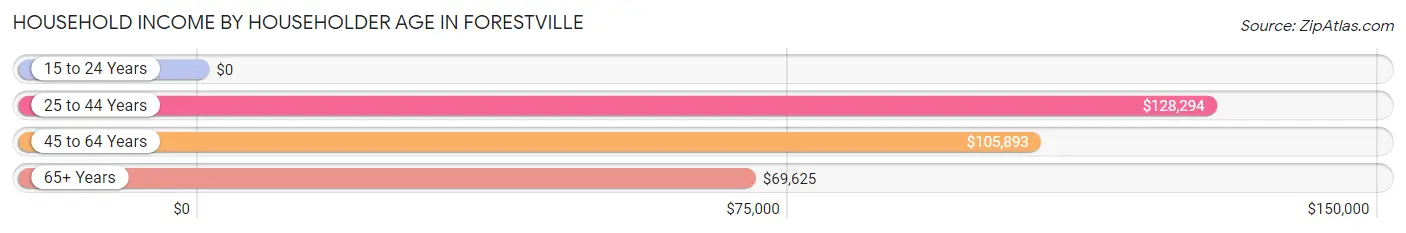
| Income Bracket | # Households | Median Income |
| 15 to 24 Years | 0 (0.0%) | $0 |
| 25 to 44 Years | 375 (25.5%) | $128,294 |
| 45 to 64 Years | 591 (40.2%) | $105,893 |
| 65+ Years | 505 (34.3%) | $69,625 |
| Total | 1,471 (100.0%) | $105,536 |
Poverty in Forestville
Income Below Poverty by Sex and Age in Forestville
With 7.3% poverty level for males and 5.9% for females among the residents of Forestville, 18 to 24 year old males and 55 to 64 year old females are the most vulnerable to poverty, with 36 males (43.9%) and 52 females (14.7%) in their respective age groups living below the poverty level.
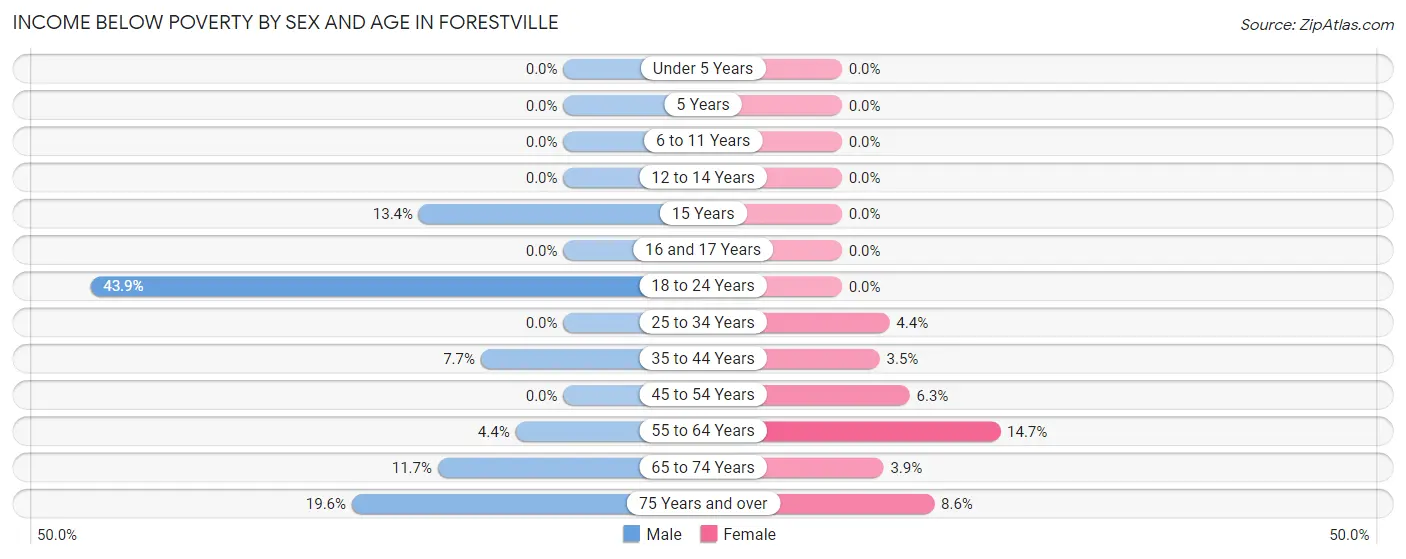
| Age Bracket | Male | Female |
| Under 5 Years | 0 (0.0%) | 0 (0.0%) |
| 5 Years | 0 (0.0%) | 0 (0.0%) |
| 6 to 11 Years | 0 (0.0%) | 0 (0.0%) |
| 12 to 14 Years | 0 (0.0%) | 0 (0.0%) |
| 15 Years | 11 (13.4%) | 0 (0.0%) |
| 16 and 17 Years | 0 (0.0%) | 0 (0.0%) |
| 18 to 24 Years | 36 (43.9%) | 0 (0.0%) |
| 25 to 34 Years | 0 (0.0%) | 8 (4.4%) |
| 35 to 44 Years | 21 (7.7%) | 14 (3.5%) |
| 45 to 54 Years | 0 (0.0%) | 9 (6.3%) |
| 55 to 64 Years | 15 (4.4%) | 52 (14.7%) |
| 65 to 74 Years | 29 (11.7%) | 11 (3.9%) |
| 75 Years and over | 21 (19.6%) | 12 (8.6%) |
| Total | 133 (7.3%) | 106 (5.9%) |
Income Above Poverty by Sex and Age in Forestville
According to the poverty statistics in Forestville, males aged under 5 years and females aged under 5 years are the age groups that are most secure financially, with 100.0% of males and 100.0% of females in these age groups living above the poverty line.
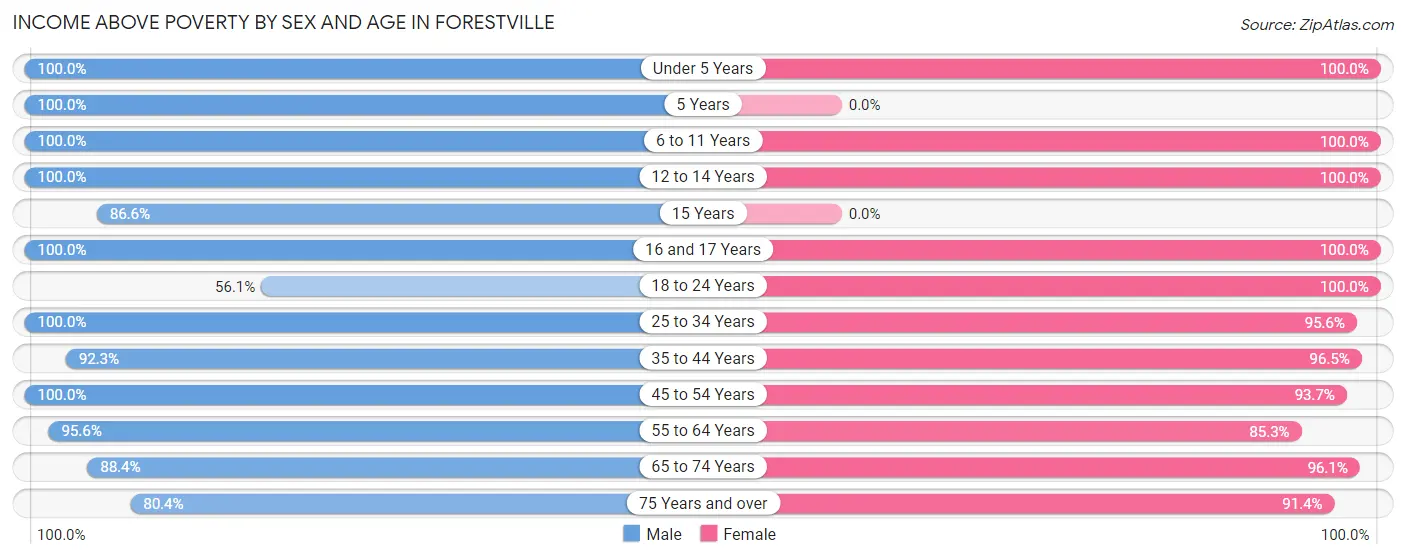
| Age Bracket | Male | Female |
| Under 5 Years | 91 (100.0%) | 41 (100.0%) |
| 5 Years | 16 (100.0%) | 0 (0.0%) |
| 6 to 11 Years | 59 (100.0%) | 90 (100.0%) |
| 12 to 14 Years | 51 (100.0%) | 97 (100.0%) |
| 15 Years | 71 (86.6%) | 0 (0.0%) |
| 16 and 17 Years | 68 (100.0%) | 54 (100.0%) |
| 18 to 24 Years | 46 (56.1%) | 19 (100.0%) |
| 25 to 34 Years | 214 (100.0%) | 173 (95.6%) |
| 35 to 44 Years | 253 (92.3%) | 385 (96.5%) |
| 45 to 54 Years | 199 (100.0%) | 134 (93.7%) |
| 55 to 64 Years | 323 (95.6%) | 302 (85.3%) |
| 65 to 74 Years | 220 (88.3%) | 273 (96.1%) |
| 75 Years and over | 86 (80.4%) | 128 (91.4%) |
| Total | 1,697 (92.7%) | 1,696 (94.1%) |
Income Below Poverty Among Married-Couple Families in Forestville
The poverty statistics for married-couple families in Forestville show that 2.3% or 15 of the total 664 families live below the poverty line. Families with no children have the highest poverty rate of 3.8%, comprising of 15 families. On the other hand, families with 1 or 2 children have the lowest poverty rate of 0.0%, which includes 0 families.
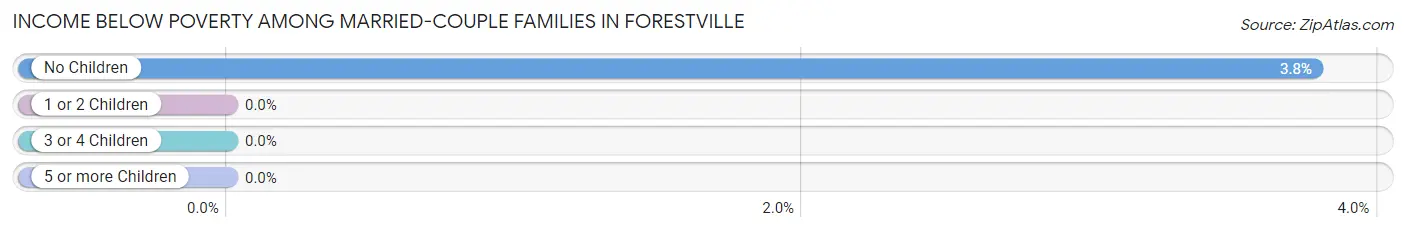
| Children | Above Poverty | Below Poverty |
| No Children | 382 (96.2%) | 15 (3.8%) |
| 1 or 2 Children | 222 (100.0%) | 0 (0.0%) |
| 3 or 4 Children | 45 (100.0%) | 0 (0.0%) |
| 5 or more Children | 0 (0.0%) | 0 (0.0%) |
| Total | 649 (97.7%) | 15 (2.3%) |
Income Below Poverty Among Single-Parent Households in Forestville
| Children | Single Father | Single Mother |
| No Children | 0 (0.0%) | 0 (0.0%) |
| 1 or 2 Children | 0 (0.0%) | 0 (0.0%) |
| 3 or 4 Children | 0 (0.0%) | 0 (0.0%) |
| 5 or more Children | 0 (0.0%) | 0 (0.0%) |
| Total | 0 (0.0%) | 0 (0.0%) |
Income Below Poverty Among Married-Couple vs Single-Parent Households in Forestville
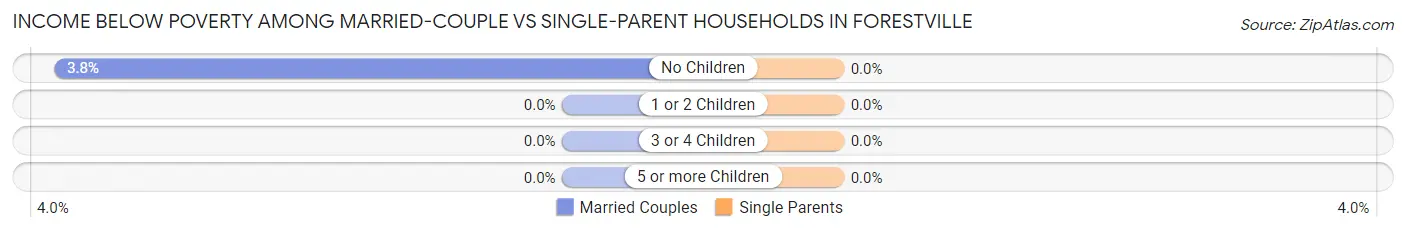
| Children | Married-Couple Families | Single-Parent Households |
| No Children | 15 (3.8%) | 0 (0.0%) |
| 1 or 2 Children | 0 (0.0%) | 0 (0.0%) |
| 3 or 4 Children | 0 (0.0%) | 0 (0.0%) |
| 5 or more Children | 0 (0.0%) | 0 (0.0%) |
| Total | 15 (2.3%) | 0 (0.0%) |
Race in Forestville
The most populous races in Forestville are White / Caucasian (2,912 | 80.2%), Hispanic or Latino (297 | 8.2%), and Two or more Races (265 | 7.3%).
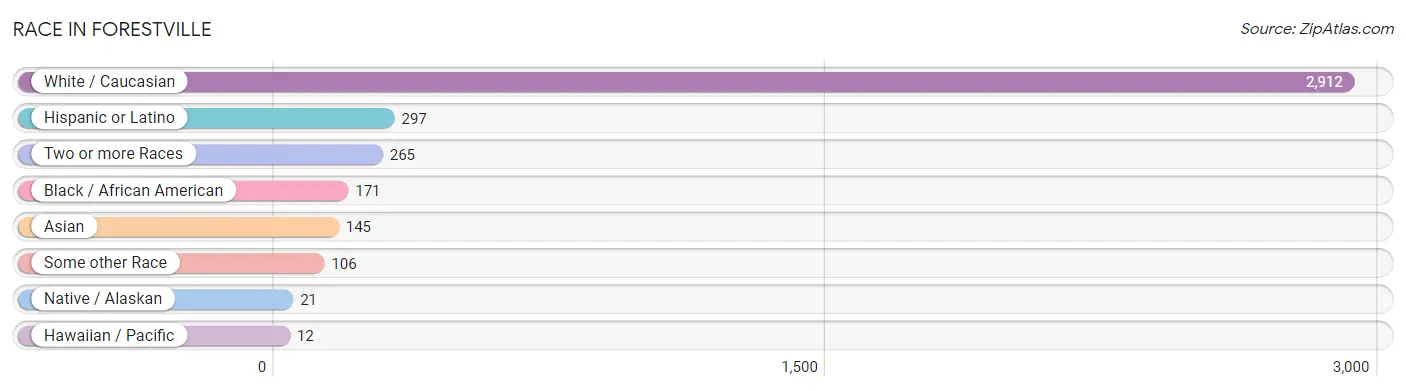
| Race | # Population | % Population |
| Asian | 145 | 4.0% |
| Black / African American | 171 | 4.7% |
| Hawaiian / Pacific | 12 | 0.3% |
| Hispanic or Latino | 297 | 8.2% |
| Native / Alaskan | 21 | 0.6% |
| White / Caucasian | 2,912 | 80.2% |
| Two or more Races | 265 | 7.3% |
| Some other Race | 106 | 2.9% |
| Total | 3,632 | 100.0% |
Ancestry in Forestville
The most populous ancestries reported in Forestville are Irish (650 | 17.9%), German (628 | 17.3%), English (540 | 14.9%), Italian (340 | 9.4%), and French (267 | 7.3%), together accounting for 66.8% of all Forestville residents.
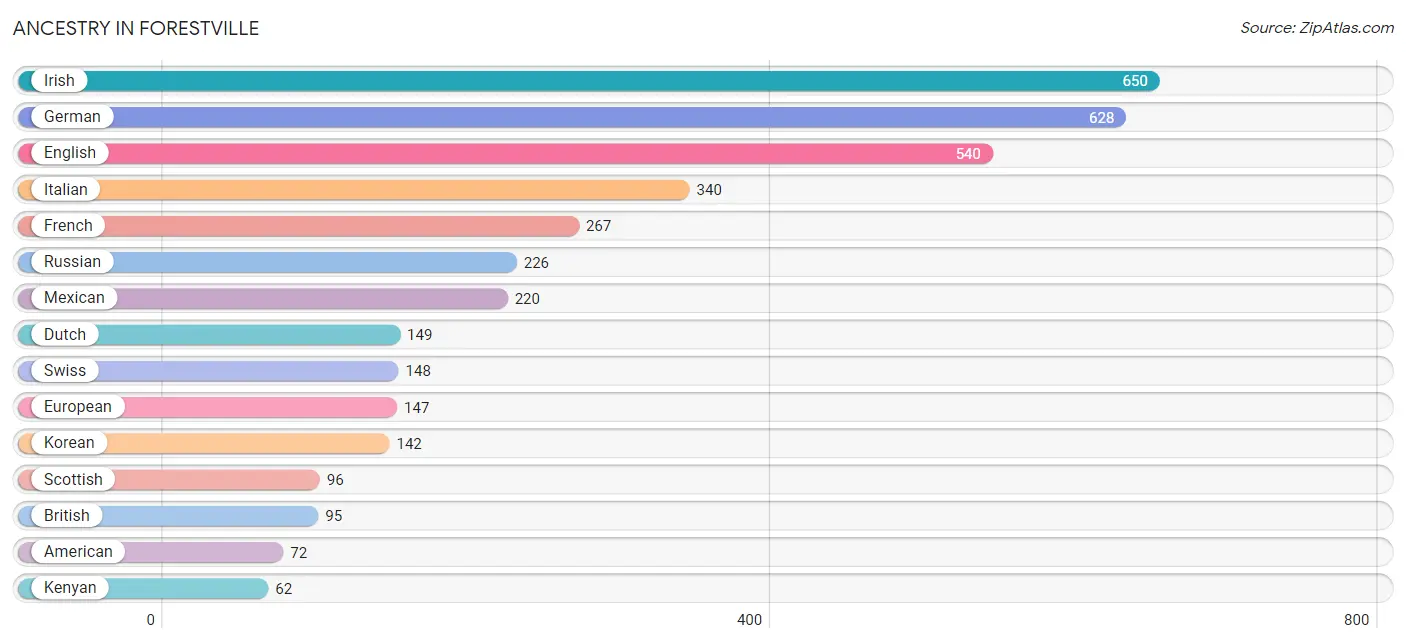
| Ancestry | # Population | % Population |
| American | 72 | 2.0% |
| Arab | 11 | 0.3% |
| Austrian | 31 | 0.9% |
| Basque | 3 | 0.1% |
| Belgian | 10 | 0.3% |
| Bhutanese | 39 | 1.1% |
| British | 95 | 2.6% |
| Canadian | 8 | 0.2% |
| Chilean | 14 | 0.4% |
| Colombian | 31 | 0.9% |
| Croatian | 4 | 0.1% |
| Czech | 9 | 0.3% |
| Delaware | 12 | 0.3% |
| Dutch | 149 | 4.1% |
| Eastern European | 22 | 0.6% |
| English | 540 | 14.9% |
| European | 147 | 4.1% |
| French | 267 | 7.3% |
| German | 628 | 17.3% |
| Greek | 12 | 0.3% |
| Indian (Asian) | 20 | 0.5% |
| Irish | 650 | 17.9% |
| Italian | 340 | 9.4% |
| Kenyan | 62 | 1.7% |
| Korean | 142 | 3.9% |
| Lithuanian | 16 | 0.4% |
| Luxembourger | 48 | 1.3% |
| Mexican | 220 | 6.1% |
| Navajo | 30 | 0.8% |
| Norwegian | 55 | 1.5% |
| Paiute | 18 | 0.5% |
| Polish | 62 | 1.7% |
| Portuguese | 17 | 0.5% |
| Puerto Rican | 14 | 0.4% |
| Romanian | 7 | 0.2% |
| Russian | 226 | 6.2% |
| Samoan | 12 | 0.3% |
| Scandinavian | 14 | 0.4% |
| Scotch-Irish | 39 | 1.1% |
| Scottish | 96 | 2.6% |
| Slavic | 7 | 0.2% |
| Slovak | 6 | 0.2% |
| South American | 45 | 1.2% |
| Spaniard | 8 | 0.2% |
| Spanish | 10 | 0.3% |
| Subsaharan African | 62 | 1.7% |
| Swedish | 51 | 1.4% |
| Swiss | 148 | 4.1% |
| Thai | 33 | 0.9% |
| Ukrainian | 19 | 0.5% |
| Ute | 30 | 0.8% |
| Welsh | 36 | 1.0% | View All 52 Rows |
Immigrants in Forestville
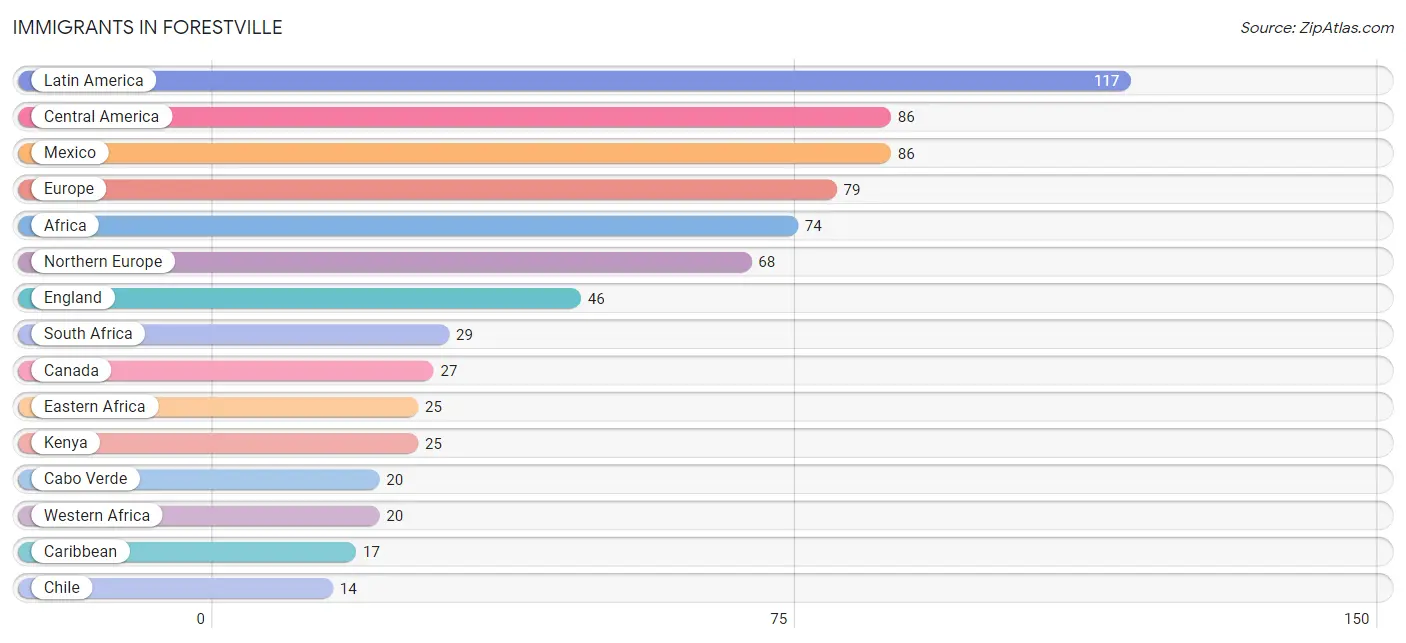
The most numerous immigrant groups reported in Forestville came from Latin America (117 | 3.2%), Central America (86 | 2.4%), Mexico (86 | 2.4%), Europe (79 | 2.2%), and Africa (74 | 2.0%), together accounting for 12.2% of all Forestville residents.
| Immigration Origin | # Population | % Population |
| Africa | 74 | 2.0% |
| Asia | 12 | 0.3% |
| Cabo Verde | 20 | 0.5% |
| Canada | 27 | 0.7% |
| Caribbean | 17 | 0.5% |
| Central America | 86 | 2.4% |
| Chile | 14 | 0.4% |
| China | 12 | 0.3% |
| Eastern Africa | 25 | 0.7% |
| Eastern Asia | 12 | 0.3% |
| England | 46 | 1.3% |
| Europe | 79 | 2.2% |
| Italy | 11 | 0.3% |
| Kenya | 25 | 0.7% |
| Latin America | 117 | 3.2% |
| Mexico | 86 | 2.4% |
| Northern Europe | 68 | 1.9% |
| South Africa | 29 | 0.8% |
| South America | 14 | 0.4% |
| Southern Europe | 11 | 0.3% |
| Western Africa | 20 | 0.5% | View All 21 Rows |
Sex and Age in Forestville
Sex and Age in Forestville
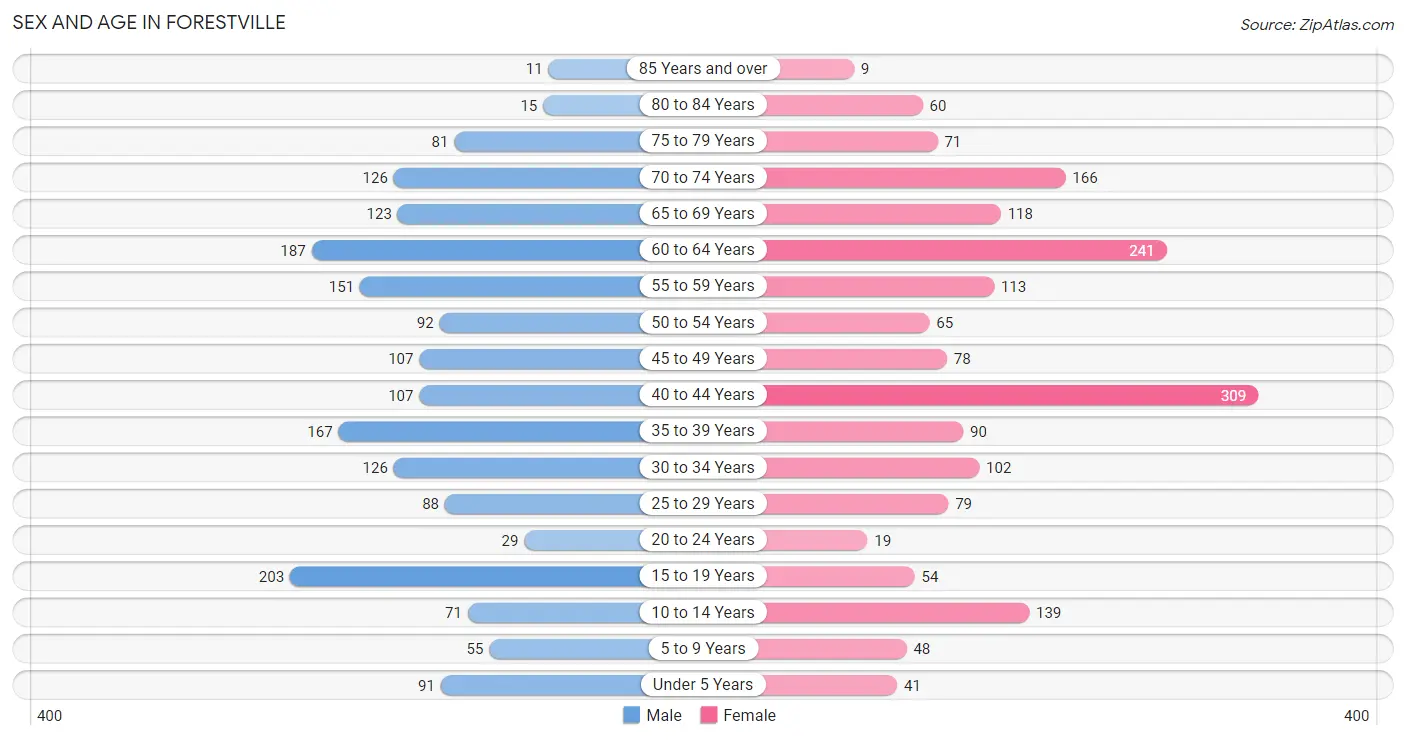
The most populous age groups in Forestville are 15 to 19 Years (203 | 11.1%) for men and 40 to 44 Years (309 | 17.2%) for women.
| Age Bracket | Male | Female |
| Under 5 Years | 91 (5.0%) | 41 (2.3%) |
| 5 to 9 Years | 55 (3.0%) | 48 (2.7%) |
| 10 to 14 Years | 71 (3.9%) | 139 (7.7%) |
| 15 to 19 Years | 203 (11.1%) | 54 (3.0%) |
| 20 to 24 Years | 29 (1.6%) | 19 (1.1%) |
| 25 to 29 Years | 88 (4.8%) | 79 (4.4%) |
| 30 to 34 Years | 126 (6.9%) | 102 (5.7%) |
| 35 to 39 Years | 167 (9.1%) | 90 (5.0%) |
| 40 to 44 Years | 107 (5.9%) | 309 (17.2%) |
| 45 to 49 Years | 107 (5.9%) | 78 (4.3%) |
| 50 to 54 Years | 92 (5.0%) | 65 (3.6%) |
| 55 to 59 Years | 151 (8.3%) | 113 (6.3%) |
| 60 to 64 Years | 187 (10.2%) | 241 (13.4%) |
| 65 to 69 Years | 123 (6.7%) | 118 (6.6%) |
| 70 to 74 Years | 126 (6.9%) | 166 (9.2%) |
| 75 to 79 Years | 81 (4.4%) | 71 (3.9%) |
| 80 to 84 Years | 15 (0.8%) | 60 (3.3%) |
| 85 Years and over | 11 (0.6%) | 9 (0.5%) |
| Total | 1,830 (100.0%) | 1,802 (100.0%) |
Families and Households in Forestville
Median Family Size in Forestville
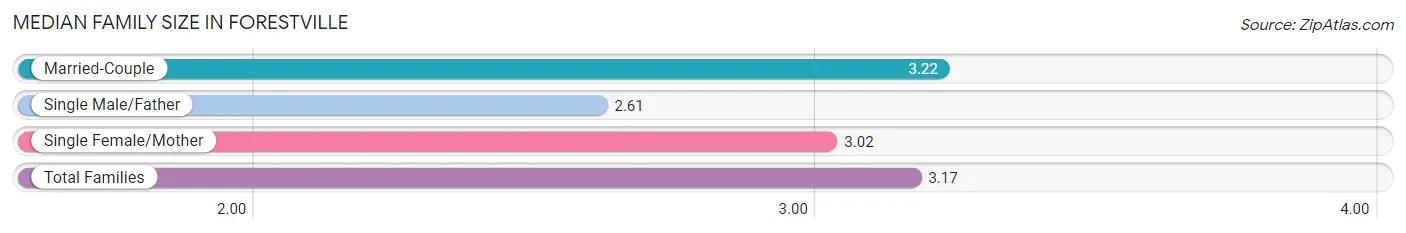
The median family size in Forestville is 3.17 persons per family, with married-couple families (664 | 83.0%) accounting for the largest median family size of 3.22 persons per family. On the other hand, single male/father families (31 | 3.9%) represent the smallest median family size with 2.61 persons per family.
| Family Type | # Families | Family Size |
| Married-Couple | 664 (83.0%) | 3.22 |
| Single Male/Father | 31 (3.9%) | 2.61 |
| Single Female/Mother | 105 (13.1%) | 3.02 |
| Total Families | 800 (100.0%) | 3.17 |
Median Household Size in Forestville
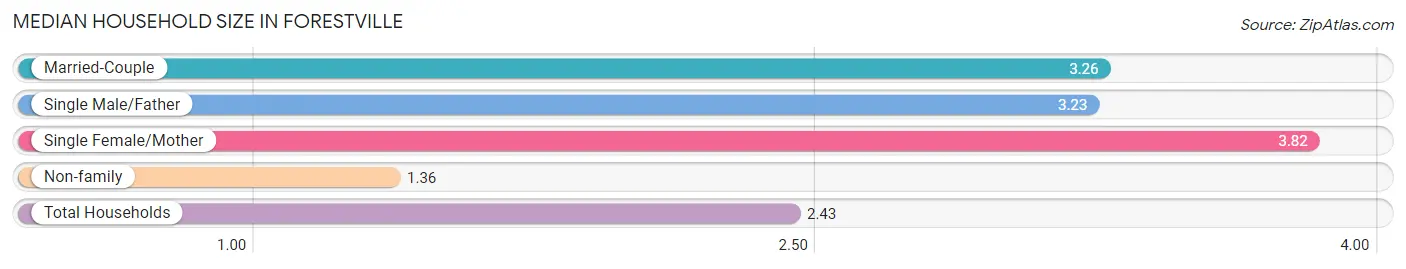
The median household size in Forestville is 2.43 persons per household, with single female/mother households (105 | 7.1%) accounting for the largest median household size of 3.82 persons per household. non-family households (671 | 45.6%) represent the smallest median household size with 1.36 persons per household.
| Household Type | # Households | Household Size |
| Married-Couple | 664 (45.1%) | 3.26 |
| Single Male/Father | 31 (2.1%) | 3.23 |
| Single Female/Mother | 105 (7.1%) | 3.82 |
| Non-family | 671 (45.6%) | 1.36 |
| Total Households | 1,471 (100.0%) | 2.43 |
Household Size by Marriage Status in Forestville
Out of a total of 1,471 households in Forestville, 800 (54.4%) are family households, while 671 (45.6%) are nonfamily households. The most numerous type of family households are 2-person households, comprising 382, and the most common type of nonfamily households are 1-person households, comprising 525.
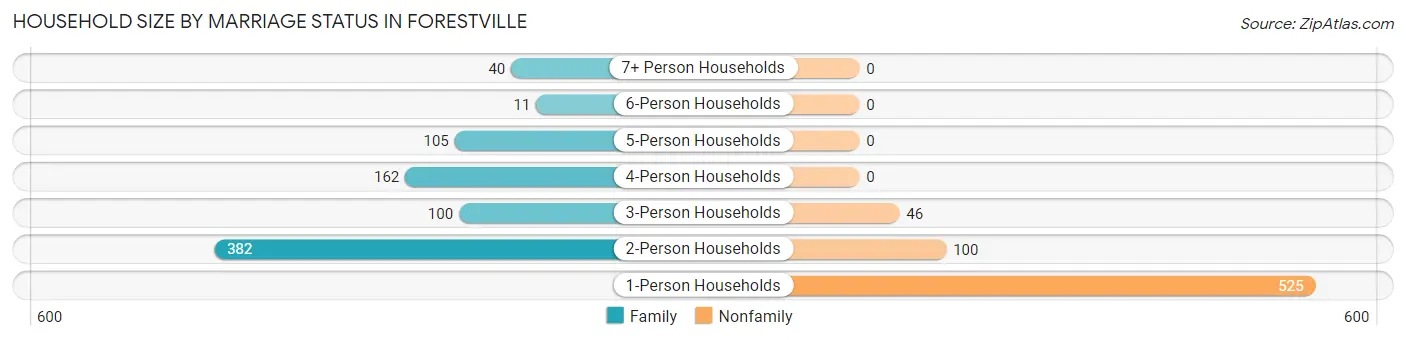
| Household Size | Family Households | Nonfamily Households |
| 1-Person Households | - | 525 (35.7%) |
| 2-Person Households | 382 (26.0%) | 100 (6.8%) |
| 3-Person Households | 100 (6.8%) | 46 (3.1%) |
| 4-Person Households | 162 (11.0%) | 0 (0.0%) |
| 5-Person Households | 105 (7.1%) | 0 (0.0%) |
| 6-Person Households | 11 (0.7%) | 0 (0.0%) |
| 7+ Person Households | 40 (2.7%) | 0 (0.0%) |
| Total | 800 (54.4%) | 671 (45.6%) |
Female Fertility in Forestville
Fertility by Age in Forestville
Average fertility rate in Forestville is 14.0 births per 1,000 women. Women in the age bracket of 20 to 34 years have the highest fertility rate with 50.0 births per 1,000 women. Women in the age bracket of 20 to 34 years acount for 100.0% of all women with births.
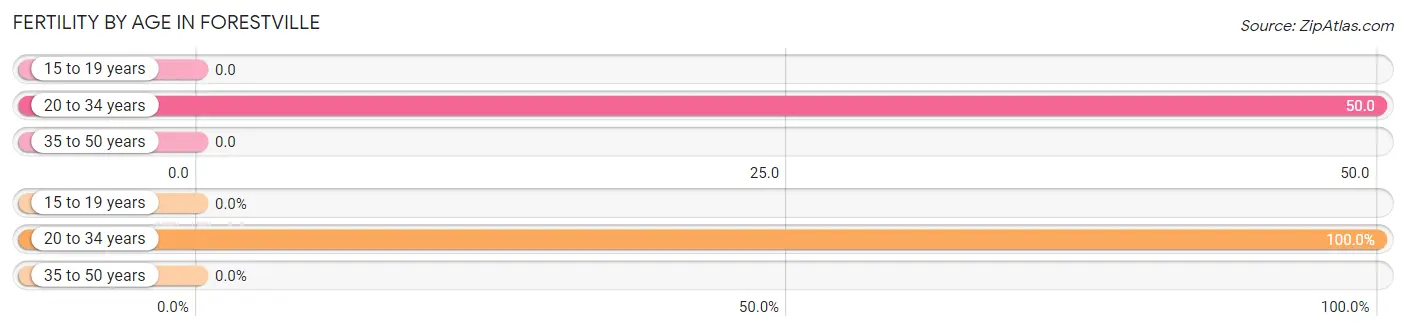
| Age Bracket | Women with Births | Births / 1,000 Women |
| 15 to 19 years | 0 (0.0%) | 0.0 |
| 20 to 34 years | 10 (100.0%) | 50.0 |
| 35 to 50 years | 0 (0.0%) | 0.0 |
| Total | 10 (100.0%) | 14.0 |
Fertility by Age by Marriage Status in Forestville
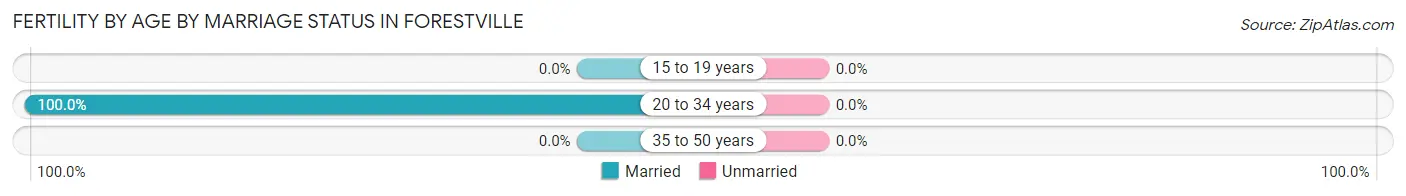
| Age Bracket | Married | Unmarried |
| 15 to 19 years | 0 (0.0%) | 0 (0.0%) |
| 20 to 34 years | 10 (100.0%) | 0 (0.0%) |
| 35 to 50 years | 0 (0.0%) | 0 (0.0%) |
| Total | 10 (100.0%) | 0 (0.0%) |
Fertility by Education in Forestville
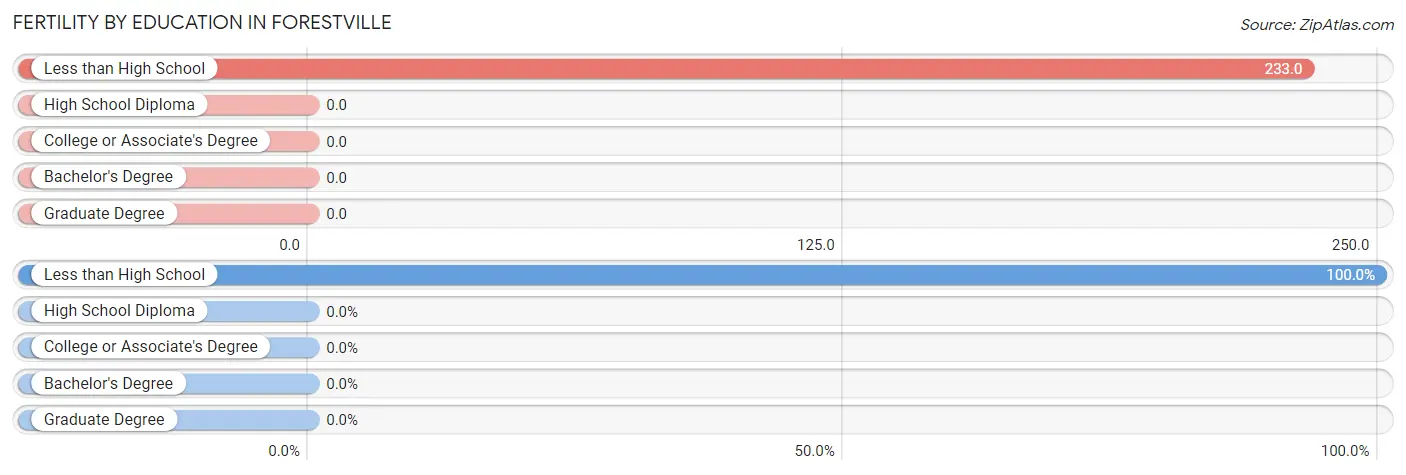
| Educational Attainment | Women with Births | Births / 1,000 Women |
| Less than High School | 10 (100.0%) | 233.0 |
| High School Diploma | 0 (0.0%) | 0.0 |
| College or Associate's Degree | 0 (0.0%) | 0.0 |
| Bachelor's Degree | 0 (0.0%) | 0.0 |
| Graduate Degree | 0 (0.0%) | 0.0 |
| Total | 10 (100.0%) | 14.0 |
Fertility by Education by Marriage Status in Forestville
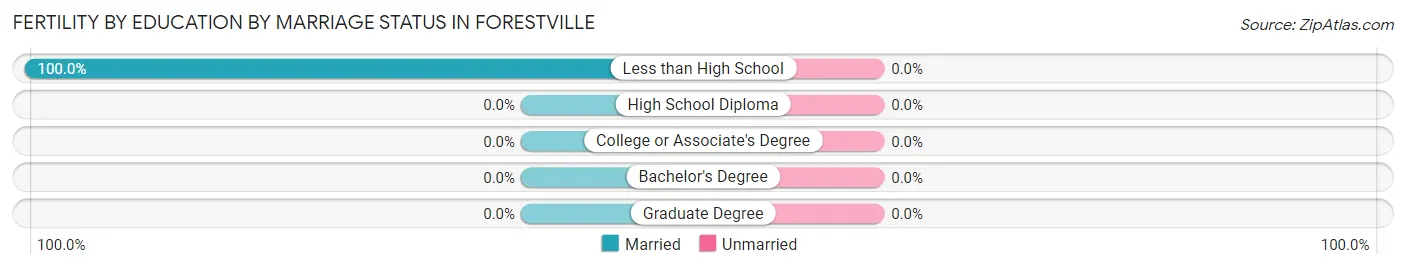
| Educational Attainment | Married | Unmarried |
| Less than High School | 10 (100.0%) | 0 (0.0%) |
| High School Diploma | 0 (0.0%) | 0 (0.0%) |
| College or Associate's Degree | 0 (0.0%) | 0 (0.0%) |
| Bachelor's Degree | 0 (0.0%) | 0 (0.0%) |
| Graduate Degree | 0 (0.0%) | 0 (0.0%) |
| Total | 10 (100.0%) | 0 (0.0%) |
Employment Characteristics in Forestville
Employment by Class of Employer in Forestville
Among the 1,863 employed individuals in Forestville, private company employees (1,022 | 54.9%), not-for-profit organizations (236 | 12.7%), and self-employed (not incorporated) (214 | 11.5%) make up the most common classes of employment.
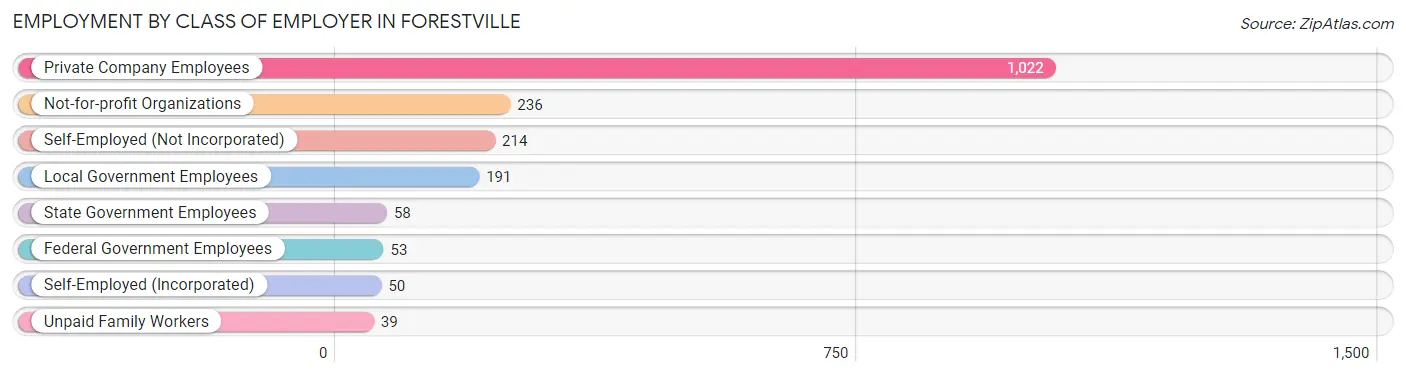
| Employer Class | # Employees | % Employees |
| Private Company Employees | 1,022 | 54.9% |
| Self-Employed (Incorporated) | 50 | 2.7% |
| Self-Employed (Not Incorporated) | 214 | 11.5% |
| Not-for-profit Organizations | 236 | 12.7% |
| Local Government Employees | 191 | 10.2% |
| State Government Employees | 58 | 3.1% |
| Federal Government Employees | 53 | 2.8% |
| Unpaid Family Workers | 39 | 2.1% |
| Total | 1,863 | 100.0% |
Employment Status by Age in Forestville
According to the labor force statistics for Forestville, out of the total population over 16 years of age (3,105), 66.6% or 2,068 individuals are in the labor force, with 3.9% or 81 of them unemployed. The age group with the highest labor force participation rate is 20 to 24 years, with 100.0% or 48 individuals in the labor force. Within the labor force, the 25 to 29 years age range has the highest percentage of unemployed individuals, with 23.4% or 33 of them being unemployed.
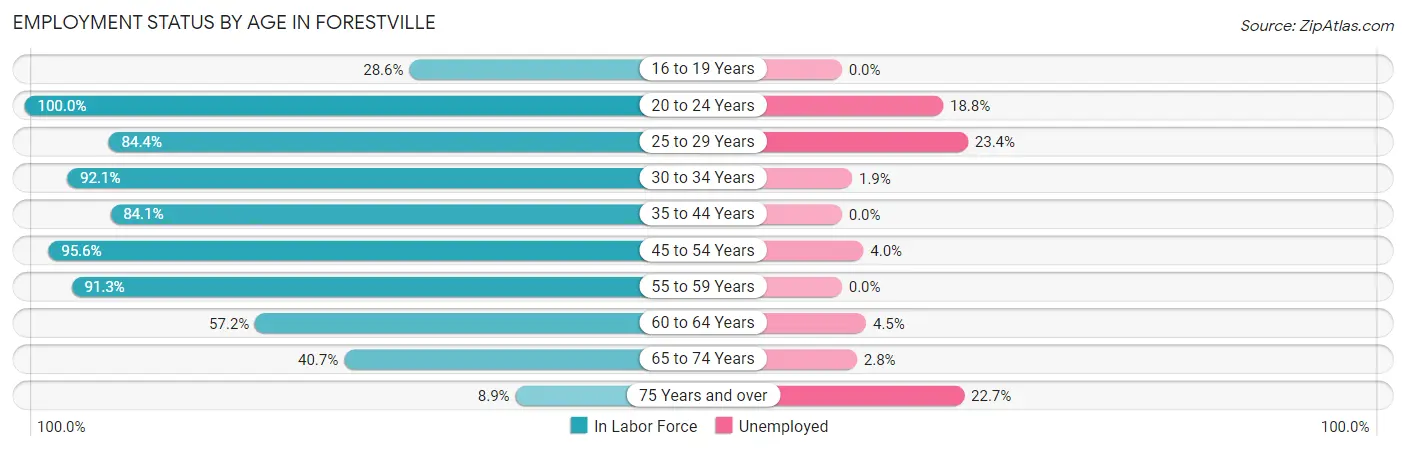
| Age Bracket | In Labor Force | Unemployed |
| 16 to 19 Years | 50 (28.6%) | 0 (0.0%) |
| 20 to 24 Years | 48 (100.0%) | 9 (18.8%) |
| 25 to 29 Years | 141 (84.4%) | 33 (23.4%) |
| 30 to 34 Years | 210 (92.1%) | 4 (1.9%) |
| 35 to 44 Years | 566 (84.1%) | 0 (0.0%) |
| 45 to 54 Years | 327 (95.6%) | 13 (4.0%) |
| 55 to 59 Years | 241 (91.3%) | 0 (0.0%) |
| 60 to 64 Years | 245 (57.2%) | 11 (4.5%) |
| 65 to 74 Years | 217 (40.7%) | 6 (2.8%) |
| 75 Years and over | 22 (8.9%) | 5 (22.7%) |
| Total | 2,068 (66.6%) | 81 (3.9%) |
Employment Status by Educational Attainment in Forestville
According to labor force statistics for Forestville, 82.3% of individuals (1,730) out of the total population between 25 and 64 years of age (2,102) are in the labor force, with 3.5% or 61 of them being unemployed. The group with the highest labor force participation rate are those with the educational attainment of bachelor's degree or higher, with 89.0% or 822 individuals in the labor force. Within the labor force, individuals with bachelor's degree or higher education have the highest percentage of unemployment, with 4.9% or 40 of them being unemployed.
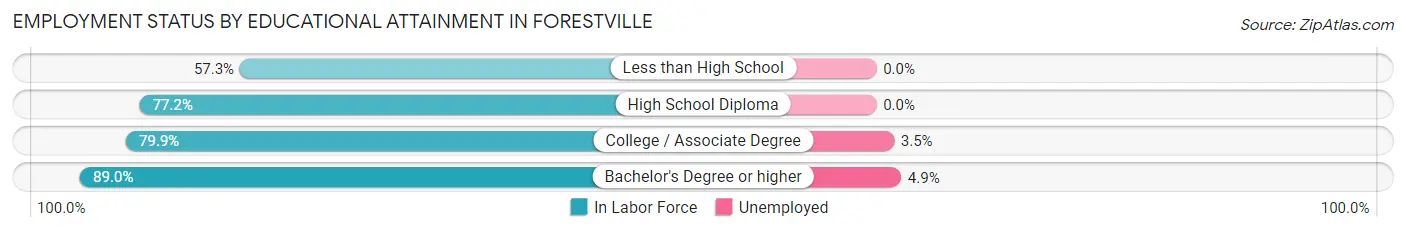
| Educational Attainment | In Labor Force | Unemployed |
| Less than High School | 63 (57.3%) | 0 (0.0%) |
| High School Diploma | 244 (77.2%) | 0 (0.0%) |
| College / Associate Degree | 601 (79.9%) | 26 (3.5%) |
| Bachelor's Degree or higher | 822 (89.0%) | 45 (4.9%) |
| Total | 1,730 (82.3%) | 74 (3.5%) |
Employment Occupations by Sex in Forestville
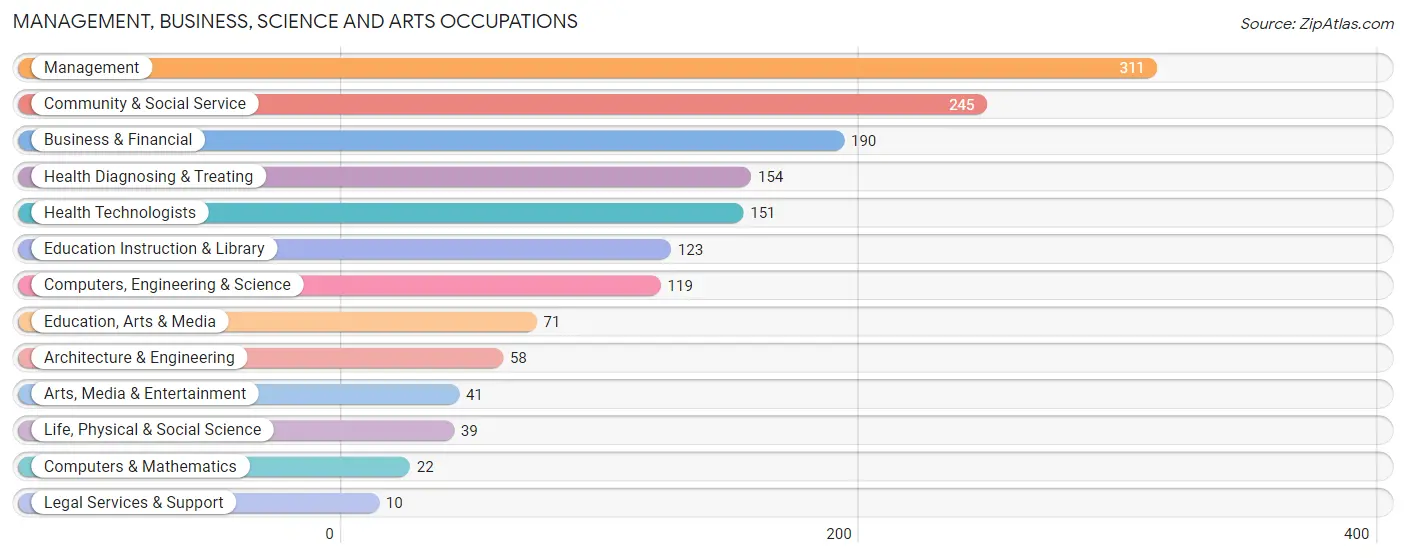
Management, Business, Science and Arts Occupations
The most common Management, Business, Science and Arts occupations in Forestville are Management (311 | 15.7%), Community & Social Service (245 | 12.3%), Business & Financial (190 | 9.6%), Health Diagnosing & Treating (154 | 7.7%), and Health Technologists (151 | 7.6%).
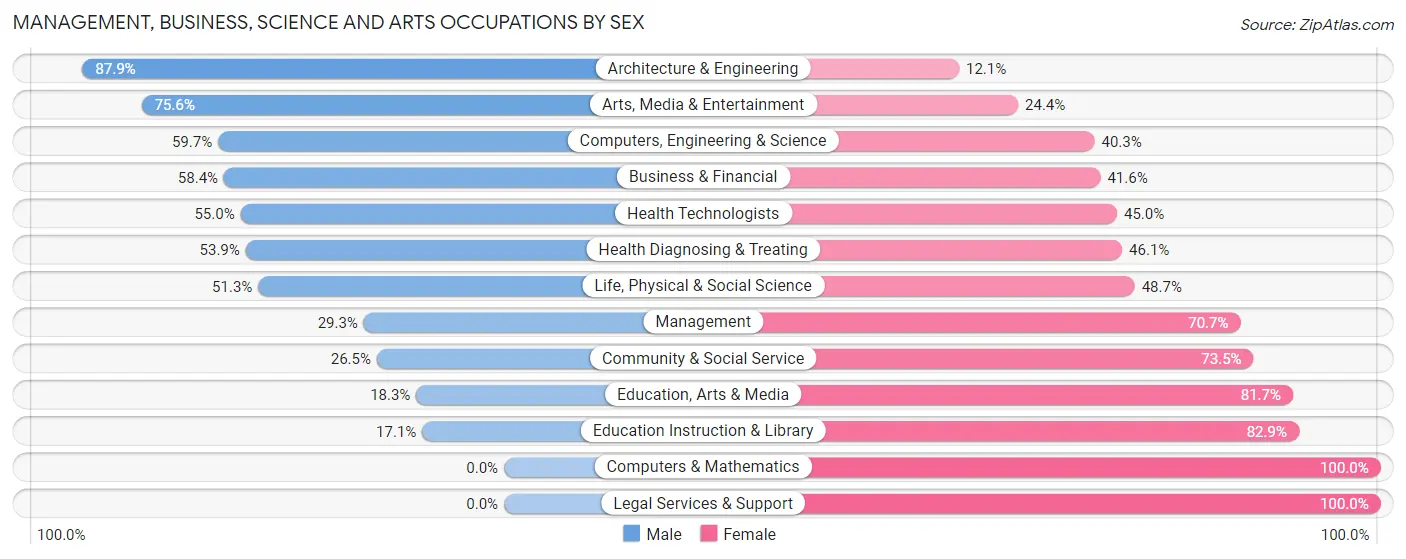
Management, Business, Science and Arts Occupations by Sex
Within the Management, Business, Science and Arts occupations in Forestville, the most male-oriented occupations are Architecture & Engineering (87.9%), Arts, Media & Entertainment (75.6%), and Computers, Engineering & Science (59.7%), while the most female-oriented occupations are Computers & Mathematics (100.0%), Legal Services & Support (100.0%), and Education Instruction & Library (82.9%).
| Occupation | Male | Female |
| Management | 91 (29.3%) | 220 (70.7%) |
| Business & Financial | 111 (58.4%) | 79 (41.6%) |
| Computers, Engineering & Science | 71 (59.7%) | 48 (40.3%) |
| Computers & Mathematics | 0 (0.0%) | 22 (100.0%) |
| Architecture & Engineering | 51 (87.9%) | 7 (12.1%) |
| Life, Physical & Social Science | 20 (51.3%) | 19 (48.7%) |
| Community & Social Service | 65 (26.5%) | 180 (73.5%) |
| Education, Arts & Media | 13 (18.3%) | 58 (81.7%) |
| Legal Services & Support | 0 (0.0%) | 10 (100.0%) |
| Education Instruction & Library | 21 (17.1%) | 102 (82.9%) |
| Arts, Media & Entertainment | 31 (75.6%) | 10 (24.4%) |
| Health Diagnosing & Treating | 83 (53.9%) | 71 (46.1%) |
| Health Technologists | 83 (55.0%) | 68 (45.0%) |
| Total (Category) | 421 (41.3%) | 598 (58.7%) |
| Total (Overall) | 888 (44.7%) | 1,098 (55.3%) |
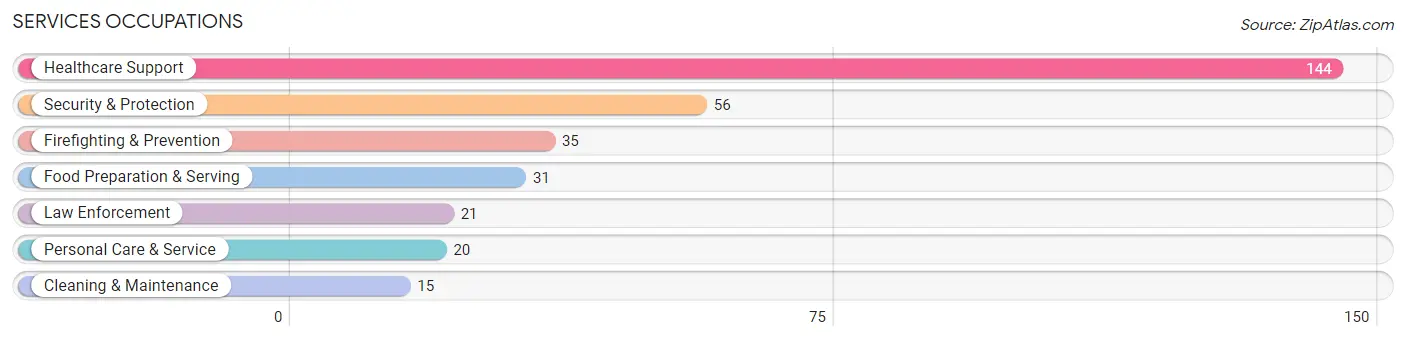
Services Occupations
The most common Services occupations in Forestville are Healthcare Support (144 | 7.2%), Security & Protection (56 | 2.8%), Firefighting & Prevention (35 | 1.8%), Food Preparation & Serving (31 | 1.6%), and Law Enforcement (21 | 1.1%).
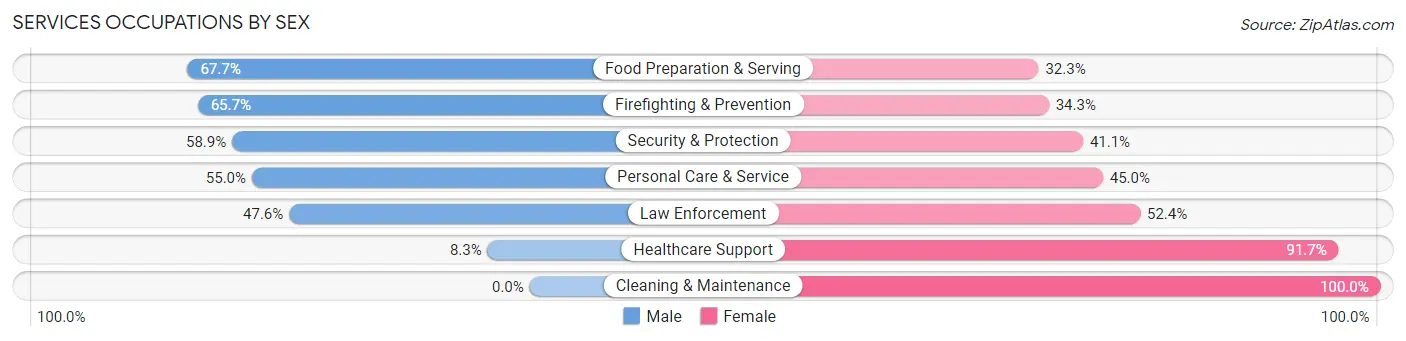
Services Occupations by Sex
Within the Services occupations in Forestville, the most male-oriented occupations are Food Preparation & Serving (67.7%), Firefighting & Prevention (65.7%), and Security & Protection (58.9%), while the most female-oriented occupations are Cleaning & Maintenance (100.0%), Healthcare Support (91.7%), and Law Enforcement (52.4%).
| Occupation | Male | Female |
| Healthcare Support | 12 (8.3%) | 132 (91.7%) |
| Security & Protection | 33 (58.9%) | 23 (41.1%) |
| Firefighting & Prevention | 23 (65.7%) | 12 (34.3%) |
| Law Enforcement | 10 (47.6%) | 11 (52.4%) |
| Food Preparation & Serving | 21 (67.7%) | 10 (32.3%) |
| Cleaning & Maintenance | 0 (0.0%) | 15 (100.0%) |
| Personal Care & Service | 11 (55.0%) | 9 (45.0%) |
| Total (Category) | 77 (28.9%) | 189 (71.1%) |
| Total (Overall) | 888 (44.7%) | 1,098 (55.3%) |
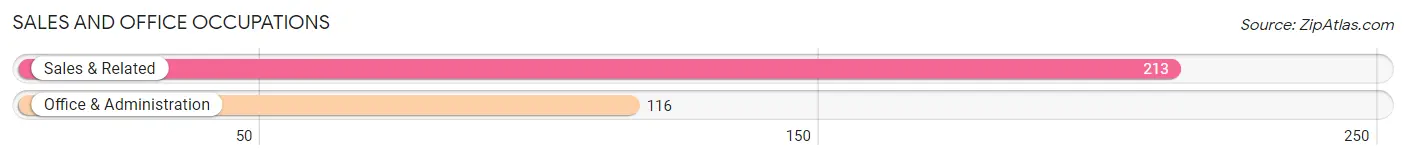
Sales and Office Occupations
The most common Sales and Office occupations in Forestville are Sales & Related (213 | 10.7%), and Office & Administration (116 | 5.8%).
Sales and Office Occupations by Sex
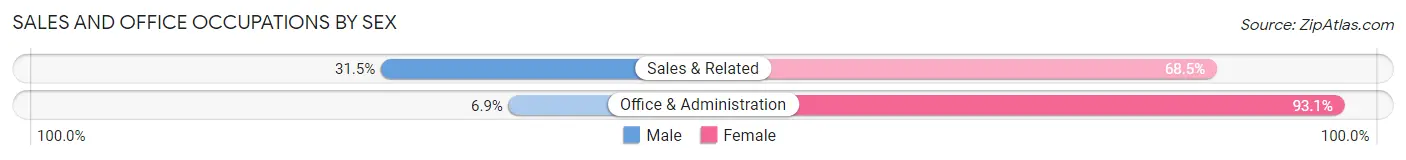
| Occupation | Male | Female |
| Sales & Related | 67 (31.5%) | 146 (68.5%) |
| Office & Administration | 8 (6.9%) | 108 (93.1%) |
| Total (Category) | 75 (22.8%) | 254 (77.2%) |
| Total (Overall) | 888 (44.7%) | 1,098 (55.3%) |
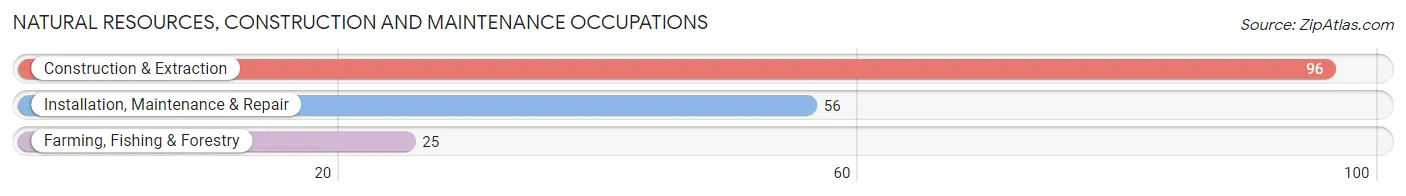
Natural Resources, Construction and Maintenance Occupations
The most common Natural Resources, Construction and Maintenance occupations in Forestville are Construction & Extraction (96 | 4.8%), Installation, Maintenance & Repair (56 | 2.8%), and Farming, Fishing & Forestry (25 | 1.3%).
Natural Resources, Construction and Maintenance Occupations by Sex
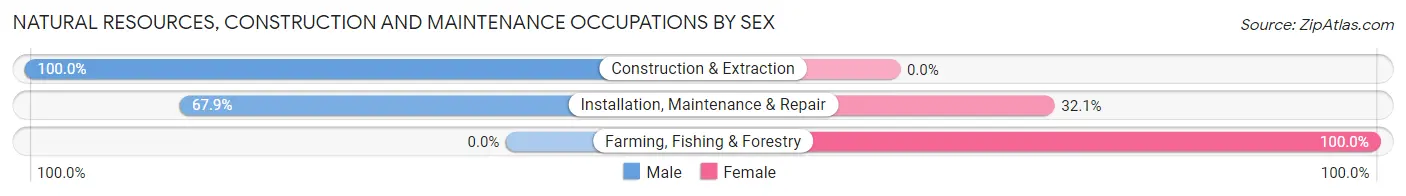
| Occupation | Male | Female |
| Farming, Fishing & Forestry | 0 (0.0%) | 25 (100.0%) |
| Construction & Extraction | 96 (100.0%) | 0 (0.0%) |
| Installation, Maintenance & Repair | 38 (67.9%) | 18 (32.1%) |
| Total (Category) | 134 (75.7%) | 43 (24.3%) |
| Total (Overall) | 888 (44.7%) | 1,098 (55.3%) |
Production, Transportation and Moving Occupations
The most common Production, Transportation and Moving occupations in Forestville are Production (104 | 5.2%), and Transportation (91 | 4.6%).
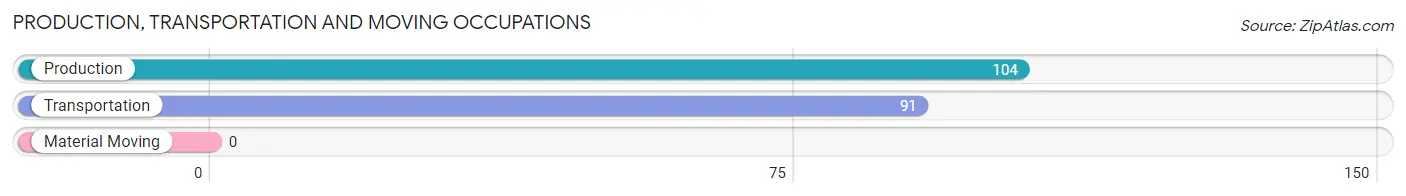
Production, Transportation and Moving Occupations by Sex
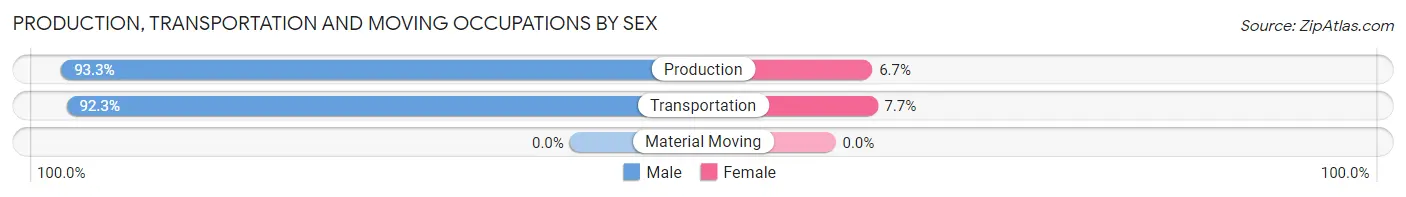
| Occupation | Male | Female |
| Production | 97 (93.3%) | 7 (6.7%) |
| Transportation | 84 (92.3%) | 7 (7.7%) |
| Material Moving | 0 (0.0%) | 0 (0.0%) |
| Total (Category) | 181 (92.8%) | 14 (7.2%) |
| Total (Overall) | 888 (44.7%) | 1,098 (55.3%) |
Employment Industries by Sex in Forestville
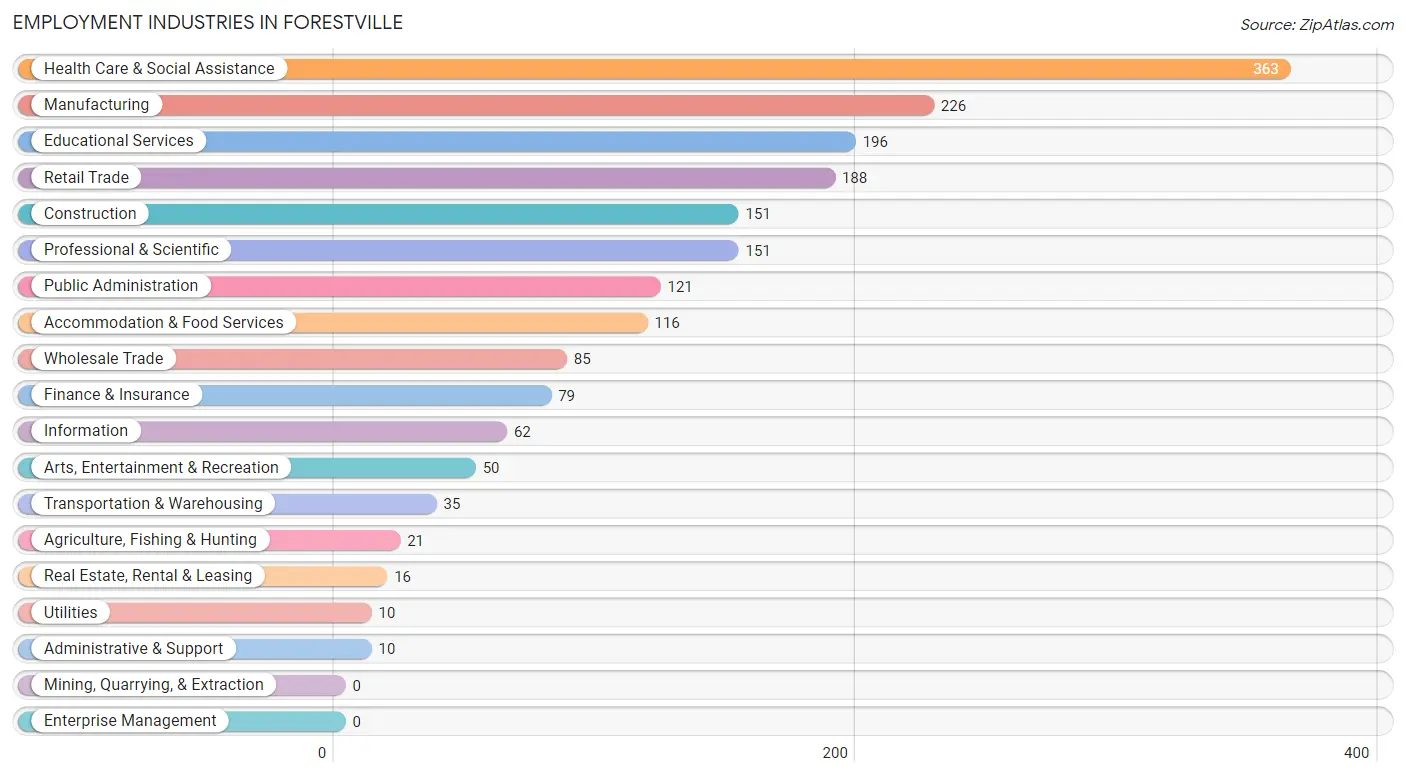
Employment Industries in Forestville
The major employment industries in Forestville include Health Care & Social Assistance (363 | 18.3%), Manufacturing (226 | 11.4%), Educational Services (196 | 9.9%), Retail Trade (188 | 9.5%), and Construction (151 | 7.6%).
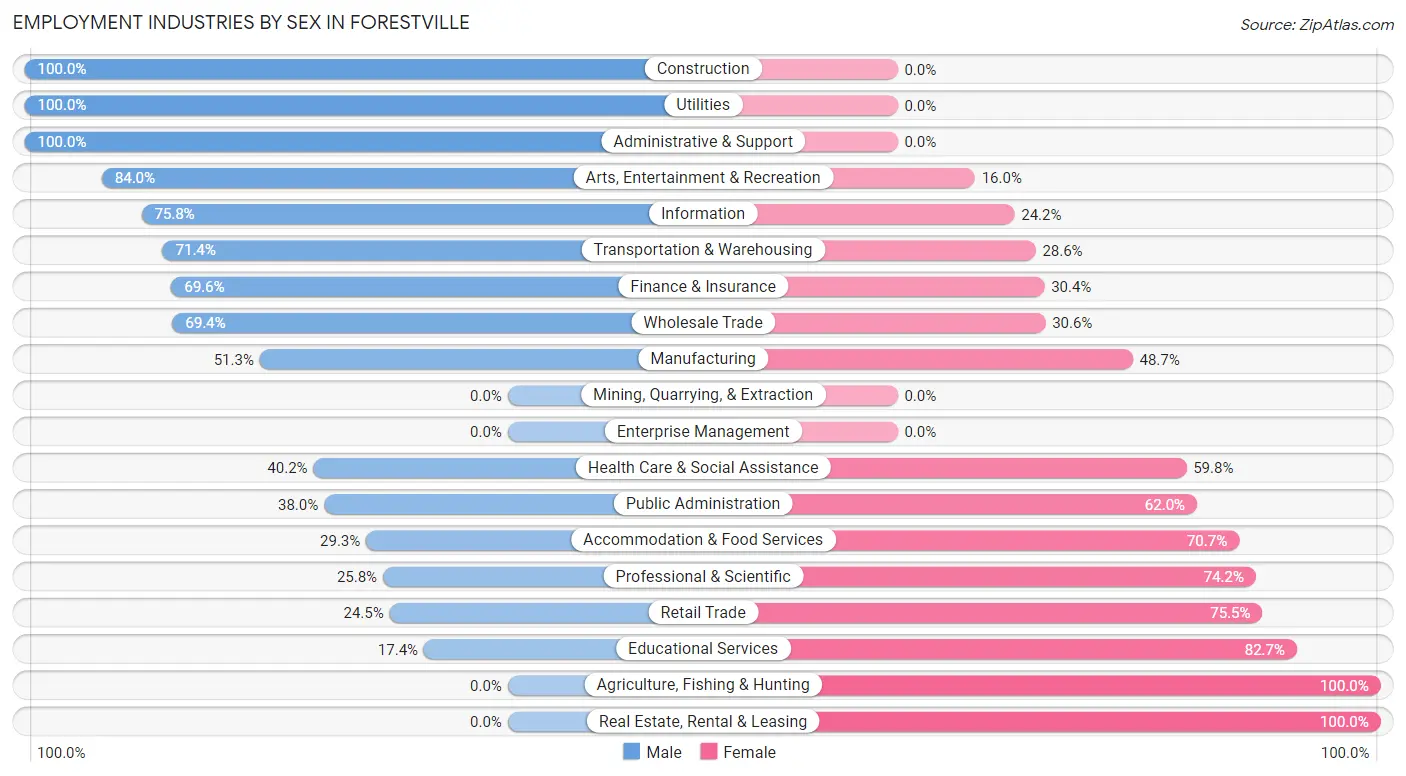
Employment Industries by Sex in Forestville
The Forestville industries that see more men than women are Construction (100.0%), Utilities (100.0%), and Administrative & Support (100.0%), whereas the industries that tend to have a higher number of women are Agriculture, Fishing & Hunting (100.0%), Real Estate, Rental & Leasing (100.0%), and Educational Services (82.7%).
| Industry | Male | Female |
| Agriculture, Fishing & Hunting | 0 (0.0%) | 21 (100.0%) |
| Mining, Quarrying, & Extraction | 0 (0.0%) | 0 (0.0%) |
| Construction | 151 (100.0%) | 0 (0.0%) |
| Manufacturing | 116 (51.3%) | 110 (48.7%) |
| Wholesale Trade | 59 (69.4%) | 26 (30.6%) |
| Retail Trade | 46 (24.5%) | 142 (75.5%) |
| Transportation & Warehousing | 25 (71.4%) | 10 (28.6%) |
| Utilities | 10 (100.0%) | 0 (0.0%) |
| Information | 47 (75.8%) | 15 (24.2%) |
| Finance & Insurance | 55 (69.6%) | 24 (30.4%) |
| Real Estate, Rental & Leasing | 0 (0.0%) | 16 (100.0%) |
| Professional & Scientific | 39 (25.8%) | 112 (74.2%) |
| Enterprise Management | 0 (0.0%) | 0 (0.0%) |
| Administrative & Support | 10 (100.0%) | 0 (0.0%) |
| Educational Services | 34 (17.3%) | 162 (82.7%) |
| Health Care & Social Assistance | 146 (40.2%) | 217 (59.8%) |
| Arts, Entertainment & Recreation | 42 (84.0%) | 8 (16.0%) |
| Accommodation & Food Services | 34 (29.3%) | 82 (70.7%) |
| Public Administration | 46 (38.0%) | 75 (62.0%) |
| Total | 888 (44.7%) | 1,098 (55.3%) |
Education in Forestville
School Enrollment in Forestville
The most common levels of schooling among the 878 students in Forestville are high school (214 | 24.4%), college / undergraduate (214 | 24.4%), and middle school (157 | 17.9%).
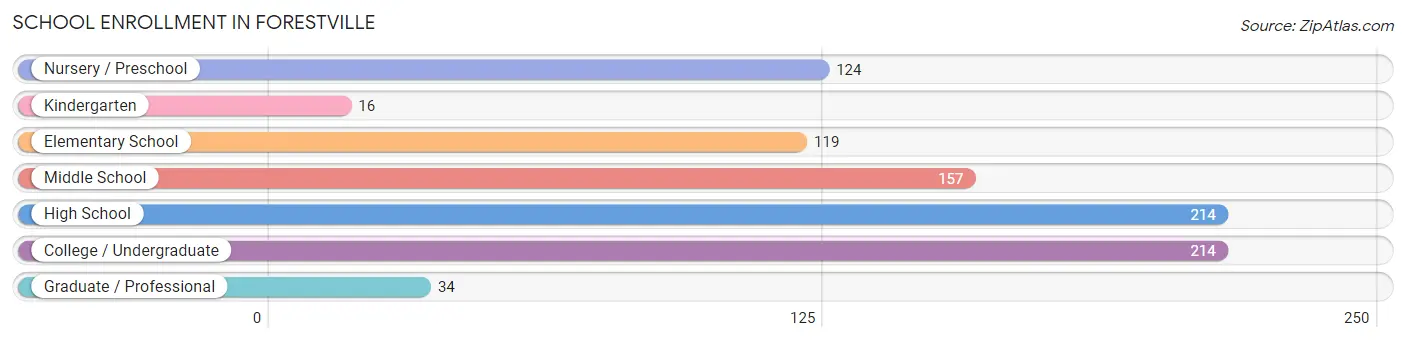
| School Level | # Students | % Students |
| Nursery / Preschool | 124 | 14.1% |
| Kindergarten | 16 | 1.8% |
| Elementary School | 119 | 13.6% |
| Middle School | 157 | 17.9% |
| High School | 214 | 24.4% |
| College / Undergraduate | 214 | 24.4% |
| Graduate / Professional | 34 | 3.9% |
| Total | 878 | 100.0% |
School Enrollment by Age by Funding Source in Forestville
Out of a total of 878 students who are enrolled in schools in Forestville, 75 (8.5%) attend a private institution, while the remaining 803 (91.5%) are enrolled in public schools. The age group of 3 to 4 year olds has the highest likelihood of being enrolled in private schools, with 22 (17.7% in the age bracket) enrolled. Conversely, the age group of 5 to 9 year old has the lowest likelihood of being enrolled in a private school, with 103 (100.0% in the age bracket) attending a public institution.
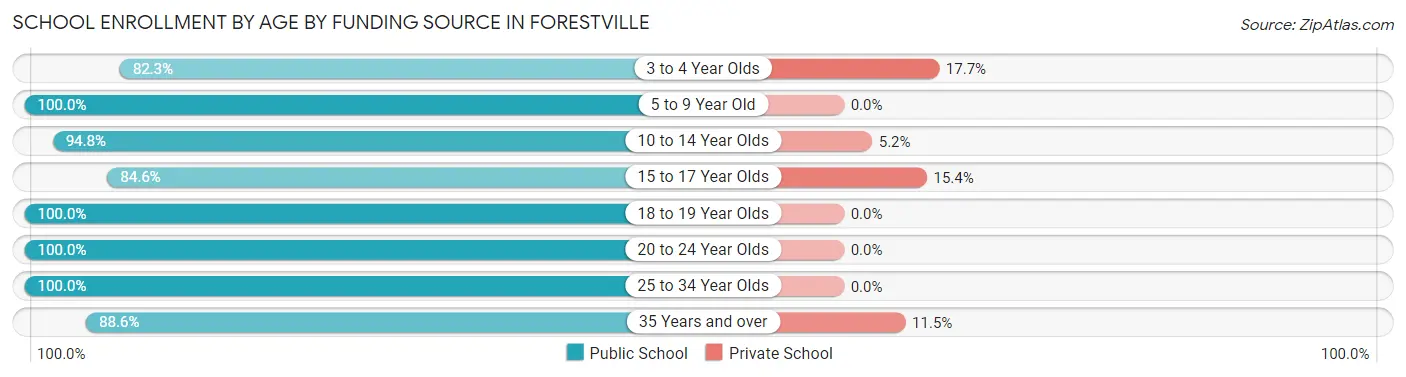
| Age Bracket | Public School | Private School |
| 3 to 4 Year Olds | 102 (82.3%) | 22 (17.7%) |
| 5 to 9 Year Old | 103 (100.0%) | 0 (0.0%) |
| 10 to 14 Year Olds | 199 (94.8%) | 11 (5.2%) |
| 15 to 17 Year Olds | 148 (84.6%) | 27 (15.4%) |
| 18 to 19 Year Olds | 17 (100.0%) | 0 (0.0%) |
| 20 to 24 Year Olds | 39 (100.0%) | 0 (0.0%) |
| 25 to 34 Year Olds | 79 (100.0%) | 0 (0.0%) |
| 35 Years and over | 116 (88.5%) | 15 (11.5%) |
| Total | 803 (91.5%) | 75 (8.5%) |
Educational Attainment by Field of Study in Forestville
Social sciences (198 | 13.5%), science & technology (161 | 10.9%), liberal arts & history (154 | 10.5%), bio, nature & agricultural (149 | 10.1%), and business (148 | 10.1%) are the most common fields of study among 1,472 individuals in Forestville who have obtained a bachelor's degree or higher.
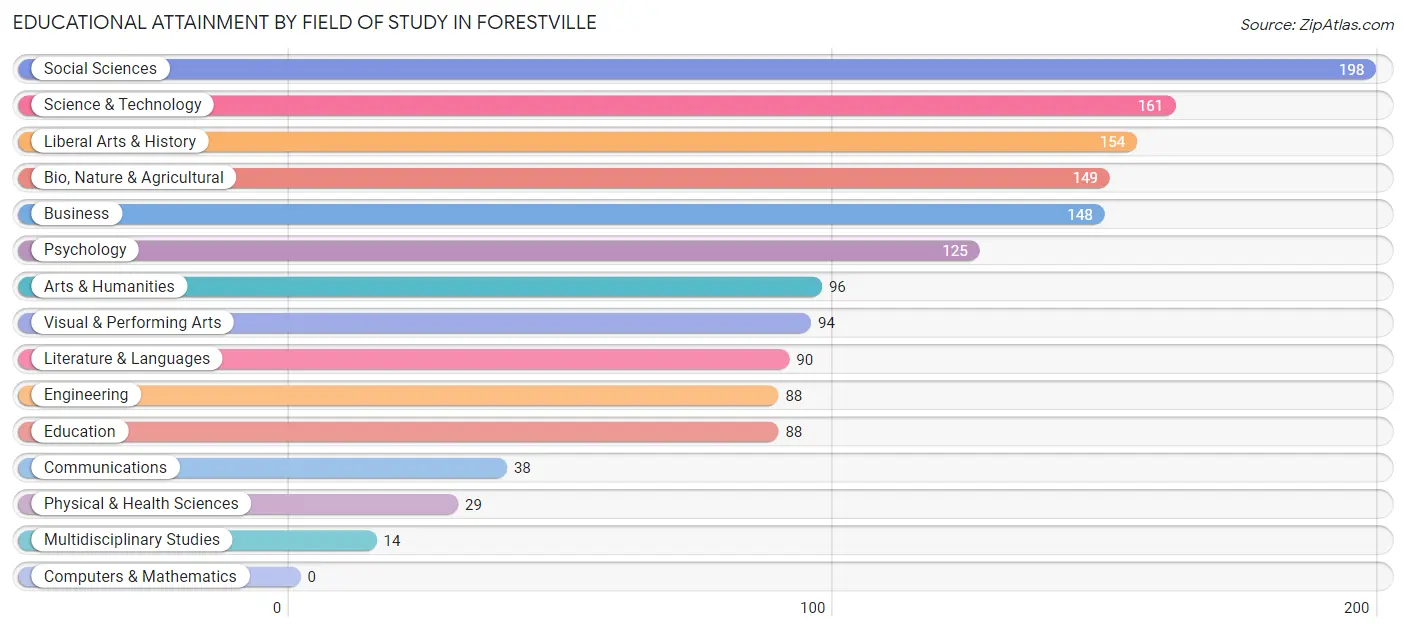
| Field of Study | # Graduates | % Graduates |
| Computers & Mathematics | 0 | 0.0% |
| Bio, Nature & Agricultural | 149 | 10.1% |
| Physical & Health Sciences | 29 | 2.0% |
| Psychology | 125 | 8.5% |
| Social Sciences | 198 | 13.5% |
| Engineering | 88 | 6.0% |
| Multidisciplinary Studies | 14 | 0.9% |
| Science & Technology | 161 | 10.9% |
| Business | 148 | 10.1% |
| Education | 88 | 6.0% |
| Literature & Languages | 90 | 6.1% |
| Liberal Arts & History | 154 | 10.5% |
| Visual & Performing Arts | 94 | 6.4% |
| Communications | 38 | 2.6% |
| Arts & Humanities | 96 | 6.5% |
| Total | 1,472 | 100.0% |
Transportation & Commute in Forestville
Vehicle Availability by Sex in Forestville
The most prevalent vehicle ownership categories in Forestville are males with 3 vehicles (277, accounting for 31.7%) and females with 3 vehicles (235, making up 28.0%).
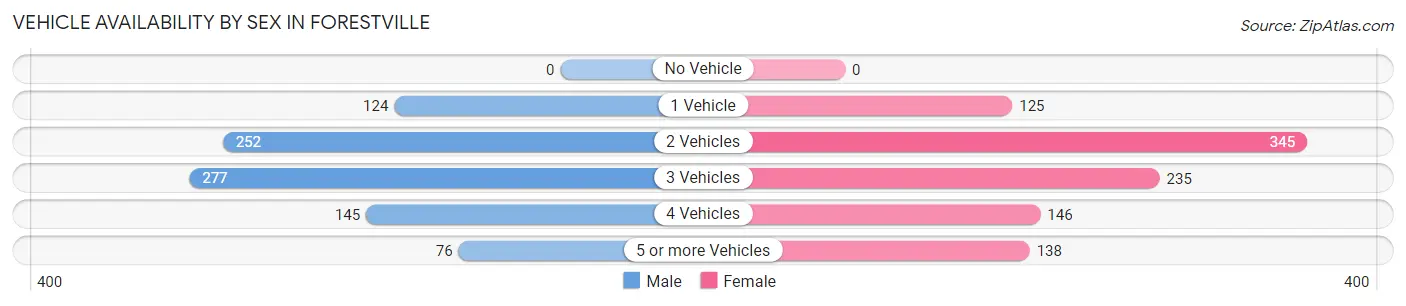
| Vehicles Available | Male | Female |
| No Vehicle | 0 (0.0%) | 0 (0.0%) |
| 1 Vehicle | 124 (14.2%) | 125 (12.6%) |
| 2 Vehicles | 252 (28.8%) | 345 (34.9%) |
| 3 Vehicles | 277 (31.7%) | 235 (23.8%) |
| 4 Vehicles | 145 (16.6%) | 146 (14.8%) |
| 5 or more Vehicles | 76 (8.7%) | 138 (14.0%) |
| Total | 874 (100.0%) | 989 (100.0%) |
Commute Time in Forestville
The most frequently occuring commute durations in Forestville are 20 to 24 minutes (376 commuters, 23.5%), 25 to 29 minutes (277 commuters, 17.3%), and 30 to 34 minutes (238 commuters, 14.9%).
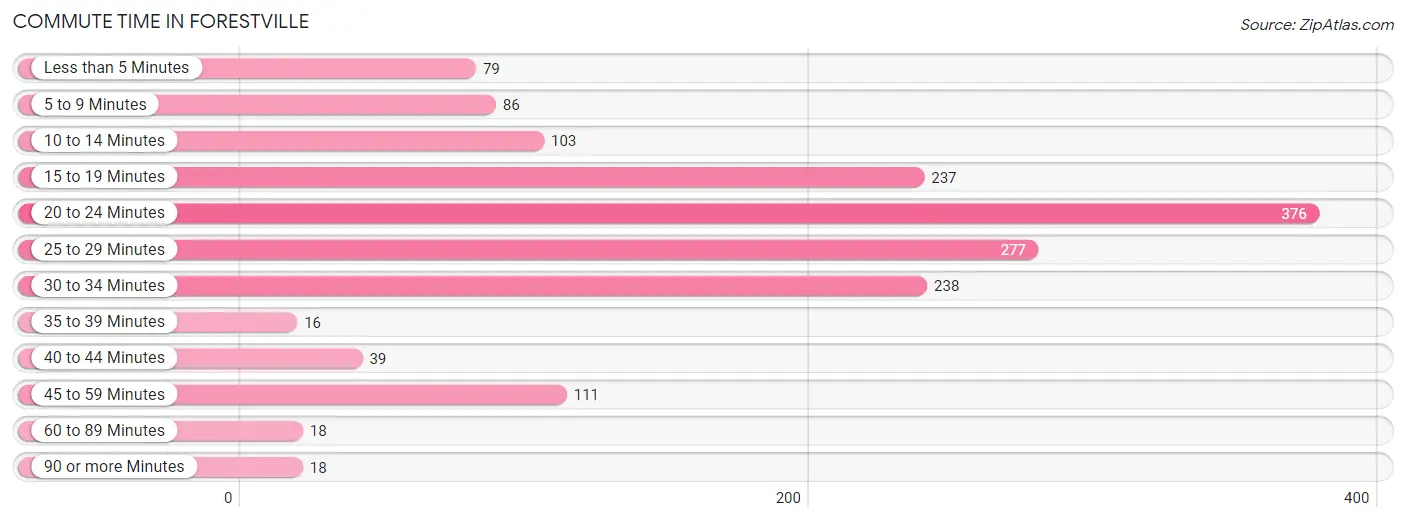
| Commute Time | # Commuters | % Commuters |
| Less than 5 Minutes | 79 | 4.9% |
| 5 to 9 Minutes | 86 | 5.4% |
| 10 to 14 Minutes | 103 | 6.5% |
| 15 to 19 Minutes | 237 | 14.8% |
| 20 to 24 Minutes | 376 | 23.5% |
| 25 to 29 Minutes | 277 | 17.3% |
| 30 to 34 Minutes | 238 | 14.9% |
| 35 to 39 Minutes | 16 | 1.0% |
| 40 to 44 Minutes | 39 | 2.4% |
| 45 to 59 Minutes | 111 | 7.0% |
| 60 to 89 Minutes | 18 | 1.1% |
| 90 or more Minutes | 18 | 1.1% |
Commute Time by Sex in Forestville
The most common commute times in Forestville are 30 to 34 minutes (152 commuters, 20.0%) for males and 20 to 24 minutes (247 commuters, 29.4%) for females.
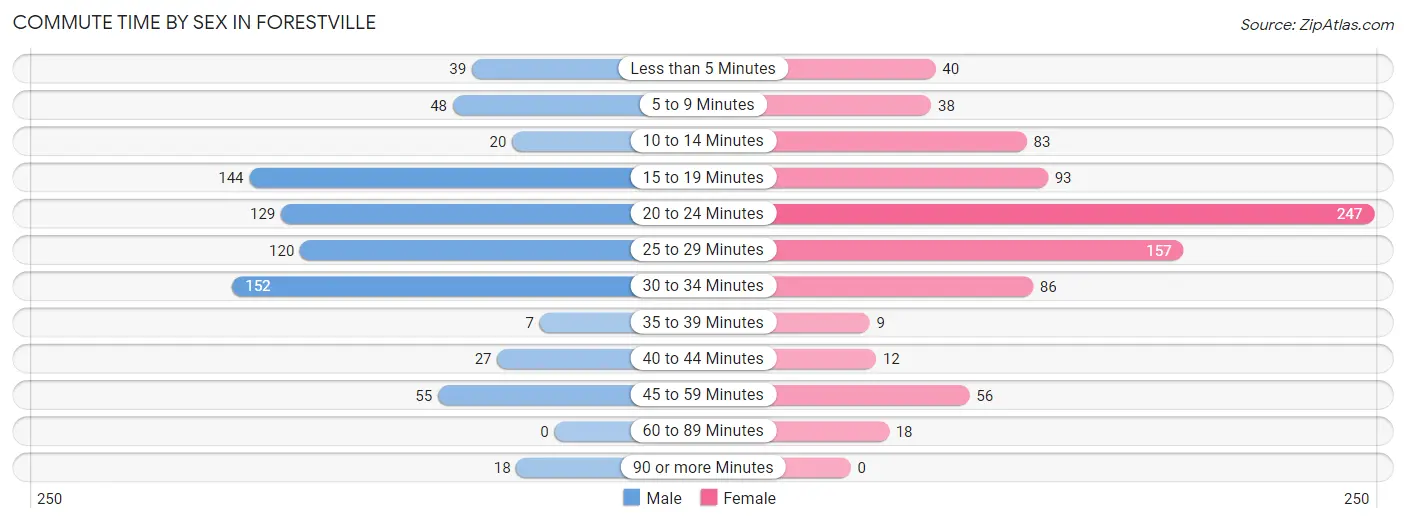
| Commute Time | Male | Female |
| Less than 5 Minutes | 39 (5.1%) | 40 (4.8%) |
| 5 to 9 Minutes | 48 (6.3%) | 38 (4.5%) |
| 10 to 14 Minutes | 20 (2.6%) | 83 (9.9%) |
| 15 to 19 Minutes | 144 (19.0%) | 93 (11.1%) |
| 20 to 24 Minutes | 129 (17.0%) | 247 (29.4%) |
| 25 to 29 Minutes | 120 (15.8%) | 157 (18.7%) |
| 30 to 34 Minutes | 152 (20.0%) | 86 (10.2%) |
| 35 to 39 Minutes | 7 (0.9%) | 9 (1.1%) |
| 40 to 44 Minutes | 27 (3.6%) | 12 (1.4%) |
| 45 to 59 Minutes | 55 (7.2%) | 56 (6.7%) |
| 60 to 89 Minutes | 0 (0.0%) | 18 (2.1%) |
| 90 or more Minutes | 18 (2.4%) | 0 (0.0%) |
Time of Departure to Work by Sex in Forestville
The most frequent times of departure to work in Forestville are 6:00 AM to 6:29 AM (202, 26.6%) for males and 8:00 AM to 8:29 AM (178, 21.2%) for females.
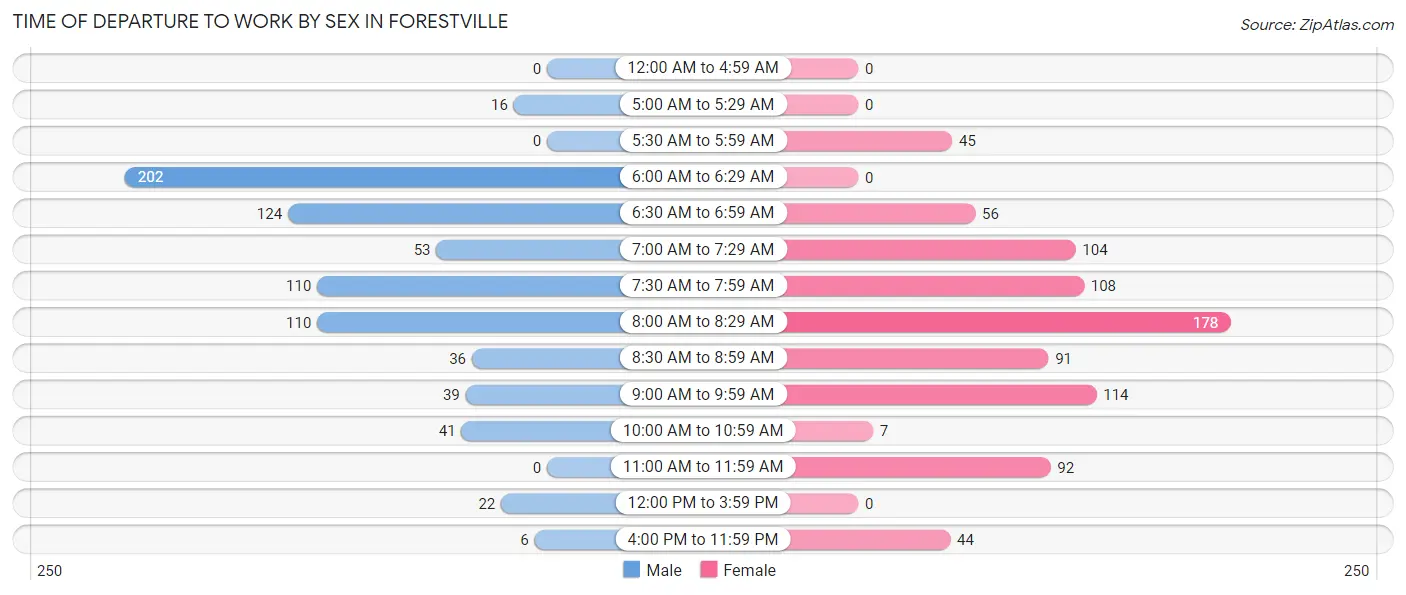
| Time of Departure | Male | Female |
| 12:00 AM to 4:59 AM | 0 (0.0%) | 0 (0.0%) |
| 5:00 AM to 5:29 AM | 16 (2.1%) | 0 (0.0%) |
| 5:30 AM to 5:59 AM | 0 (0.0%) | 45 (5.4%) |
| 6:00 AM to 6:29 AM | 202 (26.6%) | 0 (0.0%) |
| 6:30 AM to 6:59 AM | 124 (16.3%) | 56 (6.7%) |
| 7:00 AM to 7:29 AM | 53 (7.0%) | 104 (12.4%) |
| 7:30 AM to 7:59 AM | 110 (14.5%) | 108 (12.9%) |
| 8:00 AM to 8:29 AM | 110 (14.5%) | 178 (21.2%) |
| 8:30 AM to 8:59 AM | 36 (4.7%) | 91 (10.8%) |
| 9:00 AM to 9:59 AM | 39 (5.1%) | 114 (13.6%) |
| 10:00 AM to 10:59 AM | 41 (5.4%) | 7 (0.8%) |
| 11:00 AM to 11:59 AM | 0 (0.0%) | 92 (11.0%) |
| 12:00 PM to 3:59 PM | 22 (2.9%) | 0 (0.0%) |
| 4:00 PM to 11:59 PM | 6 (0.8%) | 44 (5.2%) |
| Total | 759 (100.0%) | 839 (100.0%) |
Housing Occupancy in Forestville
Occupancy by Ownership in Forestville
Of the total 1,471 dwellings in Forestville, owner-occupied units account for 1,035 (70.4%), while renter-occupied units make up 436 (29.6%).
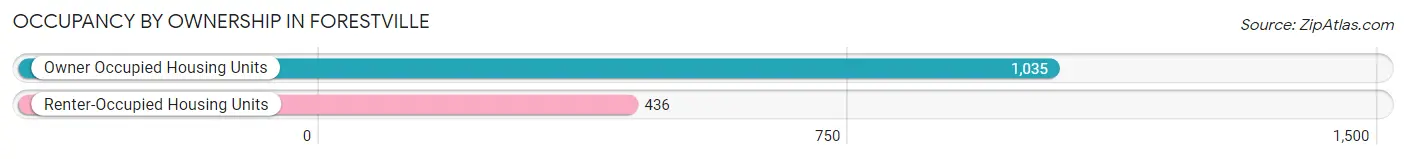
| Occupancy | # Housing Units | % Housing Units |
| Owner Occupied Housing Units | 1,035 | 70.4% |
| Renter-Occupied Housing Units | 436 | 29.6% |
| Total Occupied Housing Units | 1,471 | 100.0% |
Occupancy by Household Size in Forestville
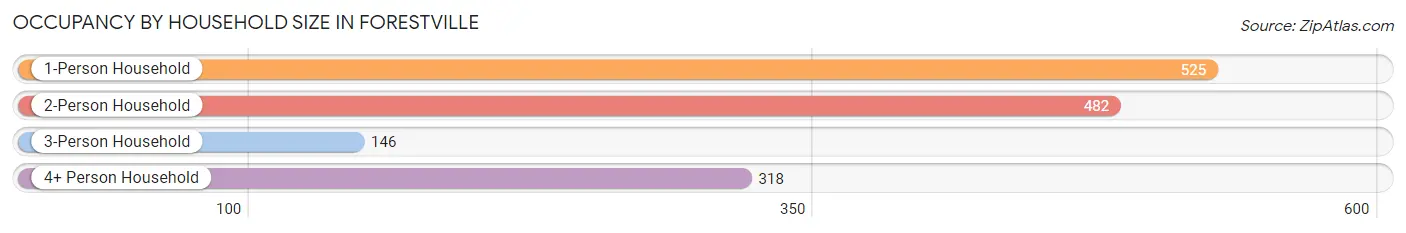
| Household Size | # Housing Units | % Housing Units |
| 1-Person Household | 525 | 35.7% |
| 2-Person Household | 482 | 32.8% |
| 3-Person Household | 146 | 9.9% |
| 4+ Person Household | 318 | 21.6% |
| Total Housing Units | 1,471 | 100.0% |
Occupancy by Ownership by Household Size in Forestville
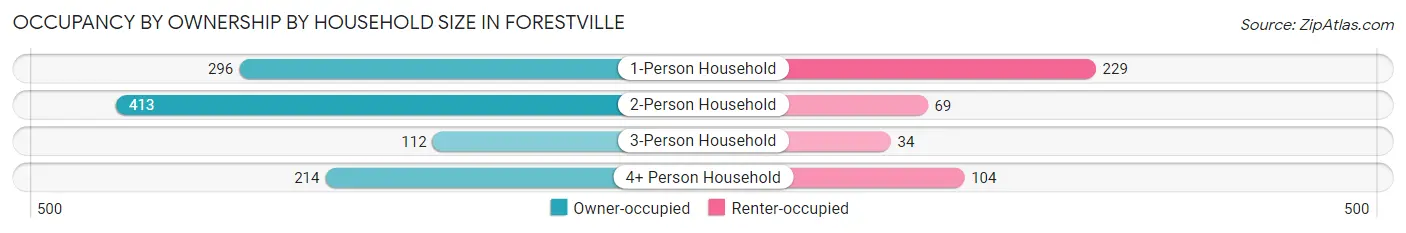
| Household Size | Owner-occupied | Renter-occupied |
| 1-Person Household | 296 (56.4%) | 229 (43.6%) |
| 2-Person Household | 413 (85.7%) | 69 (14.3%) |
| 3-Person Household | 112 (76.7%) | 34 (23.3%) |
| 4+ Person Household | 214 (67.3%) | 104 (32.7%) |
| Total Housing Units | 1,035 (70.4%) | 436 (29.6%) |
Occupancy by Educational Attainment in Forestville
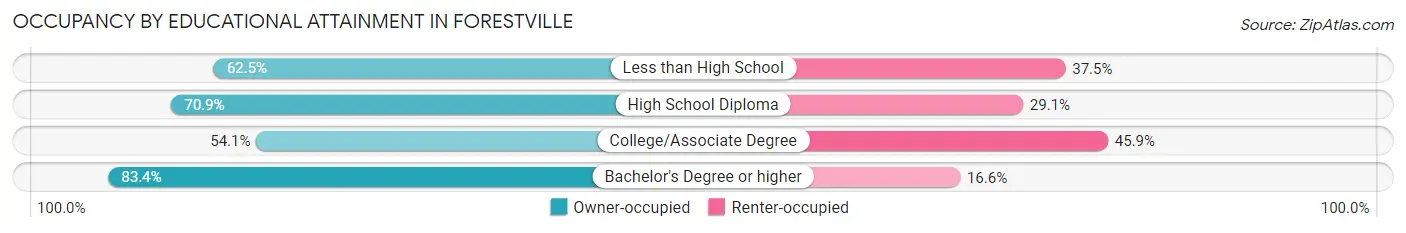
| Household Size | Owner-occupied | Renter-occupied |
| Less than High School | 15 (62.5%) | 9 (37.5%) |
| High School Diploma | 117 (70.9%) | 48 (29.1%) |
| College/Associate Degree | 306 (54.1%) | 260 (45.9%) |
| Bachelor's Degree or higher | 597 (83.4%) | 119 (16.6%) |
Occupancy by Age of Householder in Forestville
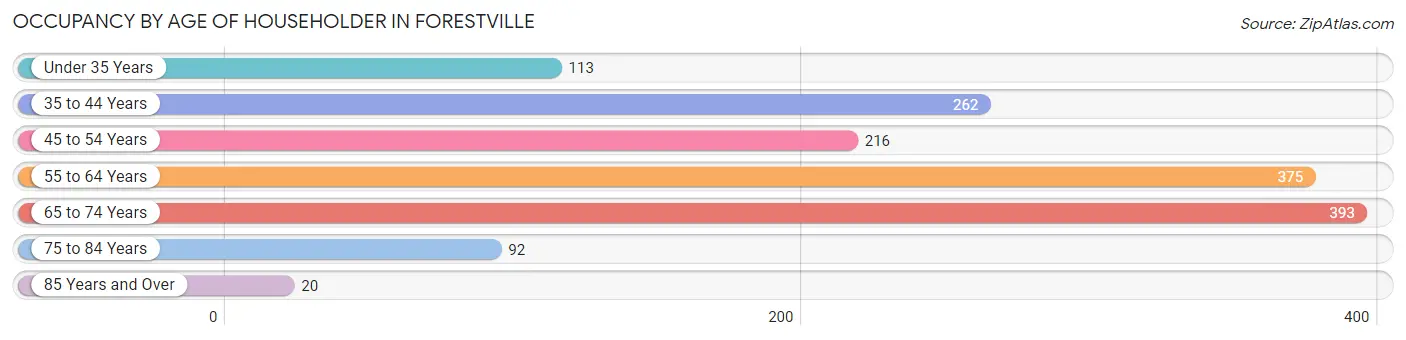
| Age Bracket | # Households | % Households |
| Under 35 Years | 113 | 7.7% |
| 35 to 44 Years | 262 | 17.8% |
| 45 to 54 Years | 216 | 14.7% |
| 55 to 64 Years | 375 | 25.5% |
| 65 to 74 Years | 393 | 26.7% |
| 75 to 84 Years | 92 | 6.2% |
| 85 Years and Over | 20 | 1.4% |
| Total | 1,471 | 100.0% |
Housing Finances in Forestville
Median Income by Occupancy in Forestville
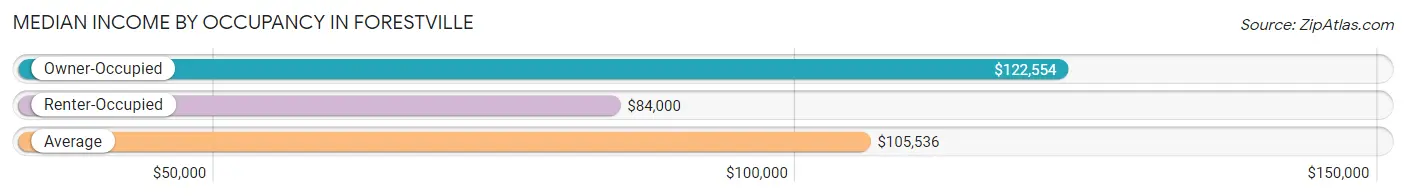
| Occupancy Type | # Households | Median Income |
| Owner-Occupied | 1,035 (70.4%) | $122,554 |
| Renter-Occupied | 436 (29.6%) | $84,000 |
| Average | 1,471 (100.0%) | $105,536 |
Occupancy by Householder Income Bracket in Forestville
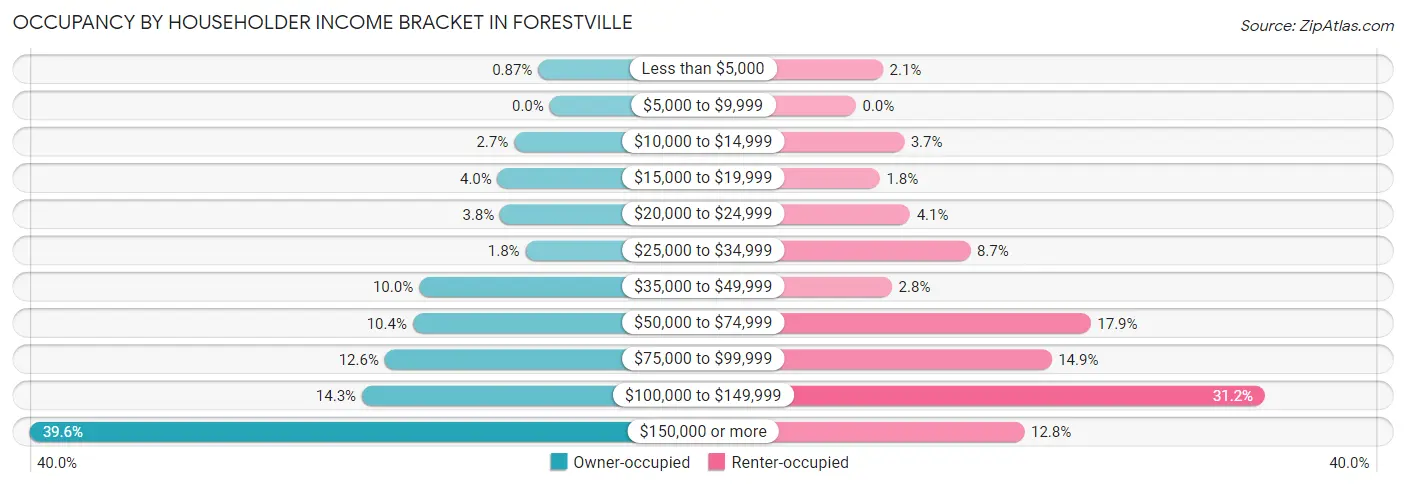
| Income Bracket | Owner-occupied | Renter-occupied |
| Less than $5,000 | 9 (0.9%) | 9 (2.1%) |
| $5,000 to $9,999 | 0 (0.0%) | 0 (0.0%) |
| $10,000 to $14,999 | 28 (2.7%) | 16 (3.7%) |
| $15,000 to $19,999 | 41 (4.0%) | 8 (1.8%) |
| $20,000 to $24,999 | 39 (3.8%) | 18 (4.1%) |
| $25,000 to $34,999 | 19 (1.8%) | 38 (8.7%) |
| $35,000 to $49,999 | 103 (10.0%) | 12 (2.8%) |
| $50,000 to $74,999 | 108 (10.4%) | 78 (17.9%) |
| $75,000 to $99,999 | 130 (12.6%) | 65 (14.9%) |
| $100,000 to $149,999 | 148 (14.3%) | 136 (31.2%) |
| $150,000 or more | 410 (39.6%) | 56 (12.8%) |
| Total | 1,035 (100.0%) | 436 (100.0%) |
Monthly Housing Cost Tiers in Forestville
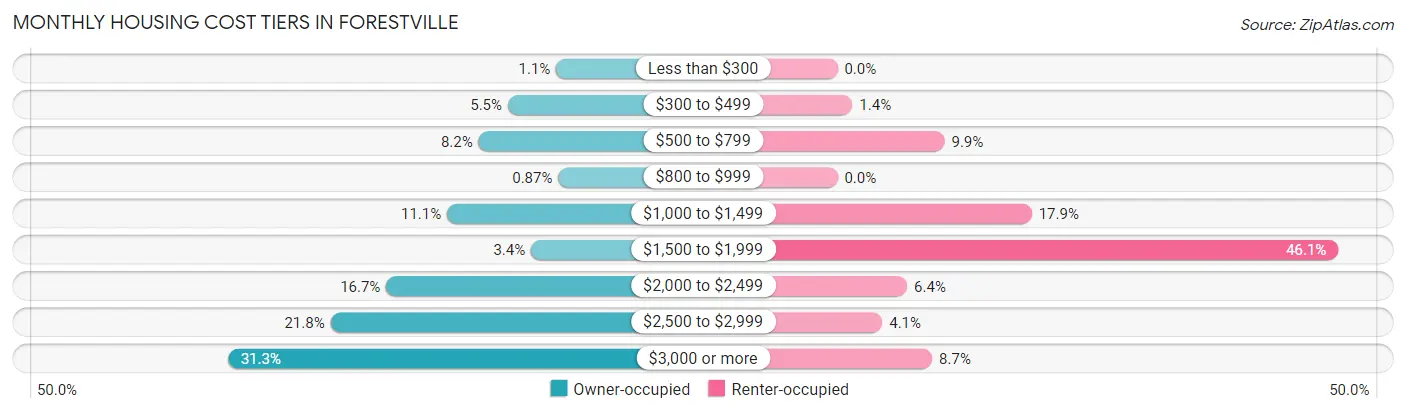
| Monthly Cost | Owner-occupied | Renter-occupied |
| Less than $300 | 11 (1.1%) | 0 (0.0%) |
| $300 to $499 | 57 (5.5%) | 6 (1.4%) |
| $500 to $799 | 85 (8.2%) | 43 (9.9%) |
| $800 to $999 | 9 (0.9%) | 0 (0.0%) |
| $1,000 to $1,499 | 115 (11.1%) | 78 (17.9%) |
| $1,500 to $1,999 | 35 (3.4%) | 201 (46.1%) |
| $2,000 to $2,499 | 173 (16.7%) | 28 (6.4%) |
| $2,500 to $2,999 | 226 (21.8%) | 18 (4.1%) |
| $3,000 or more | 324 (31.3%) | 38 (8.7%) |
| Total | 1,035 (100.0%) | 436 (100.0%) |
Physical Housing Characteristics in Forestville
Housing Structures in Forestville
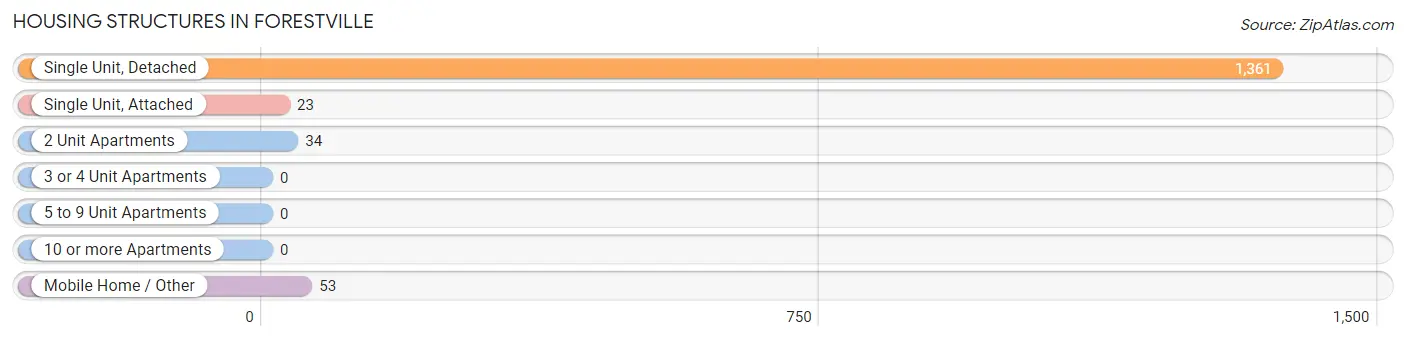
| Structure Type | # Housing Units | % Housing Units |
| Single Unit, Detached | 1,361 | 92.5% |
| Single Unit, Attached | 23 | 1.6% |
| 2 Unit Apartments | 34 | 2.3% |
| 3 or 4 Unit Apartments | 0 | 0.0% |
| 5 to 9 Unit Apartments | 0 | 0.0% |
| 10 or more Apartments | 0 | 0.0% |
| Mobile Home / Other | 53 | 3.6% |
| Total | 1,471 | 100.0% |
Housing Structures by Occupancy in Forestville
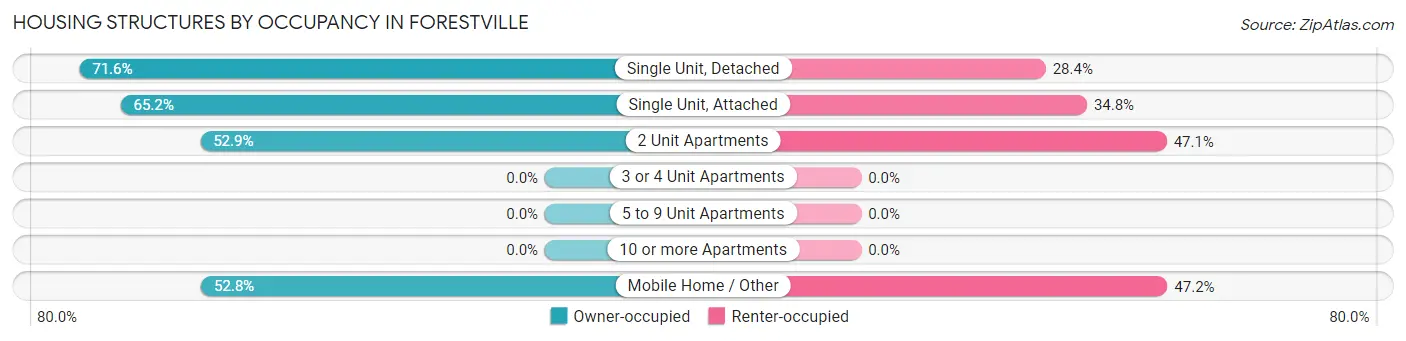
| Structure Type | Owner-occupied | Renter-occupied |
| Single Unit, Detached | 974 (71.6%) | 387 (28.4%) |
| Single Unit, Attached | 15 (65.2%) | 8 (34.8%) |
| 2 Unit Apartments | 18 (52.9%) | 16 (47.1%) |
| 3 or 4 Unit Apartments | 0 (0.0%) | 0 (0.0%) |
| 5 to 9 Unit Apartments | 0 (0.0%) | 0 (0.0%) |
| 10 or more Apartments | 0 (0.0%) | 0 (0.0%) |
| Mobile Home / Other | 28 (52.8%) | 25 (47.2%) |
| Total | 1,035 (70.4%) | 436 (29.6%) |
Housing Structures by Number of Rooms in Forestville
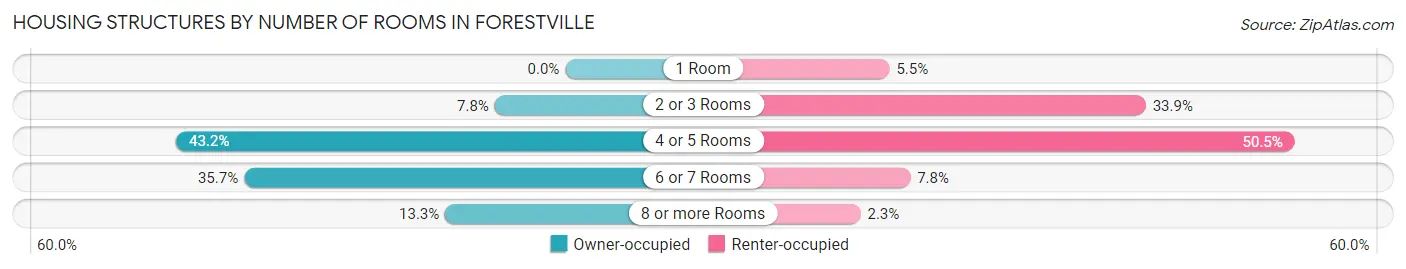
| Number of Rooms | Owner-occupied | Renter-occupied |
| 1 Room | 0 (0.0%) | 24 (5.5%) |
| 2 or 3 Rooms | 81 (7.8%) | 148 (33.9%) |
| 4 or 5 Rooms | 447 (43.2%) | 220 (50.5%) |
| 6 or 7 Rooms | 369 (35.6%) | 34 (7.8%) |
| 8 or more Rooms | 138 (13.3%) | 10 (2.3%) |
| Total | 1,035 (100.0%) | 436 (100.0%) |
Housing Structure by Heating Type in Forestville
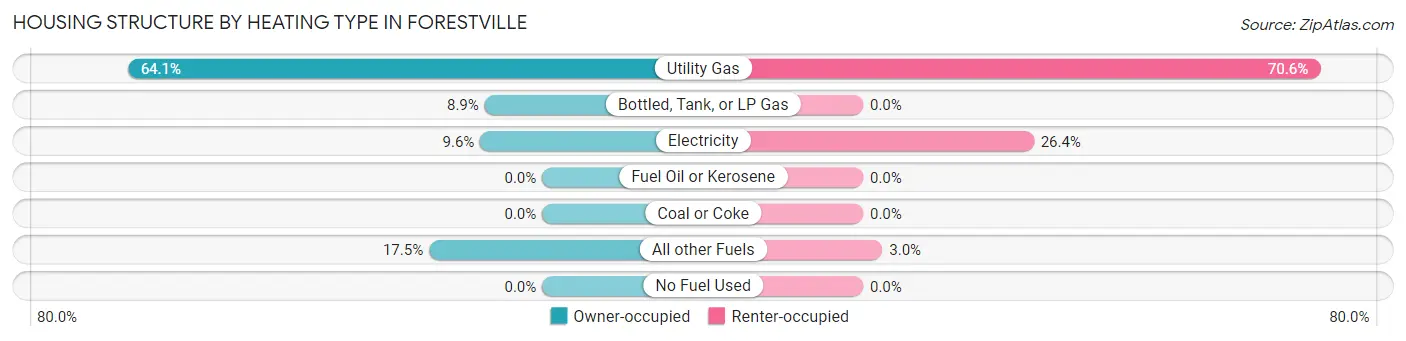
| Heating Type | Owner-occupied | Renter-occupied |
| Utility Gas | 663 (64.1%) | 308 (70.6%) |
| Bottled, Tank, or LP Gas | 92 (8.9%) | 0 (0.0%) |
| Electricity | 99 (9.6%) | 115 (26.4%) |
| Fuel Oil or Kerosene | 0 (0.0%) | 0 (0.0%) |
| Coal or Coke | 0 (0.0%) | 0 (0.0%) |
| All other Fuels | 181 (17.5%) | 13 (3.0%) |
| No Fuel Used | 0 (0.0%) | 0 (0.0%) |
| Total | 1,035 (100.0%) | 436 (100.0%) |
Household Vehicle Usage in Forestville
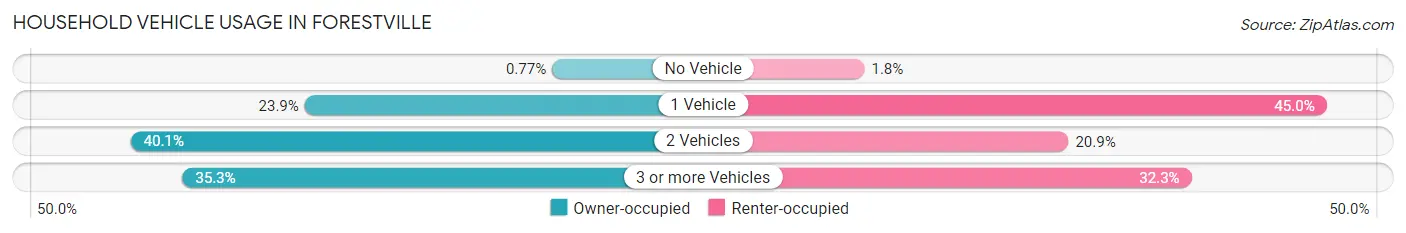
| Vehicles per Household | Owner-occupied | Renter-occupied |
| No Vehicle | 8 (0.8%) | 8 (1.8%) |
| 1 Vehicle | 247 (23.9%) | 196 (45.0%) |
| 2 Vehicles | 415 (40.1%) | 91 (20.9%) |
| 3 or more Vehicles | 365 (35.3%) | 141 (32.3%) |
| Total | 1,035 (100.0%) | 436 (100.0%) |
Real Estate & Mortgages in Forestville
Real Estate and Mortgage Overview in Forestville
| Characteristic | Without Mortgage | With Mortgage |
| Housing Units | 227 | 808 |
| Median Property Value | $632,800 | $698,400 |
| Median Household Income | $53,125 | $375 |
| Monthly Housing Costs | $636 | $324 |
| Real Estate Taxes | $2,871 | $20 |
Property Value by Mortgage Status in Forestville
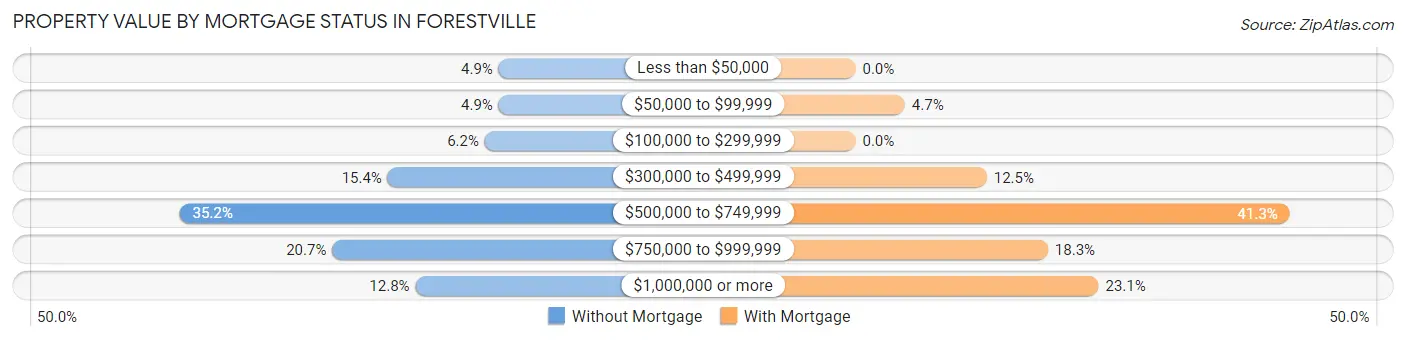
| Property Value | Without Mortgage | With Mortgage |
| Less than $50,000 | 11 (4.9%) | 0 (0.0%) |
| $50,000 to $99,999 | 11 (4.9%) | 38 (4.7%) |
| $100,000 to $299,999 | 14 (6.2%) | 0 (0.0%) |
| $300,000 to $499,999 | 35 (15.4%) | 101 (12.5%) |
| $500,000 to $749,999 | 80 (35.2%) | 334 (41.3%) |
| $750,000 to $999,999 | 47 (20.7%) | 148 (18.3%) |
| $1,000,000 or more | 29 (12.8%) | 187 (23.1%) |
| Total | 227 (100.0%) | 808 (100.0%) |
Household Income by Mortgage Status in Forestville
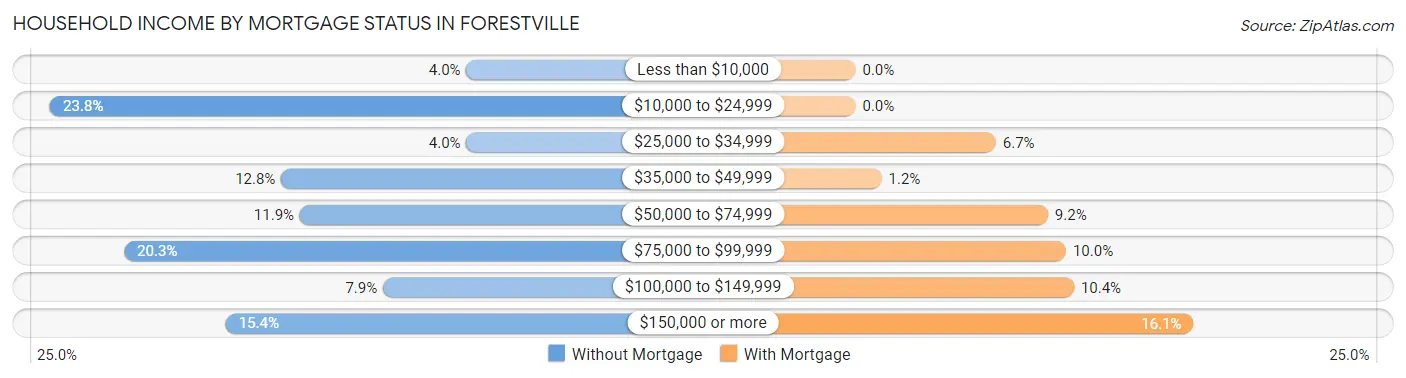
| Household Income | Without Mortgage | With Mortgage |
| Less than $10,000 | 9 (4.0%) | 0 (0.0%) |
| $10,000 to $24,999 | 54 (23.8%) | 0 (0.0%) |
| $25,000 to $34,999 | 9 (4.0%) | 54 (6.7%) |
| $35,000 to $49,999 | 29 (12.8%) | 10 (1.2%) |
| $50,000 to $74,999 | 27 (11.9%) | 74 (9.2%) |
| $75,000 to $99,999 | 46 (20.3%) | 81 (10.0%) |
| $100,000 to $149,999 | 18 (7.9%) | 84 (10.4%) |
| $150,000 or more | 35 (15.4%) | 130 (16.1%) |
| Total | 227 (100.0%) | 808 (100.0%) |
Property Value to Household Income Ratio in Forestville
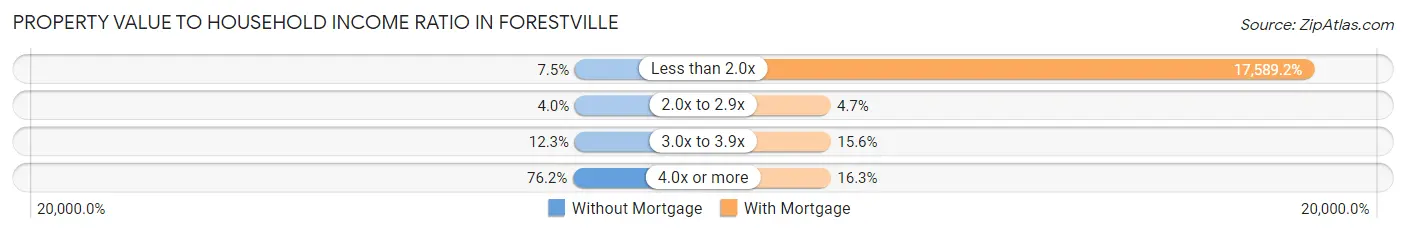
| Value-to-Income Ratio | Without Mortgage | With Mortgage |
| Less than 2.0x | 17 (7.5%) | 142,121 (17,589.2%) |
| 2.0x to 2.9x | 9 (4.0%) | 38 (4.7%) |
| 3.0x to 3.9x | 28 (12.3%) | 126 (15.6%) |
| 4.0x or more | 173 (76.2%) | 132 (16.3%) |
| Total | 227 (100.0%) | 808 (100.0%) |
Real Estate Taxes by Mortgage Status in Forestville
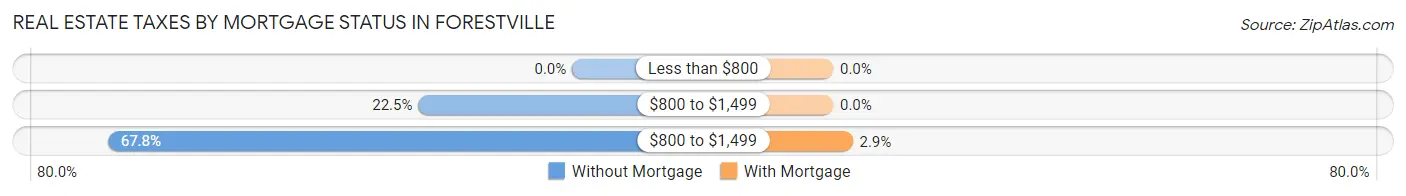
| Property Taxes | Without Mortgage | With Mortgage |
| Less than $800 | 0 (0.0%) | 0 (0.0%) |
| $800 to $1,499 | 51 (22.5%) | 0 (0.0%) |
| $800 to $1,499 | 154 (67.8%) | 23 (2.9%) |
| Total | 227 (100.0%) | 808 (100.0%) |
Health & Disability in Forestville
Health Insurance Coverage by Age in Forestville
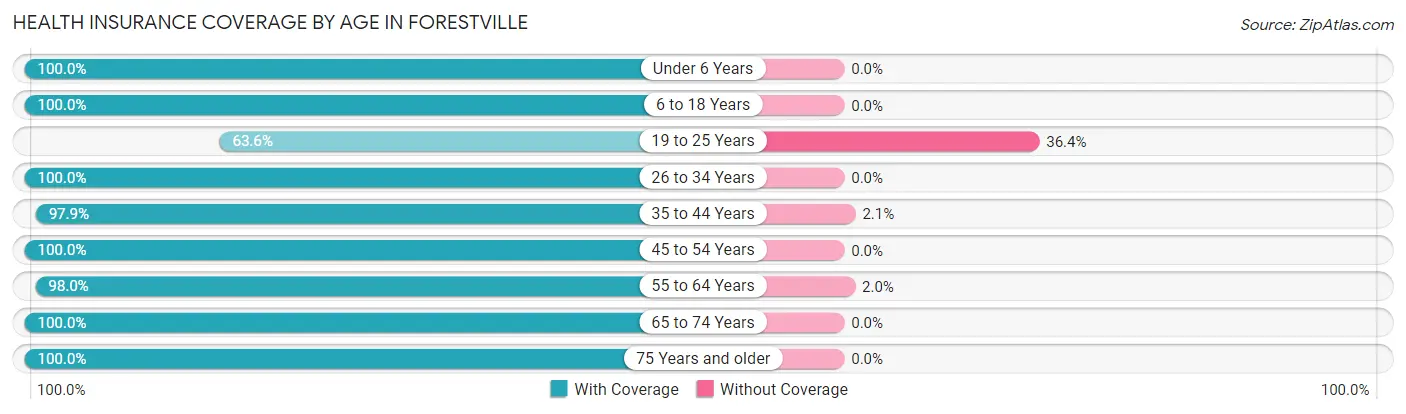
| Age Bracket | With Coverage | Without Coverage |
| Under 6 Years | 148 (100.0%) | 0 (0.0%) |
| 6 to 18 Years | 509 (100.0%) | 0 (0.0%) |
| 19 to 25 Years | 84 (63.6%) | 48 (36.4%) |
| 26 to 34 Years | 356 (100.0%) | 0 (0.0%) |
| 35 to 44 Years | 659 (97.9%) | 14 (2.1%) |
| 45 to 54 Years | 342 (100.0%) | 0 (0.0%) |
| 55 to 64 Years | 678 (98.0%) | 14 (2.0%) |
| 65 to 74 Years | 533 (100.0%) | 0 (0.0%) |
| 75 Years and older | 247 (100.0%) | 0 (0.0%) |
| Total | 3,556 (97.9%) | 76 (2.1%) |
Health Insurance Coverage by Citizenship Status in Forestville
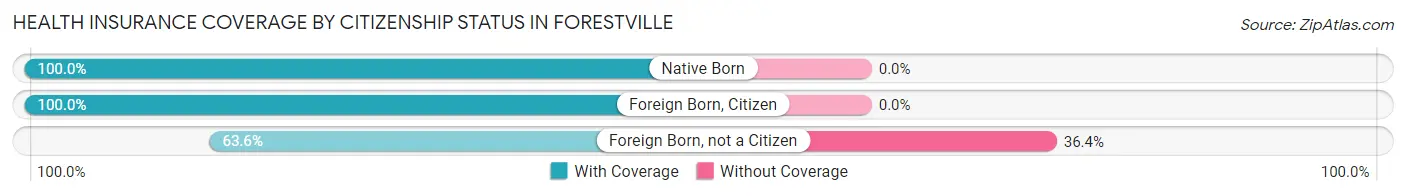
| Citizenship Status | With Coverage | Without Coverage |
| Native Born | 148 (100.0%) | 0 (0.0%) |
| Foreign Born, Citizen | 509 (100.0%) | 0 (0.0%) |
| Foreign Born, not a Citizen | 84 (63.6%) | 48 (36.4%) |
Health Insurance Coverage by Household Income in Forestville
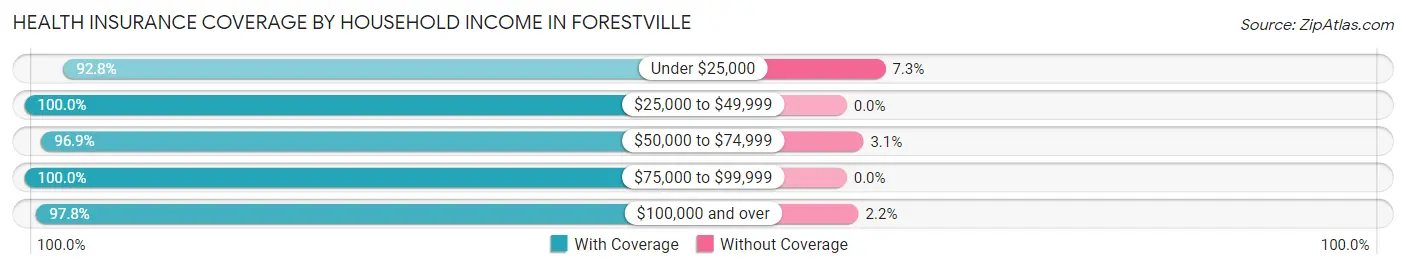
| Household Income | With Coverage | Without Coverage |
| Under $25,000 | 179 (92.7%) | 14 (7.2%) |
| $25,000 to $49,999 | 280 (100.0%) | 0 (0.0%) |
| $50,000 to $74,999 | 371 (96.9%) | 12 (3.1%) |
| $75,000 to $99,999 | 475 (100.0%) | 0 (0.0%) |
| $100,000 and over | 2,199 (97.8%) | 50 (2.2%) |
Public vs Private Health Insurance Coverage by Age in Forestville
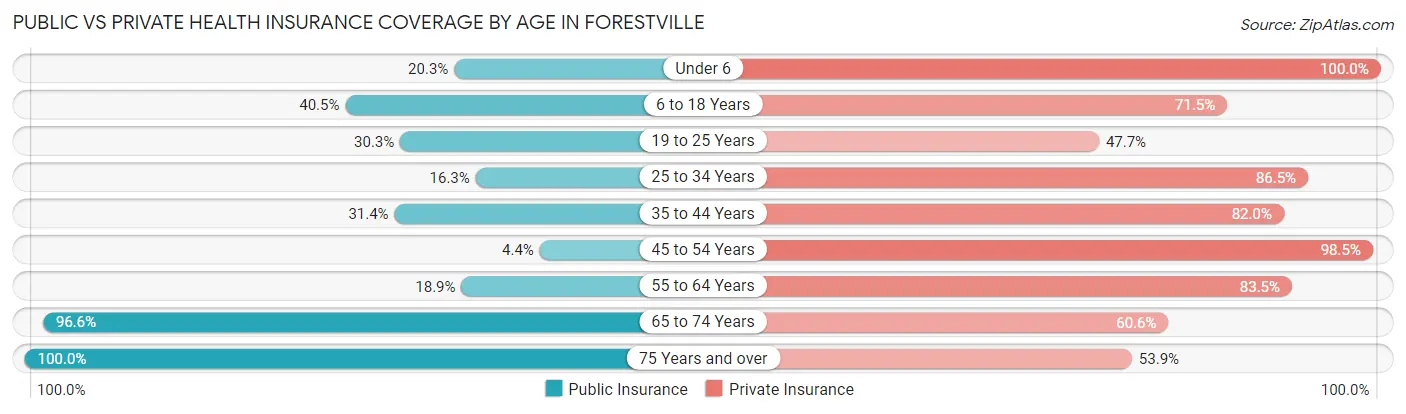
| Age Bracket | Public Insurance | Private Insurance |
| Under 6 | 30 (20.3%) | 148 (100.0%) |
| 6 to 18 Years | 206 (40.5%) | 364 (71.5%) |
| 19 to 25 Years | 40 (30.3%) | 63 (47.7%) |
| 25 to 34 Years | 58 (16.3%) | 308 (86.5%) |
| 35 to 44 Years | 211 (31.4%) | 552 (82.0%) |
| 45 to 54 Years | 15 (4.4%) | 337 (98.5%) |
| 55 to 64 Years | 131 (18.9%) | 578 (83.5%) |
| 65 to 74 Years | 515 (96.6%) | 323 (60.6%) |
| 75 Years and over | 247 (100.0%) | 133 (53.8%) |
| Total | 1,453 (40.0%) | 2,806 (77.3%) |
Disability Status by Sex by Age in Forestville
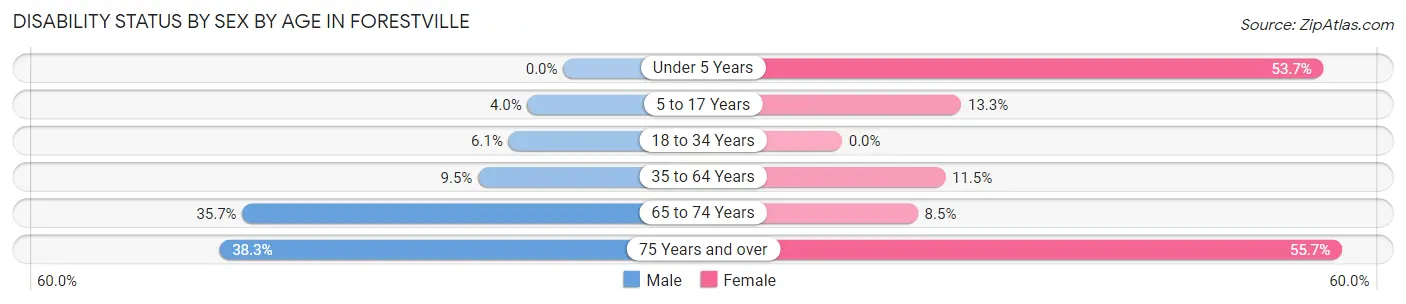
| Age Bracket | Male | Female |
| Under 5 Years | 0 (0.0%) | 22 (53.7%) |
| 5 to 17 Years | 11 (4.0%) | 32 (13.3%) |
| 18 to 34 Years | 18 (6.1%) | 0 (0.0%) |
| 35 to 64 Years | 77 (9.5%) | 103 (11.5%) |
| 65 to 74 Years | 89 (35.7%) | 24 (8.5%) |
| 75 Years and over | 41 (38.3%) | 78 (55.7%) |
Disability Class by Sex by Age in Forestville
Disability Class: Hearing Difficulty
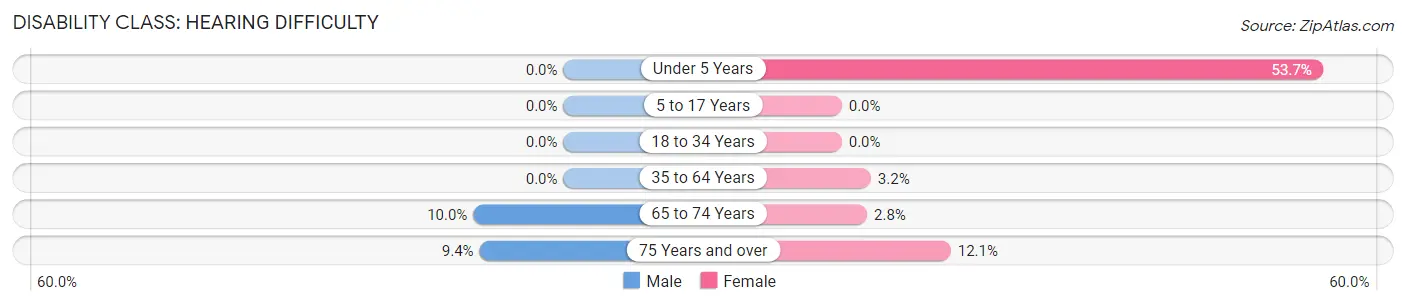
| Age Bracket | Male | Female |
| Under 5 Years | 0 (0.0%) | 22 (53.7%) |
| 5 to 17 Years | 0 (0.0%) | 0 (0.0%) |
| 18 to 34 Years | 0 (0.0%) | 0 (0.0%) |
| 35 to 64 Years | 0 (0.0%) | 29 (3.2%) |
| 65 to 74 Years | 25 (10.0%) | 8 (2.8%) |
| 75 Years and over | 10 (9.3%) | 17 (12.1%) |
Disability Class: Vision Difficulty
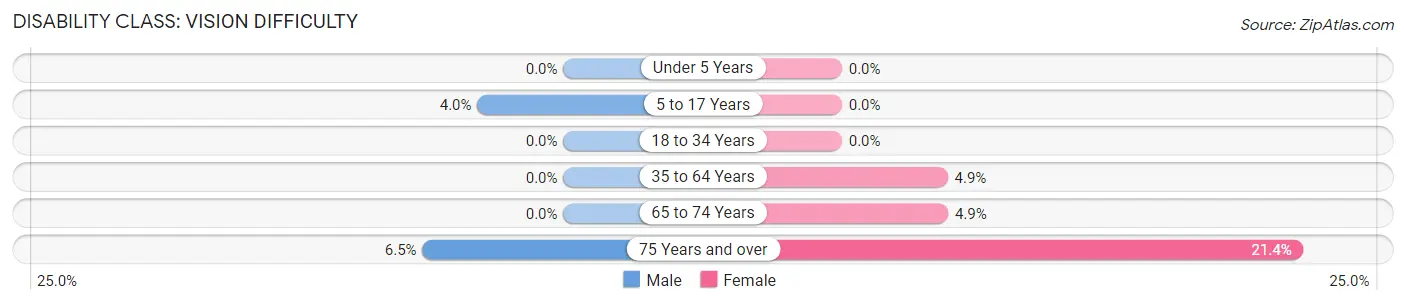
| Age Bracket | Male | Female |
| Under 5 Years | 0 (0.0%) | 0 (0.0%) |
| 5 to 17 Years | 11 (4.0%) | 0 (0.0%) |
| 18 to 34 Years | 0 (0.0%) | 0 (0.0%) |
| 35 to 64 Years | 0 (0.0%) | 44 (4.9%) |
| 65 to 74 Years | 0 (0.0%) | 14 (4.9%) |
| 75 Years and over | 7 (6.5%) | 30 (21.4%) |
Disability Class: Cognitive Difficulty
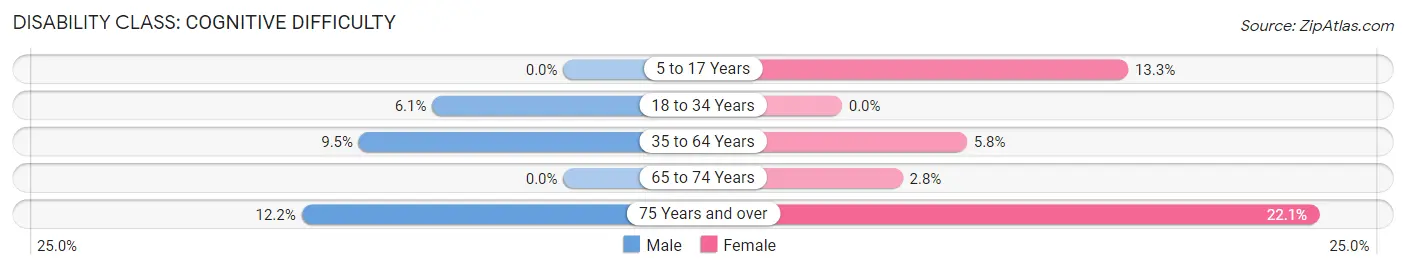
| Age Bracket | Male | Female |
| 5 to 17 Years | 0 (0.0%) | 32 (13.3%) |
| 18 to 34 Years | 18 (6.1%) | 0 (0.0%) |
| 35 to 64 Years | 77 (9.5%) | 52 (5.8%) |
| 65 to 74 Years | 0 (0.0%) | 8 (2.8%) |
| 75 Years and over | 13 (12.1%) | 31 (22.1%) |
Disability Class: Ambulatory Difficulty
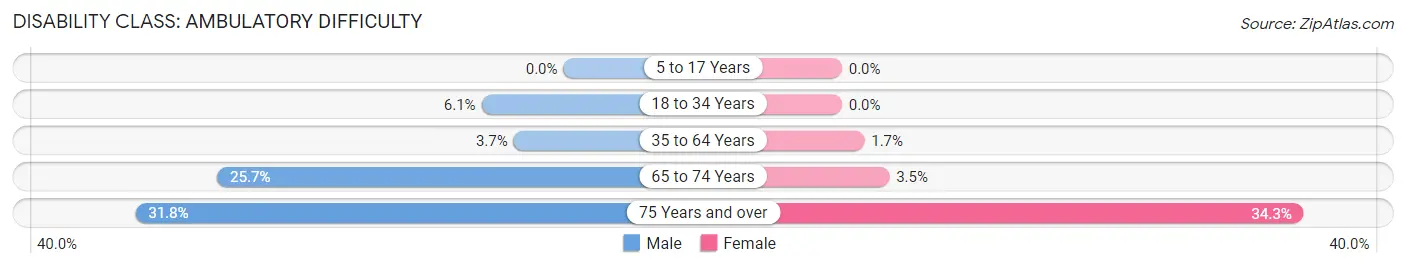
| Age Bracket | Male | Female |
| 5 to 17 Years | 0 (0.0%) | 0 (0.0%) |
| 18 to 34 Years | 18 (6.1%) | 0 (0.0%) |
| 35 to 64 Years | 30 (3.7%) | 15 (1.7%) |
| 65 to 74 Years | 64 (25.7%) | 10 (3.5%) |
| 75 Years and over | 34 (31.8%) | 48 (34.3%) |
Disability Class: Self-Care Difficulty
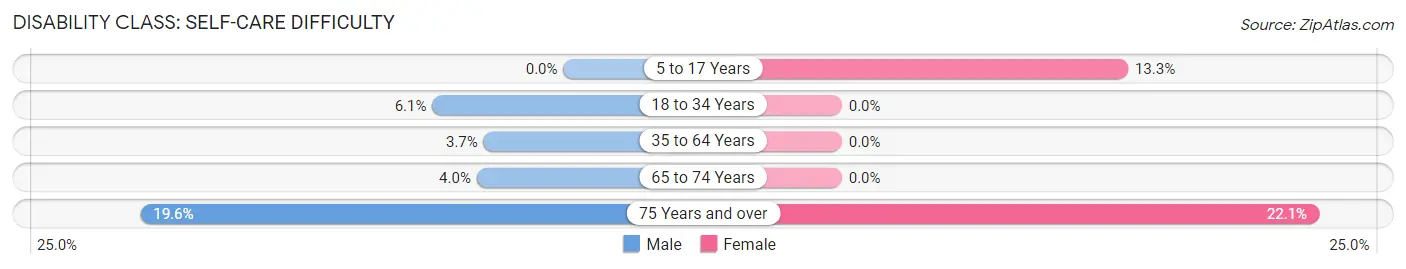
| Age Bracket | Male | Female |
| 5 to 17 Years | 0 (0.0%) | 32 (13.3%) |
| 18 to 34 Years | 18 (6.1%) | 0 (0.0%) |
| 35 to 64 Years | 30 (3.7%) | 0 (0.0%) |
| 65 to 74 Years | 10 (4.0%) | 0 (0.0%) |
| 75 Years and over | 21 (19.6%) | 31 (22.1%) |
Technology Access in Forestville
Computing Device Access in Forestville
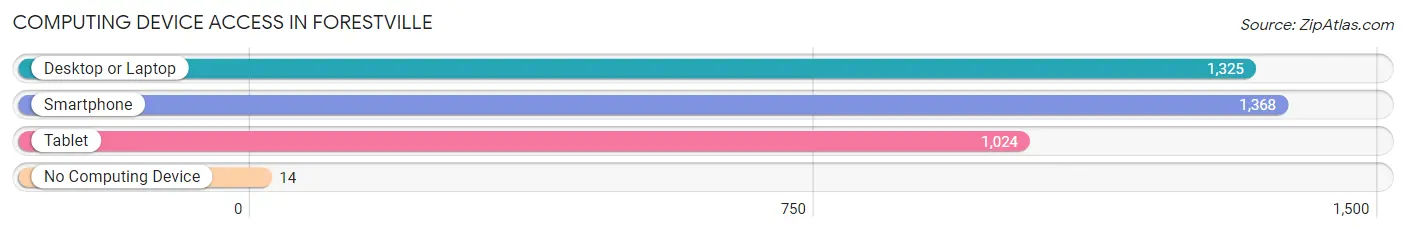
| Device Type | # Households | % Households |
| Desktop or Laptop | 1,325 | 90.1% |
| Smartphone | 1,368 | 93.0% |
| Tablet | 1,024 | 69.6% |
| No Computing Device | 14 | 0.9% |
| Total | 1,471 | 100.0% |
Internet Access in Forestville
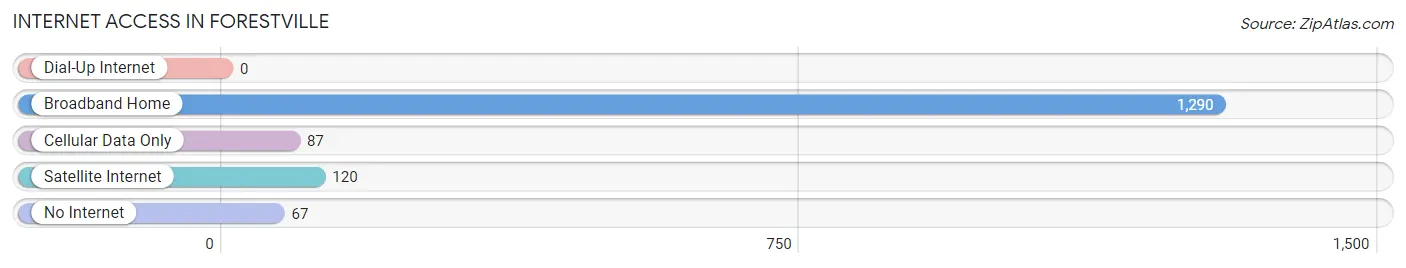
| Internet Type | # Households | % Households |
| Dial-Up Internet | 0 | 0.0% |
| Broadband Home | 1,290 | 87.7% |
| Cellular Data Only | 87 | 5.9% |
| Satellite Internet | 120 | 8.2% |
| No Internet | 67 | 4.5% |
| Total | 1,471 | 100.0% |
Forestville Summary
History
The small town of Forestville, California is located in Sonoma County, about an hour north of San Francisco. It is a rural community with a population of about 3,000 people. The town was founded in 1867 by William B. Ide, a former California governor, and was originally called Ideville. Ide named the town after the nearby forest, and it was later changed to Forestville.
The town was originally a logging and lumber town, and the first sawmill was built in 1868. The town grew quickly, and by the early 1900s, it had become a popular tourist destination. The town was known for its natural beauty, and it was a popular spot for fishing, hunting, and camping.
In the early 1900s, the town was also home to a number of wineries, and it became known as the “Burgundy of California.” The wineries were popular with tourists, and the town was known for its excellent wines.
In the 1950s, the town began to decline as the logging industry declined and the wineries closed. The town was in danger of becoming a ghost town, but in the 1970s, it began to experience a revival. The town was revitalized by the influx of new residents, and it became a popular destination for retirees and second-home owners.
Today, Forestville is a small, rural community with a population of about 3,000 people. It is a popular destination for tourists, and it is known for its natural beauty and its excellent wines.
Geography
Forestville is located in Sonoma County, about an hour north of San Francisco. It is situated in the Russian River Valley, and it is surrounded by rolling hills and vineyards. The town is located at the intersection of Highways 116 and 116A, and it is about 10 miles from the Pacific Ocean.
The town is located in a temperate climate, and it has mild winters and warm summers. The average temperature in the summer is around 70 degrees Fahrenheit, and the average temperature in the winter is around 50 degrees Fahrenheit.
The town is located in a rural area, and it is surrounded by vineyards, farms, and forests. The nearby Russian River is a popular spot for fishing, swimming, and boating.
Economy
The economy of Forestville is largely based on tourism and agriculture. The town is a popular destination for tourists, and it is known for its natural beauty and its excellent wines. The nearby vineyards are a popular destination for wine tasting, and the town is also home to a number of wineries.
The town is also home to a number of small businesses, including restaurants, shops, and galleries. The town is also home to a number of small farms, and it is a popular destination for farmers’ markets.
Demographics
As of the 2010 census, the population of Forestville was 3,293. The population is largely white (90.2%), with a small percentage of Hispanic (4.2%) and Asian (2.2%) residents. The median household income is $60,000, and the median age is 44.
The town is largely rural, and it is home to a number of small farms and vineyards. The town is also home to a number of retirees and second-home owners. The town is known for its natural beauty and its excellent wines, and it is a popular destination for tourists.
Common Questions
What is Per Capita Income in Forestville?
Per Capita income in Forestville is $52,628.
What is the Median Family Income in Forestville?
Median Family Income in Forestville is $133,333.
What is the Median Household income in Forestville?
Median Household Income in Forestville is $105,536.
What is Income or Wage Gap in Forestville?
Income or Wage Gap in Forestville is 47.2%.
Women in Forestville earn 52.8 cents for every dollar earned by a man.
What is Inequality or Gini Index in Forestville?
Inequality or Gini Index in Forestville is 0.40.
What is the Total Population of Forestville?
Total Population of Forestville is 3,632.
What is the Total Male Population of Forestville?
Total Male Population of Forestville is 1,830.
What is the Total Female Population of Forestville?
Total Female Population of Forestville is 1,802.
What is the Ratio of Males per 100 Females in Forestville?
There are 101.55 Males per 100 Females in Forestville.
What is the Ratio of Females per 100 Males in Forestville?
There are 98.47 Females per 100 Males in Forestville.
What is the Median Population Age in Forestville?
Median Population Age in Forestville is 45.0 Years.
What is the Average Family Size in Forestville
Average Family Size in Forestville is 3.2 People.
What is the Average Household Size in Forestville
Average Household Size in Forestville is 2.4 People.
How Large is the Labor Force in Forestville?
There are 2,068 People in the Labor Forcein in Forestville.
What is the Percentage of People in the Labor Force in Forestville?
66.6% of People are in the Labor Force in Forestville.
What is the Unemployment Rate in Forestville?
Unemployment Rate in Forestville is 3.9%.