Fallbrook, CA Map & Demographics
Fallbrook Map
Fallbrook Overview
$33,073
PER CAPITA INCOME
$87,927
AVG FAMILY INCOME
$78,479
AVG HOUSEHOLD INCOME
27.1%
WAGE / INCOME GAP [ % ]
72.9¢/ $1
WAGE / INCOME GAP [ $ ]
$9,907
FAMILY INCOME DEFICIT
0.43
INEQUALITY / GINI INDEX
33,710
TOTAL POPULATION
16,960
MALE POPULATION
16,750
FEMALE POPULATION
101.25
MALES / 100 FEMALES
98.76
FEMALES / 100 MALES
33.9
MEDIAN AGE
3.6
AVG FAMILY SIZE
3.2
AVG HOUSEHOLD SIZE
15,550
LABOR FORCE [ PEOPLE ]
60.3%
PERCENT IN LABOR FORCE
7.4%
UNEMPLOYMENT RATE
Fallbrook Zip Codes
Income in Fallbrook
Income Overview in Fallbrook
Per Capita Income in Fallbrook is $33,073, while median incomes of families and households are $87,927 and $78,479 respectively.
| Characteristic | Number | Measure |
| Per Capita Income | 33,710 | $33,073 |
| Median Family Income | 8,129 | $87,927 |
| Mean Family Income | 8,129 | $108,904 |
| Median Household Income | 10,334 | $78,479 |
| Mean Household Income | 10,334 | $103,534 |
| Income Deficit | 8,129 | $9,907 |
| Wage / Income Gap (%) | 33,710 | 27.14% |
| Wage / Income Gap ($) | 33,710 | 72.86¢ per $1 |
| Gini / Inequality Index | 33,710 | 0.43 |
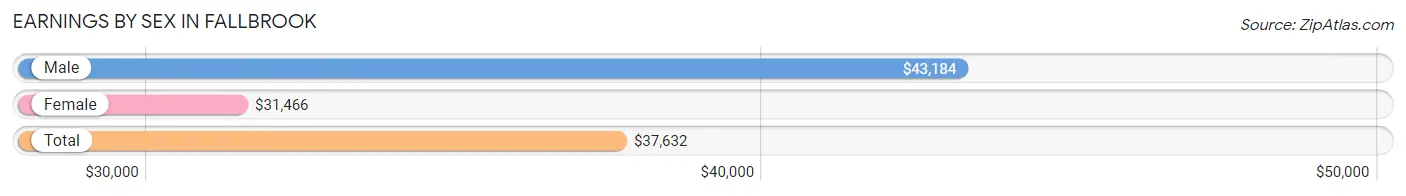
Earnings by Sex in Fallbrook
Average Earnings in Fallbrook are $37,632, $43,184 for men and $31,466 for women, a difference of 27.1%.
| Sex | Number | Average Earnings |
| Male | 8,473 (53.8%) | $43,184 |
| Female | 7,264 (46.2%) | $31,466 |
| Total | 15,737 (100.0%) | $37,632 |
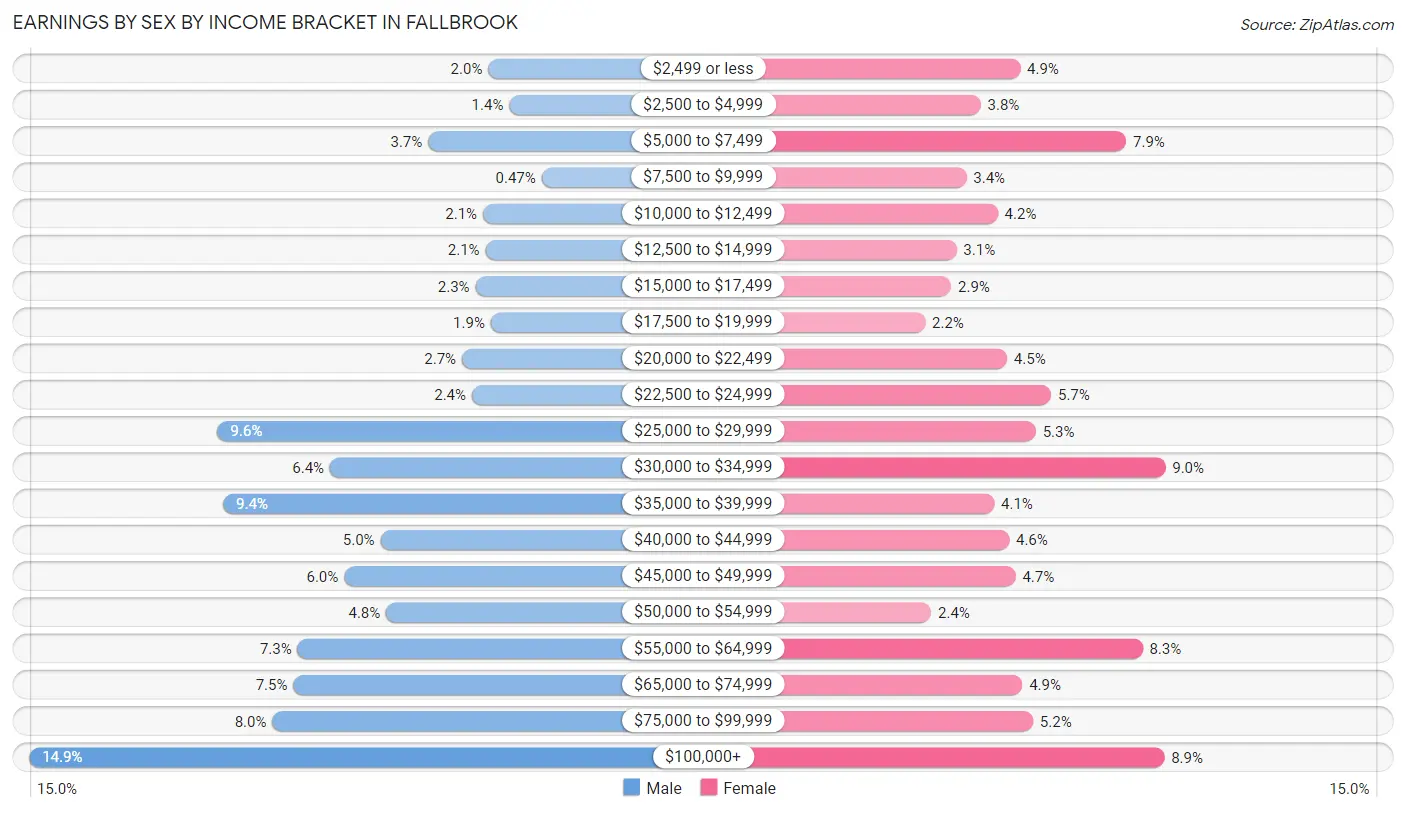
Earnings by Sex by Income Bracket in Fallbrook
The most common earnings brackets in Fallbrook are $100,000+ for men (1,260 | 14.9%) and $30,000 to $34,999 for women (650 | 8.9%).
| Income | Male | Female |
| $2,499 or less | 167 (2.0%) | 354 (4.9%) |
| $2,500 to $4,999 | 117 (1.4%) | 273 (3.8%) |
| $5,000 to $7,499 | 310 (3.7%) | 570 (7.9%) |
| $7,500 to $9,999 | 40 (0.5%) | 244 (3.4%) |
| $10,000 to $12,499 | 180 (2.1%) | 308 (4.2%) |
| $12,500 to $14,999 | 174 (2.1%) | 224 (3.1%) |
| $15,000 to $17,499 | 197 (2.3%) | 213 (2.9%) |
| $17,500 to $19,999 | 161 (1.9%) | 160 (2.2%) |
| $20,000 to $22,499 | 230 (2.7%) | 327 (4.5%) |
| $22,500 to $24,999 | 206 (2.4%) | 417 (5.7%) |
| $25,000 to $29,999 | 812 (9.6%) | 386 (5.3%) |
| $30,000 to $34,999 | 544 (6.4%) | 650 (8.9%) |
| $35,000 to $39,999 | 798 (9.4%) | 301 (4.1%) |
| $40,000 to $44,999 | 424 (5.0%) | 331 (4.6%) |
| $45,000 to $49,999 | 510 (6.0%) | 344 (4.7%) |
| $50,000 to $54,999 | 410 (4.8%) | 172 (2.4%) |
| $55,000 to $64,999 | 621 (7.3%) | 604 (8.3%) |
| $65,000 to $74,999 | 631 (7.4%) | 358 (4.9%) |
| $75,000 to $99,999 | 681 (8.0%) | 380 (5.2%) |
| $100,000+ | 1,260 (14.9%) | 648 (8.9%) |
| Total | 8,473 (100.0%) | 7,264 (100.0%) |
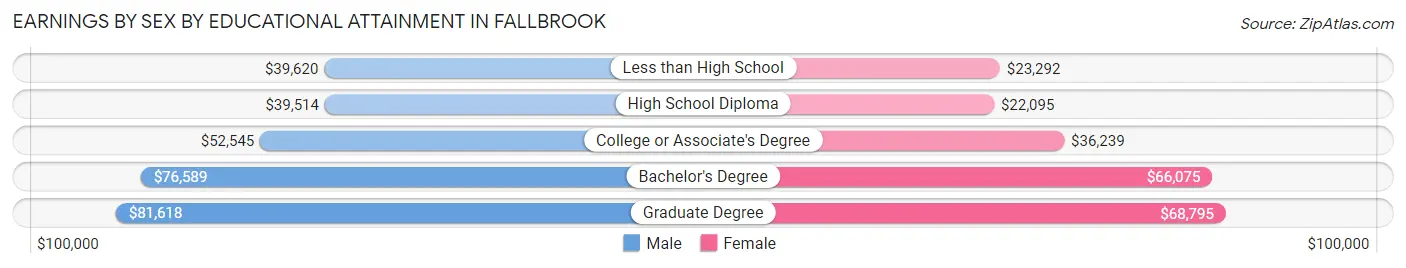
Earnings by Sex by Educational Attainment in Fallbrook
Average earnings in Fallbrook are $48,566 for men and $33,879 for women, a difference of 30.2%. Men with an educational attainment of graduate degree enjoy the highest average annual earnings of $81,618, while those with high school diploma education earn the least with $39,514. Women with an educational attainment of graduate degree earn the most with the average annual earnings of $68,795, while those with high school diploma education have the smallest earnings of $22,095.
| Educational Attainment | Male Income | Female Income |
| Less than High School | $39,620 | $23,292 |
| High School Diploma | $39,514 | $22,095 |
| College or Associate's Degree | $52,545 | $36,239 |
| Bachelor's Degree | $76,589 | $66,075 |
| Graduate Degree | $81,618 | $68,795 |
| Total | $48,566 | $33,879 |
Family Income in Fallbrook
Family Income Brackets in Fallbrook
According to the Fallbrook family income data, there are 1,496 families falling into the $100,000 to $149,999 income range, which is the most common income bracket and makes up 18.4% of all families. Conversely, the $10,000 to $14,999 income bracket is the least frequent group with only 138 families (1.7%) belonging to this category.
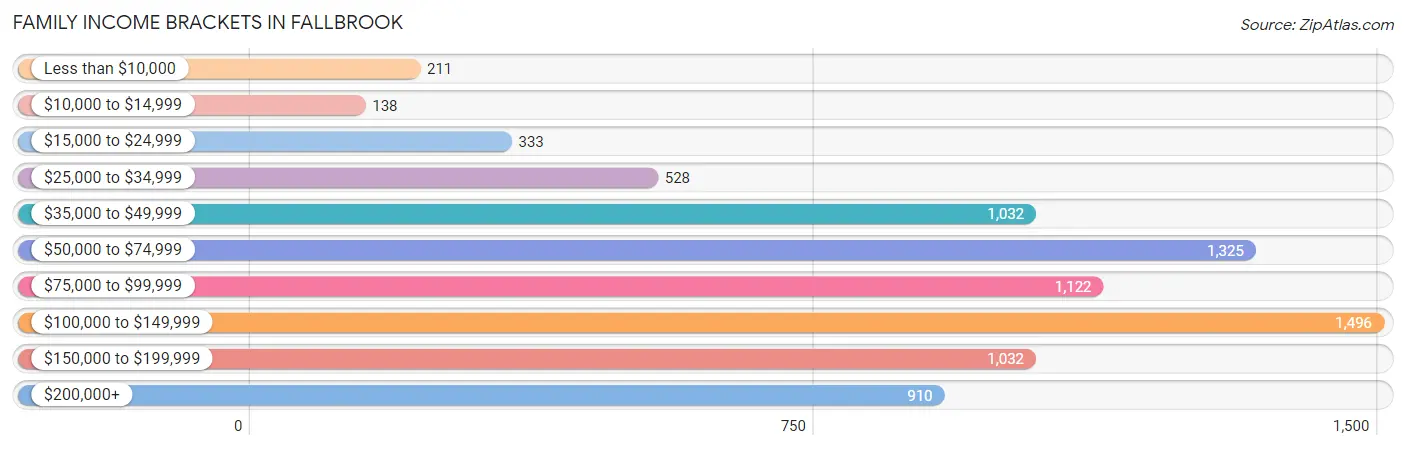
| Income Bracket | # Families | % Families |
| Less than $10,000 | 211 | 2.6% |
| $10,000 to $14,999 | 138 | 1.7% |
| $15,000 to $24,999 | 333 | 4.1% |
| $25,000 to $34,999 | 528 | 6.5% |
| $35,000 to $49,999 | 1,032 | 12.7% |
| $50,000 to $74,999 | 1,325 | 16.3% |
| $75,000 to $99,999 | 1,122 | 13.8% |
| $100,000 to $149,999 | 1,496 | 18.4% |
| $150,000 to $199,999 | 1,032 | 12.7% |
| $200,000+ | 910 | 11.2% |
Family Income by Famaliy Size in Fallbrook
5-person families (935 | 11.5%) account for the highest median family income in Fallbrook with $91,250 per family, while 2-person families (3,216 | 39.6%) have the highest median income of $45,110 per family member.
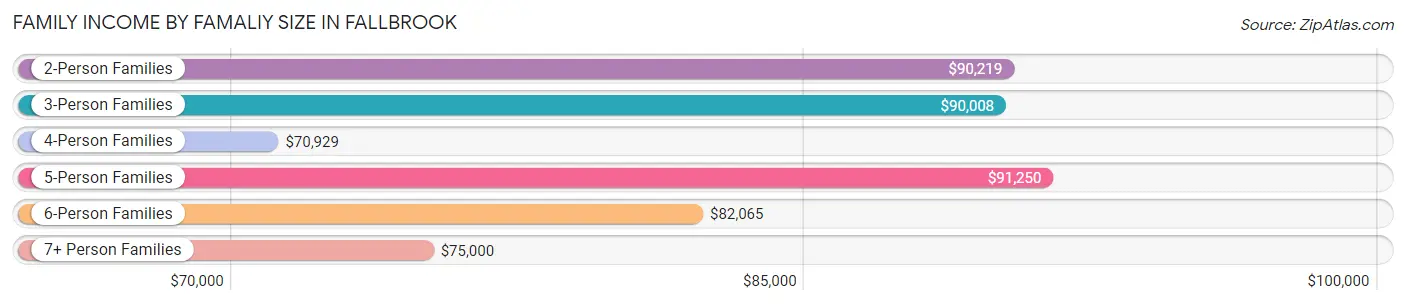
| Income Bracket | # Families | Median Income |
| 2-Person Families | 3,216 (39.6%) | $90,219 |
| 3-Person Families | 1,421 (17.5%) | $90,008 |
| 4-Person Families | 1,819 (22.4%) | $70,929 |
| 5-Person Families | 935 (11.5%) | $91,250 |
| 6-Person Families | 430 (5.3%) | $82,065 |
| 7+ Person Families | 308 (3.8%) | $75,000 |
| Total | 8,129 (100.0%) | $87,927 |
Family Income by Number of Earners in Fallbrook
The median family income in Fallbrook is $87,927, with families comprising 3+ earners (1,333) having the highest median family income of $151,433, while families with 1 earner (2,599) have the lowest median family income of $59,430, accounting for 16.4% and 32.0% of families, respectively.
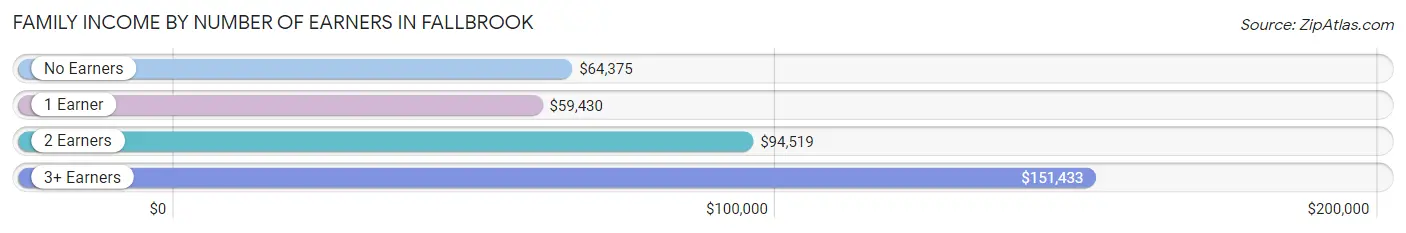
| Number of Earners | # Families | Median Income |
| No Earners | 1,475 (18.1%) | $64,375 |
| 1 Earner | 2,599 (32.0%) | $59,430 |
| 2 Earners | 2,722 (33.5%) | $94,519 |
| 3+ Earners | 1,333 (16.4%) | $151,433 |
| Total | 8,129 (100.0%) | $87,927 |
Household Income in Fallbrook
Household Income Brackets in Fallbrook
With 1,881 households falling in the category, the $100,000 to $149,999 income range is the most frequent in Fallbrook, accounting for 18.2% of all households. In contrast, only 176 households (1.7%) fall into the $10,000 to $14,999 income bracket, making it the least populous group.
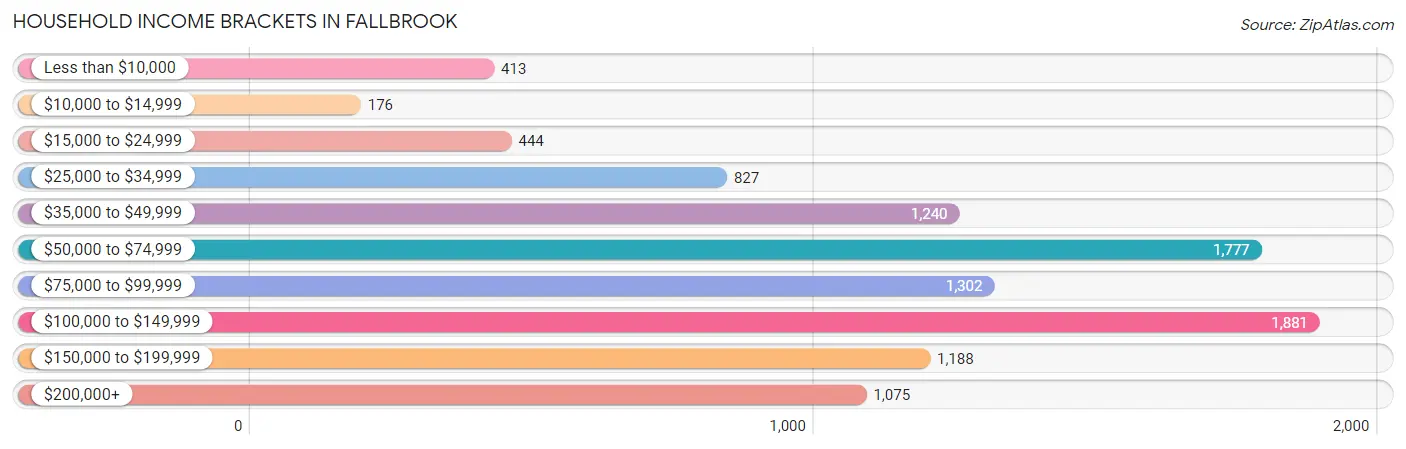
| Income Bracket | # Households | % Households |
| Less than $10,000 | 413 | 4.0% |
| $10,000 to $14,999 | 176 | 1.7% |
| $15,000 to $24,999 | 444 | 4.3% |
| $25,000 to $34,999 | 827 | 8.0% |
| $35,000 to $49,999 | 1,240 | 12.0% |
| $50,000 to $74,999 | 1,777 | 17.2% |
| $75,000 to $99,999 | 1,302 | 12.6% |
| $100,000 to $149,999 | 1,881 | 18.2% |
| $150,000 to $199,999 | 1,188 | 11.5% |
| $200,000+ | 1,075 | 10.4% |
Household Income by Householder Age in Fallbrook
The median household income in Fallbrook is $78,479, with the highest median household income of $101,078 found in the 45 to 64 years age bracket for the primary householder. A total of 3,762 households (36.4%) fall into this category. Meanwhile, the 15 to 24 years age bracket for the primary householder has the lowest median household income of $52,802, with 519 households (5.0%) in this group.
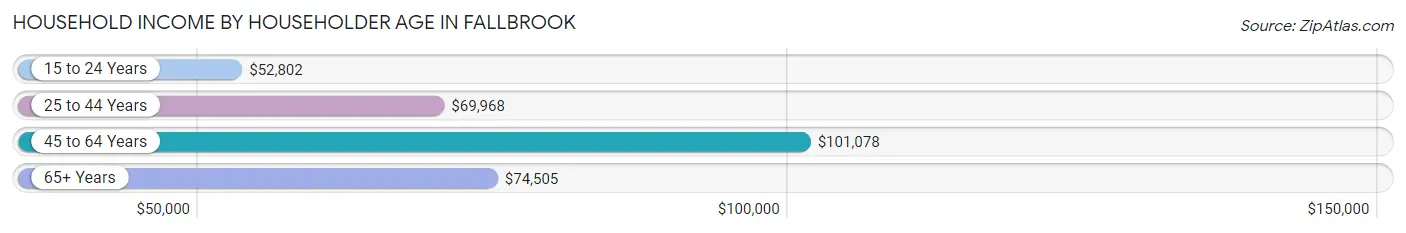
| Income Bracket | # Households | Median Income |
| 15 to 24 Years | 519 (5.0%) | $52,802 |
| 25 to 44 Years | 3,050 (29.5%) | $69,968 |
| 45 to 64 Years | 3,762 (36.4%) | $101,078 |
| 65+ Years | 3,003 (29.1%) | $74,505 |
| Total | 10,334 (100.0%) | $78,479 |
Poverty in Fallbrook
Income Below Poverty by Sex and Age in Fallbrook
With 12.7% poverty level for males and 17.3% for females among the residents of Fallbrook, 16 and 17 year old males and under 5 year old females are the most vulnerable to poverty, with 150 males (33.6%) and 614 females (38.0%) in their respective age groups living below the poverty level.
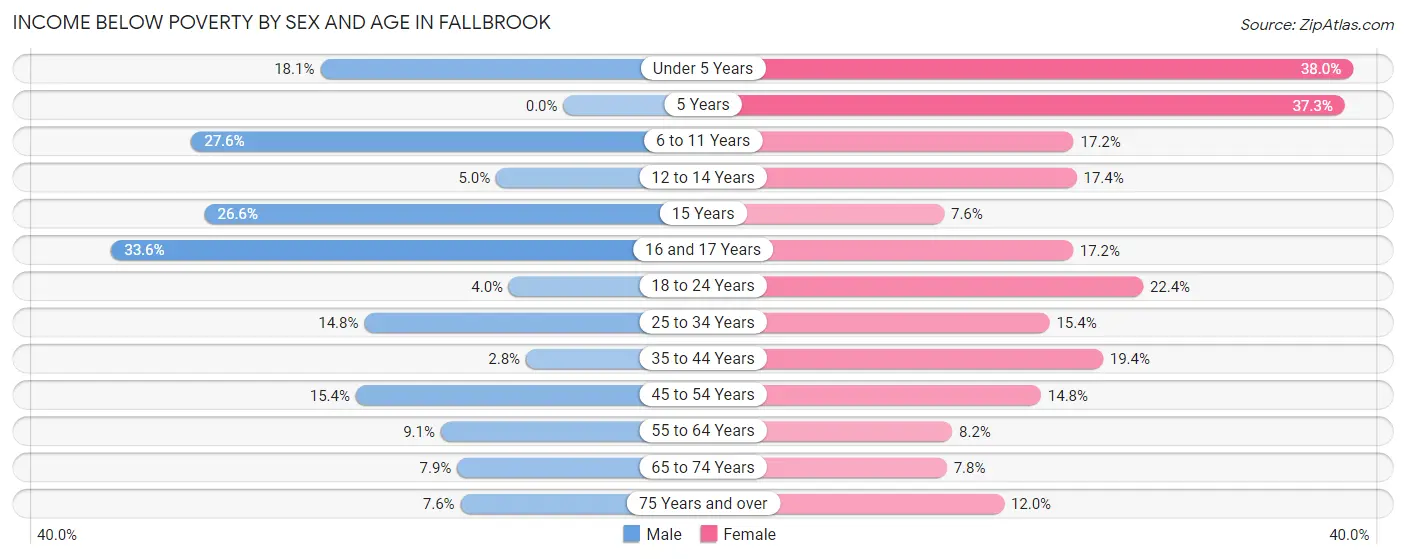
| Age Bracket | Male | Female |
| Under 5 Years | 209 (18.0%) | 614 (38.0%) |
| 5 Years | 0 (0.0%) | 118 (37.3%) |
| 6 to 11 Years | 483 (27.6%) | 175 (17.2%) |
| 12 to 14 Years | 33 (5.0%) | 103 (17.4%) |
| 15 Years | 98 (26.6%) | 11 (7.6%) |
| 16 and 17 Years | 150 (33.6%) | 71 (17.2%) |
| 18 to 24 Years | 69 (4.0%) | 392 (22.4%) |
| 25 to 34 Years | 355 (14.8%) | 460 (15.4%) |
| 35 to 44 Years | 41 (2.8%) | 252 (19.4%) |
| 45 to 54 Years | 329 (15.4%) | 268 (14.8%) |
| 55 to 64 Years | 171 (9.1%) | 162 (8.2%) |
| 65 to 74 Years | 141 (7.9%) | 114 (7.8%) |
| 75 Years and over | 66 (7.6%) | 158 (12.0%) |
| Total | 2,145 (12.7%) | 2,898 (17.3%) |
Income Above Poverty by Sex and Age in Fallbrook
According to the poverty statistics in Fallbrook, males aged 5 years and females aged 15 years are the age groups that are most secure financially, with 100.0% of males and 92.4% of females in these age groups living above the poverty line.
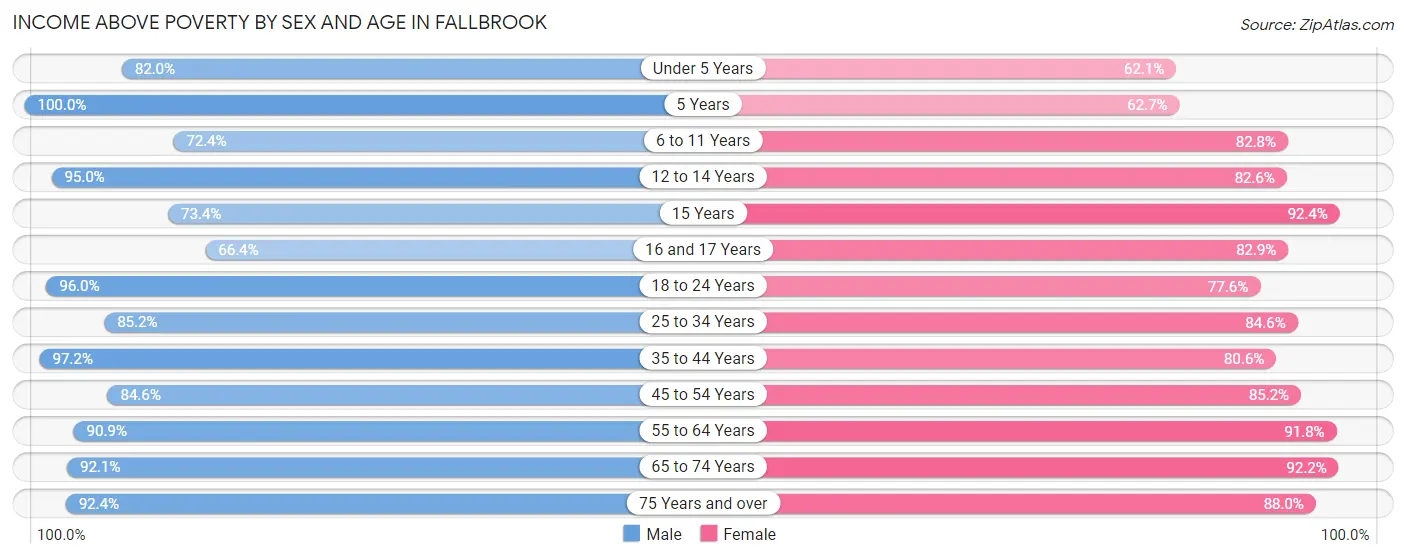
| Age Bracket | Male | Female |
| Under 5 Years | 949 (82.0%) | 1,004 (62.1%) |
| 5 Years | 285 (100.0%) | 198 (62.7%) |
| 6 to 11 Years | 1,266 (72.4%) | 842 (82.8%) |
| 12 to 14 Years | 628 (95.0%) | 488 (82.6%) |
| 15 Years | 270 (73.4%) | 134 (92.4%) |
| 16 and 17 Years | 297 (66.4%) | 343 (82.9%) |
| 18 to 24 Years | 1,637 (96.0%) | 1,361 (77.6%) |
| 25 to 34 Years | 2,047 (85.2%) | 2,523 (84.6%) |
| 35 to 44 Years | 1,433 (97.2%) | 1,048 (80.6%) |
| 45 to 54 Years | 1,806 (84.6%) | 1,545 (85.2%) |
| 55 to 64 Years | 1,709 (90.9%) | 1,815 (91.8%) |
| 65 to 74 Years | 1,649 (92.1%) | 1,349 (92.2%) |
| 75 Years and over | 798 (92.4%) | 1,154 (88.0%) |
| Total | 14,774 (87.3%) | 13,804 (82.7%) |
Income Below Poverty Among Married-Couple Families in Fallbrook
The poverty statistics for married-couple families in Fallbrook show that 7.0% or 413 of the total 5,942 families live below the poverty line. Families with 5 or more children have the highest poverty rate of 69.1%, comprising of 38 families. On the other hand, families with no children have the lowest poverty rate of 2.3%, which includes 78 families.
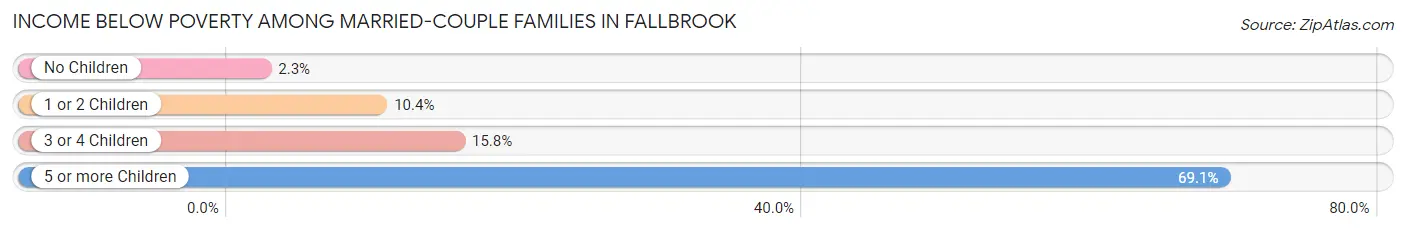
| Children | Above Poverty | Below Poverty |
| No Children | 3,288 (97.7%) | 78 (2.3%) |
| 1 or 2 Children | 1,681 (89.6%) | 195 (10.4%) |
| 3 or 4 Children | 543 (84.2%) | 102 (15.8%) |
| 5 or more Children | 17 (30.9%) | 38 (69.1%) |
| Total | 5,529 (93.0%) | 413 (7.0%) |
Income Below Poverty Among Single-Parent Households in Fallbrook
According to the poverty data in Fallbrook, 7.3% or 65 single-father households and 29.5% or 382 single-mother households are living below the poverty line. Among single-father households, those with 1 or 2 children have the highest poverty rate, with 48 households (11.9%) experiencing poverty. Likewise, among single-mother households, those with 3 or 4 children have the highest poverty rate, with 79 households (85.9%) falling below the poverty line.
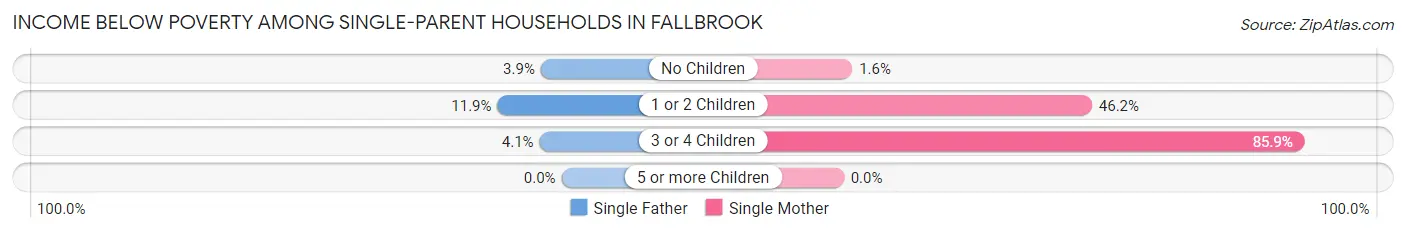
| Children | Single Father | Single Mother |
| No Children | 11 (3.9%) | 9 (1.6%) |
| 1 or 2 Children | 48 (11.9%) | 294 (46.2%) |
| 3 or 4 Children | 6 (4.1%) | 79 (85.9%) |
| 5 or more Children | 0 (0.0%) | 0 (0.0%) |
| Total | 65 (7.3%) | 382 (29.5%) |
Income Below Poverty Among Married-Couple vs Single-Parent Households in Fallbrook
The poverty data for Fallbrook shows that 413 of the married-couple family households (7.0%) and 447 of the single-parent households (20.4%) are living below the poverty level. Within the married-couple family households, those with 5 or more children have the highest poverty rate, with 38 households (69.1%) falling below the poverty line. Among the single-parent households, those with 3 or 4 children have the highest poverty rate, with 85 household (35.7%) living below poverty.
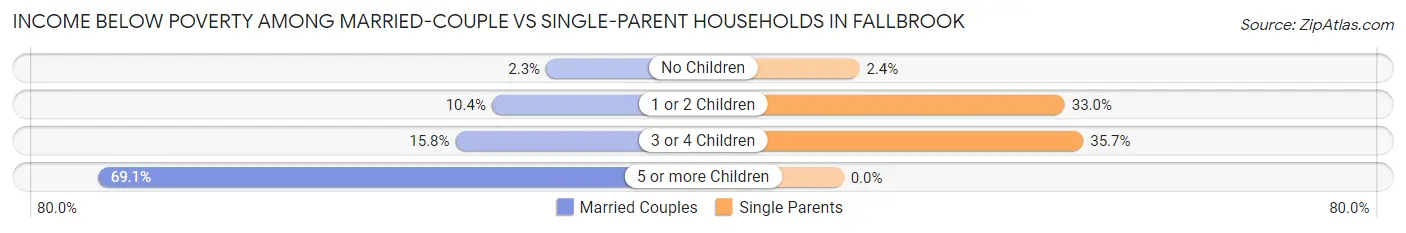
| Children | Married-Couple Families | Single-Parent Households |
| No Children | 78 (2.3%) | 20 (2.4%) |
| 1 or 2 Children | 195 (10.4%) | 342 (33.0%) |
| 3 or 4 Children | 102 (15.8%) | 85 (35.7%) |
| 5 or more Children | 38 (69.1%) | 0 (0.0%) |
| Total | 413 (7.0%) | 447 (20.4%) |
Race in Fallbrook
The most populous races in Fallbrook are White / Caucasian (19,788 | 58.7%), Hispanic or Latino (18,079 | 53.6%), and Two or more Races (6,347 | 18.8%).
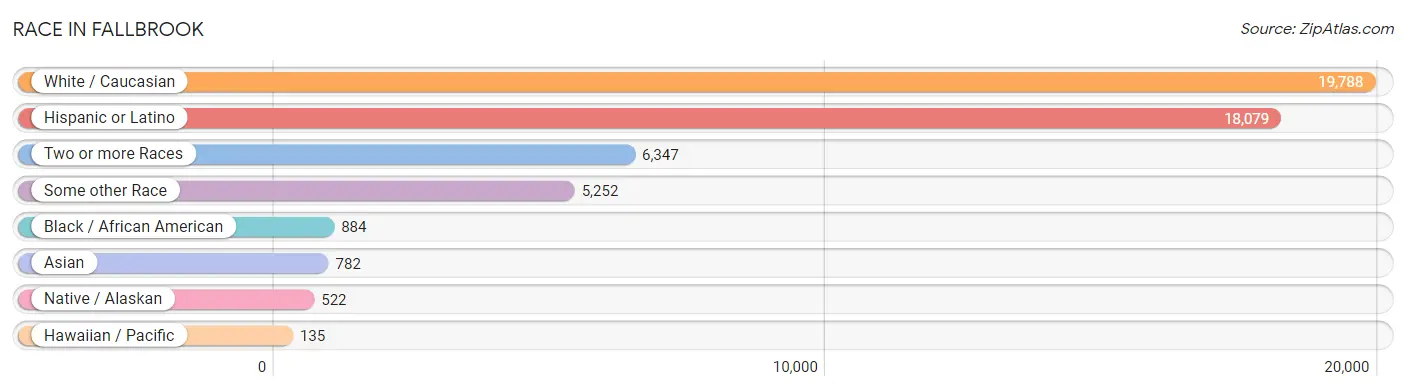
| Race | # Population | % Population |
| Asian | 782 | 2.3% |
| Black / African American | 884 | 2.6% |
| Hawaiian / Pacific | 135 | 0.4% |
| Hispanic or Latino | 18,079 | 53.6% |
| Native / Alaskan | 522 | 1.5% |
| White / Caucasian | 19,788 | 58.7% |
| Two or more Races | 6,347 | 18.8% |
| Some other Race | 5,252 | 15.6% |
| Total | 33,710 | 100.0% |
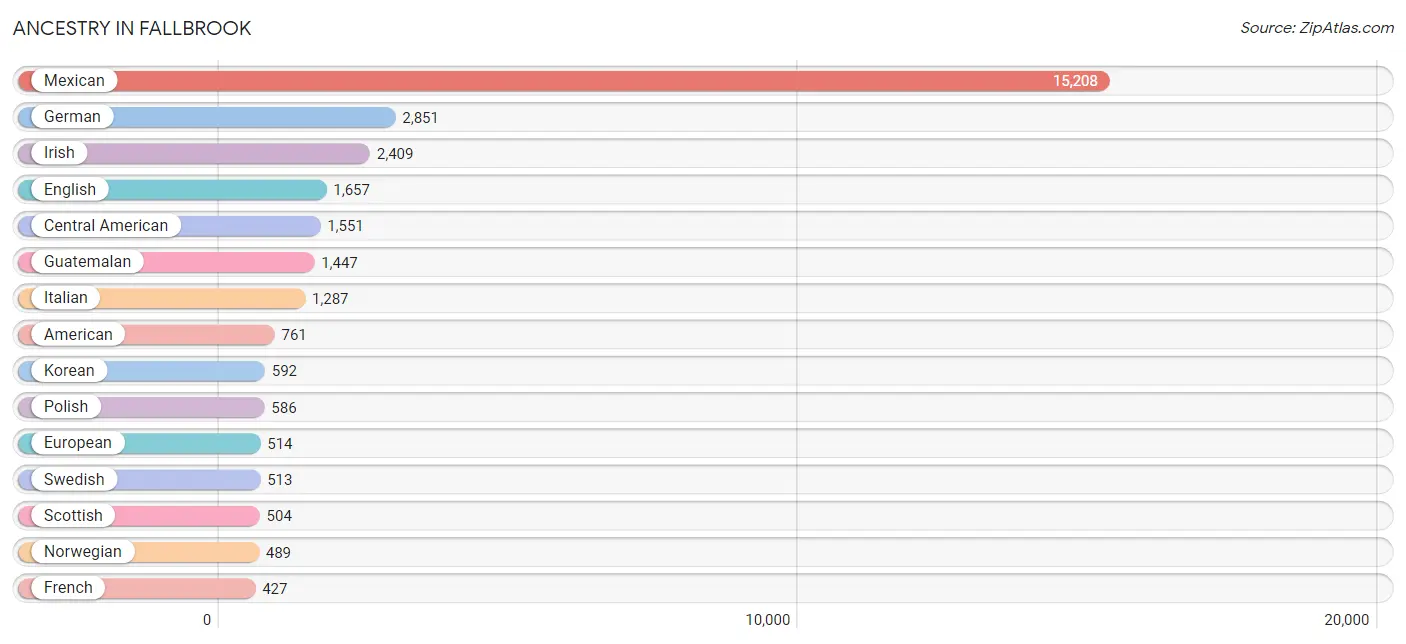
Ancestry in Fallbrook
The most populous ancestries reported in Fallbrook are Mexican (15,208 | 45.1%), German (2,851 | 8.5%), Irish (2,409 | 7.1%), English (1,657 | 4.9%), and Central American (1,551 | 4.6%), together accounting for 70.2% of all Fallbrook residents.
| Ancestry | # Population | % Population |
| Afghan | 17 | 0.1% |
| African | 6 | 0.0% |
| Alsatian | 7 | 0.0% |
| American | 761 | 2.3% |
| Arab | 95 | 0.3% |
| Argentinean | 25 | 0.1% |
| Armenian | 45 | 0.1% |
| Austrian | 21 | 0.1% |
| Basque | 19 | 0.1% |
| Belgian | 36 | 0.1% |
| Bhutanese | 224 | 0.7% |
| Blackfeet | 25 | 0.1% |
| Bolivian | 76 | 0.2% |
| Brazilian | 100 | 0.3% |
| British | 165 | 0.5% |
| Burmese | 54 | 0.2% |
| Canadian | 25 | 0.1% |
| Central American | 1,551 | 4.6% |
| Central American Indian | 125 | 0.4% |
| Cherokee | 124 | 0.4% |
| Chickasaw | 19 | 0.1% |
| Chinese | 47 | 0.1% |
| Choctaw | 13 | 0.0% |
| Colombian | 84 | 0.3% |
| Comanche | 9 | 0.0% |
| Costa Rican | 10 | 0.0% |
| Creek | 55 | 0.2% |
| Croatian | 117 | 0.4% |
| Cuban | 143 | 0.4% |
| Czech | 58 | 0.2% |
| Czechoslovakian | 49 | 0.2% |
| Danish | 147 | 0.4% |
| Dutch | 202 | 0.6% |
| Eastern European | 29 | 0.1% |
| Ecuadorian | 45 | 0.1% |
| English | 1,657 | 4.9% |
| Estonian | 9 | 0.0% |
| European | 514 | 1.5% |
| Filipino | 7 | 0.0% |
| Finnish | 19 | 0.1% |
| French | 427 | 1.3% |
| French Canadian | 49 | 0.2% |
| German | 2,851 | 8.5% |
| Greek | 65 | 0.2% |
| Guamanian / Chamorro | 175 | 0.5% |
| Guatemalan | 1,447 | 4.3% |
| Honduran | 19 | 0.1% |
| Hungarian | 79 | 0.2% |
| Indian (Asian) | 191 | 0.6% |
| Iranian | 74 | 0.2% |
| Iraqi | 15 | 0.0% |
| Irish | 2,409 | 7.1% |
| Iroquois | 6 | 0.0% |
| Italian | 1,287 | 3.8% |
| Jamaican | 37 | 0.1% |
| Kenyan | 16 | 0.1% |
| Korean | 592 | 1.8% |
| Laotian | 32 | 0.1% |
| Lithuanian | 28 | 0.1% |
| Mexican | 15,208 | 45.1% |
| Mexican American Indian | 84 | 0.3% |
| Native Hawaiian | 88 | 0.3% |
| Navajo | 2 | 0.0% |
| Nicaraguan | 4 | 0.0% |
| Northern European | 89 | 0.3% |
| Norwegian | 489 | 1.5% |
| Pima | 3 | 0.0% |
| Polish | 586 | 1.7% |
| Portuguese | 83 | 0.3% |
| Puerto Rican | 132 | 0.4% |
| Romanian | 22 | 0.1% |
| Russian | 174 | 0.5% |
| Salvadoran | 71 | 0.2% |
| Samoan | 52 | 0.2% |
| Scandinavian | 67 | 0.2% |
| Scotch-Irish | 209 | 0.6% |
| Scottish | 504 | 1.5% |
| Seminole | 13 | 0.0% |
| Serbian | 14 | 0.0% |
| Slovene | 6 | 0.0% |
| South American | 230 | 0.7% |
| Spaniard | 143 | 0.4% |
| Spanish | 341 | 1.0% |
| Sri Lankan | 70 | 0.2% |
| Subsaharan African | 22 | 0.1% |
| Swedish | 513 | 1.5% |
| Swiss | 47 | 0.1% |
| Syrian | 32 | 0.1% |
| Thai | 96 | 0.3% |
| Tlingit-Haida | 6 | 0.0% |
| Ukrainian | 45 | 0.1% |
| Welsh | 161 | 0.5% | View All 92 Rows |
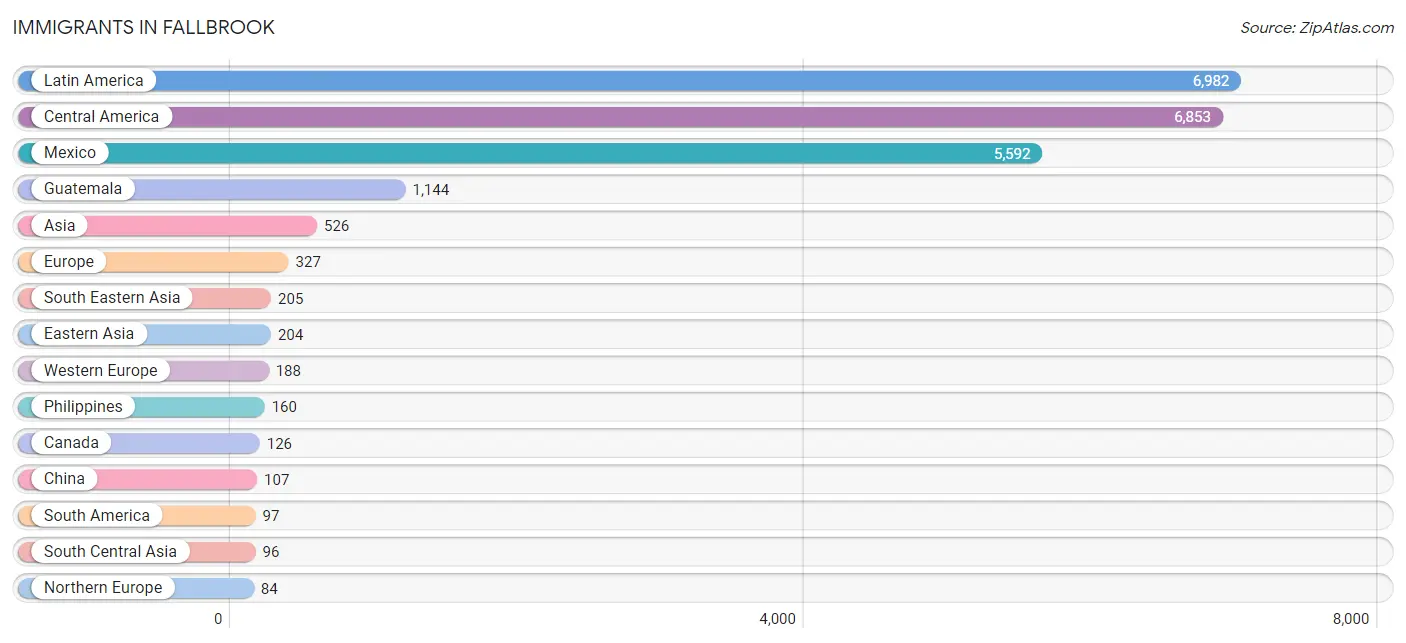
Immigrants in Fallbrook
The most numerous immigrant groups reported in Fallbrook came from Latin America (6,982 | 20.7%), Central America (6,853 | 20.3%), Mexico (5,592 | 16.6%), Guatemala (1,144 | 3.4%), and Asia (526 | 1.6%), together accounting for 62.6% of all Fallbrook residents.
| Immigration Origin | # Population | % Population |
| Afghanistan | 21 | 0.1% |
| Africa | 26 | 0.1% |
| Argentina | 35 | 0.1% |
| Asia | 526 | 1.6% |
| Austria | 29 | 0.1% |
| Belgium | 7 | 0.0% |
| Brazil | 47 | 0.1% |
| Canada | 126 | 0.4% |
| Caribbean | 32 | 0.1% |
| Central America | 6,853 | 20.3% |
| China | 107 | 0.3% |
| Colombia | 15 | 0.0% |
| Costa Rica | 10 | 0.0% |
| Cuba | 10 | 0.0% |
| Czechoslovakia | 4 | 0.0% |
| Eastern Africa | 7 | 0.0% |
| Eastern Asia | 204 | 0.6% |
| Eastern Europe | 55 | 0.2% |
| El Salvador | 22 | 0.1% |
| England | 25 | 0.1% |
| Europe | 327 | 1.0% |
| Fiji | 55 | 0.2% |
| France | 15 | 0.0% |
| Germany | 82 | 0.2% |
| Guatemala | 1,144 | 3.4% |
| Honduras | 81 | 0.2% |
| Hong Kong | 1 | 0.0% |
| India | 41 | 0.1% |
| Indonesia | 10 | 0.0% |
| Iran | 34 | 0.1% |
| Iraq | 15 | 0.0% |
| Jamaica | 22 | 0.1% |
| Japan | 75 | 0.2% |
| Kenya | 7 | 0.0% |
| Korea | 22 | 0.1% |
| Latin America | 6,982 | 20.7% |
| Mexico | 5,592 | 16.6% |
| Morocco | 12 | 0.0% |
| Netherlands | 40 | 0.1% |
| Nicaragua | 4 | 0.0% |
| Northern Africa | 19 | 0.1% |
| Northern Europe | 84 | 0.3% |
| Oceania | 67 | 0.2% |
| Philippines | 160 | 0.5% |
| Romania | 22 | 0.1% |
| Russia | 29 | 0.1% |
| South America | 97 | 0.3% |
| South Central Asia | 96 | 0.3% |
| South Eastern Asia | 205 | 0.6% |
| Switzerland | 15 | 0.0% |
| Taiwan | 7 | 0.0% |
| Vietnam | 35 | 0.1% |
| Western Asia | 21 | 0.1% |
| Western Europe | 188 | 0.6% | View All 54 Rows |
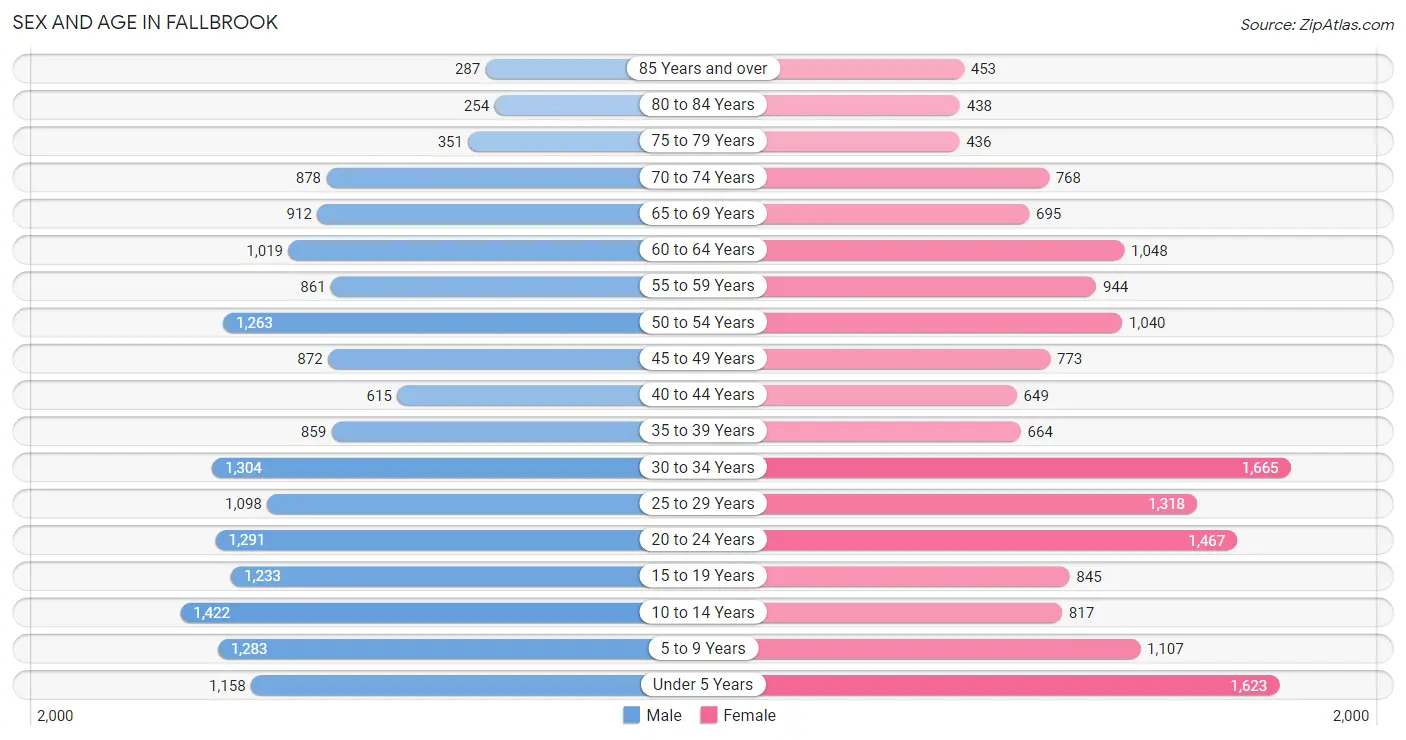
Sex and Age in Fallbrook
Sex and Age in Fallbrook
The most populous age groups in Fallbrook are 10 to 14 Years (1,422 | 8.4%) for men and 30 to 34 Years (1,665 | 9.9%) for women.
| Age Bracket | Male | Female |
| Under 5 Years | 1,158 (6.8%) | 1,623 (9.7%) |
| 5 to 9 Years | 1,283 (7.6%) | 1,107 (6.6%) |
| 10 to 14 Years | 1,422 (8.4%) | 817 (4.9%) |
| 15 to 19 Years | 1,233 (7.3%) | 845 (5.0%) |
| 20 to 24 Years | 1,291 (7.6%) | 1,467 (8.8%) |
| 25 to 29 Years | 1,098 (6.5%) | 1,318 (7.9%) |
| 30 to 34 Years | 1,304 (7.7%) | 1,665 (9.9%) |
| 35 to 39 Years | 859 (5.1%) | 664 (4.0%) |
| 40 to 44 Years | 615 (3.6%) | 649 (3.9%) |
| 45 to 49 Years | 872 (5.1%) | 773 (4.6%) |
| 50 to 54 Years | 1,263 (7.4%) | 1,040 (6.2%) |
| 55 to 59 Years | 861 (5.1%) | 944 (5.6%) |
| 60 to 64 Years | 1,019 (6.0%) | 1,048 (6.3%) |
| 65 to 69 Years | 912 (5.4%) | 695 (4.2%) |
| 70 to 74 Years | 878 (5.2%) | 768 (4.6%) |
| 75 to 79 Years | 351 (2.1%) | 436 (2.6%) |
| 80 to 84 Years | 254 (1.5%) | 438 (2.6%) |
| 85 Years and over | 287 (1.7%) | 453 (2.7%) |
| Total | 16,960 (100.0%) | 16,750 (100.0%) |
Families and Households in Fallbrook
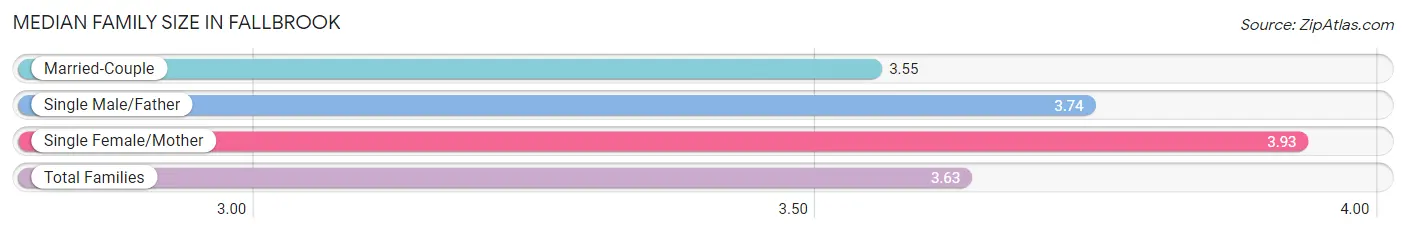
Median Family Size in Fallbrook
The median family size in Fallbrook is 3.63 persons per family, with single female/mother families (1,294 | 15.9%) accounting for the largest median family size of 3.93 persons per family. On the other hand, married-couple families (5,942 | 73.1%) represent the smallest median family size with 3.55 persons per family.
| Family Type | # Families | Family Size |
| Married-Couple | 5,942 (73.1%) | 3.55 |
| Single Male/Father | 893 (11.0%) | 3.74 |
| Single Female/Mother | 1,294 (15.9%) | 3.93 |
| Total Families | 8,129 (100.0%) | 3.63 |
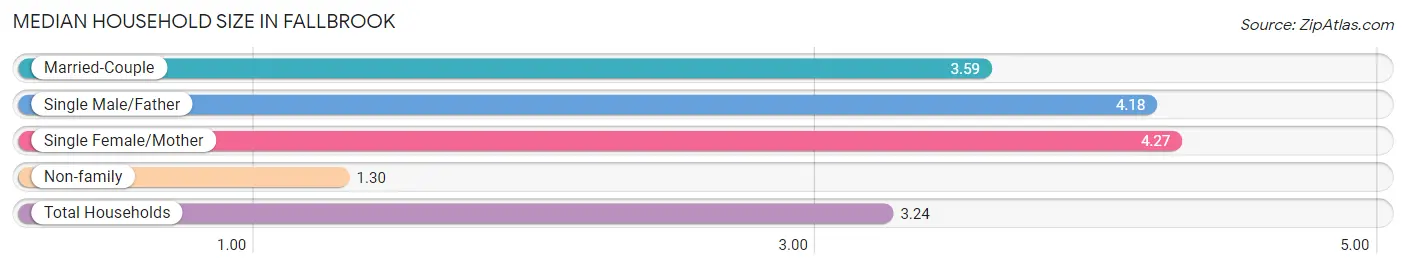
Median Household Size in Fallbrook
The median household size in Fallbrook is 3.24 persons per household, with single female/mother households (1,294 | 12.5%) accounting for the largest median household size of 4.27 persons per household. non-family households (2,205 | 21.3%) represent the smallest median household size with 1.30 persons per household.
| Household Type | # Households | Household Size |
| Married-Couple | 5,942 (57.5%) | 3.59 |
| Single Male/Father | 893 (8.6%) | 4.18 |
| Single Female/Mother | 1,294 (12.5%) | 4.27 |
| Non-family | 2,205 (21.3%) | 1.30 |
| Total Households | 10,334 (100.0%) | 3.24 |
Household Size by Marriage Status in Fallbrook
Out of a total of 10,334 households in Fallbrook, 8,129 (78.7%) are family households, while 2,205 (21.3%) are nonfamily households. The most numerous type of family households are 2-person households, comprising 2,979, and the most common type of nonfamily households are 1-person households, comprising 1,660.
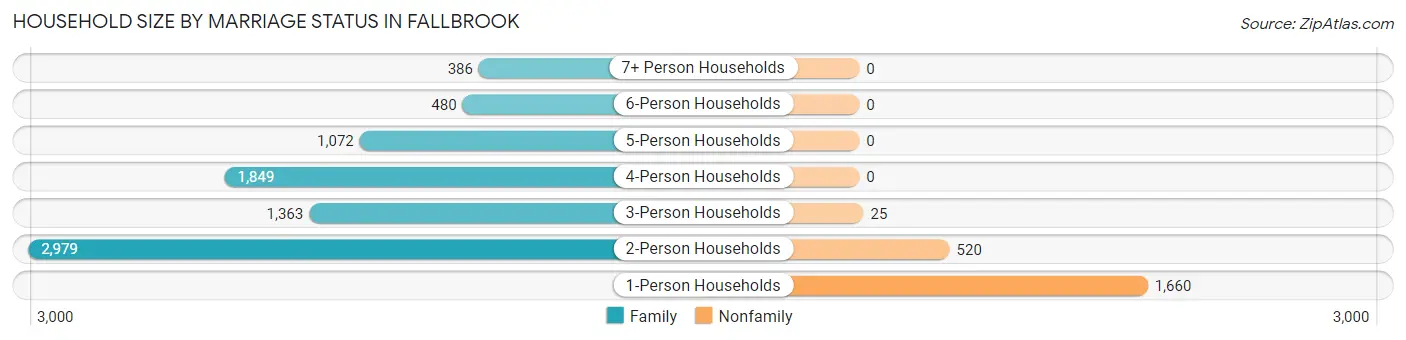
| Household Size | Family Households | Nonfamily Households |
| 1-Person Households | - | 1,660 (16.1%) |
| 2-Person Households | 2,979 (28.8%) | 520 (5.0%) |
| 3-Person Households | 1,363 (13.2%) | 25 (0.2%) |
| 4-Person Households | 1,849 (17.9%) | 0 (0.0%) |
| 5-Person Households | 1,072 (10.4%) | 0 (0.0%) |
| 6-Person Households | 480 (4.6%) | 0 (0.0%) |
| 7+ Person Households | 386 (3.7%) | 0 (0.0%) |
| Total | 8,129 (78.7%) | 2,205 (21.3%) |
Female Fertility in Fallbrook
Fertility by Age in Fallbrook
Average fertility rate in Fallbrook is 70.0 births per 1,000 women. Women in the age bracket of 20 to 34 years have the highest fertility rate with 97.0 births per 1,000 women. Women in the age bracket of 20 to 34 years acount for 81.7% of all women with births.
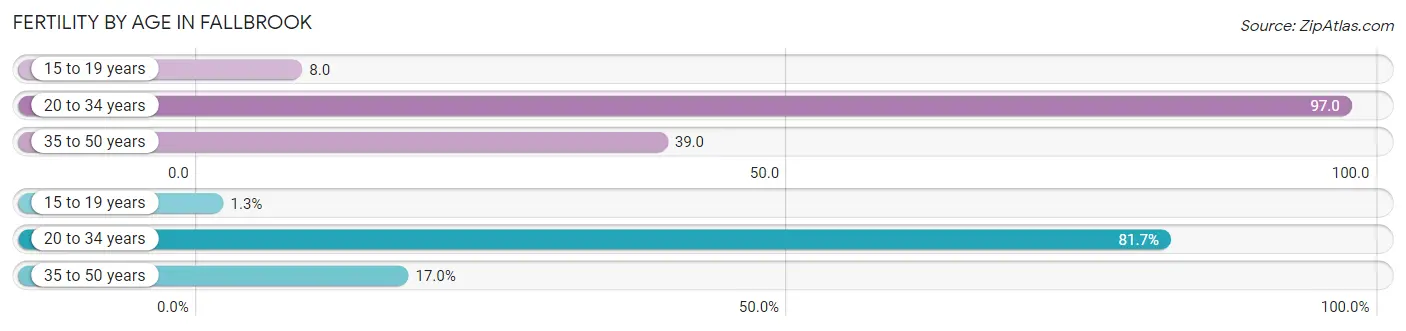
| Age Bracket | Women with Births | Births / 1,000 Women |
| 15 to 19 years | 7 (1.3%) | 8.0 |
| 20 to 34 years | 432 (81.7%) | 97.0 |
| 35 to 50 years | 90 (17.0%) | 39.0 |
| Total | 529 (100.0%) | 70.0 |
Fertility by Age by Marriage Status in Fallbrook
73.9% of women with births (529) in Fallbrook are married. The highest percentage of unmarried women with births falls into 15 to 19 years age bracket with 100.0% of them unmarried at the time of birth, while the lowest percentage of unmarried women with births belong to 35 to 50 years age bracket with 0.0% of them unmarried.
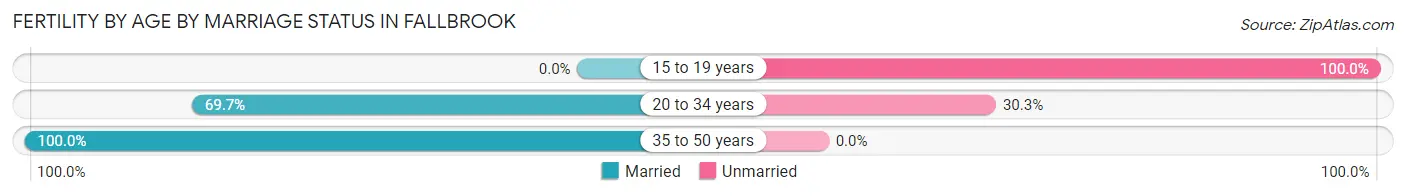
| Age Bracket | Married | Unmarried |
| 15 to 19 years | 0 (0.0%) | 7 (100.0%) |
| 20 to 34 years | 301 (69.7%) | 131 (30.3%) |
| 35 to 50 years | 90 (100.0%) | 0 (0.0%) |
| Total | 391 (73.9%) | 138 (26.1%) |
Fertility by Education in Fallbrook
Average fertility rate in Fallbrook is 70.0 births per 1,000 women. Women with the education attainment of bachelor's degree have the highest fertility rate of 218.0 births per 1,000 women, while women with the education attainment of college or associate's degree have the lowest fertility at 33.0 births per 1,000 women. Women with the education attainment of bachelor's degree represent 36.9% of all women with births.
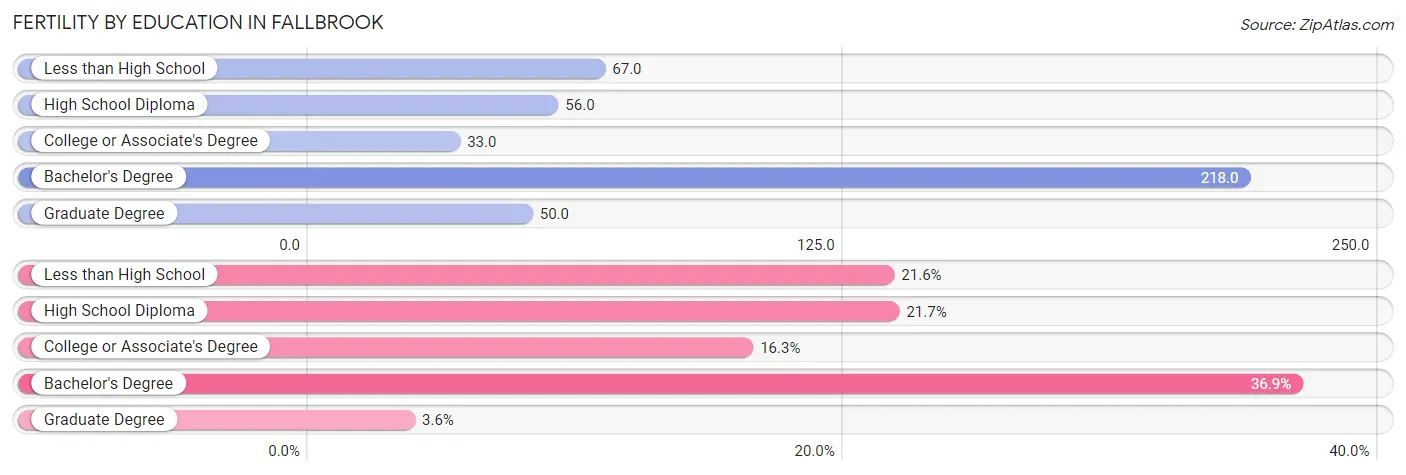
| Educational Attainment | Women with Births | Births / 1,000 Women |
| Less than High School | 114 (21.5%) | 67.0 |
| High School Diploma | 115 (21.7%) | 56.0 |
| College or Associate's Degree | 86 (16.3%) | 33.0 |
| Bachelor's Degree | 195 (36.9%) | 218.0 |
| Graduate Degree | 19 (3.6%) | 50.0 |
| Total | 529 (100.0%) | 70.0 |
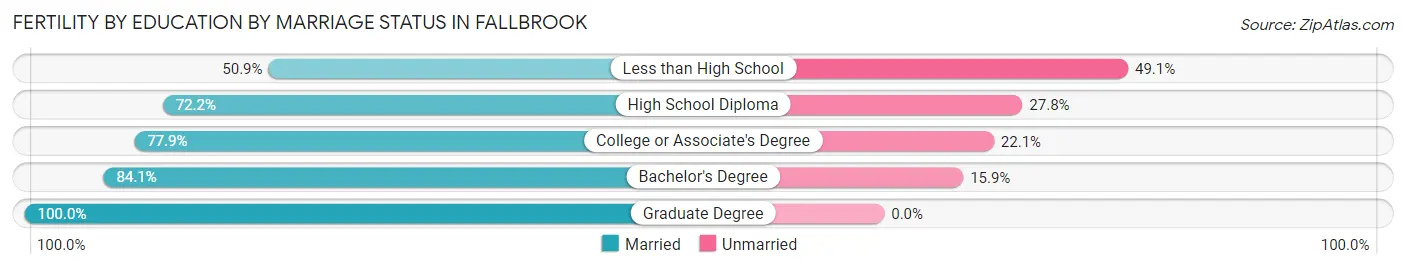
Fertility by Education by Marriage Status in Fallbrook
26.1% of women with births in Fallbrook are unmarried. Women with the educational attainment of graduate degree are most likely to be married with 100.0% of them married at childbirth, while women with the educational attainment of less than high school are least likely to be married with 49.1% of them unmarried at childbirth.
| Educational Attainment | Married | Unmarried |
| Less than High School | 58 (50.9%) | 56 (49.1%) |
| High School Diploma | 83 (72.2%) | 32 (27.8%) |
| College or Associate's Degree | 67 (77.9%) | 19 (22.1%) |
| Bachelor's Degree | 164 (84.1%) | 31 (15.9%) |
| Graduate Degree | 19 (100.0%) | 0 (0.0%) |
| Total | 391 (73.9%) | 138 (26.1%) |
Employment Characteristics in Fallbrook
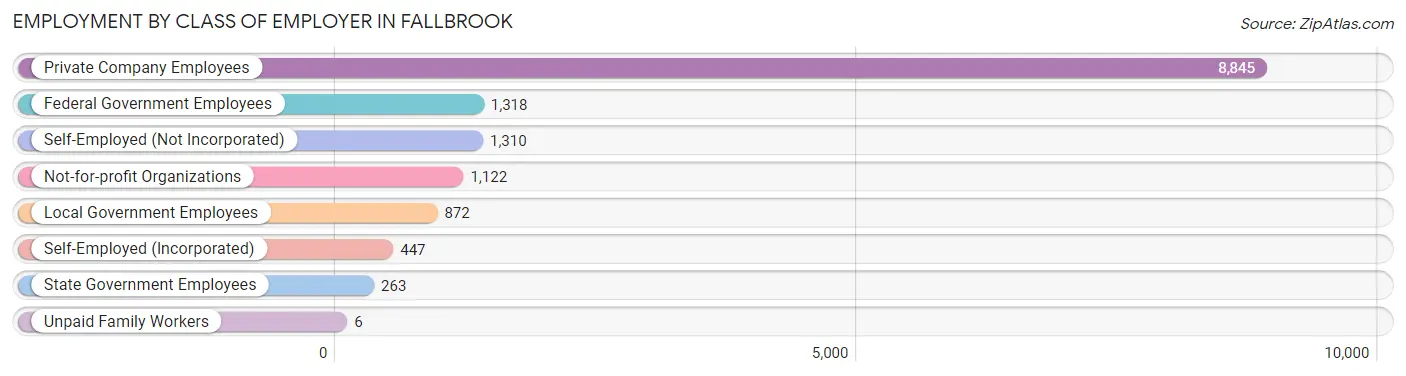
Employment by Class of Employer in Fallbrook
Among the 14,183 employed individuals in Fallbrook, private company employees (8,845 | 62.4%), federal government employees (1,318 | 9.3%), and self-employed (not incorporated) (1,310 | 9.2%) make up the most common classes of employment.
| Employer Class | # Employees | % Employees |
| Private Company Employees | 8,845 | 62.4% |
| Self-Employed (Incorporated) | 447 | 3.2% |
| Self-Employed (Not Incorporated) | 1,310 | 9.2% |
| Not-for-profit Organizations | 1,122 | 7.9% |
| Local Government Employees | 872 | 6.1% |
| State Government Employees | 263 | 1.8% |
| Federal Government Employees | 1,318 | 9.3% |
| Unpaid Family Workers | 6 | 0.0% |
| Total | 14,183 | 100.0% |
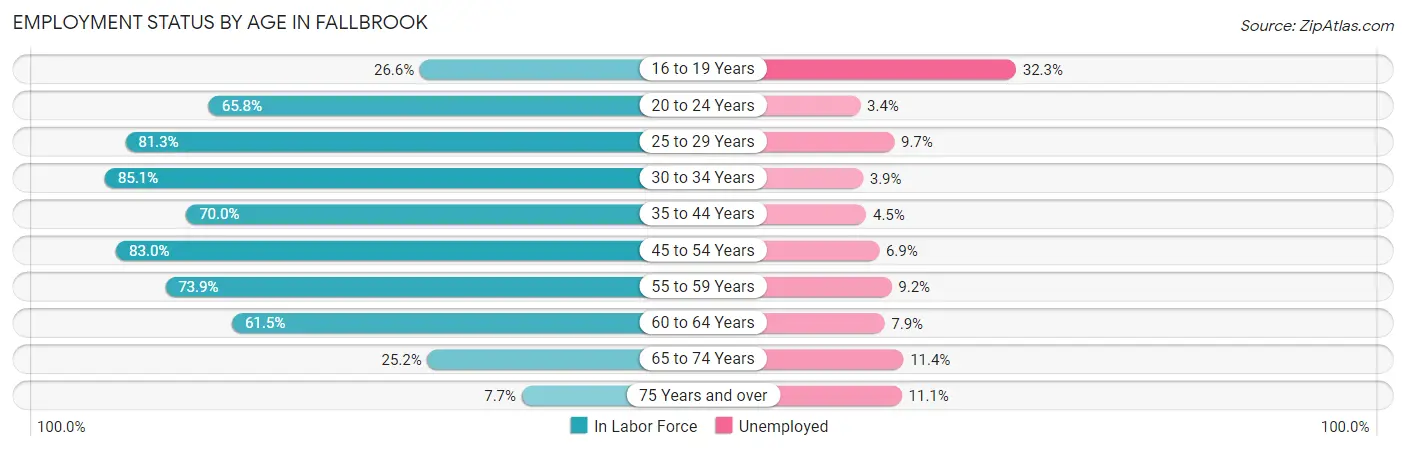
Employment Status by Age in Fallbrook
According to the labor force statistics for Fallbrook, out of the total population over 16 years of age (25,787), 60.3% or 15,550 individuals are in the labor force, with 7.4% or 1,151 of them unemployed. The age group with the highest labor force participation rate is 30 to 34 years, with 85.1% or 2,527 individuals in the labor force. Within the labor force, the 16 to 19 years age range has the highest percentage of unemployed individuals, with 32.3% or 134 of them being unemployed.
| Age Bracket | In Labor Force | Unemployed |
| 16 to 19 Years | 416 (26.6%) | 134 (32.3%) |
| 20 to 24 Years | 1,815 (65.8%) | 62 (3.4%) |
| 25 to 29 Years | 1,964 (81.3%) | 191 (9.7%) |
| 30 to 34 Years | 2,527 (85.1%) | 99 (3.9%) |
| 35 to 44 Years | 1,951 (70.0%) | 88 (4.5%) |
| 45 to 54 Years | 3,277 (83.0%) | 226 (6.9%) |
| 55 to 59 Years | 1,334 (73.9%) | 123 (9.2%) |
| 60 to 64 Years | 1,271 (61.5%) | 100 (7.9%) |
| 65 to 74 Years | 820 (25.2%) | 93 (11.4%) |
| 75 Years and over | 171 (7.7%) | 19 (11.1%) |
| Total | 15,550 (60.3%) | 1,151 (7.4%) |
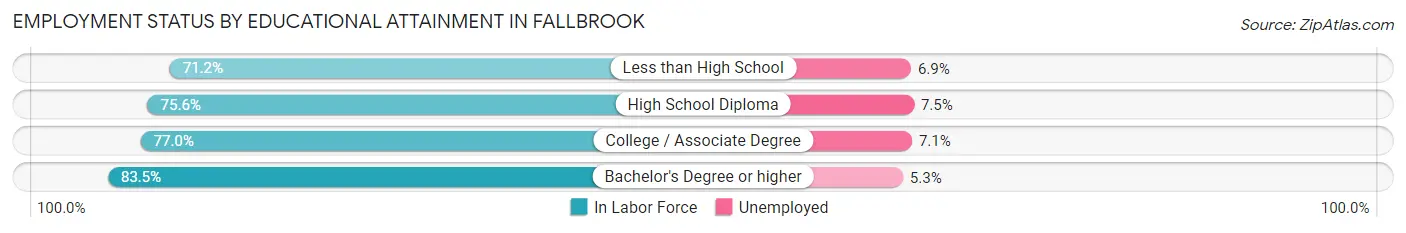
Employment Status by Educational Attainment in Fallbrook
According to labor force statistics for Fallbrook, 77.1% of individuals (12,330) out of the total population between 25 and 64 years of age (15,992) are in the labor force, with 6.7% or 826 of them being unemployed. The group with the highest labor force participation rate are those with the educational attainment of bachelor's degree or higher, with 83.5% or 3,145 individuals in the labor force. Within the labor force, individuals with high school diploma education have the highest percentage of unemployment, with 7.5% or 239 of them being unemployed.
| Educational Attainment | In Labor Force | Unemployed |
| Less than High School | 2,164 (71.2%) | 210 (6.9%) |
| High School Diploma | 3,191 (75.6%) | 317 (7.5%) |
| College / Associate Degree | 3,823 (77.0%) | 353 (7.1%) |
| Bachelor's Degree or higher | 3,145 (83.5%) | 200 (5.3%) |
| Total | 12,330 (77.1%) | 1,071 (6.7%) |
Employment Occupations by Sex in Fallbrook
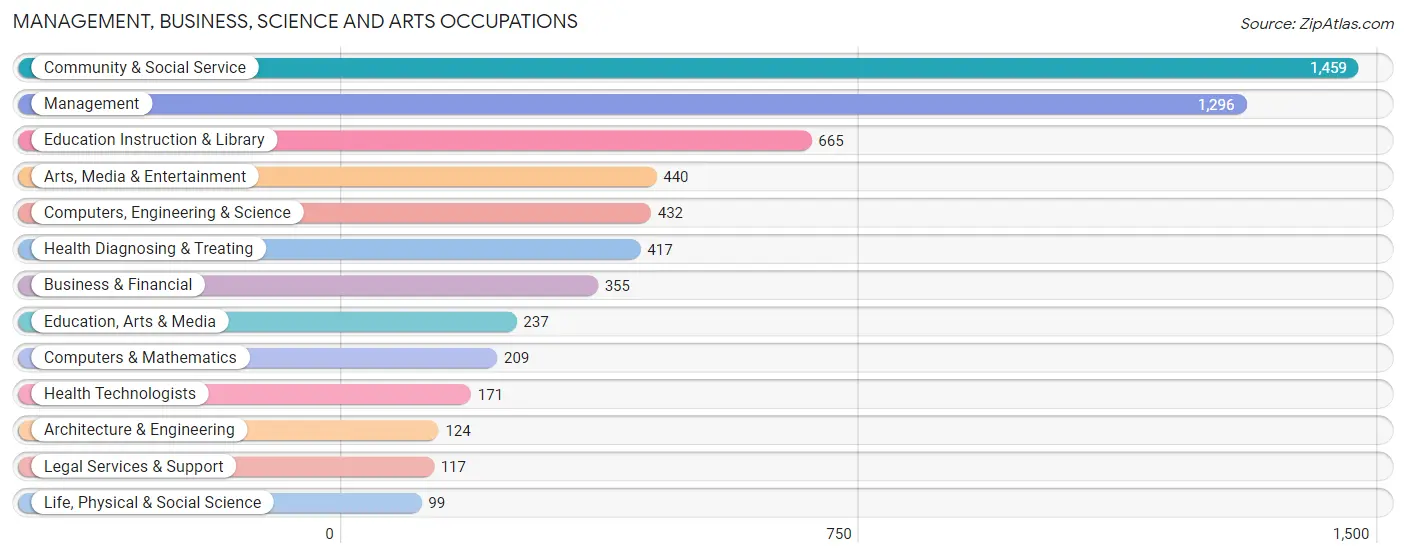
Management, Business, Science and Arts Occupations
The most common Management, Business, Science and Arts occupations in Fallbrook are Community & Social Service (1,459 | 10.7%), Management (1,296 | 9.5%), Education Instruction & Library (665 | 4.9%), Arts, Media & Entertainment (440 | 3.2%), and Computers, Engineering & Science (432 | 3.2%).
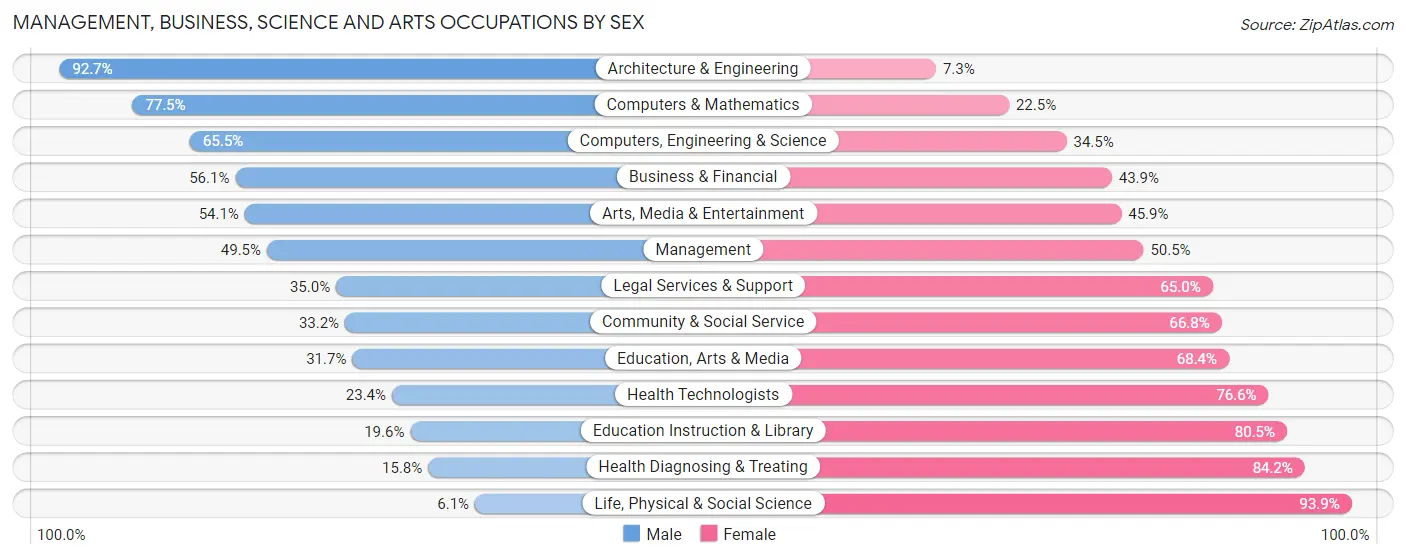
Management, Business, Science and Arts Occupations by Sex
Within the Management, Business, Science and Arts occupations in Fallbrook, the most male-oriented occupations are Architecture & Engineering (92.7%), Computers & Mathematics (77.5%), and Computers, Engineering & Science (65.5%), while the most female-oriented occupations are Life, Physical & Social Science (93.9%), Health Diagnosing & Treating (84.2%), and Education Instruction & Library (80.4%).
| Occupation | Male | Female |
| Management | 641 (49.5%) | 655 (50.5%) |
| Business & Financial | 199 (56.1%) | 156 (43.9%) |
| Computers, Engineering & Science | 283 (65.5%) | 149 (34.5%) |
| Computers & Mathematics | 162 (77.5%) | 47 (22.5%) |
| Architecture & Engineering | 115 (92.7%) | 9 (7.3%) |
| Life, Physical & Social Science | 6 (6.1%) | 93 (93.9%) |
| Community & Social Service | 484 (33.2%) | 975 (66.8%) |
| Education, Arts & Media | 75 (31.7%) | 162 (68.3%) |
| Legal Services & Support | 41 (35.0%) | 76 (65.0%) |
| Education Instruction & Library | 130 (19.6%) | 535 (80.4%) |
| Arts, Media & Entertainment | 238 (54.1%) | 202 (45.9%) |
| Health Diagnosing & Treating | 66 (15.8%) | 351 (84.2%) |
| Health Technologists | 40 (23.4%) | 131 (76.6%) |
| Total (Category) | 1,673 (42.3%) | 2,286 (57.7%) |
| Total (Overall) | 7,255 (53.1%) | 6,409 (46.9%) |
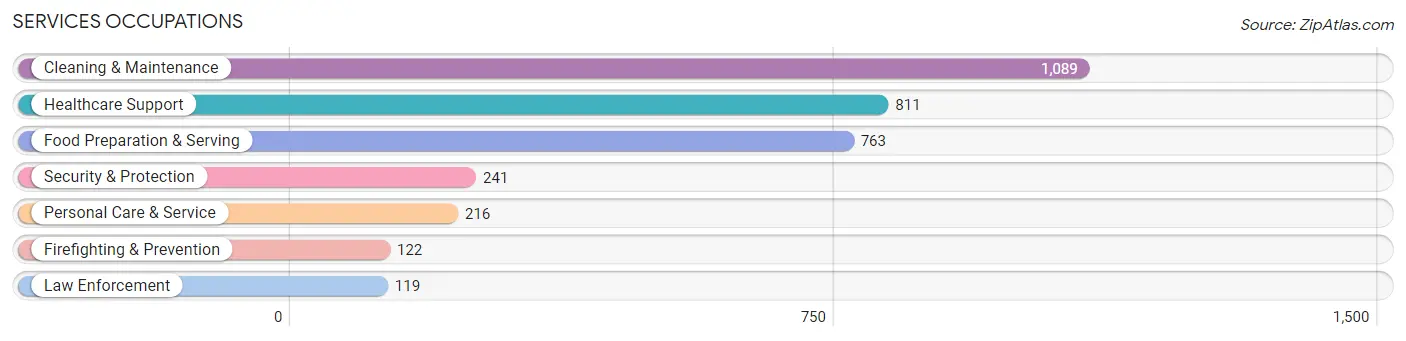
Services Occupations
The most common Services occupations in Fallbrook are Cleaning & Maintenance (1,089 | 8.0%), Healthcare Support (811 | 5.9%), Food Preparation & Serving (763 | 5.6%), Security & Protection (241 | 1.8%), and Personal Care & Service (216 | 1.6%).
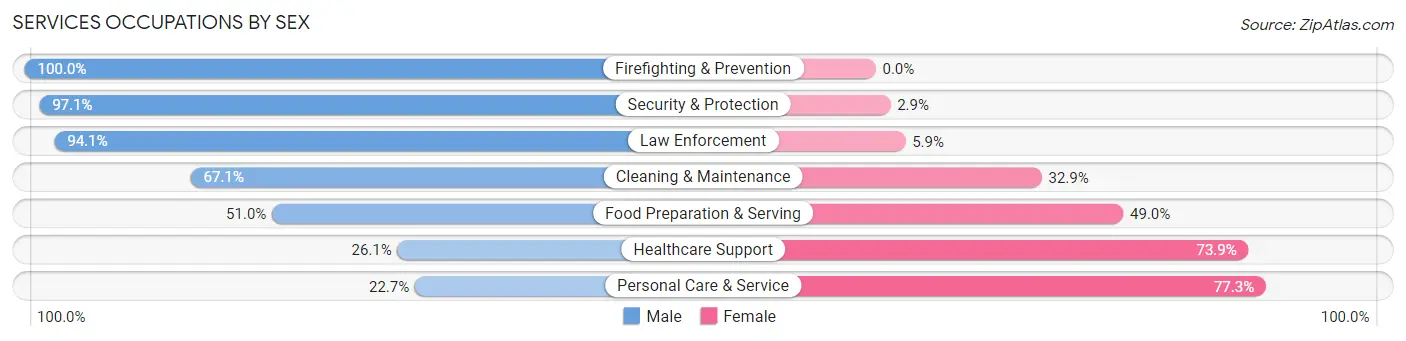
Services Occupations by Sex
Within the Services occupations in Fallbrook, the most male-oriented occupations are Firefighting & Prevention (100.0%), Security & Protection (97.1%), and Law Enforcement (94.1%), while the most female-oriented occupations are Personal Care & Service (77.3%), Healthcare Support (73.9%), and Food Preparation & Serving (49.0%).
| Occupation | Male | Female |
| Healthcare Support | 212 (26.1%) | 599 (73.9%) |
| Security & Protection | 234 (97.1%) | 7 (2.9%) |
| Firefighting & Prevention | 122 (100.0%) | 0 (0.0%) |
| Law Enforcement | 112 (94.1%) | 7 (5.9%) |
| Food Preparation & Serving | 389 (51.0%) | 374 (49.0%) |
| Cleaning & Maintenance | 731 (67.1%) | 358 (32.9%) |
| Personal Care & Service | 49 (22.7%) | 167 (77.3%) |
| Total (Category) | 1,615 (51.8%) | 1,505 (48.2%) |
| Total (Overall) | 7,255 (53.1%) | 6,409 (46.9%) |
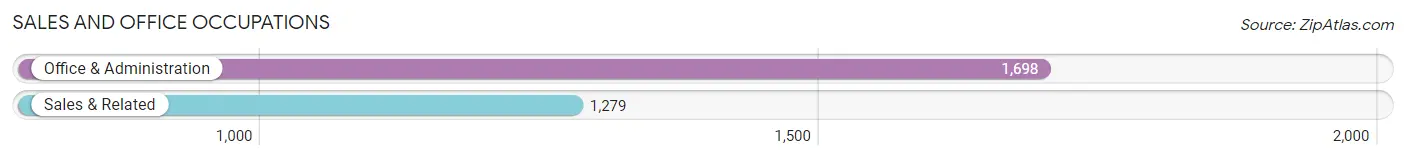
Sales and Office Occupations
The most common Sales and Office occupations in Fallbrook are Office & Administration (1,698 | 12.4%), and Sales & Related (1,279 | 9.4%).
Sales and Office Occupations by Sex
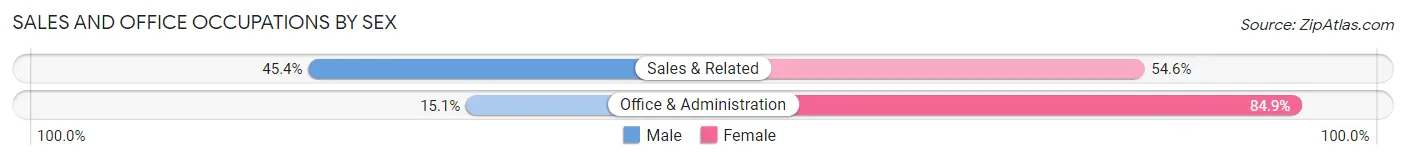
| Occupation | Male | Female |
| Sales & Related | 581 (45.4%) | 698 (54.6%) |
| Office & Administration | 256 (15.1%) | 1,442 (84.9%) |
| Total (Category) | 837 (28.1%) | 2,140 (71.9%) |
| Total (Overall) | 7,255 (53.1%) | 6,409 (46.9%) |
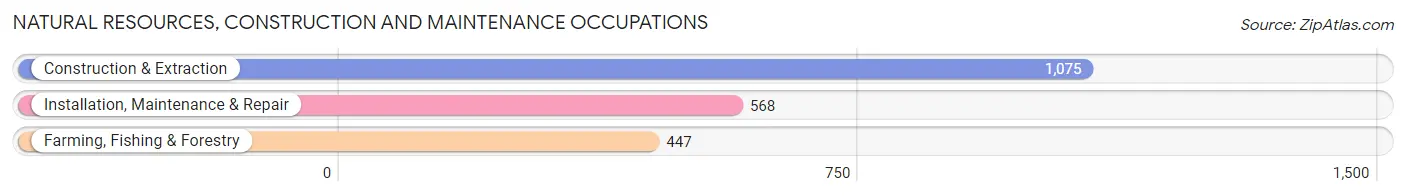
Natural Resources, Construction and Maintenance Occupations
The most common Natural Resources, Construction and Maintenance occupations in Fallbrook are Construction & Extraction (1,075 | 7.9%), Installation, Maintenance & Repair (568 | 4.2%), and Farming, Fishing & Forestry (447 | 3.3%).
Natural Resources, Construction and Maintenance Occupations by Sex
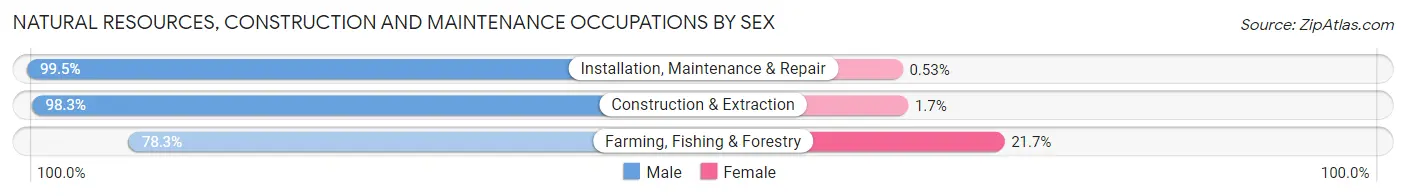
| Occupation | Male | Female |
| Farming, Fishing & Forestry | 350 (78.3%) | 97 (21.7%) |
| Construction & Extraction | 1,057 (98.3%) | 18 (1.7%) |
| Installation, Maintenance & Repair | 565 (99.5%) | 3 (0.5%) |
| Total (Category) | 1,972 (94.4%) | 118 (5.7%) |
| Total (Overall) | 7,255 (53.1%) | 6,409 (46.9%) |
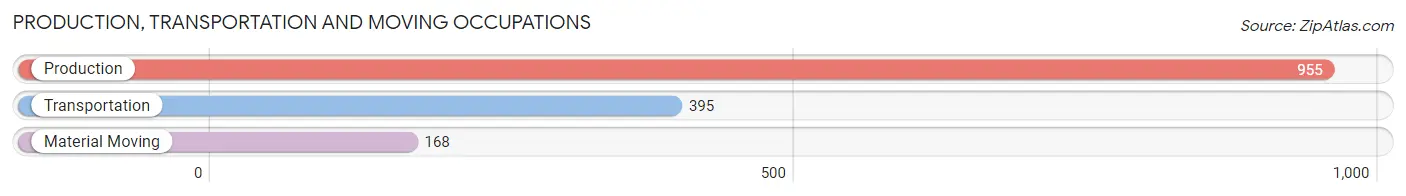
Production, Transportation and Moving Occupations
The most common Production, Transportation and Moving occupations in Fallbrook are Production (955 | 7.0%), Transportation (395 | 2.9%), and Material Moving (168 | 1.2%).
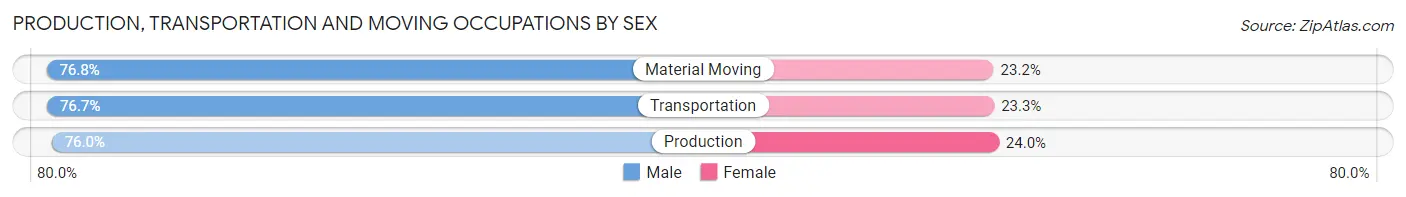
Production, Transportation and Moving Occupations by Sex
| Occupation | Male | Female |
| Production | 726 (76.0%) | 229 (24.0%) |
| Transportation | 303 (76.7%) | 92 (23.3%) |
| Material Moving | 129 (76.8%) | 39 (23.2%) |
| Total (Category) | 1,158 (76.3%) | 360 (23.7%) |
| Total (Overall) | 7,255 (53.1%) | 6,409 (46.9%) |
Employment Industries by Sex in Fallbrook
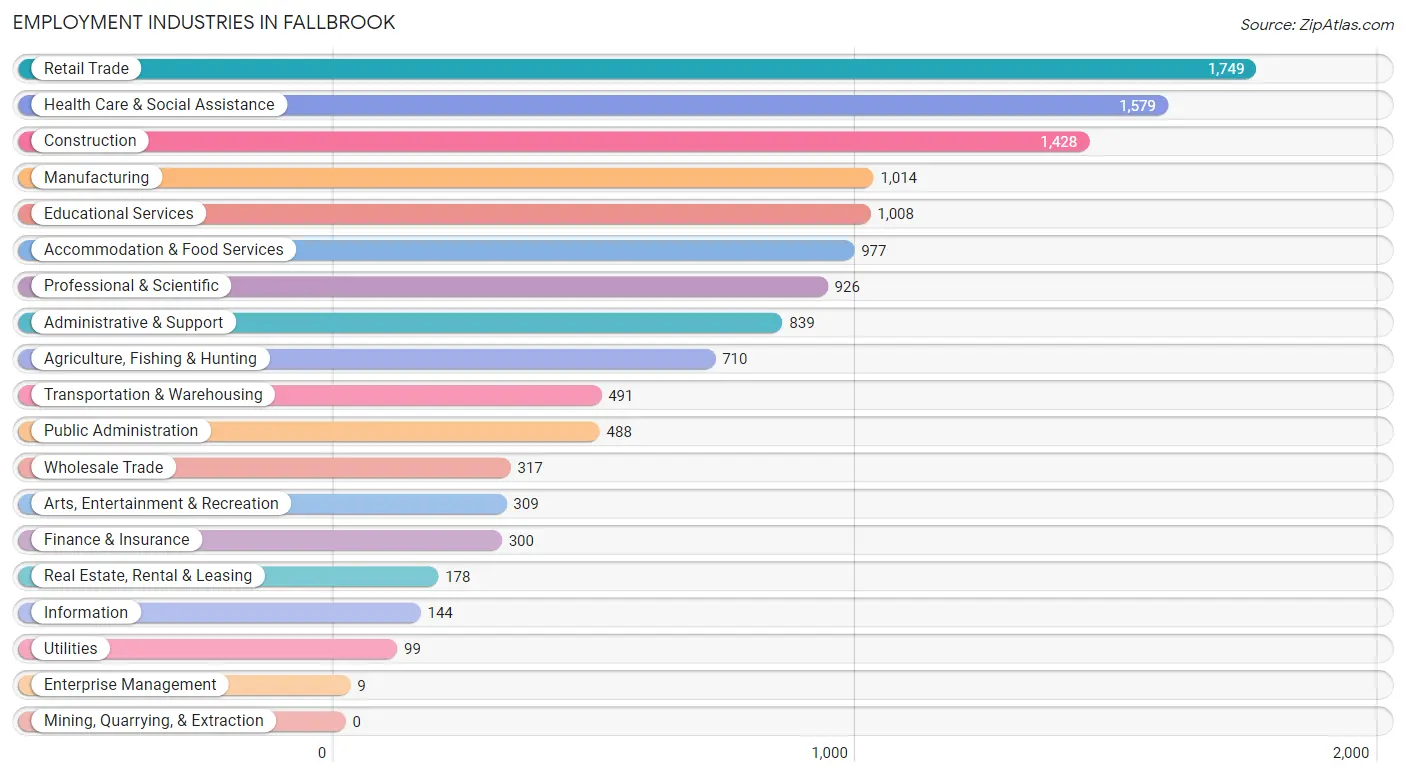
Employment Industries in Fallbrook
The major employment industries in Fallbrook include Retail Trade (1,749 | 12.8%), Health Care & Social Assistance (1,579 | 11.6%), Construction (1,428 | 10.4%), Manufacturing (1,014 | 7.4%), and Educational Services (1,008 | 7.4%).
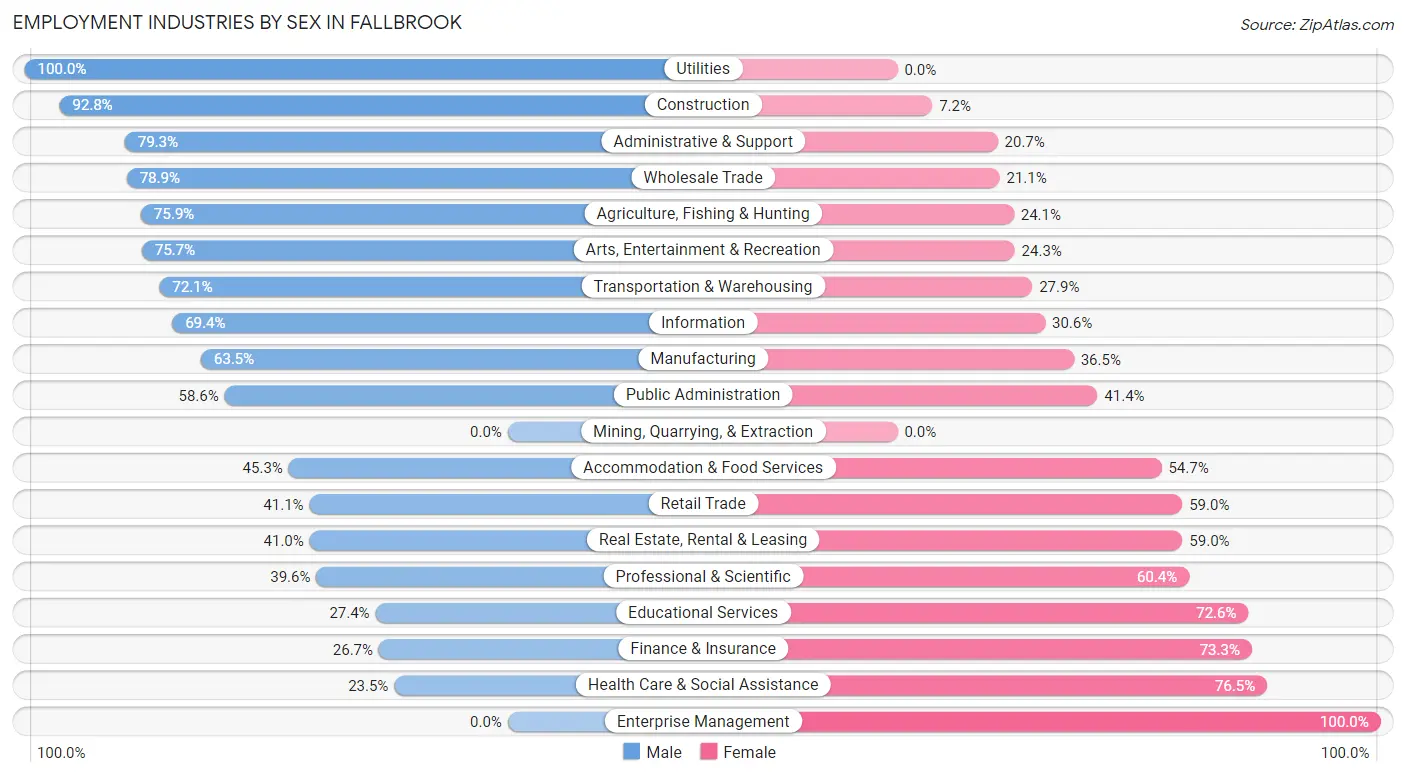
Employment Industries by Sex in Fallbrook
The Fallbrook industries that see more men than women are Utilities (100.0%), Construction (92.8%), and Administrative & Support (79.3%), whereas the industries that tend to have a higher number of women are Enterprise Management (100.0%), Health Care & Social Assistance (76.5%), and Finance & Insurance (73.3%).
| Industry | Male | Female |
| Agriculture, Fishing & Hunting | 539 (75.9%) | 171 (24.1%) |
| Mining, Quarrying, & Extraction | 0 (0.0%) | 0 (0.0%) |
| Construction | 1,325 (92.8%) | 103 (7.2%) |
| Manufacturing | 644 (63.5%) | 370 (36.5%) |
| Wholesale Trade | 250 (78.9%) | 67 (21.1%) |
| Retail Trade | 718 (41.0%) | 1,031 (59.0%) |
| Transportation & Warehousing | 354 (72.1%) | 137 (27.9%) |
| Utilities | 99 (100.0%) | 0 (0.0%) |
| Information | 100 (69.4%) | 44 (30.6%) |
| Finance & Insurance | 80 (26.7%) | 220 (73.3%) |
| Real Estate, Rental & Leasing | 73 (41.0%) | 105 (59.0%) |
| Professional & Scientific | 367 (39.6%) | 559 (60.4%) |
| Enterprise Management | 0 (0.0%) | 9 (100.0%) |
| Administrative & Support | 665 (79.3%) | 174 (20.7%) |
| Educational Services | 276 (27.4%) | 732 (72.6%) |
| Health Care & Social Assistance | 371 (23.5%) | 1,208 (76.5%) |
| Arts, Entertainment & Recreation | 234 (75.7%) | 75 (24.3%) |
| Accommodation & Food Services | 443 (45.3%) | 534 (54.7%) |
| Public Administration | 286 (58.6%) | 202 (41.4%) |
| Total | 7,255 (53.1%) | 6,409 (46.9%) |
Education in Fallbrook
School Enrollment in Fallbrook
The most common levels of schooling among the 8,292 students in Fallbrook are elementary school (1,903 | 23.0%), high school (1,901 | 22.9%), and middle school (1,664 | 20.1%).
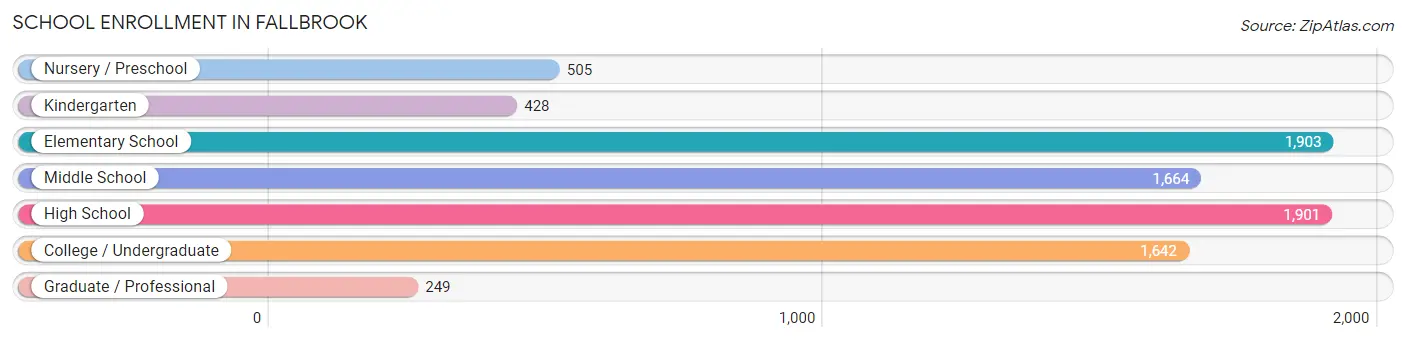
| School Level | # Students | % Students |
| Nursery / Preschool | 505 | 6.1% |
| Kindergarten | 428 | 5.2% |
| Elementary School | 1,903 | 23.0% |
| Middle School | 1,664 | 20.1% |
| High School | 1,901 | 22.9% |
| College / Undergraduate | 1,642 | 19.8% |
| Graduate / Professional | 249 | 3.0% |
| Total | 8,292 | 100.0% |
School Enrollment by Age by Funding Source in Fallbrook
Out of a total of 8,292 students who are enrolled in schools in Fallbrook, 1,012 (12.2%) attend a private institution, while the remaining 7,280 (87.8%) are enrolled in public schools. The age group of 3 to 4 year olds has the highest likelihood of being enrolled in private schools, with 90 (28.8% in the age bracket) enrolled. Conversely, the age group of 18 to 19 year olds has the lowest likelihood of being enrolled in a private school, with 358 (100.0% in the age bracket) attending a public institution.
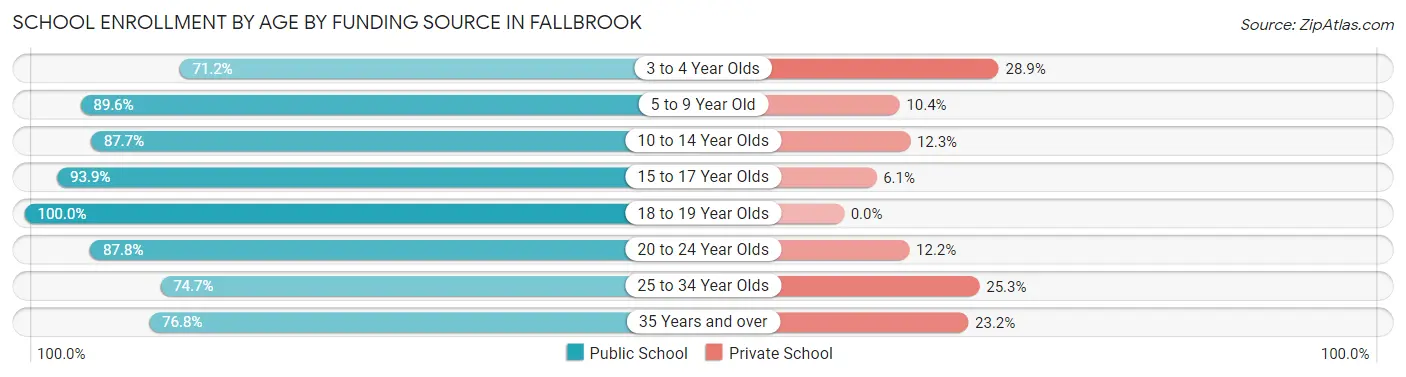
| Age Bracket | Public School | Private School |
| 3 to 4 Year Olds | 222 (71.2%) | 90 (28.8%) |
| 5 to 9 Year Old | 2,053 (89.6%) | 238 (10.4%) |
| 10 to 14 Year Olds | 1,939 (87.7%) | 273 (12.3%) |
| 15 to 17 Year Olds | 1,272 (93.9%) | 82 (6.1%) |
| 18 to 19 Year Olds | 358 (100.0%) | 0 (0.0%) |
| 20 to 24 Year Olds | 713 (87.8%) | 99 (12.2%) |
| 25 to 34 Year Olds | 435 (74.7%) | 147 (25.3%) |
| 35 Years and over | 285 (76.8%) | 86 (23.2%) |
| Total | 7,280 (87.8%) | 1,012 (12.2%) |
Educational Attainment by Field of Study in Fallbrook
Business (1,092 | 17.6%), computers & mathematics (619 | 10.0%), arts & humanities (613 | 9.9%), social sciences (534 | 8.6%), and liberal arts & history (500 | 8.1%) are the most common fields of study among 6,215 individuals in Fallbrook who have obtained a bachelor's degree or higher.
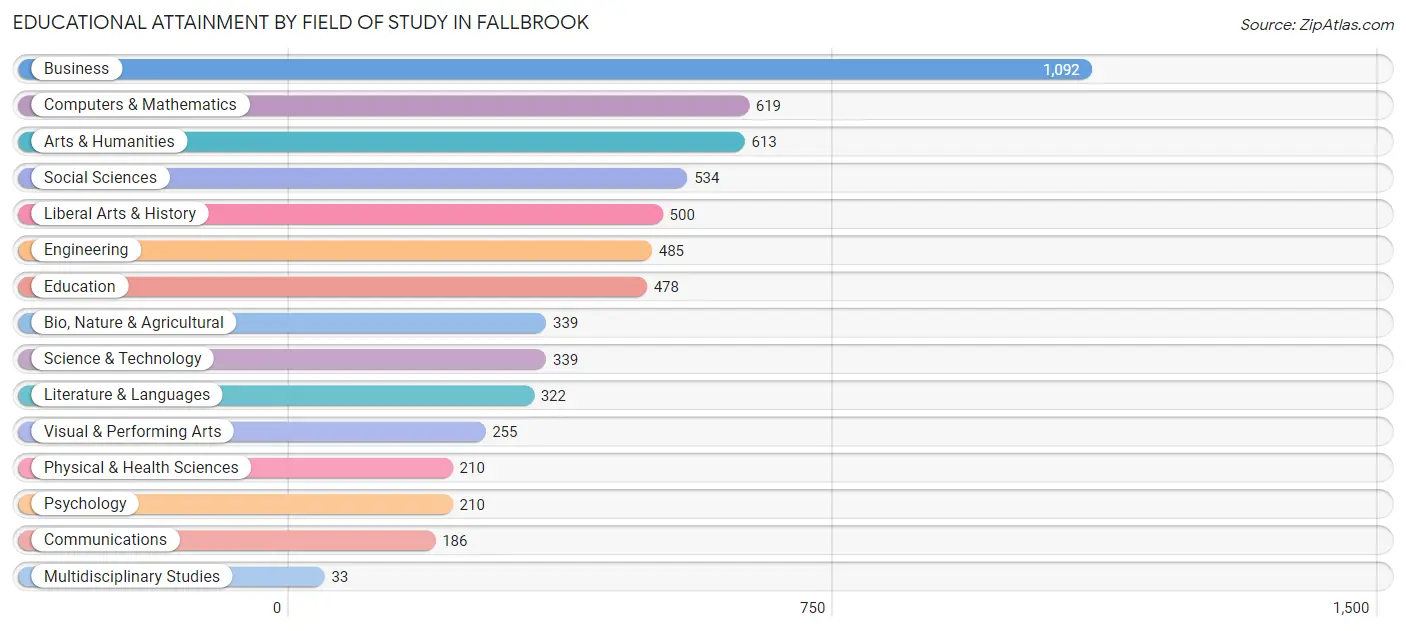
| Field of Study | # Graduates | % Graduates |
| Computers & Mathematics | 619 | 10.0% |
| Bio, Nature & Agricultural | 339 | 5.4% |
| Physical & Health Sciences | 210 | 3.4% |
| Psychology | 210 | 3.4% |
| Social Sciences | 534 | 8.6% |
| Engineering | 485 | 7.8% |
| Multidisciplinary Studies | 33 | 0.5% |
| Science & Technology | 339 | 5.4% |
| Business | 1,092 | 17.6% |
| Education | 478 | 7.7% |
| Literature & Languages | 322 | 5.2% |
| Liberal Arts & History | 500 | 8.1% |
| Visual & Performing Arts | 255 | 4.1% |
| Communications | 186 | 3.0% |
| Arts & Humanities | 613 | 9.9% |
| Total | 6,215 | 100.0% |
Transportation & Commute in Fallbrook
Vehicle Availability by Sex in Fallbrook
The most prevalent vehicle ownership categories in Fallbrook are males with 2 vehicles (2,841, accounting for 36.3%) and females with 2 vehicles (1,872, making up 44.8%).
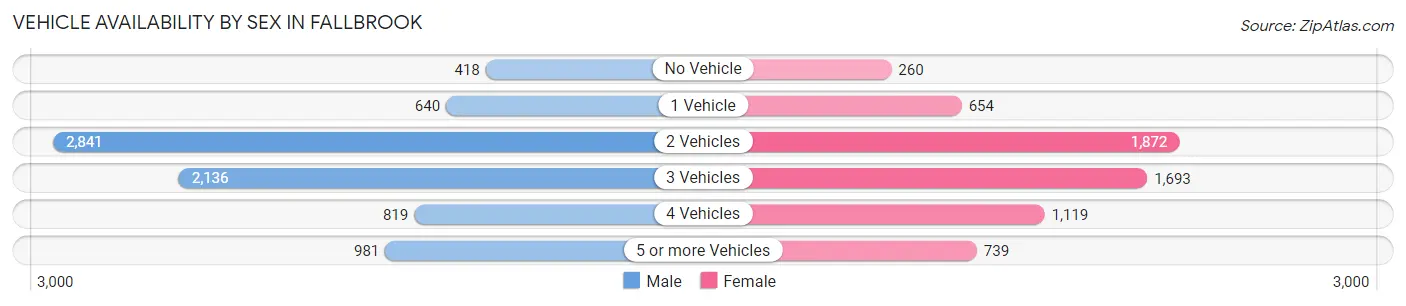
| Vehicles Available | Male | Female |
| No Vehicle | 418 (5.3%) | 260 (4.1%) |
| 1 Vehicle | 640 (8.2%) | 654 (10.3%) |
| 2 Vehicles | 2,841 (36.3%) | 1,872 (29.5%) |
| 3 Vehicles | 2,136 (27.3%) | 1,693 (26.7%) |
| 4 Vehicles | 819 (10.4%) | 1,119 (17.7%) |
| 5 or more Vehicles | 981 (12.5%) | 739 (11.7%) |
| Total | 7,835 (100.0%) | 6,337 (100.0%) |
Commute Time in Fallbrook
The most frequently occuring commute durations in Fallbrook are 30 to 34 minutes (2,701 commuters, 20.9%), 45 to 59 minutes (1,527 commuters, 11.8%), and 20 to 24 minutes (1,320 commuters, 10.2%).
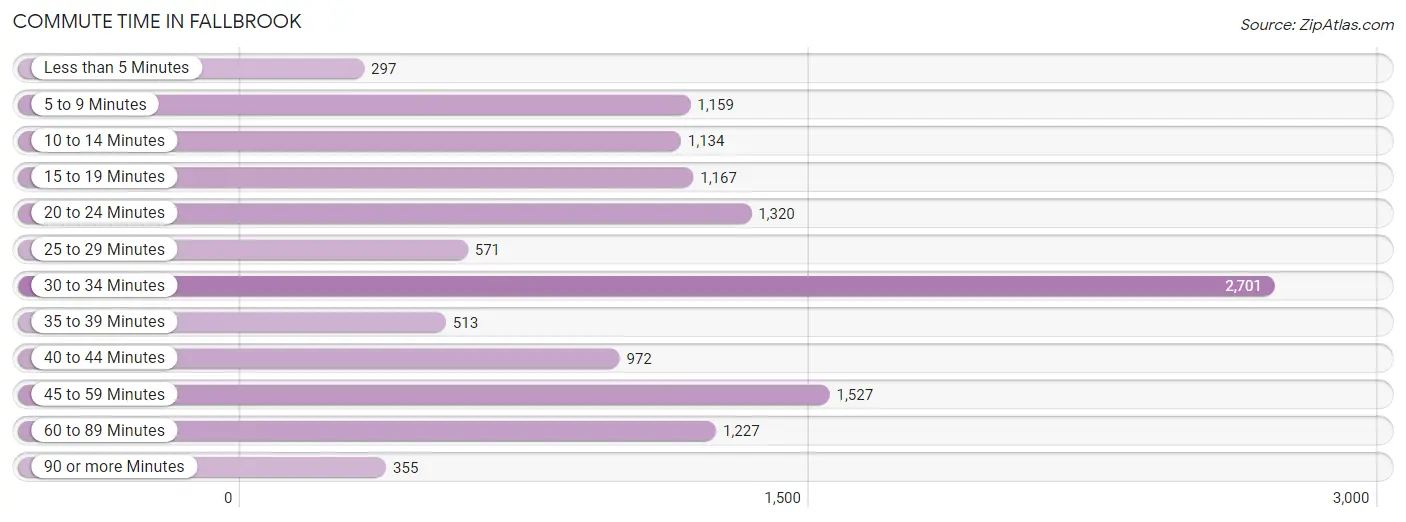
| Commute Time | # Commuters | % Commuters |
| Less than 5 Minutes | 297 | 2.3% |
| 5 to 9 Minutes | 1,159 | 8.9% |
| 10 to 14 Minutes | 1,134 | 8.8% |
| 15 to 19 Minutes | 1,167 | 9.0% |
| 20 to 24 Minutes | 1,320 | 10.2% |
| 25 to 29 Minutes | 571 | 4.4% |
| 30 to 34 Minutes | 2,701 | 20.9% |
| 35 to 39 Minutes | 513 | 4.0% |
| 40 to 44 Minutes | 972 | 7.5% |
| 45 to 59 Minutes | 1,527 | 11.8% |
| 60 to 89 Minutes | 1,227 | 9.5% |
| 90 or more Minutes | 355 | 2.7% |
Commute Time by Sex in Fallbrook
The most common commute times in Fallbrook are 30 to 34 minutes (1,782 commuters, 24.4%) for males and 30 to 34 minutes (919 commuters, 16.3%) for females.
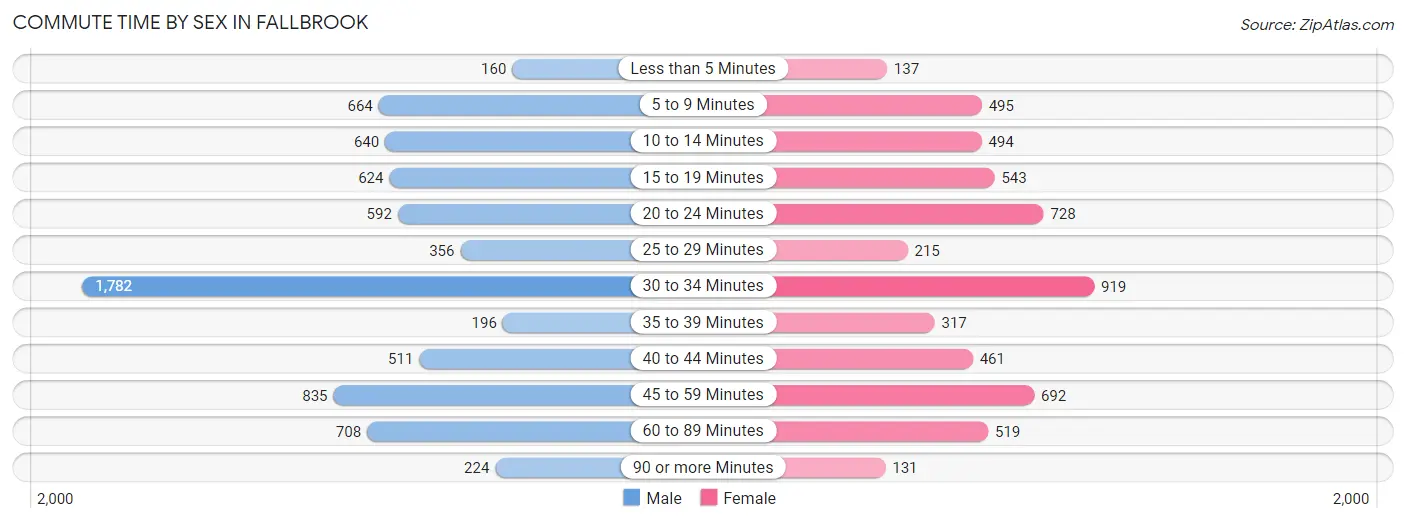
| Commute Time | Male | Female |
| Less than 5 Minutes | 160 (2.2%) | 137 (2.4%) |
| 5 to 9 Minutes | 664 (9.1%) | 495 (8.8%) |
| 10 to 14 Minutes | 640 (8.8%) | 494 (8.7%) |
| 15 to 19 Minutes | 624 (8.6%) | 543 (9.6%) |
| 20 to 24 Minutes | 592 (8.1%) | 728 (12.9%) |
| 25 to 29 Minutes | 356 (4.9%) | 215 (3.8%) |
| 30 to 34 Minutes | 1,782 (24.4%) | 919 (16.3%) |
| 35 to 39 Minutes | 196 (2.7%) | 317 (5.6%) |
| 40 to 44 Minutes | 511 (7.0%) | 461 (8.2%) |
| 45 to 59 Minutes | 835 (11.5%) | 692 (12.2%) |
| 60 to 89 Minutes | 708 (9.7%) | 519 (9.2%) |
| 90 or more Minutes | 224 (3.1%) | 131 (2.3%) |
Time of Departure to Work by Sex in Fallbrook
The most frequent times of departure to work in Fallbrook are 6:00 AM to 6:29 AM (1,232, 16.9%) for males and 7:00 AM to 7:29 AM (1,334, 23.6%) for females.
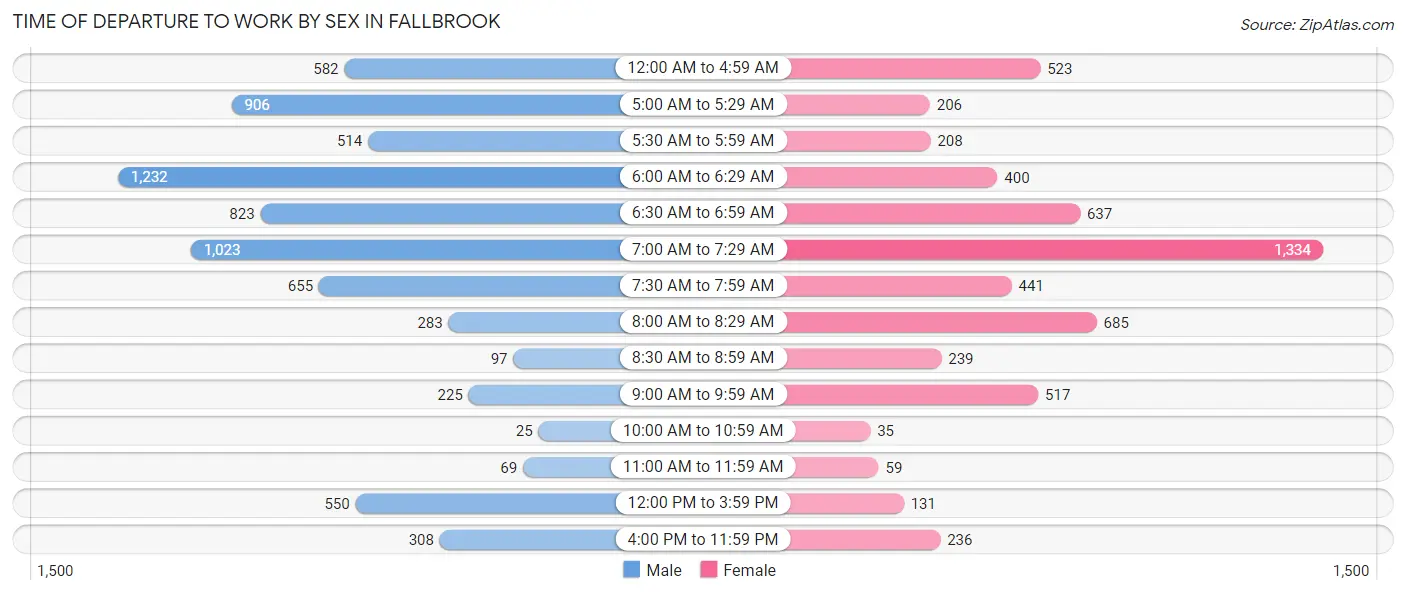
| Time of Departure | Male | Female |
| 12:00 AM to 4:59 AM | 582 (8.0%) | 523 (9.2%) |
| 5:00 AM to 5:29 AM | 906 (12.4%) | 206 (3.6%) |
| 5:30 AM to 5:59 AM | 514 (7.0%) | 208 (3.7%) |
| 6:00 AM to 6:29 AM | 1,232 (16.9%) | 400 (7.1%) |
| 6:30 AM to 6:59 AM | 823 (11.3%) | 637 (11.3%) |
| 7:00 AM to 7:29 AM | 1,023 (14.0%) | 1,334 (23.6%) |
| 7:30 AM to 7:59 AM | 655 (9.0%) | 441 (7.8%) |
| 8:00 AM to 8:29 AM | 283 (3.9%) | 685 (12.1%) |
| 8:30 AM to 8:59 AM | 97 (1.3%) | 239 (4.2%) |
| 9:00 AM to 9:59 AM | 225 (3.1%) | 517 (9.1%) |
| 10:00 AM to 10:59 AM | 25 (0.3%) | 35 (0.6%) |
| 11:00 AM to 11:59 AM | 69 (0.9%) | 59 (1.0%) |
| 12:00 PM to 3:59 PM | 550 (7.5%) | 131 (2.3%) |
| 4:00 PM to 11:59 PM | 308 (4.2%) | 236 (4.2%) |
| Total | 7,292 (100.0%) | 5,651 (100.0%) |
Housing Occupancy in Fallbrook
Occupancy by Ownership in Fallbrook
Of the total 10,334 dwellings in Fallbrook, owner-occupied units account for 6,062 (58.7%), while renter-occupied units make up 4,272 (41.3%).
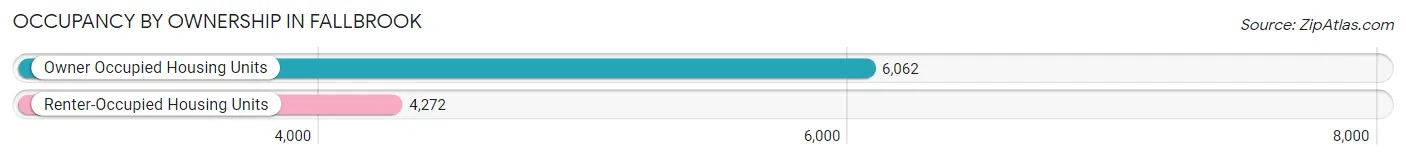
| Occupancy | # Housing Units | % Housing Units |
| Owner Occupied Housing Units | 6,062 | 58.7% |
| Renter-Occupied Housing Units | 4,272 | 41.3% |
| Total Occupied Housing Units | 10,334 | 100.0% |
Occupancy by Household Size in Fallbrook
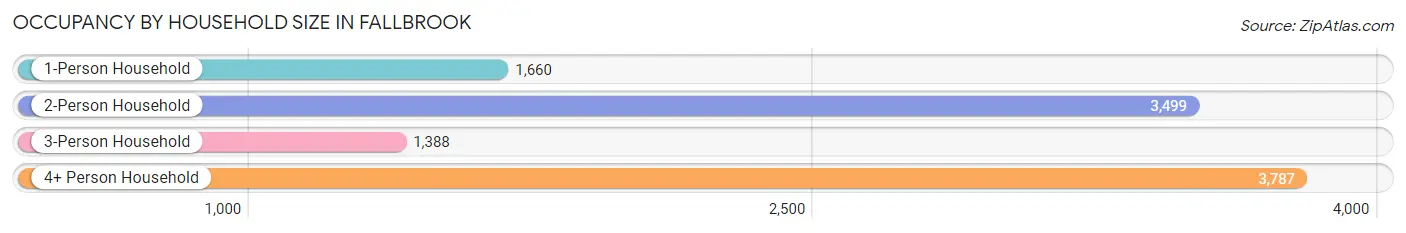
| Household Size | # Housing Units | % Housing Units |
| 1-Person Household | 1,660 | 16.1% |
| 2-Person Household | 3,499 | 33.9% |
| 3-Person Household | 1,388 | 13.4% |
| 4+ Person Household | 3,787 | 36.6% |
| Total Housing Units | 10,334 | 100.0% |
Occupancy by Ownership by Household Size in Fallbrook
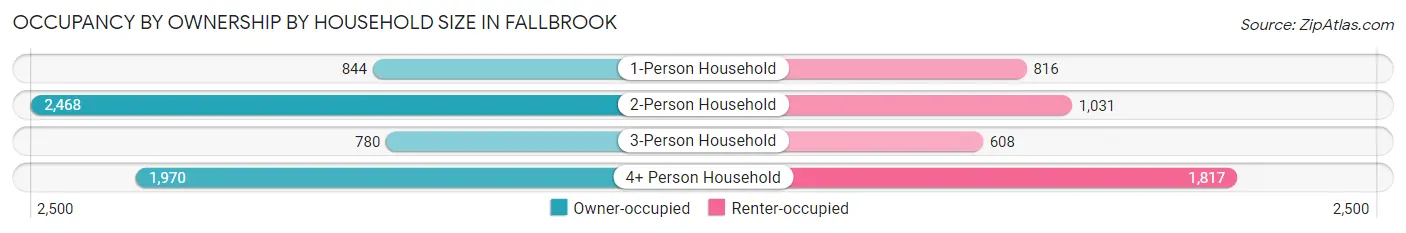
| Household Size | Owner-occupied | Renter-occupied |
| 1-Person Household | 844 (50.8%) | 816 (49.2%) |
| 2-Person Household | 2,468 (70.5%) | 1,031 (29.5%) |
| 3-Person Household | 780 (56.2%) | 608 (43.8%) |
| 4+ Person Household | 1,970 (52.0%) | 1,817 (48.0%) |
| Total Housing Units | 6,062 (58.7%) | 4,272 (41.3%) |
Occupancy by Educational Attainment in Fallbrook
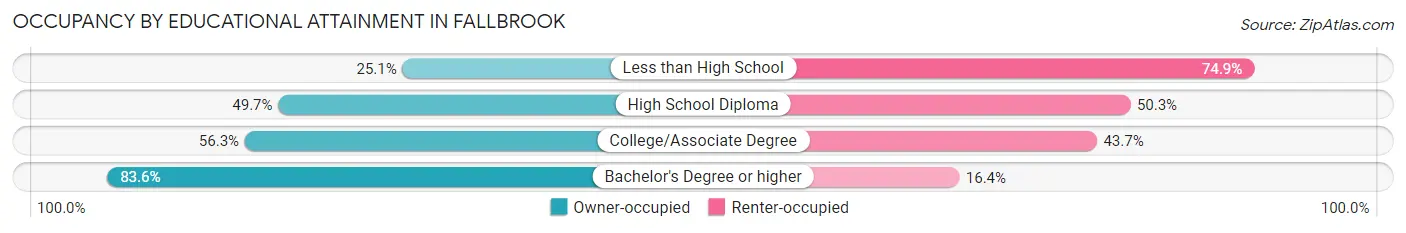
| Household Size | Owner-occupied | Renter-occupied |
| Less than High School | 377 (25.1%) | 1,127 (74.9%) |
| High School Diploma | 1,119 (49.7%) | 1,133 (50.3%) |
| College/Associate Degree | 1,928 (56.3%) | 1,495 (43.7%) |
| Bachelor's Degree or higher | 2,638 (83.6%) | 517 (16.4%) |
Occupancy by Age of Householder in Fallbrook
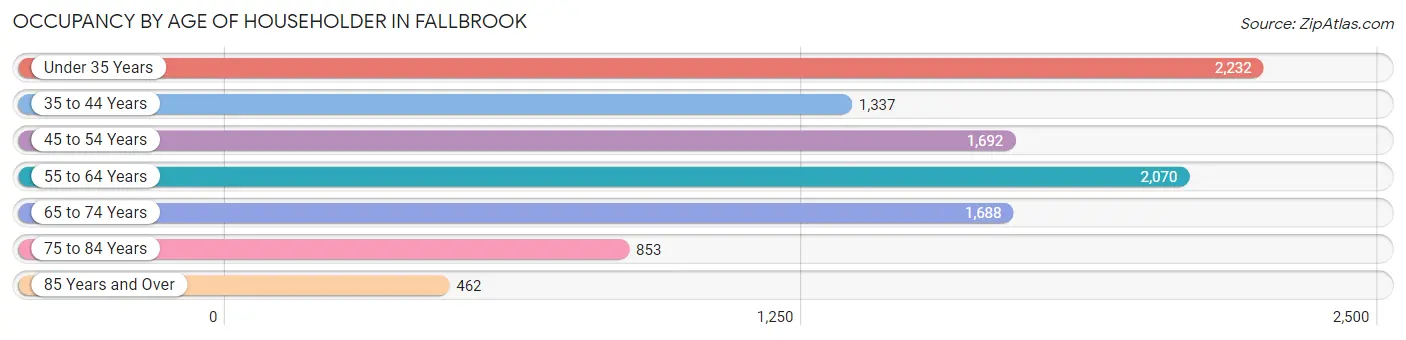
| Age Bracket | # Households | % Households |
| Under 35 Years | 2,232 | 21.6% |
| 35 to 44 Years | 1,337 | 12.9% |
| 45 to 54 Years | 1,692 | 16.4% |
| 55 to 64 Years | 2,070 | 20.0% |
| 65 to 74 Years | 1,688 | 16.3% |
| 75 to 84 Years | 853 | 8.3% |
| 85 Years and Over | 462 | 4.5% |
| Total | 10,334 | 100.0% |
Housing Finances in Fallbrook
Median Income by Occupancy in Fallbrook
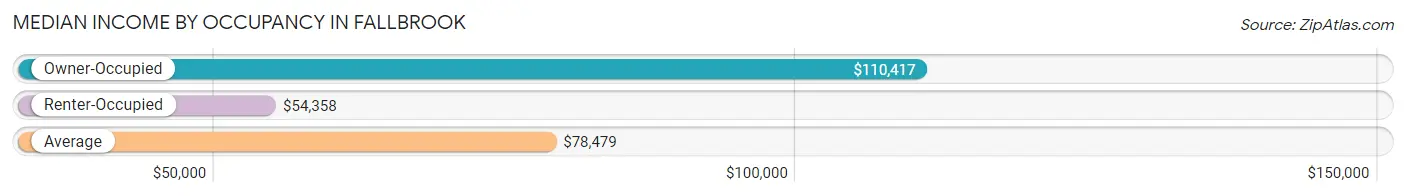
| Occupancy Type | # Households | Median Income |
| Owner-Occupied | 6,062 (58.7%) | $110,417 |
| Renter-Occupied | 4,272 (41.3%) | $54,358 |
| Average | 10,334 (100.0%) | $78,479 |
Occupancy by Householder Income Bracket in Fallbrook
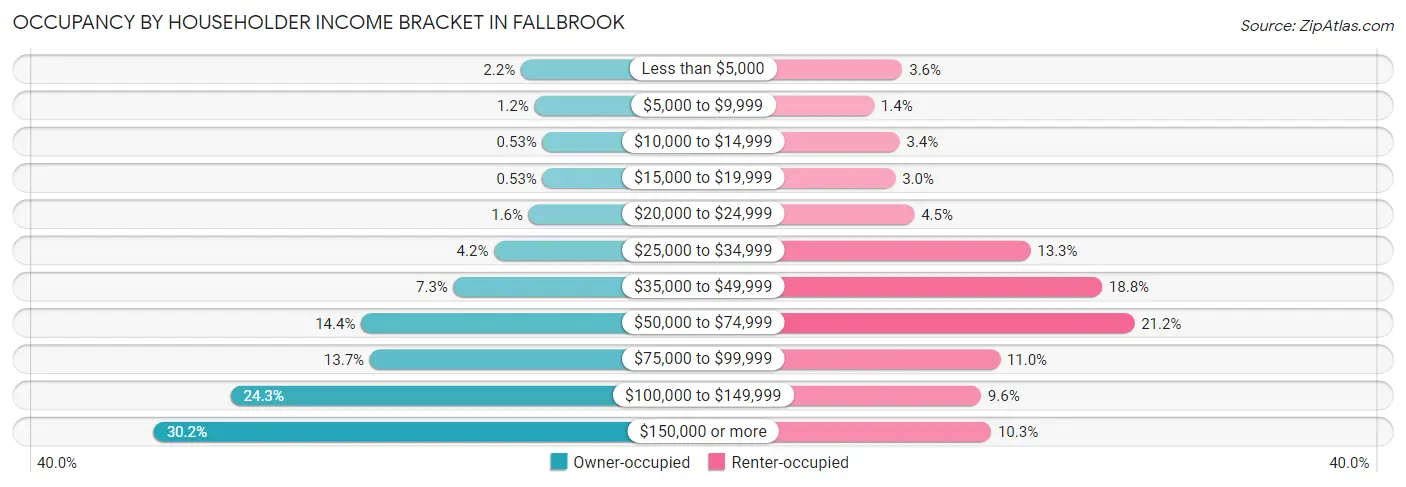
| Income Bracket | Owner-occupied | Renter-occupied |
| Less than $5,000 | 132 (2.2%) | 152 (3.6%) |
| $5,000 to $9,999 | 70 (1.1%) | 60 (1.4%) |
| $10,000 to $14,999 | 32 (0.5%) | 143 (3.4%) |
| $15,000 to $19,999 | 32 (0.5%) | 129 (3.0%) |
| $20,000 to $24,999 | 96 (1.6%) | 191 (4.5%) |
| $25,000 to $34,999 | 256 (4.2%) | 569 (13.3%) |
| $35,000 to $49,999 | 443 (7.3%) | 802 (18.8%) |
| $50,000 to $74,999 | 870 (14.3%) | 907 (21.2%) |
| $75,000 to $99,999 | 830 (13.7%) | 470 (11.0%) |
| $100,000 to $149,999 | 1,473 (24.3%) | 408 (9.6%) |
| $150,000 or more | 1,828 (30.2%) | 441 (10.3%) |
| Total | 6,062 (100.0%) | 4,272 (100.0%) |
Monthly Housing Cost Tiers in Fallbrook
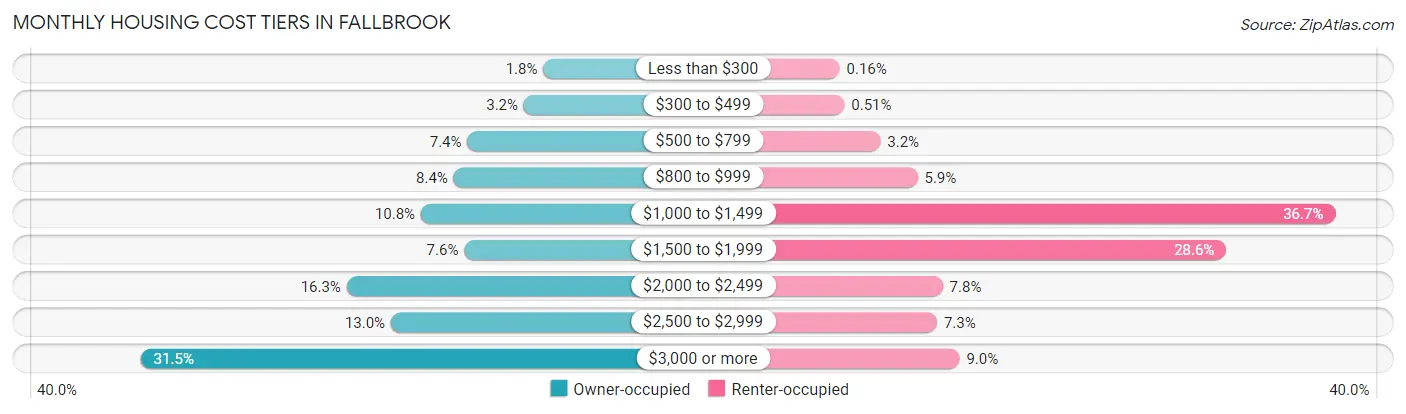
| Monthly Cost | Owner-occupied | Renter-occupied |
| Less than $300 | 109 (1.8%) | 7 (0.2%) |
| $300 to $499 | 196 (3.2%) | 22 (0.5%) |
| $500 to $799 | 448 (7.4%) | 135 (3.2%) |
| $800 to $999 | 509 (8.4%) | 252 (5.9%) |
| $1,000 to $1,499 | 655 (10.8%) | 1,566 (36.7%) |
| $1,500 to $1,999 | 462 (7.6%) | 1,223 (28.6%) |
| $2,000 to $2,499 | 987 (16.3%) | 331 (7.7%) |
| $2,500 to $2,999 | 789 (13.0%) | 313 (7.3%) |
| $3,000 or more | 1,907 (31.5%) | 384 (9.0%) |
| Total | 6,062 (100.0%) | 4,272 (100.0%) |
Physical Housing Characteristics in Fallbrook
Housing Structures in Fallbrook
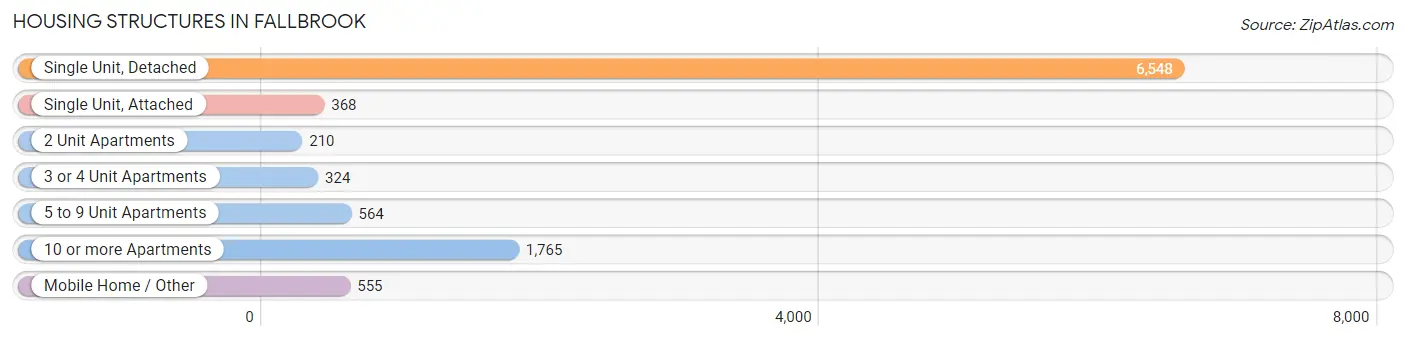
| Structure Type | # Housing Units | % Housing Units |
| Single Unit, Detached | 6,548 | 63.4% |
| Single Unit, Attached | 368 | 3.6% |
| 2 Unit Apartments | 210 | 2.0% |
| 3 or 4 Unit Apartments | 324 | 3.1% |
| 5 to 9 Unit Apartments | 564 | 5.5% |
| 10 or more Apartments | 1,765 | 17.1% |
| Mobile Home / Other | 555 | 5.4% |
| Total | 10,334 | 100.0% |
Housing Structures by Occupancy in Fallbrook
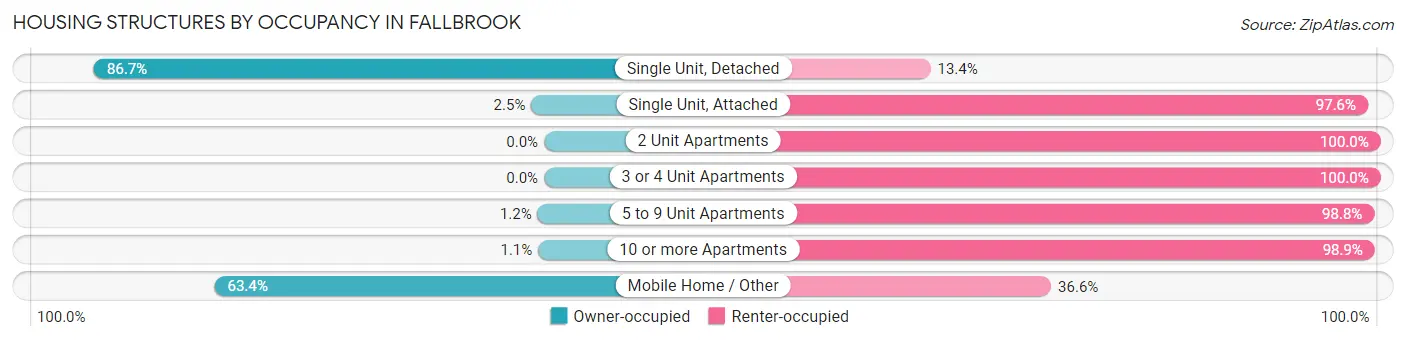
| Structure Type | Owner-occupied | Renter-occupied |
| Single Unit, Detached | 5,674 (86.7%) | 874 (13.4%) |
| Single Unit, Attached | 9 (2.5%) | 359 (97.6%) |
| 2 Unit Apartments | 0 (0.0%) | 210 (100.0%) |
| 3 or 4 Unit Apartments | 0 (0.0%) | 324 (100.0%) |
| 5 to 9 Unit Apartments | 7 (1.2%) | 557 (98.8%) |
| 10 or more Apartments | 20 (1.1%) | 1,745 (98.9%) |
| Mobile Home / Other | 352 (63.4%) | 203 (36.6%) |
| Total | 6,062 (58.7%) | 4,272 (41.3%) |
Housing Structures by Number of Rooms in Fallbrook
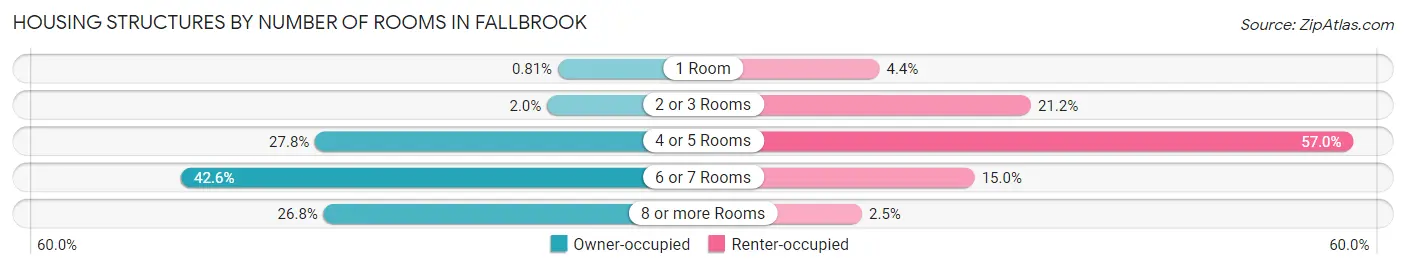
| Number of Rooms | Owner-occupied | Renter-occupied |
| 1 Room | 49 (0.8%) | 188 (4.4%) |
| 2 or 3 Rooms | 122 (2.0%) | 906 (21.2%) |
| 4 or 5 Rooms | 1,682 (27.8%) | 2,434 (57.0%) |
| 6 or 7 Rooms | 2,584 (42.6%) | 639 (15.0%) |
| 8 or more Rooms | 1,625 (26.8%) | 105 (2.5%) |
| Total | 6,062 (100.0%) | 4,272 (100.0%) |
Housing Structure by Heating Type in Fallbrook
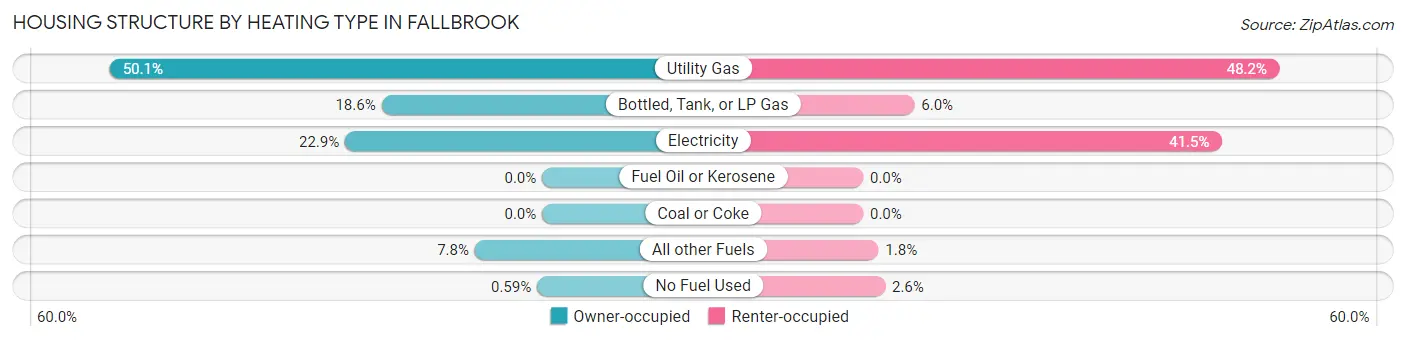
| Heating Type | Owner-occupied | Renter-occupied |
| Utility Gas | 3,039 (50.1%) | 2,059 (48.2%) |
| Bottled, Tank, or LP Gas | 1,129 (18.6%) | 254 (5.9%) |
| Electricity | 1,385 (22.9%) | 1,774 (41.5%) |
| Fuel Oil or Kerosene | 0 (0.0%) | 0 (0.0%) |
| Coal or Coke | 0 (0.0%) | 0 (0.0%) |
| All other Fuels | 473 (7.8%) | 76 (1.8%) |
| No Fuel Used | 36 (0.6%) | 109 (2.5%) |
| Total | 6,062 (100.0%) | 4,272 (100.0%) |
Household Vehicle Usage in Fallbrook
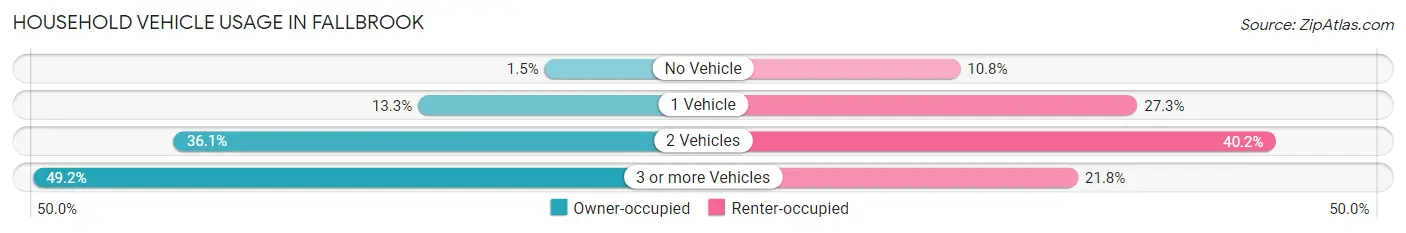
| Vehicles per Household | Owner-occupied | Renter-occupied |
| No Vehicle | 89 (1.5%) | 460 (10.8%) |
| 1 Vehicle | 805 (13.3%) | 1,166 (27.3%) |
| 2 Vehicles | 2,186 (36.1%) | 1,716 (40.2%) |
| 3 or more Vehicles | 2,982 (49.2%) | 930 (21.8%) |
| Total | 6,062 (100.0%) | 4,272 (100.0%) |
Real Estate & Mortgages in Fallbrook
Real Estate and Mortgage Overview in Fallbrook
| Characteristic | Without Mortgage | With Mortgage |
| Housing Units | 1,785 | 4,277 |
| Median Property Value | $650,500 | $671,800 |
| Median Household Income | $87,321 | $1,507 |
| Monthly Housing Costs | $909 | $1,898 |
| Real Estate Taxes | $4,236 | $43 |
Property Value by Mortgage Status in Fallbrook
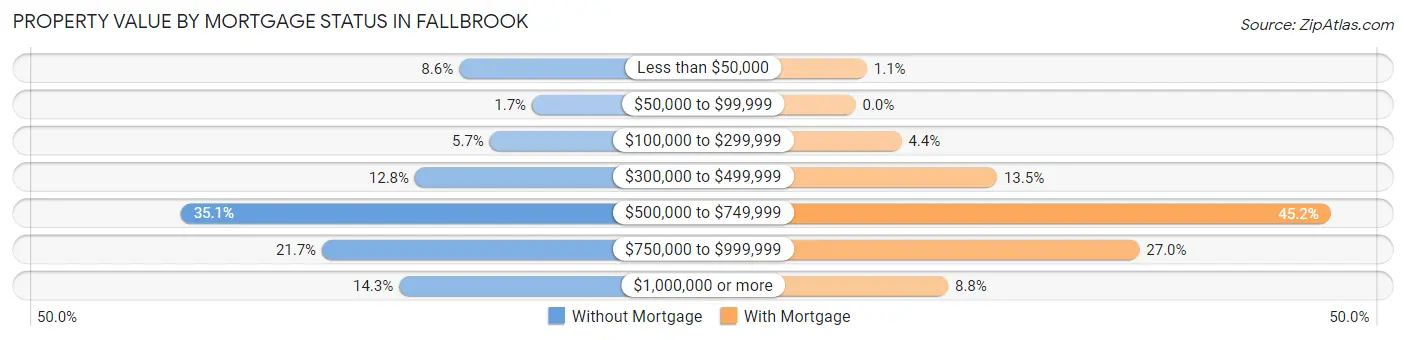
| Property Value | Without Mortgage | With Mortgage |
| Less than $50,000 | 154 (8.6%) | 46 (1.1%) |
| $50,000 to $99,999 | 30 (1.7%) | 0 (0.0%) |
| $100,000 to $299,999 | 102 (5.7%) | 187 (4.4%) |
| $300,000 to $499,999 | 229 (12.8%) | 576 (13.5%) |
| $500,000 to $749,999 | 627 (35.1%) | 1,935 (45.2%) |
| $750,000 to $999,999 | 387 (21.7%) | 1,156 (27.0%) |
| $1,000,000 or more | 256 (14.3%) | 377 (8.8%) |
| Total | 1,785 (100.0%) | 4,277 (100.0%) |
Household Income by Mortgage Status in Fallbrook
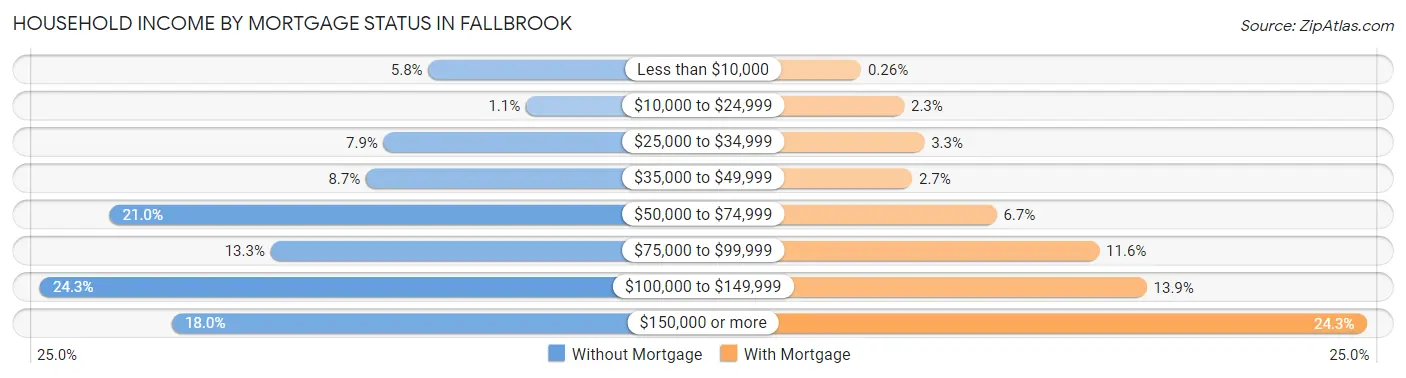
| Household Income | Without Mortgage | With Mortgage |
| Less than $10,000 | 103 (5.8%) | 11 (0.3%) |
| $10,000 to $24,999 | 20 (1.1%) | 99 (2.3%) |
| $25,000 to $34,999 | 141 (7.9%) | 140 (3.3%) |
| $35,000 to $49,999 | 156 (8.7%) | 115 (2.7%) |
| $50,000 to $74,999 | 374 (20.9%) | 287 (6.7%) |
| $75,000 to $99,999 | 237 (13.3%) | 496 (11.6%) |
| $100,000 to $149,999 | 433 (24.3%) | 593 (13.9%) |
| $150,000 or more | 321 (18.0%) | 1,040 (24.3%) |
| Total | 1,785 (100.0%) | 4,277 (100.0%) |
Property Value to Household Income Ratio in Fallbrook
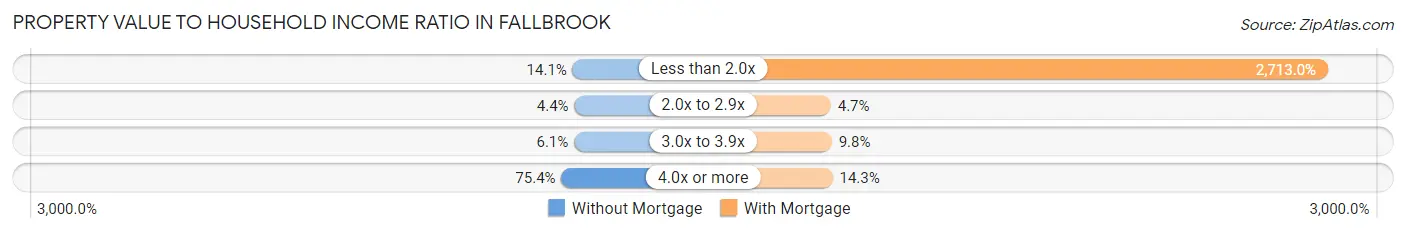
| Value-to-Income Ratio | Without Mortgage | With Mortgage |
| Less than 2.0x | 251 (14.1%) | 116,036 (2,713.0%) |
| 2.0x to 2.9x | 79 (4.4%) | 199 (4.6%) |
| 3.0x to 3.9x | 109 (6.1%) | 420 (9.8%) |
| 4.0x or more | 1,346 (75.4%) | 612 (14.3%) |
| Total | 1,785 (100.0%) | 4,277 (100.0%) |
Real Estate Taxes by Mortgage Status in Fallbrook
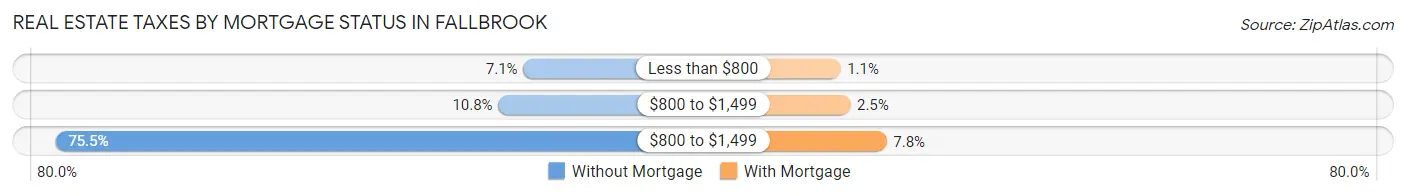
| Property Taxes | Without Mortgage | With Mortgage |
| Less than $800 | 127 (7.1%) | 45 (1.1%) |
| $800 to $1,499 | 192 (10.8%) | 106 (2.5%) |
| $800 to $1,499 | 1,348 (75.5%) | 333 (7.8%) |
| Total | 1,785 (100.0%) | 4,277 (100.0%) |
Health & Disability in Fallbrook
Health Insurance Coverage by Age in Fallbrook
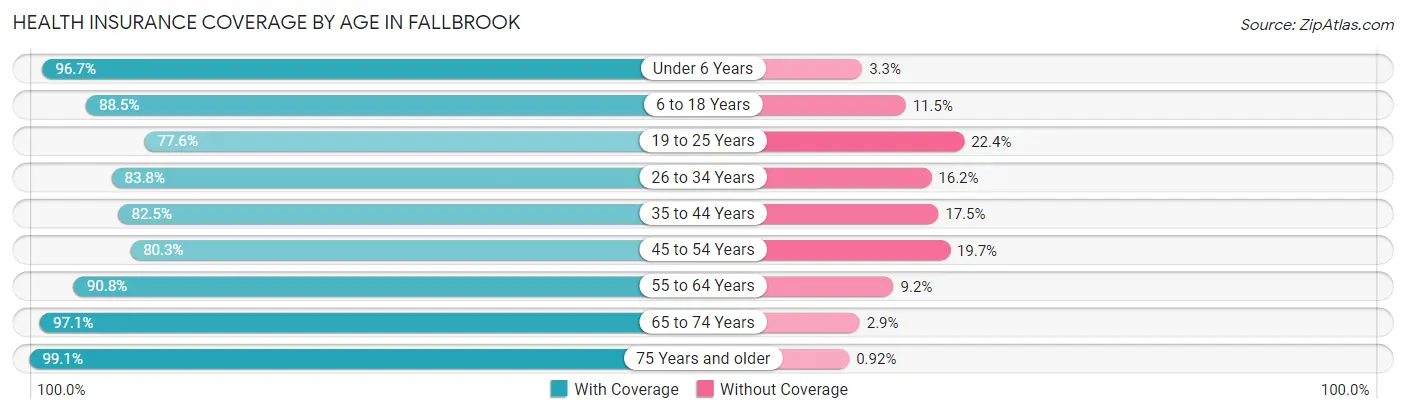
| Age Bracket | With Coverage | Without Coverage |
| Under 6 Years | 3,269 (96.7%) | 113 (3.3%) |
| 6 to 18 Years | 5,206 (88.5%) | 674 (11.5%) |
| 19 to 25 Years | 2,748 (77.6%) | 792 (22.4%) |
| 26 to 34 Years | 3,665 (83.8%) | 710 (16.2%) |
| 35 to 44 Years | 2,107 (82.5%) | 448 (17.5%) |
| 45 to 54 Years | 3,066 (80.3%) | 752 (19.7%) |
| 55 to 64 Years | 3,502 (90.8%) | 355 (9.2%) |
| 65 to 74 Years | 3,159 (97.1%) | 94 (2.9%) |
| 75 Years and older | 2,156 (99.1%) | 20 (0.9%) |
| Total | 28,878 (87.9%) | 3,958 (12.0%) |
Health Insurance Coverage by Citizenship Status in Fallbrook
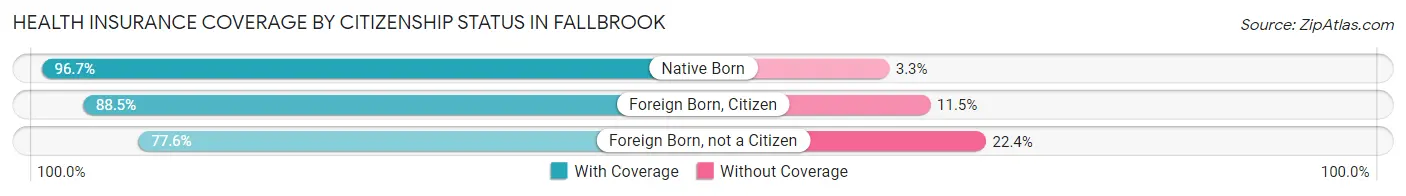
| Citizenship Status | With Coverage | Without Coverage |
| Native Born | 3,269 (96.7%) | 113 (3.3%) |
| Foreign Born, Citizen | 5,206 (88.5%) | 674 (11.5%) |
| Foreign Born, not a Citizen | 2,748 (77.6%) | 792 (22.4%) |
Health Insurance Coverage by Household Income in Fallbrook
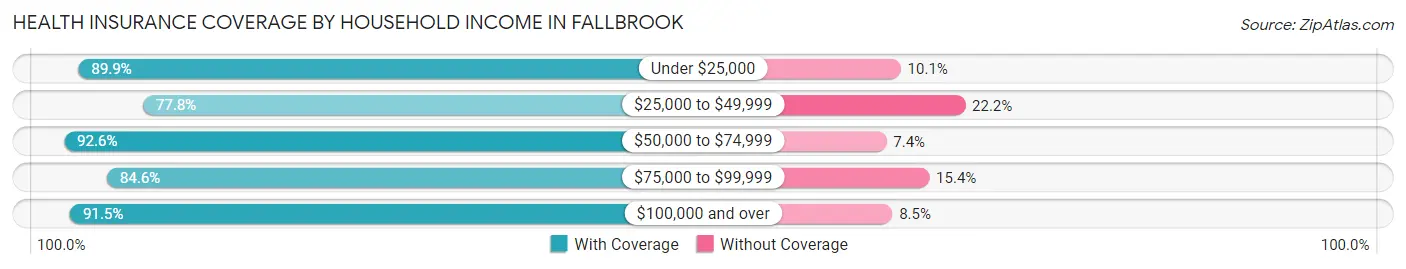
| Household Income | With Coverage | Without Coverage |
| Under $25,000 | 2,130 (89.9%) | 239 (10.1%) |
| $25,000 to $49,999 | 5,121 (77.8%) | 1,459 (22.2%) |
| $50,000 to $74,999 | 4,511 (92.6%) | 361 (7.4%) |
| $75,000 to $99,999 | 3,508 (84.6%) | 640 (15.4%) |
| $100,000 and over | 13,443 (91.5%) | 1,251 (8.5%) |
Public vs Private Health Insurance Coverage by Age in Fallbrook
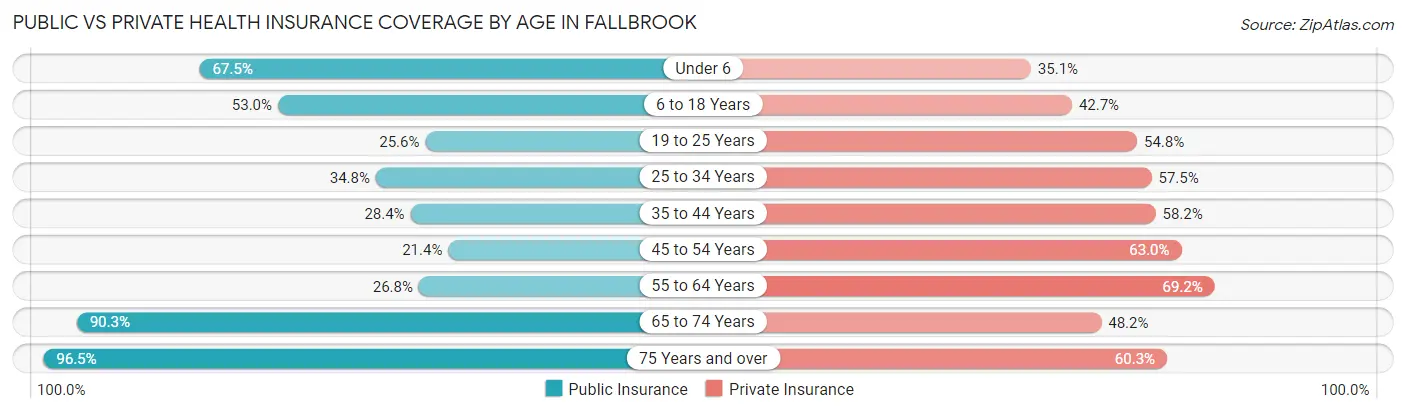
| Age Bracket | Public Insurance | Private Insurance |
| Under 6 | 2,284 (67.5%) | 1,187 (35.1%) |
| 6 to 18 Years | 3,116 (53.0%) | 2,512 (42.7%) |
| 19 to 25 Years | 907 (25.6%) | 1,940 (54.8%) |
| 25 to 34 Years | 1,523 (34.8%) | 2,515 (57.5%) |
| 35 to 44 Years | 725 (28.4%) | 1,488 (58.2%) |
| 45 to 54 Years | 816 (21.4%) | 2,406 (63.0%) |
| 55 to 64 Years | 1,035 (26.8%) | 2,669 (69.2%) |
| 65 to 74 Years | 2,938 (90.3%) | 1,567 (48.2%) |
| 75 Years and over | 2,100 (96.5%) | 1,313 (60.3%) |
| Total | 15,444 (47.0%) | 17,597 (53.6%) |
Disability Status by Sex by Age in Fallbrook
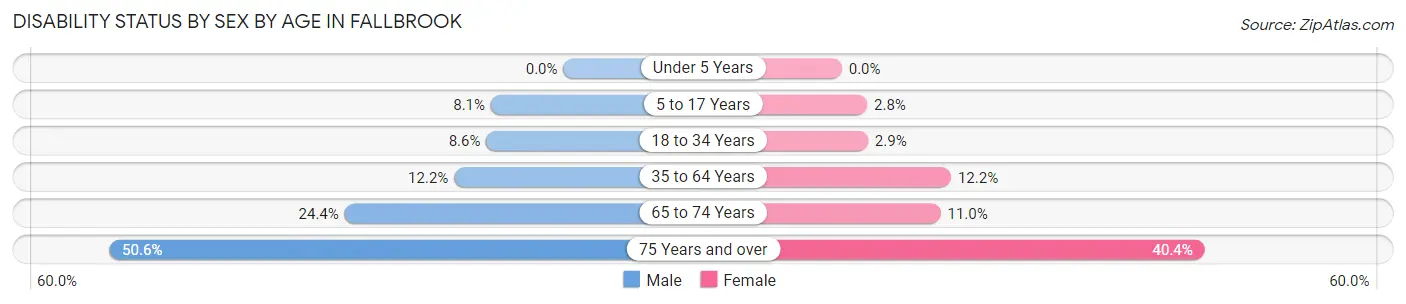
| Age Bracket | Male | Female |
| Under 5 Years | 0 (0.0%) | 0 (0.0%) |
| 5 to 17 Years | 284 (8.1%) | 70 (2.8%) |
| 18 to 34 Years | 322 (8.6%) | 135 (2.9%) |
| 35 to 64 Years | 628 (12.2%) | 616 (12.2%) |
| 65 to 74 Years | 436 (24.4%) | 161 (11.0%) |
| 75 Years and over | 437 (50.6%) | 530 (40.4%) |
Disability Class by Sex by Age in Fallbrook
Disability Class: Hearing Difficulty
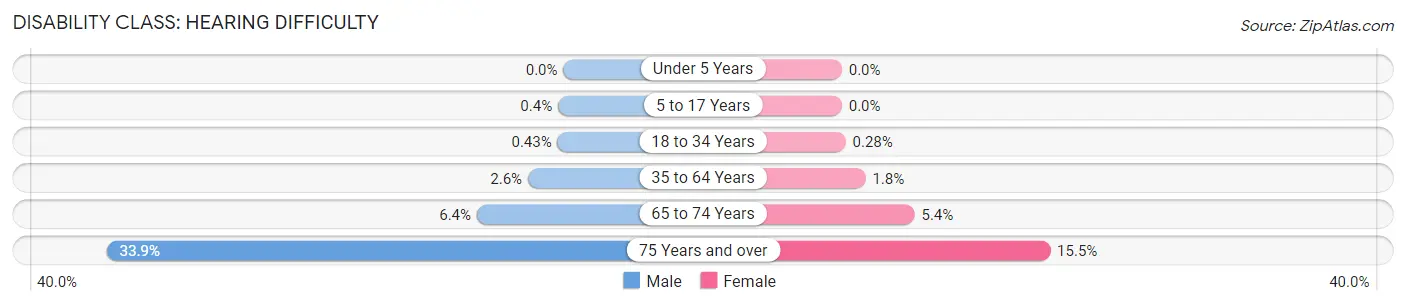
| Age Bracket | Male | Female |
| Under 5 Years | 0 (0.0%) | 0 (0.0%) |
| 5 to 17 Years | 14 (0.4%) | 0 (0.0%) |
| 18 to 34 Years | 16 (0.4%) | 13 (0.3%) |
| 35 to 64 Years | 136 (2.6%) | 89 (1.8%) |
| 65 to 74 Years | 115 (6.4%) | 79 (5.4%) |
| 75 Years and over | 293 (33.9%) | 203 (15.5%) |
Disability Class: Vision Difficulty
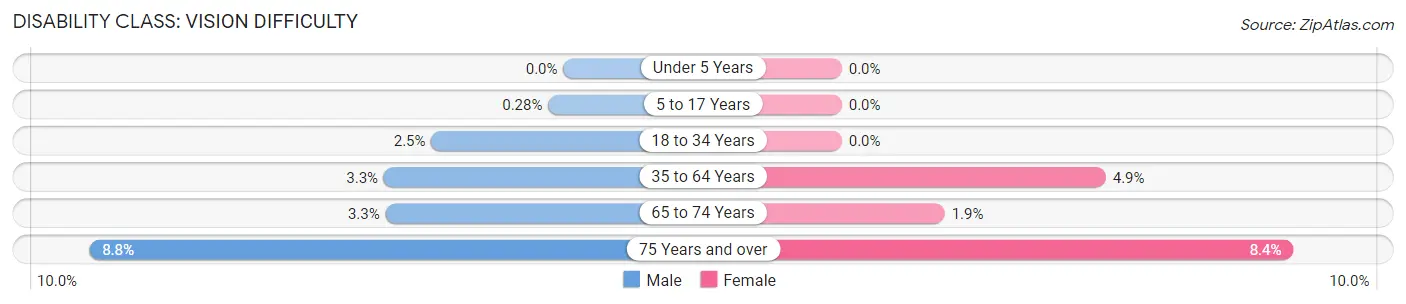
| Age Bracket | Male | Female |
| Under 5 Years | 0 (0.0%) | 0 (0.0%) |
| 5 to 17 Years | 10 (0.3%) | 0 (0.0%) |
| 18 to 34 Years | 92 (2.5%) | 0 (0.0%) |
| 35 to 64 Years | 172 (3.3%) | 248 (4.9%) |
| 65 to 74 Years | 59 (3.3%) | 28 (1.9%) |
| 75 Years and over | 76 (8.8%) | 110 (8.4%) |
Disability Class: Cognitive Difficulty
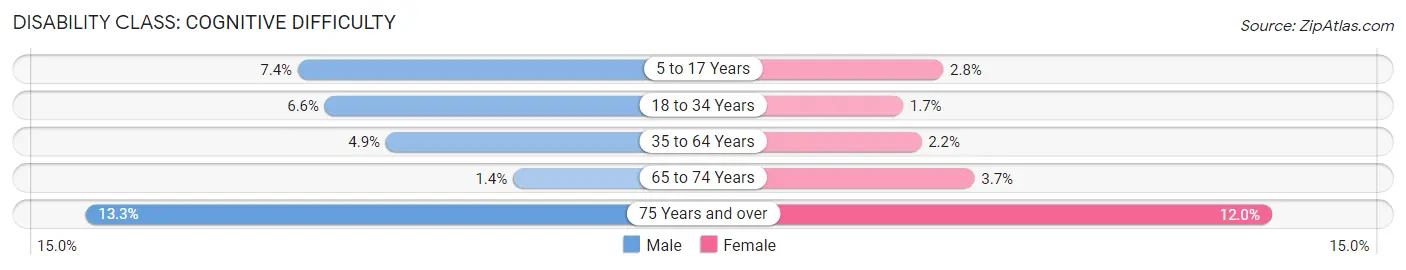
| Age Bracket | Male | Female |
| 5 to 17 Years | 260 (7.4%) | 70 (2.8%) |
| 18 to 34 Years | 249 (6.6%) | 79 (1.7%) |
| 35 to 64 Years | 255 (4.9%) | 112 (2.2%) |
| 65 to 74 Years | 25 (1.4%) | 54 (3.7%) |
| 75 Years and over | 115 (13.3%) | 157 (12.0%) |
Disability Class: Ambulatory Difficulty
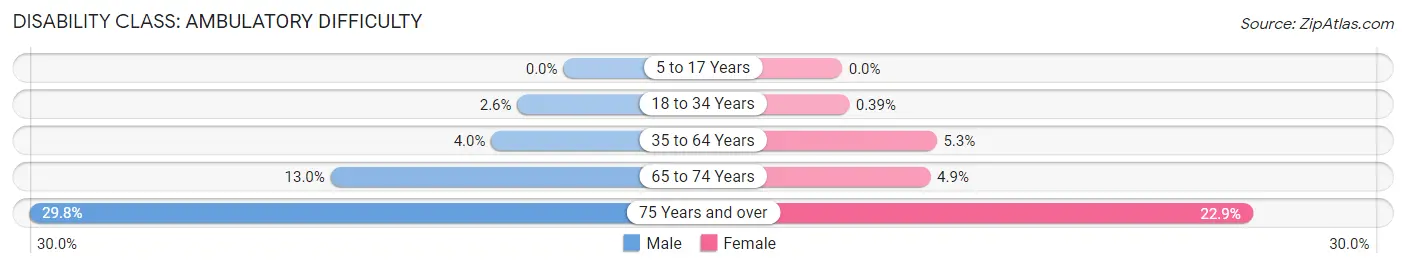
| Age Bracket | Male | Female |
| 5 to 17 Years | 0 (0.0%) | 0 (0.0%) |
| 18 to 34 Years | 96 (2.6%) | 18 (0.4%) |
| 35 to 64 Years | 207 (4.0%) | 267 (5.3%) |
| 65 to 74 Years | 232 (13.0%) | 72 (4.9%) |
| 75 Years and over | 257 (29.7%) | 300 (22.9%) |
Disability Class: Self-Care Difficulty
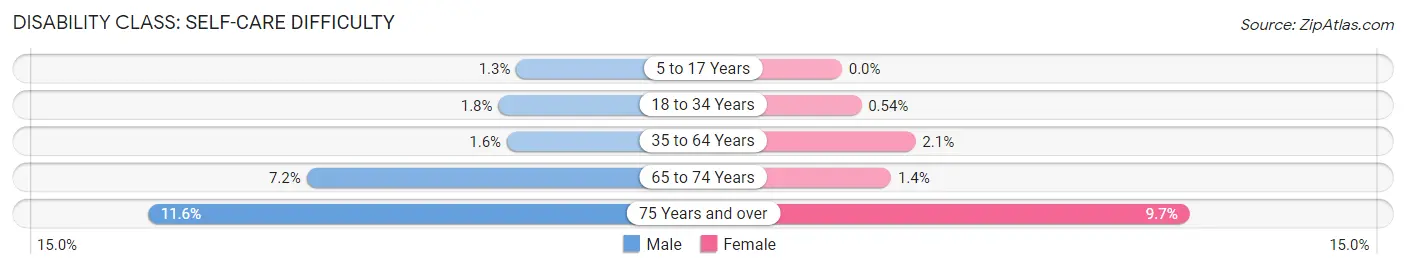
| Age Bracket | Male | Female |
| 5 to 17 Years | 46 (1.3%) | 0 (0.0%) |
| 18 to 34 Years | 68 (1.8%) | 25 (0.5%) |
| 35 to 64 Years | 81 (1.6%) | 104 (2.1%) |
| 65 to 74 Years | 128 (7.1%) | 20 (1.4%) |
| 75 Years and over | 100 (11.6%) | 127 (9.7%) |
Technology Access in Fallbrook
Computing Device Access in Fallbrook
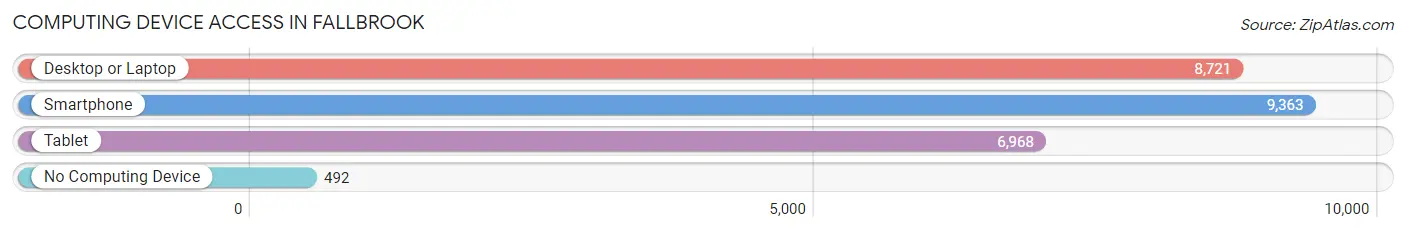
| Device Type | # Households | % Households |
| Desktop or Laptop | 8,721 | 84.4% |
| Smartphone | 9,363 | 90.6% |
| Tablet | 6,968 | 67.4% |
| No Computing Device | 492 | 4.8% |
| Total | 10,334 | 100.0% |
Internet Access in Fallbrook
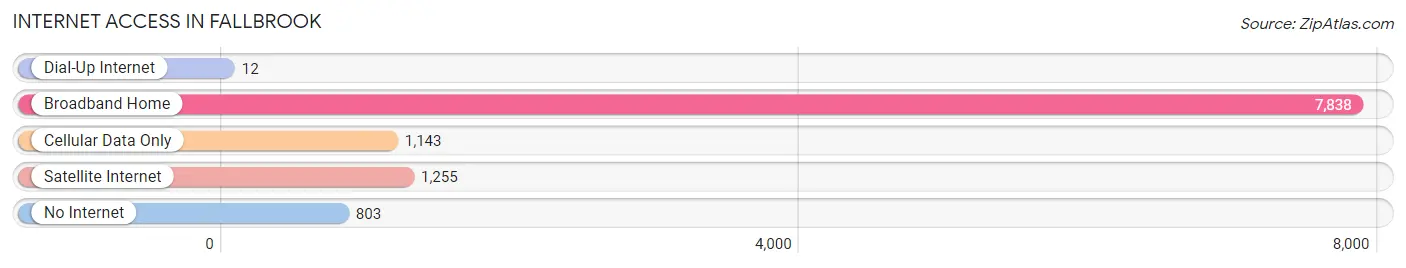
| Internet Type | # Households | % Households |
| Dial-Up Internet | 12 | 0.1% |
| Broadband Home | 7,838 | 75.8% |
| Cellular Data Only | 1,143 | 11.1% |
| Satellite Internet | 1,255 | 12.1% |
| No Internet | 803 | 7.8% |
| Total | 10,334 | 100.0% |
Fallbrook Summary
Fallbrook, California is a small town located in San Diego County, California. It is situated in the foothills of the Santa Margarita Mountains, about 30 miles north of San Diego. The town is known for its rural atmosphere and its agricultural production, which includes avocados, citrus fruits, and flowers. Fallbrook has a population of approximately 30,000 people and is part of the San Diego-Carlsbad metropolitan area.
Geography
Fallbrook is located in the northern part of San Diego County, about 30 miles north of San Diego. It is situated in the foothills of the Santa Margarita Mountains, which are part of the Peninsular Ranges. The town is bordered by the cities of Bonsall to the north, Rainbow to the east, and Oceanside to the south. The town is located in a semi-arid climate zone, with hot summers and mild winters. The average annual precipitation is about 15 inches.
Economy
Fallbrook’s economy is largely based on agriculture. The town is known for its production of avocados, citrus fruits, and flowers. Other industries in the area include manufacturing, retail, and tourism. The town is home to several wineries, as well as a number of small businesses.
Demographics
As of the 2010 census, Fallbrook had a population of 30,534 people. The racial makeup of the town was 75.3% White, 1.3% African American, 0.7% Native American, 1.2% Asian, 0.2% Pacific Islander, 17.7% from other races, and 3.7% from two or more races. Hispanic or Latino of any race were 33.2% of the population.
The median household income in Fallbrook was $60,945 in 2018. The median age of the population was 42.7 years. The town has a higher percentage of married couples than the national average, and a lower percentage of single-parent households.
History
Fallbrook was founded in 1869 by a group of settlers from San Diego. The town was originally called “Fall Brook” after a nearby stream. The town was incorporated in 1885 and was named after the stream. The town grew rapidly in the late 19th and early 20th centuries, due to its agricultural production and its proximity to San Diego. In the 1950s, the town began to experience a population boom, as many people moved to the area from other parts of California.
Today, Fallbrook is a small town with a rural atmosphere. It is known for its agricultural production and its wineries. The town is also home to a number of small businesses and is a popular tourist destination.
Common Questions
What is Per Capita Income in Fallbrook?
Per Capita income in Fallbrook is $33,073.
What is the Median Family Income in Fallbrook?
Median Family Income in Fallbrook is $87,927.
What is the Median Household income in Fallbrook?
Median Household Income in Fallbrook is $78,479.
What is Income or Wage Gap in Fallbrook?
Income or Wage Gap in Fallbrook is 27.1%.
Women in Fallbrook earn 72.9 cents for every dollar earned by a man.
What is Family Income Deficit in Fallbrook?
Family Income Deficit in Fallbrook is $9,907.
Families that are below poverty line in Fallbrook earn $9,907 less on average than the poverty threshold level.
What is Inequality or Gini Index in Fallbrook?
Inequality or Gini Index in Fallbrook is 0.43.
What is the Total Population of Fallbrook?
Total Population of Fallbrook is 33,710.
What is the Total Male Population of Fallbrook?
Total Male Population of Fallbrook is 16,960.
What is the Total Female Population of Fallbrook?
Total Female Population of Fallbrook is 16,750.
What is the Ratio of Males per 100 Females in Fallbrook?
There are 101.25 Males per 100 Females in Fallbrook.
What is the Ratio of Females per 100 Males in Fallbrook?
There are 98.76 Females per 100 Males in Fallbrook.
What is the Median Population Age in Fallbrook?
Median Population Age in Fallbrook is 33.9 Years.
What is the Average Family Size in Fallbrook
Average Family Size in Fallbrook is 3.6 People.
What is the Average Household Size in Fallbrook
Average Household Size in Fallbrook is 3.2 People.
How Large is the Labor Force in Fallbrook?
There are 15,550 People in the Labor Forcein in Fallbrook.
What is the Percentage of People in the Labor Force in Fallbrook?
60.3% of People are in the Labor Force in Fallbrook.
What is the Unemployment Rate in Fallbrook?
Unemployment Rate in Fallbrook is 7.4%.