El Centro, CA Map & Demographics
El Centro Map
El Centro Overview
$22,039
PER CAPITA INCOME
$56,657
AVG FAMILY INCOME
$54,922
AVG HOUSEHOLD INCOME
33.8%
WAGE / INCOME GAP [ % ]
66.2¢/ $1
WAGE / INCOME GAP [ $ ]
$11,235
FAMILY INCOME DEFICIT
0.45
INEQUALITY / GINI INDEX
44,184
TOTAL POPULATION
22,117
MALE POPULATION
22,067
FEMALE POPULATION
100.23
MALES / 100 FEMALES
99.77
FEMALES / 100 MALES
32.2
MEDIAN AGE
4.1
AVG FAMILY SIZE
3.6
AVG HOUSEHOLD SIZE
18,638
LABOR FORCE [ PEOPLE ]
58.0%
PERCENT IN LABOR FORCE
10.2%
UNEMPLOYMENT RATE
El Centro Zip Codes
Income in El Centro
Income Overview in El Centro
Per Capita Income in El Centro is $22,039, while median incomes of families and households are $56,657 and $54,922 respectively.
| Characteristic | Number | Measure |
| Per Capita Income | 44,184 | $22,039 |
| Median Family Income | 9,475 | $56,657 |
| Mean Family Income | 9,475 | $77,314 |
| Median Household Income | 12,225 | $54,922 |
| Mean Household Income | 12,225 | $73,280 |
| Income Deficit | 9,475 | $11,235 |
| Wage / Income Gap (%) | 44,184 | 33.75% |
| Wage / Income Gap ($) | 44,184 | 66.25¢ per $1 |
| Gini / Inequality Index | 44,184 | 0.45 |
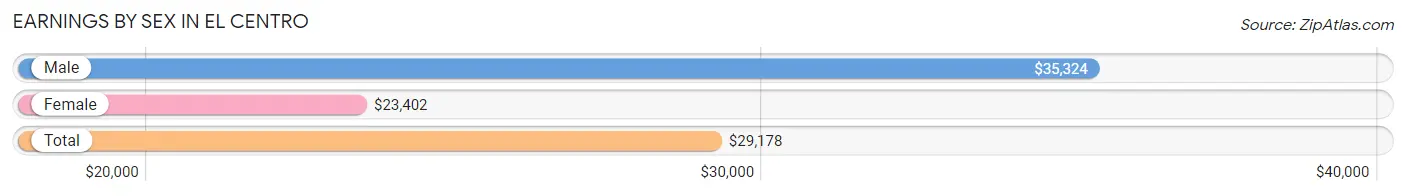
Earnings by Sex in El Centro
Average Earnings in El Centro are $29,178, $35,324 for men and $23,402 for women, a difference of 33.8%.
| Sex | Number | Average Earnings |
| Male | 10,692 (57.5%) | $35,324 |
| Female | 7,915 (42.5%) | $23,402 |
| Total | 18,607 (100.0%) | $29,178 |
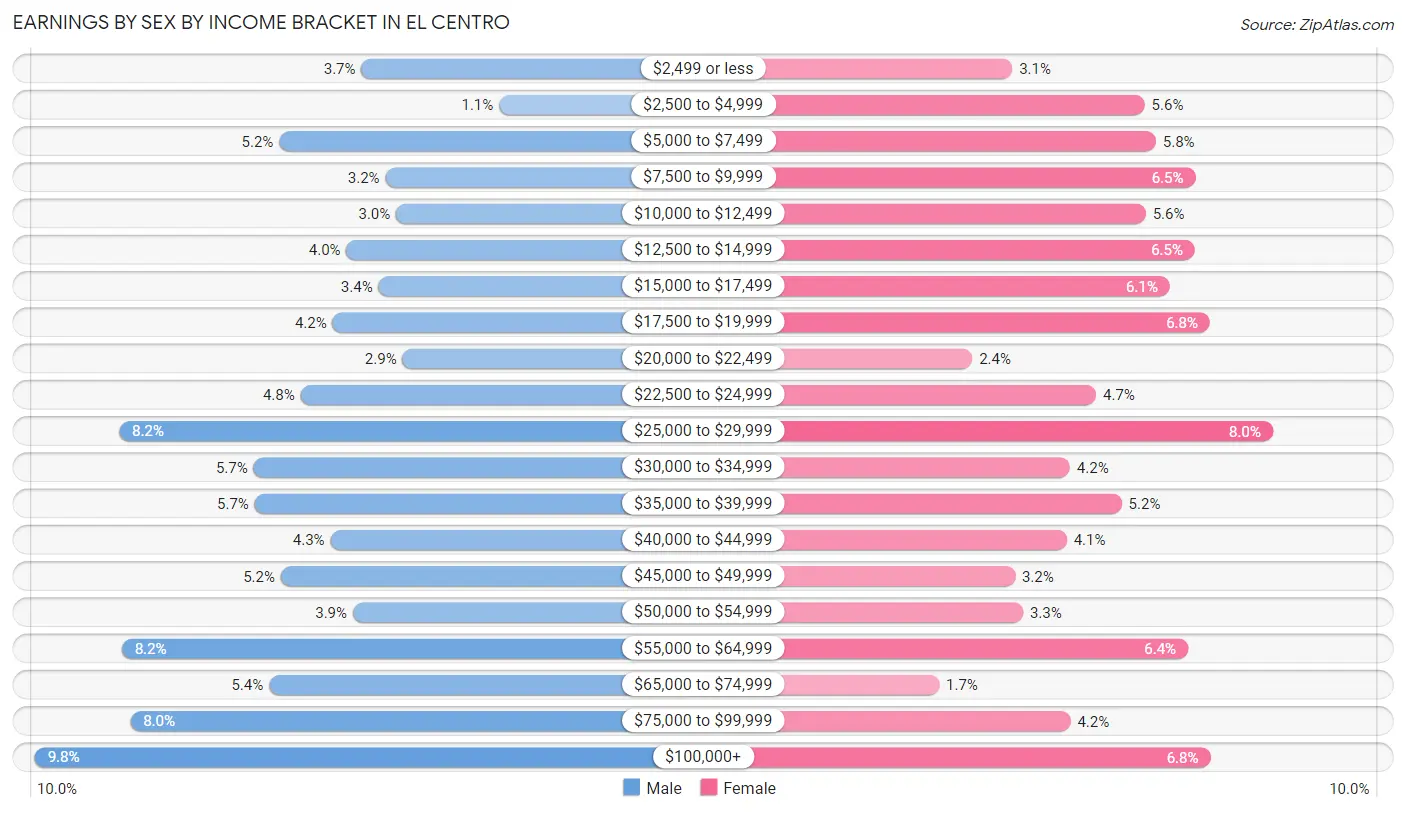
Earnings by Sex by Income Bracket in El Centro
The most common earnings brackets in El Centro are $100,000+ for men (1,049 | 9.8%) and $25,000 to $29,999 for women (632 | 8.0%).
| Income | Male | Female |
| $2,499 or less | 395 (3.7%) | 245 (3.1%) |
| $2,500 to $4,999 | 119 (1.1%) | 442 (5.6%) |
| $5,000 to $7,499 | 559 (5.2%) | 458 (5.8%) |
| $7,500 to $9,999 | 346 (3.2%) | 517 (6.5%) |
| $10,000 to $12,499 | 325 (3.0%) | 443 (5.6%) |
| $12,500 to $14,999 | 425 (4.0%) | 516 (6.5%) |
| $15,000 to $17,499 | 360 (3.4%) | 479 (6.0%) |
| $17,500 to $19,999 | 452 (4.2%) | 538 (6.8%) |
| $20,000 to $22,499 | 312 (2.9%) | 186 (2.4%) |
| $22,500 to $24,999 | 516 (4.8%) | 370 (4.7%) |
| $25,000 to $29,999 | 880 (8.2%) | 632 (8.0%) |
| $30,000 to $34,999 | 610 (5.7%) | 331 (4.2%) |
| $35,000 to $39,999 | 608 (5.7%) | 408 (5.1%) |
| $40,000 to $44,999 | 457 (4.3%) | 326 (4.1%) |
| $45,000 to $49,999 | 556 (5.2%) | 249 (3.2%) |
| $50,000 to $54,999 | 412 (3.8%) | 261 (3.3%) |
| $55,000 to $64,999 | 875 (8.2%) | 506 (6.4%) |
| $65,000 to $74,999 | 579 (5.4%) | 137 (1.7%) |
| $75,000 to $99,999 | 857 (8.0%) | 332 (4.2%) |
| $100,000+ | 1,049 (9.8%) | 539 (6.8%) |
| Total | 10,692 (100.0%) | 7,915 (100.0%) |
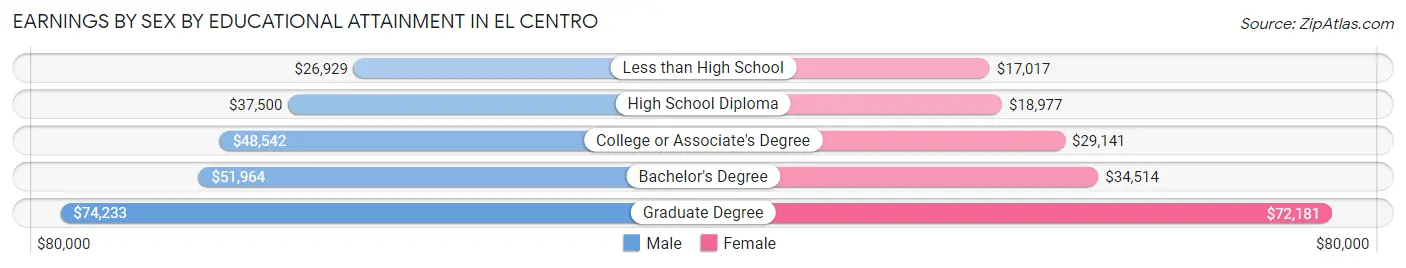
Earnings by Sex by Educational Attainment in El Centro
Average earnings in El Centro are $41,409 for men and $25,719 for women, a difference of 37.9%. Men with an educational attainment of graduate degree enjoy the highest average annual earnings of $74,233, while those with less than high school education earn the least with $26,929. Women with an educational attainment of graduate degree earn the most with the average annual earnings of $72,181, while those with less than high school education have the smallest earnings of $17,017.
| Educational Attainment | Male Income | Female Income |
| Less than High School | $26,929 | $17,017 |
| High School Diploma | $37,500 | $18,977 |
| College or Associate's Degree | $48,542 | $29,141 |
| Bachelor's Degree | $51,964 | $34,514 |
| Graduate Degree | $74,233 | $72,181 |
| Total | $41,409 | $25,719 |
Family Income in El Centro
Family Income Brackets in El Centro
According to the El Centro family income data, there are 1,630 families falling into the $100,000 to $149,999 income range, which is the most common income bracket and makes up 17.2% of all families. Conversely, the $10,000 to $14,999 income bracket is the least frequent group with only 332 families (3.5%) belonging to this category.
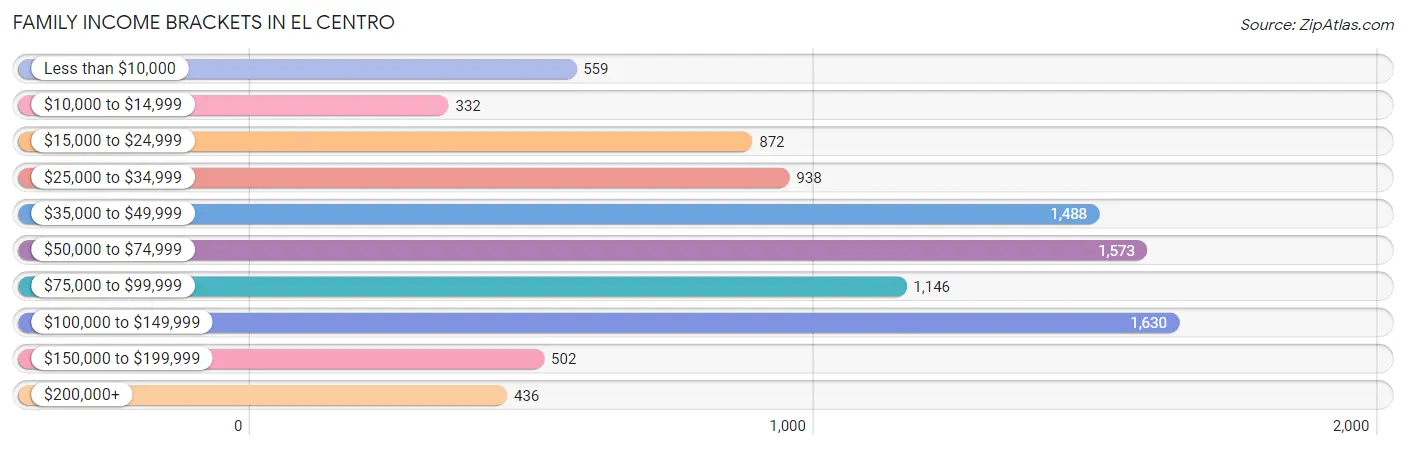
| Income Bracket | # Families | % Families |
| Less than $10,000 | 559 | 5.9% |
| $10,000 to $14,999 | 332 | 3.5% |
| $15,000 to $24,999 | 872 | 9.2% |
| $25,000 to $34,999 | 938 | 9.9% |
| $35,000 to $49,999 | 1,488 | 15.7% |
| $50,000 to $74,999 | 1,573 | 16.6% |
| $75,000 to $99,999 | 1,146 | 12.1% |
| $100,000 to $149,999 | 1,630 | 17.2% |
| $150,000 to $199,999 | 502 | 5.3% |
| $200,000+ | 436 | 4.6% |
Family Income by Famaliy Size in El Centro
7+ person families (269 | 2.8%) account for the highest median family income in El Centro with $105,893 per family, while 2-person families (3,256 | 34.4%) have the highest median income of $26,158 per family member.
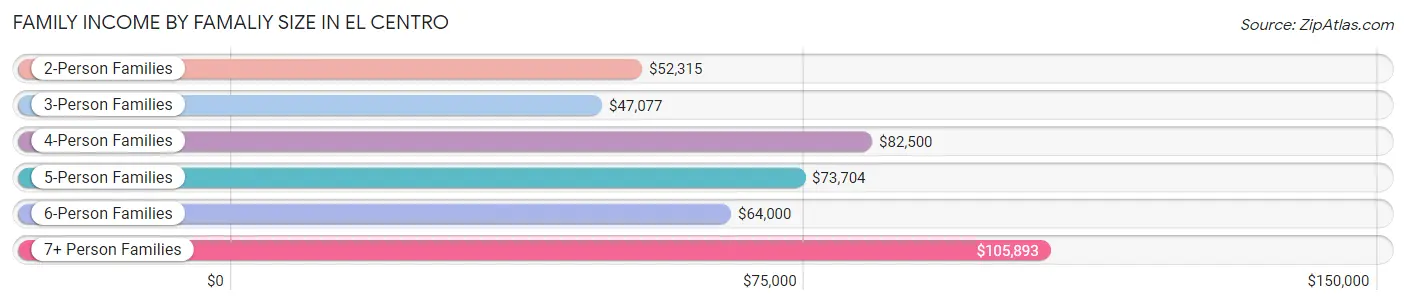
| Income Bracket | # Families | Median Income |
| 2-Person Families | 3,256 (34.4%) | $52,315 |
| 3-Person Families | 2,350 (24.8%) | $47,077 |
| 4-Person Families | 2,038 (21.5%) | $82,500 |
| 5-Person Families | 1,156 (12.2%) | $73,704 |
| 6-Person Families | 406 (4.3%) | $64,000 |
| 7+ Person Families | 269 (2.8%) | $105,893 |
| Total | 9,475 (100.0%) | $56,657 |
Family Income by Number of Earners in El Centro
The median family income in El Centro is $56,657, with families comprising 3+ earners (1,031) having the highest median family income of $106,250, while families with no earners (1,440) have the lowest median family income of $21,250, accounting for 10.9% and 15.2% of families, respectively.
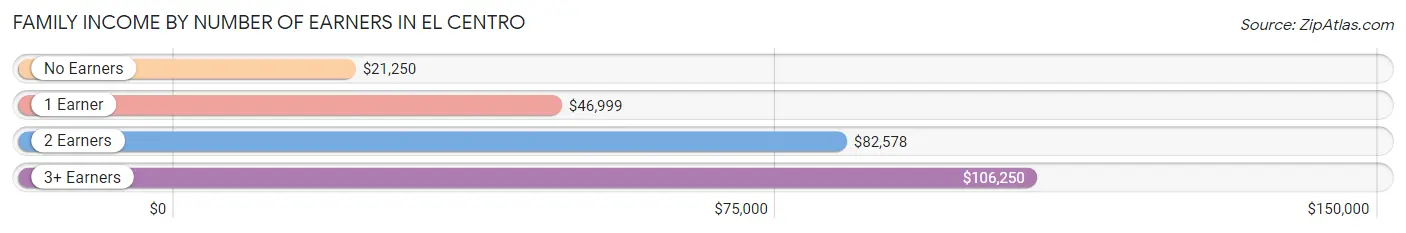
| Number of Earners | # Families | Median Income |
| No Earners | 1,440 (15.2%) | $21,250 |
| 1 Earner | 3,493 (36.9%) | $46,999 |
| 2 Earners | 3,511 (37.1%) | $82,578 |
| 3+ Earners | 1,031 (10.9%) | $106,250 |
| Total | 9,475 (100.0%) | $56,657 |
Household Income in El Centro
Household Income Brackets in El Centro
With 2,017 households falling in the category, the $50,000 to $74,999 income range is the most frequent in El Centro, accounting for 16.5% of all households. In contrast, only 550 households (4.5%) fall into the $150,000 to $199,999 income bracket, making it the least populous group.
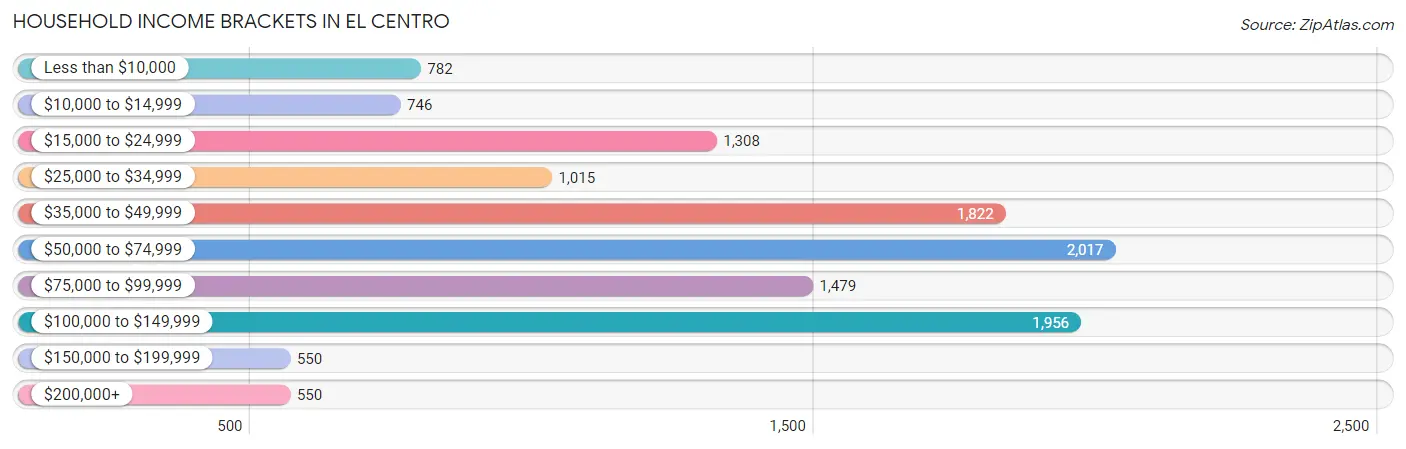
| Income Bracket | # Households | % Households |
| Less than $10,000 | 782 | 6.4% |
| $10,000 to $14,999 | 746 | 6.1% |
| $15,000 to $24,999 | 1,308 | 10.7% |
| $25,000 to $34,999 | 1,015 | 8.3% |
| $35,000 to $49,999 | 1,822 | 14.9% |
| $50,000 to $74,999 | 2,017 | 16.5% |
| $75,000 to $99,999 | 1,479 | 12.1% |
| $100,000 to $149,999 | 1,956 | 16.0% |
| $150,000 to $199,999 | 550 | 4.5% |
| $200,000+ | 550 | 4.5% |
Household Income by Householder Age in El Centro
The median household income in El Centro is $54,922, with the highest median household income of $64,098 found in the 45 to 64 years age bracket for the primary householder. A total of 4,342 households (35.5%) fall into this category. Meanwhile, the 65+ years age bracket for the primary householder has the lowest median household income of $35,735, with 3,106 households (25.4%) in this group.
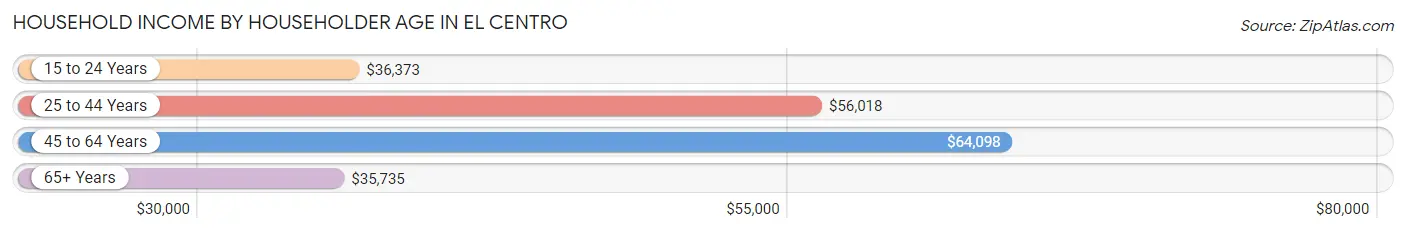
| Income Bracket | # Households | Median Income |
| 15 to 24 Years | 386 (3.2%) | $36,373 |
| 25 to 44 Years | 4,391 (35.9%) | $56,018 |
| 45 to 64 Years | 4,342 (35.5%) | $64,098 |
| 65+ Years | 3,106 (25.4%) | $35,735 |
| Total | 12,225 (100.0%) | $54,922 |
Poverty in El Centro
Income Below Poverty by Sex and Age in El Centro
With 17.4% poverty level for males and 24.9% for females among the residents of El Centro, under 5 year old males and 5 year old females are the most vulnerable to poverty, with 537 males (34.4%) and 233 females (45.4%) in their respective age groups living below the poverty level.
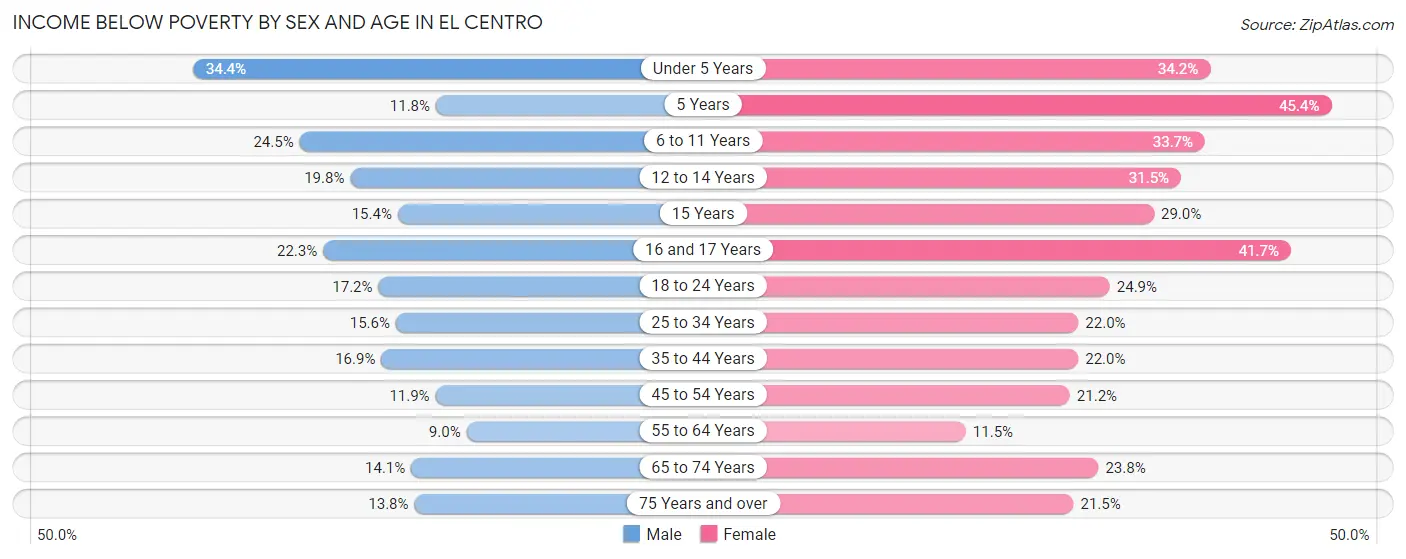
| Age Bracket | Male | Female |
| Under 5 Years | 537 (34.4%) | 456 (34.2%) |
| 5 Years | 22 (11.8%) | 233 (45.4%) |
| 6 to 11 Years | 526 (24.5%) | 845 (33.7%) |
| 12 to 14 Years | 312 (19.8%) | 393 (31.5%) |
| 15 Years | 71 (15.4%) | 122 (29.0%) |
| 16 and 17 Years | 169 (22.3%) | 195 (41.7%) |
| 18 to 24 Years | 408 (17.2%) | 472 (24.9%) |
| 25 to 34 Years | 543 (15.5%) | 572 (22.0%) |
| 35 to 44 Years | 396 (16.9%) | 594 (22.0%) |
| 45 to 54 Years | 286 (11.9%) | 499 (21.2%) |
| 55 to 64 Years | 185 (9.0%) | 267 (11.5%) |
| 65 to 74 Years | 214 (14.1%) | 434 (23.8%) |
| 75 Years and over | 139 (13.8%) | 375 (21.5%) |
| Total | 3,808 (17.4%) | 5,457 (24.9%) |
Income Above Poverty by Sex and Age in El Centro
According to the poverty statistics in El Centro, males aged 55 to 64 years and females aged 55 to 64 years are the age groups that are most secure financially, with 91.0% of males and 88.5% of females in these age groups living above the poverty line.
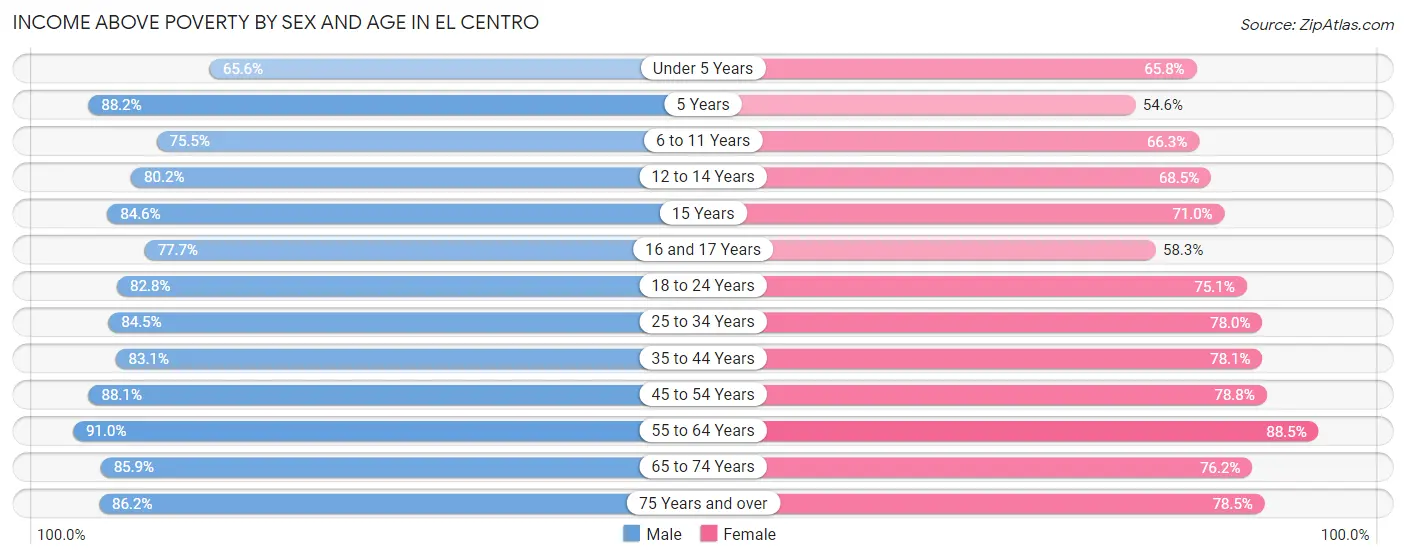
| Age Bracket | Male | Female |
| Under 5 Years | 1,025 (65.6%) | 878 (65.8%) |
| 5 Years | 164 (88.2%) | 280 (54.6%) |
| 6 to 11 Years | 1,622 (75.5%) | 1,663 (66.3%) |
| 12 to 14 Years | 1,265 (80.2%) | 856 (68.5%) |
| 15 Years | 391 (84.6%) | 299 (71.0%) |
| 16 and 17 Years | 589 (77.7%) | 273 (58.3%) |
| 18 to 24 Years | 1,968 (82.8%) | 1,425 (75.1%) |
| 25 to 34 Years | 2,948 (84.5%) | 2,033 (78.0%) |
| 35 to 44 Years | 1,947 (83.1%) | 2,112 (78.0%) |
| 45 to 54 Years | 2,123 (88.1%) | 1,858 (78.8%) |
| 55 to 64 Years | 1,872 (91.0%) | 2,050 (88.5%) |
| 65 to 74 Years | 1,300 (85.9%) | 1,388 (76.2%) |
| 75 Years and over | 866 (86.2%) | 1,368 (78.5%) |
| Total | 18,080 (82.6%) | 16,483 (75.1%) |
Income Below Poverty Among Married-Couple Families in El Centro
The poverty statistics for married-couple families in El Centro show that 11.9% or 723 of the total 6,098 families live below the poverty line. Families with 5 or more children have the highest poverty rate of 88.6%, comprising of 62 families. On the other hand, families with no children have the lowest poverty rate of 8.4%, which includes 245 families.
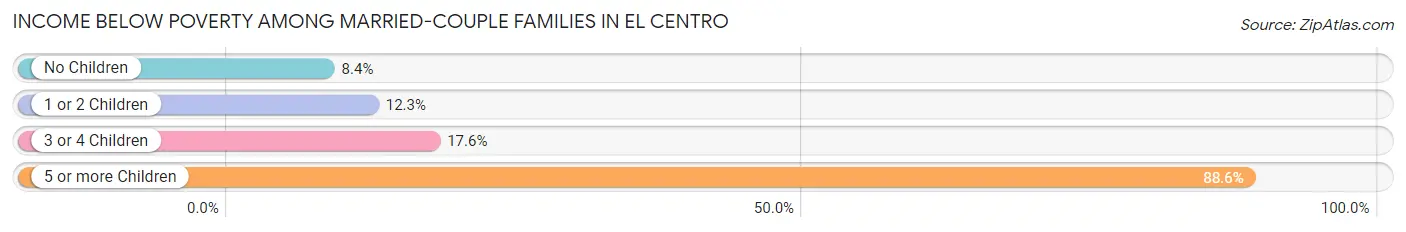
| Children | Above Poverty | Below Poverty |
| No Children | 2,667 (91.6%) | 245 (8.4%) |
| 1 or 2 Children | 2,171 (87.7%) | 303 (12.2%) |
| 3 or 4 Children | 529 (82.4%) | 113 (17.6%) |
| 5 or more Children | 8 (11.4%) | 62 (88.6%) |
| Total | 5,375 (88.1%) | 723 (11.9%) |
Income Below Poverty Among Single-Parent Households in El Centro
According to the poverty data in El Centro, 8.7% or 84 single-father households and 36.6% or 881 single-mother households are living below the poverty line. Among single-father households, those with 1 or 2 children have the highest poverty rate, with 84 households (23.3%) experiencing poverty. Likewise, among single-mother households, those with 5 or more children have the highest poverty rate, with 22 households (100.0%) falling below the poverty line.
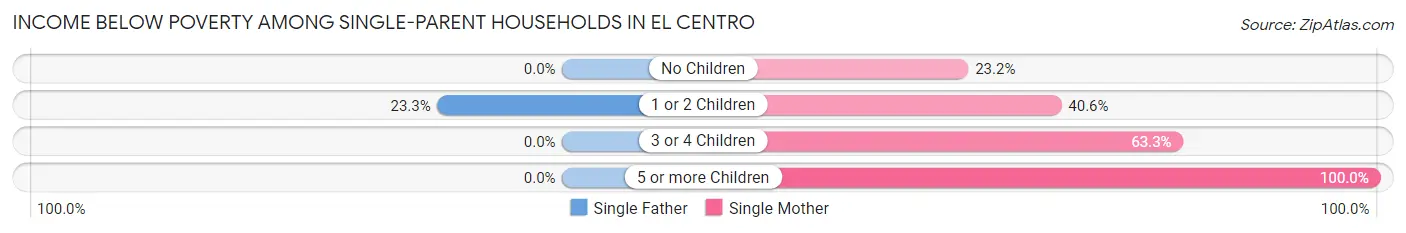
| Children | Single Father | Single Mother |
| No Children | 0 (0.0%) | 200 (23.2%) |
| 1 or 2 Children | 84 (23.3%) | 547 (40.6%) |
| 3 or 4 Children | 0 (0.0%) | 112 (63.3%) |
| 5 or more Children | 0 (0.0%) | 22 (100.0%) |
| Total | 84 (8.7%) | 881 (36.6%) |
Income Below Poverty Among Married-Couple vs Single-Parent Households in El Centro
The poverty data for El Centro shows that 723 of the married-couple family households (11.9%) and 965 of the single-parent households (28.6%) are living below the poverty level. Within the married-couple family households, those with 5 or more children have the highest poverty rate, with 62 households (88.6%) falling below the poverty line. Among the single-parent households, those with 3 or 4 children have the highest poverty rate, with 112 household (56.6%) living below poverty.
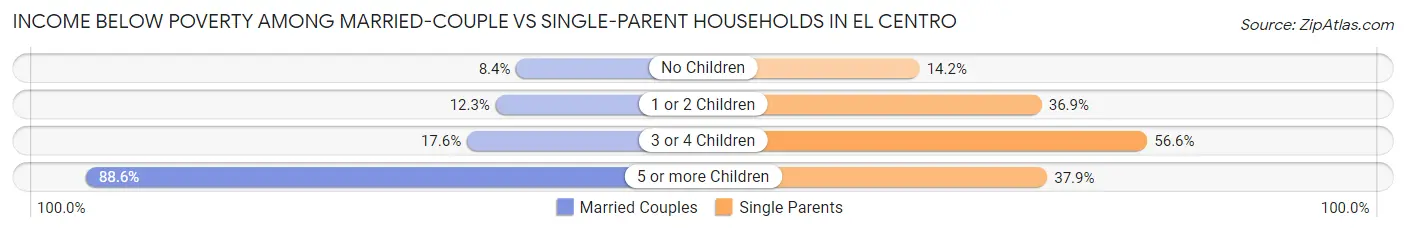
| Children | Married-Couple Families | Single-Parent Households |
| No Children | 245 (8.4%) | 200 (14.2%) |
| 1 or 2 Children | 303 (12.2%) | 631 (36.9%) |
| 3 or 4 Children | 113 (17.6%) | 112 (56.6%) |
| 5 or more Children | 62 (88.6%) | 22 (37.9%) |
| Total | 723 (11.9%) | 965 (28.6%) |
Race in El Centro
The most populous races in El Centro are Hispanic or Latino (38,974 | 88.2%), Some other Race (20,315 | 46.0%), and White / Caucasian (12,000 | 27.2%).
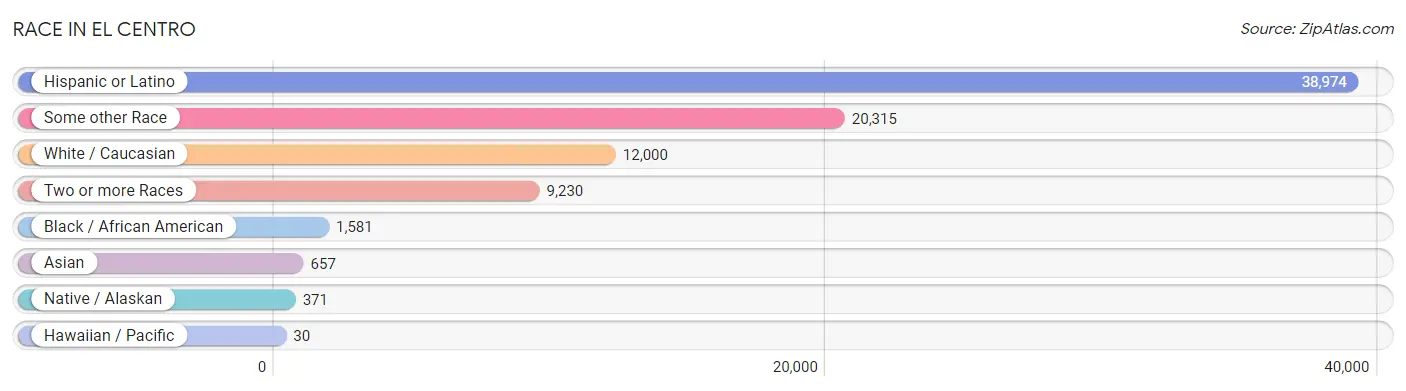
| Race | # Population | % Population |
| Asian | 657 | 1.5% |
| Black / African American | 1,581 | 3.6% |
| Hawaiian / Pacific | 30 | 0.1% |
| Hispanic or Latino | 38,974 | 88.2% |
| Native / Alaskan | 371 | 0.8% |
| White / Caucasian | 12,000 | 27.2% |
| Two or more Races | 9,230 | 20.9% |
| Some other Race | 20,315 | 46.0% |
| Total | 44,184 | 100.0% |
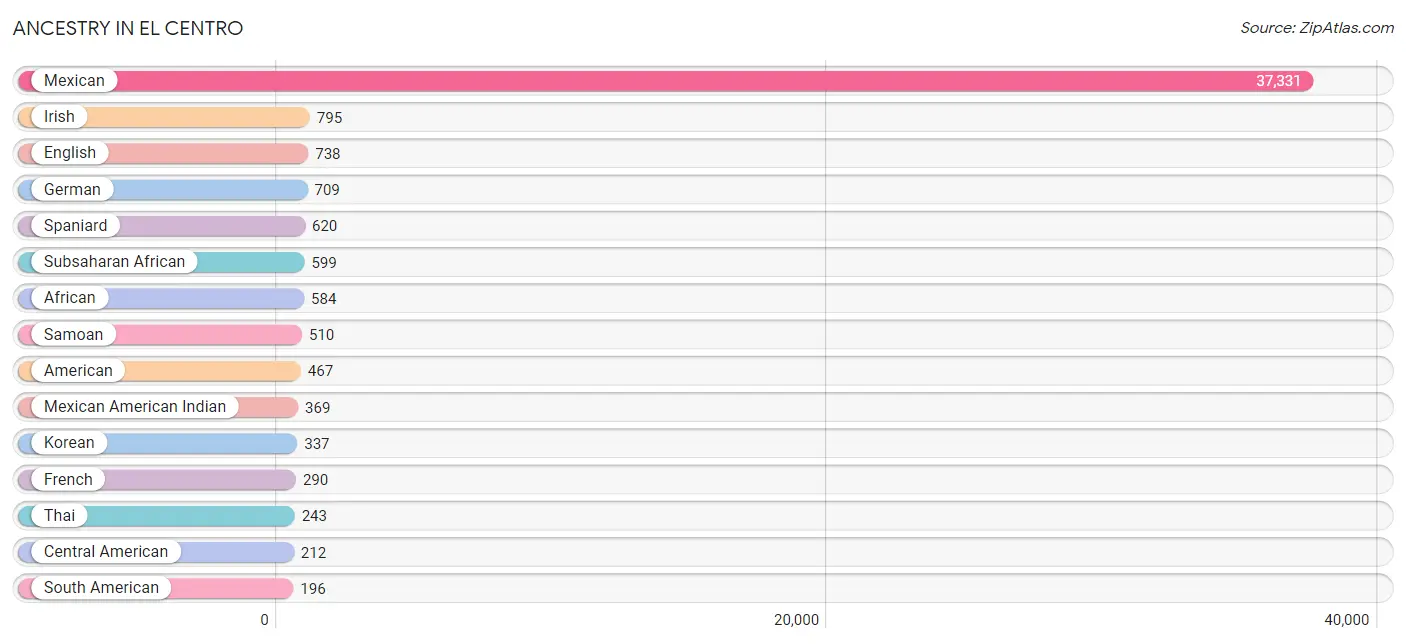
Ancestry in El Centro
The most populous ancestries reported in El Centro are Mexican (37,331 | 84.5%), Irish (795 | 1.8%), English (738 | 1.7%), German (709 | 1.6%), and Spaniard (620 | 1.4%), together accounting for 91.0% of all El Centro residents.
| Ancestry | # Population | % Population |
| African | 584 | 1.3% |
| American | 467 | 1.1% |
| Apache | 5 | 0.0% |
| Arab | 19 | 0.0% |
| Armenian | 4 | 0.0% |
| Austrian | 38 | 0.1% |
| Bangladeshi | 8 | 0.0% |
| Bhutanese | 42 | 0.1% |
| Bolivian | 33 | 0.1% |
| Brazilian | 15 | 0.0% |
| British | 23 | 0.1% |
| Burmese | 140 | 0.3% |
| Cape Verdean | 11 | 0.0% |
| Central American | 212 | 0.5% |
| Cherokee | 18 | 0.0% |
| Colombian | 106 | 0.2% |
| Croatian | 12 | 0.0% |
| Cuban | 19 | 0.0% |
| Czech | 1 | 0.0% |
| Danish | 7 | 0.0% |
| Dominican | 58 | 0.1% |
| Dutch | 17 | 0.0% |
| Dutch West Indian | 12 | 0.0% |
| Egyptian | 5 | 0.0% |
| English | 738 | 1.7% |
| Ethiopian | 4 | 0.0% |
| European | 72 | 0.2% |
| Filipino | 48 | 0.1% |
| French | 290 | 0.7% |
| French Canadian | 1 | 0.0% |
| German | 709 | 1.6% |
| Greek | 11 | 0.0% |
| Guamanian / Chamorro | 11 | 0.0% |
| Guatemalan | 87 | 0.2% |
| Honduran | 30 | 0.1% |
| Hungarian | 14 | 0.0% |
| Indian (Asian) | 48 | 0.1% |
| Iranian | 14 | 0.0% |
| Irish | 795 | 1.8% |
| Italian | 84 | 0.2% |
| Jamaican | 135 | 0.3% |
| Japanese | 6 | 0.0% |
| Korean | 337 | 0.8% |
| Lebanese | 14 | 0.0% |
| Malaysian | 11 | 0.0% |
| Mexican | 37,331 | 84.5% |
| Mexican American Indian | 369 | 0.8% |
| Native Hawaiian | 18 | 0.0% |
| Navajo | 10 | 0.0% |
| Nicaraguan | 53 | 0.1% |
| Northern European | 73 | 0.2% |
| Norwegian | 53 | 0.1% |
| Panamanian | 12 | 0.0% |
| Peruvian | 11 | 0.0% |
| Polish | 116 | 0.3% |
| Portuguese | 7 | 0.0% |
| Puerto Rican | 56 | 0.1% |
| Romanian | 10 | 0.0% |
| Russian | 50 | 0.1% |
| Salvadoran | 30 | 0.1% |
| Samoan | 510 | 1.1% |
| Scandinavian | 12 | 0.0% |
| Scotch-Irish | 66 | 0.2% |
| Scottish | 76 | 0.2% |
| South American | 196 | 0.4% |
| Spaniard | 620 | 1.4% |
| Spanish | 87 | 0.2% |
| Subsaharan African | 599 | 1.4% |
| Swedish | 116 | 0.3% |
| Swiss | 92 | 0.2% |
| Thai | 243 | 0.5% |
| Tongan | 1 | 0.0% |
| Ukrainian | 11 | 0.0% |
| Venezuelan | 46 | 0.1% |
| Welsh | 23 | 0.1% |
| Yaqui | 11 | 0.0% | View All 76 Rows |
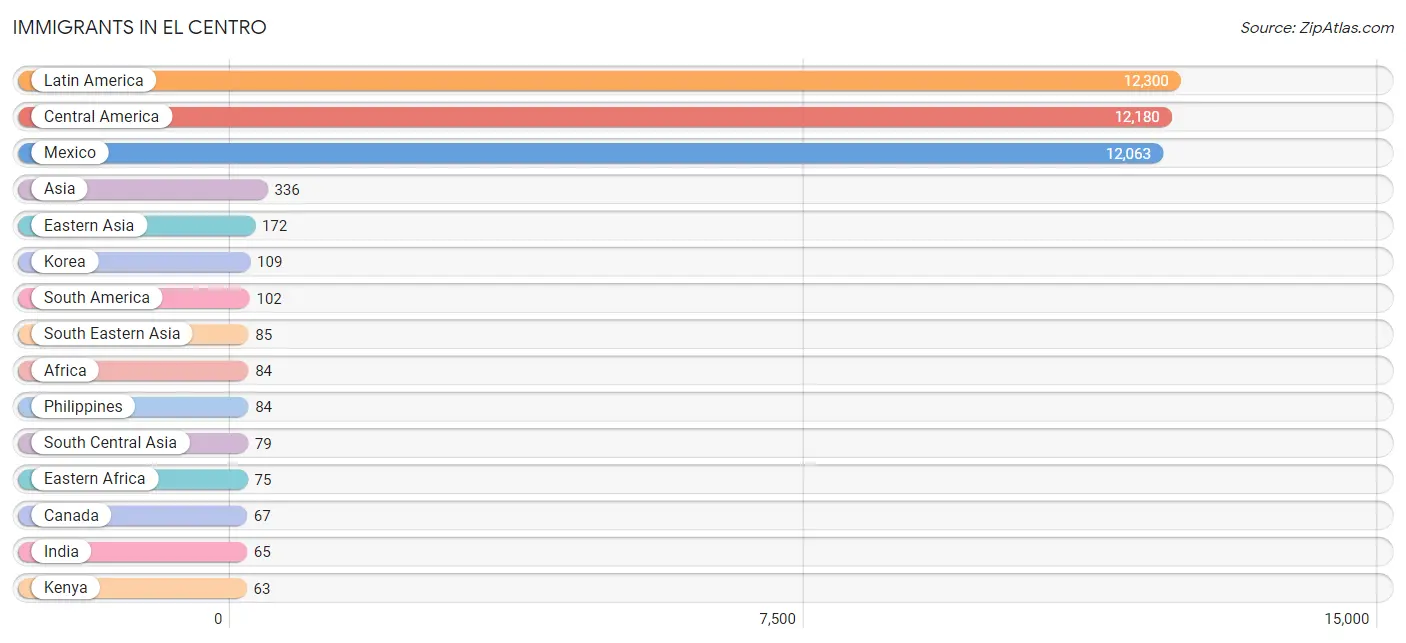
Immigrants in El Centro
The most numerous immigrant groups reported in El Centro came from Latin America (12,300 | 27.8%), Central America (12,180 | 27.6%), Mexico (12,063 | 27.3%), Asia (336 | 0.8%), and Eastern Asia (172 | 0.4%), together accounting for 83.9% of all El Centro residents.
| Immigration Origin | # Population | % Population |
| Africa | 84 | 0.2% |
| Asia | 336 | 0.8% |
| Bolivia | 33 | 0.1% |
| Brazil | 15 | 0.0% |
| Cameroon | 3 | 0.0% |
| Canada | 67 | 0.2% |
| Caribbean | 18 | 0.0% |
| Central America | 12,180 | 27.6% |
| China | 53 | 0.1% |
| Colombia | 25 | 0.1% |
| Cuba | 7 | 0.0% |
| Czechoslovakia | 1 | 0.0% |
| Eastern Africa | 75 | 0.2% |
| Eastern Asia | 172 | 0.4% |
| Eastern Europe | 1 | 0.0% |
| El Salvador | 24 | 0.1% |
| Europe | 31 | 0.1% |
| France | 7 | 0.0% |
| Guatemala | 50 | 0.1% |
| Honduras | 31 | 0.1% |
| India | 65 | 0.2% |
| Iran | 14 | 0.0% |
| Ireland | 23 | 0.1% |
| Japan | 10 | 0.0% |
| Kenya | 63 | 0.1% |
| Korea | 109 | 0.3% |
| Laos | 1 | 0.0% |
| Latin America | 12,300 | 27.8% |
| Mexico | 12,063 | 27.3% |
| Middle Africa | 9 | 0.0% |
| Northern Europe | 23 | 0.1% |
| Panama | 12 | 0.0% |
| Peru | 11 | 0.0% |
| Philippines | 84 | 0.2% |
| South America | 102 | 0.2% |
| South Central Asia | 79 | 0.2% |
| South Eastern Asia | 85 | 0.2% |
| Taiwan | 23 | 0.1% |
| Venezuela | 18 | 0.0% |
| Western Europe | 7 | 0.0% | View All 40 Rows |
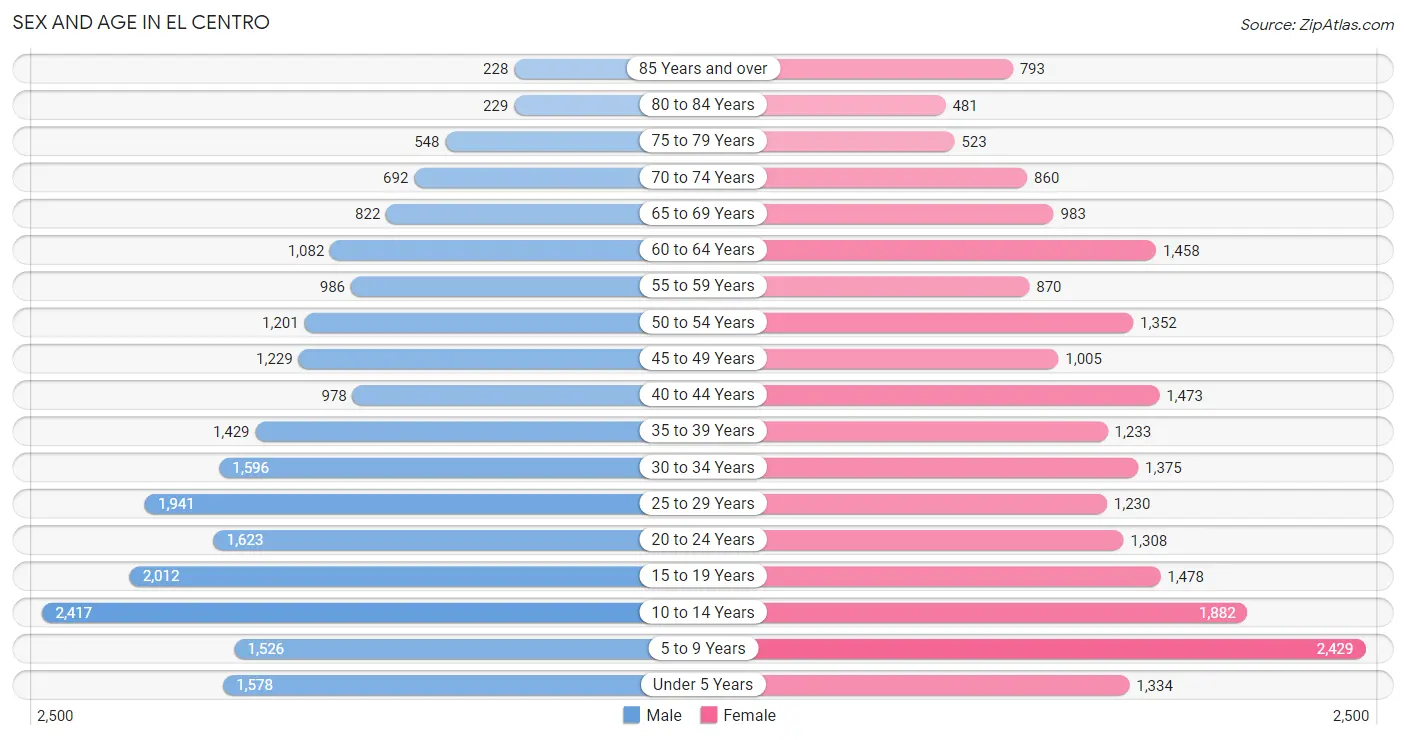
Sex and Age in El Centro
Sex and Age in El Centro
The most populous age groups in El Centro are 10 to 14 Years (2,417 | 10.9%) for men and 5 to 9 Years (2,429 | 11.0%) for women.
| Age Bracket | Male | Female |
| Under 5 Years | 1,578 (7.1%) | 1,334 (6.0%) |
| 5 to 9 Years | 1,526 (6.9%) | 2,429 (11.0%) |
| 10 to 14 Years | 2,417 (10.9%) | 1,882 (8.5%) |
| 15 to 19 Years | 2,012 (9.1%) | 1,478 (6.7%) |
| 20 to 24 Years | 1,623 (7.3%) | 1,308 (5.9%) |
| 25 to 29 Years | 1,941 (8.8%) | 1,230 (5.6%) |
| 30 to 34 Years | 1,596 (7.2%) | 1,375 (6.2%) |
| 35 to 39 Years | 1,429 (6.5%) | 1,233 (5.6%) |
| 40 to 44 Years | 978 (4.4%) | 1,473 (6.7%) |
| 45 to 49 Years | 1,229 (5.6%) | 1,005 (4.5%) |
| 50 to 54 Years | 1,201 (5.4%) | 1,352 (6.1%) |
| 55 to 59 Years | 986 (4.5%) | 870 (3.9%) |
| 60 to 64 Years | 1,082 (4.9%) | 1,458 (6.6%) |
| 65 to 69 Years | 822 (3.7%) | 983 (4.4%) |
| 70 to 74 Years | 692 (3.1%) | 860 (3.9%) |
| 75 to 79 Years | 548 (2.5%) | 523 (2.4%) |
| 80 to 84 Years | 229 (1.0%) | 481 (2.2%) |
| 85 Years and over | 228 (1.0%) | 793 (3.6%) |
| Total | 22,117 (100.0%) | 22,067 (100.0%) |
Families and Households in El Centro
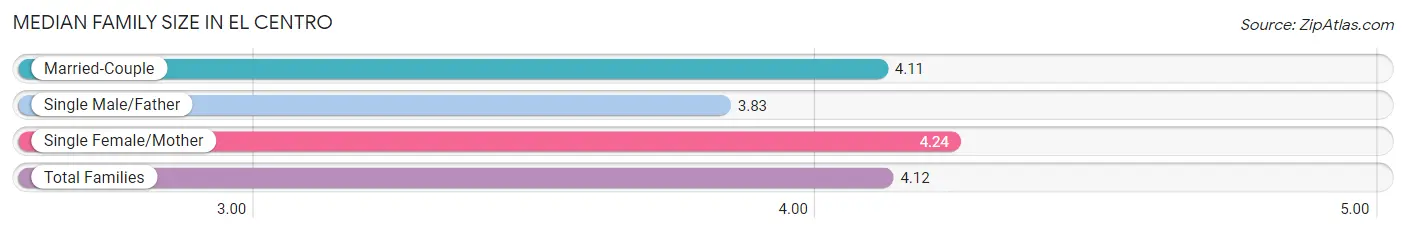
Median Family Size in El Centro
The median family size in El Centro is 4.12 persons per family, with single female/mother families (2,410 | 25.4%) accounting for the largest median family size of 4.24 persons per family. On the other hand, single male/father families (967 | 10.2%) represent the smallest median family size with 3.83 persons per family.
| Family Type | # Families | Family Size |
| Married-Couple | 6,098 (64.4%) | 4.11 |
| Single Male/Father | 967 (10.2%) | 3.83 |
| Single Female/Mother | 2,410 (25.4%) | 4.24 |
| Total Families | 9,475 (100.0%) | 4.12 |
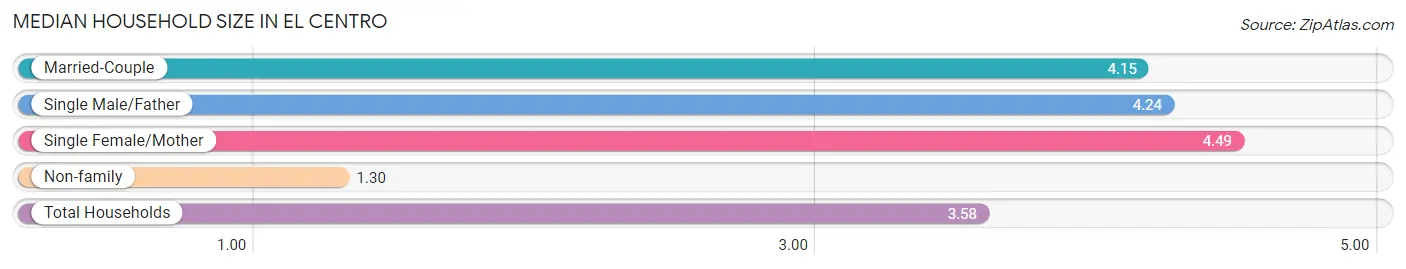
Median Household Size in El Centro
The median household size in El Centro is 3.58 persons per household, with single female/mother households (2,410 | 19.7%) accounting for the largest median household size of 4.49 persons per household. non-family households (2,750 | 22.5%) represent the smallest median household size with 1.30 persons per household.
| Household Type | # Households | Household Size |
| Married-Couple | 6,098 (49.9%) | 4.15 |
| Single Male/Father | 967 (7.9%) | 4.24 |
| Single Female/Mother | 2,410 (19.7%) | 4.49 |
| Non-family | 2,750 (22.5%) | 1.30 |
| Total Households | 12,225 (100.0%) | 3.58 |
Household Size by Marriage Status in El Centro
Out of a total of 12,225 households in El Centro, 9,475 (77.5%) are family households, while 2,750 (22.5%) are nonfamily households. The most numerous type of family households are 2-person households, comprising 3,021, and the most common type of nonfamily households are 1-person households, comprising 2,286.
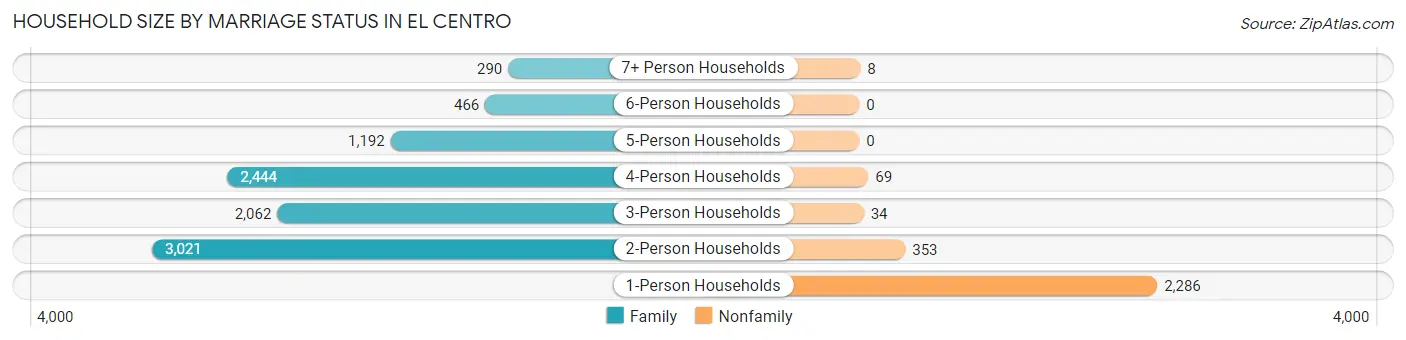
| Household Size | Family Households | Nonfamily Households |
| 1-Person Households | - | 2,286 (18.7%) |
| 2-Person Households | 3,021 (24.7%) | 353 (2.9%) |
| 3-Person Households | 2,062 (16.9%) | 34 (0.3%) |
| 4-Person Households | 2,444 (20.0%) | 69 (0.6%) |
| 5-Person Households | 1,192 (9.8%) | 0 (0.0%) |
| 6-Person Households | 466 (3.8%) | 0 (0.0%) |
| 7+ Person Households | 290 (2.4%) | 8 (0.1%) |
| Total | 9,475 (77.5%) | 2,750 (22.5%) |
Female Fertility in El Centro
Fertility by Age in El Centro
Average fertility rate in El Centro is 48.0 births per 1,000 women. Women in the age bracket of 20 to 34 years have the highest fertility rate with 83.0 births per 1,000 women. Women in the age bracket of 20 to 34 years acount for 73.1% of all women with births.
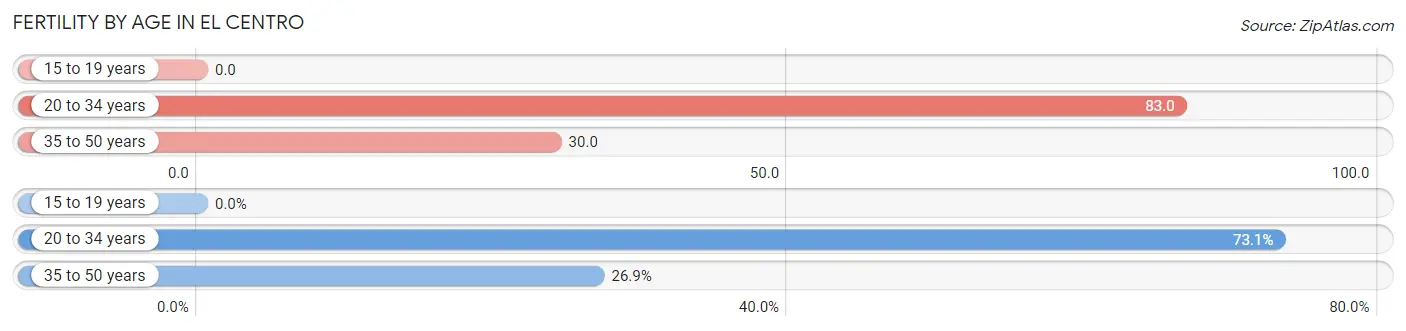
| Age Bracket | Women with Births | Births / 1,000 Women |
| 15 to 19 years | 0 (0.0%) | 0.0 |
| 20 to 34 years | 326 (73.1%) | 83.0 |
| 35 to 50 years | 120 (26.9%) | 30.0 |
| Total | 446 (100.0%) | 48.0 |
Fertility by Age by Marriage Status in El Centro
43.7% of women with births (446) in El Centro are married. The highest percentage of unmarried women with births falls into 20 to 34 years age bracket with 65.0% of them unmarried at the time of birth, while the lowest percentage of unmarried women with births belong to 35 to 50 years age bracket with 32.5% of them unmarried.
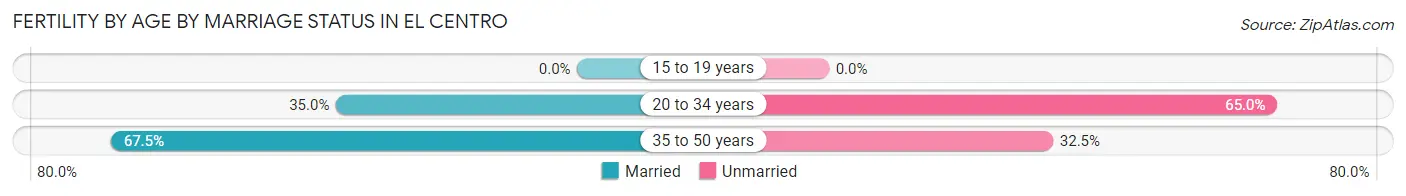
| Age Bracket | Married | Unmarried |
| 15 to 19 years | 0 (0.0%) | 0 (0.0%) |
| 20 to 34 years | 114 (35.0%) | 212 (65.0%) |
| 35 to 50 years | 81 (67.5%) | 39 (32.5%) |
| Total | 195 (43.7%) | 251 (56.3%) |
Fertility by Education in El Centro
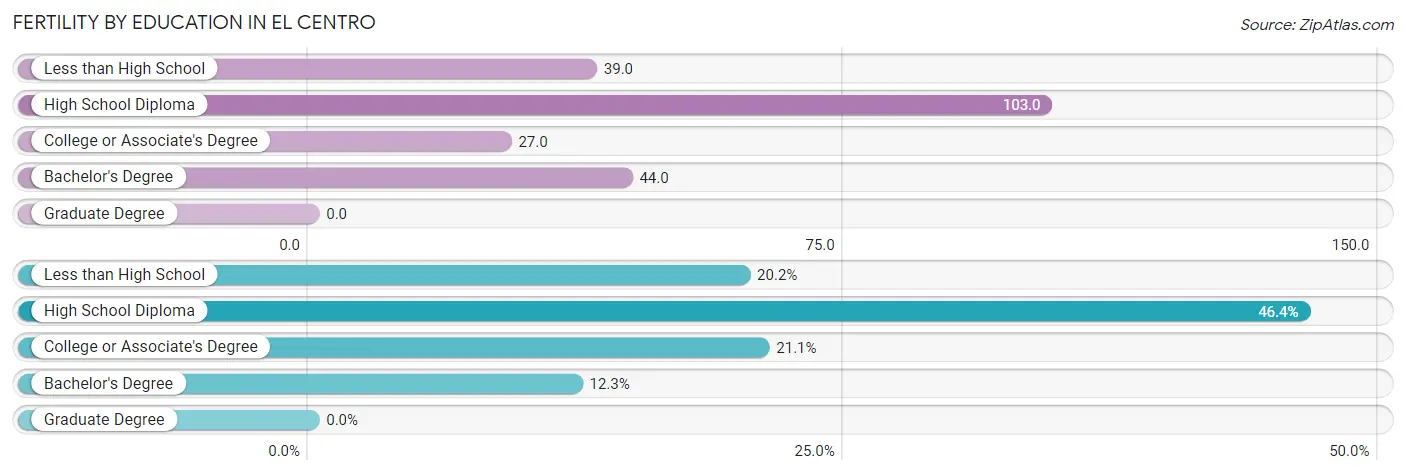
| Educational Attainment | Women with Births | Births / 1,000 Women |
| Less than High School | 90 (20.2%) | 39.0 |
| High School Diploma | 207 (46.4%) | 103.0 |
| College or Associate's Degree | 94 (21.1%) | 27.0 |
| Bachelor's Degree | 55 (12.3%) | 44.0 |
| Graduate Degree | 0 (0.0%) | 0.0 |
| Total | 446 (100.0%) | 48.0 |
Fertility by Education by Marriage Status in El Centro
56.3% of women with births in El Centro are unmarried. Women with the educational attainment of less than high school are most likely to be married with 55.6% of them married at childbirth, while women with the educational attainment of bachelor's degree are least likely to be married with 83.6% of them unmarried at childbirth.
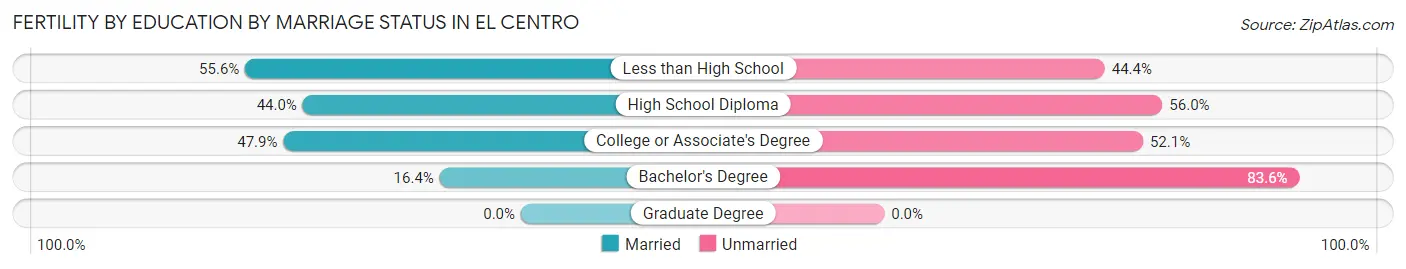
| Educational Attainment | Married | Unmarried |
| Less than High School | 50 (55.6%) | 40 (44.4%) |
| High School Diploma | 91 (44.0%) | 116 (56.0%) |
| College or Associate's Degree | 45 (47.9%) | 49 (52.1%) |
| Bachelor's Degree | 9 (16.4%) | 46 (83.6%) |
| Graduate Degree | 0 (0.0%) | 0 (0.0%) |
| Total | 195 (43.7%) | 251 (56.3%) |
Employment Characteristics in El Centro
Employment by Class of Employer in El Centro
Among the 16,229 employed individuals in El Centro, private company employees (9,568 | 59.0%), local government employees (2,116 | 13.0%), and state government employees (1,268 | 7.8%) make up the most common classes of employment.
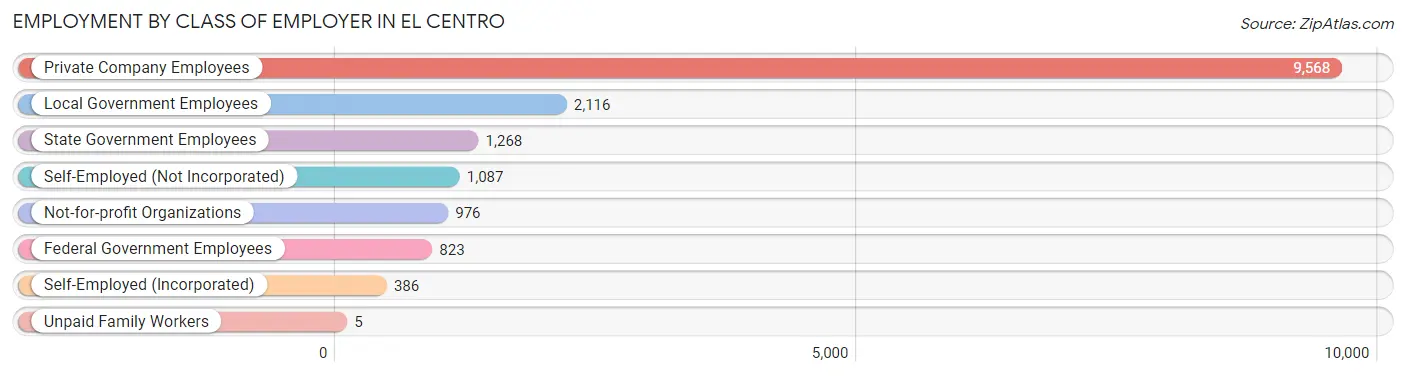
| Employer Class | # Employees | % Employees |
| Private Company Employees | 9,568 | 59.0% |
| Self-Employed (Incorporated) | 386 | 2.4% |
| Self-Employed (Not Incorporated) | 1,087 | 6.7% |
| Not-for-profit Organizations | 976 | 6.0% |
| Local Government Employees | 2,116 | 13.0% |
| State Government Employees | 1,268 | 7.8% |
| Federal Government Employees | 823 | 5.1% |
| Unpaid Family Workers | 5 | 0.0% |
| Total | 16,229 | 100.0% |
Employment Status by Age in El Centro
According to the labor force statistics for El Centro, out of the total population over 16 years of age (32,135), 58.0% or 18,638 individuals are in the labor force, with 10.2% or 1,901 of them unemployed. The age group with the highest labor force participation rate is 30 to 34 years, with 86.5% or 2,570 individuals in the labor force. Within the labor force, the 20 to 24 years age range has the highest percentage of unemployed individuals, with 20.4% or 426 of them being unemployed.
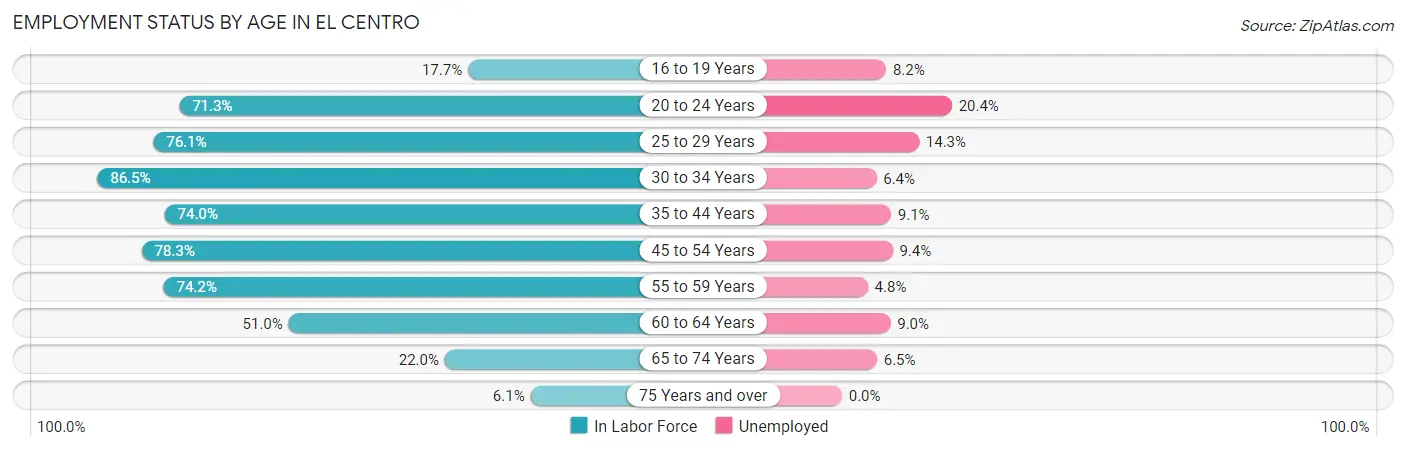
| Age Bracket | In Labor Force | Unemployed |
| 16 to 19 Years | 461 (17.7%) | 38 (8.2%) |
| 20 to 24 Years | 2,090 (71.3%) | 426 (20.4%) |
| 25 to 29 Years | 2,413 (76.1%) | 345 (14.3%) |
| 30 to 34 Years | 2,570 (86.5%) | 164 (6.4%) |
| 35 to 44 Years | 3,784 (74.0%) | 344 (9.1%) |
| 45 to 54 Years | 3,748 (78.3%) | 352 (9.4%) |
| 55 to 59 Years | 1,377 (74.2%) | 66 (4.8%) |
| 60 to 64 Years | 1,295 (51.0%) | 117 (9.0%) |
| 65 to 74 Years | 739 (22.0%) | 48 (6.5%) |
| 75 Years and over | 171 (6.1%) | 0 (0.0%) |
| Total | 18,638 (58.0%) | 1,901 (10.2%) |
Employment Status by Educational Attainment in El Centro
According to labor force statistics for El Centro, 74.3% of individuals (15,185) out of the total population between 25 and 64 years of age (20,438) are in the labor force, with 9.1% or 1,382 of them being unemployed. The group with the highest labor force participation rate are those with the educational attainment of bachelor's degree or higher, with 87.8% or 3,141 individuals in the labor force. Within the labor force, individuals with less than high school education have the highest percentage of unemployment, with 13.4% or 340 of them being unemployed.
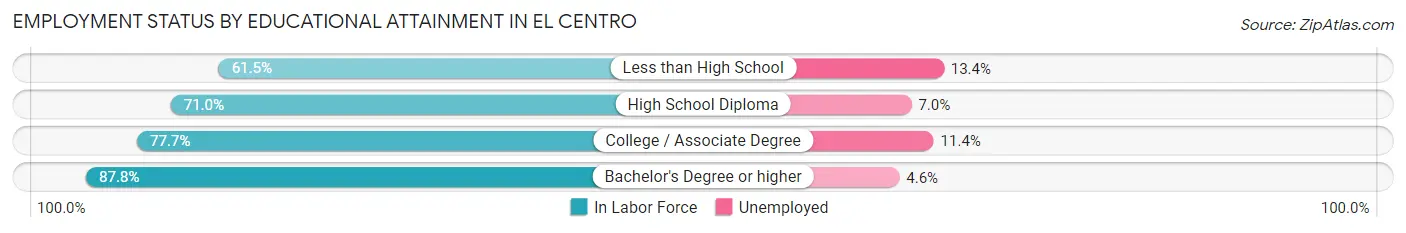
| Educational Attainment | In Labor Force | Unemployed |
| Less than High School | 2,539 (61.5%) | 553 (13.4%) |
| High School Diploma | 4,084 (71.0%) | 403 (7.0%) |
| College / Associate Degree | 5,423 (77.7%) | 796 (11.4%) |
| Bachelor's Degree or higher | 3,141 (87.8%) | 165 (4.6%) |
| Total | 15,185 (74.3%) | 1,860 (9.1%) |
Employment Occupations by Sex in El Centro
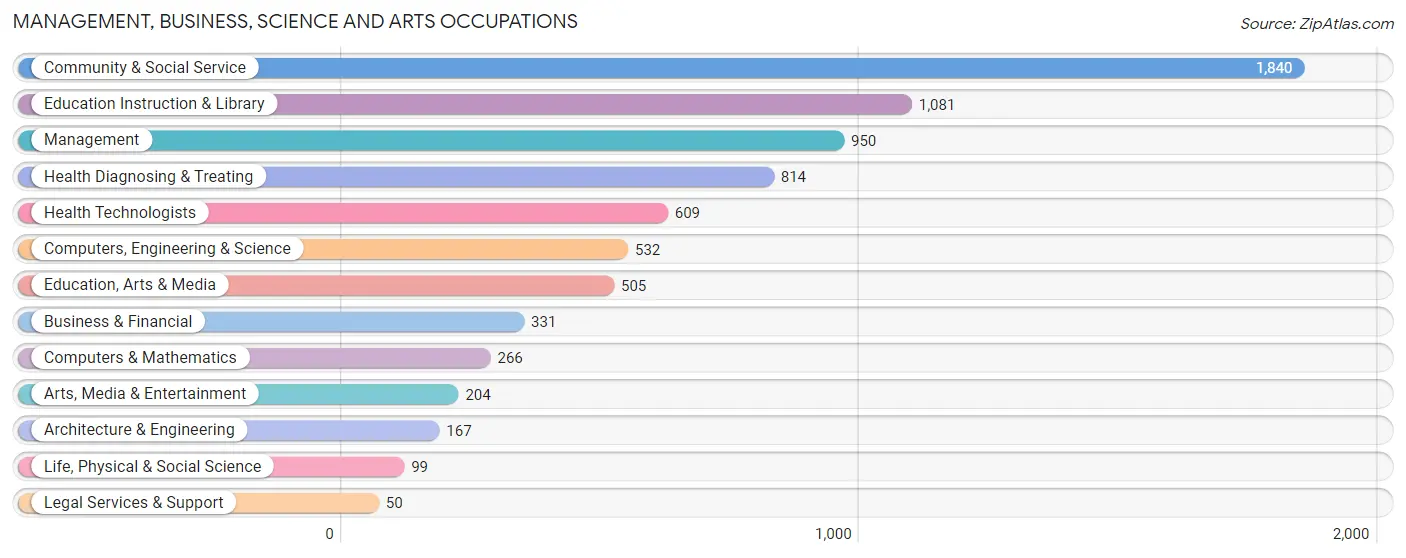
Management, Business, Science and Arts Occupations
The most common Management, Business, Science and Arts occupations in El Centro are Community & Social Service (1,840 | 11.0%), Education Instruction & Library (1,081 | 6.5%), Management (950 | 5.7%), Health Diagnosing & Treating (814 | 4.9%), and Health Technologists (609 | 3.6%).
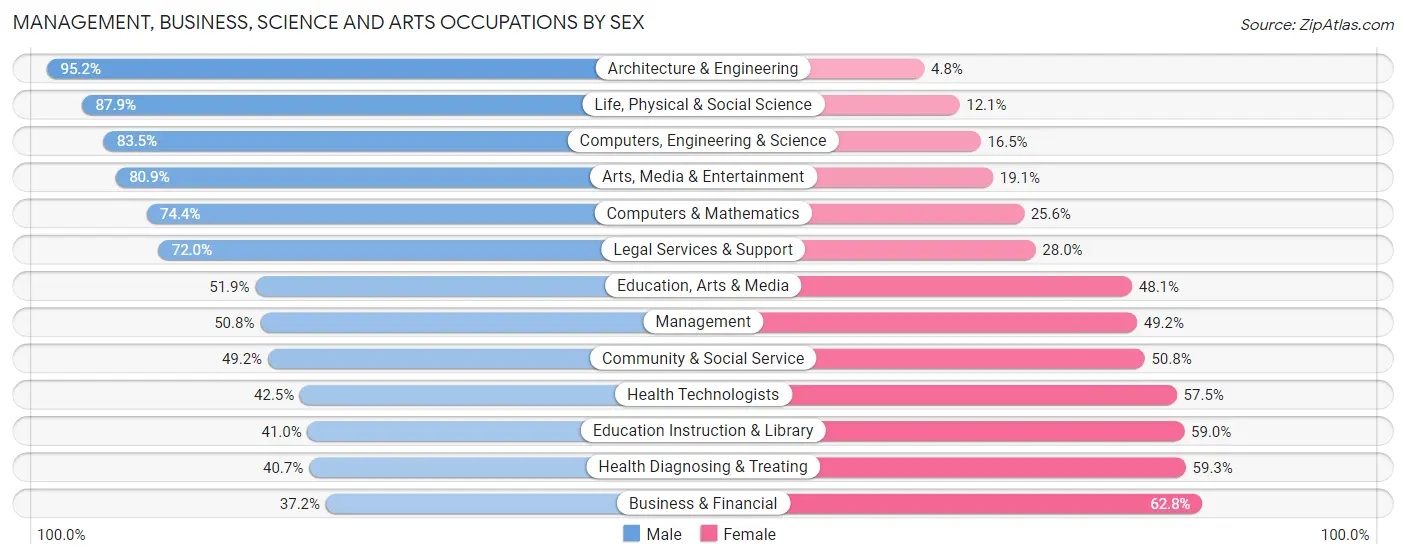
Management, Business, Science and Arts Occupations by Sex
Within the Management, Business, Science and Arts occupations in El Centro, the most male-oriented occupations are Architecture & Engineering (95.2%), Life, Physical & Social Science (87.9%), and Computers, Engineering & Science (83.5%), while the most female-oriented occupations are Business & Financial (62.8%), Health Diagnosing & Treating (59.3%), and Education Instruction & Library (59.0%).
| Occupation | Male | Female |
| Management | 483 (50.8%) | 467 (49.2%) |
| Business & Financial | 123 (37.2%) | 208 (62.8%) |
| Computers, Engineering & Science | 444 (83.5%) | 88 (16.5%) |
| Computers & Mathematics | 198 (74.4%) | 68 (25.6%) |
| Architecture & Engineering | 159 (95.2%) | 8 (4.8%) |
| Life, Physical & Social Science | 87 (87.9%) | 12 (12.1%) |
| Community & Social Service | 906 (49.2%) | 934 (50.8%) |
| Education, Arts & Media | 262 (51.9%) | 243 (48.1%) |
| Legal Services & Support | 36 (72.0%) | 14 (28.0%) |
| Education Instruction & Library | 443 (41.0%) | 638 (59.0%) |
| Arts, Media & Entertainment | 165 (80.9%) | 39 (19.1%) |
| Health Diagnosing & Treating | 331 (40.7%) | 483 (59.3%) |
| Health Technologists | 259 (42.5%) | 350 (57.5%) |
| Total (Category) | 2,287 (51.2%) | 2,180 (48.8%) |
| Total (Overall) | 9,622 (57.5%) | 7,108 (42.5%) |
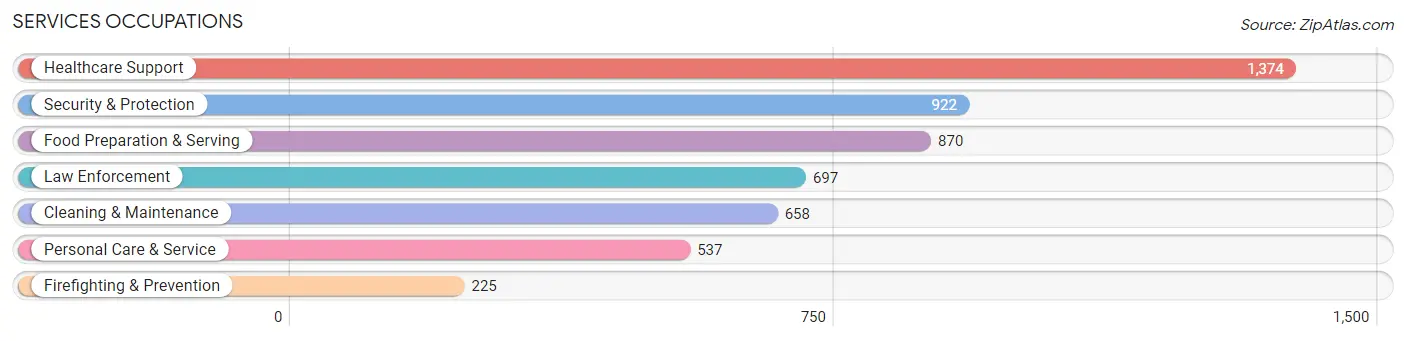
Services Occupations
The most common Services occupations in El Centro are Healthcare Support (1,374 | 8.2%), Security & Protection (922 | 5.5%), Food Preparation & Serving (870 | 5.2%), Law Enforcement (697 | 4.2%), and Cleaning & Maintenance (658 | 3.9%).
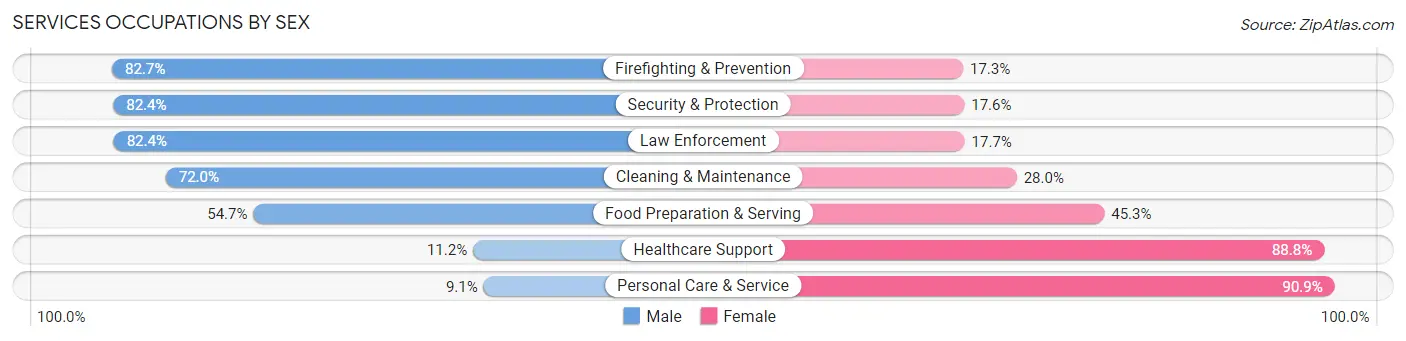
Services Occupations by Sex
Within the Services occupations in El Centro, the most male-oriented occupations are Firefighting & Prevention (82.7%), Security & Protection (82.4%), and Law Enforcement (82.4%), while the most female-oriented occupations are Personal Care & Service (90.9%), Healthcare Support (88.8%), and Food Preparation & Serving (45.3%).
| Occupation | Male | Female |
| Healthcare Support | 154 (11.2%) | 1,220 (88.8%) |
| Security & Protection | 760 (82.4%) | 162 (17.6%) |
| Firefighting & Prevention | 186 (82.7%) | 39 (17.3%) |
| Law Enforcement | 574 (82.4%) | 123 (17.6%) |
| Food Preparation & Serving | 476 (54.7%) | 394 (45.3%) |
| Cleaning & Maintenance | 474 (72.0%) | 184 (28.0%) |
| Personal Care & Service | 49 (9.1%) | 488 (90.9%) |
| Total (Category) | 1,913 (43.9%) | 2,448 (56.1%) |
| Total (Overall) | 9,622 (57.5%) | 7,108 (42.5%) |
Sales and Office Occupations
The most common Sales and Office occupations in El Centro are Sales & Related (1,739 | 10.4%), and Office & Administration (1,253 | 7.5%).

Sales and Office Occupations by Sex
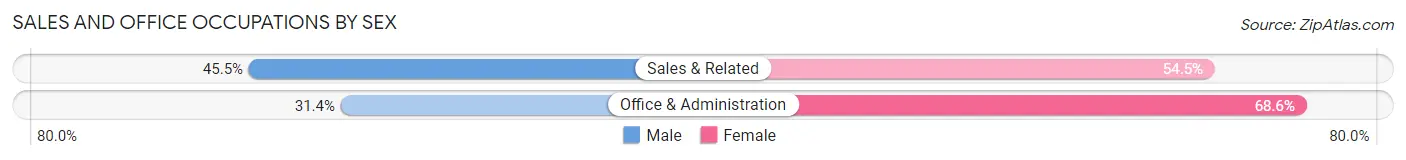
| Occupation | Male | Female |
| Sales & Related | 791 (45.5%) | 948 (54.5%) |
| Office & Administration | 393 (31.4%) | 860 (68.6%) |
| Total (Category) | 1,184 (39.6%) | 1,808 (60.4%) |
| Total (Overall) | 9,622 (57.5%) | 7,108 (42.5%) |
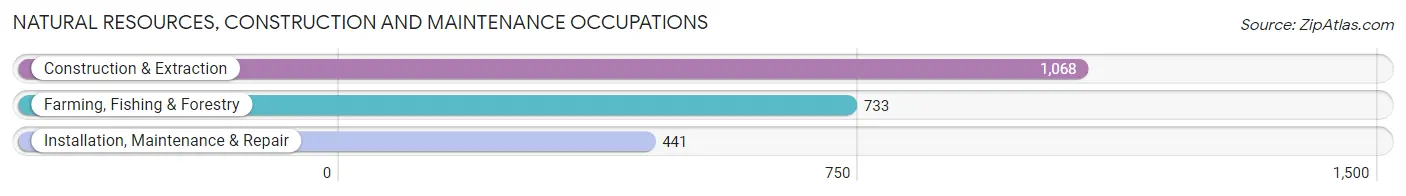
Natural Resources, Construction and Maintenance Occupations
The most common Natural Resources, Construction and Maintenance occupations in El Centro are Construction & Extraction (1,068 | 6.4%), Farming, Fishing & Forestry (733 | 4.4%), and Installation, Maintenance & Repair (441 | 2.6%).
Natural Resources, Construction and Maintenance Occupations by Sex
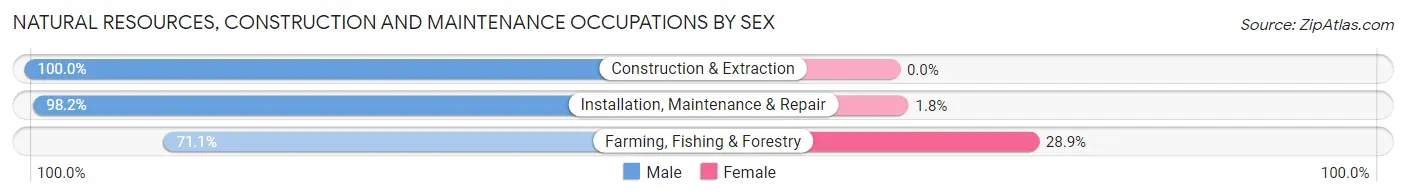
| Occupation | Male | Female |
| Farming, Fishing & Forestry | 521 (71.1%) | 212 (28.9%) |
| Construction & Extraction | 1,068 (100.0%) | 0 (0.0%) |
| Installation, Maintenance & Repair | 433 (98.2%) | 8 (1.8%) |
| Total (Category) | 2,022 (90.2%) | 220 (9.8%) |
| Total (Overall) | 9,622 (57.5%) | 7,108 (42.5%) |
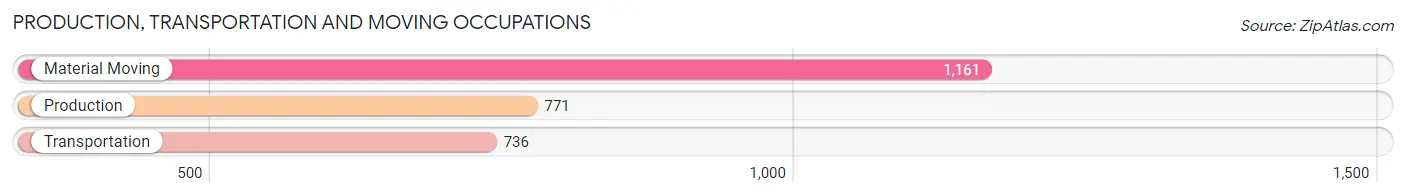
Production, Transportation and Moving Occupations
The most common Production, Transportation and Moving occupations in El Centro are Material Moving (1,161 | 6.9%), Production (771 | 4.6%), and Transportation (736 | 4.4%).
Production, Transportation and Moving Occupations by Sex
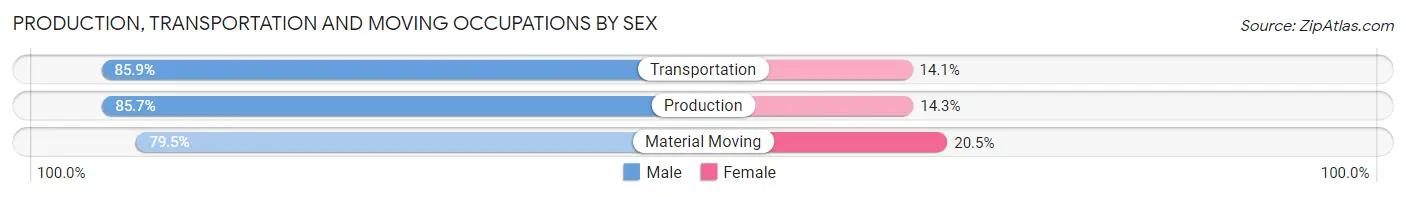
| Occupation | Male | Female |
| Production | 661 (85.7%) | 110 (14.3%) |
| Transportation | 632 (85.9%) | 104 (14.1%) |
| Material Moving | 923 (79.5%) | 238 (20.5%) |
| Total (Category) | 2,216 (83.1%) | 452 (16.9%) |
| Total (Overall) | 9,622 (57.5%) | 7,108 (42.5%) |
Employment Industries by Sex in El Centro
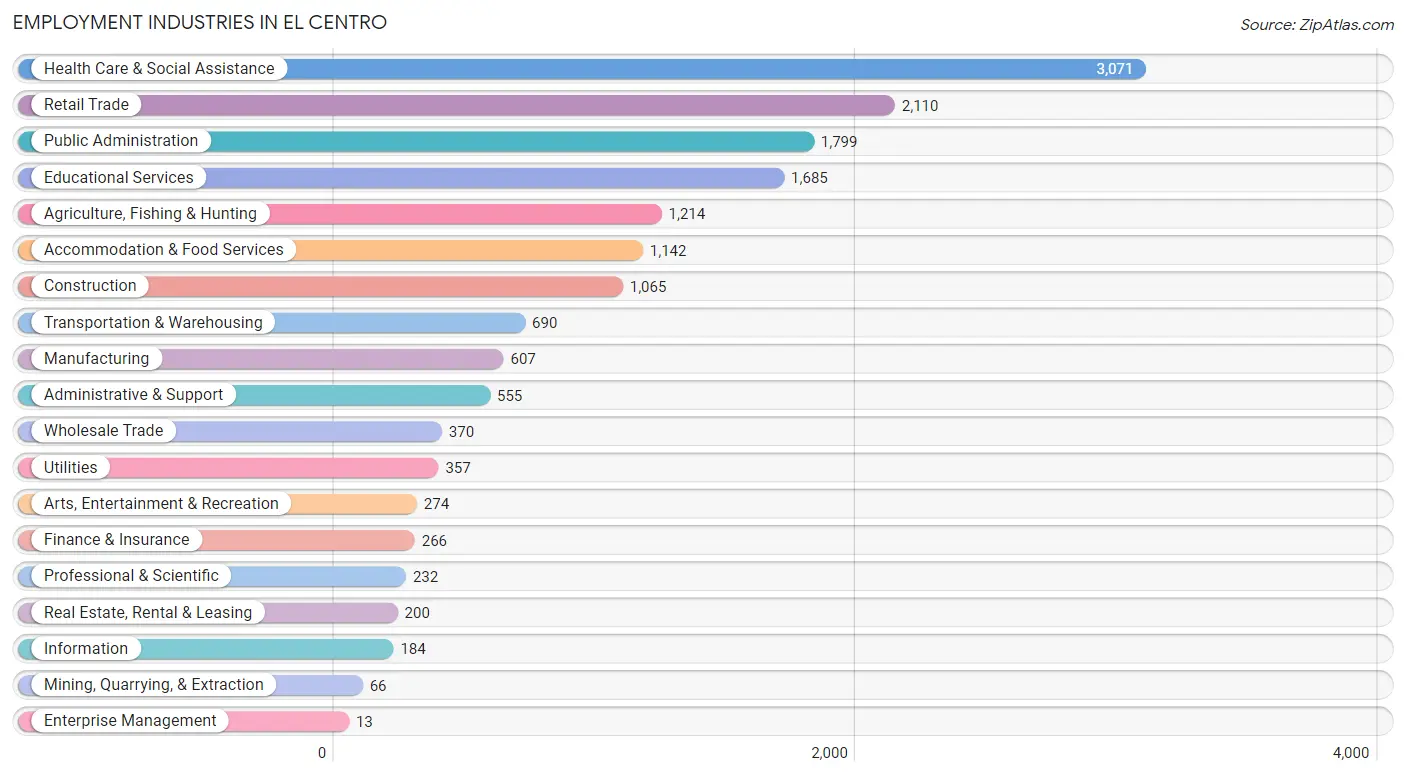
Employment Industries in El Centro
The major employment industries in El Centro include Health Care & Social Assistance (3,071 | 18.4%), Retail Trade (2,110 | 12.6%), Public Administration (1,799 | 10.7%), Educational Services (1,685 | 10.1%), and Agriculture, Fishing & Hunting (1,214 | 7.3%).
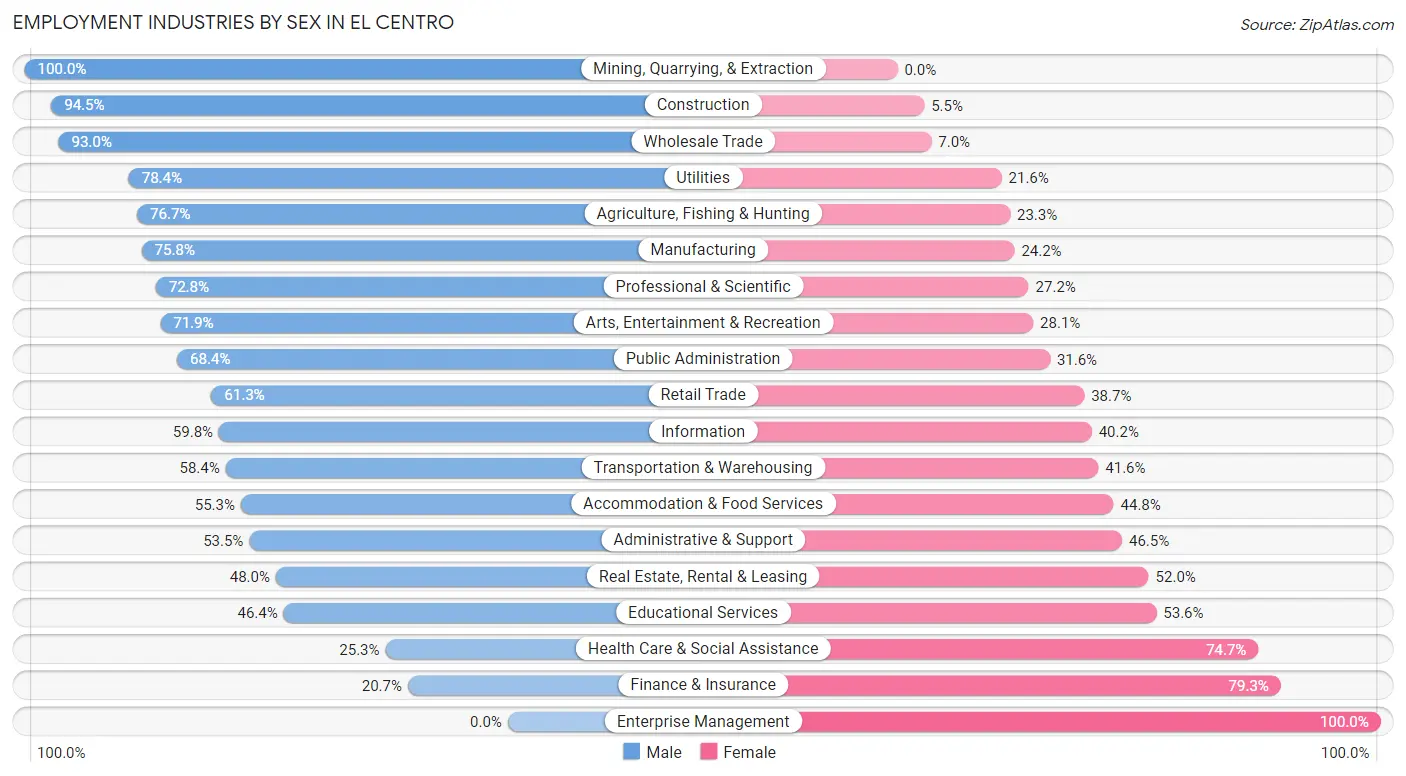
Employment Industries by Sex in El Centro
The El Centro industries that see more men than women are Mining, Quarrying, & Extraction (100.0%), Construction (94.5%), and Wholesale Trade (93.0%), whereas the industries that tend to have a higher number of women are Enterprise Management (100.0%), Finance & Insurance (79.3%), and Health Care & Social Assistance (74.7%).
| Industry | Male | Female |
| Agriculture, Fishing & Hunting | 931 (76.7%) | 283 (23.3%) |
| Mining, Quarrying, & Extraction | 66 (100.0%) | 0 (0.0%) |
| Construction | 1,006 (94.5%) | 59 (5.5%) |
| Manufacturing | 460 (75.8%) | 147 (24.2%) |
| Wholesale Trade | 344 (93.0%) | 26 (7.0%) |
| Retail Trade | 1,294 (61.3%) | 816 (38.7%) |
| Transportation & Warehousing | 403 (58.4%) | 287 (41.6%) |
| Utilities | 280 (78.4%) | 77 (21.6%) |
| Information | 110 (59.8%) | 74 (40.2%) |
| Finance & Insurance | 55 (20.7%) | 211 (79.3%) |
| Real Estate, Rental & Leasing | 96 (48.0%) | 104 (52.0%) |
| Professional & Scientific | 169 (72.8%) | 63 (27.2%) |
| Enterprise Management | 0 (0.0%) | 13 (100.0%) |
| Administrative & Support | 297 (53.5%) | 258 (46.5%) |
| Educational Services | 782 (46.4%) | 903 (53.6%) |
| Health Care & Social Assistance | 778 (25.3%) | 2,293 (74.7%) |
| Arts, Entertainment & Recreation | 197 (71.9%) | 77 (28.1%) |
| Accommodation & Food Services | 631 (55.2%) | 511 (44.8%) |
| Public Administration | 1,231 (68.4%) | 568 (31.6%) |
| Total | 9,622 (57.5%) | 7,108 (42.5%) |
Education in El Centro
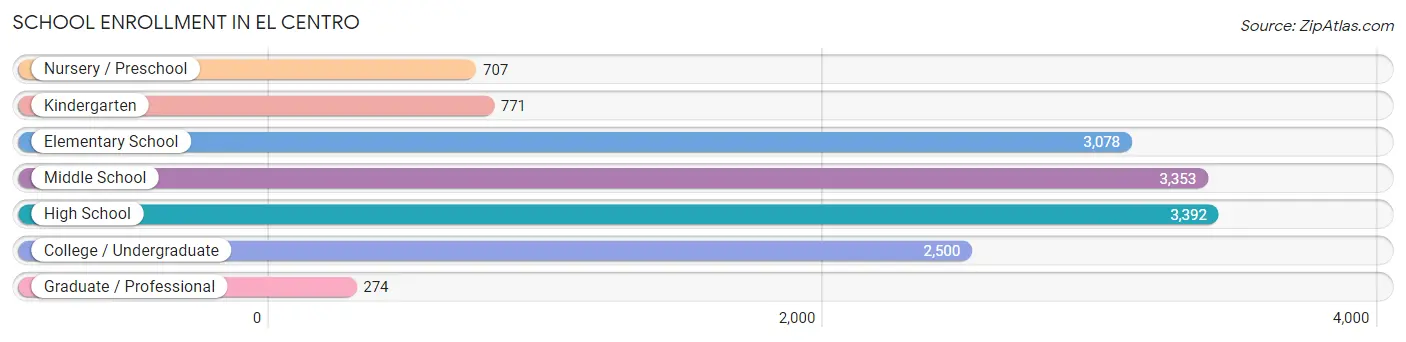
School Enrollment in El Centro
The most common levels of schooling among the 14,075 students in El Centro are high school (3,392 | 24.1%), middle school (3,353 | 23.8%), and elementary school (3,078 | 21.9%).
| School Level | # Students | % Students |
| Nursery / Preschool | 707 | 5.0% |
| Kindergarten | 771 | 5.5% |
| Elementary School | 3,078 | 21.9% |
| Middle School | 3,353 | 23.8% |
| High School | 3,392 | 24.1% |
| College / Undergraduate | 2,500 | 17.8% |
| Graduate / Professional | 274 | 1.9% |
| Total | 14,075 | 100.0% |
School Enrollment by Age by Funding Source in El Centro
Out of a total of 14,075 students who are enrolled in schools in El Centro, 479 (3.4%) attend a private institution, while the remaining 13,596 (96.6%) are enrolled in public schools. The age group of 3 to 4 year olds has the highest likelihood of being enrolled in private schools, with 171 (34.8% in the age bracket) enrolled. Conversely, the age group of 18 to 19 year olds has the lowest likelihood of being enrolled in a private school, with 1,206 (100.0% in the age bracket) attending a public institution.
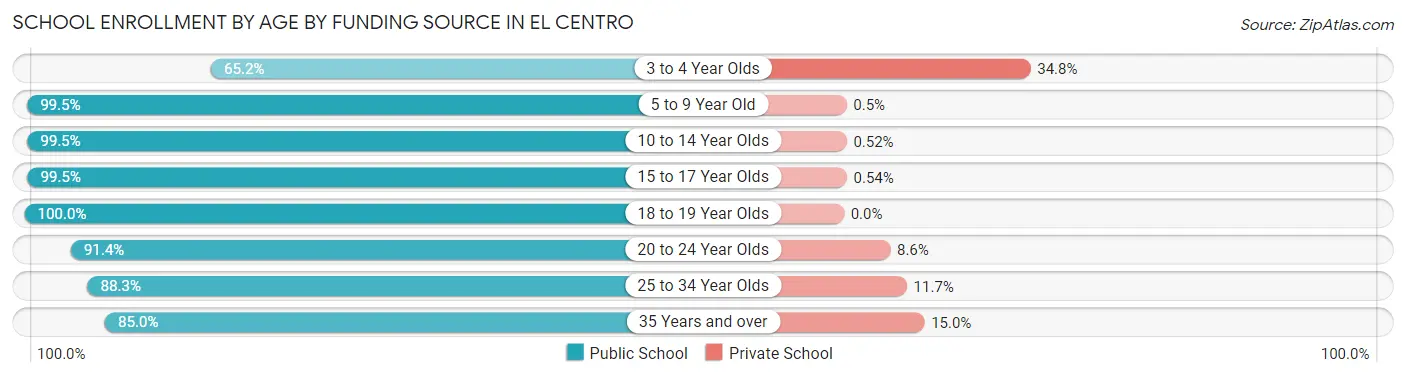
| Age Bracket | Public School | Private School |
| 3 to 4 Year Olds | 321 (65.2%) | 171 (34.8%) |
| 5 to 9 Year Old | 3,803 (99.5%) | 19 (0.5%) |
| 10 to 14 Year Olds | 4,190 (99.5%) | 22 (0.5%) |
| 15 to 17 Year Olds | 2,039 (99.5%) | 11 (0.5%) |
| 18 to 19 Year Olds | 1,206 (100.0%) | 0 (0.0%) |
| 20 to 24 Year Olds | 942 (91.4%) | 89 (8.6%) |
| 25 to 34 Year Olds | 655 (88.3%) | 87 (11.7%) |
| 35 Years and over | 442 (85.0%) | 78 (15.0%) |
| Total | 13,596 (96.6%) | 479 (3.4%) |
Educational Attainment by Field of Study in El Centro
Education (794 | 17.2%), psychology (557 | 12.1%), business (536 | 11.6%), science & technology (370 | 8.0%), and social sciences (361 | 7.8%) are the most common fields of study among 4,605 individuals in El Centro who have obtained a bachelor's degree or higher.
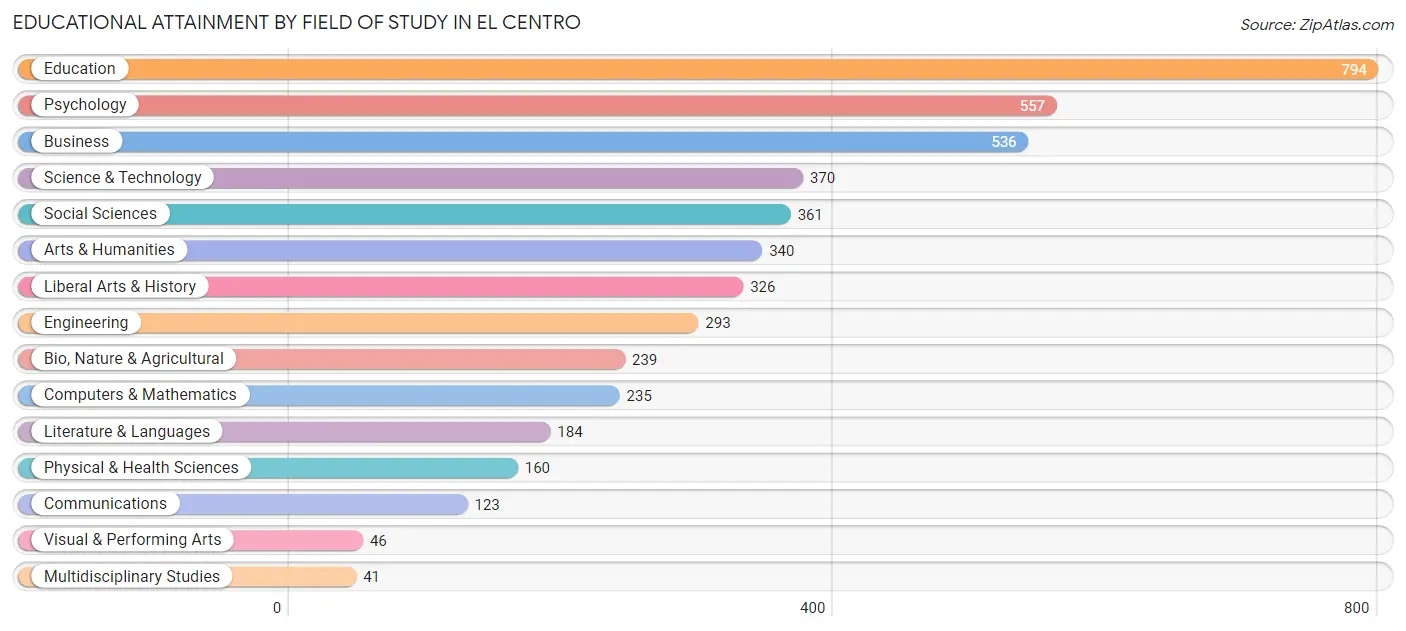
| Field of Study | # Graduates | % Graduates |
| Computers & Mathematics | 235 | 5.1% |
| Bio, Nature & Agricultural | 239 | 5.2% |
| Physical & Health Sciences | 160 | 3.5% |
| Psychology | 557 | 12.1% |
| Social Sciences | 361 | 7.8% |
| Engineering | 293 | 6.4% |
| Multidisciplinary Studies | 41 | 0.9% |
| Science & Technology | 370 | 8.0% |
| Business | 536 | 11.6% |
| Education | 794 | 17.2% |
| Literature & Languages | 184 | 4.0% |
| Liberal Arts & History | 326 | 7.1% |
| Visual & Performing Arts | 46 | 1.0% |
| Communications | 123 | 2.7% |
| Arts & Humanities | 340 | 7.4% |
| Total | 4,605 | 100.0% |
Transportation & Commute in El Centro
Vehicle Availability by Sex in El Centro
The most prevalent vehicle ownership categories in El Centro are males with 2 vehicles (3,551, accounting for 37.5%) and females with 2 vehicles (2,753, making up 52.6%).
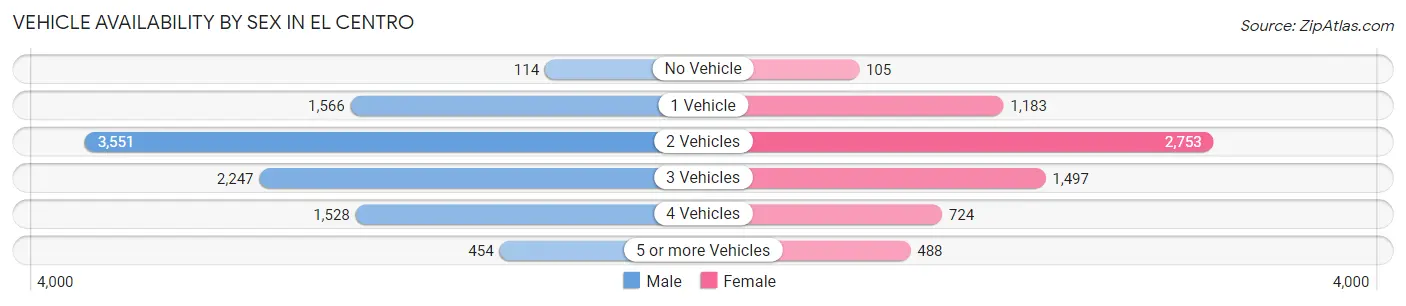
| Vehicles Available | Male | Female |
| No Vehicle | 114 (1.2%) | 105 (1.6%) |
| 1 Vehicle | 1,566 (16.6%) | 1,183 (17.5%) |
| 2 Vehicles | 3,551 (37.5%) | 2,753 (40.8%) |
| 3 Vehicles | 2,247 (23.7%) | 1,497 (22.2%) |
| 4 Vehicles | 1,528 (16.2%) | 724 (10.7%) |
| 5 or more Vehicles | 454 (4.8%) | 488 (7.2%) |
| Total | 9,460 (100.0%) | 6,750 (100.0%) |
Commute Time in El Centro
The most frequently occuring commute durations in El Centro are 10 to 14 minutes (3,666 commuters, 23.6%), 15 to 19 minutes (3,349 commuters, 21.6%), and 5 to 9 minutes (2,392 commuters, 15.4%).
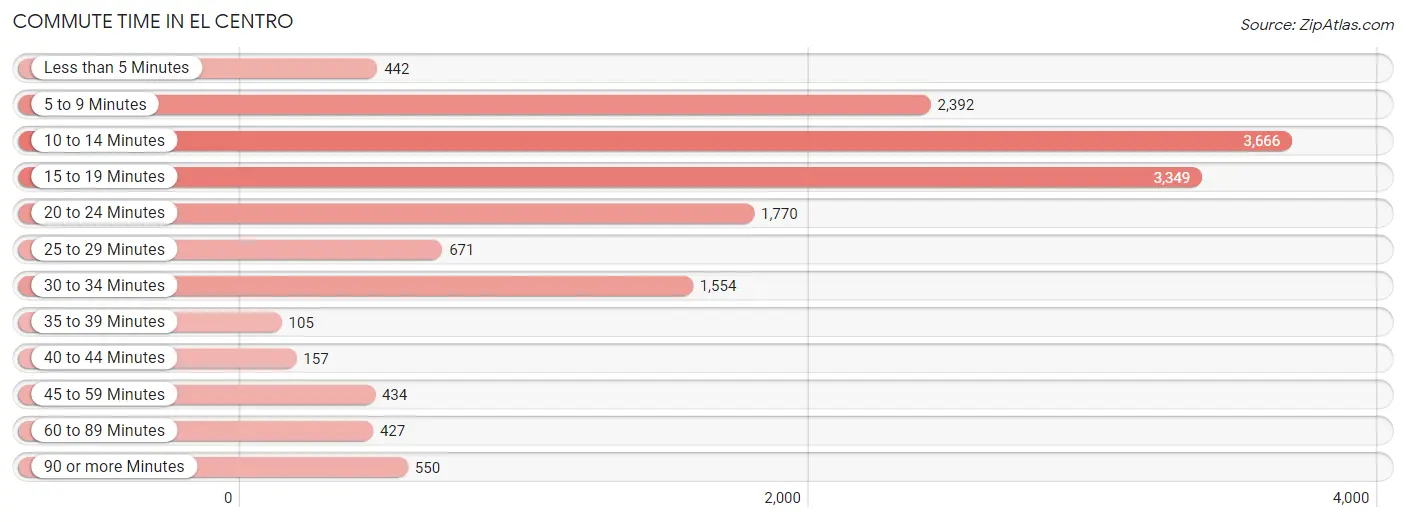
| Commute Time | # Commuters | % Commuters |
| Less than 5 Minutes | 442 | 2.9% |
| 5 to 9 Minutes | 2,392 | 15.4% |
| 10 to 14 Minutes | 3,666 | 23.6% |
| 15 to 19 Minutes | 3,349 | 21.6% |
| 20 to 24 Minutes | 1,770 | 11.4% |
| 25 to 29 Minutes | 671 | 4.3% |
| 30 to 34 Minutes | 1,554 | 10.0% |
| 35 to 39 Minutes | 105 | 0.7% |
| 40 to 44 Minutes | 157 | 1.0% |
| 45 to 59 Minutes | 434 | 2.8% |
| 60 to 89 Minutes | 427 | 2.8% |
| 90 or more Minutes | 550 | 3.5% |
Commute Time by Sex in El Centro
The most common commute times in El Centro are 10 to 14 minutes (1,962 commuters, 21.6%) for males and 10 to 14 minutes (1,704 commuters, 26.5%) for females.
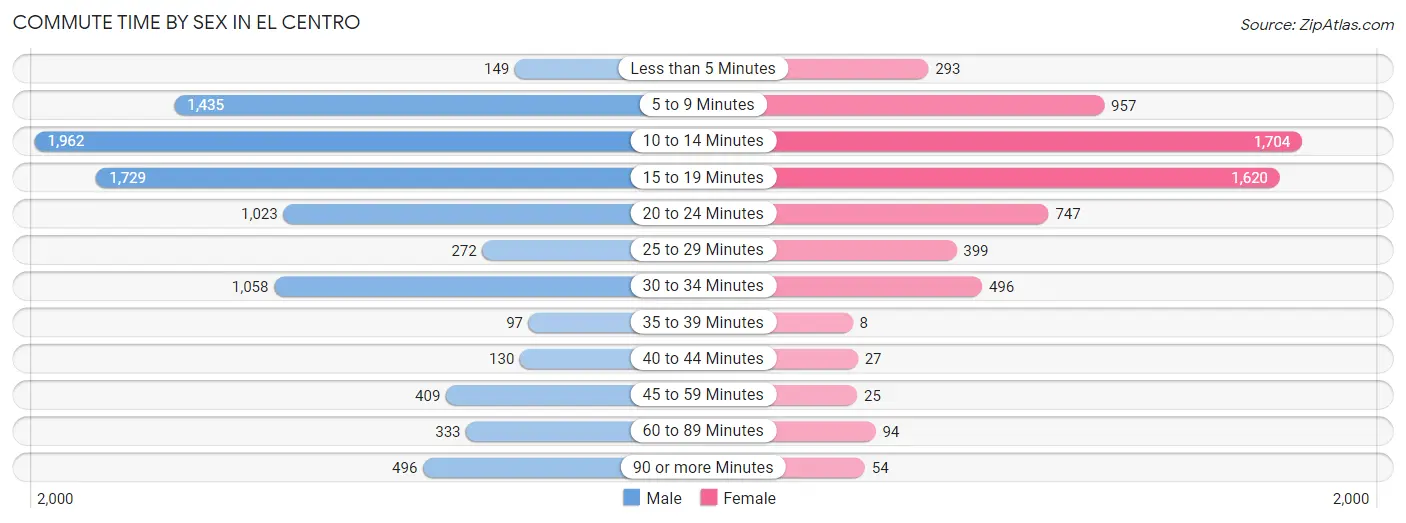
| Commute Time | Male | Female |
| Less than 5 Minutes | 149 (1.6%) | 293 (4.6%) |
| 5 to 9 Minutes | 1,435 (15.8%) | 957 (14.9%) |
| 10 to 14 Minutes | 1,962 (21.6%) | 1,704 (26.5%) |
| 15 to 19 Minutes | 1,729 (19.0%) | 1,620 (25.2%) |
| 20 to 24 Minutes | 1,023 (11.3%) | 747 (11.6%) |
| 25 to 29 Minutes | 272 (3.0%) | 399 (6.2%) |
| 30 to 34 Minutes | 1,058 (11.6%) | 496 (7.7%) |
| 35 to 39 Minutes | 97 (1.1%) | 8 (0.1%) |
| 40 to 44 Minutes | 130 (1.4%) | 27 (0.4%) |
| 45 to 59 Minutes | 409 (4.5%) | 25 (0.4%) |
| 60 to 89 Minutes | 333 (3.7%) | 94 (1.5%) |
| 90 or more Minutes | 496 (5.4%) | 54 (0.8%) |
Time of Departure to Work by Sex in El Centro
The most frequent times of departure to work in El Centro are 7:30 AM to 7:59 AM (1,373, 15.1%) for males and 7:30 AM to 7:59 AM (1,289, 20.1%) for females.
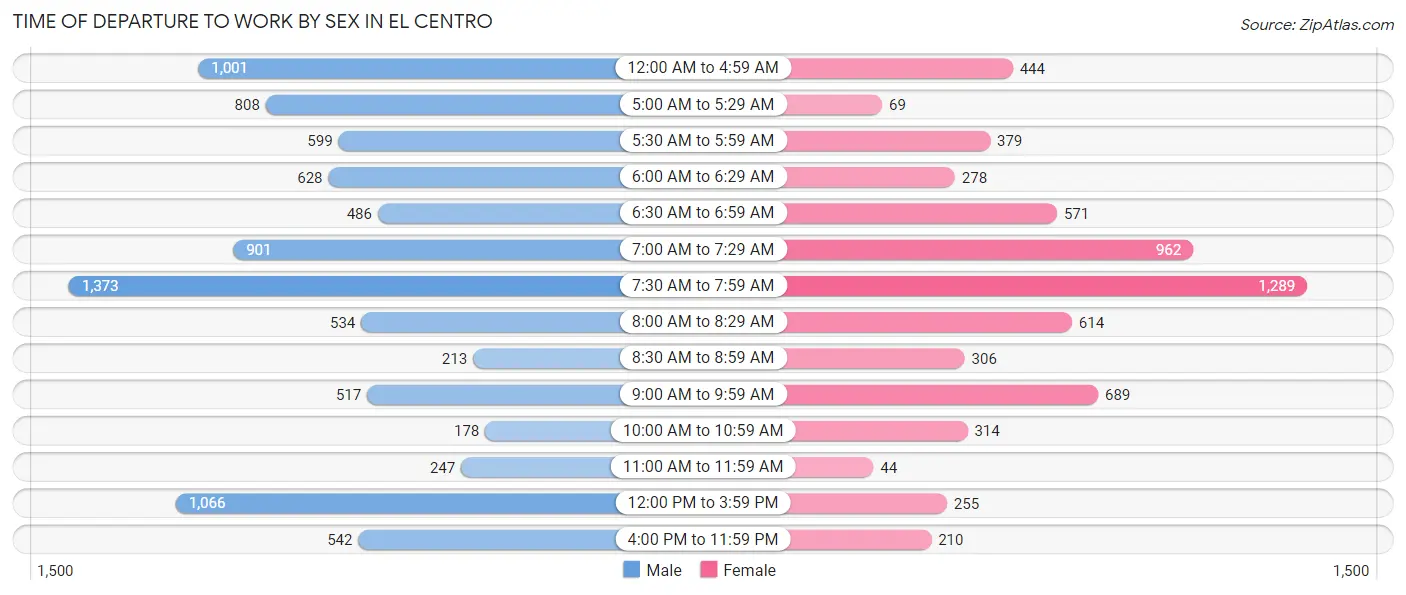
| Time of Departure | Male | Female |
| 12:00 AM to 4:59 AM | 1,001 (11.0%) | 444 (6.9%) |
| 5:00 AM to 5:29 AM | 808 (8.9%) | 69 (1.1%) |
| 5:30 AM to 5:59 AM | 599 (6.6%) | 379 (5.9%) |
| 6:00 AM to 6:29 AM | 628 (6.9%) | 278 (4.3%) |
| 6:30 AM to 6:59 AM | 486 (5.3%) | 571 (8.9%) |
| 7:00 AM to 7:29 AM | 901 (9.9%) | 962 (15.0%) |
| 7:30 AM to 7:59 AM | 1,373 (15.1%) | 1,289 (20.1%) |
| 8:00 AM to 8:29 AM | 534 (5.9%) | 614 (9.6%) |
| 8:30 AM to 8:59 AM | 213 (2.3%) | 306 (4.8%) |
| 9:00 AM to 9:59 AM | 517 (5.7%) | 689 (10.7%) |
| 10:00 AM to 10:59 AM | 178 (2.0%) | 314 (4.9%) |
| 11:00 AM to 11:59 AM | 247 (2.7%) | 44 (0.7%) |
| 12:00 PM to 3:59 PM | 1,066 (11.7%) | 255 (4.0%) |
| 4:00 PM to 11:59 PM | 542 (6.0%) | 210 (3.3%) |
| Total | 9,093 (100.0%) | 6,424 (100.0%) |
Housing Occupancy in El Centro
Occupancy by Ownership in El Centro
Of the total 12,225 dwellings in El Centro, owner-occupied units account for 6,200 (50.7%), while renter-occupied units make up 6,025 (49.3%).
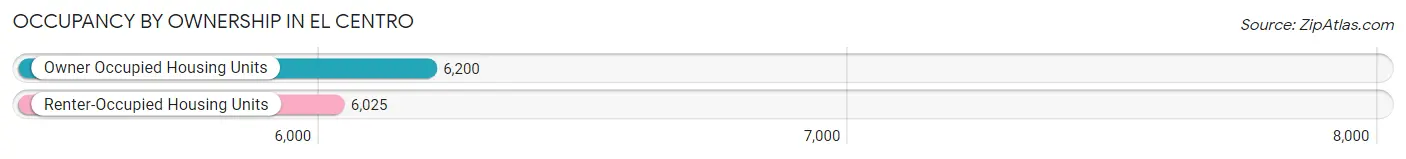
| Occupancy | # Housing Units | % Housing Units |
| Owner Occupied Housing Units | 6,200 | 50.7% |
| Renter-Occupied Housing Units | 6,025 | 49.3% |
| Total Occupied Housing Units | 12,225 | 100.0% |
Occupancy by Household Size in El Centro
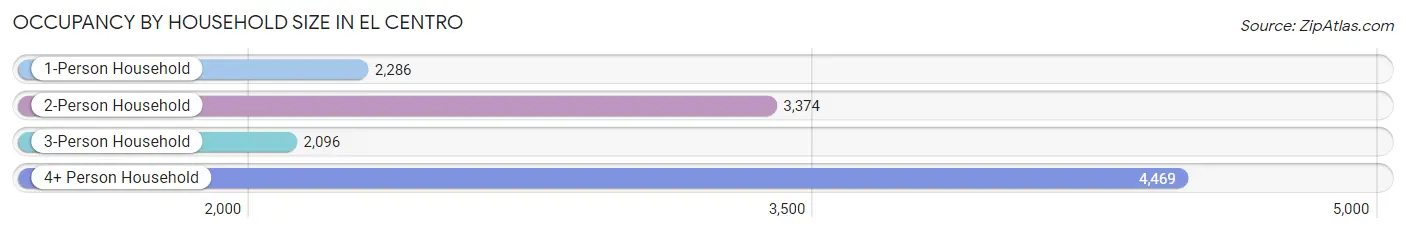
| Household Size | # Housing Units | % Housing Units |
| 1-Person Household | 2,286 | 18.7% |
| 2-Person Household | 3,374 | 27.6% |
| 3-Person Household | 2,096 | 17.2% |
| 4+ Person Household | 4,469 | 36.6% |
| Total Housing Units | 12,225 | 100.0% |
Occupancy by Ownership by Household Size in El Centro
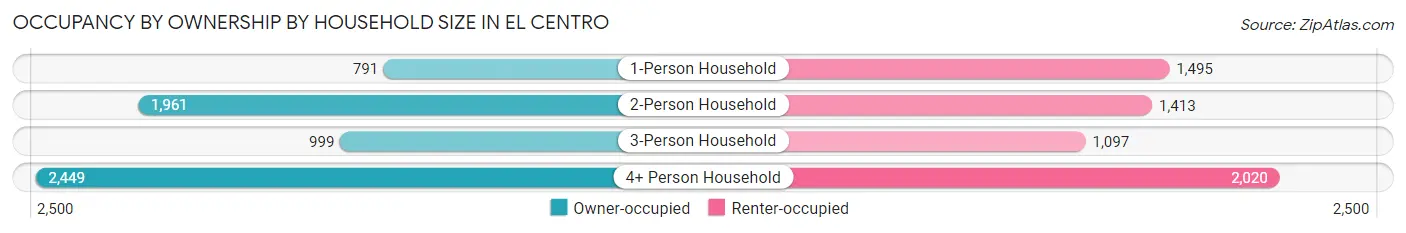
| Household Size | Owner-occupied | Renter-occupied |
| 1-Person Household | 791 (34.6%) | 1,495 (65.4%) |
| 2-Person Household | 1,961 (58.1%) | 1,413 (41.9%) |
| 3-Person Household | 999 (47.7%) | 1,097 (52.3%) |
| 4+ Person Household | 2,449 (54.8%) | 2,020 (45.2%) |
| Total Housing Units | 6,200 (50.7%) | 6,025 (49.3%) |
Occupancy by Educational Attainment in El Centro
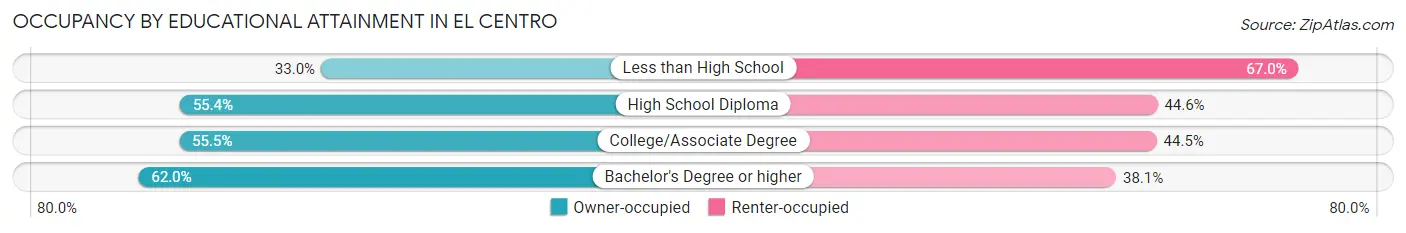
| Household Size | Owner-occupied | Renter-occupied |
| Less than High School | 1,076 (33.0%) | 2,185 (67.0%) |
| High School Diploma | 1,464 (55.4%) | 1,179 (44.6%) |
| College/Associate Degree | 2,203 (55.5%) | 1,766 (44.5%) |
| Bachelor's Degree or higher | 1,457 (62.0%) | 895 (38.1%) |
Occupancy by Age of Householder in El Centro
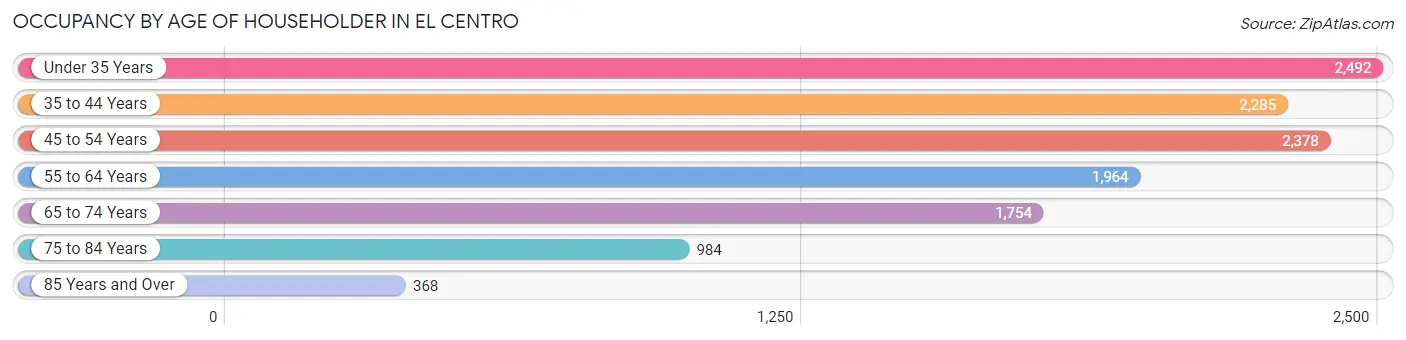
| Age Bracket | # Households | % Households |
| Under 35 Years | 2,492 | 20.4% |
| 35 to 44 Years | 2,285 | 18.7% |
| 45 to 54 Years | 2,378 | 19.5% |
| 55 to 64 Years | 1,964 | 16.1% |
| 65 to 74 Years | 1,754 | 14.3% |
| 75 to 84 Years | 984 | 8.1% |
| 85 Years and Over | 368 | 3.0% |
| Total | 12,225 | 100.0% |
Housing Finances in El Centro
Median Income by Occupancy in El Centro
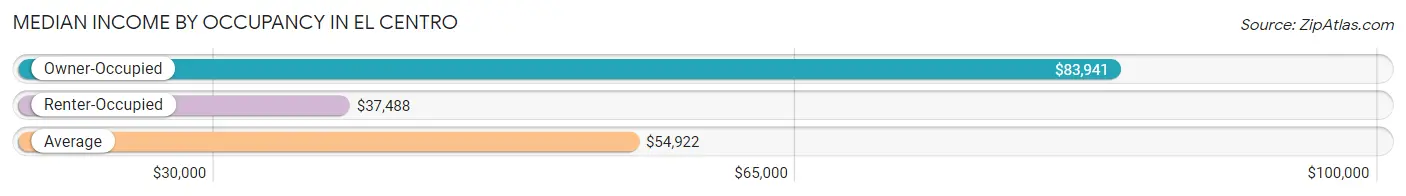
| Occupancy Type | # Households | Median Income |
| Owner-Occupied | 6,200 (50.7%) | $83,941 |
| Renter-Occupied | 6,025 (49.3%) | $37,488 |
| Average | 12,225 (100.0%) | $54,922 |
Occupancy by Householder Income Bracket in El Centro
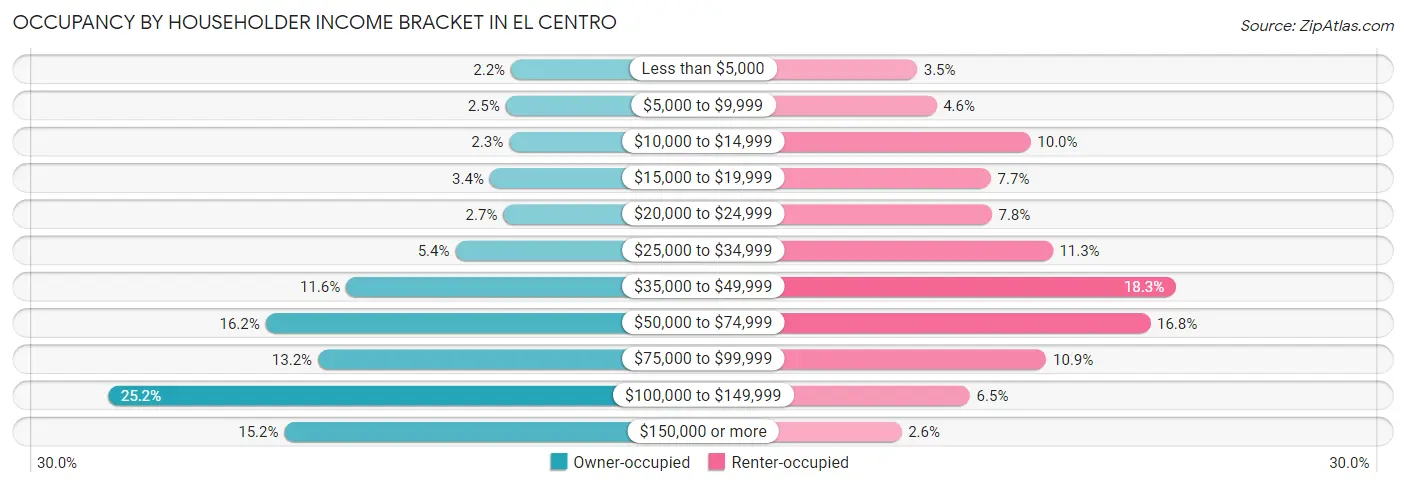
| Income Bracket | Owner-occupied | Renter-occupied |
| Less than $5,000 | 137 (2.2%) | 211 (3.5%) |
| $5,000 to $9,999 | 156 (2.5%) | 278 (4.6%) |
| $10,000 to $14,999 | 144 (2.3%) | 602 (10.0%) |
| $15,000 to $19,999 | 212 (3.4%) | 465 (7.7%) |
| $20,000 to $24,999 | 164 (2.6%) | 468 (7.8%) |
| $25,000 to $34,999 | 334 (5.4%) | 678 (11.3%) |
| $35,000 to $49,999 | 721 (11.6%) | 1,103 (18.3%) |
| $50,000 to $74,999 | 1,006 (16.2%) | 1,014 (16.8%) |
| $75,000 to $99,999 | 821 (13.2%) | 656 (10.9%) |
| $100,000 to $149,999 | 1,565 (25.2%) | 393 (6.5%) |
| $150,000 or more | 940 (15.2%) | 157 (2.6%) |
| Total | 6,200 (100.0%) | 6,025 (100.0%) |
Monthly Housing Cost Tiers in El Centro
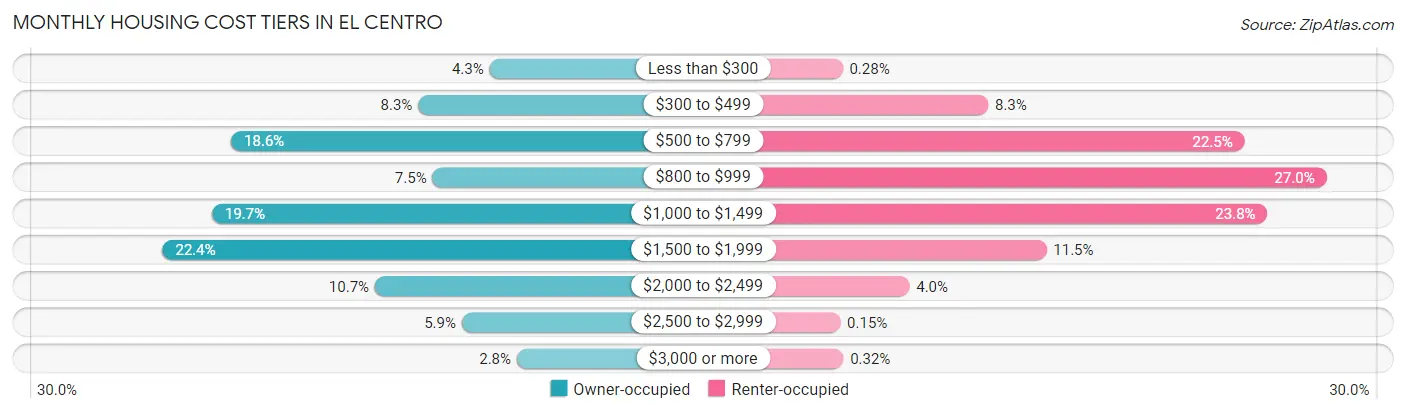
| Monthly Cost | Owner-occupied | Renter-occupied |
| Less than $300 | 268 (4.3%) | 17 (0.3%) |
| $300 to $499 | 512 (8.3%) | 501 (8.3%) |
| $500 to $799 | 1,153 (18.6%) | 1,355 (22.5%) |
| $800 to $999 | 463 (7.5%) | 1,628 (27.0%) |
| $1,000 to $1,499 | 1,219 (19.7%) | 1,431 (23.7%) |
| $1,500 to $1,999 | 1,388 (22.4%) | 695 (11.5%) |
| $2,000 to $2,499 | 660 (10.6%) | 239 (4.0%) |
| $2,500 to $2,999 | 363 (5.9%) | 9 (0.2%) |
| $3,000 or more | 174 (2.8%) | 19 (0.3%) |
| Total | 6,200 (100.0%) | 6,025 (100.0%) |
Physical Housing Characteristics in El Centro
Housing Structures in El Centro
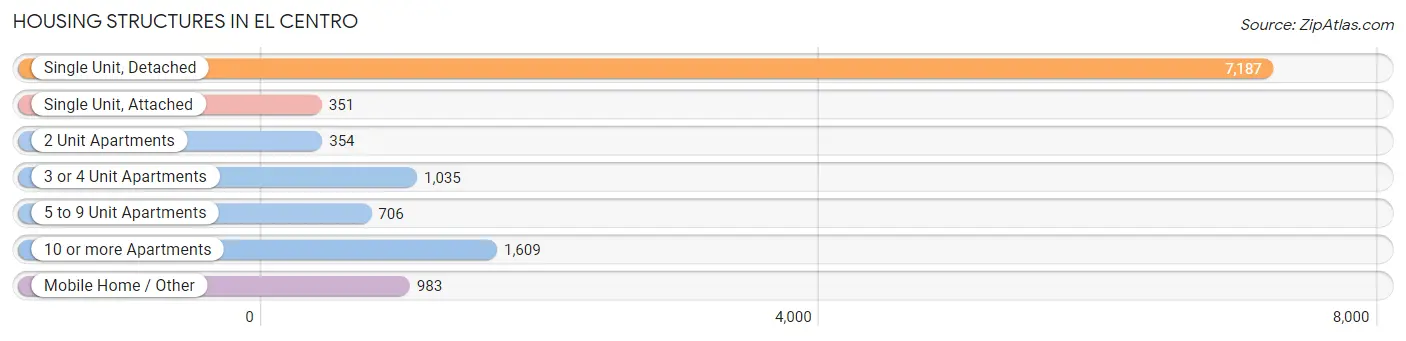
| Structure Type | # Housing Units | % Housing Units |
| Single Unit, Detached | 7,187 | 58.8% |
| Single Unit, Attached | 351 | 2.9% |
| 2 Unit Apartments | 354 | 2.9% |
| 3 or 4 Unit Apartments | 1,035 | 8.5% |
| 5 to 9 Unit Apartments | 706 | 5.8% |
| 10 or more Apartments | 1,609 | 13.2% |
| Mobile Home / Other | 983 | 8.0% |
| Total | 12,225 | 100.0% |
Housing Structures by Occupancy in El Centro
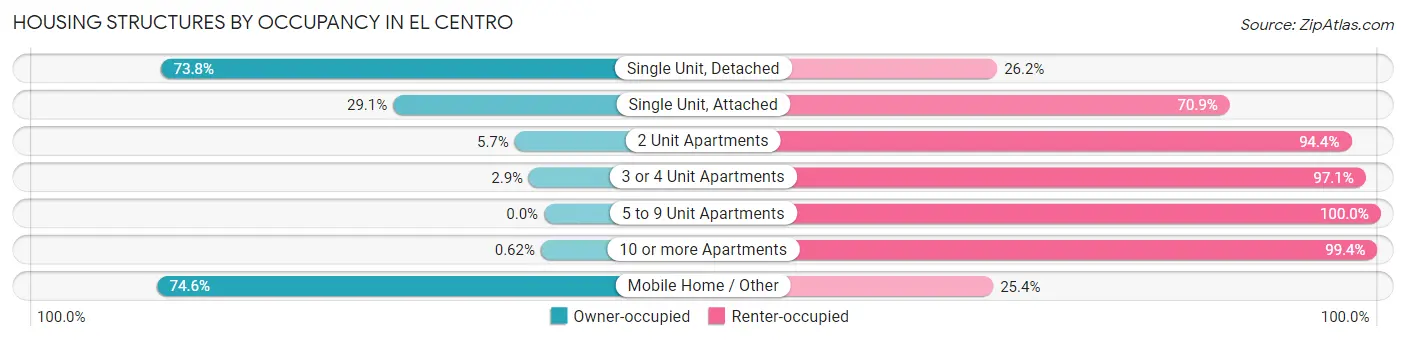
| Structure Type | Owner-occupied | Renter-occupied |
| Single Unit, Detached | 5,305 (73.8%) | 1,882 (26.2%) |
| Single Unit, Attached | 102 (29.1%) | 249 (70.9%) |
| 2 Unit Apartments | 20 (5.7%) | 334 (94.4%) |
| 3 or 4 Unit Apartments | 30 (2.9%) | 1,005 (97.1%) |
| 5 to 9 Unit Apartments | 0 (0.0%) | 706 (100.0%) |
| 10 or more Apartments | 10 (0.6%) | 1,599 (99.4%) |
| Mobile Home / Other | 733 (74.6%) | 250 (25.4%) |
| Total | 6,200 (50.7%) | 6,025 (49.3%) |
Housing Structures by Number of Rooms in El Centro
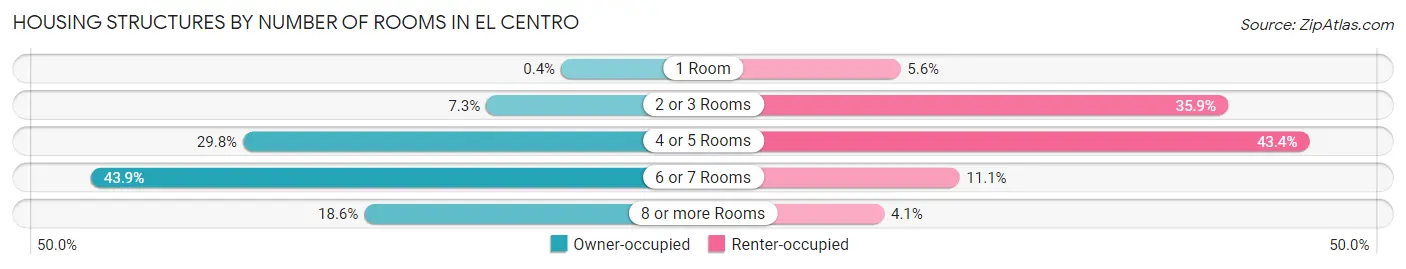
| Number of Rooms | Owner-occupied | Renter-occupied |
| 1 Room | 25 (0.4%) | 337 (5.6%) |
| 2 or 3 Rooms | 454 (7.3%) | 2,161 (35.9%) |
| 4 or 5 Rooms | 1,848 (29.8%) | 2,615 (43.4%) |
| 6 or 7 Rooms | 2,720 (43.9%) | 666 (11.1%) |
| 8 or more Rooms | 1,153 (18.6%) | 246 (4.1%) |
| Total | 6,200 (100.0%) | 6,025 (100.0%) |
Housing Structure by Heating Type in El Centro
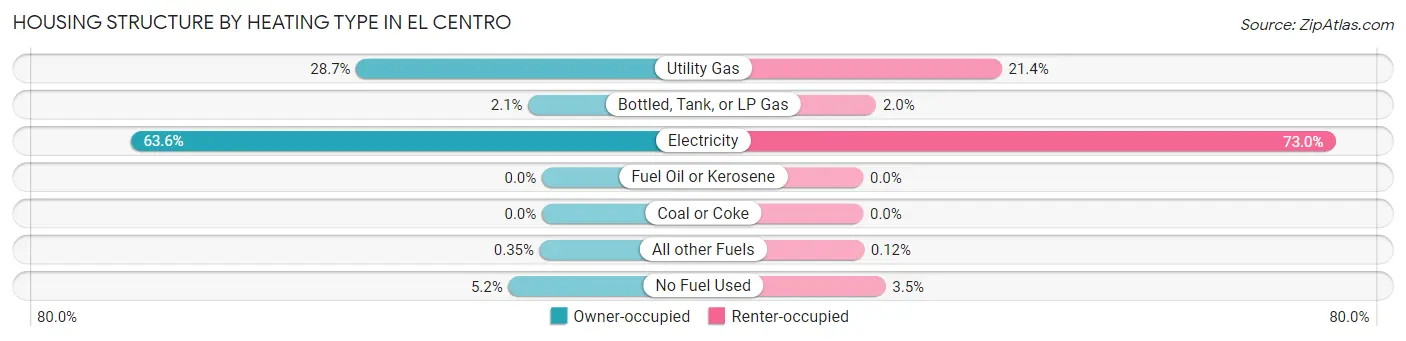
| Heating Type | Owner-occupied | Renter-occupied |
| Utility Gas | 1,780 (28.7%) | 1,290 (21.4%) |
| Bottled, Tank, or LP Gas | 131 (2.1%) | 121 (2.0%) |
| Electricity | 3,945 (63.6%) | 4,399 (73.0%) |
| Fuel Oil or Kerosene | 0 (0.0%) | 0 (0.0%) |
| Coal or Coke | 0 (0.0%) | 0 (0.0%) |
| All other Fuels | 22 (0.4%) | 7 (0.1%) |
| No Fuel Used | 322 (5.2%) | 208 (3.5%) |
| Total | 6,200 (100.0%) | 6,025 (100.0%) |
Household Vehicle Usage in El Centro
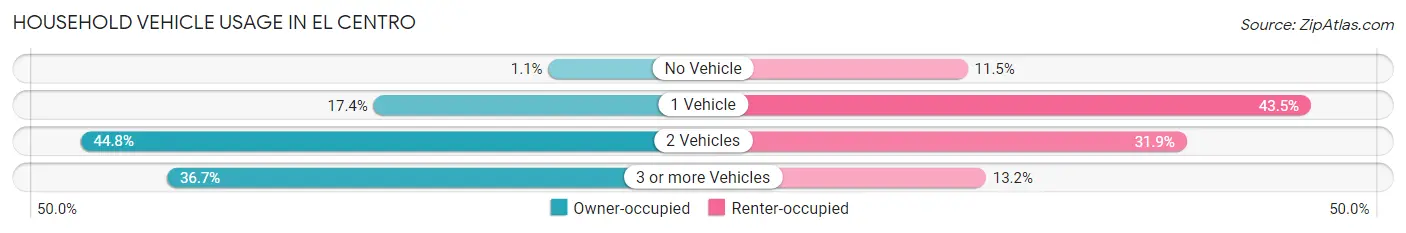
| Vehicles per Household | Owner-occupied | Renter-occupied |
| No Vehicle | 68 (1.1%) | 690 (11.5%) |
| 1 Vehicle | 1,080 (17.4%) | 2,621 (43.5%) |
| 2 Vehicles | 2,776 (44.8%) | 1,922 (31.9%) |
| 3 or more Vehicles | 2,276 (36.7%) | 792 (13.2%) |
| Total | 6,200 (100.0%) | 6,025 (100.0%) |
Real Estate & Mortgages in El Centro
Real Estate and Mortgage Overview in El Centro
| Characteristic | Without Mortgage | With Mortgage |
| Housing Units | 2,348 | 3,852 |
| Median Property Value | $198,000 | $284,000 |
| Median Household Income | $71,058 | $581 |
| Monthly Housing Costs | $582 | $174 |
| Real Estate Taxes | $1,666 | $149 |
Property Value by Mortgage Status in El Centro
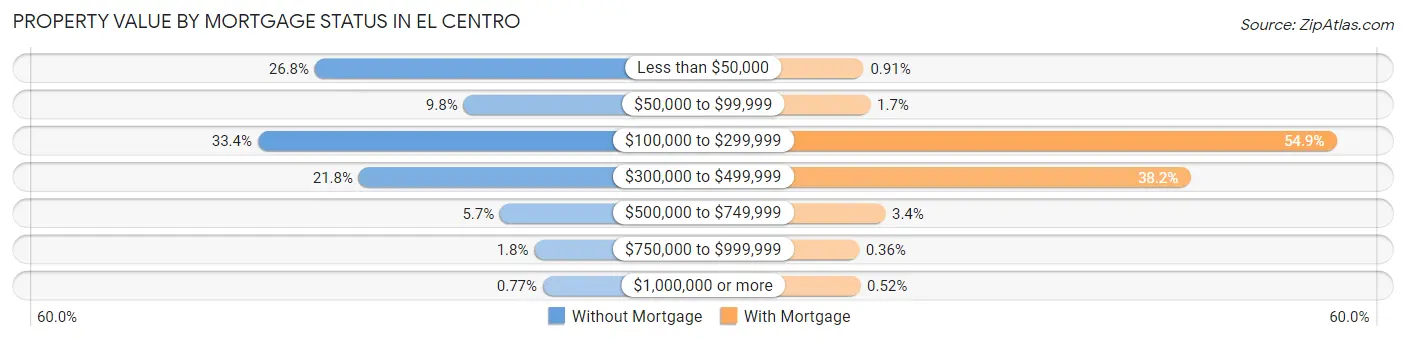
| Property Value | Without Mortgage | With Mortgage |
| Less than $50,000 | 630 (26.8%) | 35 (0.9%) |
| $50,000 to $99,999 | 231 (9.8%) | 64 (1.7%) |
| $100,000 to $299,999 | 783 (33.4%) | 2,116 (54.9%) |
| $300,000 to $499,999 | 512 (21.8%) | 1,473 (38.2%) |
| $500,000 to $749,999 | 133 (5.7%) | 130 (3.4%) |
| $750,000 to $999,999 | 41 (1.8%) | 14 (0.4%) |
| $1,000,000 or more | 18 (0.8%) | 20 (0.5%) |
| Total | 2,348 (100.0%) | 3,852 (100.0%) |
Household Income by Mortgage Status in El Centro
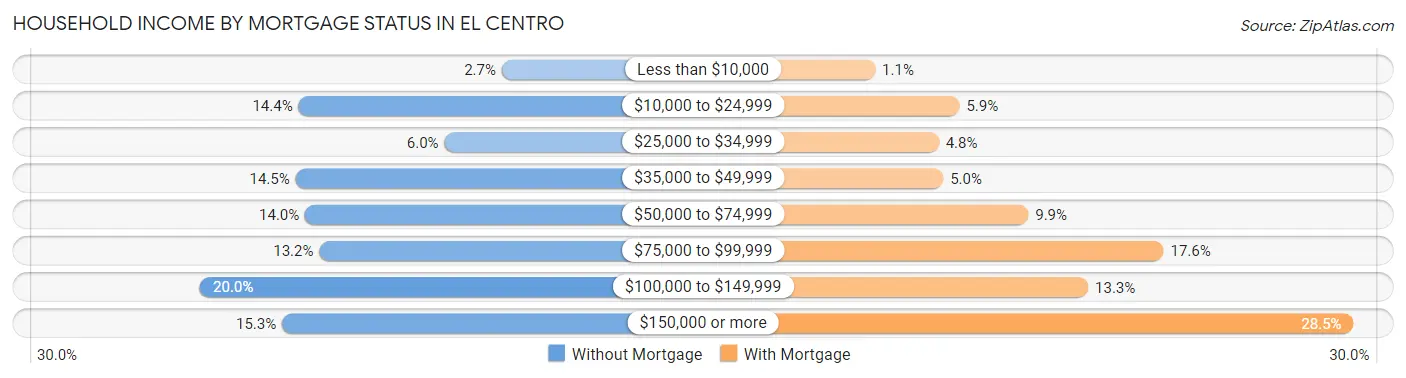
| Household Income | Without Mortgage | With Mortgage |
| Less than $10,000 | 64 (2.7%) | 43 (1.1%) |
| $10,000 to $24,999 | 337 (14.3%) | 229 (5.9%) |
| $25,000 to $34,999 | 141 (6.0%) | 183 (4.8%) |
| $35,000 to $49,999 | 341 (14.5%) | 193 (5.0%) |
| $50,000 to $74,999 | 328 (14.0%) | 380 (9.9%) |
| $75,000 to $99,999 | 309 (13.2%) | 678 (17.6%) |
| $100,000 to $149,999 | 469 (20.0%) | 512 (13.3%) |
| $150,000 or more | 359 (15.3%) | 1,096 (28.4%) |
| Total | 2,348 (100.0%) | 3,852 (100.0%) |
Property Value to Household Income Ratio in El Centro
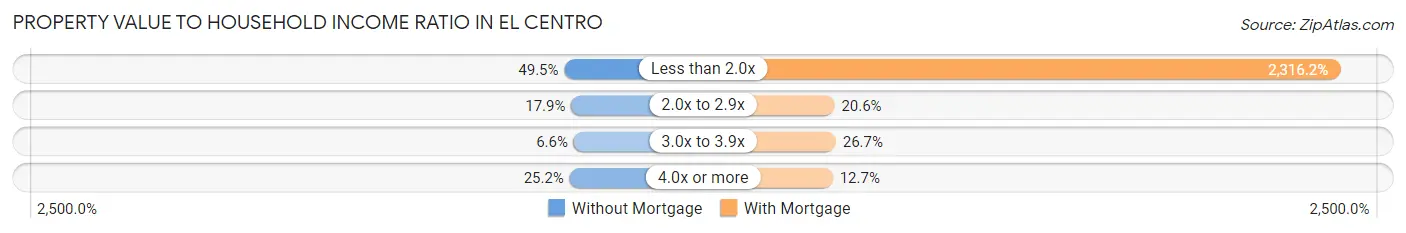
| Value-to-Income Ratio | Without Mortgage | With Mortgage |
| Less than 2.0x | 1,161 (49.4%) | 89,219 (2,316.2%) |
| 2.0x to 2.9x | 420 (17.9%) | 792 (20.6%) |
| 3.0x to 3.9x | 154 (6.6%) | 1,029 (26.7%) |
| 4.0x or more | 591 (25.2%) | 490 (12.7%) |
| Total | 2,348 (100.0%) | 3,852 (100.0%) |
Real Estate Taxes by Mortgage Status in El Centro
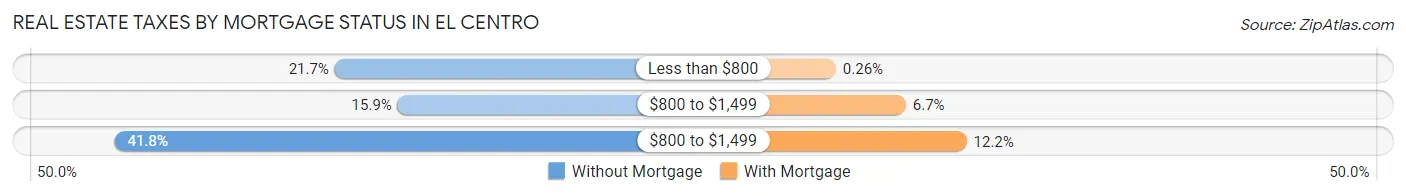
| Property Taxes | Without Mortgage | With Mortgage |
| Less than $800 | 509 (21.7%) | 10 (0.3%) |
| $800 to $1,499 | 374 (15.9%) | 256 (6.7%) |
| $800 to $1,499 | 981 (41.8%) | 470 (12.2%) |
| Total | 2,348 (100.0%) | 3,852 (100.0%) |
Health & Disability in El Centro
Health Insurance Coverage by Age in El Centro
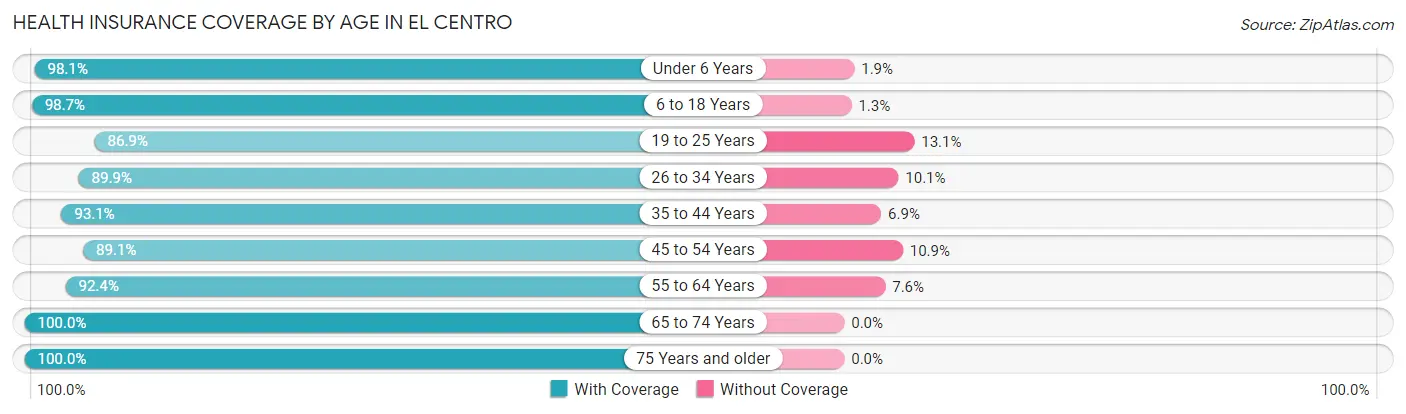
| Age Bracket | With Coverage | Without Coverage |
| Under 6 Years | 3,544 (98.1%) | 67 (1.9%) |
| 6 to 18 Years | 10,157 (98.7%) | 137 (1.3%) |
| 19 to 25 Years | 3,514 (86.9%) | 528 (13.1%) |
| 26 to 34 Years | 5,105 (89.9%) | 572 (10.1%) |
| 35 to 44 Years | 4,702 (93.1%) | 347 (6.9%) |
| 45 to 54 Years | 4,246 (89.1%) | 520 (10.9%) |
| 55 to 64 Years | 4,040 (92.4%) | 334 (7.6%) |
| 65 to 74 Years | 3,336 (100.0%) | 0 (0.0%) |
| 75 Years and older | 2,748 (100.0%) | 0 (0.0%) |
| Total | 41,392 (94.3%) | 2,505 (5.7%) |
Health Insurance Coverage by Citizenship Status in El Centro
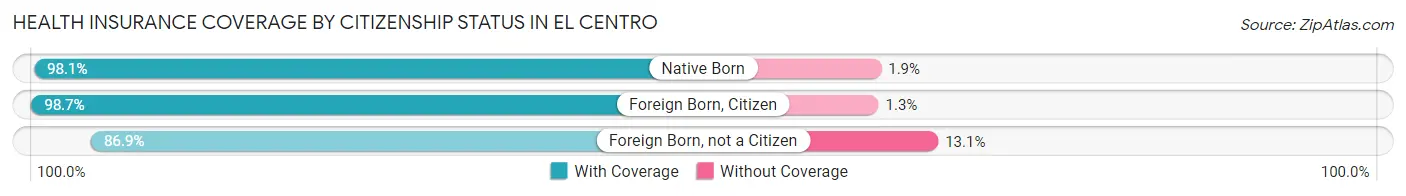
| Citizenship Status | With Coverage | Without Coverage |
| Native Born | 3,544 (98.1%) | 67 (1.9%) |
| Foreign Born, Citizen | 10,157 (98.7%) | 137 (1.3%) |
| Foreign Born, not a Citizen | 3,514 (86.9%) | 528 (13.1%) |
Health Insurance Coverage by Household Income in El Centro
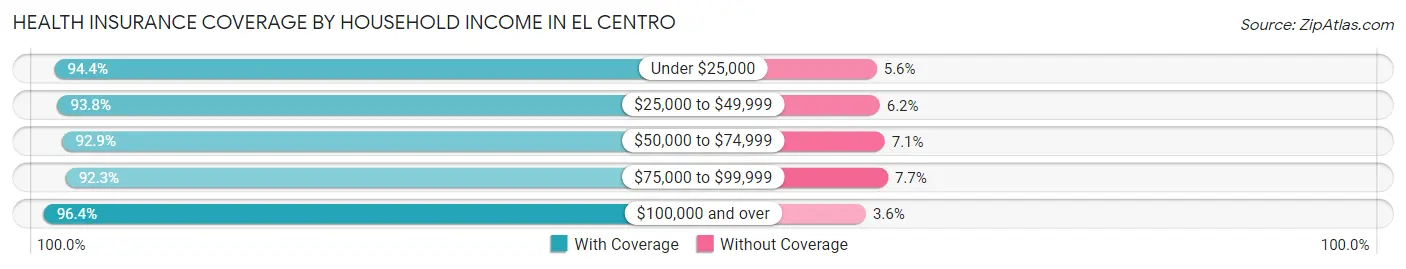
| Household Income | With Coverage | Without Coverage |
| Under $25,000 | 6,833 (94.4%) | 407 (5.6%) |
| $25,000 to $49,999 | 10,033 (93.8%) | 661 (6.2%) |
| $50,000 to $74,999 | 7,052 (92.9%) | 541 (7.1%) |
| $75,000 to $99,999 | 5,074 (92.3%) | 424 (7.7%) |
| $100,000 and over | 12,279 (96.4%) | 457 (3.6%) |
Public vs Private Health Insurance Coverage by Age in El Centro
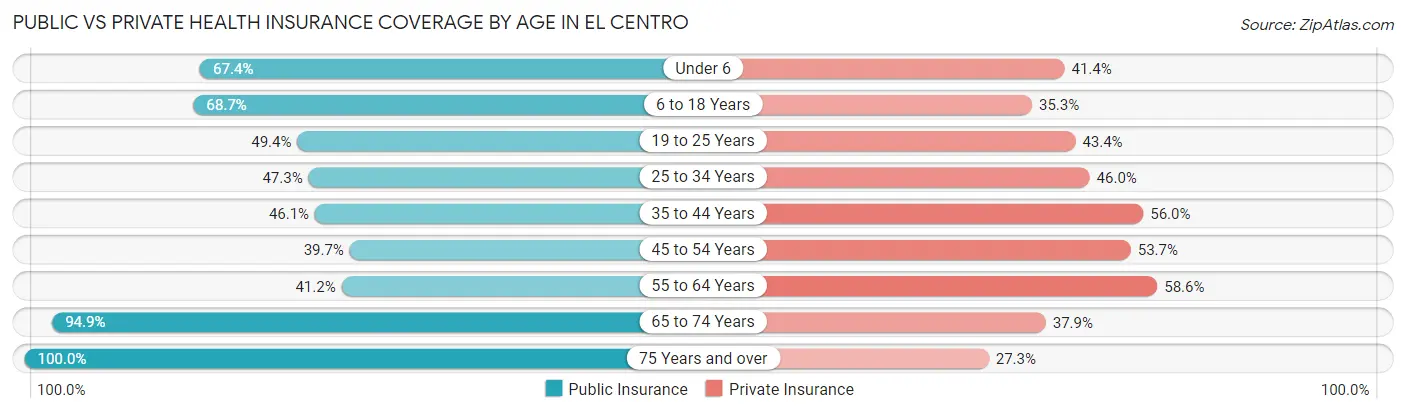
| Age Bracket | Public Insurance | Private Insurance |
| Under 6 | 2,434 (67.4%) | 1,493 (41.3%) |
| 6 to 18 Years | 7,068 (68.7%) | 3,636 (35.3%) |
| 19 to 25 Years | 1,996 (49.4%) | 1,753 (43.4%) |
| 25 to 34 Years | 2,686 (47.3%) | 2,612 (46.0%) |
| 35 to 44 Years | 2,328 (46.1%) | 2,826 (56.0%) |
| 45 to 54 Years | 1,890 (39.7%) | 2,557 (53.6%) |
| 55 to 64 Years | 1,801 (41.2%) | 2,562 (58.6%) |
| 65 to 74 Years | 3,165 (94.9%) | 1,263 (37.9%) |
| 75 Years and over | 2,748 (100.0%) | 750 (27.3%) |
| Total | 26,116 (59.5%) | 19,452 (44.3%) |
Disability Status by Sex by Age in El Centro
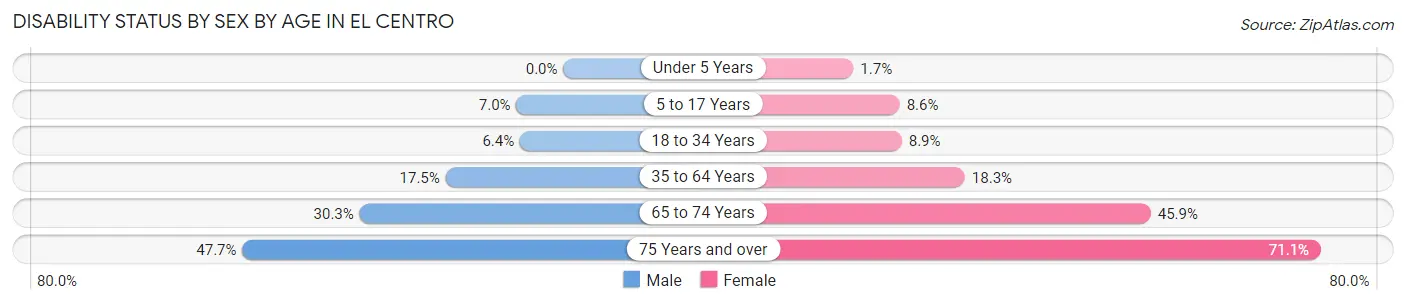
| Age Bracket | Male | Female |
| Under 5 Years | 0 (0.0%) | 23 (1.7%) |
| 5 to 17 Years | 360 (7.0%) | 447 (8.6%) |
| 18 to 34 Years | 376 (6.4%) | 401 (8.9%) |
| 35 to 64 Years | 1,190 (17.5%) | 1,349 (18.3%) |
| 65 to 74 Years | 458 (30.2%) | 836 (45.9%) |
| 75 Years and over | 479 (47.7%) | 1,240 (71.1%) |
Disability Class by Sex by Age in El Centro
Disability Class: Hearing Difficulty
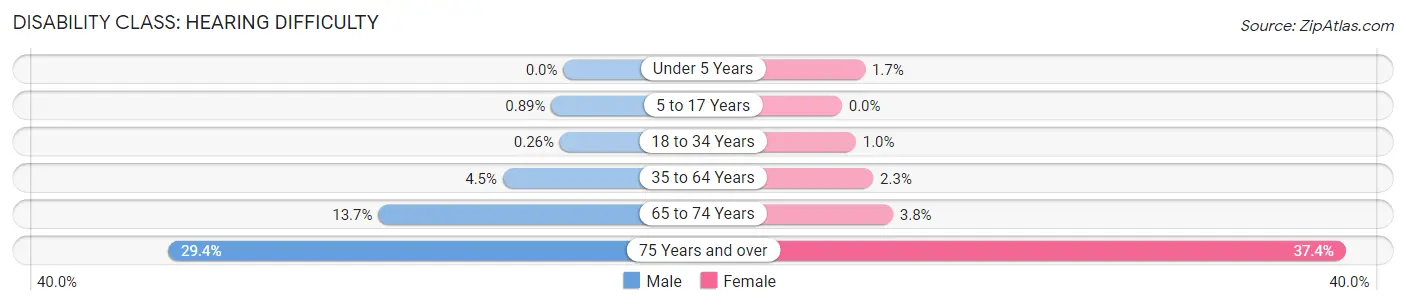
| Age Bracket | Male | Female |
| Under 5 Years | 0 (0.0%) | 23 (1.7%) |
| 5 to 17 Years | 46 (0.9%) | 0 (0.0%) |
| 18 to 34 Years | 15 (0.3%) | 47 (1.0%) |
| 35 to 64 Years | 306 (4.5%) | 172 (2.3%) |
| 65 to 74 Years | 208 (13.7%) | 69 (3.8%) |
| 75 Years and over | 295 (29.3%) | 652 (37.4%) |
Disability Class: Vision Difficulty
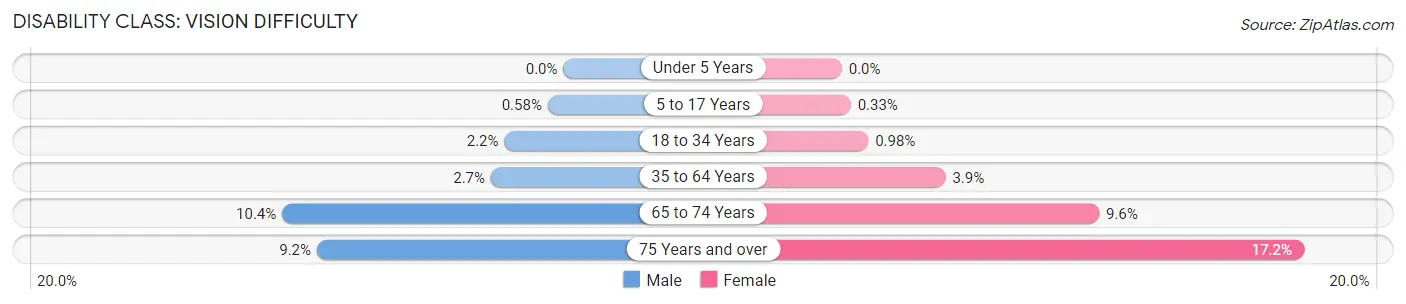
| Age Bracket | Male | Female |
| Under 5 Years | 0 (0.0%) | 0 (0.0%) |
| 5 to 17 Years | 30 (0.6%) | 17 (0.3%) |
| 18 to 34 Years | 128 (2.2%) | 44 (1.0%) |
| 35 to 64 Years | 183 (2.7%) | 284 (3.8%) |
| 65 to 74 Years | 158 (10.4%) | 174 (9.6%) |
| 75 Years and over | 92 (9.1%) | 299 (17.2%) |
Disability Class: Cognitive Difficulty
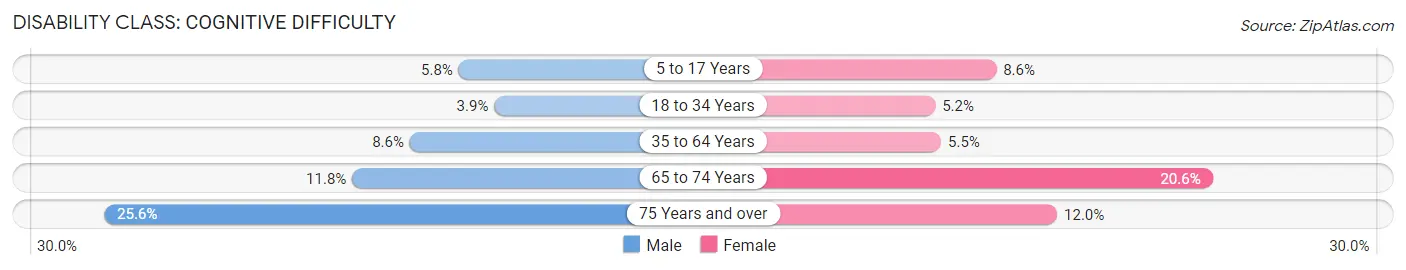
| Age Bracket | Male | Female |
| 5 to 17 Years | 301 (5.8%) | 447 (8.6%) |
| 18 to 34 Years | 225 (3.8%) | 234 (5.2%) |
| 35 to 64 Years | 582 (8.6%) | 408 (5.5%) |
| 65 to 74 Years | 178 (11.8%) | 376 (20.6%) |
| 75 Years and over | 257 (25.6%) | 209 (12.0%) |
Disability Class: Ambulatory Difficulty
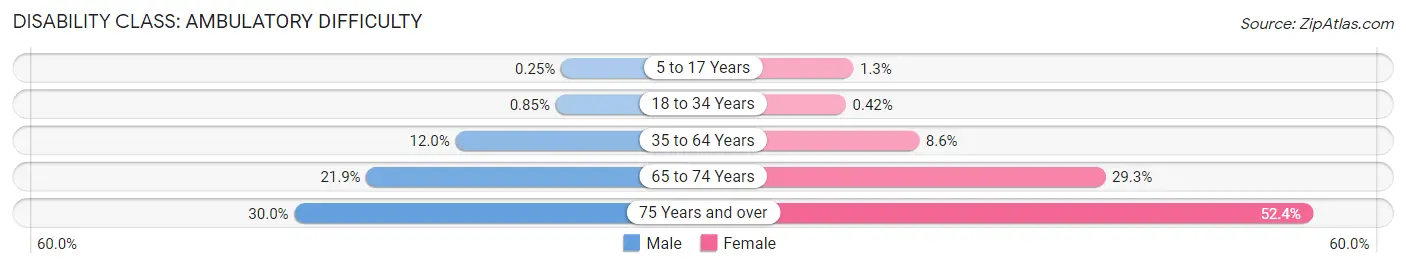
| Age Bracket | Male | Female |
| 5 to 17 Years | 13 (0.3%) | 65 (1.3%) |
| 18 to 34 Years | 50 (0.9%) | 19 (0.4%) |
| 35 to 64 Years | 817 (12.0%) | 633 (8.6%) |
| 65 to 74 Years | 332 (21.9%) | 534 (29.3%) |
| 75 Years and over | 301 (29.9%) | 914 (52.4%) |
Disability Class: Self-Care Difficulty
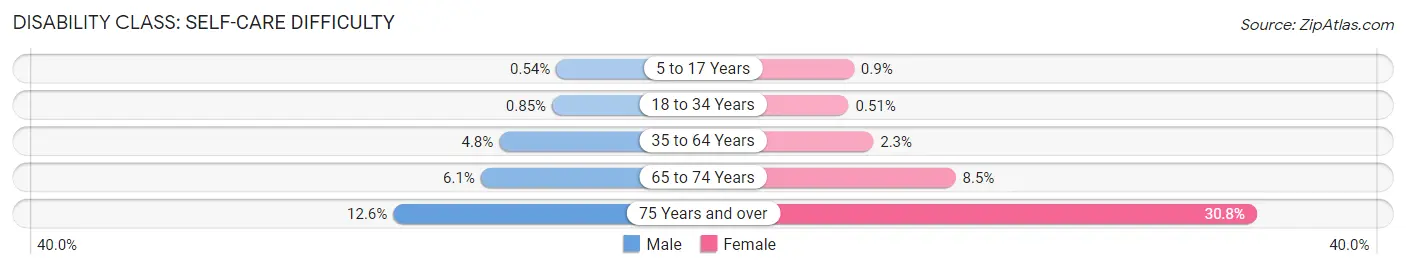
| Age Bracket | Male | Female |
| 5 to 17 Years | 28 (0.5%) | 47 (0.9%) |
| 18 to 34 Years | 50 (0.9%) | 23 (0.5%) |
| 35 to 64 Years | 325 (4.8%) | 173 (2.3%) |
| 65 to 74 Years | 93 (6.1%) | 154 (8.5%) |
| 75 Years and over | 127 (12.6%) | 537 (30.8%) |
Technology Access in El Centro
Computing Device Access in El Centro
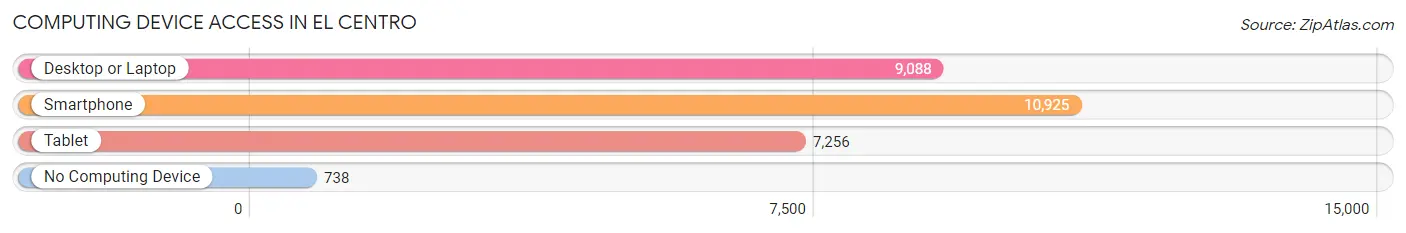
| Device Type | # Households | % Households |
| Desktop or Laptop | 9,088 | 74.3% |
| Smartphone | 10,925 | 89.4% |
| Tablet | 7,256 | 59.4% |
| No Computing Device | 738 | 6.0% |
| Total | 12,225 | 100.0% |
Internet Access in El Centro
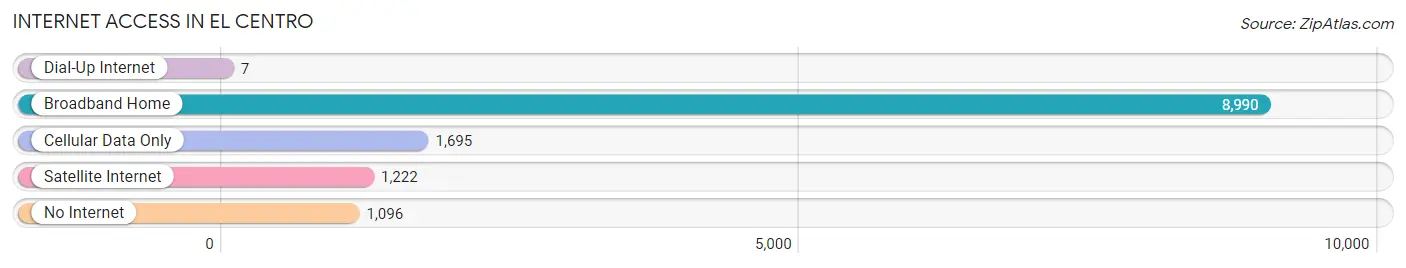
| Internet Type | # Households | % Households |
| Dial-Up Internet | 7 | 0.1% |
| Broadband Home | 8,990 | 73.5% |
| Cellular Data Only | 1,695 | 13.9% |
| Satellite Internet | 1,222 | 10.0% |
| No Internet | 1,096 | 9.0% |
| Total | 12,225 | 100.0% |
El Centro Summary
Centro, California is a city located in Imperial County, California. It is the largest city in the county and is the county seat. The city is located in the Imperial Valley, which is a large agricultural region in the southeastern corner of the state. The city is located along the banks of the New River, which is a tributary of the Colorado River.
History
Centro was founded in 1908 by the Southern Pacific Railroad. The city was named after the Spanish word for “center”, as it was intended to be the center of the Imperial Valley. The city was incorporated in 1910 and has since grown to become the largest city in Imperial County.
Geography
Centro is located in the Imperial Valley, which is a large agricultural region in the southeastern corner of California. The city is located along the banks of the New River, which is a tributary of the Colorado River. The city is located at an elevation of -53 feet, making it the lowest city in the United States. The city has a total area of 8.3 square miles, of which 8.2 square miles is land and 0.1 square miles is water.
Climate
Centro has a hot desert climate, with hot summers and mild winters. The average high temperature in the summer is around 100°F, while the average low temperature in the winter is around 50°F. The city receives an average of 4.5 inches of precipitation per year, with most of it falling in the winter months.
Economy
Centro’s economy is largely based on agriculture. The city is home to a large number of farms and ranches, which produce a variety of crops, including cotton, alfalfa, and vegetables. The city is also home to a number of food processing plants, which process the crops grown in the area. The city is also home to a number of manufacturing plants, which produce a variety of products, including furniture, clothing, and electronics.
Demographics
As of the 2010 census, Centro had a population of 37,835. The racial makeup of the city was 64.2% Hispanic or Latino, 28.2% White, 2.2% African American, 0.7% Native American, 0.4% Asian, 0.1% Pacific Islander, and 4.2% from other races. The median household income in the city was $30,945, and the median family income was $35,945.
Centro is a diverse city, with a large Hispanic population. The city is home to a number of cultural events, including the annual Cinco de Mayo celebration. The city is also home to a number of churches, including the Iglesia de Dios Pentecostal, which is the largest Pentecostal church in the city.
Conclusion
Centro, California is a city located in Imperial County, California. It is the largest city in the county and is the county seat. The city is located in the Imperial Valley, which is a large agricultural region in the southeastern corner of the state. The city is located along the banks of the New River, which is a tributary of the Colorado River. The city has a hot desert climate, with hot summers and mild winters. The city’s economy is largely based on agriculture, with a number of farms and ranches producing a variety of crops. The city is also home to a number of food processing plants and manufacturing plants. As of the 2010 census, Centro had a population of 37,835, with a large Hispanic population. The city is home to a number of cultural events, including the annual Cinco de Mayo celebration.
Common Questions
What is Per Capita Income in El Centro?
Per Capita income in El Centro is $22,039.
What is the Median Family Income in El Centro?
Median Family Income in El Centro is $56,657.
What is the Median Household income in El Centro?
Median Household Income in El Centro is $54,922.
What is Income or Wage Gap in El Centro?
Income or Wage Gap in El Centro is 33.8%.
Women in El Centro earn 66.2 cents for every dollar earned by a man.
What is Family Income Deficit in El Centro?
Family Income Deficit in El Centro is $11,235.
Families that are below poverty line in El Centro earn $11,235 less on average than the poverty threshold level.
What is Inequality or Gini Index in El Centro?
Inequality or Gini Index in El Centro is 0.45.
What is the Total Population of El Centro?
Total Population of El Centro is 44,184.
What is the Total Male Population of El Centro?
Total Male Population of El Centro is 22,117.
What is the Total Female Population of El Centro?
Total Female Population of El Centro is 22,067.
What is the Ratio of Males per 100 Females in El Centro?
There are 100.23 Males per 100 Females in El Centro.
What is the Ratio of Females per 100 Males in El Centro?
There are 99.77 Females per 100 Males in El Centro.
What is the Median Population Age in El Centro?
Median Population Age in El Centro is 32.2 Years.
What is the Average Family Size in El Centro
Average Family Size in El Centro is 4.1 People.
What is the Average Household Size in El Centro
Average Household Size in El Centro is 3.6 People.
How Large is the Labor Force in El Centro?
There are 18,638 People in the Labor Forcein in El Centro.
What is the Percentage of People in the Labor Force in El Centro?
58.0% of People are in the Labor Force in El Centro.
What is the Unemployment Rate in El Centro?
Unemployment Rate in El Centro is 10.2%.