Dixon, CA Map & Demographics
Dixon Map
Dixon Overview
$40,095
PER CAPITA INCOME
$94,405
AVG FAMILY INCOME
$92,138
AVG HOUSEHOLD INCOME
19.0%
WAGE / INCOME GAP [ % ]
81.0¢/ $1
WAGE / INCOME GAP [ $ ]
0.40
INEQUALITY / GINI INDEX
19,071
TOTAL POPULATION
9,622
MALE POPULATION
9,449
FEMALE POPULATION
101.83
MALES / 100 FEMALES
98.20
FEMALES / 100 MALES
33.5
MEDIAN AGE
3.3
AVG FAMILY SIZE
2.9
AVG HOUSEHOLD SIZE
10,474
LABOR FORCE [ PEOPLE ]
71.7%
PERCENT IN LABOR FORCE
3.2%
UNEMPLOYMENT RATE
Dixon Zip Codes
Income in Dixon
Income Overview in Dixon
Per Capita Income in Dixon is $40,095, while median incomes of families and households are $94,405 and $92,138 respectively.
| Characteristic | Number | Measure |
| Per Capita Income | 19,071 | $40,095 |
| Median Family Income | 4,999 | $94,405 |
| Mean Family Income | 4,999 | $122,491 |
| Median Household Income | 6,491 | $92,138 |
| Mean Household Income | 6,491 | $115,750 |
| Income Deficit | 4,999 | $0 |
| Wage / Income Gap (%) | 19,071 | 19.03% |
| Wage / Income Gap ($) | 19,071 | 80.97¢ per $1 |
| Gini / Inequality Index | 19,071 | 0.40 |
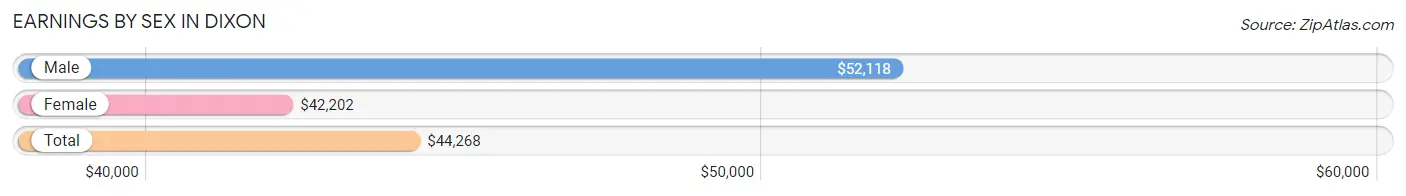
Earnings by Sex in Dixon
Average Earnings in Dixon are $44,268, $52,118 for men and $42,202 for women, a difference of 19.0%.
| Sex | Number | Average Earnings |
| Male | 6,050 (55.7%) | $52,118 |
| Female | 4,812 (44.3%) | $42,202 |
| Total | 10,862 (100.0%) | $44,268 |
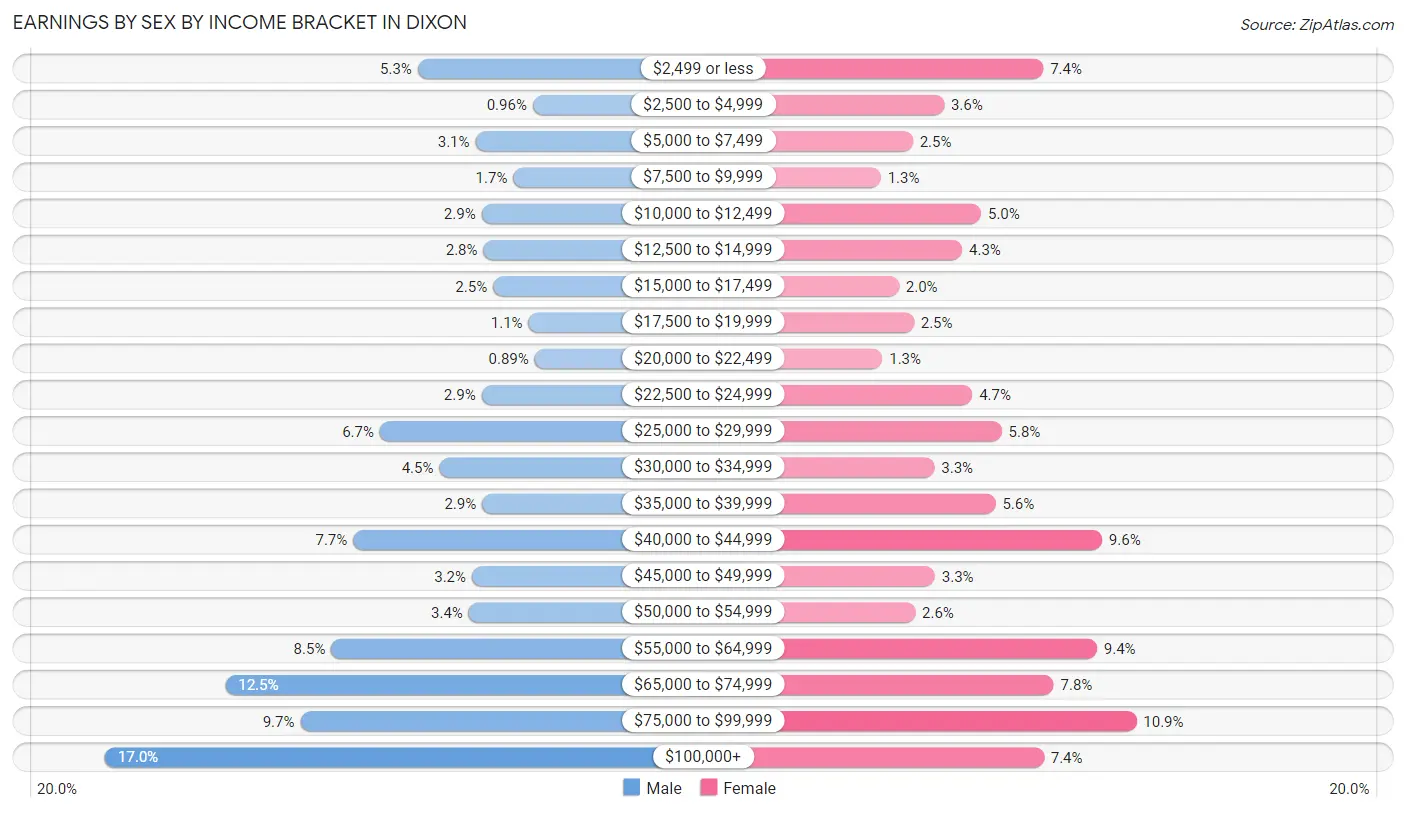
Earnings by Sex by Income Bracket in Dixon
The most common earnings brackets in Dixon are $100,000+ for men (1,028 | 17.0%) and $75,000 to $99,999 for women (522 | 10.8%).
| Income | Male | Female |
| $2,499 or less | 319 (5.3%) | 354 (7.4%) |
| $2,500 to $4,999 | 58 (1.0%) | 175 (3.6%) |
| $5,000 to $7,499 | 188 (3.1%) | 119 (2.5%) |
| $7,500 to $9,999 | 102 (1.7%) | 61 (1.3%) |
| $10,000 to $12,499 | 174 (2.9%) | 242 (5.0%) |
| $12,500 to $14,999 | 170 (2.8%) | 208 (4.3%) |
| $15,000 to $17,499 | 148 (2.5%) | 94 (1.9%) |
| $17,500 to $19,999 | 68 (1.1%) | 121 (2.5%) |
| $20,000 to $22,499 | 54 (0.9%) | 64 (1.3%) |
| $22,500 to $24,999 | 174 (2.9%) | 226 (4.7%) |
| $25,000 to $29,999 | 405 (6.7%) | 279 (5.8%) |
| $30,000 to $34,999 | 270 (4.5%) | 158 (3.3%) |
| $35,000 to $39,999 | 173 (2.9%) | 268 (5.6%) |
| $40,000 to $44,999 | 465 (7.7%) | 460 (9.6%) |
| $45,000 to $49,999 | 196 (3.2%) | 159 (3.3%) |
| $50,000 to $54,999 | 203 (3.4%) | 123 (2.6%) |
| $55,000 to $64,999 | 515 (8.5%) | 451 (9.4%) |
| $65,000 to $74,999 | 755 (12.5%) | 373 (7.7%) |
| $75,000 to $99,999 | 585 (9.7%) | 522 (10.8%) |
| $100,000+ | 1,028 (17.0%) | 355 (7.4%) |
| Total | 6,050 (100.0%) | 4,812 (100.0%) |
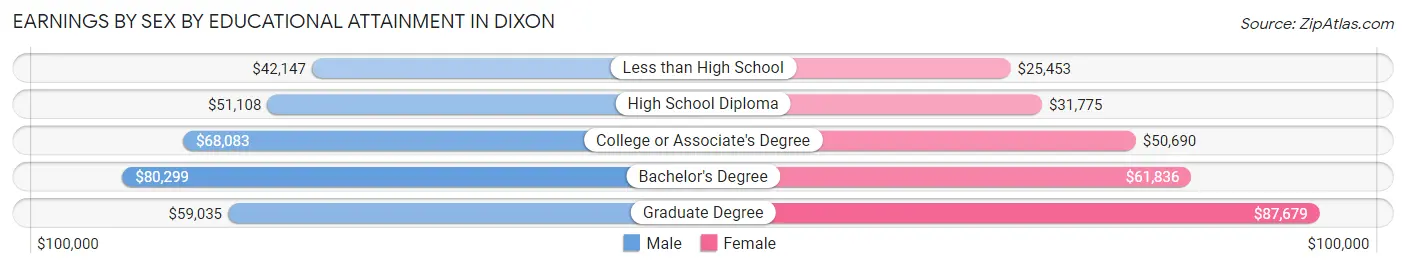
Earnings by Sex by Educational Attainment in Dixon
Average earnings in Dixon are $61,940 for men and $44,825 for women, a difference of 27.6%. Men with an educational attainment of bachelor's degree enjoy the highest average annual earnings of $80,299, while those with less than high school education earn the least with $42,147. Women with an educational attainment of graduate degree earn the most with the average annual earnings of $87,679, while those with less than high school education have the smallest earnings of $25,453.
| Educational Attainment | Male Income | Female Income |
| Less than High School | $42,147 | $25,453 |
| High School Diploma | $51,108 | $31,775 |
| College or Associate's Degree | $68,083 | $50,690 |
| Bachelor's Degree | $80,299 | $61,836 |
| Graduate Degree | $59,035 | $87,679 |
| Total | $61,940 | $44,825 |
Family Income in Dixon
Family Income Brackets in Dixon
According to the Dixon family income data, there are 1,165 families falling into the $100,000 to $149,999 income range, which is the most common income bracket and makes up 23.3% of all families. Conversely, the $15,000 to $24,999 income bracket is the least frequent group with only 25 families (0.5%) belonging to this category.
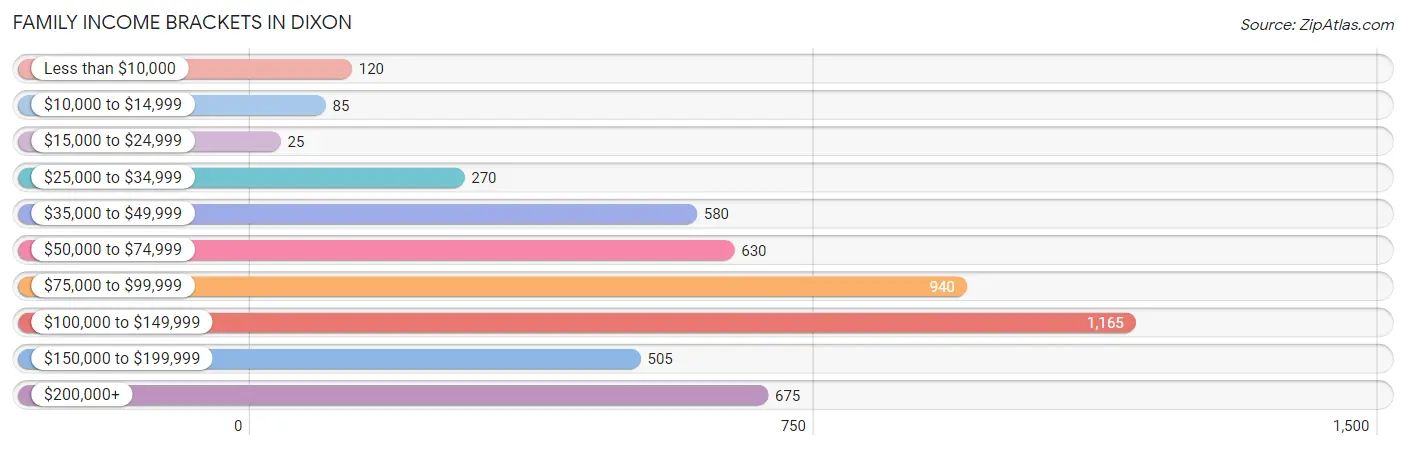
| Income Bracket | # Families | % Families |
| Less than $10,000 | 120 | 2.4% |
| $10,000 to $14,999 | 85 | 1.7% |
| $15,000 to $24,999 | 25 | 0.5% |
| $25,000 to $34,999 | 270 | 5.4% |
| $35,000 to $49,999 | 580 | 11.6% |
| $50,000 to $74,999 | 630 | 12.6% |
| $75,000 to $99,999 | 940 | 18.8% |
| $100,000 to $149,999 | 1,165 | 23.3% |
| $150,000 to $199,999 | 505 | 10.1% |
| $200,000+ | 675 | 13.5% |
Family Income by Famaliy Size in Dixon
6-person families (169 | 3.4%) account for the highest median family income in Dixon with $180,048 per family, while 2-person families (1,763 | 35.3%) have the highest median income of $44,590 per family member.
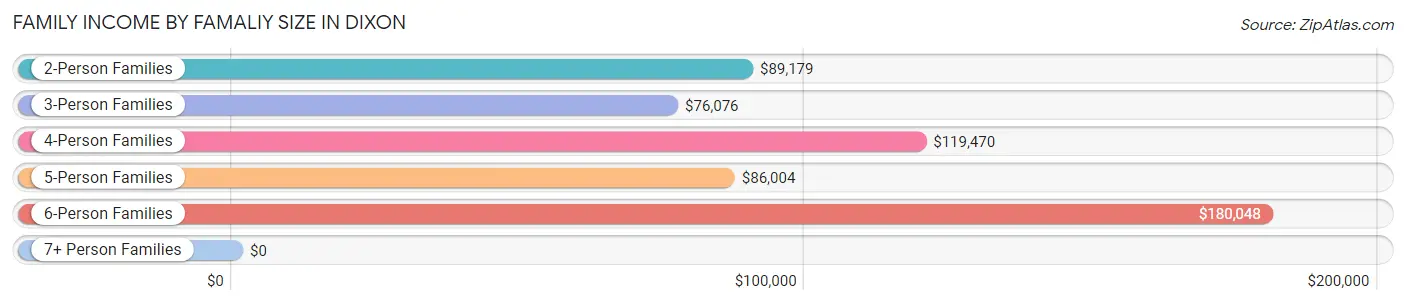
| Income Bracket | # Families | Median Income |
| 2-Person Families | 1,763 (35.3%) | $89,179 |
| 3-Person Families | 1,250 (25.0%) | $76,076 |
| 4-Person Families | 1,216 (24.3%) | $119,470 |
| 5-Person Families | 581 (11.6%) | $86,004 |
| 6-Person Families | 169 (3.4%) | $180,048 |
| 7+ Person Families | 20 (0.4%) | $0 |
| Total | 4,999 (100.0%) | $94,405 |
Family Income by Number of Earners in Dixon
The median family income in Dixon is $94,405, with families comprising 2 earners (1,877) having the highest median family income of $123,750, while families with no earners (418) have the lowest median family income of $36,354, accounting for 37.6% and 8.4% of families, respectively.
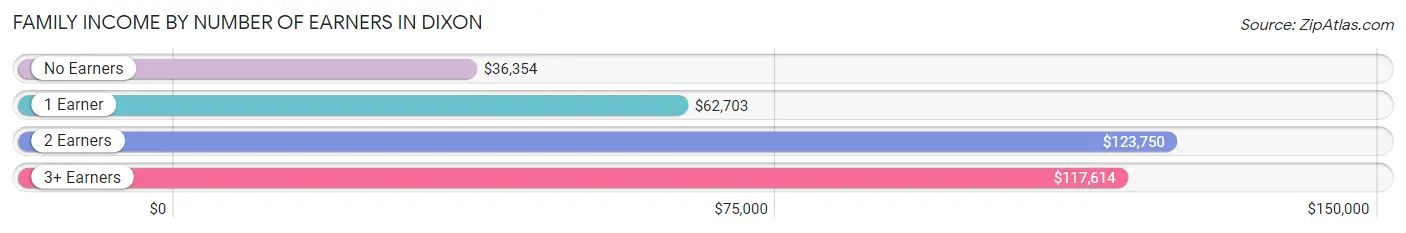
| Number of Earners | # Families | Median Income |
| No Earners | 418 (8.4%) | $36,354 |
| 1 Earner | 1,683 (33.7%) | $62,703 |
| 2 Earners | 1,877 (37.6%) | $123,750 |
| 3+ Earners | 1,021 (20.4%) | $117,614 |
| Total | 4,999 (100.0%) | $94,405 |
Household Income in Dixon
Household Income Brackets in Dixon
With 1,532 households falling in the category, the $100,000 to $149,999 income range is the most frequent in Dixon, accounting for 23.6% of all households. In contrast, only 78 households (1.2%) fall into the $15,000 to $24,999 income bracket, making it the least populous group.
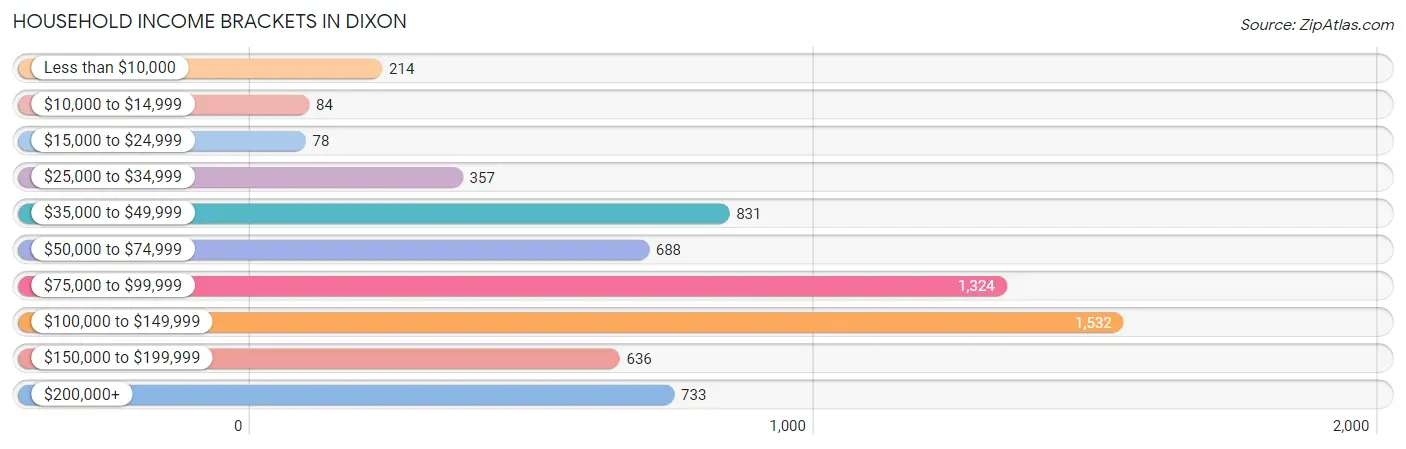
| Income Bracket | # Households | % Households |
| Less than $10,000 | 214 | 3.3% |
| $10,000 to $14,999 | 84 | 1.3% |
| $15,000 to $24,999 | 78 | 1.2% |
| $25,000 to $34,999 | 357 | 5.5% |
| $35,000 to $49,999 | 831 | 12.8% |
| $50,000 to $74,999 | 688 | 10.6% |
| $75,000 to $99,999 | 1,324 | 20.4% |
| $100,000 to $149,999 | 1,532 | 23.6% |
| $150,000 to $199,999 | 636 | 9.8% |
| $200,000+ | 733 | 11.3% |
Household Income by Householder Age in Dixon
The median household income in Dixon is $92,138, with the highest median household income of $106,644 found in the 45 to 64 years age bracket for the primary householder. A total of 2,447 households (37.7%) fall into this category. Meanwhile, the 15 to 24 years age bracket for the primary householder has the lowest median household income of $0, with 33 households (0.5%) in this group.
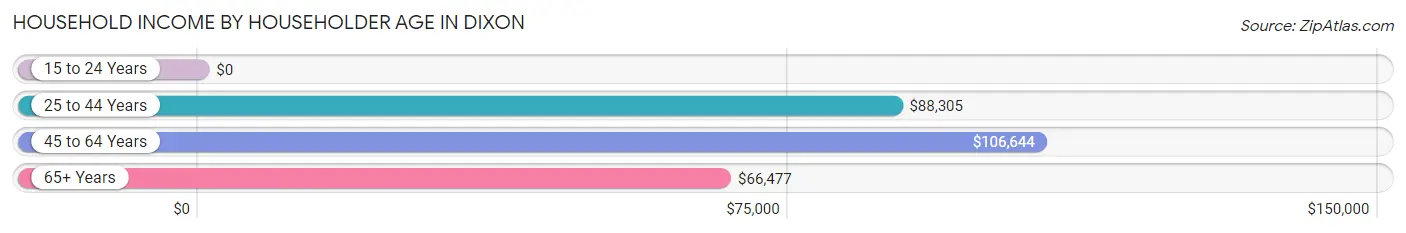
| Income Bracket | # Households | Median Income |
| 15 to 24 Years | 33 (0.5%) | $0 |
| 25 to 44 Years | 2,625 (40.4%) | $88,305 |
| 45 to 64 Years | 2,447 (37.7%) | $106,644 |
| 65+ Years | 1,386 (21.3%) | $66,477 |
| Total | 6,491 (100.0%) | $92,138 |
Poverty in Dixon
Income Below Poverty by Sex and Age in Dixon
With 6.2% poverty level for males and 8.1% for females among the residents of Dixon, 5 year old males and 25 to 34 year old females are the most vulnerable to poverty, with 28 males (71.8%) and 236 females (15.8%) in their respective age groups living below the poverty level.
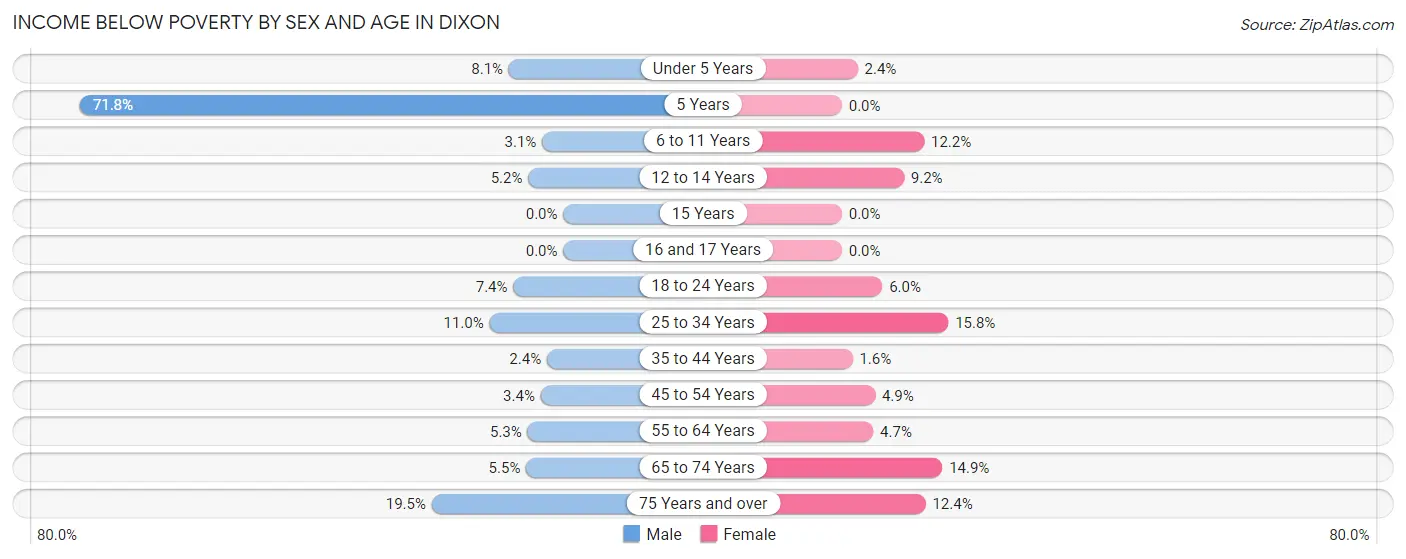
| Age Bracket | Male | Female |
| Under 5 Years | 54 (8.1%) | 12 (2.4%) |
| 5 Years | 28 (71.8%) | 0 (0.0%) |
| 6 to 11 Years | 31 (3.1%) | 121 (12.2%) |
| 12 to 14 Years | 28 (5.2%) | 36 (9.2%) |
| 15 Years | 0 (0.0%) | 0 (0.0%) |
| 16 and 17 Years | 0 (0.0%) | 0 (0.0%) |
| 18 to 24 Years | 72 (7.4%) | 62 (6.0%) |
| 25 to 34 Years | 161 (11.0%) | 236 (15.8%) |
| 35 to 44 Years | 30 (2.4%) | 18 (1.6%) |
| 45 to 54 Years | 43 (3.4%) | 54 (4.9%) |
| 55 to 64 Years | 46 (5.3%) | 53 (4.7%) |
| 65 to 74 Years | 47 (5.5%) | 103 (14.9%) |
| 75 Years and over | 59 (19.5%) | 68 (12.4%) |
| Total | 599 (6.2%) | 763 (8.1%) |
Income Above Poverty by Sex and Age in Dixon
According to the poverty statistics in Dixon, males aged 15 years and females aged 5 years are the age groups that are most secure financially, with 100.0% of males and 100.0% of females in these age groups living above the poverty line.
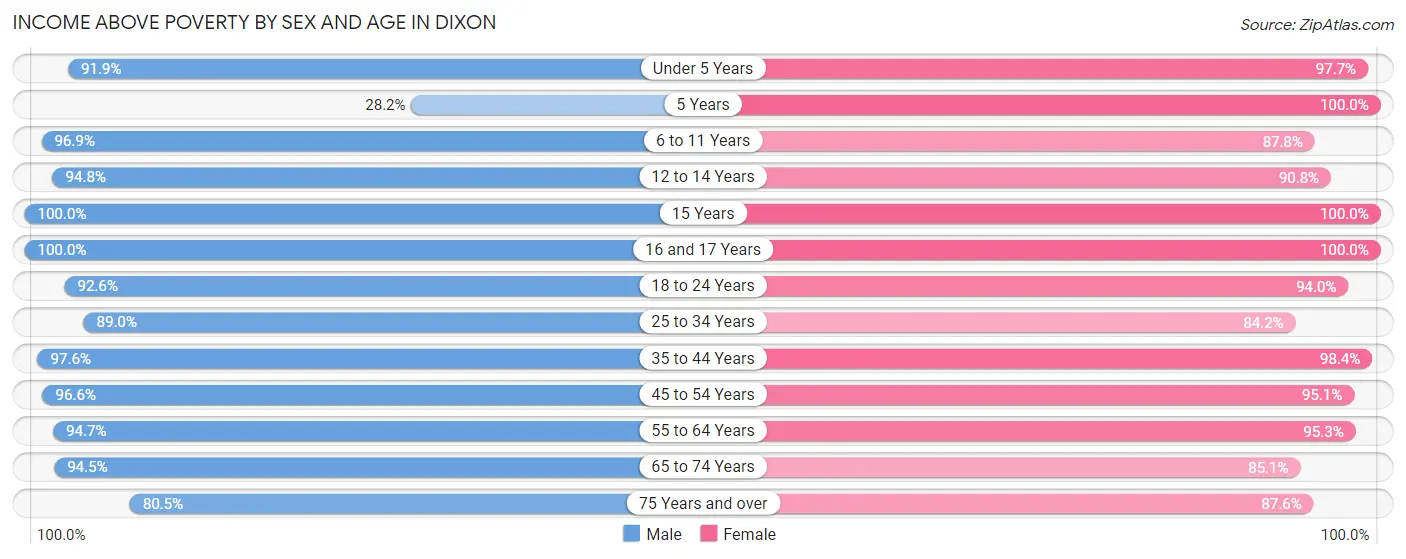
| Age Bracket | Male | Female |
| Under 5 Years | 614 (91.9%) | 498 (97.7%) |
| 5 Years | 11 (28.2%) | 44 (100.0%) |
| 6 to 11 Years | 955 (96.9%) | 870 (87.8%) |
| 12 to 14 Years | 509 (94.8%) | 355 (90.8%) |
| 15 Years | 115 (100.0%) | 156 (100.0%) |
| 16 and 17 Years | 278 (100.0%) | 216 (100.0%) |
| 18 to 24 Years | 899 (92.6%) | 972 (94.0%) |
| 25 to 34 Years | 1,308 (89.0%) | 1,258 (84.2%) |
| 35 to 44 Years | 1,203 (97.6%) | 1,124 (98.4%) |
| 45 to 54 Years | 1,236 (96.6%) | 1,041 (95.1%) |
| 55 to 64 Years | 820 (94.7%) | 1,085 (95.3%) |
| 65 to 74 Years | 806 (94.5%) | 588 (85.1%) |
| 75 Years and over | 243 (80.5%) | 479 (87.6%) |
| Total | 8,997 (93.8%) | 8,686 (91.9%) |
Income Below Poverty Among Married-Couple Families in Dixon
The poverty statistics for married-couple families in Dixon show that 2.8% or 96 of the total 3,480 families live below the poverty line. Families with 3 or 4 children have the highest poverty rate of 6.5%, comprising of 29 families. On the other hand, families with 1 or 2 children have the lowest poverty rate of 0.9%, which includes 13 families.
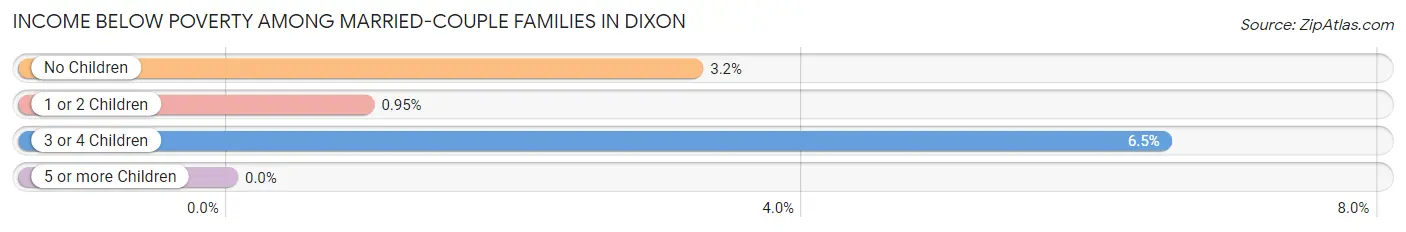
| Children | Above Poverty | Below Poverty |
| No Children | 1,615 (96.8%) | 54 (3.2%) |
| 1 or 2 Children | 1,352 (99.1%) | 13 (0.9%) |
| 3 or 4 Children | 417 (93.5%) | 29 (6.5%) |
| 5 or more Children | 0 (0.0%) | 0 (0.0%) |
| Total | 3,384 (97.2%) | 96 (2.8%) |
Income Below Poverty Among Single-Parent Households in Dixon
According to the poverty data in Dixon, 14.6% or 54 single-father households and 10.2% or 117 single-mother households are living below the poverty line. Among single-father households, those with no children have the highest poverty rate, with 54 households (25.6%) experiencing poverty. Likewise, among single-mother households, those with 1 or 2 children have the highest poverty rate, with 117 households (14.7%) falling below the poverty line.
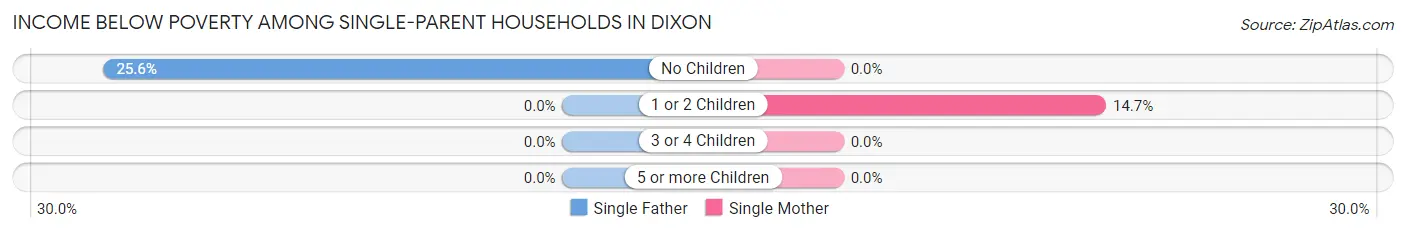
| Children | Single Father | Single Mother |
| No Children | 54 (25.6%) | 0 (0.0%) |
| 1 or 2 Children | 0 (0.0%) | 117 (14.7%) |
| 3 or 4 Children | 0 (0.0%) | 0 (0.0%) |
| 5 or more Children | 0 (0.0%) | 0 (0.0%) |
| Total | 54 (14.6%) | 117 (10.2%) |
Income Below Poverty Among Married-Couple vs Single-Parent Households in Dixon
The poverty data for Dixon shows that 96 of the married-couple family households (2.8%) and 171 of the single-parent households (11.3%) are living below the poverty level. Within the married-couple family households, those with 3 or 4 children have the highest poverty rate, with 29 households (6.5%) falling below the poverty line. Among the single-parent households, those with 1 or 2 children have the highest poverty rate, with 117 household (12.9%) living below poverty.
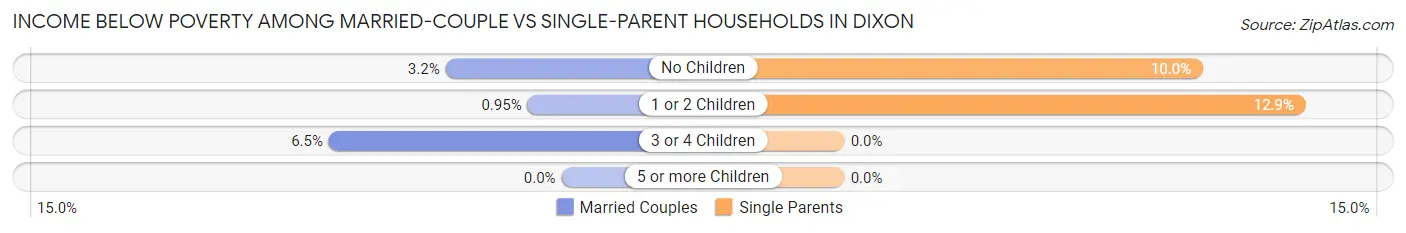
| Children | Married-Couple Families | Single-Parent Households |
| No Children | 54 (3.2%) | 54 (10.0%) |
| 1 or 2 Children | 13 (0.9%) | 117 (12.9%) |
| 3 or 4 Children | 29 (6.5%) | 0 (0.0%) |
| 5 or more Children | 0 (0.0%) | 0 (0.0%) |
| Total | 96 (2.8%) | 171 (11.3%) |
Race in Dixon
The most populous races in Dixon are White / Caucasian (12,314 | 64.6%), Hispanic or Latino (7,840 | 41.1%), and Some other Race (3,063 | 16.1%).
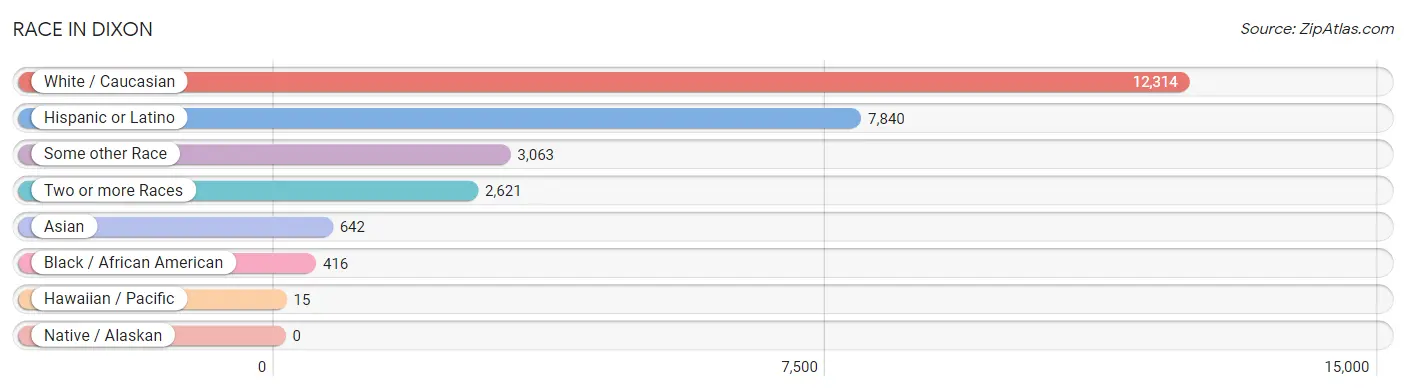
| Race | # Population | % Population |
| Asian | 642 | 3.4% |
| Black / African American | 416 | 2.2% |
| Hawaiian / Pacific | 15 | 0.1% |
| Hispanic or Latino | 7,840 | 41.1% |
| Native / Alaskan | 0 | 0.0% |
| White / Caucasian | 12,314 | 64.6% |
| Two or more Races | 2,621 | 13.7% |
| Some other Race | 3,063 | 16.1% |
| Total | 19,071 | 100.0% |
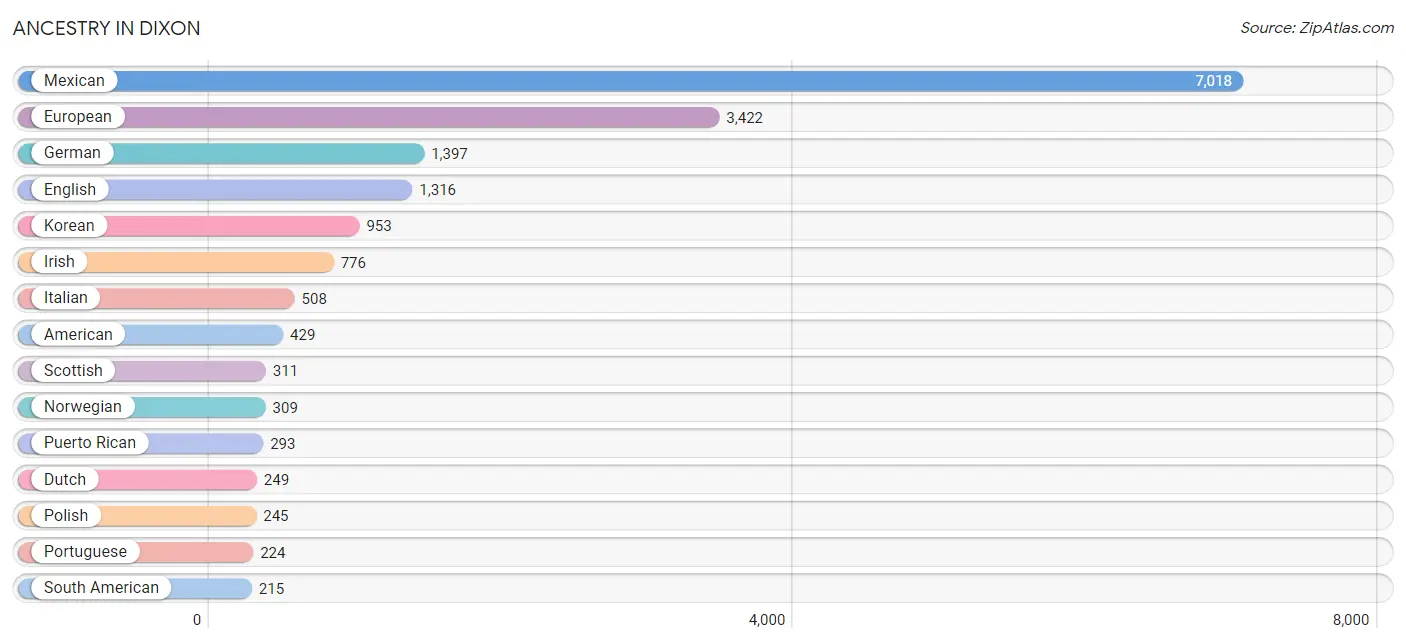
Ancestry in Dixon
The most populous ancestries reported in Dixon are Mexican (7,018 | 36.8%), European (3,422 | 17.9%), German (1,397 | 7.3%), English (1,316 | 6.9%), and Korean (953 | 5.0%), together accounting for 74.0% of all Dixon residents.
| Ancestry | # Population | % Population |
| Afghan | 15 | 0.1% |
| American | 429 | 2.2% |
| Arab | 83 | 0.4% |
| Armenian | 12 | 0.1% |
| Austrian | 54 | 0.3% |
| Basque | 30 | 0.2% |
| Bhutanese | 135 | 0.7% |
| Blackfeet | 63 | 0.3% |
| British | 143 | 0.7% |
| Burmese | 34 | 0.2% |
| Central American | 37 | 0.2% |
| Cherokee | 3 | 0.0% |
| Chickasaw | 16 | 0.1% |
| Chilean | 170 | 0.9% |
| Choctaw | 24 | 0.1% |
| Czech | 27 | 0.1% |
| Danish | 17 | 0.1% |
| Delaware | 13 | 0.1% |
| Dutch | 249 | 1.3% |
| Eastern European | 11 | 0.1% |
| English | 1,316 | 6.9% |
| European | 3,422 | 17.9% |
| Finnish | 16 | 0.1% |
| French | 147 | 0.8% |
| French Canadian | 120 | 0.6% |
| German | 1,397 | 7.3% |
| Greek | 15 | 0.1% |
| Guamanian / Chamorro | 22 | 0.1% |
| Guatemalan | 14 | 0.1% |
| Hungarian | 33 | 0.2% |
| Indian (Asian) | 189 | 1.0% |
| Inupiat | 21 | 0.1% |
| Iranian | 9 | 0.1% |
| Irish | 776 | 4.1% |
| Italian | 508 | 2.7% |
| Korean | 953 | 5.0% |
| Lithuanian | 20 | 0.1% |
| Maltese | 15 | 0.1% |
| Mexican | 7,018 | 36.8% |
| Mexican American Indian | 13 | 0.1% |
| Native Hawaiian | 109 | 0.6% |
| Nicaraguan | 23 | 0.1% |
| Northern European | 26 | 0.1% |
| Norwegian | 309 | 1.6% |
| Pennsylvania German | 19 | 0.1% |
| Peruvian | 45 | 0.2% |
| Polish | 245 | 1.3% |
| Portuguese | 224 | 1.2% |
| Puerto Rican | 293 | 1.5% |
| Russian | 58 | 0.3% |
| Scandinavian | 45 | 0.2% |
| Scotch-Irish | 54 | 0.3% |
| Scottish | 311 | 1.6% |
| Serbian | 10 | 0.1% |
| Slavic | 21 | 0.1% |
| South American | 215 | 1.1% |
| Spaniard | 113 | 0.6% |
| Spanish | 117 | 0.6% |
| Sri Lankan | 170 | 0.9% |
| Swedish | 178 | 0.9% |
| Swiss | 60 | 0.3% |
| Syrian | 20 | 0.1% |
| Thai | 152 | 0.8% |
| Tongan | 3 | 0.0% |
| Ukrainian | 22 | 0.1% |
| Welsh | 100 | 0.5% |
| Yugoslavian | 7 | 0.0% |
| Yuman | 3 | 0.0% | View All 68 Rows |
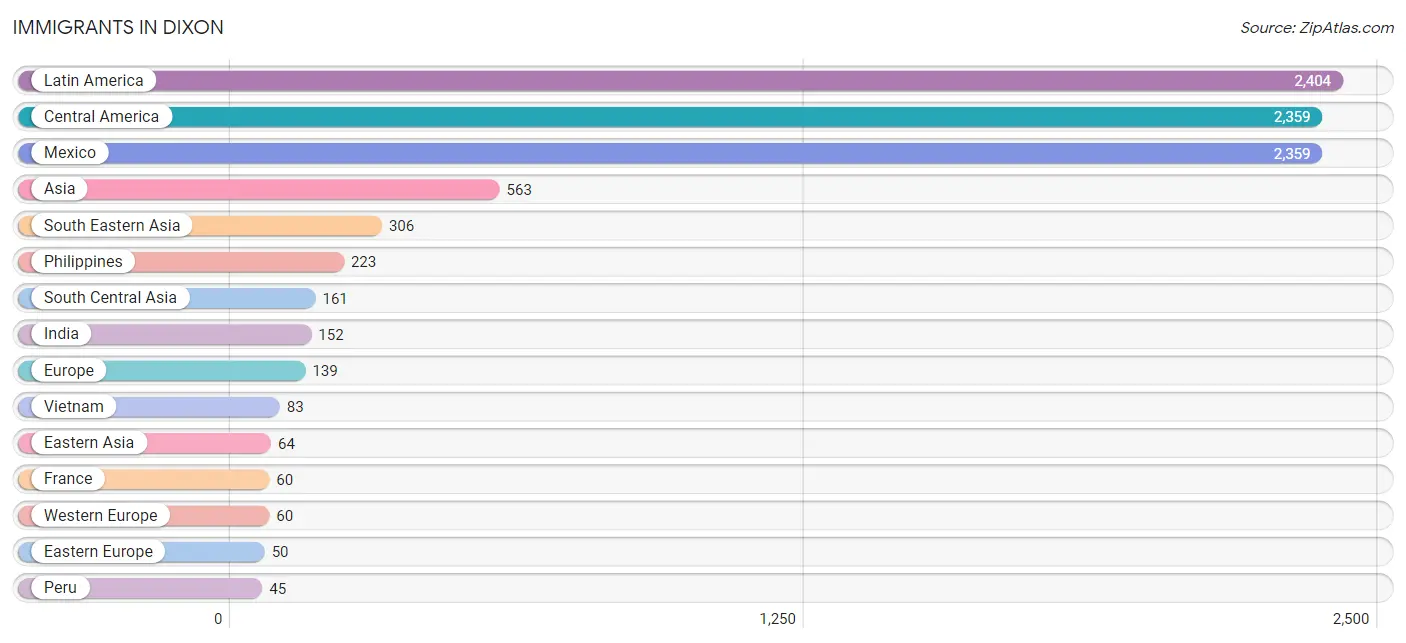
Immigrants in Dixon
The most numerous immigrant groups reported in Dixon came from Latin America (2,404 | 12.6%), Central America (2,359 | 12.4%), Mexico (2,359 | 12.4%), Asia (563 | 2.9%), and South Eastern Asia (306 | 1.6%), together accounting for 41.9% of all Dixon residents.
| Immigration Origin | # Population | % Population |
| Asia | 563 | 2.9% |
| Central America | 2,359 | 12.4% |
| China | 14 | 0.1% |
| Eastern Asia | 64 | 0.3% |
| Eastern Europe | 50 | 0.3% |
| Europe | 139 | 0.7% |
| France | 60 | 0.3% |
| Hong Kong | 7 | 0.0% |
| India | 152 | 0.8% |
| Iran | 9 | 0.1% |
| Japan | 32 | 0.2% |
| Korea | 18 | 0.1% |
| Latin America | 2,404 | 12.6% |
| Mexico | 2,359 | 12.4% |
| Northern Europe | 29 | 0.2% |
| Oceania | 3 | 0.0% |
| Peru | 45 | 0.2% |
| Philippines | 223 | 1.2% |
| Poland | 28 | 0.2% |
| South America | 45 | 0.2% |
| South Central Asia | 161 | 0.8% |
| South Eastern Asia | 306 | 1.6% |
| Ukraine | 22 | 0.1% |
| Vietnam | 83 | 0.4% |
| Western Europe | 60 | 0.3% | View All 25 Rows |
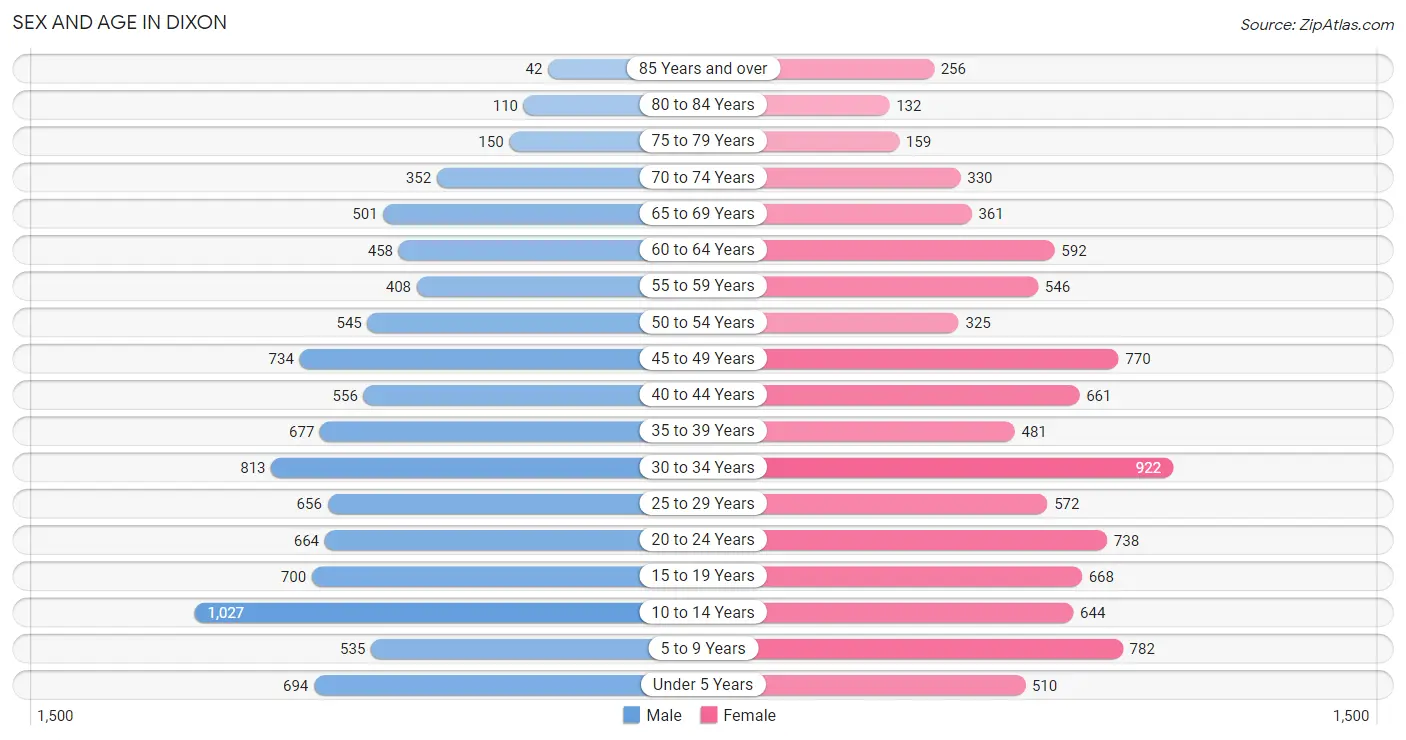
Sex and Age in Dixon
Sex and Age in Dixon
The most populous age groups in Dixon are 10 to 14 Years (1,027 | 10.7%) for men and 30 to 34 Years (922 | 9.8%) for women.
| Age Bracket | Male | Female |
| Under 5 Years | 694 (7.2%) | 510 (5.4%) |
| 5 to 9 Years | 535 (5.6%) | 782 (8.3%) |
| 10 to 14 Years | 1,027 (10.7%) | 644 (6.8%) |
| 15 to 19 Years | 700 (7.3%) | 668 (7.1%) |
| 20 to 24 Years | 664 (6.9%) | 738 (7.8%) |
| 25 to 29 Years | 656 (6.8%) | 572 (6.0%) |
| 30 to 34 Years | 813 (8.5%) | 922 (9.8%) |
| 35 to 39 Years | 677 (7.0%) | 481 (5.1%) |
| 40 to 44 Years | 556 (5.8%) | 661 (7.0%) |
| 45 to 49 Years | 734 (7.6%) | 770 (8.2%) |
| 50 to 54 Years | 545 (5.7%) | 325 (3.4%) |
| 55 to 59 Years | 408 (4.2%) | 546 (5.8%) |
| 60 to 64 Years | 458 (4.8%) | 592 (6.3%) |
| 65 to 69 Years | 501 (5.2%) | 361 (3.8%) |
| 70 to 74 Years | 352 (3.7%) | 330 (3.5%) |
| 75 to 79 Years | 150 (1.6%) | 159 (1.7%) |
| 80 to 84 Years | 110 (1.1%) | 132 (1.4%) |
| 85 Years and over | 42 (0.4%) | 256 (2.7%) |
| Total | 9,622 (100.0%) | 9,449 (100.0%) |
Families and Households in Dixon
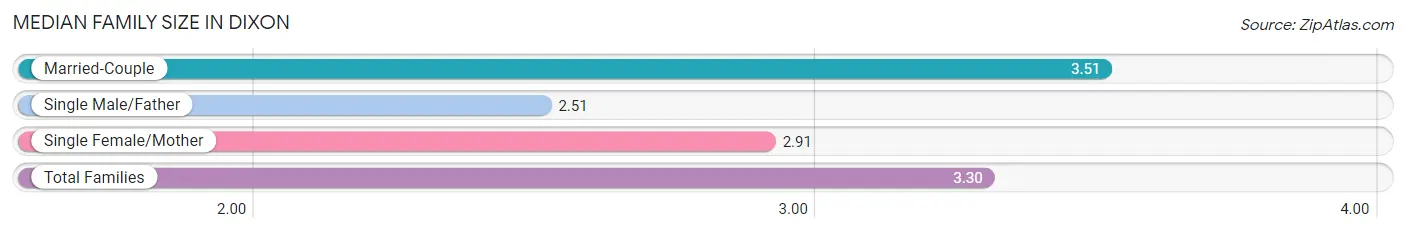
Median Family Size in Dixon
The median family size in Dixon is 3.30 persons per family, with married-couple families (3,480 | 69.6%) accounting for the largest median family size of 3.51 persons per family. On the other hand, single male/father families (370 | 7.4%) represent the smallest median family size with 2.51 persons per family.
| Family Type | # Families | Family Size |
| Married-Couple | 3,480 (69.6%) | 3.51 |
| Single Male/Father | 370 (7.4%) | 2.51 |
| Single Female/Mother | 1,149 (23.0%) | 2.91 |
| Total Families | 4,999 (100.0%) | 3.30 |
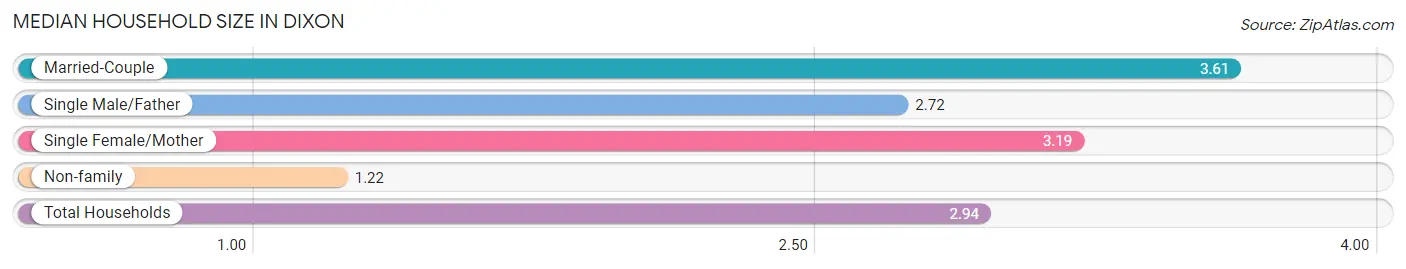
Median Household Size in Dixon
The median household size in Dixon is 2.94 persons per household, with married-couple households (3,480 | 53.6%) accounting for the largest median household size of 3.61 persons per household. non-family households (1,492 | 23.0%) represent the smallest median household size with 1.22 persons per household.
| Household Type | # Households | Household Size |
| Married-Couple | 3,480 (53.6%) | 3.61 |
| Single Male/Father | 370 (5.7%) | 2.72 |
| Single Female/Mother | 1,149 (17.7%) | 3.19 |
| Non-family | 1,492 (23.0%) | 1.22 |
| Total Households | 6,491 (100.0%) | 2.94 |
Household Size by Marriage Status in Dixon
Out of a total of 6,491 households in Dixon, 4,999 (77.0%) are family households, while 1,492 (23.0%) are nonfamily households. The most numerous type of family households are 2-person households, comprising 1,621, and the most common type of nonfamily households are 1-person households, comprising 1,302.
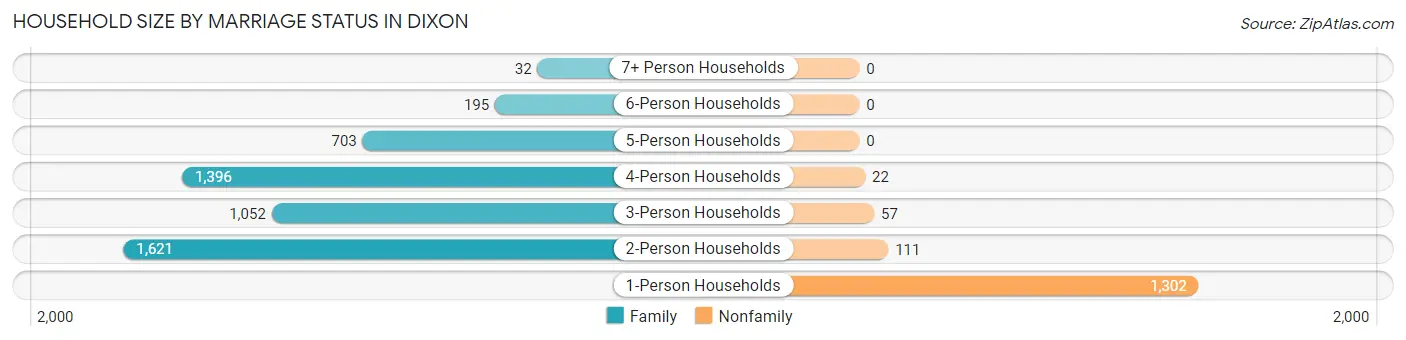
| Household Size | Family Households | Nonfamily Households |
| 1-Person Households | - | 1,302 (20.1%) |
| 2-Person Households | 1,621 (25.0%) | 111 (1.7%) |
| 3-Person Households | 1,052 (16.2%) | 57 (0.9%) |
| 4-Person Households | 1,396 (21.5%) | 22 (0.3%) |
| 5-Person Households | 703 (10.8%) | 0 (0.0%) |
| 6-Person Households | 195 (3.0%) | 0 (0.0%) |
| 7+ Person Households | 32 (0.5%) | 0 (0.0%) |
| Total | 4,999 (77.0%) | 1,492 (23.0%) |
Female Fertility in Dixon
Fertility by Age in Dixon
Average fertility rate in Dixon is 57.0 births per 1,000 women. Women in the age bracket of 20 to 34 years have the highest fertility rate with 119.0 births per 1,000 women. Women in the age bracket of 20 to 34 years acount for 95.7% of all women with births.
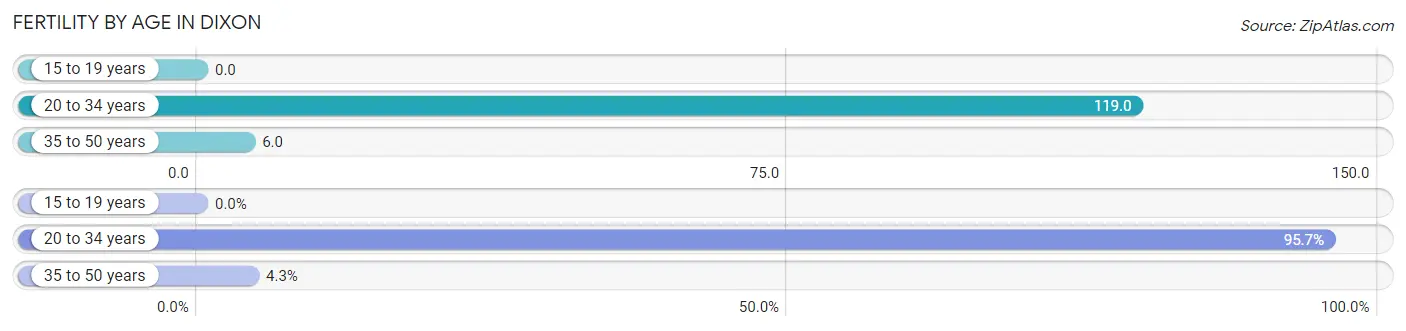
| Age Bracket | Women with Births | Births / 1,000 Women |
| 15 to 19 years | 0 (0.0%) | 0.0 |
| 20 to 34 years | 265 (95.7%) | 119.0 |
| 35 to 50 years | 12 (4.3%) | 6.0 |
| Total | 277 (100.0%) | 57.0 |
Fertility by Age by Marriage Status in Dixon
69.0% of women with births (277) in Dixon are married. The highest percentage of unmarried women with births falls into 20 to 34 years age bracket with 32.5% of them unmarried at the time of birth, while the lowest percentage of unmarried women with births belong to 35 to 50 years age bracket with 0.0% of them unmarried.
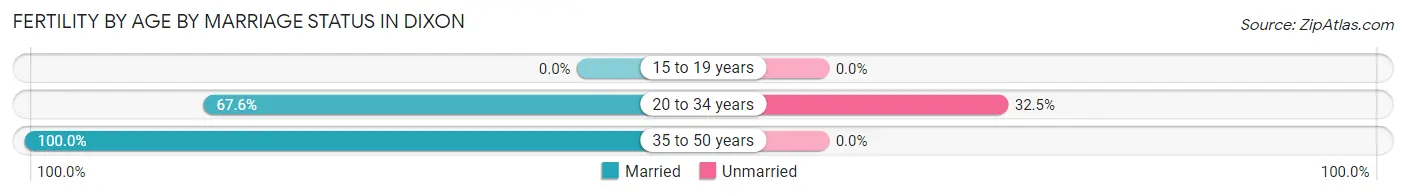
| Age Bracket | Married | Unmarried |
| 15 to 19 years | 0 (0.0%) | 0 (0.0%) |
| 20 to 34 years | 179 (67.5%) | 86 (32.5%) |
| 35 to 50 years | 12 (100.0%) | 0 (0.0%) |
| Total | 191 (69.0%) | 86 (31.0%) |
Fertility by Education in Dixon
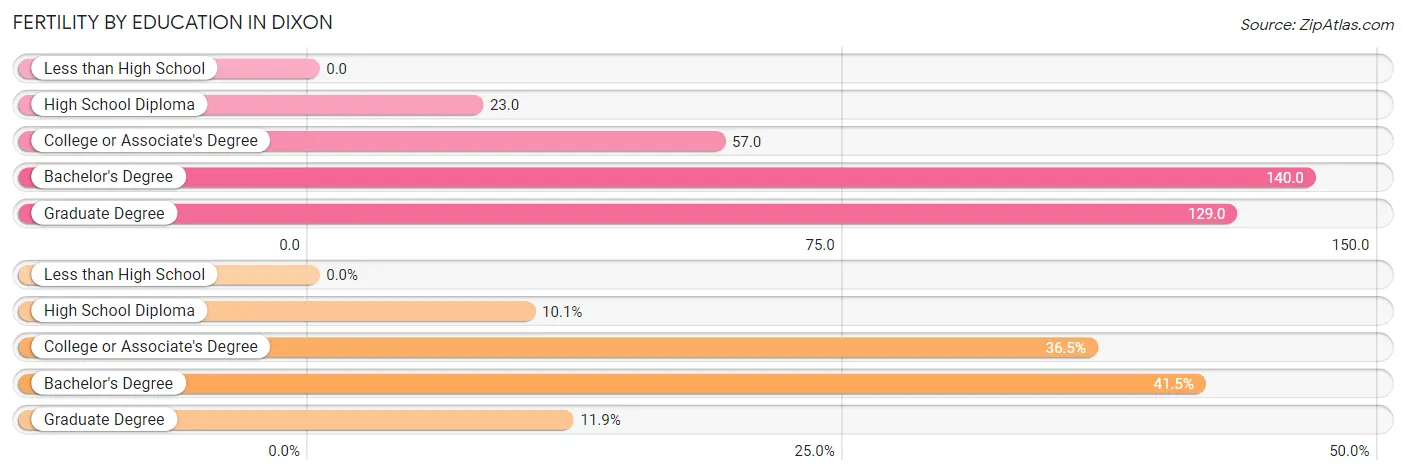
| Educational Attainment | Women with Births | Births / 1,000 Women |
| Less than High School | 0 (0.0%) | 0.0 |
| High School Diploma | 28 (10.1%) | 23.0 |
| College or Associate's Degree | 101 (36.5%) | 57.0 |
| Bachelor's Degree | 115 (41.5%) | 140.0 |
| Graduate Degree | 33 (11.9%) | 129.0 |
| Total | 277 (100.0%) | 57.0 |
Fertility by Education by Marriage Status in Dixon
31.0% of women with births in Dixon are unmarried. Women with the educational attainment of high school diploma are most likely to be married with 100.0% of them married at childbirth, while women with the educational attainment of college or associate's degree are least likely to be married with 85.2% of them unmarried at childbirth.
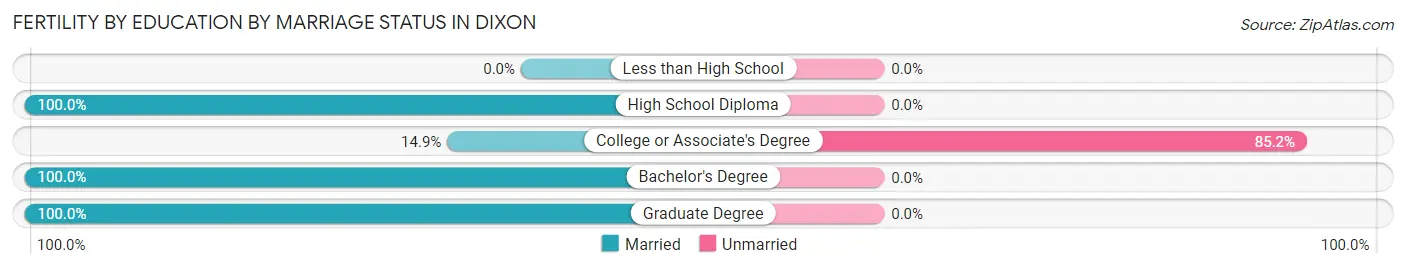
| Educational Attainment | Married | Unmarried |
| Less than High School | 0 (0.0%) | 0 (0.0%) |
| High School Diploma | 28 (100.0%) | 0 (0.0%) |
| College or Associate's Degree | 15 (14.8%) | 86 (85.2%) |
| Bachelor's Degree | 115 (100.0%) | 0 (0.0%) |
| Graduate Degree | 33 (100.0%) | 0 (0.0%) |
| Total | 191 (69.0%) | 86 (31.0%) |
Employment Characteristics in Dixon
Employment by Class of Employer in Dixon
Among the 10,029 employed individuals in Dixon, private company employees (6,704 | 66.8%), local government employees (1,005 | 10.0%), and state government employees (657 | 6.6%) make up the most common classes of employment.
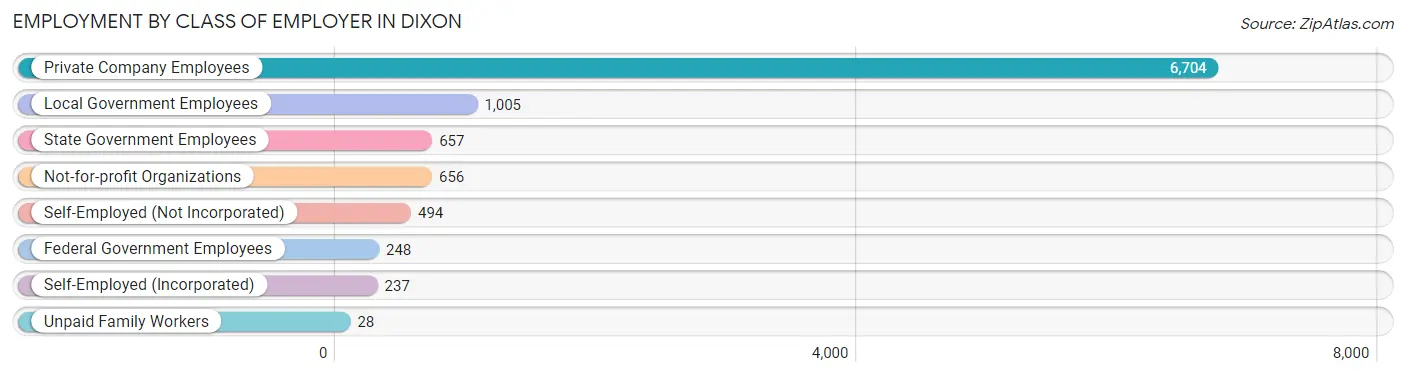
| Employer Class | # Employees | % Employees |
| Private Company Employees | 6,704 | 66.8% |
| Self-Employed (Incorporated) | 237 | 2.4% |
| Self-Employed (Not Incorporated) | 494 | 4.9% |
| Not-for-profit Organizations | 656 | 6.5% |
| Local Government Employees | 1,005 | 10.0% |
| State Government Employees | 657 | 6.6% |
| Federal Government Employees | 248 | 2.5% |
| Unpaid Family Workers | 28 | 0.3% |
| Total | 10,029 | 100.0% |
Employment Status by Age in Dixon
According to the labor force statistics for Dixon, out of the total population over 16 years of age (14,608), 71.7% or 10,474 individuals are in the labor force, with 3.2% or 335 of them unemployed. The age group with the highest labor force participation rate is 45 to 54 years, with 93.0% or 2,208 individuals in the labor force. Within the labor force, the 30 to 34 years age range has the highest percentage of unemployed individuals, with 8.3% or 109 of them being unemployed.
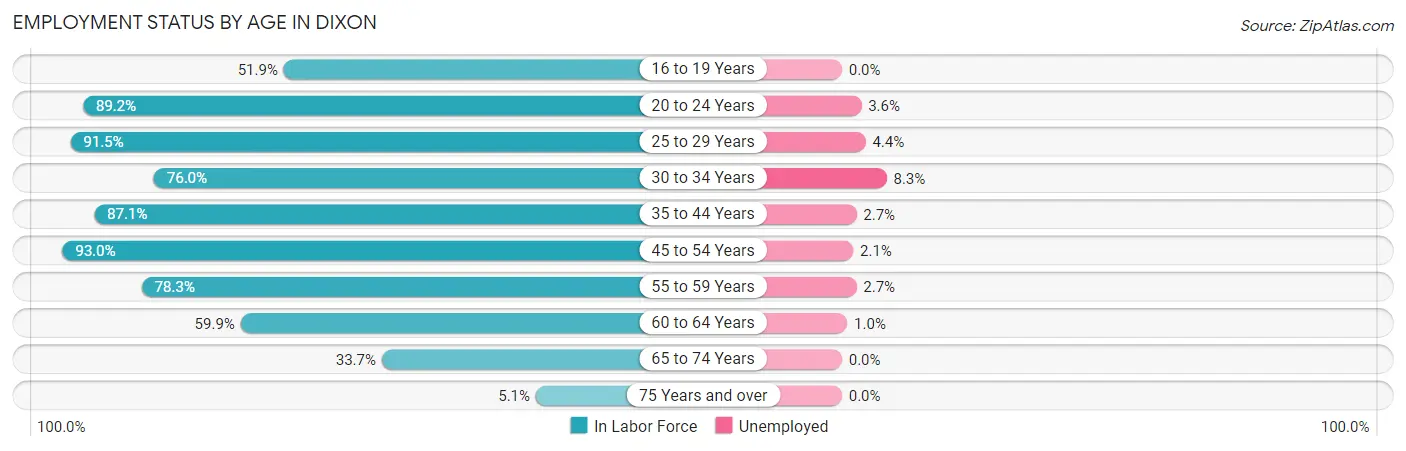
| Age Bracket | In Labor Force | Unemployed |
| 16 to 19 Years | 569 (51.9%) | 0 (0.0%) |
| 20 to 24 Years | 1,251 (89.2%) | 45 (3.6%) |
| 25 to 29 Years | 1,124 (91.5%) | 49 (4.4%) |
| 30 to 34 Years | 1,319 (76.0%) | 109 (8.3%) |
| 35 to 44 Years | 2,069 (87.1%) | 56 (2.7%) |
| 45 to 54 Years | 2,208 (93.0%) | 46 (2.1%) |
| 55 to 59 Years | 747 (78.3%) | 20 (2.7%) |
| 60 to 64 Years | 629 (59.9%) | 6 (1.0%) |
| 65 to 74 Years | 520 (33.7%) | 0 (0.0%) |
| 75 Years and over | 43 (5.1%) | 0 (0.0%) |
| Total | 10,474 (71.7%) | 335 (3.2%) |
Employment Status by Educational Attainment in Dixon
According to labor force statistics for Dixon, 83.3% of individuals (8,093) out of the total population between 25 and 64 years of age (9,716) are in the labor force, with 3.6% or 291 of them being unemployed. The group with the highest labor force participation rate are those with the educational attainment of bachelor's degree or higher, with 91.8% or 2,077 individuals in the labor force. Within the labor force, individuals with high school diploma education have the highest percentage of unemployment, with 6.0% or 149 of them being unemployed.
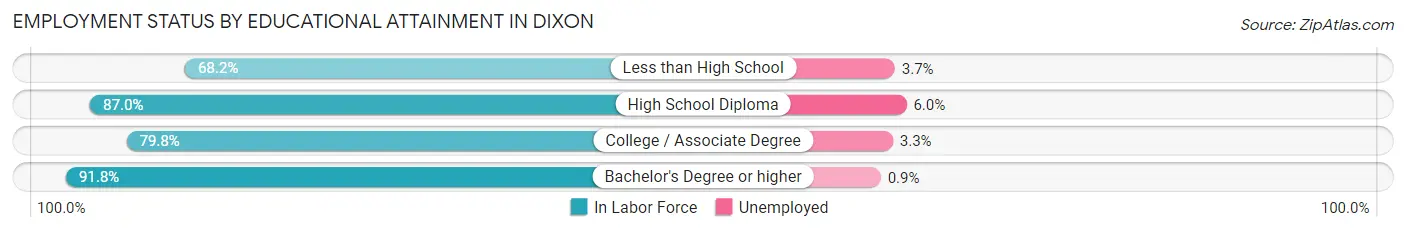
| Educational Attainment | In Labor Force | Unemployed |
| Less than High School | 792 (68.2%) | 43 (3.7%) |
| High School Diploma | 2,485 (87.0%) | 171 (6.0%) |
| College / Associate Degree | 2,742 (79.8%) | 113 (3.3%) |
| Bachelor's Degree or higher | 2,077 (91.8%) | 20 (0.9%) |
| Total | 8,093 (83.3%) | 350 (3.6%) |
Employment Occupations by Sex in Dixon
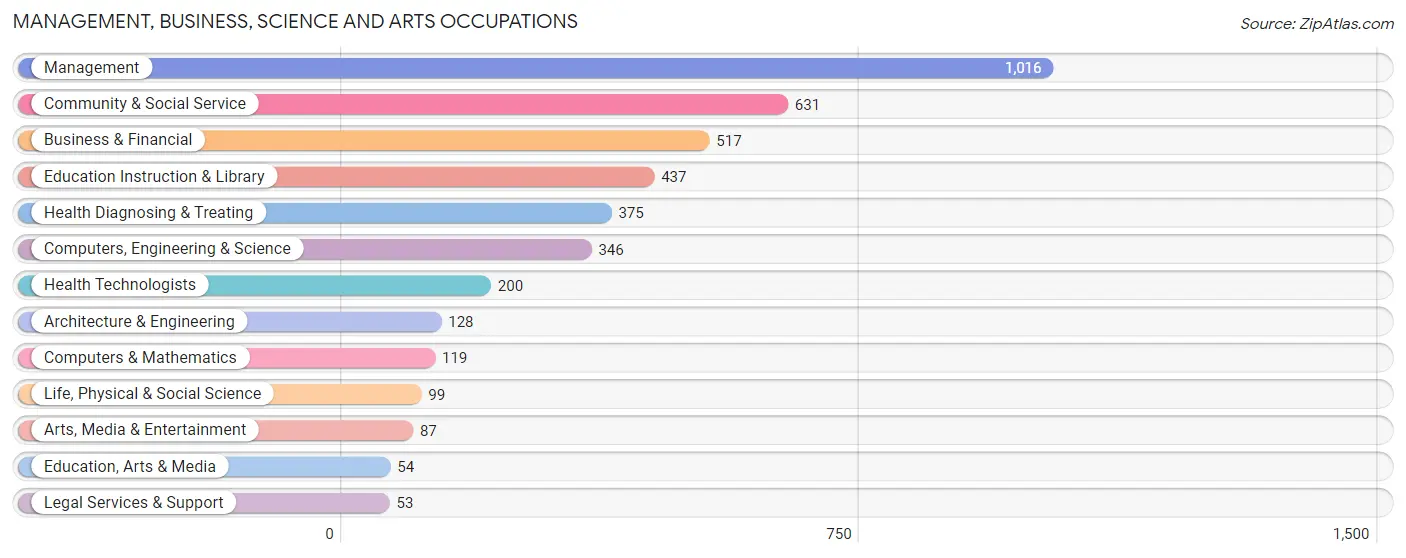
Management, Business, Science and Arts Occupations
The most common Management, Business, Science and Arts occupations in Dixon are Management (1,016 | 10.1%), Community & Social Service (631 | 6.2%), Business & Financial (517 | 5.1%), Education Instruction & Library (437 | 4.3%), and Health Diagnosing & Treating (375 | 3.7%).
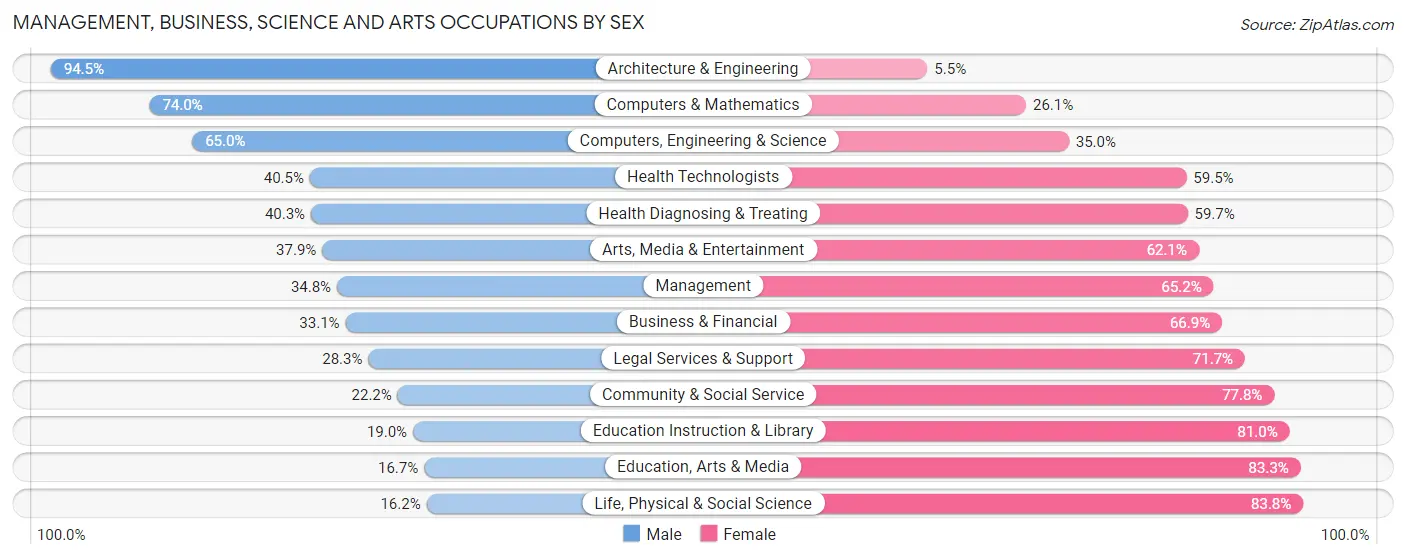
Management, Business, Science and Arts Occupations by Sex
Within the Management, Business, Science and Arts occupations in Dixon, the most male-oriented occupations are Architecture & Engineering (94.5%), Computers & Mathematics (74.0%), and Computers, Engineering & Science (65.0%), while the most female-oriented occupations are Life, Physical & Social Science (83.8%), Education, Arts & Media (83.3%), and Education Instruction & Library (81.0%).
| Occupation | Male | Female |
| Management | 354 (34.8%) | 662 (65.2%) |
| Business & Financial | 171 (33.1%) | 346 (66.9%) |
| Computers, Engineering & Science | 225 (65.0%) | 121 (35.0%) |
| Computers & Mathematics | 88 (74.0%) | 31 (26.1%) |
| Architecture & Engineering | 121 (94.5%) | 7 (5.5%) |
| Life, Physical & Social Science | 16 (16.2%) | 83 (83.8%) |
| Community & Social Service | 140 (22.2%) | 491 (77.8%) |
| Education, Arts & Media | 9 (16.7%) | 45 (83.3%) |
| Legal Services & Support | 15 (28.3%) | 38 (71.7%) |
| Education Instruction & Library | 83 (19.0%) | 354 (81.0%) |
| Arts, Media & Entertainment | 33 (37.9%) | 54 (62.1%) |
| Health Diagnosing & Treating | 151 (40.3%) | 224 (59.7%) |
| Health Technologists | 81 (40.5%) | 119 (59.5%) |
| Total (Category) | 1,041 (36.1%) | 1,844 (63.9%) |
| Total (Overall) | 5,682 (56.3%) | 4,413 (43.7%) |
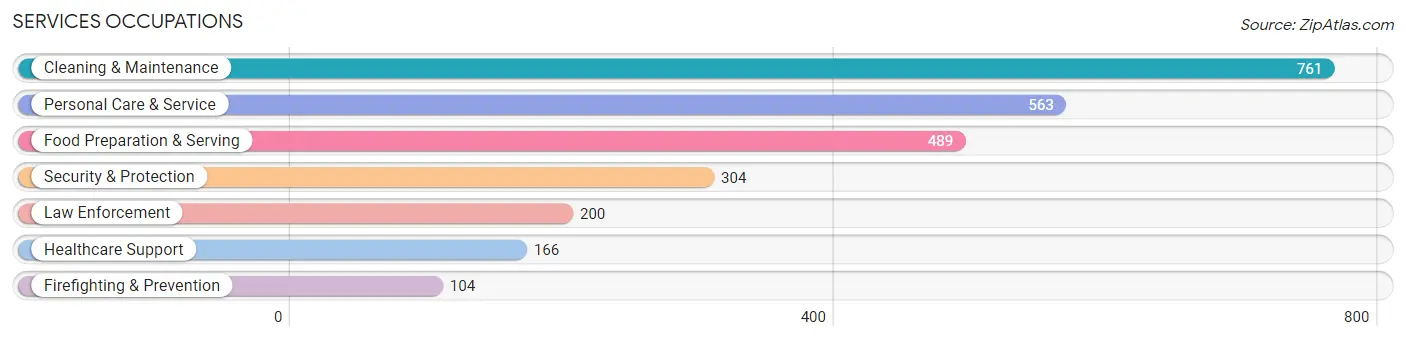
Services Occupations
The most common Services occupations in Dixon are Cleaning & Maintenance (761 | 7.5%), Personal Care & Service (563 | 5.6%), Food Preparation & Serving (489 | 4.8%), Security & Protection (304 | 3.0%), and Law Enforcement (200 | 2.0%).
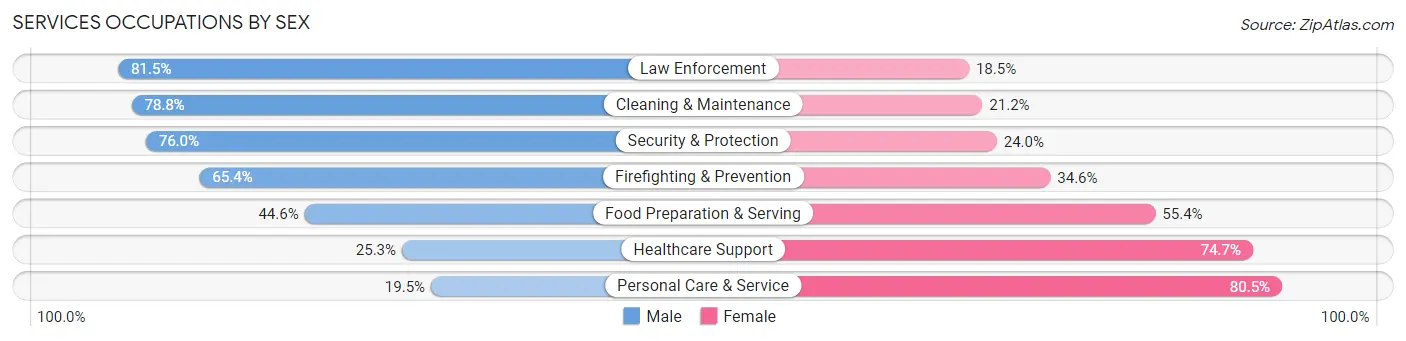
Services Occupations by Sex
Within the Services occupations in Dixon, the most male-oriented occupations are Law Enforcement (81.5%), Cleaning & Maintenance (78.8%), and Security & Protection (76.0%), while the most female-oriented occupations are Personal Care & Service (80.5%), Healthcare Support (74.7%), and Food Preparation & Serving (55.4%).
| Occupation | Male | Female |
| Healthcare Support | 42 (25.3%) | 124 (74.7%) |
| Security & Protection | 231 (76.0%) | 73 (24.0%) |
| Firefighting & Prevention | 68 (65.4%) | 36 (34.6%) |
| Law Enforcement | 163 (81.5%) | 37 (18.5%) |
| Food Preparation & Serving | 218 (44.6%) | 271 (55.4%) |
| Cleaning & Maintenance | 600 (78.8%) | 161 (21.2%) |
| Personal Care & Service | 110 (19.5%) | 453 (80.5%) |
| Total (Category) | 1,201 (52.6%) | 1,082 (47.4%) |
| Total (Overall) | 5,682 (56.3%) | 4,413 (43.7%) |
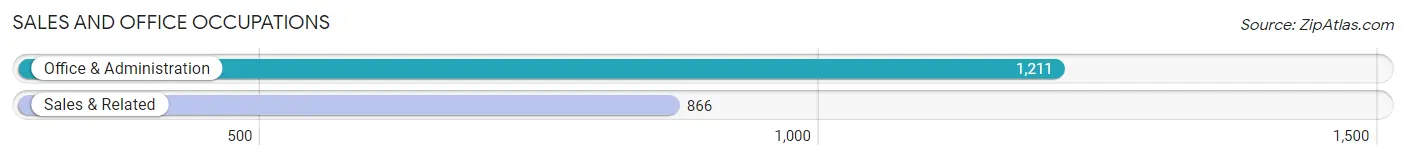
Sales and Office Occupations
The most common Sales and Office occupations in Dixon are Office & Administration (1,211 | 12.0%), and Sales & Related (866 | 8.6%).
Sales and Office Occupations by Sex
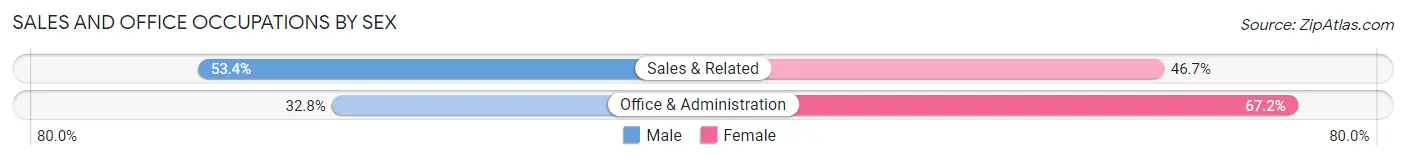
| Occupation | Male | Female |
| Sales & Related | 462 (53.3%) | 404 (46.7%) |
| Office & Administration | 397 (32.8%) | 814 (67.2%) |
| Total (Category) | 859 (41.4%) | 1,218 (58.6%) |
| Total (Overall) | 5,682 (56.3%) | 4,413 (43.7%) |
Natural Resources, Construction and Maintenance Occupations
The most common Natural Resources, Construction and Maintenance occupations in Dixon are Construction & Extraction (770 | 7.6%), Installation, Maintenance & Repair (557 | 5.5%), and Farming, Fishing & Forestry (61 | 0.6%).

Natural Resources, Construction and Maintenance Occupations by Sex
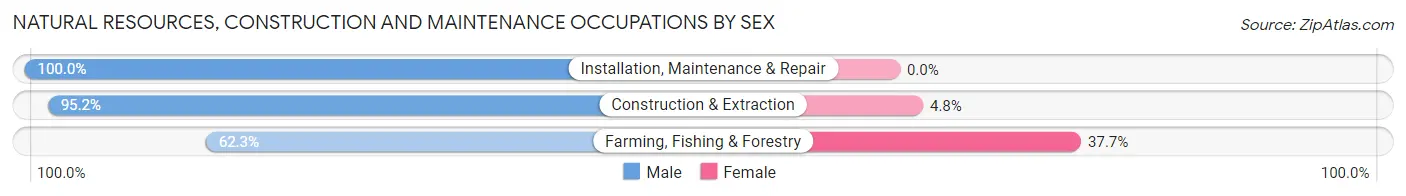
| Occupation | Male | Female |
| Farming, Fishing & Forestry | 38 (62.3%) | 23 (37.7%) |
| Construction & Extraction | 733 (95.2%) | 37 (4.8%) |
| Installation, Maintenance & Repair | 557 (100.0%) | 0 (0.0%) |
| Total (Category) | 1,328 (95.7%) | 60 (4.3%) |
| Total (Overall) | 5,682 (56.3%) | 4,413 (43.7%) |
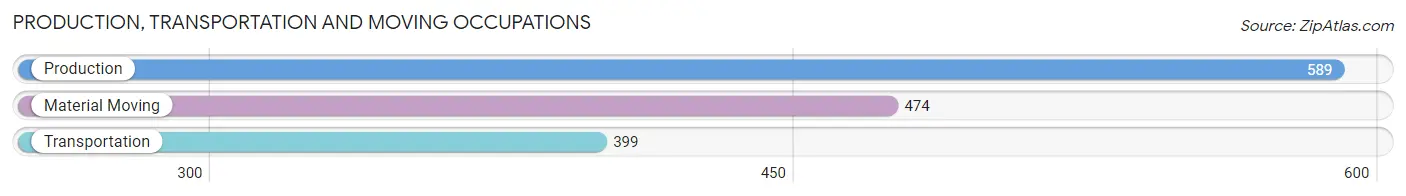
Production, Transportation and Moving Occupations
The most common Production, Transportation and Moving occupations in Dixon are Production (589 | 5.8%), Material Moving (474 | 4.7%), and Transportation (399 | 4.0%).
Production, Transportation and Moving Occupations by Sex
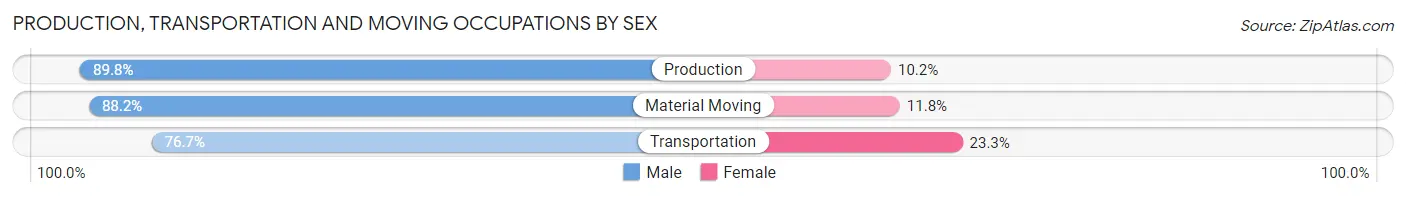
| Occupation | Male | Female |
| Production | 529 (89.8%) | 60 (10.2%) |
| Transportation | 306 (76.7%) | 93 (23.3%) |
| Material Moving | 418 (88.2%) | 56 (11.8%) |
| Total (Category) | 1,253 (85.7%) | 209 (14.3%) |
| Total (Overall) | 5,682 (56.3%) | 4,413 (43.7%) |
Employment Industries by Sex in Dixon
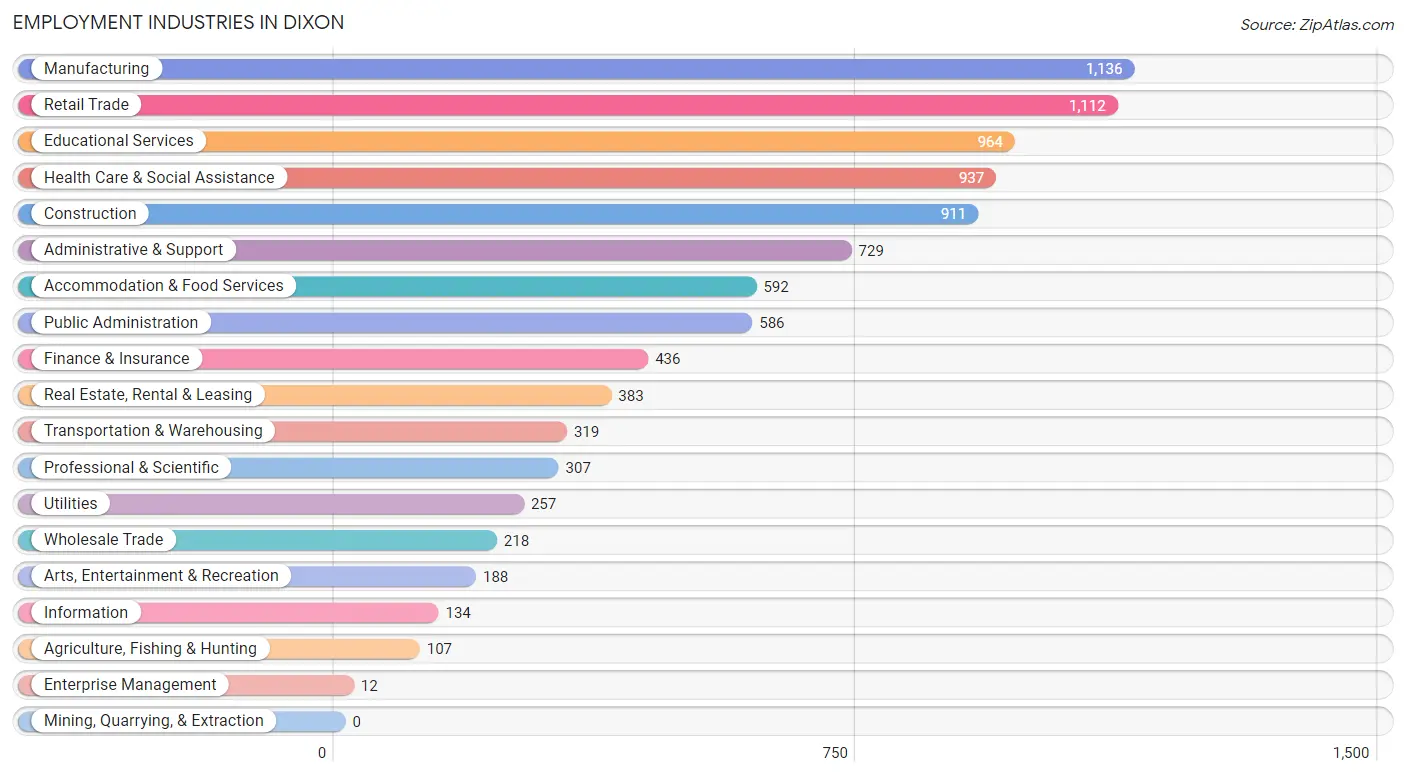
Employment Industries in Dixon
The major employment industries in Dixon include Manufacturing (1,136 | 11.3%), Retail Trade (1,112 | 11.0%), Educational Services (964 | 9.6%), Health Care & Social Assistance (937 | 9.3%), and Construction (911 | 9.0%).
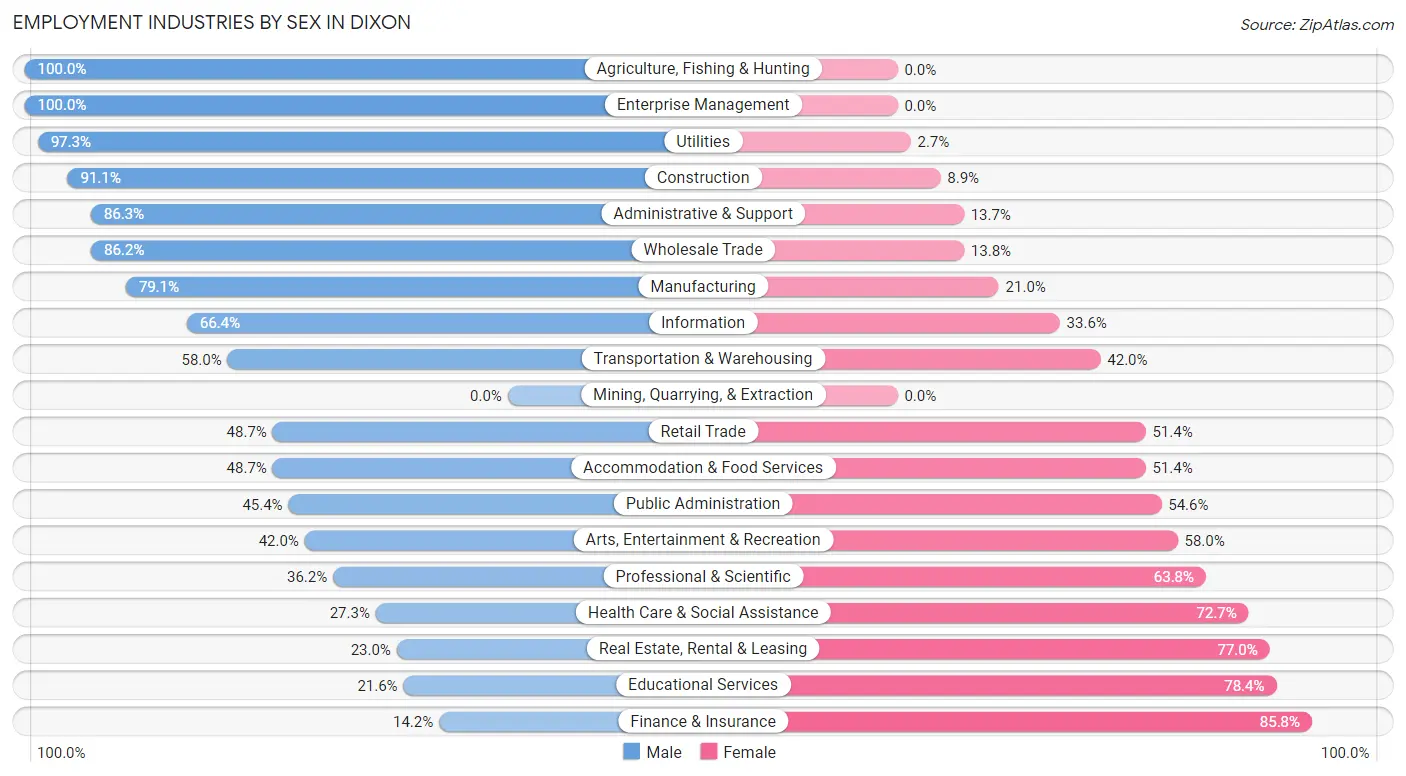
Employment Industries by Sex in Dixon
The Dixon industries that see more men than women are Agriculture, Fishing & Hunting (100.0%), Enterprise Management (100.0%), and Utilities (97.3%), whereas the industries that tend to have a higher number of women are Finance & Insurance (85.8%), Educational Services (78.4%), and Real Estate, Rental & Leasing (77.0%).
| Industry | Male | Female |
| Agriculture, Fishing & Hunting | 107 (100.0%) | 0 (0.0%) |
| Mining, Quarrying, & Extraction | 0 (0.0%) | 0 (0.0%) |
| Construction | 830 (91.1%) | 81 (8.9%) |
| Manufacturing | 898 (79.0%) | 238 (20.9%) |
| Wholesale Trade | 188 (86.2%) | 30 (13.8%) |
| Retail Trade | 541 (48.6%) | 571 (51.3%) |
| Transportation & Warehousing | 185 (58.0%) | 134 (42.0%) |
| Utilities | 250 (97.3%) | 7 (2.7%) |
| Information | 89 (66.4%) | 45 (33.6%) |
| Finance & Insurance | 62 (14.2%) | 374 (85.8%) |
| Real Estate, Rental & Leasing | 88 (23.0%) | 295 (77.0%) |
| Professional & Scientific | 111 (36.2%) | 196 (63.8%) |
| Enterprise Management | 12 (100.0%) | 0 (0.0%) |
| Administrative & Support | 629 (86.3%) | 100 (13.7%) |
| Educational Services | 208 (21.6%) | 756 (78.4%) |
| Health Care & Social Assistance | 256 (27.3%) | 681 (72.7%) |
| Arts, Entertainment & Recreation | 79 (42.0%) | 109 (58.0%) |
| Accommodation & Food Services | 288 (48.6%) | 304 (51.3%) |
| Public Administration | 266 (45.4%) | 320 (54.6%) |
| Total | 5,682 (56.3%) | 4,413 (43.7%) |
Education in Dixon
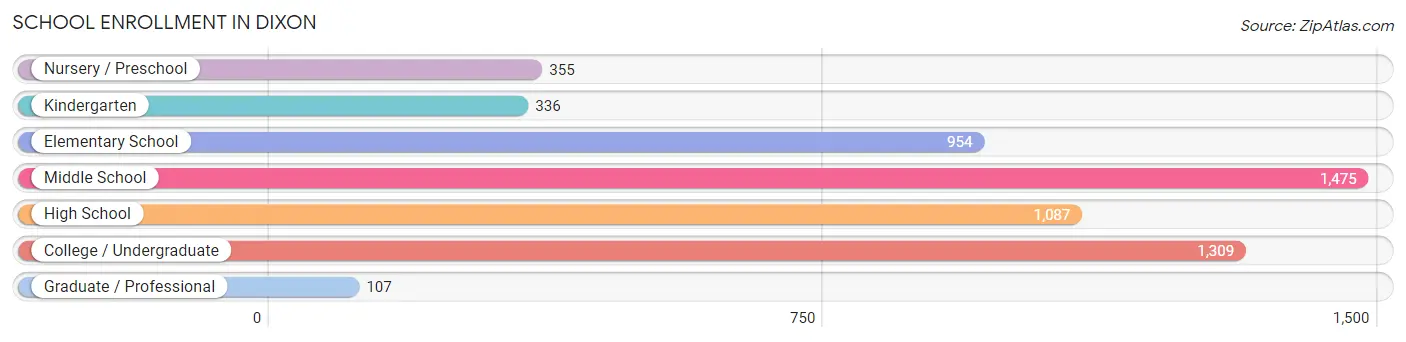
School Enrollment in Dixon
The most common levels of schooling among the 5,623 students in Dixon are middle school (1,475 | 26.2%), college / undergraduate (1,309 | 23.3%), and high school (1,087 | 19.3%).
| School Level | # Students | % Students |
| Nursery / Preschool | 355 | 6.3% |
| Kindergarten | 336 | 6.0% |
| Elementary School | 954 | 17.0% |
| Middle School | 1,475 | 26.2% |
| High School | 1,087 | 19.3% |
| College / Undergraduate | 1,309 | 23.3% |
| Graduate / Professional | 107 | 1.9% |
| Total | 5,623 | 100.0% |
School Enrollment by Age by Funding Source in Dixon
Out of a total of 5,623 students who are enrolled in schools in Dixon, 669 (11.9%) attend a private institution, while the remaining 4,954 (88.1%) are enrolled in public schools. The age group of 3 to 4 year olds has the highest likelihood of being enrolled in private schools, with 316 (94.9% in the age bracket) enrolled. Conversely, the age group of 18 to 19 year olds has the lowest likelihood of being enrolled in a private school, with 550 (100.0% in the age bracket) attending a public institution.
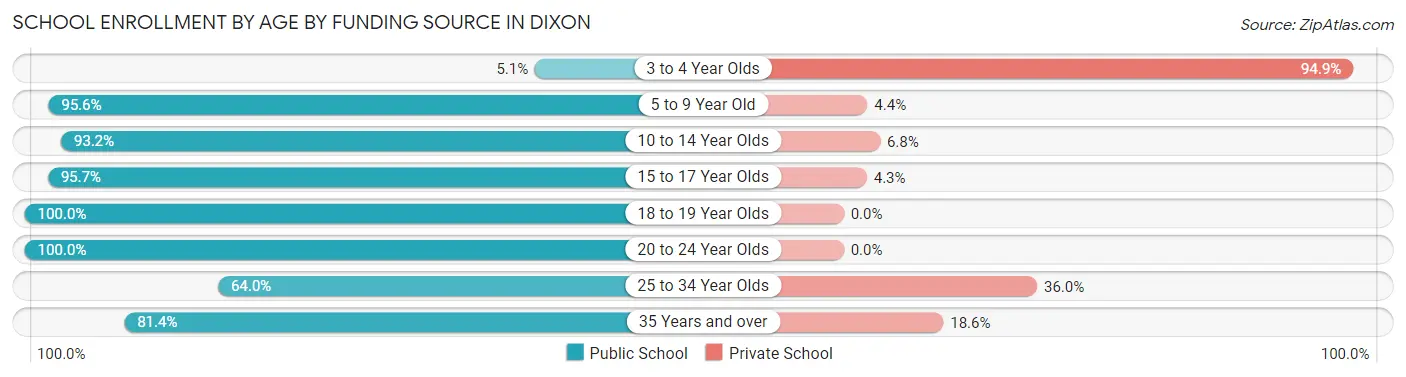
| Age Bracket | Public School | Private School |
| 3 to 4 Year Olds | 17 (5.1%) | 316 (94.9%) |
| 5 to 9 Year Old | 1,253 (95.6%) | 58 (4.4%) |
| 10 to 14 Year Olds | 1,558 (93.2%) | 113 (6.8%) |
| 15 to 17 Year Olds | 732 (95.7%) | 33 (4.3%) |
| 18 to 19 Year Olds | 550 (100.0%) | 0 (0.0%) |
| 20 to 24 Year Olds | 504 (100.0%) | 0 (0.0%) |
| 25 to 34 Year Olds | 206 (64.0%) | 116 (36.0%) |
| 35 Years and over | 136 (81.4%) | 31 (18.6%) |
| Total | 4,954 (88.1%) | 669 (11.9%) |
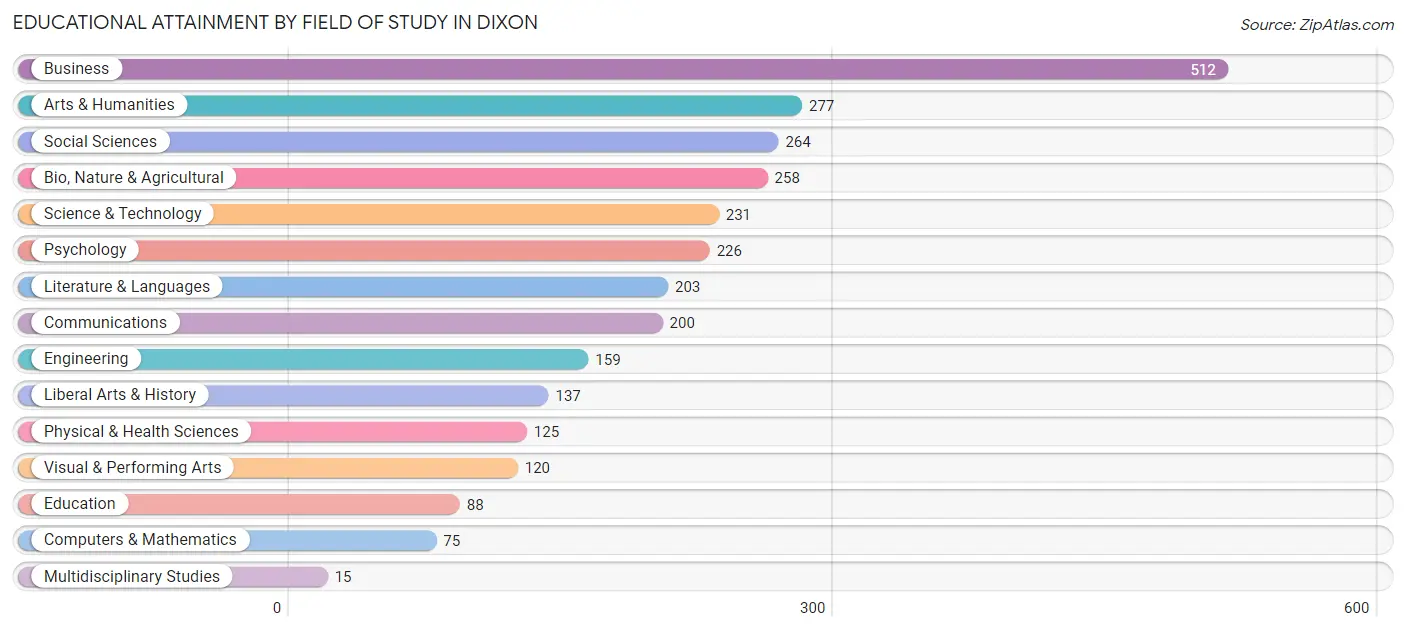
Educational Attainment by Field of Study in Dixon
Business (512 | 17.7%), arts & humanities (277 | 9.6%), social sciences (264 | 9.1%), bio, nature & agricultural (258 | 8.9%), and science & technology (231 | 8.0%) are the most common fields of study among 2,890 individuals in Dixon who have obtained a bachelor's degree or higher.
| Field of Study | # Graduates | % Graduates |
| Computers & Mathematics | 75 | 2.6% |
| Bio, Nature & Agricultural | 258 | 8.9% |
| Physical & Health Sciences | 125 | 4.3% |
| Psychology | 226 | 7.8% |
| Social Sciences | 264 | 9.1% |
| Engineering | 159 | 5.5% |
| Multidisciplinary Studies | 15 | 0.5% |
| Science & Technology | 231 | 8.0% |
| Business | 512 | 17.7% |
| Education | 88 | 3.0% |
| Literature & Languages | 203 | 7.0% |
| Liberal Arts & History | 137 | 4.7% |
| Visual & Performing Arts | 120 | 4.2% |
| Communications | 200 | 6.9% |
| Arts & Humanities | 277 | 9.6% |
| Total | 2,890 | 100.0% |
Transportation & Commute in Dixon
Vehicle Availability by Sex in Dixon
The most prevalent vehicle ownership categories in Dixon are males with 2 vehicles (1,868, accounting for 32.8%) and females with 2 vehicles (1,448, making up 43.2%).
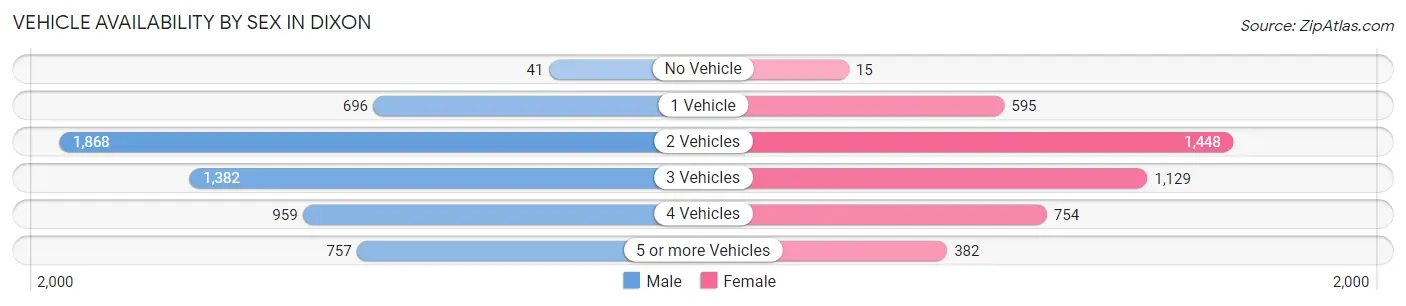
| Vehicles Available | Male | Female |
| No Vehicle | 41 (0.7%) | 15 (0.4%) |
| 1 Vehicle | 696 (12.2%) | 595 (13.8%) |
| 2 Vehicles | 1,868 (32.8%) | 1,448 (33.5%) |
| 3 Vehicles | 1,382 (24.2%) | 1,129 (26.1%) |
| 4 Vehicles | 959 (16.8%) | 754 (17.4%) |
| 5 or more Vehicles | 757 (13.3%) | 382 (8.8%) |
| Total | 5,703 (100.0%) | 4,323 (100.0%) |
Commute Time in Dixon
The most frequently occuring commute durations in Dixon are 15 to 19 minutes (1,600 commuters, 17.0%), 5 to 9 minutes (1,531 commuters, 16.3%), and 20 to 24 minutes (1,215 commuters, 12.9%).
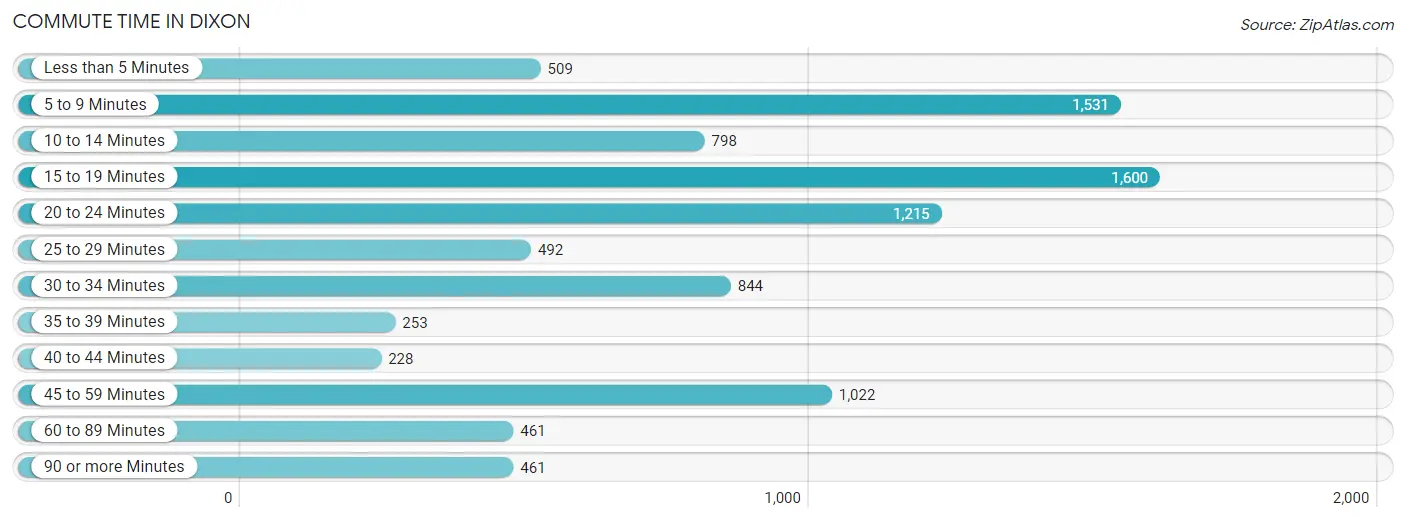
| Commute Time | # Commuters | % Commuters |
| Less than 5 Minutes | 509 | 5.4% |
| 5 to 9 Minutes | 1,531 | 16.3% |
| 10 to 14 Minutes | 798 | 8.5% |
| 15 to 19 Minutes | 1,600 | 17.0% |
| 20 to 24 Minutes | 1,215 | 12.9% |
| 25 to 29 Minutes | 492 | 5.2% |
| 30 to 34 Minutes | 844 | 9.0% |
| 35 to 39 Minutes | 253 | 2.7% |
| 40 to 44 Minutes | 228 | 2.4% |
| 45 to 59 Minutes | 1,022 | 10.9% |
| 60 to 89 Minutes | 461 | 4.9% |
| 90 or more Minutes | 461 | 4.9% |
Commute Time by Sex in Dixon
The most common commute times in Dixon are 5 to 9 minutes (887 commuters, 15.9%) for males and 15 to 19 minutes (1,114 commuters, 29.1%) for females.
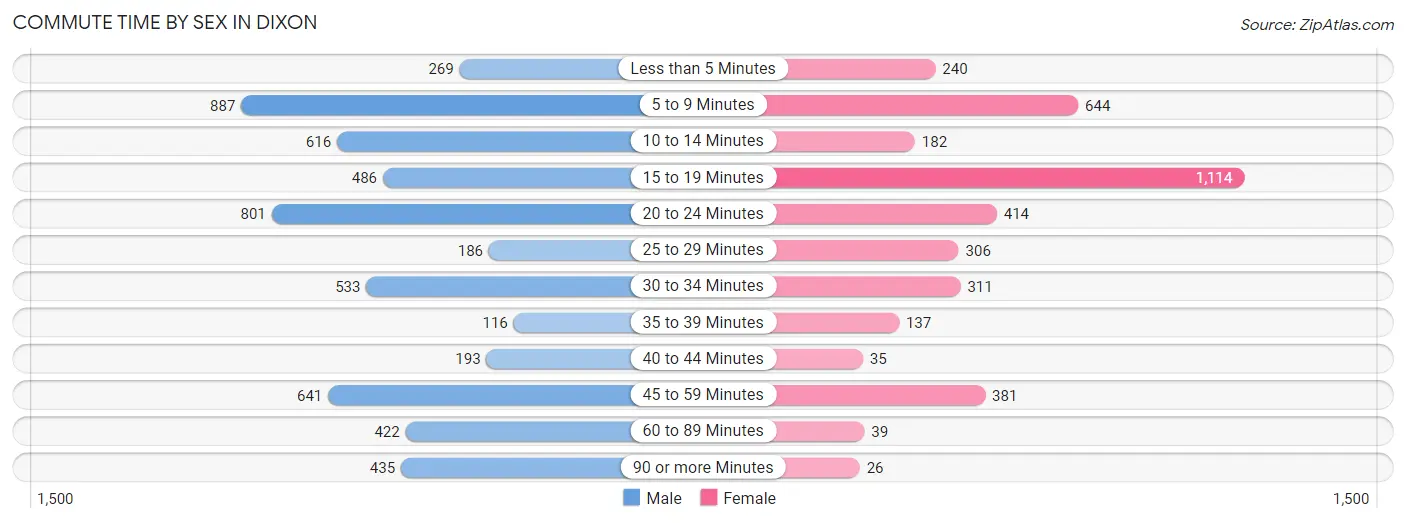
| Commute Time | Male | Female |
| Less than 5 Minutes | 269 (4.8%) | 240 (6.3%) |
| 5 to 9 Minutes | 887 (15.9%) | 644 (16.8%) |
| 10 to 14 Minutes | 616 (11.0%) | 182 (4.8%) |
| 15 to 19 Minutes | 486 (8.7%) | 1,114 (29.1%) |
| 20 to 24 Minutes | 801 (14.3%) | 414 (10.8%) |
| 25 to 29 Minutes | 186 (3.3%) | 306 (8.0%) |
| 30 to 34 Minutes | 533 (9.5%) | 311 (8.1%) |
| 35 to 39 Minutes | 116 (2.1%) | 137 (3.6%) |
| 40 to 44 Minutes | 193 (3.5%) | 35 (0.9%) |
| 45 to 59 Minutes | 641 (11.5%) | 381 (10.0%) |
| 60 to 89 Minutes | 422 (7.6%) | 39 (1.0%) |
| 90 or more Minutes | 435 (7.8%) | 26 (0.7%) |
Time of Departure to Work by Sex in Dixon
The most frequent times of departure to work in Dixon are 6:00 AM to 6:29 AM (993, 17.8%) for males and 7:00 AM to 7:29 AM (878, 22.9%) for females.
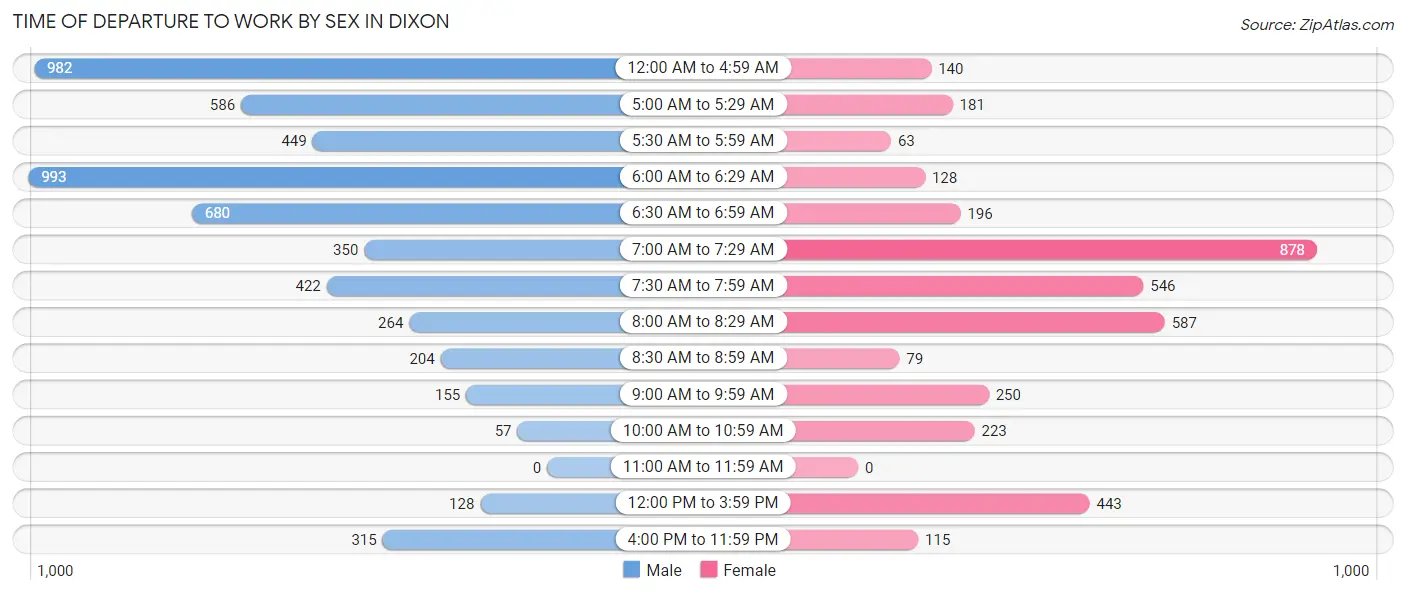
| Time of Departure | Male | Female |
| 12:00 AM to 4:59 AM | 982 (17.6%) | 140 (3.7%) |
| 5:00 AM to 5:29 AM | 586 (10.5%) | 181 (4.7%) |
| 5:30 AM to 5:59 AM | 449 (8.0%) | 63 (1.7%) |
| 6:00 AM to 6:29 AM | 993 (17.8%) | 128 (3.3%) |
| 6:30 AM to 6:59 AM | 680 (12.2%) | 196 (5.1%) |
| 7:00 AM to 7:29 AM | 350 (6.3%) | 878 (22.9%) |
| 7:30 AM to 7:59 AM | 422 (7.6%) | 546 (14.3%) |
| 8:00 AM to 8:29 AM | 264 (4.7%) | 587 (15.3%) |
| 8:30 AM to 8:59 AM | 204 (3.6%) | 79 (2.1%) |
| 9:00 AM to 9:59 AM | 155 (2.8%) | 250 (6.5%) |
| 10:00 AM to 10:59 AM | 57 (1.0%) | 223 (5.8%) |
| 11:00 AM to 11:59 AM | 0 (0.0%) | 0 (0.0%) |
| 12:00 PM to 3:59 PM | 128 (2.3%) | 443 (11.6%) |
| 4:00 PM to 11:59 PM | 315 (5.6%) | 115 (3.0%) |
| Total | 5,585 (100.0%) | 3,829 (100.0%) |
Housing Occupancy in Dixon
Occupancy by Ownership in Dixon
Of the total 6,491 dwellings in Dixon, owner-occupied units account for 3,847 (59.3%), while renter-occupied units make up 2,644 (40.7%).
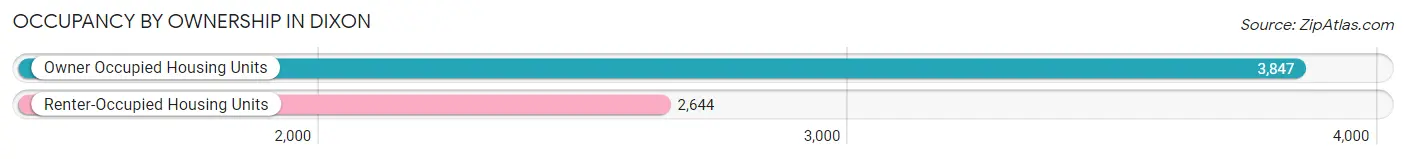
| Occupancy | # Housing Units | % Housing Units |
| Owner Occupied Housing Units | 3,847 | 59.3% |
| Renter-Occupied Housing Units | 2,644 | 40.7% |
| Total Occupied Housing Units | 6,491 | 100.0% |
Occupancy by Household Size in Dixon
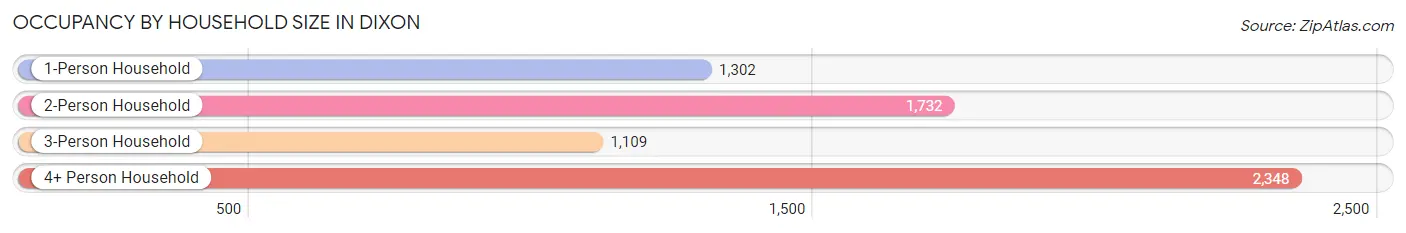
| Household Size | # Housing Units | % Housing Units |
| 1-Person Household | 1,302 | 20.1% |
| 2-Person Household | 1,732 | 26.7% |
| 3-Person Household | 1,109 | 17.1% |
| 4+ Person Household | 2,348 | 36.2% |
| Total Housing Units | 6,491 | 100.0% |
Occupancy by Ownership by Household Size in Dixon
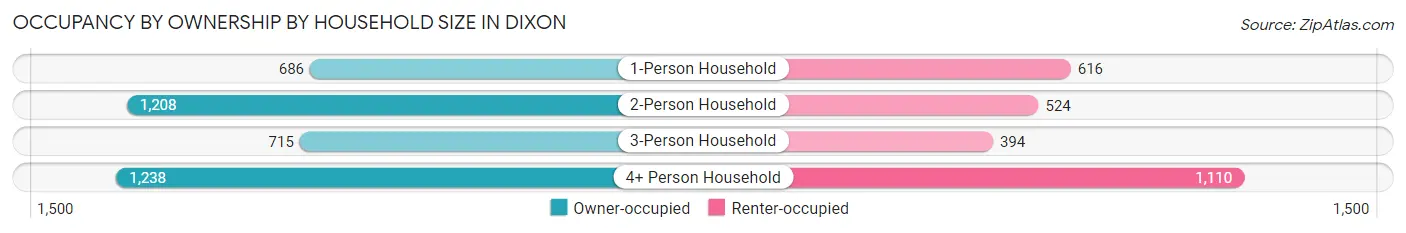
| Household Size | Owner-occupied | Renter-occupied |
| 1-Person Household | 686 (52.7%) | 616 (47.3%) |
| 2-Person Household | 1,208 (69.8%) | 524 (30.2%) |
| 3-Person Household | 715 (64.5%) | 394 (35.5%) |
| 4+ Person Household | 1,238 (52.7%) | 1,110 (47.3%) |
| Total Housing Units | 3,847 (59.3%) | 2,644 (40.7%) |
Occupancy by Educational Attainment in Dixon
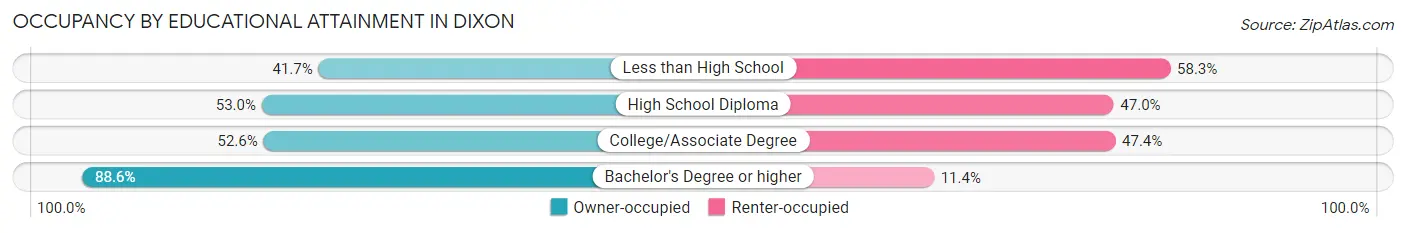
| Household Size | Owner-occupied | Renter-occupied |
| Less than High School | 350 (41.7%) | 489 (58.3%) |
| High School Diploma | 883 (53.0%) | 784 (47.0%) |
| College/Associate Degree | 1,341 (52.6%) | 1,207 (47.4%) |
| Bachelor's Degree or higher | 1,273 (88.6%) | 164 (11.4%) |
Occupancy by Age of Householder in Dixon
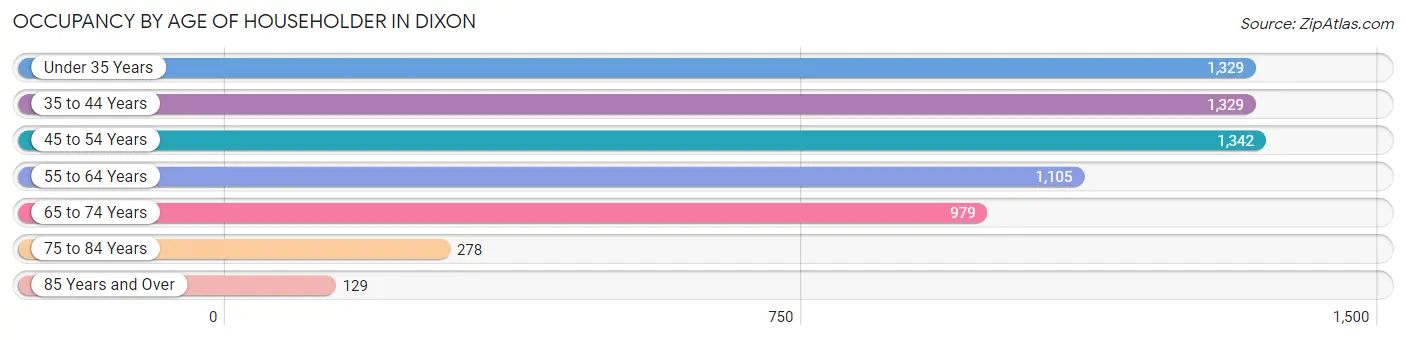
| Age Bracket | # Households | % Households |
| Under 35 Years | 1,329 | 20.5% |
| 35 to 44 Years | 1,329 | 20.5% |
| 45 to 54 Years | 1,342 | 20.7% |
| 55 to 64 Years | 1,105 | 17.0% |
| 65 to 74 Years | 979 | 15.1% |
| 75 to 84 Years | 278 | 4.3% |
| 85 Years and Over | 129 | 2.0% |
| Total | 6,491 | 100.0% |
Housing Finances in Dixon
Median Income by Occupancy in Dixon
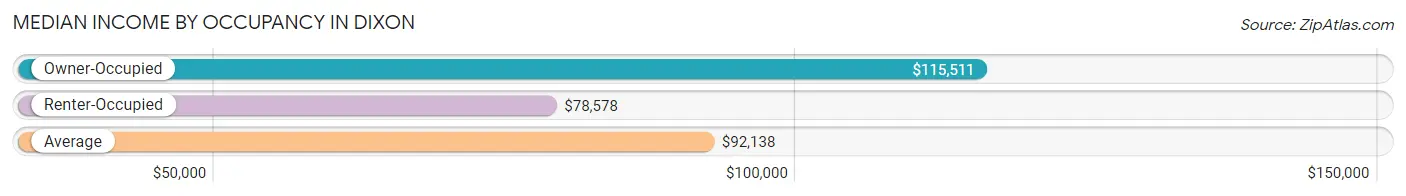
| Occupancy Type | # Households | Median Income |
| Owner-Occupied | 3,847 (59.3%) | $115,511 |
| Renter-Occupied | 2,644 (40.7%) | $78,578 |
| Average | 6,491 (100.0%) | $92,138 |
Occupancy by Householder Income Bracket in Dixon
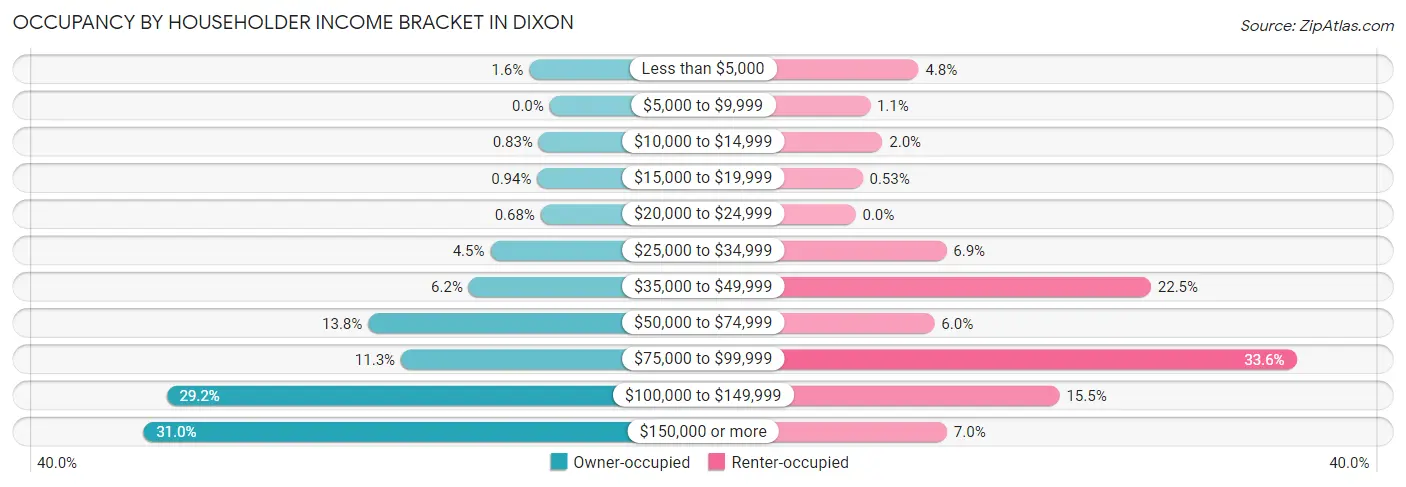
| Income Bracket | Owner-occupied | Renter-occupied |
| Less than $5,000 | 60 (1.6%) | 127 (4.8%) |
| $5,000 to $9,999 | 0 (0.0%) | 29 (1.1%) |
| $10,000 to $14,999 | 32 (0.8%) | 54 (2.0%) |
| $15,000 to $19,999 | 36 (0.9%) | 14 (0.5%) |
| $20,000 to $24,999 | 26 (0.7%) | 0 (0.0%) |
| $25,000 to $34,999 | 174 (4.5%) | 183 (6.9%) |
| $35,000 to $49,999 | 237 (6.2%) | 595 (22.5%) |
| $50,000 to $74,999 | 532 (13.8%) | 159 (6.0%) |
| $75,000 to $99,999 | 436 (11.3%) | 888 (33.6%) |
| $100,000 to $149,999 | 1,123 (29.2%) | 411 (15.5%) |
| $150,000 or more | 1,191 (31.0%) | 184 (7.0%) |
| Total | 3,847 (100.0%) | 2,644 (100.0%) |
Monthly Housing Cost Tiers in Dixon
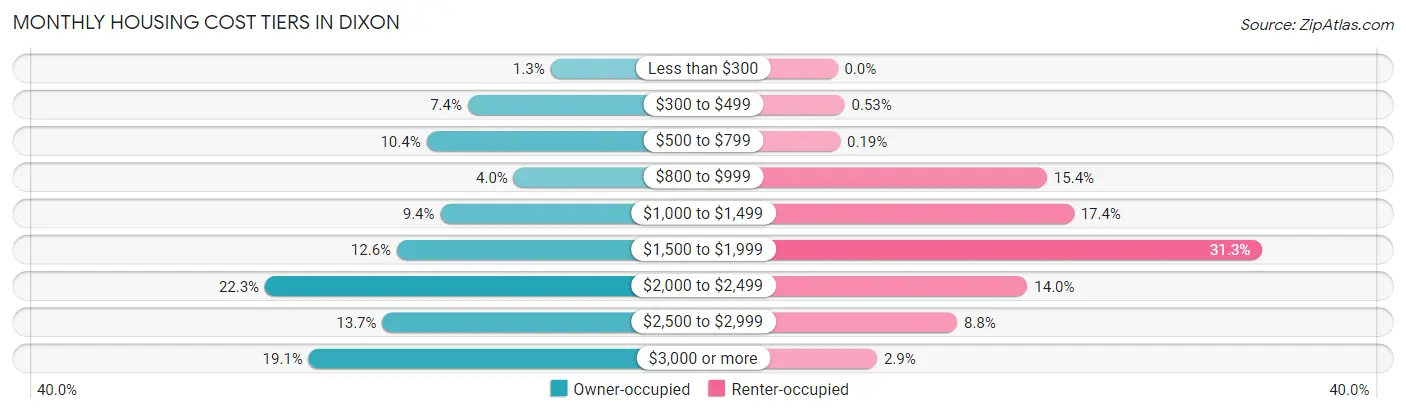
| Monthly Cost | Owner-occupied | Renter-occupied |
| Less than $300 | 49 (1.3%) | 0 (0.0%) |
| $300 to $499 | 283 (7.4%) | 14 (0.5%) |
| $500 to $799 | 400 (10.4%) | 5 (0.2%) |
| $800 to $999 | 153 (4.0%) | 408 (15.4%) |
| $1,000 to $1,499 | 361 (9.4%) | 460 (17.4%) |
| $1,500 to $1,999 | 484 (12.6%) | 827 (31.3%) |
| $2,000 to $2,499 | 858 (22.3%) | 370 (14.0%) |
| $2,500 to $2,999 | 525 (13.7%) | 233 (8.8%) |
| $3,000 or more | 734 (19.1%) | 77 (2.9%) |
| Total | 3,847 (100.0%) | 2,644 (100.0%) |
Physical Housing Characteristics in Dixon
Housing Structures in Dixon
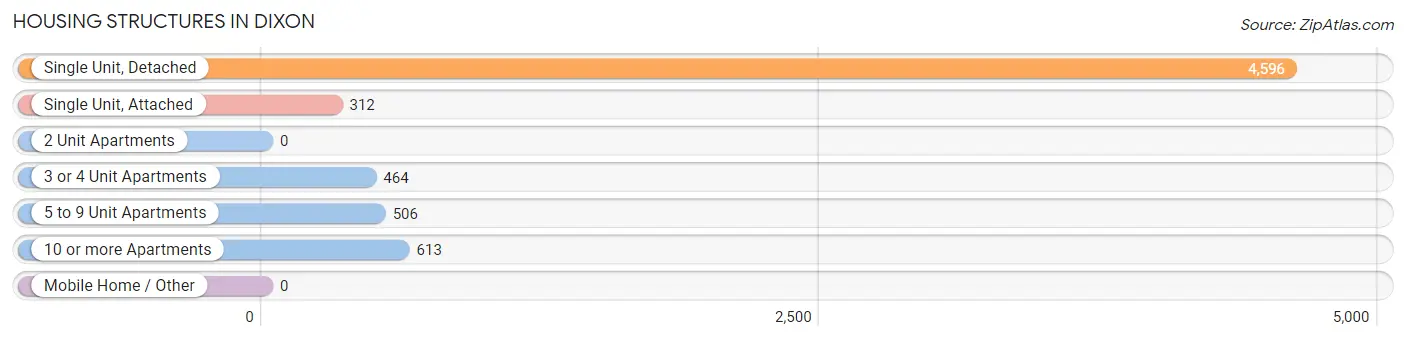
| Structure Type | # Housing Units | % Housing Units |
| Single Unit, Detached | 4,596 | 70.8% |
| Single Unit, Attached | 312 | 4.8% |
| 2 Unit Apartments | 0 | 0.0% |
| 3 or 4 Unit Apartments | 464 | 7.1% |
| 5 to 9 Unit Apartments | 506 | 7.8% |
| 10 or more Apartments | 613 | 9.4% |
| Mobile Home / Other | 0 | 0.0% |
| Total | 6,491 | 100.0% |
Housing Structures by Occupancy in Dixon
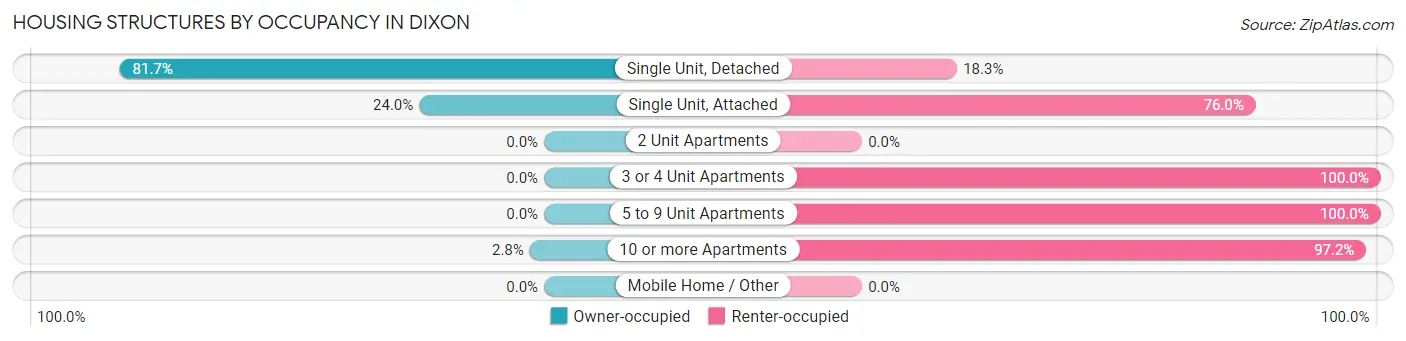
| Structure Type | Owner-occupied | Renter-occupied |
| Single Unit, Detached | 3,755 (81.7%) | 841 (18.3%) |
| Single Unit, Attached | 75 (24.0%) | 237 (76.0%) |
| 2 Unit Apartments | 0 (0.0%) | 0 (0.0%) |
| 3 or 4 Unit Apartments | 0 (0.0%) | 464 (100.0%) |
| 5 to 9 Unit Apartments | 0 (0.0%) | 506 (100.0%) |
| 10 or more Apartments | 17 (2.8%) | 596 (97.2%) |
| Mobile Home / Other | 0 (0.0%) | 0 (0.0%) |
| Total | 3,847 (59.3%) | 2,644 (40.7%) |
Housing Structures by Number of Rooms in Dixon
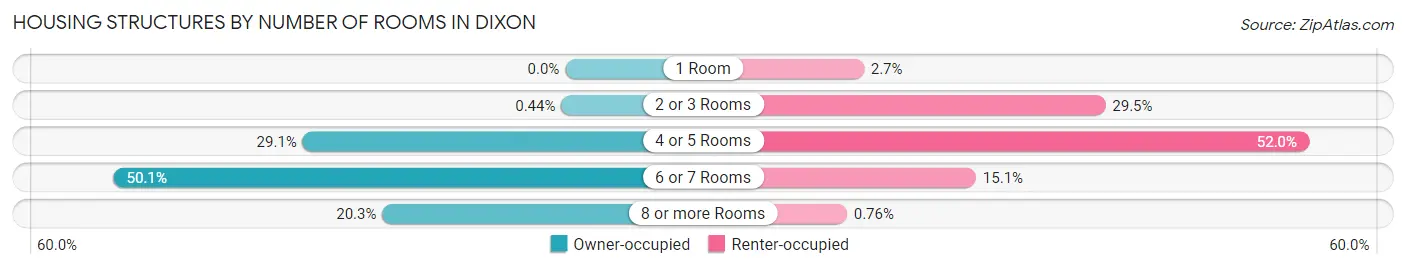
| Number of Rooms | Owner-occupied | Renter-occupied |
| 1 Room | 0 (0.0%) | 70 (2.6%) |
| 2 or 3 Rooms | 17 (0.4%) | 779 (29.5%) |
| 4 or 5 Rooms | 1,121 (29.1%) | 1,376 (52.0%) |
| 6 or 7 Rooms | 1,928 (50.1%) | 399 (15.1%) |
| 8 or more Rooms | 781 (20.3%) | 20 (0.8%) |
| Total | 3,847 (100.0%) | 2,644 (100.0%) |
Housing Structure by Heating Type in Dixon
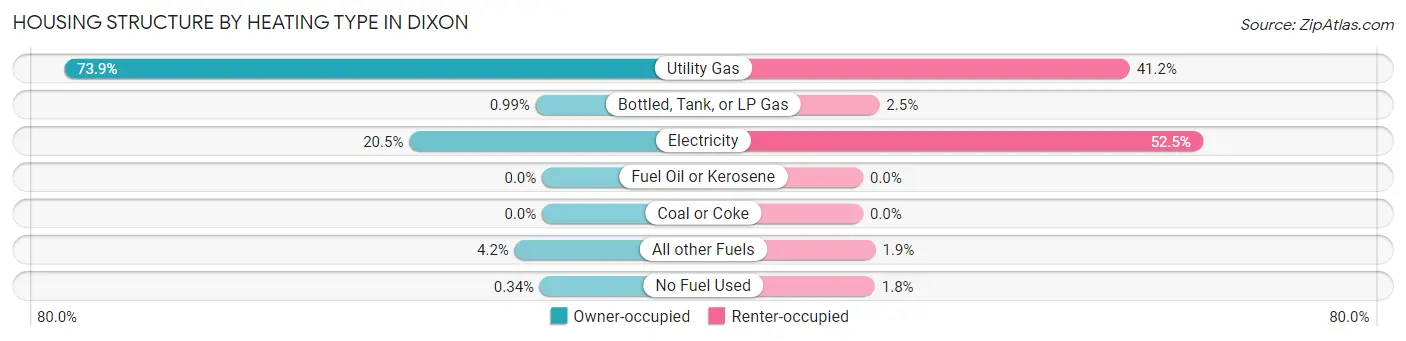
| Heating Type | Owner-occupied | Renter-occupied |
| Utility Gas | 2,843 (73.9%) | 1,090 (41.2%) |
| Bottled, Tank, or LP Gas | 38 (1.0%) | 67 (2.5%) |
| Electricity | 790 (20.5%) | 1,388 (52.5%) |
| Fuel Oil or Kerosene | 0 (0.0%) | 0 (0.0%) |
| Coal or Coke | 0 (0.0%) | 0 (0.0%) |
| All other Fuels | 163 (4.2%) | 51 (1.9%) |
| No Fuel Used | 13 (0.3%) | 48 (1.8%) |
| Total | 3,847 (100.0%) | 2,644 (100.0%) |
Household Vehicle Usage in Dixon
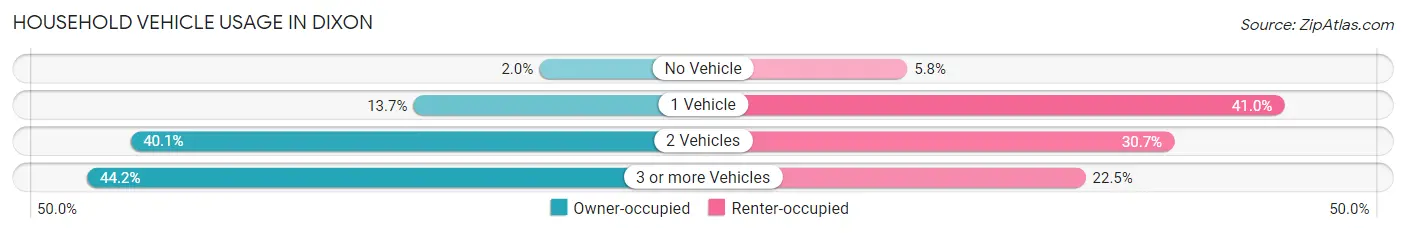
| Vehicles per Household | Owner-occupied | Renter-occupied |
| No Vehicle | 76 (2.0%) | 154 (5.8%) |
| 1 Vehicle | 528 (13.7%) | 1,084 (41.0%) |
| 2 Vehicles | 1,544 (40.1%) | 812 (30.7%) |
| 3 or more Vehicles | 1,699 (44.2%) | 594 (22.5%) |
| Total | 3,847 (100.0%) | 2,644 (100.0%) |
Real Estate & Mortgages in Dixon
Real Estate and Mortgage Overview in Dixon
| Characteristic | Without Mortgage | With Mortgage |
| Housing Units | 1,077 | 2,770 |
| Median Property Value | $474,900 | $549,100 |
| Median Household Income | $97,270 | $960 |
| Monthly Housing Costs | $649 | $722 |
| Real Estate Taxes | $3,063 | $21 |
Property Value by Mortgage Status in Dixon
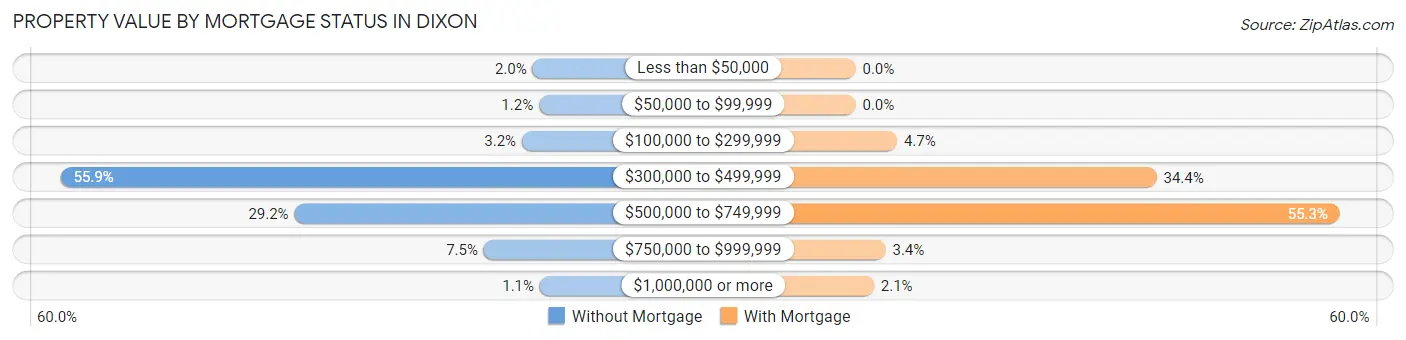
| Property Value | Without Mortgage | With Mortgage |
| Less than $50,000 | 21 (1.9%) | 0 (0.0%) |
| $50,000 to $99,999 | 13 (1.2%) | 0 (0.0%) |
| $100,000 to $299,999 | 34 (3.2%) | 131 (4.7%) |
| $300,000 to $499,999 | 602 (55.9%) | 953 (34.4%) |
| $500,000 to $749,999 | 314 (29.2%) | 1,533 (55.3%) |
| $750,000 to $999,999 | 81 (7.5%) | 95 (3.4%) |
| $1,000,000 or more | 12 (1.1%) | 58 (2.1%) |
| Total | 1,077 (100.0%) | 2,770 (100.0%) |
Household Income by Mortgage Status in Dixon
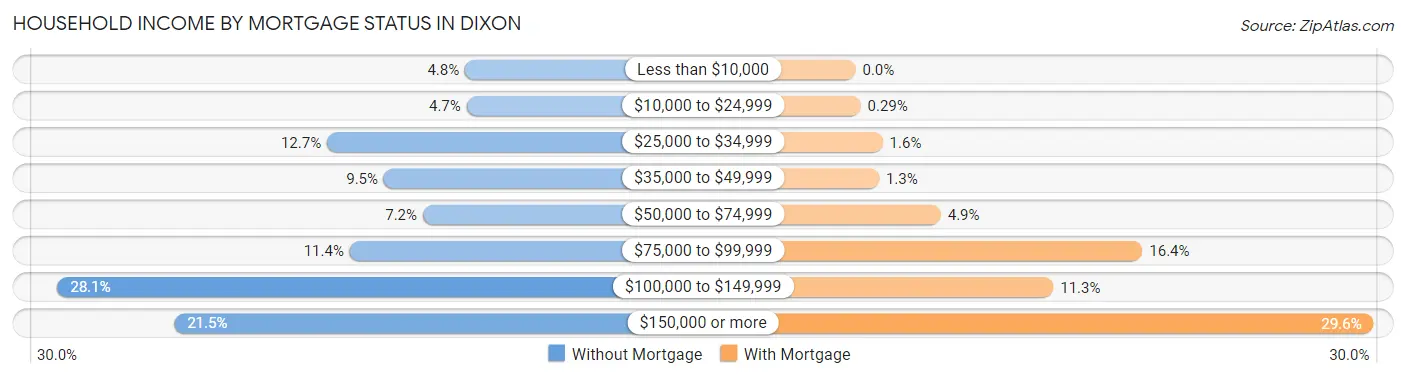
| Household Income | Without Mortgage | With Mortgage |
| Less than $10,000 | 52 (4.8%) | 0 (0.0%) |
| $10,000 to $24,999 | 51 (4.7%) | 8 (0.3%) |
| $25,000 to $34,999 | 137 (12.7%) | 43 (1.5%) |
| $35,000 to $49,999 | 102 (9.5%) | 37 (1.3%) |
| $50,000 to $74,999 | 78 (7.2%) | 135 (4.9%) |
| $75,000 to $99,999 | 123 (11.4%) | 454 (16.4%) |
| $100,000 to $149,999 | 303 (28.1%) | 313 (11.3%) |
| $150,000 or more | 231 (21.4%) | 820 (29.6%) |
| Total | 1,077 (100.0%) | 2,770 (100.0%) |
Property Value to Household Income Ratio in Dixon
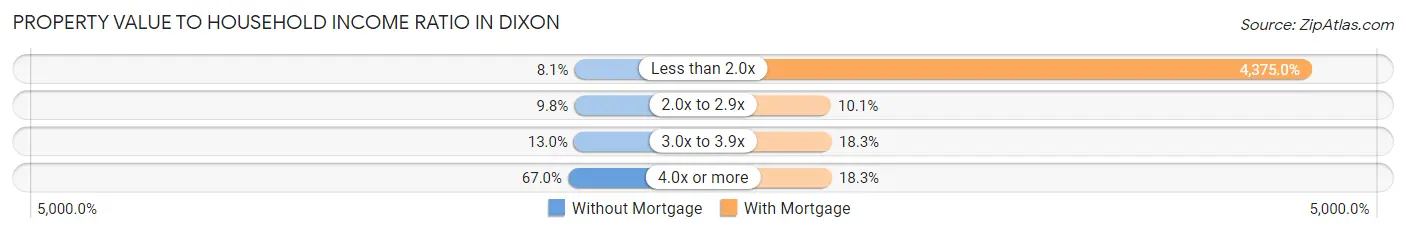
| Value-to-Income Ratio | Without Mortgage | With Mortgage |
| Less than 2.0x | 87 (8.1%) | 121,188 (4,375.0%) |
| 2.0x to 2.9x | 106 (9.8%) | 281 (10.1%) |
| 3.0x to 3.9x | 140 (13.0%) | 508 (18.3%) |
| 4.0x or more | 722 (67.0%) | 506 (18.3%) |
| Total | 1,077 (100.0%) | 2,770 (100.0%) |
Real Estate Taxes by Mortgage Status in Dixon
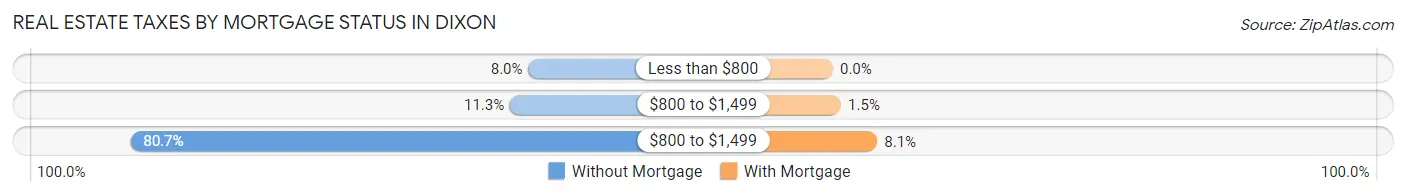
| Property Taxes | Without Mortgage | With Mortgage |
| Less than $800 | 86 (8.0%) | 0 (0.0%) |
| $800 to $1,499 | 122 (11.3%) | 41 (1.5%) |
| $800 to $1,499 | 869 (80.7%) | 224 (8.1%) |
| Total | 1,077 (100.0%) | 2,770 (100.0%) |
Health & Disability in Dixon
Health Insurance Coverage by Age in Dixon
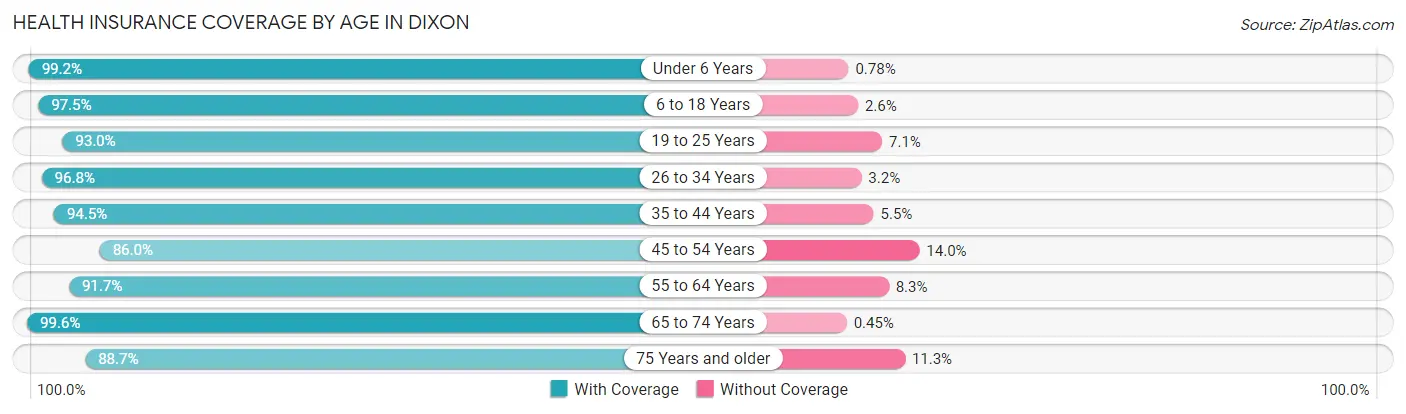
| Age Bracket | With Coverage | Without Coverage |
| Under 6 Years | 1,277 (99.2%) | 10 (0.8%) |
| 6 to 18 Years | 3,826 (97.5%) | 100 (2.5%) |
| 19 to 25 Years | 1,846 (92.9%) | 140 (7.0%) |
| 26 to 34 Years | 2,639 (96.8%) | 87 (3.2%) |
| 35 to 44 Years | 2,212 (94.5%) | 128 (5.5%) |
| 45 to 54 Years | 2,025 (86.0%) | 330 (14.0%) |
| 55 to 64 Years | 1,838 (91.7%) | 166 (8.3%) |
| 65 to 74 Years | 1,537 (99.6%) | 7 (0.4%) |
| 75 Years and older | 753 (88.7%) | 96 (11.3%) |
| Total | 17,953 (94.4%) | 1,064 (5.6%) |
Health Insurance Coverage by Citizenship Status in Dixon
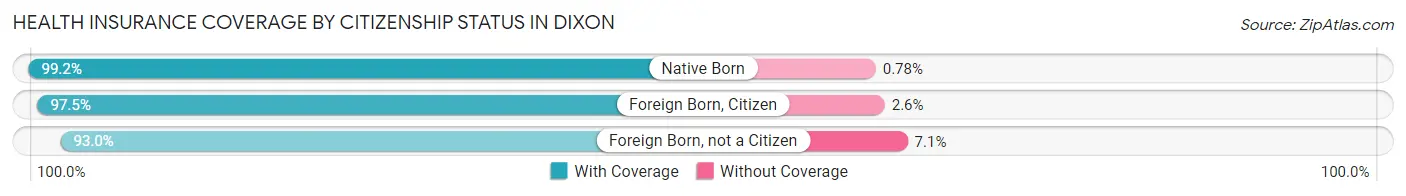
| Citizenship Status | With Coverage | Without Coverage |
| Native Born | 1,277 (99.2%) | 10 (0.8%) |
| Foreign Born, Citizen | 3,826 (97.5%) | 100 (2.5%) |
| Foreign Born, not a Citizen | 1,846 (92.9%) | 140 (7.0%) |
Health Insurance Coverage by Household Income in Dixon
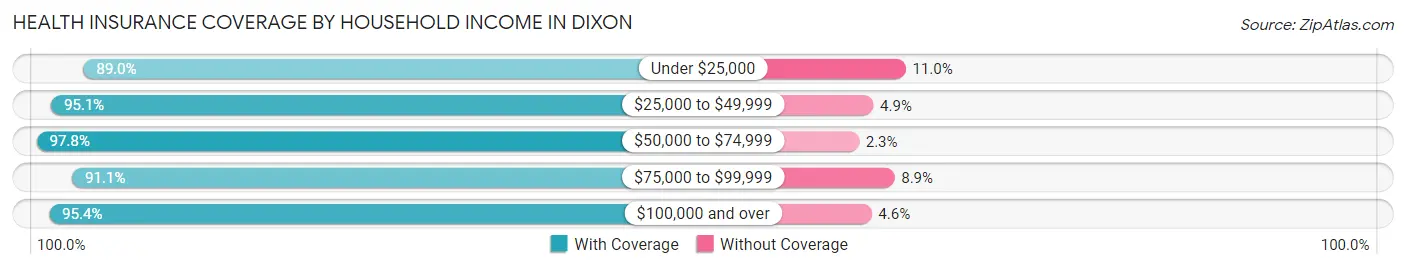
| Household Income | With Coverage | Without Coverage |
| Under $25,000 | 736 (89.0%) | 91 (11.0%) |
| $25,000 to $49,999 | 2,542 (95.1%) | 132 (4.9%) |
| $50,000 to $74,999 | 1,780 (97.8%) | 41 (2.2%) |
| $75,000 to $99,999 | 3,595 (91.1%) | 351 (8.9%) |
| $100,000 and over | 9,281 (95.4%) | 449 (4.6%) |
Public vs Private Health Insurance Coverage by Age in Dixon
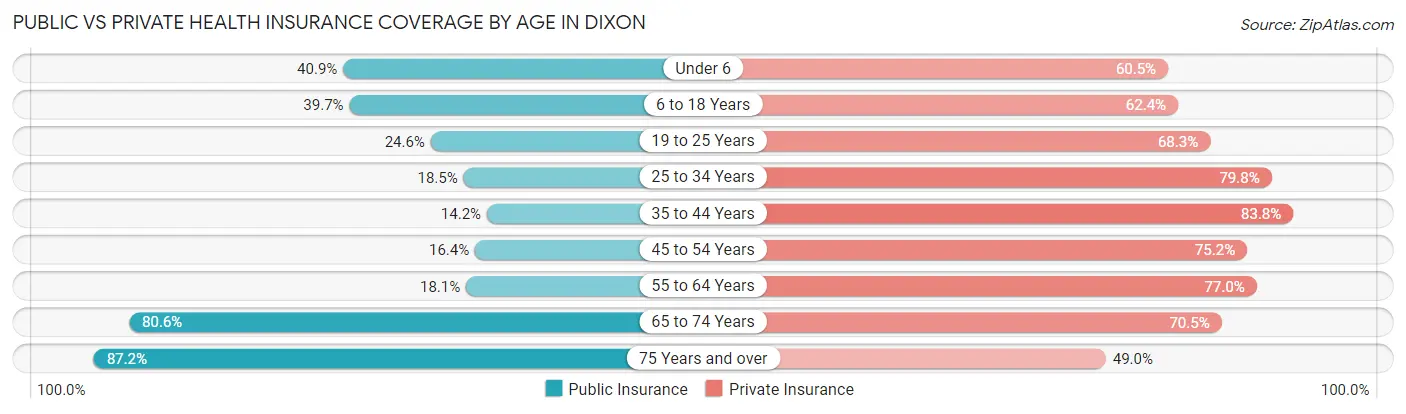
| Age Bracket | Public Insurance | Private Insurance |
| Under 6 | 526 (40.9%) | 779 (60.5%) |
| 6 to 18 Years | 1,559 (39.7%) | 2,449 (62.4%) |
| 19 to 25 Years | 489 (24.6%) | 1,357 (68.3%) |
| 25 to 34 Years | 505 (18.5%) | 2,174 (79.7%) |
| 35 to 44 Years | 332 (14.2%) | 1,960 (83.8%) |
| 45 to 54 Years | 386 (16.4%) | 1,771 (75.2%) |
| 55 to 64 Years | 362 (18.1%) | 1,543 (77.0%) |
| 65 to 74 Years | 1,245 (80.6%) | 1,088 (70.5%) |
| 75 Years and over | 740 (87.2%) | 416 (49.0%) |
| Total | 6,144 (32.3%) | 13,537 (71.2%) |
Disability Status by Sex by Age in Dixon
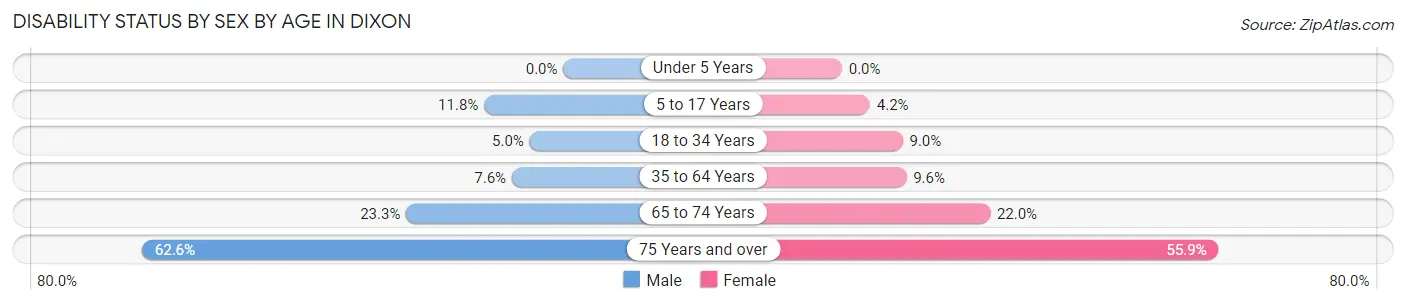
| Age Bracket | Male | Female |
| Under 5 Years | 0 (0.0%) | 0 (0.0%) |
| 5 to 17 Years | 230 (11.8%) | 75 (4.2%) |
| 18 to 34 Years | 122 (5.0%) | 228 (9.0%) |
| 35 to 64 Years | 254 (7.6%) | 323 (9.6%) |
| 65 to 74 Years | 199 (23.3%) | 152 (22.0%) |
| 75 Years and over | 189 (62.6%) | 306 (55.9%) |
Disability Class by Sex by Age in Dixon
Disability Class: Hearing Difficulty
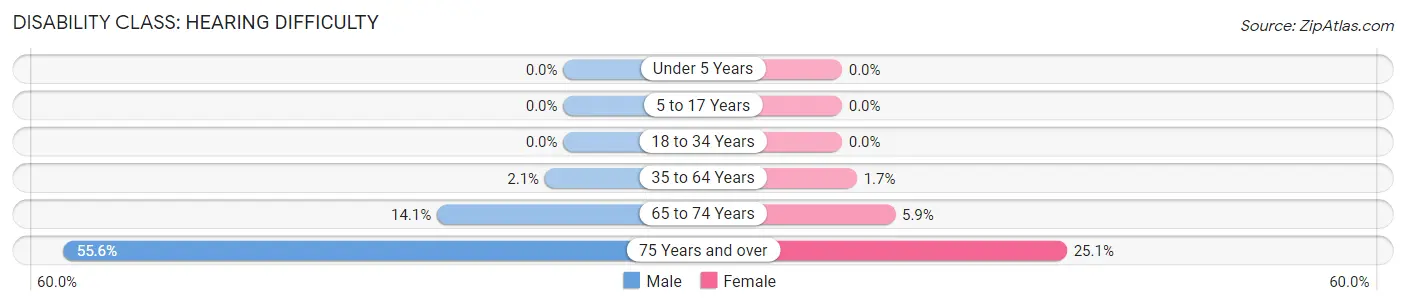
| Age Bracket | Male | Female |
| Under 5 Years | 0 (0.0%) | 0 (0.0%) |
| 5 to 17 Years | 0 (0.0%) | 0 (0.0%) |
| 18 to 34 Years | 0 (0.0%) | 0 (0.0%) |
| 35 to 64 Years | 68 (2.1%) | 56 (1.7%) |
| 65 to 74 Years | 120 (14.1%) | 41 (5.9%) |
| 75 Years and over | 168 (55.6%) | 137 (25.1%) |
Disability Class: Vision Difficulty
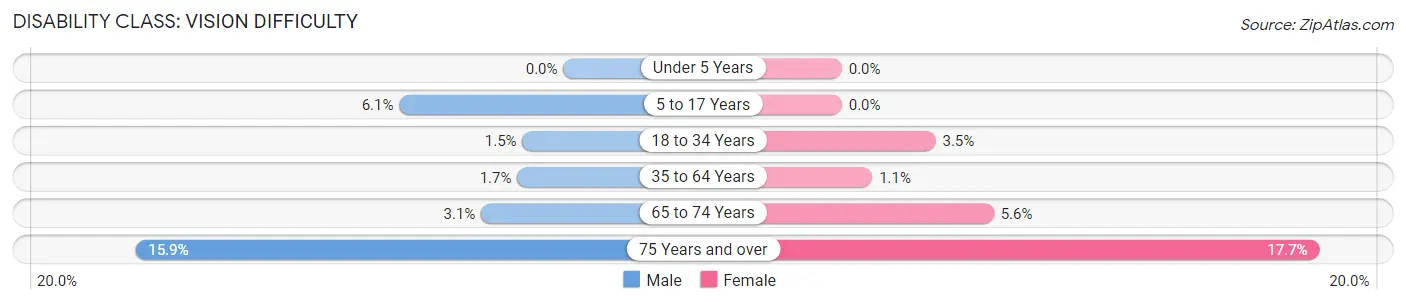
| Age Bracket | Male | Female |
| Under 5 Years | 0 (0.0%) | 0 (0.0%) |
| 5 to 17 Years | 119 (6.1%) | 0 (0.0%) |
| 18 to 34 Years | 37 (1.5%) | 88 (3.5%) |
| 35 to 64 Years | 57 (1.7%) | 38 (1.1%) |
| 65 to 74 Years | 26 (3.0%) | 39 (5.6%) |
| 75 Years and over | 48 (15.9%) | 97 (17.7%) |
Disability Class: Cognitive Difficulty
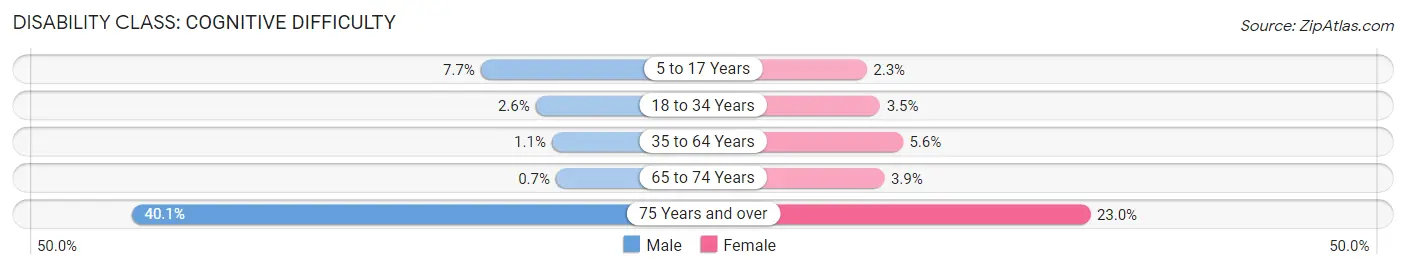
| Age Bracket | Male | Female |
| 5 to 17 Years | 150 (7.7%) | 41 (2.3%) |
| 18 to 34 Years | 63 (2.6%) | 89 (3.5%) |
| 35 to 64 Years | 36 (1.1%) | 190 (5.6%) |
| 65 to 74 Years | 6 (0.7%) | 27 (3.9%) |
| 75 Years and over | 121 (40.1%) | 126 (23.0%) |
Disability Class: Ambulatory Difficulty
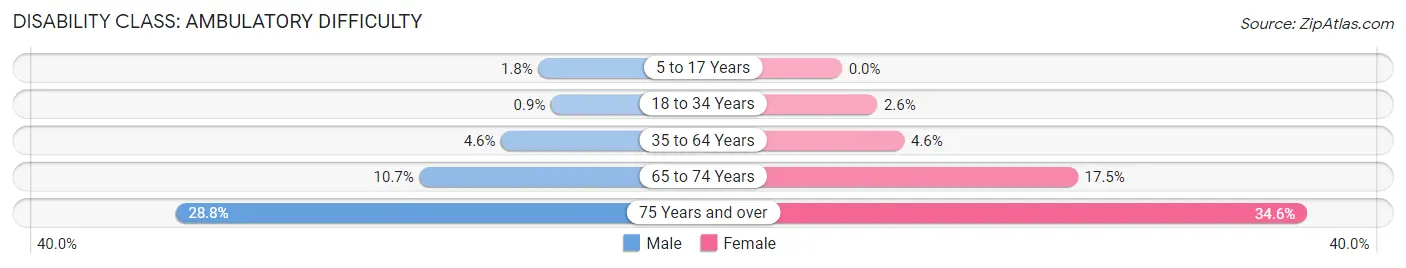
| Age Bracket | Male | Female |
| 5 to 17 Years | 36 (1.8%) | 0 (0.0%) |
| 18 to 34 Years | 22 (0.9%) | 66 (2.6%) |
| 35 to 64 Years | 153 (4.6%) | 156 (4.6%) |
| 65 to 74 Years | 91 (10.7%) | 121 (17.5%) |
| 75 Years and over | 87 (28.8%) | 189 (34.5%) |
Disability Class: Self-Care Difficulty
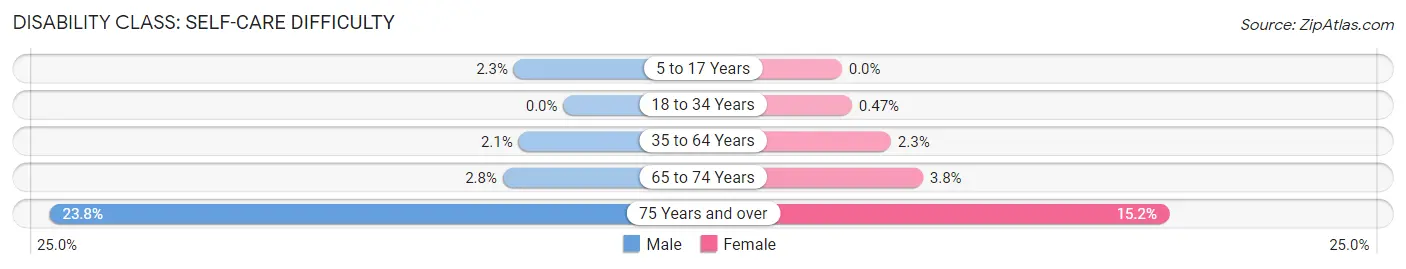
| Age Bracket | Male | Female |
| 5 to 17 Years | 45 (2.3%) | 0 (0.0%) |
| 18 to 34 Years | 0 (0.0%) | 12 (0.5%) |
| 35 to 64 Years | 69 (2.1%) | 77 (2.3%) |
| 65 to 74 Years | 24 (2.8%) | 26 (3.8%) |
| 75 Years and over | 72 (23.8%) | 83 (15.2%) |
Technology Access in Dixon
Computing Device Access in Dixon
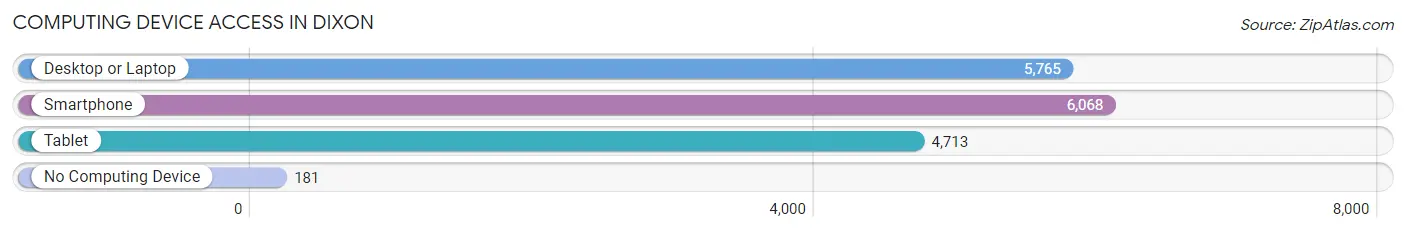
| Device Type | # Households | % Households |
| Desktop or Laptop | 5,765 | 88.8% |
| Smartphone | 6,068 | 93.5% |
| Tablet | 4,713 | 72.6% |
| No Computing Device | 181 | 2.8% |
| Total | 6,491 | 100.0% |
Internet Access in Dixon
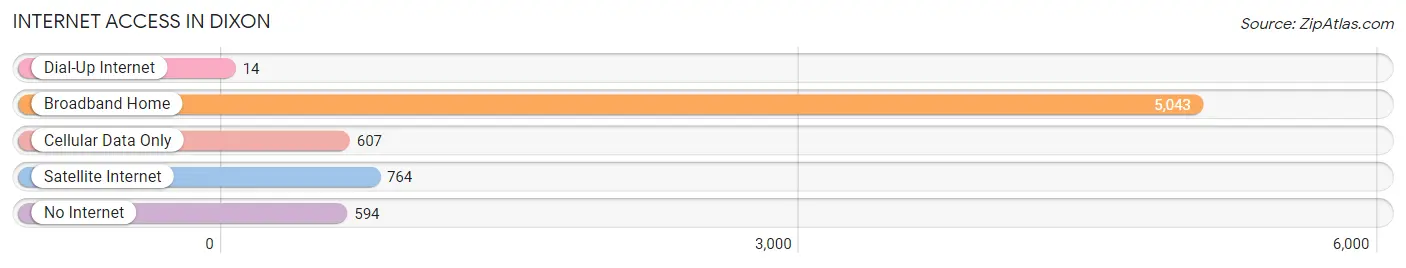
| Internet Type | # Households | % Households |
| Dial-Up Internet | 14 | 0.2% |
| Broadband Home | 5,043 | 77.7% |
| Cellular Data Only | 607 | 9.3% |
| Satellite Internet | 764 | 11.8% |
| No Internet | 594 | 9.1% |
| Total | 6,491 | 100.0% |
Dixon Summary
Dixon is a city located in Solano County, California, United States. The population was 18,351 at the 2010 census. The city was founded in 1868 by John Dixon, who named it after himself. It is the home of the Dixon May Fair, the oldest continuous event in the state of California.
History
The area around what is now Dixon was originally inhabited by the Patwin Native American tribe. In 1841, John Dixon, a settler from the east coast, purchased the land from the Patwin tribe and established a ranch. In 1868, he founded the town of Dixon and named it after himself.
The town grew slowly but steadily, and by the early 1900s, it had become a thriving agricultural center. The town was incorporated in 1914, and the first mayor was elected in 1915.
In the 1920s, the town began to expand, and the population grew to over 1,000. The city was connected to the rest of the state by the construction of a railroad line in the 1930s.
In the 1950s, the town began to experience a period of rapid growth, and the population increased to over 5,000. This growth was fueled by the expansion of the nearby Travis Air Force Base and the growth of the local agricultural industry.
In the 1970s, the city experienced a period of decline, as the agricultural industry began to decline and the population began to decrease. However, in the 1980s, the city began to experience a period of revitalization, as new businesses began to move into the area and the population began to increase.
Geography
Dixon is located in the northern part of Solano County, in the Central Valley region of California. It is situated at the intersection of Interstate 80 and State Route 113. The city is located about 20 miles southwest of Sacramento and about 50 miles northeast of San Francisco.
The city has a total area of 5.3 square miles, all of which is land. The city is located in a flat, agricultural area, and is surrounded by farmland. The city is located in the Suisun Valley, which is known for its mild climate and fertile soil.
Economy
Dixon is a small city with a diverse economy. The city is home to a variety of businesses, including manufacturing, retail, and agriculture.
The city is home to several large employers, including the Dixon Unified School District, the Solano County Office of Education, and the Dixon May Fair. The city is also home to several smaller businesses, including a variety of restaurants, retail stores, and service providers.
Agriculture is an important part of the local economy. The city is home to several large farms, and the surrounding area is known for its production of tomatoes, corn, and other crops.
Demographics
As of the 2010 census, the population of Dixon was 18,351. The racial makeup of the city was 68.3% White, 1.3% African American, 0.7% Native American, 1.7% Asian, 0.2% Pacific Islander, 24.3% from other races, and 3.7% from two or more races. Hispanic or Latino of any race were 44.2% of the population.
The median household income in Dixon was $60,945, and the median family income was $68,945. The per capita income in Dixon was $25,945. About 11.3% of the population was below the poverty line.
Conclusion
Dixon is a small city located in Solano County, California. The city was founded in 1868 by John Dixon, and has since grown to become a thriving agricultural center. The city has a diverse economy, with a variety of businesses, including manufacturing, retail, and agriculture. The population of Dixon was 18,351 at the 2010 census, and the median household income was $60,945. Dixon is known for its mild climate and fertile soil, and is home to several large employers, including the Dixon Unified School District and the Dixon May Fair.
Common Questions
What is Per Capita Income in Dixon?
Per Capita income in Dixon is $40,095.
What is the Median Family Income in Dixon?
Median Family Income in Dixon is $94,405.
What is the Median Household income in Dixon?
Median Household Income in Dixon is $92,138.
What is Income or Wage Gap in Dixon?
Income or Wage Gap in Dixon is 19.0%.
Women in Dixon earn 81.0 cents for every dollar earned by a man.
What is Inequality or Gini Index in Dixon?
Inequality or Gini Index in Dixon is 0.40.
What is the Total Population of Dixon?
Total Population of Dixon is 19,071.
What is the Total Male Population of Dixon?
Total Male Population of Dixon is 9,622.
What is the Total Female Population of Dixon?
Total Female Population of Dixon is 9,449.
What is the Ratio of Males per 100 Females in Dixon?
There are 101.83 Males per 100 Females in Dixon.
What is the Ratio of Females per 100 Males in Dixon?
There are 98.20 Females per 100 Males in Dixon.
What is the Median Population Age in Dixon?
Median Population Age in Dixon is 33.5 Years.
What is the Average Family Size in Dixon
Average Family Size in Dixon is 3.3 People.
What is the Average Household Size in Dixon
Average Household Size in Dixon is 2.9 People.
How Large is the Labor Force in Dixon?
There are 10,474 People in the Labor Forcein in Dixon.
What is the Percentage of People in the Labor Force in Dixon?
71.7% of People are in the Labor Force in Dixon.
What is the Unemployment Rate in Dixon?
Unemployment Rate in Dixon is 3.2%.