Deer Park, CA Map & Demographics
Deer Park Map
Deer Park Overview
$77,504
PER CAPITA INCOME
$158,594
AVG FAMILY INCOME
$104,830
AVG HOUSEHOLD INCOME
26.5%
WAGE / INCOME GAP [ % ]
73.5¢/ $1
WAGE / INCOME GAP [ $ ]
0.50
INEQUALITY / GINI INDEX
835
TOTAL POPULATION
359
MALE POPULATION
476
FEMALE POPULATION
75.42
MALES / 100 FEMALES
132.59
FEMALES / 100 MALES
49.5
MEDIAN AGE
2.6
AVG FAMILY SIZE
2.1
AVG HOUSEHOLD SIZE
484
LABOR FORCE [ PEOPLE ]
66.0%
PERCENT IN LABOR FORCE
0.8%
UNEMPLOYMENT RATE
Deer Park Zip Codes
Deer Park Area Codes
Income in Deer Park
Income Overview in Deer Park
Per Capita Income in Deer Park is $77,504, while median incomes of families and households are $158,594 and $104,830 respectively.
| Characteristic | Number | Measure |
| Per Capita Income | 835 | $77,504 |
| Median Family Income | 180 | $158,594 |
| Mean Family Income | 180 | $224,229 |
| Median Household Income | 379 | $104,830 |
| Mean Household Income | 379 | $163,603 |
| Income Deficit | 180 | $0 |
| Wage / Income Gap (%) | 835 | 26.54% |
| Wage / Income Gap ($) | 835 | 73.46¢ per $1 |
| Gini / Inequality Index | 835 | 0.50 |
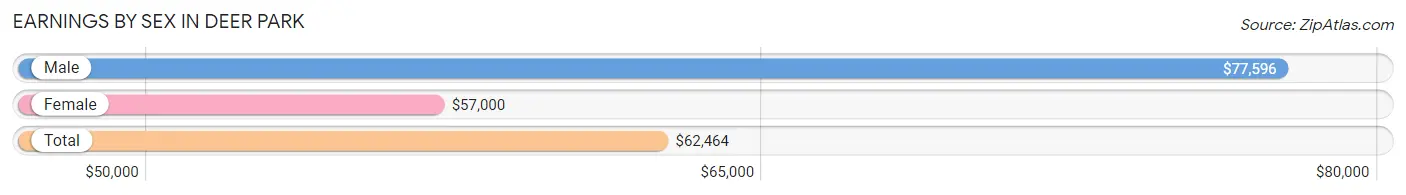
Earnings by Sex in Deer Park
Average Earnings in Deer Park are $62,464, $77,596 for men and $57,000 for women, a difference of 26.5%.
| Sex | Number | Average Earnings |
| Male | 281 (55.4%) | $77,596 |
| Female | 226 (44.6%) | $57,000 |
| Total | 507 (100.0%) | $62,464 |
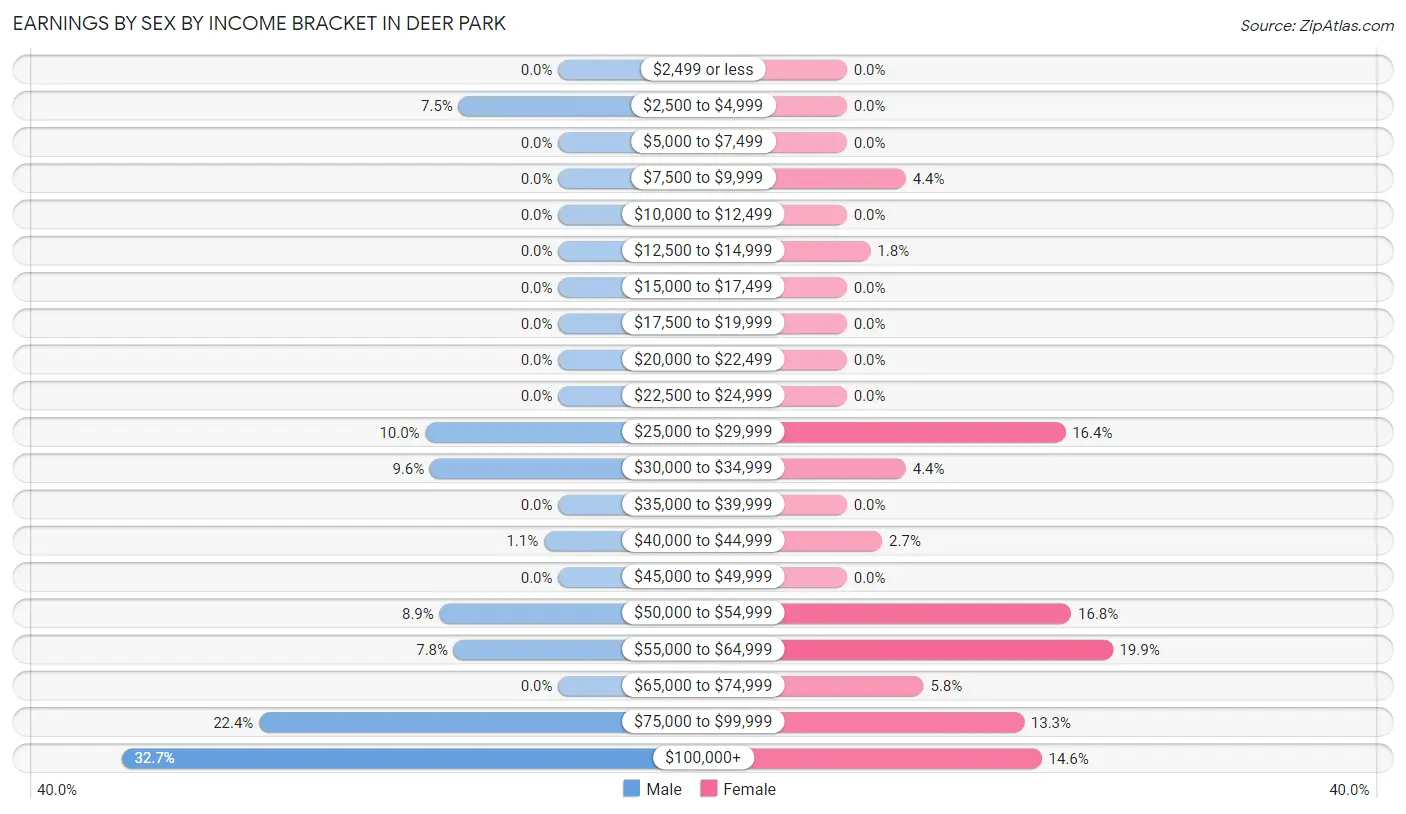
Earnings by Sex by Income Bracket in Deer Park
The most common earnings brackets in Deer Park are $100,000+ for men (92 | 32.7%) and $55,000 to $64,999 for women (45 | 19.9%).
| Income | Male | Female |
| $2,499 or less | 0 (0.0%) | 0 (0.0%) |
| $2,500 to $4,999 | 21 (7.5%) | 0 (0.0%) |
| $5,000 to $7,499 | 0 (0.0%) | 0 (0.0%) |
| $7,500 to $9,999 | 0 (0.0%) | 10 (4.4%) |
| $10,000 to $12,499 | 0 (0.0%) | 0 (0.0%) |
| $12,500 to $14,999 | 0 (0.0%) | 4 (1.8%) |
| $15,000 to $17,499 | 0 (0.0%) | 0 (0.0%) |
| $17,500 to $19,999 | 0 (0.0%) | 0 (0.0%) |
| $20,000 to $22,499 | 0 (0.0%) | 0 (0.0%) |
| $22,500 to $24,999 | 0 (0.0%) | 0 (0.0%) |
| $25,000 to $29,999 | 28 (10.0%) | 37 (16.4%) |
| $30,000 to $34,999 | 27 (9.6%) | 10 (4.4%) |
| $35,000 to $39,999 | 0 (0.0%) | 0 (0.0%) |
| $40,000 to $44,999 | 3 (1.1%) | 6 (2.6%) |
| $45,000 to $49,999 | 0 (0.0%) | 0 (0.0%) |
| $50,000 to $54,999 | 25 (8.9%) | 38 (16.8%) |
| $55,000 to $64,999 | 22 (7.8%) | 45 (19.9%) |
| $65,000 to $74,999 | 0 (0.0%) | 13 (5.8%) |
| $75,000 to $99,999 | 63 (22.4%) | 30 (13.3%) |
| $100,000+ | 92 (32.7%) | 33 (14.6%) |
| Total | 281 (100.0%) | 226 (100.0%) |
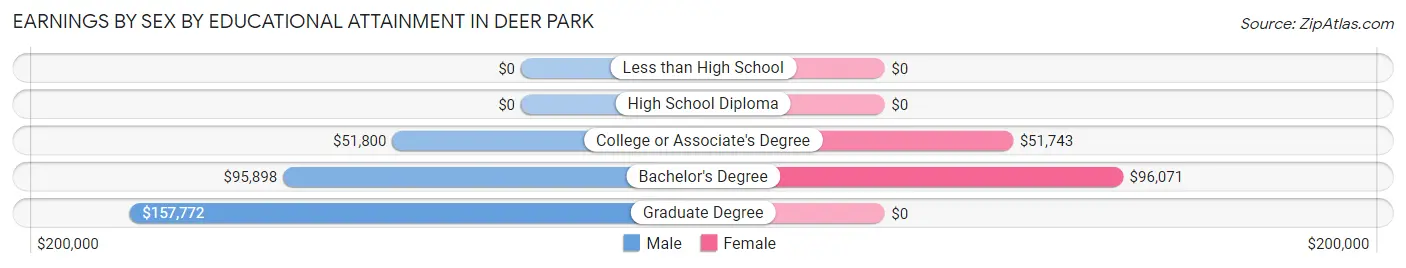
Earnings by Sex by Educational Attainment in Deer Park
Average earnings in Deer Park are $77,596 for men and $60,214 for women, a difference of 22.4%. Men with an educational attainment of graduate degree enjoy the highest average annual earnings of $157,772, while those with college or associate's degree education earn the least with $51,800. Women with an educational attainment of bachelor's degree earn the most with the average annual earnings of $96,071, while those with college or associate's degree education have the smallest earnings of $51,743.
| Educational Attainment | Male Income | Female Income |
| Less than High School | - | - |
| High School Diploma | - | - |
| College or Associate's Degree | $51,800 | $51,743 |
| Bachelor's Degree | $95,898 | $96,071 |
| Graduate Degree | $157,772 | $0 |
| Total | $77,596 | $60,214 |
Family Income in Deer Park
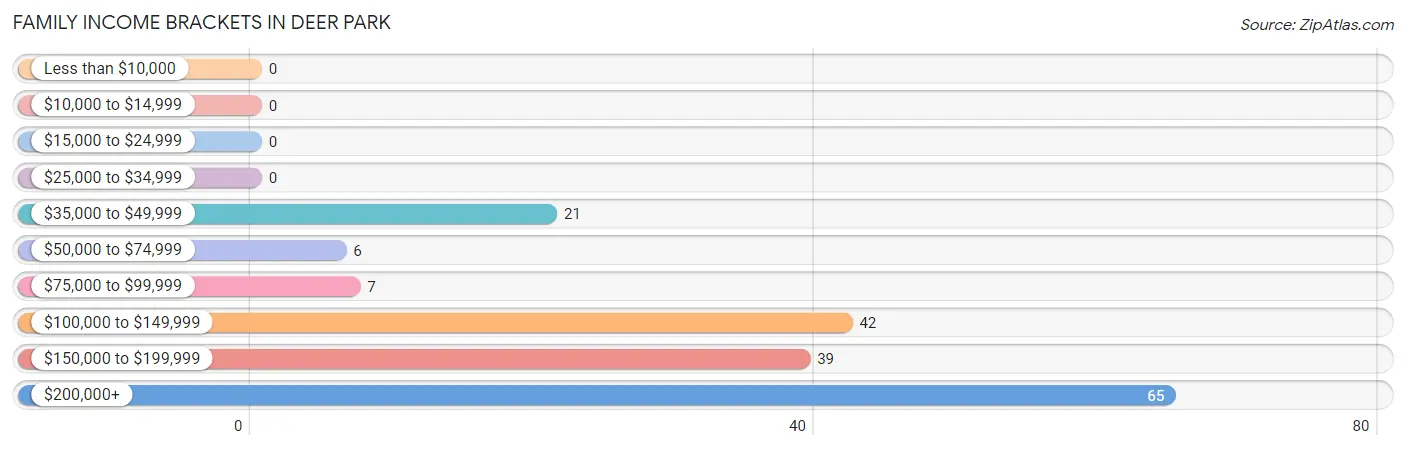
Family Income Brackets in Deer Park
According to the Deer Park family income data, there are 65 families falling into the $200,000+ income range, which is the most common income bracket and makes up 36.1% of all families.
| Income Bracket | # Families | % Families |
| Less than $10,000 | 0 | 0.0% |
| $10,000 to $14,999 | 0 | 0.0% |
| $15,000 to $24,999 | 0 | 0.0% |
| $25,000 to $34,999 | 0 | 0.0% |
| $35,000 to $49,999 | 21 | 11.7% |
| $50,000 to $74,999 | 6 | 3.3% |
| $75,000 to $99,999 | 7 | 3.9% |
| $100,000 to $149,999 | 42 | 23.3% |
| $150,000 to $199,999 | 39 | 21.7% |
| $200,000+ | 65 | 36.1% |
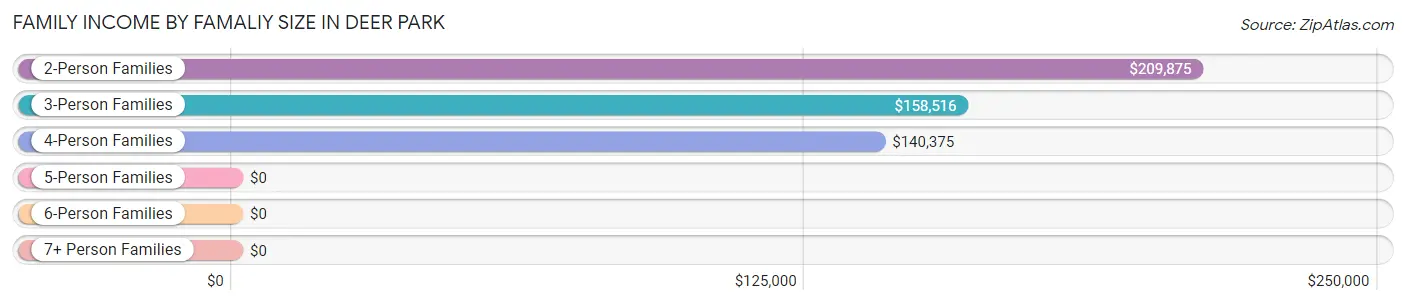
Family Income by Famaliy Size in Deer Park
2-person families (91 | 50.6%) account for the highest median family income in Deer Park with $209,875 per family, while 2-person families (91 | 50.6%) have the highest median income of $104,938 per family member.
| Income Bracket | # Families | Median Income |
| 2-Person Families | 91 (50.6%) | $209,875 |
| 3-Person Families | 58 (32.2%) | $158,516 |
| 4-Person Families | 31 (17.2%) | $140,375 |
| 5-Person Families | 0 (0.0%) | $0 |
| 6-Person Families | 0 (0.0%) | $0 |
| 7+ Person Families | 0 (0.0%) | $0 |
| Total | 180 (100.0%) | $158,594 |
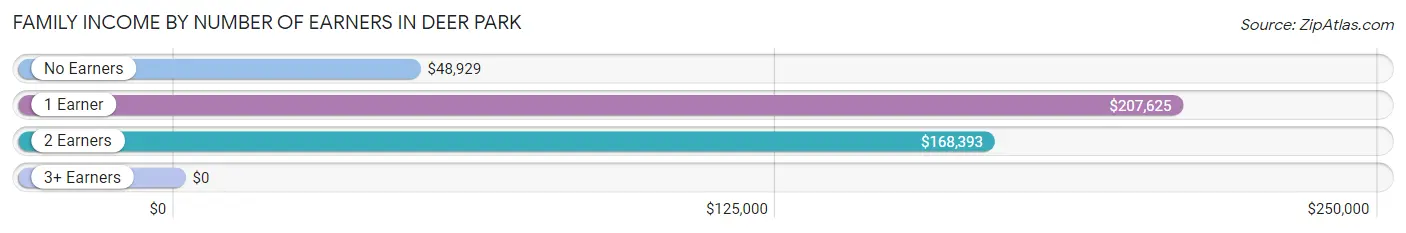
Family Income by Number of Earners in Deer Park
| Number of Earners | # Families | Median Income |
| No Earners | 32 (17.8%) | $48,929 |
| 1 Earner | 61 (33.9%) | $207,625 |
| 2 Earners | 77 (42.8%) | $168,393 |
| 3+ Earners | 10 (5.6%) | $0 |
| Total | 180 (100.0%) | $158,594 |
Household Income in Deer Park
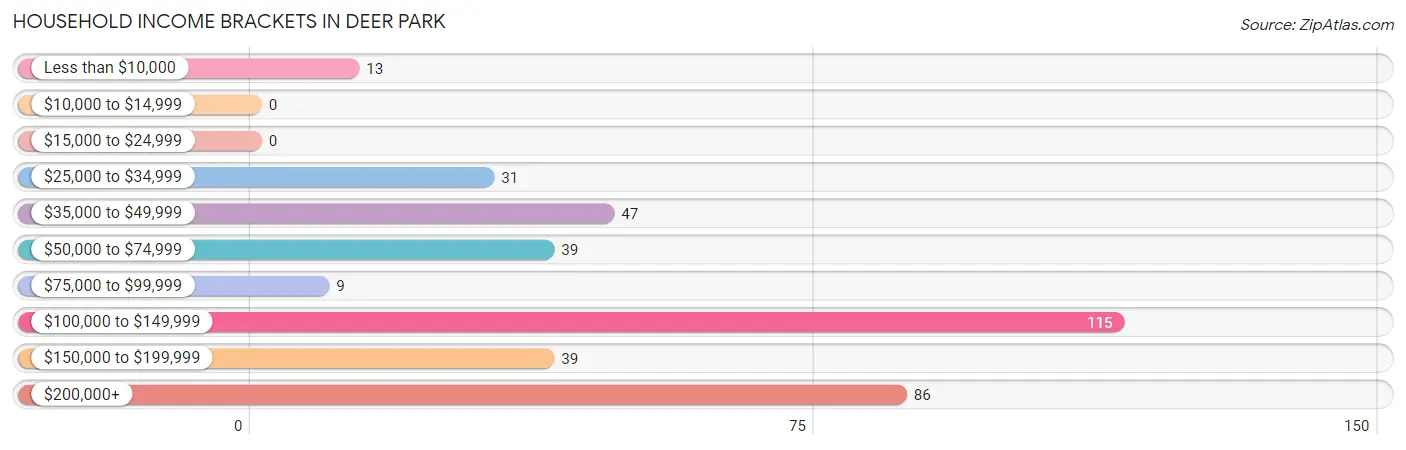
Household Income Brackets in Deer Park
With 115 households falling in the category, the $100,000 to $149,999 income range is the most frequent in Deer Park, accounting for 30.3% of all households.
| Income Bracket | # Households | % Households |
| Less than $10,000 | 13 | 3.4% |
| $10,000 to $14,999 | 0 | 0.0% |
| $15,000 to $24,999 | 0 | 0.0% |
| $25,000 to $34,999 | 31 | 8.2% |
| $35,000 to $49,999 | 47 | 12.4% |
| $50,000 to $74,999 | 39 | 10.3% |
| $75,000 to $99,999 | 9 | 2.4% |
| $100,000 to $149,999 | 115 | 30.3% |
| $150,000 to $199,999 | 39 | 10.3% |
| $200,000+ | 86 | 22.7% |
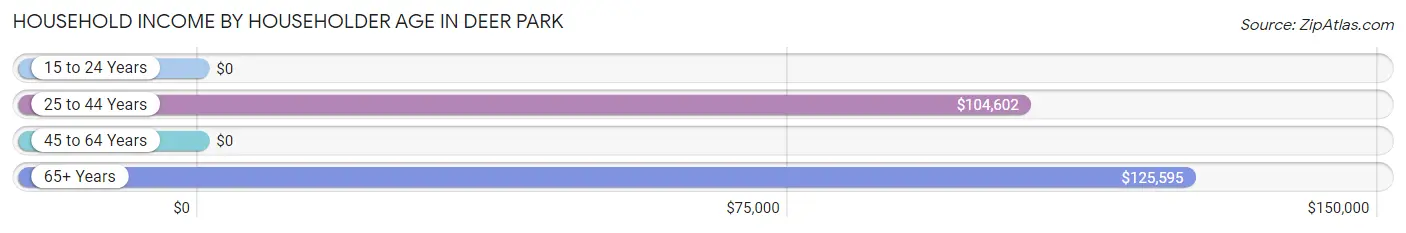
Household Income by Householder Age in Deer Park
The median household income in Deer Park is $104,830, with the highest median household income of $125,595 found in the 65+ years age bracket for the primary householder. A total of 158 households (41.7%) fall into this category.
| Income Bracket | # Households | Median Income |
| 15 to 24 Years | 0 (0.0%) | $0 |
| 25 to 44 Years | 97 (25.6%) | $104,602 |
| 45 to 64 Years | 124 (32.7%) | $0 |
| 65+ Years | 158 (41.7%) | $125,595 |
| Total | 379 (100.0%) | $104,830 |
Poverty in Deer Park
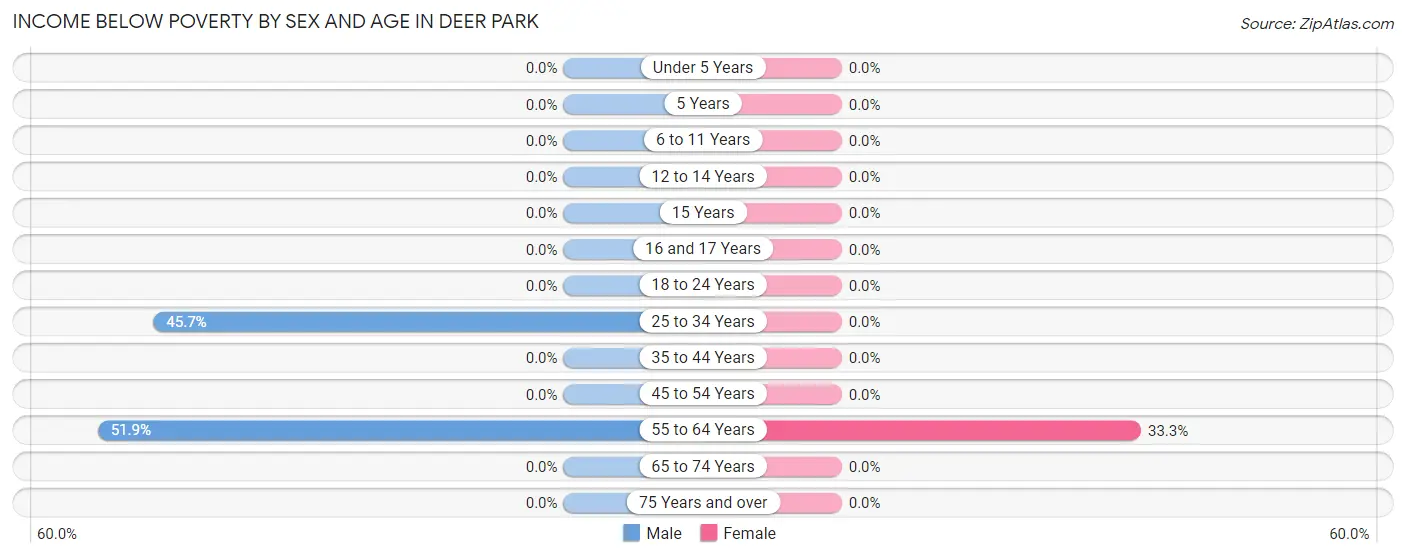
Income Below Poverty by Sex and Age in Deer Park
With 9.8% poverty level for males and 3.1% for females among the residents of Deer Park, 55 to 64 year old males and 55 to 64 year old females are the most vulnerable to poverty, with 14 males (51.8%) and 13 females (33.3%) in their respective age groups living below the poverty level.
| Age Bracket | Male | Female |
| Under 5 Years | 0 (0.0%) | 0 (0.0%) |
| 5 Years | 0 (0.0%) | 0 (0.0%) |
| 6 to 11 Years | 0 (0.0%) | 0 (0.0%) |
| 12 to 14 Years | 0 (0.0%) | 0 (0.0%) |
| 15 Years | 0 (0.0%) | 0 (0.0%) |
| 16 and 17 Years | 0 (0.0%) | 0 (0.0%) |
| 18 to 24 Years | 0 (0.0%) | 0 (0.0%) |
| 25 to 34 Years | 21 (45.7%) | 0 (0.0%) |
| 35 to 44 Years | 0 (0.0%) | 0 (0.0%) |
| 45 to 54 Years | 0 (0.0%) | 0 (0.0%) |
| 55 to 64 Years | 14 (51.8%) | 13 (33.3%) |
| 65 to 74 Years | 0 (0.0%) | 0 (0.0%) |
| 75 Years and over | 0 (0.0%) | 0 (0.0%) |
| Total | 35 (9.8%) | 13 (3.1%) |
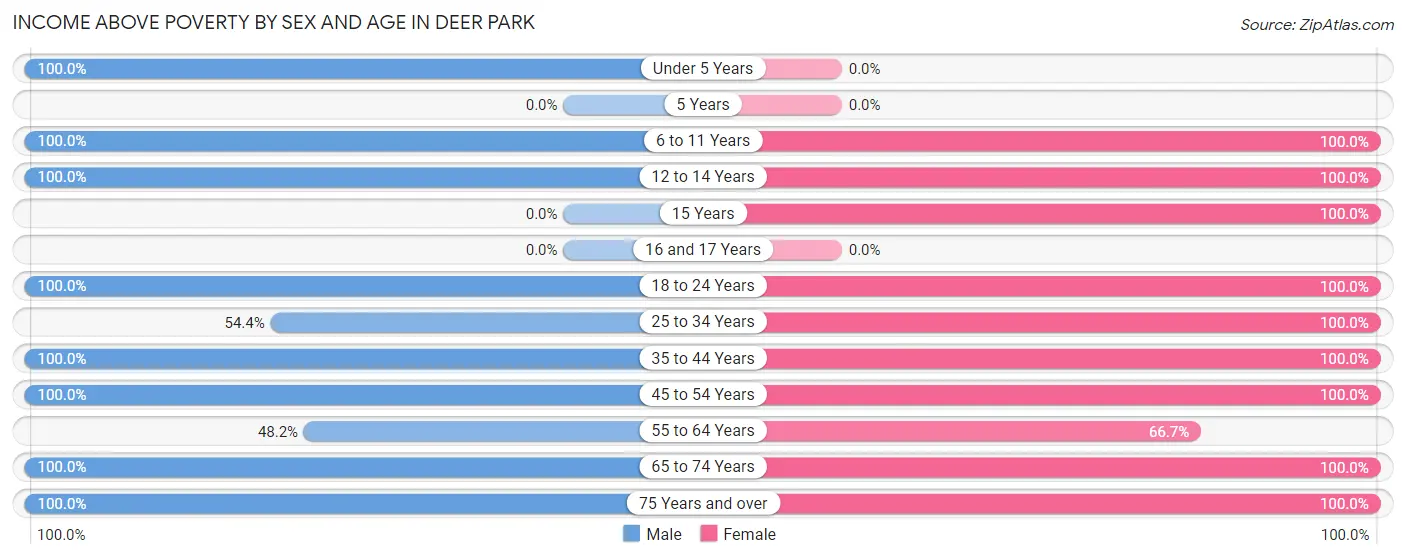
Income Above Poverty by Sex and Age in Deer Park
According to the poverty statistics in Deer Park, males aged under 5 years and females aged 6 to 11 years are the age groups that are most secure financially, with 100.0% of males and 100.0% of females in these age groups living above the poverty line.
| Age Bracket | Male | Female |
| Under 5 Years | 14 (100.0%) | 0 (0.0%) |
| 5 Years | 0 (0.0%) | 0 (0.0%) |
| 6 to 11 Years | 6 (100.0%) | 58 (100.0%) |
| 12 to 14 Years | 10 (100.0%) | 2 (100.0%) |
| 15 Years | 0 (0.0%) | 12 (100.0%) |
| 16 and 17 Years | 0 (0.0%) | 0 (0.0%) |
| 18 to 24 Years | 2 (100.0%) | 10 (100.0%) |
| 25 to 34 Years | 25 (54.3%) | 43 (100.0%) |
| 35 to 44 Years | 53 (100.0%) | 42 (100.0%) |
| 45 to 54 Years | 93 (100.0%) | 100 (100.0%) |
| 55 to 64 Years | 13 (48.1%) | 26 (66.7%) |
| 65 to 74 Years | 44 (100.0%) | 80 (100.0%) |
| 75 Years and over | 64 (100.0%) | 34 (100.0%) |
| Total | 324 (90.2%) | 407 (96.9%) |
Income Below Poverty Among Married-Couple Families in Deer Park
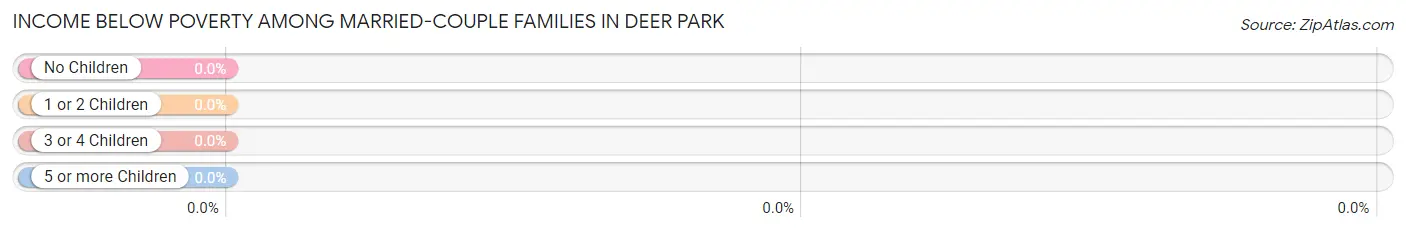
| Children | Above Poverty | Below Poverty |
| No Children | 91 (100.0%) | 0 (0.0%) |
| 1 or 2 Children | 87 (100.0%) | 0 (0.0%) |
| 3 or 4 Children | 0 (0.0%) | 0 (0.0%) |
| 5 or more Children | 0 (0.0%) | 0 (0.0%) |
| Total | 178 (100.0%) | 0 (0.0%) |
Income Below Poverty Among Single-Parent Households in Deer Park
| Children | Single Father | Single Mother |
| No Children | 0 (0.0%) | 0 (0.0%) |
| 1 or 2 Children | 0 (0.0%) | 0 (0.0%) |
| 3 or 4 Children | 0 (0.0%) | 0 (0.0%) |
| 5 or more Children | 0 (0.0%) | 0 (0.0%) |
| Total | 0 (0.0%) | 0 (0.0%) |
Income Below Poverty Among Married-Couple vs Single-Parent Households in Deer Park
| Children | Married-Couple Families | Single-Parent Households |
| No Children | 0 (0.0%) | 0 (0.0%) |
| 1 or 2 Children | 0 (0.0%) | 0 (0.0%) |
| 3 or 4 Children | 0 (0.0%) | 0 (0.0%) |
| 5 or more Children | 0 (0.0%) | 0 (0.0%) |
| Total | 0 (0.0%) | 0 (0.0%) |
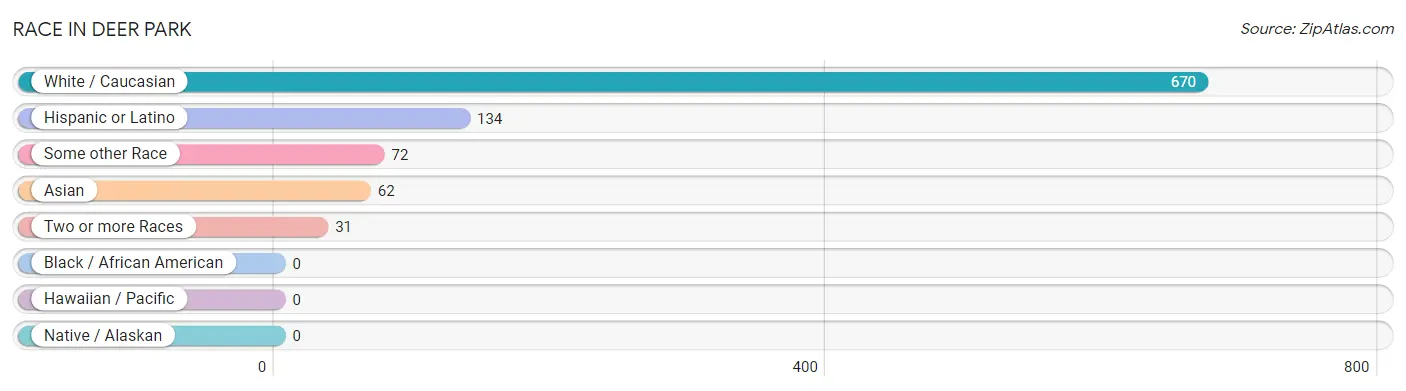
Race in Deer Park
The most populous races in Deer Park are White / Caucasian (670 | 80.2%), Hispanic or Latino (134 | 16.1%), and Some other Race (72 | 8.6%).
| Race | # Population | % Population |
| Asian | 62 | 7.4% |
| Black / African American | 0 | 0.0% |
| Hawaiian / Pacific | 0 | 0.0% |
| Hispanic or Latino | 134 | 16.1% |
| Native / Alaskan | 0 | 0.0% |
| White / Caucasian | 670 | 80.2% |
| Two or more Races | 31 | 3.7% |
| Some other Race | 72 | 8.6% |
| Total | 835 | 100.0% |
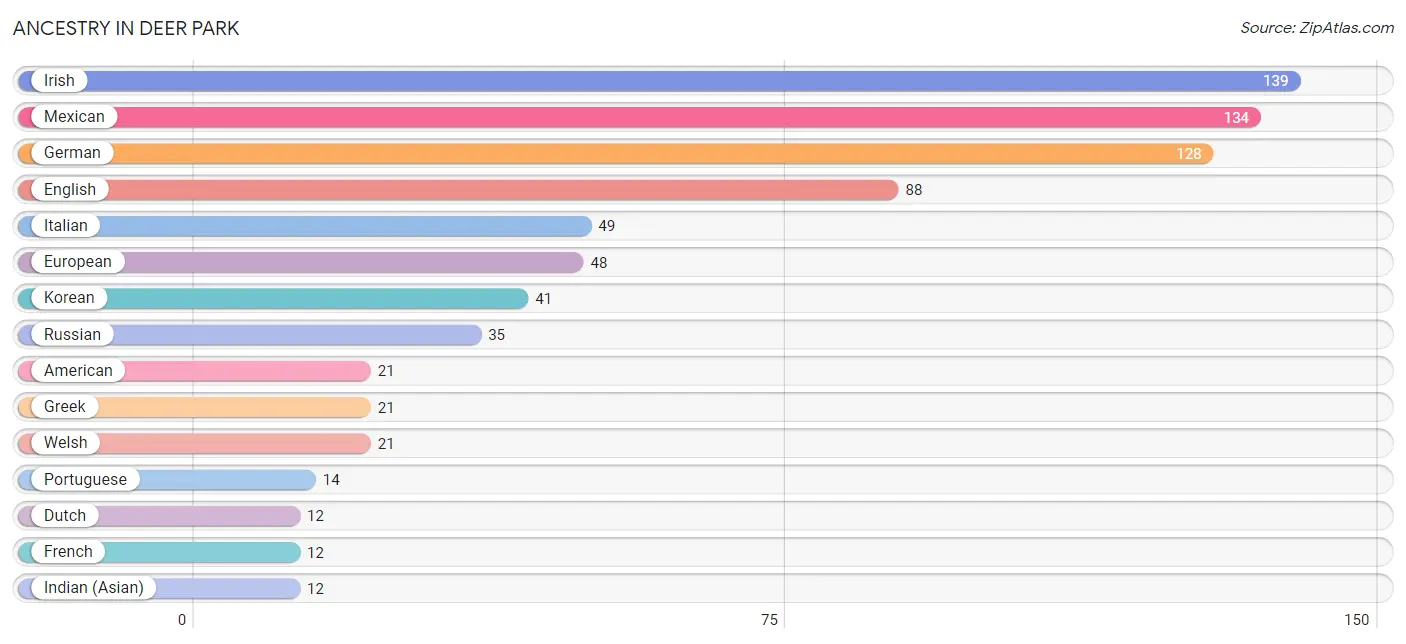
Ancestry in Deer Park
The most populous ancestries reported in Deer Park are Irish (139 | 16.7%), Mexican (134 | 16.1%), German (128 | 15.3%), English (88 | 10.5%), and Italian (49 | 5.9%), together accounting for 64.4% of all Deer Park residents.
| Ancestry | # Population | % Population |
| American | 21 | 2.5% |
| Dutch | 12 | 1.4% |
| Eastern European | 6 | 0.7% |
| English | 88 | 10.5% |
| European | 48 | 5.8% |
| French | 12 | 1.4% |
| German | 128 | 15.3% |
| Greek | 21 | 2.5% |
| Indian (Asian) | 12 | 1.4% |
| Irish | 139 | 16.7% |
| Italian | 49 | 5.9% |
| Korean | 41 | 4.9% |
| Laotian | 9 | 1.1% |
| Mexican | 134 | 16.1% |
| Portuguese | 14 | 1.7% |
| Russian | 35 | 4.2% |
| Swiss | 10 | 1.2% |
| Welsh | 21 | 2.5% | View All 18 Rows |
Immigrants in Deer Park
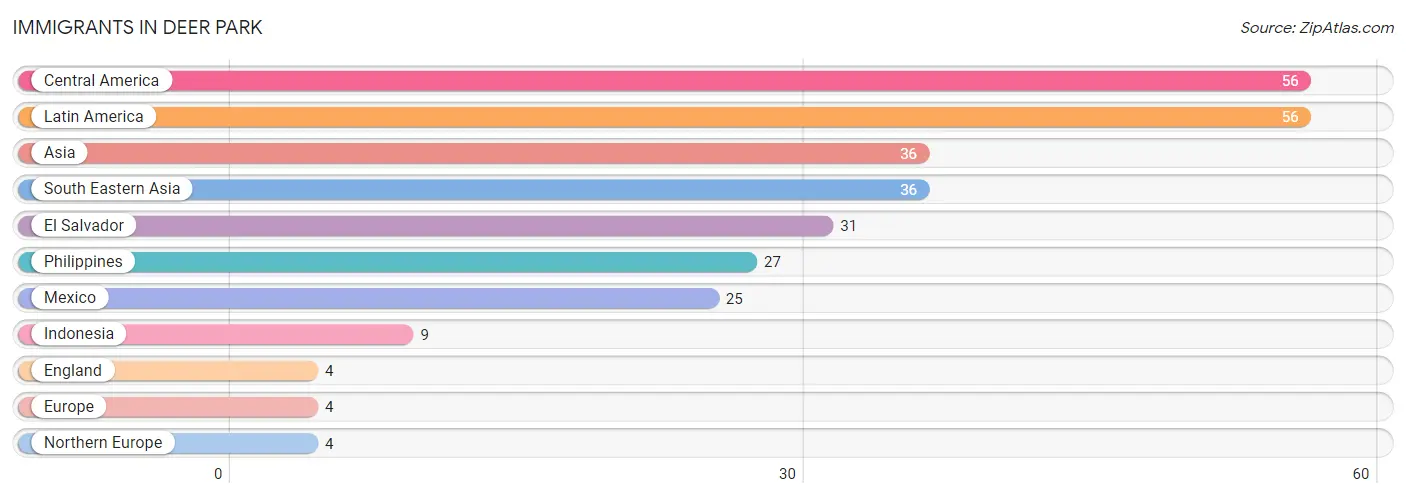
The most numerous immigrant groups reported in Deer Park came from Central America (56 | 6.7%), Latin America (56 | 6.7%), Asia (36 | 4.3%), South Eastern Asia (36 | 4.3%), and El Salvador (31 | 3.7%), together accounting for 25.8% of all Deer Park residents.
| Immigration Origin | # Population | % Population |
| Asia | 36 | 4.3% |
| Central America | 56 | 6.7% |
| El Salvador | 31 | 3.7% |
| England | 4 | 0.5% |
| Europe | 4 | 0.5% |
| Indonesia | 9 | 1.1% |
| Latin America | 56 | 6.7% |
| Mexico | 25 | 3.0% |
| Northern Europe | 4 | 0.5% |
| Philippines | 27 | 3.2% |
| South Eastern Asia | 36 | 4.3% | View All 11 Rows |
Sex and Age in Deer Park
Sex and Age in Deer Park
The most populous age groups in Deer Park are 50 to 54 Years (58 | 16.2%) for men and 45 to 49 Years (90 | 18.9%) for women.
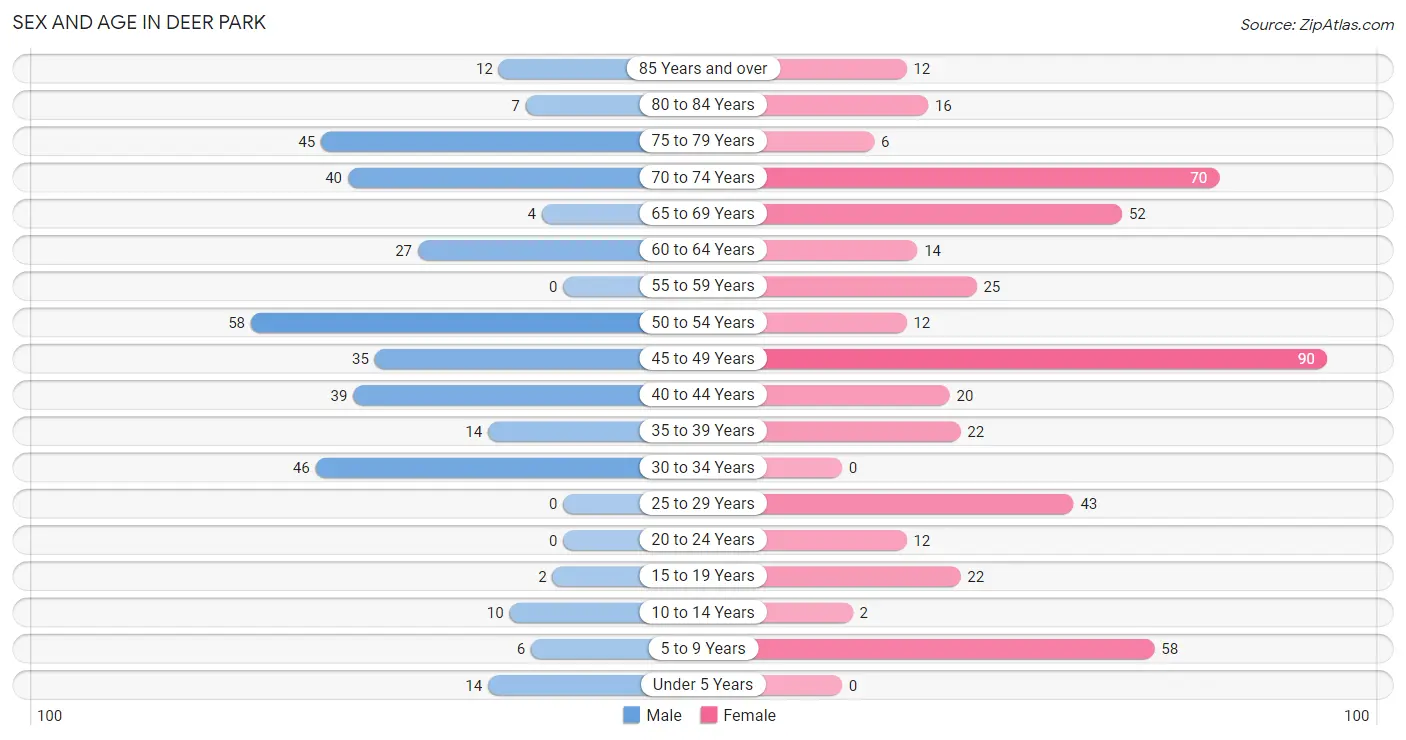
| Age Bracket | Male | Female |
| Under 5 Years | 14 (3.9%) | 0 (0.0%) |
| 5 to 9 Years | 6 (1.7%) | 58 (12.2%) |
| 10 to 14 Years | 10 (2.8%) | 2 (0.4%) |
| 15 to 19 Years | 2 (0.6%) | 22 (4.6%) |
| 20 to 24 Years | 0 (0.0%) | 12 (2.5%) |
| 25 to 29 Years | 0 (0.0%) | 43 (9.0%) |
| 30 to 34 Years | 46 (12.8%) | 0 (0.0%) |
| 35 to 39 Years | 14 (3.9%) | 22 (4.6%) |
| 40 to 44 Years | 39 (10.9%) | 20 (4.2%) |
| 45 to 49 Years | 35 (9.8%) | 90 (18.9%) |
| 50 to 54 Years | 58 (16.2%) | 12 (2.5%) |
| 55 to 59 Years | 0 (0.0%) | 25 (5.2%) |
| 60 to 64 Years | 27 (7.5%) | 14 (2.9%) |
| 65 to 69 Years | 4 (1.1%) | 52 (10.9%) |
| 70 to 74 Years | 40 (11.1%) | 70 (14.7%) |
| 75 to 79 Years | 45 (12.5%) | 6 (1.3%) |
| 80 to 84 Years | 7 (1.9%) | 16 (3.4%) |
| 85 Years and over | 12 (3.3%) | 12 (2.5%) |
| Total | 359 (100.0%) | 476 (100.0%) |
Families and Households in Deer Park
Median Family Size in Deer Park
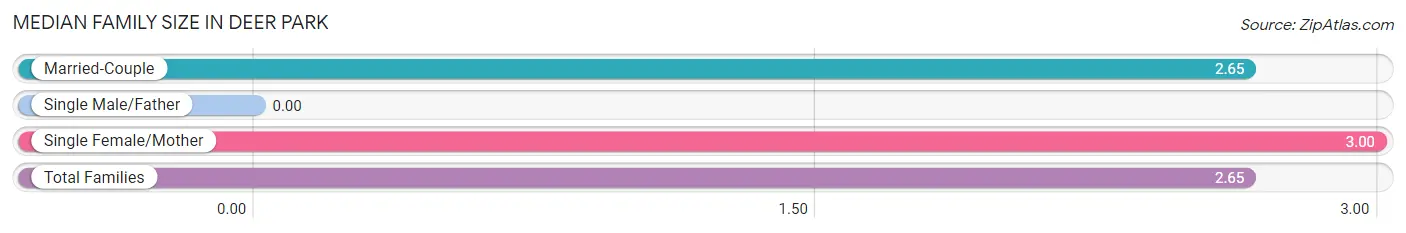
| Family Type | # Families | Family Size |
| Married-Couple | 178 (98.9%) | 2.65 |
| Single Male/Father | 0 (0.0%) | - |
| Single Female/Mother | 2 (1.1%) | 3.00 |
| Total Families | 180 (100.0%) | 2.65 |
Median Household Size in Deer Park
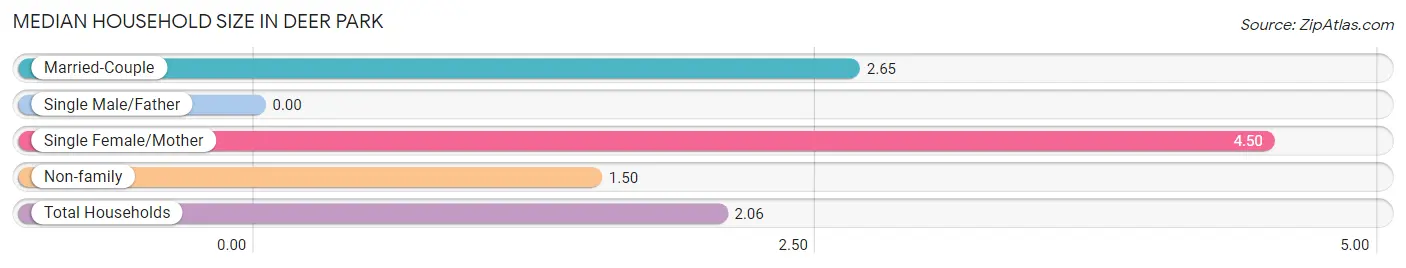
| Household Type | # Households | Household Size |
| Married-Couple | 178 (47.0%) | 2.65 |
| Single Male/Father | 0 (0.0%) | - |
| Single Female/Mother | 2 (0.5%) | 4.50 |
| Non-family | 199 (52.5%) | 1.50 |
| Total Households | 379 (100.0%) | 2.06 |
Household Size by Marriage Status in Deer Park
Out of a total of 379 households in Deer Park, 180 (47.5%) are family households, while 199 (52.5%) are nonfamily households. The most numerous type of family households are 2-person households, comprising 91, and the most common type of nonfamily households are 1-person households, comprising 139.
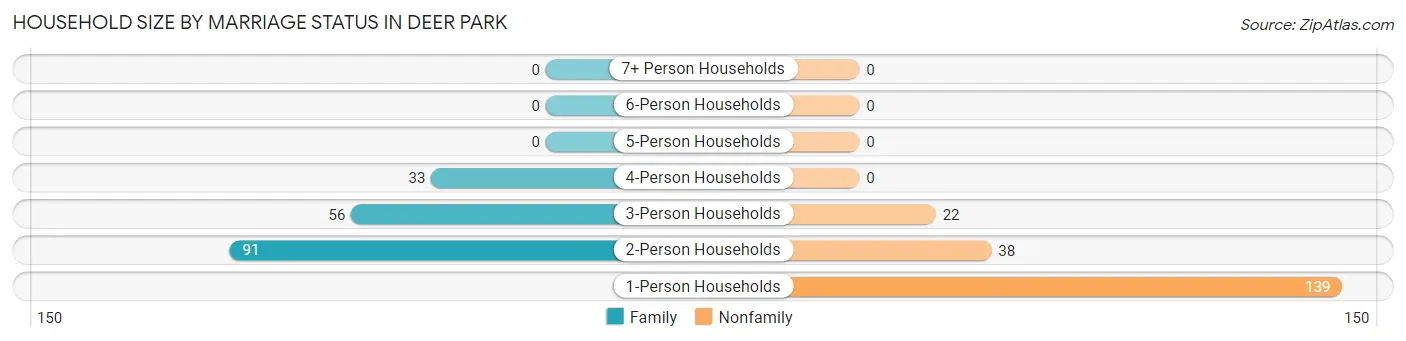
| Household Size | Family Households | Nonfamily Households |
| 1-Person Households | - | 139 (36.7%) |
| 2-Person Households | 91 (24.0%) | 38 (10.0%) |
| 3-Person Households | 56 (14.8%) | 22 (5.8%) |
| 4-Person Households | 33 (8.7%) | 0 (0.0%) |
| 5-Person Households | 0 (0.0%) | 0 (0.0%) |
| 6-Person Households | 0 (0.0%) | 0 (0.0%) |
| 7+ Person Households | 0 (0.0%) | 0 (0.0%) |
| Total | 180 (47.5%) | 199 (52.5%) |
Female Fertility in Deer Park
Fertility by Age in Deer Park
| Age Bracket | Women with Births | Births / 1,000 Women |
| 15 to 19 years | 0 (0.0%) | 0.0 |
| 20 to 34 years | 0 (0.0%) | 0.0 |
| 35 to 50 years | 0 (0.0%) | 0.0 |
| Total | 0 (0.0%) | 0.0 |
Fertility by Age by Marriage Status in Deer Park
| Age Bracket | Married | Unmarried |
| 15 to 19 years | 0 (0.0%) | 0 (0.0%) |
| 20 to 34 years | 0 (0.0%) | 0 (0.0%) |
| 35 to 50 years | 0 (0.0%) | 0 (0.0%) |
| Total | 0 (0.0%) | 0 (0.0%) |
Fertility by Education in Deer Park
| Educational Attainment | Women with Births | Births / 1,000 Women |
| Less than High School | 0 (0.0%) | 0.0 |
| High School Diploma | 0 (0.0%) | 0.0 |
| College or Associate's Degree | 0 (0.0%) | 0.0 |
| Bachelor's Degree | 0 (0.0%) | 0.0 |
| Graduate Degree | 0 (0.0%) | 0.0 |
| Total | 0 (0.0%) | 0.0 |
Fertility by Education by Marriage Status in Deer Park
| Educational Attainment | Married | Unmarried |
| Less than High School | 0 (0.0%) | 0 (0.0%) |
| High School Diploma | 0 (0.0%) | 0 (0.0%) |
| College or Associate's Degree | 0 (0.0%) | 0 (0.0%) |
| Bachelor's Degree | 0 (0.0%) | 0 (0.0%) |
| Graduate Degree | 0 (0.0%) | 0 (0.0%) |
| Total | 0 (0.0%) | 0 (0.0%) |
Employment Characteristics in Deer Park
Employment by Class of Employer in Deer Park
Among the 458 employed individuals in Deer Park, private company employees (306 | 66.8%), not-for-profit organizations (62 | 13.5%), and self-employed (not incorporated) (48 | 10.5%) make up the most common classes of employment.
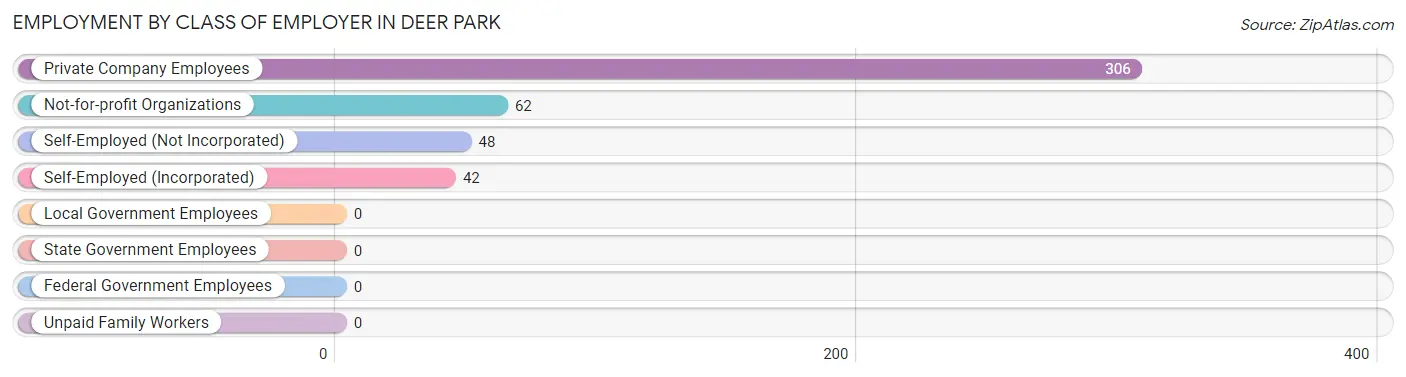
| Employer Class | # Employees | % Employees |
| Private Company Employees | 306 | 66.8% |
| Self-Employed (Incorporated) | 42 | 9.2% |
| Self-Employed (Not Incorporated) | 48 | 10.5% |
| Not-for-profit Organizations | 62 | 13.5% |
| Local Government Employees | 0 | 0.0% |
| State Government Employees | 0 | 0.0% |
| Federal Government Employees | 0 | 0.0% |
| Unpaid Family Workers | 0 | 0.0% |
| Total | 458 | 100.0% |
Employment Status by Age in Deer Park
According to the labor force statistics for Deer Park, out of the total population over 16 years of age (733), 66.0% or 484 individuals are in the labor force, with 0.8% or 4 of them unemployed. The age group with the highest labor force participation rate is 25 to 29 years, with 100.0% or 43 individuals in the labor force. Within the labor force, the 65 to 74 years age range has the highest percentage of unemployed individuals, with 5.7% or 4 of them being unemployed.
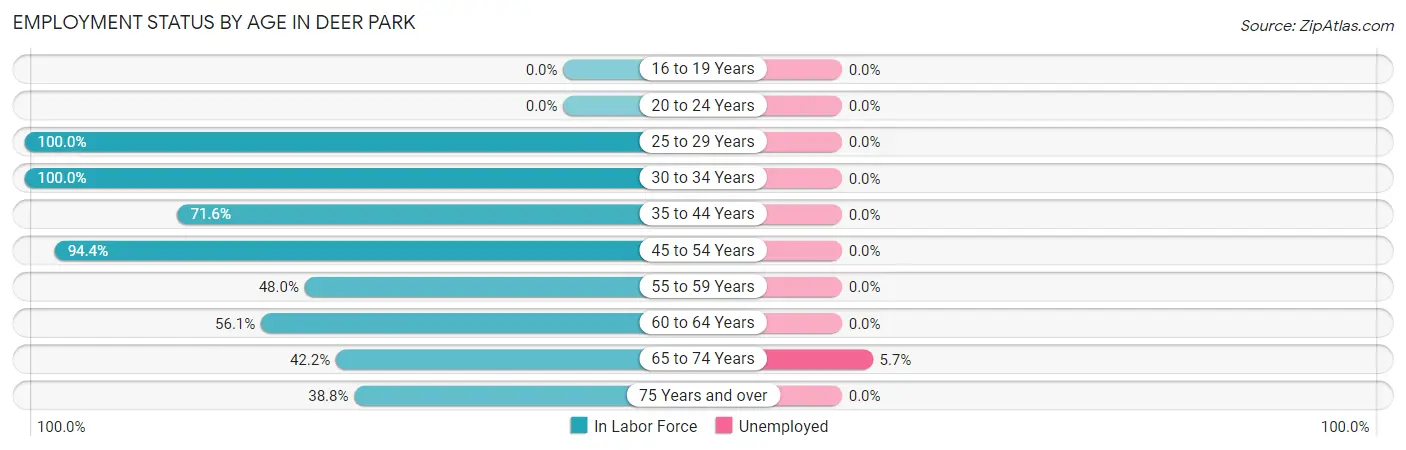
| Age Bracket | In Labor Force | Unemployed |
| 16 to 19 Years | 0 (0.0%) | 0 (0.0%) |
| 20 to 24 Years | 0 (0.0%) | 0 (0.0%) |
| 25 to 29 Years | 43 (100.0%) | 0 (0.0%) |
| 30 to 34 Years | 46 (100.0%) | 0 (0.0%) |
| 35 to 44 Years | 68 (71.6%) | 0 (0.0%) |
| 45 to 54 Years | 184 (94.4%) | 0 (0.0%) |
| 55 to 59 Years | 12 (48.0%) | 0 (0.0%) |
| 60 to 64 Years | 23 (56.1%) | 0 (0.0%) |
| 65 to 74 Years | 70 (42.2%) | 4 (5.7%) |
| 75 Years and over | 38 (38.8%) | 0 (0.0%) |
| Total | 484 (66.0%) | 4 (0.8%) |
Employment Status by Educational Attainment in Deer Park
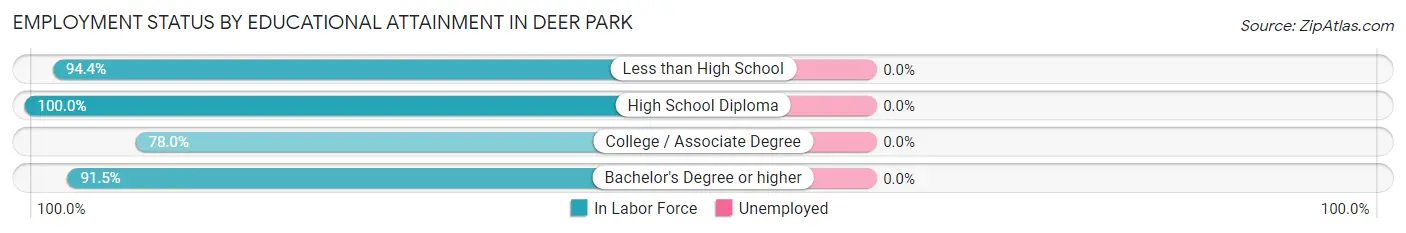
| Educational Attainment | In Labor Force | Unemployed |
| Less than High School | 34 (94.4%) | 0 (0.0%) |
| High School Diploma | 11 (100.0%) | 0 (0.0%) |
| College / Associate Degree | 191 (78.0%) | 0 (0.0%) |
| Bachelor's Degree or higher | 140 (91.5%) | 0 (0.0%) |
| Total | 376 (84.5%) | 0 (0.0%) |
Employment Occupations by Sex in Deer Park
Management, Business, Science and Arts Occupations
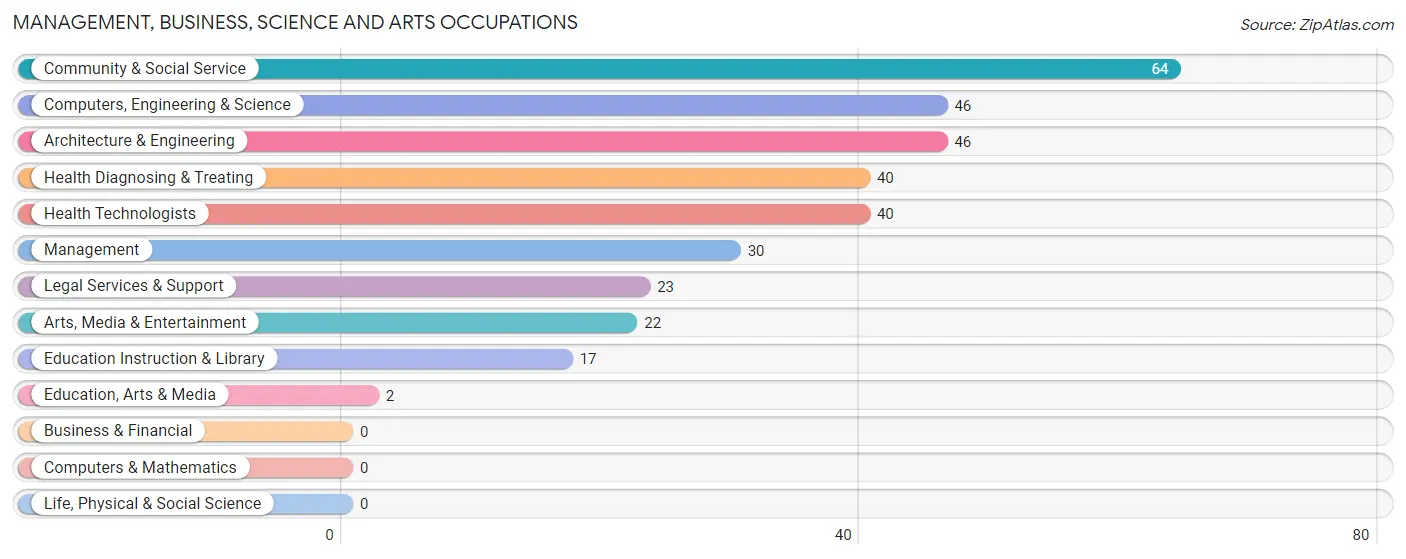
The most common Management, Business, Science and Arts occupations in Deer Park are Community & Social Service (64 | 13.3%), Computers, Engineering & Science (46 | 9.6%), Architecture & Engineering (46 | 9.6%), Health Diagnosing & Treating (40 | 8.3%), and Health Technologists (40 | 8.3%).
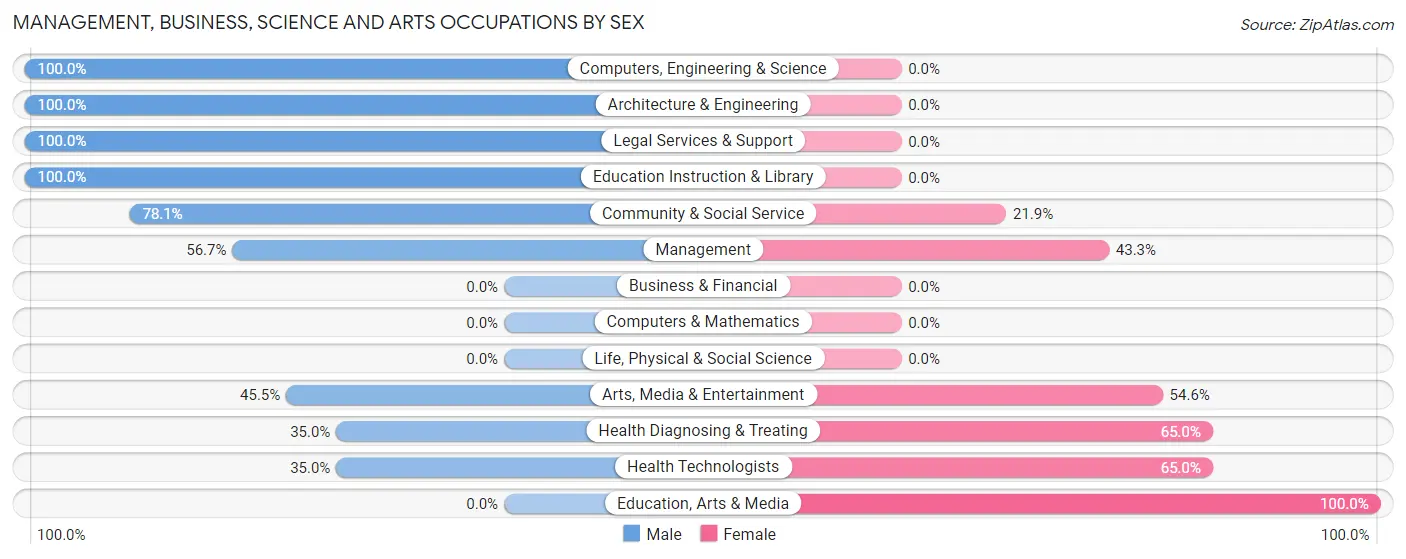
Management, Business, Science and Arts Occupations by Sex
Within the Management, Business, Science and Arts occupations in Deer Park, the most male-oriented occupations are Computers, Engineering & Science (100.0%), Architecture & Engineering (100.0%), and Legal Services & Support (100.0%), while the most female-oriented occupations are Education, Arts & Media (100.0%), Health Diagnosing & Treating (65.0%), and Health Technologists (65.0%).
| Occupation | Male | Female |
| Management | 17 (56.7%) | 13 (43.3%) |
| Business & Financial | 0 (0.0%) | 0 (0.0%) |
| Computers, Engineering & Science | 46 (100.0%) | 0 (0.0%) |
| Computers & Mathematics | 0 (0.0%) | 0 (0.0%) |
| Architecture & Engineering | 46 (100.0%) | 0 (0.0%) |
| Life, Physical & Social Science | 0 (0.0%) | 0 (0.0%) |
| Community & Social Service | 50 (78.1%) | 14 (21.9%) |
| Education, Arts & Media | 0 (0.0%) | 2 (100.0%) |
| Legal Services & Support | 23 (100.0%) | 0 (0.0%) |
| Education Instruction & Library | 17 (100.0%) | 0 (0.0%) |
| Arts, Media & Entertainment | 10 (45.5%) | 12 (54.5%) |
| Health Diagnosing & Treating | 14 (35.0%) | 26 (65.0%) |
| Health Technologists | 14 (35.0%) | 26 (65.0%) |
| Total (Category) | 127 (70.6%) | 53 (29.4%) |
| Total (Overall) | 281 (58.5%) | 199 (41.5%) |
Services Occupations
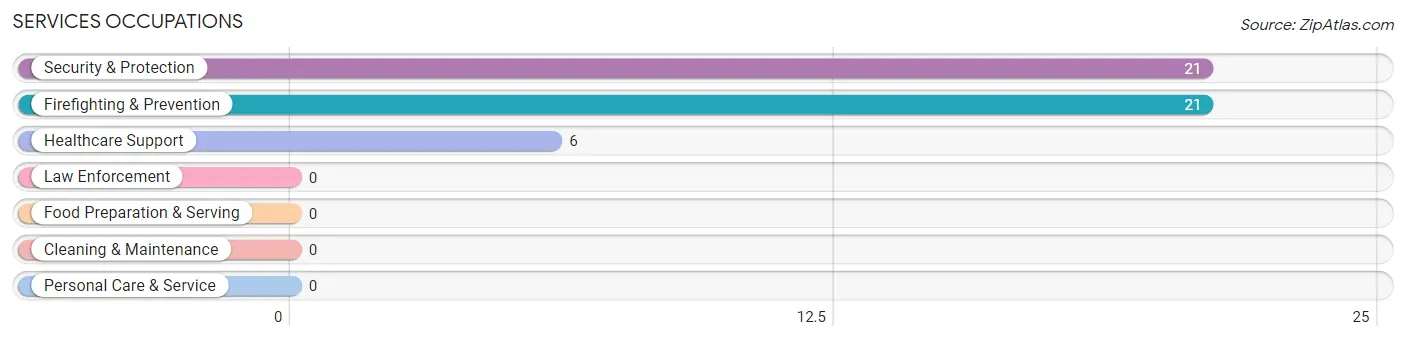
The most common Services occupations in Deer Park are Security & Protection (21 | 4.4%), Firefighting & Prevention (21 | 4.4%), and Healthcare Support (6 | 1.3%).
Services Occupations by Sex
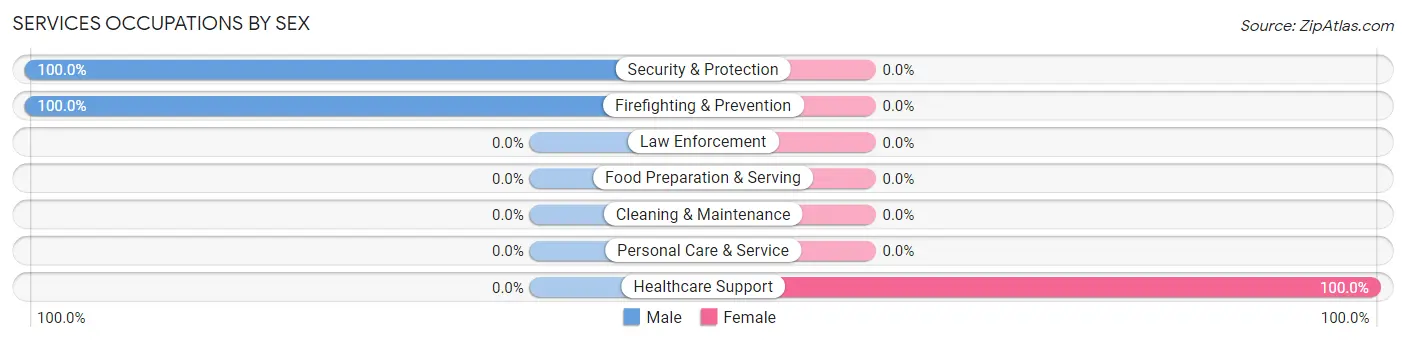
| Occupation | Male | Female |
| Healthcare Support | 0 (0.0%) | 6 (100.0%) |
| Security & Protection | 21 (100.0%) | 0 (0.0%) |
| Firefighting & Prevention | 21 (100.0%) | 0 (0.0%) |
| Law Enforcement | 0 (0.0%) | 0 (0.0%) |
| Food Preparation & Serving | 0 (0.0%) | 0 (0.0%) |
| Cleaning & Maintenance | 0 (0.0%) | 0 (0.0%) |
| Personal Care & Service | 0 (0.0%) | 0 (0.0%) |
| Total (Category) | 21 (77.8%) | 6 (22.2%) |
| Total (Overall) | 281 (58.5%) | 199 (41.5%) |
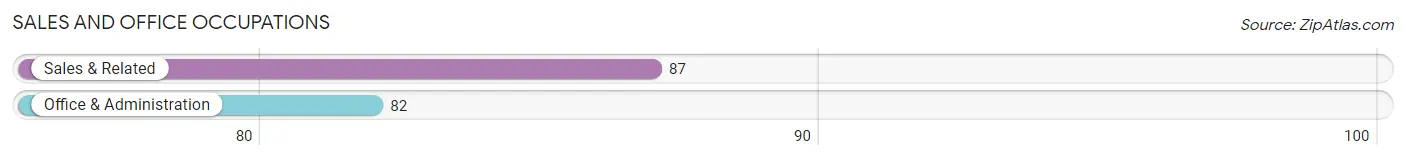
Sales and Office Occupations
The most common Sales and Office occupations in Deer Park are Sales & Related (87 | 18.1%), and Office & Administration (82 | 17.1%).
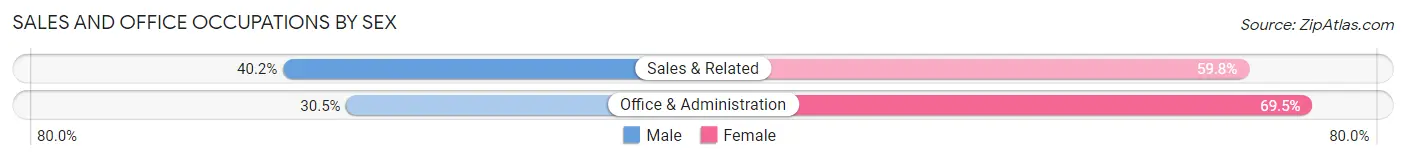
Sales and Office Occupations by Sex
| Occupation | Male | Female |
| Sales & Related | 35 (40.2%) | 52 (59.8%) |
| Office & Administration | 25 (30.5%) | 57 (69.5%) |
| Total (Category) | 60 (35.5%) | 109 (64.5%) |
| Total (Overall) | 281 (58.5%) | 199 (41.5%) |
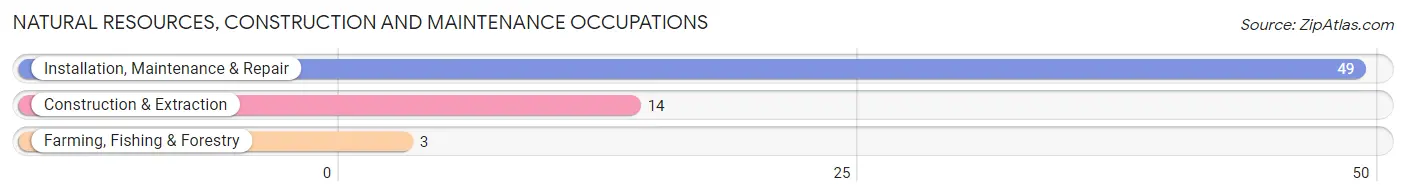
Natural Resources, Construction and Maintenance Occupations
The most common Natural Resources, Construction and Maintenance occupations in Deer Park are Installation, Maintenance & Repair (49 | 10.2%), Construction & Extraction (14 | 2.9%), and Farming, Fishing & Forestry (3 | 0.6%).
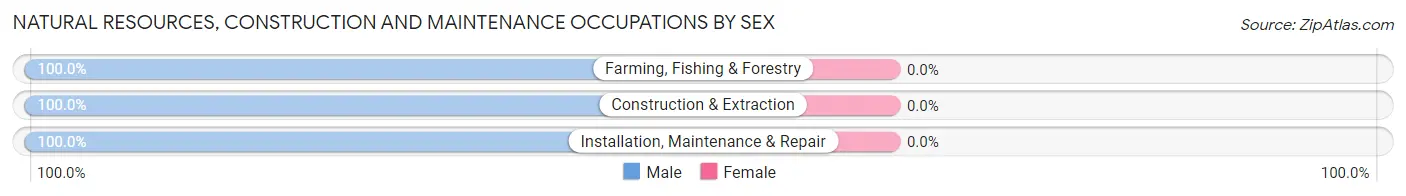
Natural Resources, Construction and Maintenance Occupations by Sex
| Occupation | Male | Female |
| Farming, Fishing & Forestry | 3 (100.0%) | 0 (0.0%) |
| Construction & Extraction | 14 (100.0%) | 0 (0.0%) |
| Installation, Maintenance & Repair | 49 (100.0%) | 0 (0.0%) |
| Total (Category) | 66 (100.0%) | 0 (0.0%) |
| Total (Overall) | 281 (58.5%) | 199 (41.5%) |
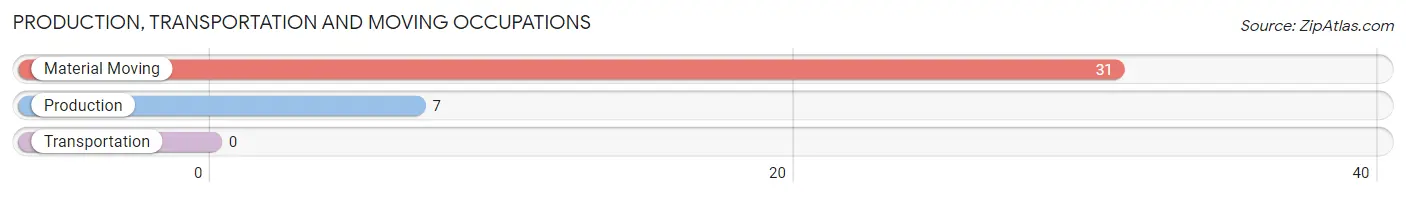
Production, Transportation and Moving Occupations
The most common Production, Transportation and Moving occupations in Deer Park are Material Moving (31 | 6.5%), and Production (7 | 1.5%).
Production, Transportation and Moving Occupations by Sex
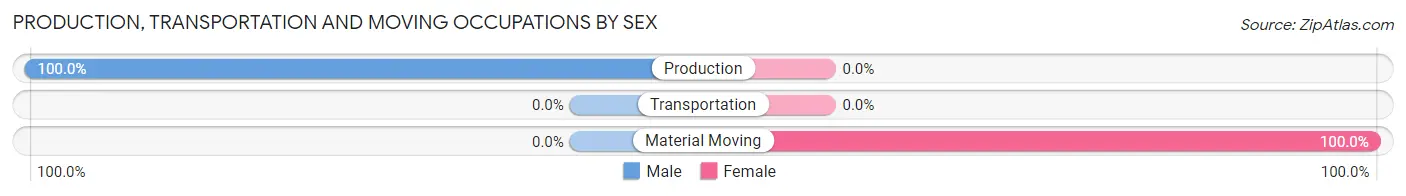
| Occupation | Male | Female |
| Production | 7 (100.0%) | 0 (0.0%) |
| Transportation | 0 (0.0%) | 0 (0.0%) |
| Material Moving | 0 (0.0%) | 31 (100.0%) |
| Total (Category) | 7 (18.4%) | 31 (81.6%) |
| Total (Overall) | 281 (58.5%) | 199 (41.5%) |
Employment Industries by Sex in Deer Park
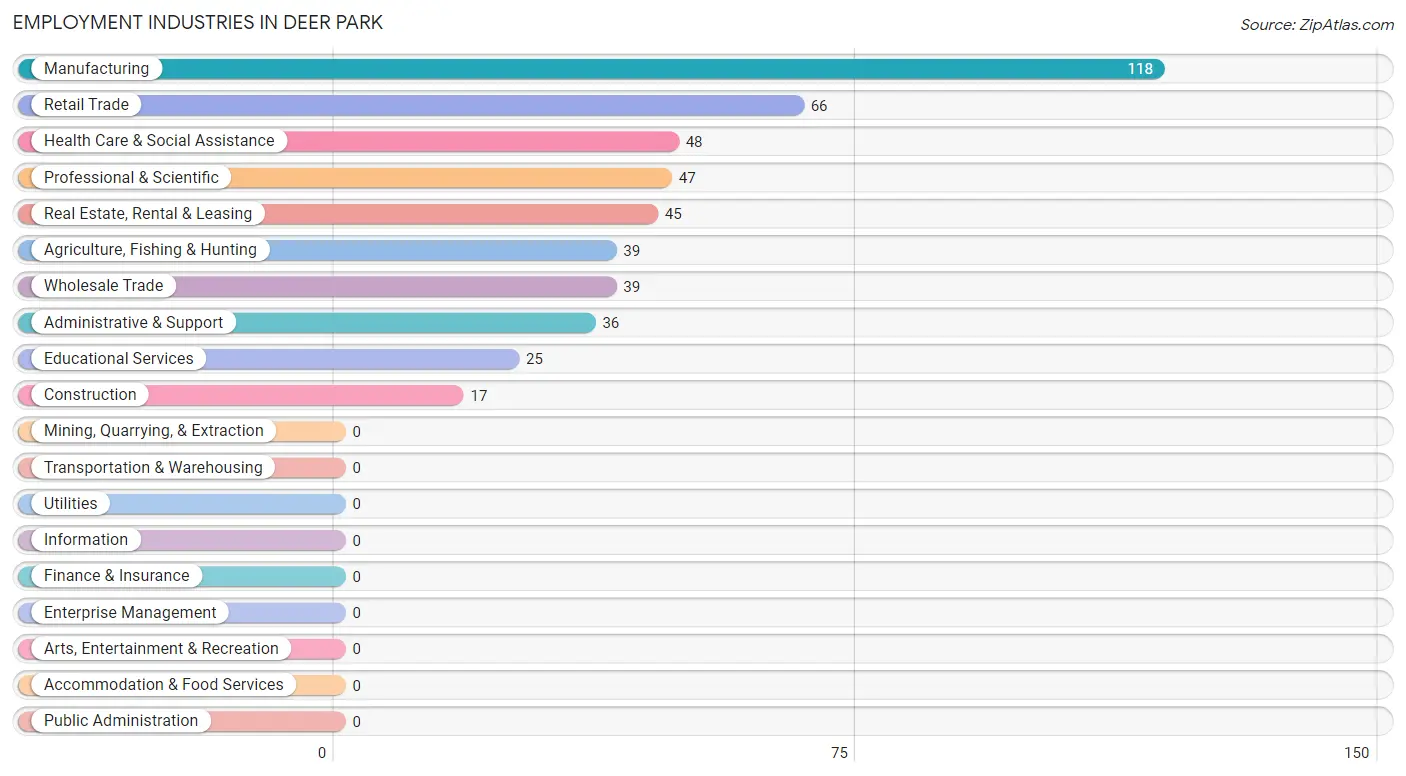
Employment Industries in Deer Park
The major employment industries in Deer Park include Manufacturing (118 | 24.6%), Retail Trade (66 | 13.8%), Health Care & Social Assistance (48 | 10.0%), Professional & Scientific (47 | 9.8%), and Real Estate, Rental & Leasing (45 | 9.4%).
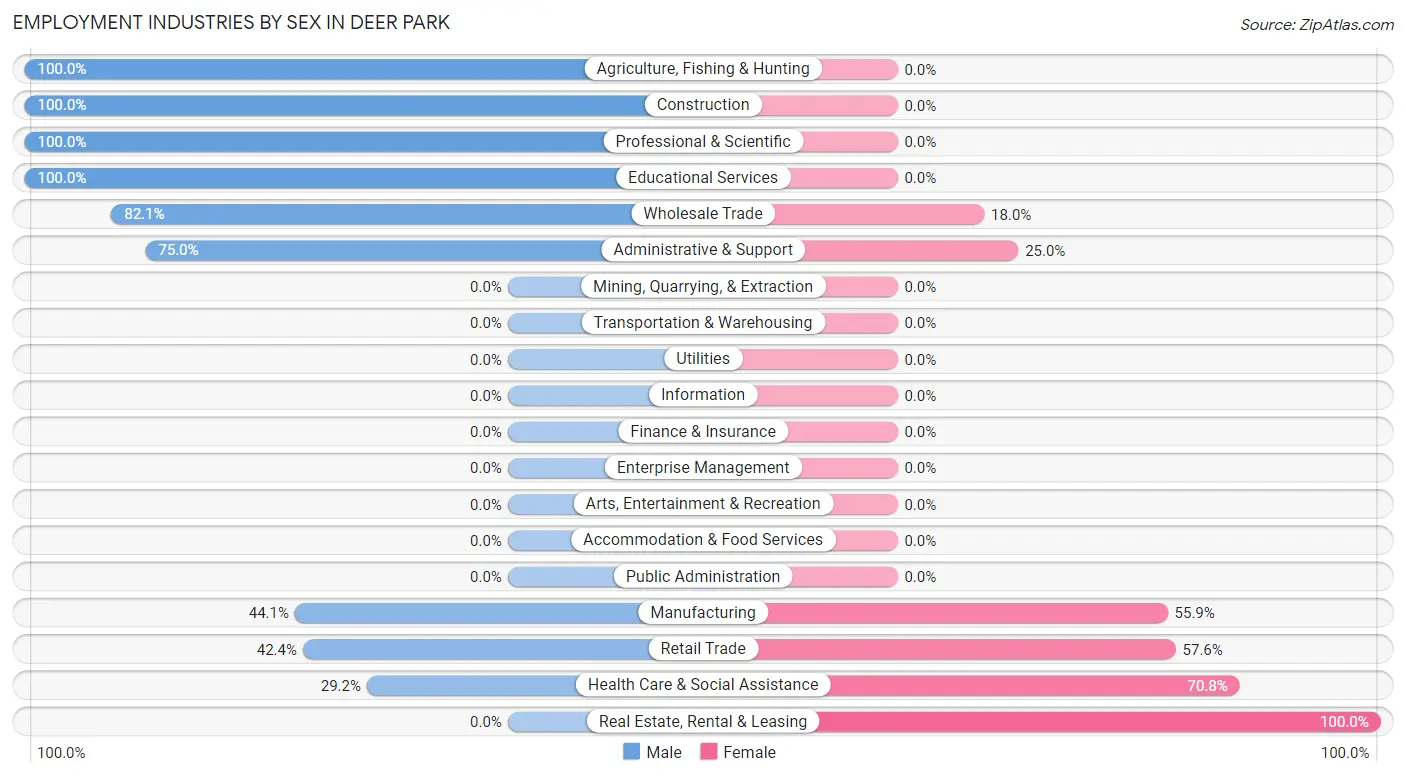
Employment Industries by Sex in Deer Park
The Deer Park industries that see more men than women are Agriculture, Fishing & Hunting (100.0%), Construction (100.0%), and Professional & Scientific (100.0%), whereas the industries that tend to have a higher number of women are Real Estate, Rental & Leasing (100.0%), Health Care & Social Assistance (70.8%), and Retail Trade (57.6%).
| Industry | Male | Female |
| Agriculture, Fishing & Hunting | 39 (100.0%) | 0 (0.0%) |
| Mining, Quarrying, & Extraction | 0 (0.0%) | 0 (0.0%) |
| Construction | 17 (100.0%) | 0 (0.0%) |
| Manufacturing | 52 (44.1%) | 66 (55.9%) |
| Wholesale Trade | 32 (82.1%) | 7 (17.9%) |
| Retail Trade | 28 (42.4%) | 38 (57.6%) |
| Transportation & Warehousing | 0 (0.0%) | 0 (0.0%) |
| Utilities | 0 (0.0%) | 0 (0.0%) |
| Information | 0 (0.0%) | 0 (0.0%) |
| Finance & Insurance | 0 (0.0%) | 0 (0.0%) |
| Real Estate, Rental & Leasing | 0 (0.0%) | 45 (100.0%) |
| Professional & Scientific | 47 (100.0%) | 0 (0.0%) |
| Enterprise Management | 0 (0.0%) | 0 (0.0%) |
| Administrative & Support | 27 (75.0%) | 9 (25.0%) |
| Educational Services | 25 (100.0%) | 0 (0.0%) |
| Health Care & Social Assistance | 14 (29.2%) | 34 (70.8%) |
| Arts, Entertainment & Recreation | 0 (0.0%) | 0 (0.0%) |
| Accommodation & Food Services | 0 (0.0%) | 0 (0.0%) |
| Public Administration | 0 (0.0%) | 0 (0.0%) |
| Total | 281 (58.5%) | 199 (41.5%) |
Education in Deer Park
School Enrollment in Deer Park
The most common levels of schooling among the 119 students in Deer Park are elementary school (40 | 33.6%), kindergarten (24 | 20.2%), and high school (22 | 18.5%).
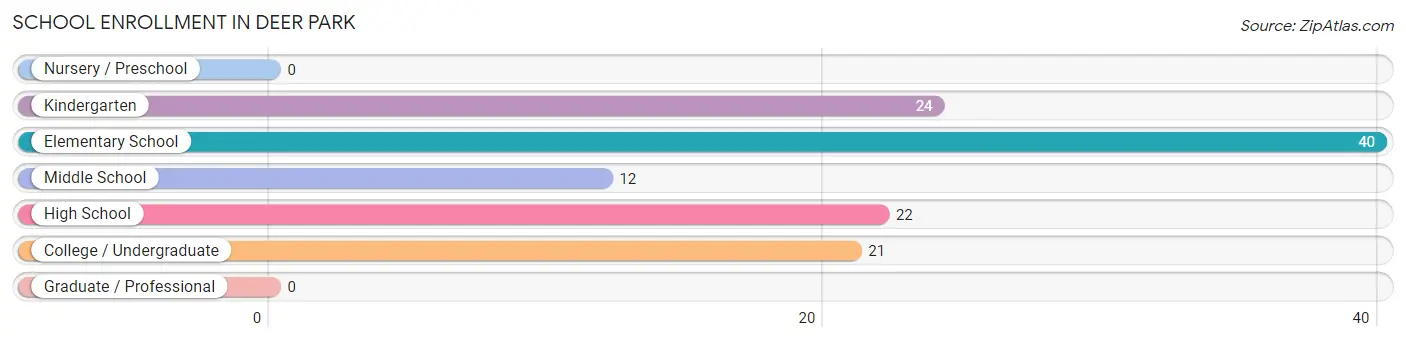
| School Level | # Students | % Students |
| Nursery / Preschool | 0 | 0.0% |
| Kindergarten | 24 | 20.2% |
| Elementary School | 40 | 33.6% |
| Middle School | 12 | 10.1% |
| High School | 22 | 18.5% |
| College / Undergraduate | 21 | 17.6% |
| Graduate / Professional | 0 | 0.0% |
| Total | 119 | 100.0% |
School Enrollment by Age by Funding Source in Deer Park
Out of a total of 119 students who are enrolled in schools in Deer Park, 40 (33.6%) attend a private institution, while the remaining 79 (66.4%) are enrolled in public schools. The age group of 5 to 9 year old has the highest likelihood of being enrolled in private schools, with 40 (62.5% in the age bracket) enrolled. Conversely, the age group of 10 to 14 year olds has the lowest likelihood of being enrolled in a private school, with 12 (100.0% in the age bracket) attending a public institution.
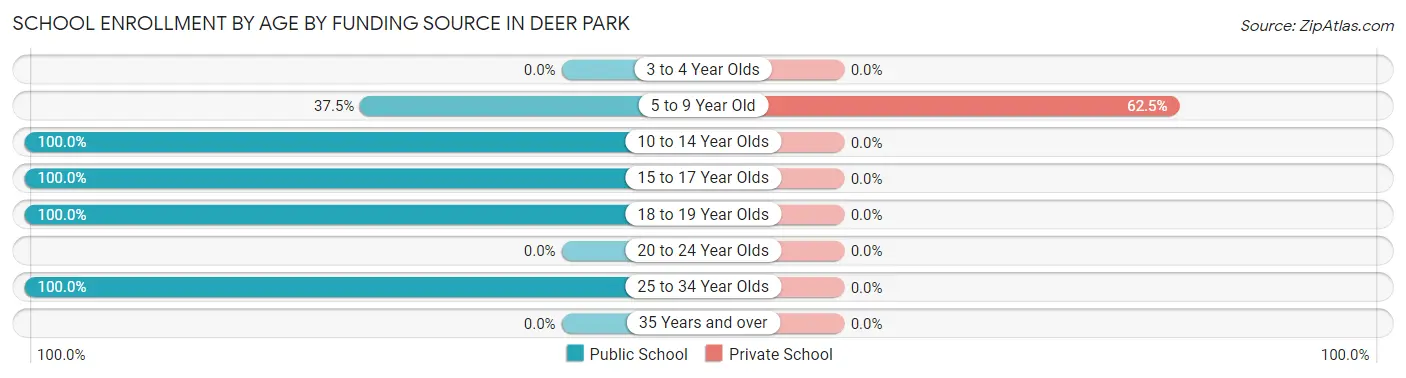
| Age Bracket | Public School | Private School |
| 3 to 4 Year Olds | 0 (0.0%) | 0 (0.0%) |
| 5 to 9 Year Old | 24 (37.5%) | 40 (62.5%) |
| 10 to 14 Year Olds | 12 (100.0%) | 0 (0.0%) |
| 15 to 17 Year Olds | 12 (100.0%) | 0 (0.0%) |
| 18 to 19 Year Olds | 10 (100.0%) | 0 (0.0%) |
| 20 to 24 Year Olds | 0 (0.0%) | 0 (0.0%) |
| 25 to 34 Year Olds | 21 (100.0%) | 0 (0.0%) |
| 35 Years and over | 0 (0.0%) | 0 (0.0%) |
| Total | 79 (66.4%) | 40 (33.6%) |
Educational Attainment by Field of Study in Deer Park
Science & technology (83 | 27.9%), social sciences (53 | 17.8%), visual & performing arts (46 | 15.4%), liberal arts & history (34 | 11.4%), and literature & languages (25 | 8.4%) are the most common fields of study among 298 individuals in Deer Park who have obtained a bachelor's degree or higher.
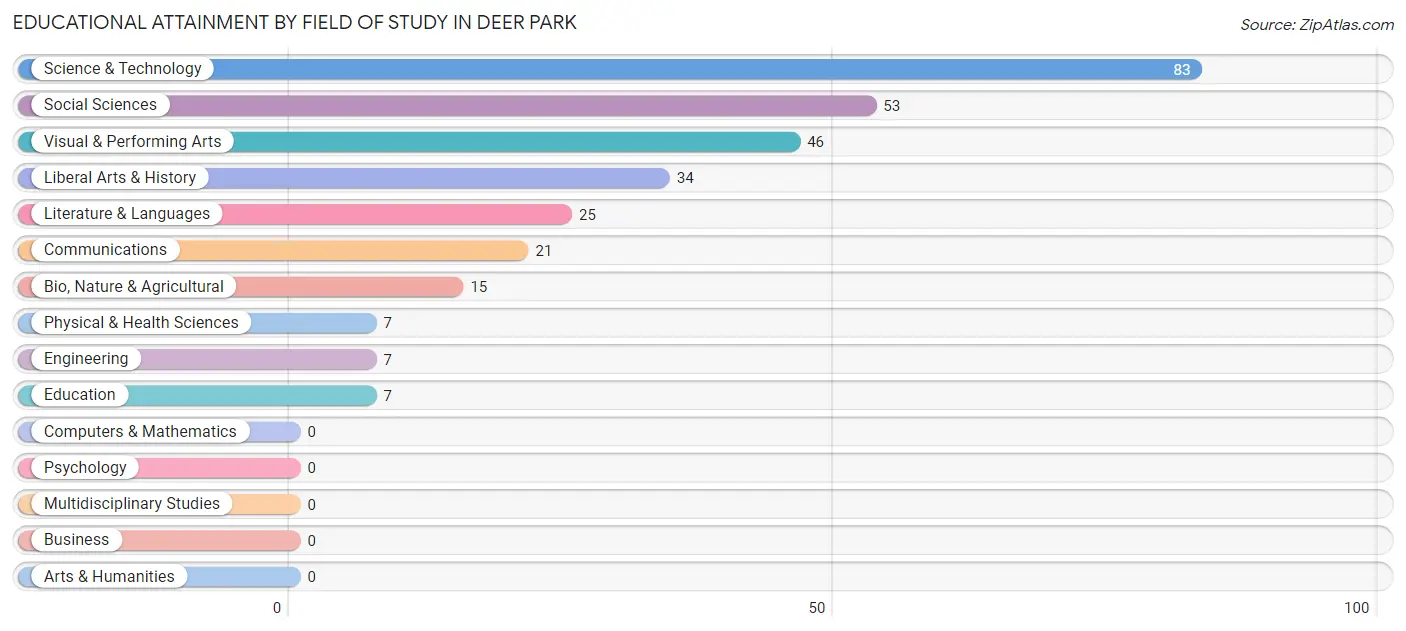
| Field of Study | # Graduates | % Graduates |
| Computers & Mathematics | 0 | 0.0% |
| Bio, Nature & Agricultural | 15 | 5.0% |
| Physical & Health Sciences | 7 | 2.4% |
| Psychology | 0 | 0.0% |
| Social Sciences | 53 | 17.8% |
| Engineering | 7 | 2.4% |
| Multidisciplinary Studies | 0 | 0.0% |
| Science & Technology | 83 | 27.9% |
| Business | 0 | 0.0% |
| Education | 7 | 2.4% |
| Literature & Languages | 25 | 8.4% |
| Liberal Arts & History | 34 | 11.4% |
| Visual & Performing Arts | 46 | 15.4% |
| Communications | 21 | 7.0% |
| Arts & Humanities | 0 | 0.0% |
| Total | 298 | 100.0% |
Transportation & Commute in Deer Park
Vehicle Availability by Sex in Deer Park
The most prevalent vehicle ownership categories in Deer Park are males with 2 vehicles (121, accounting for 46.7%) and females with 2 vehicles (108, making up 60.8%).
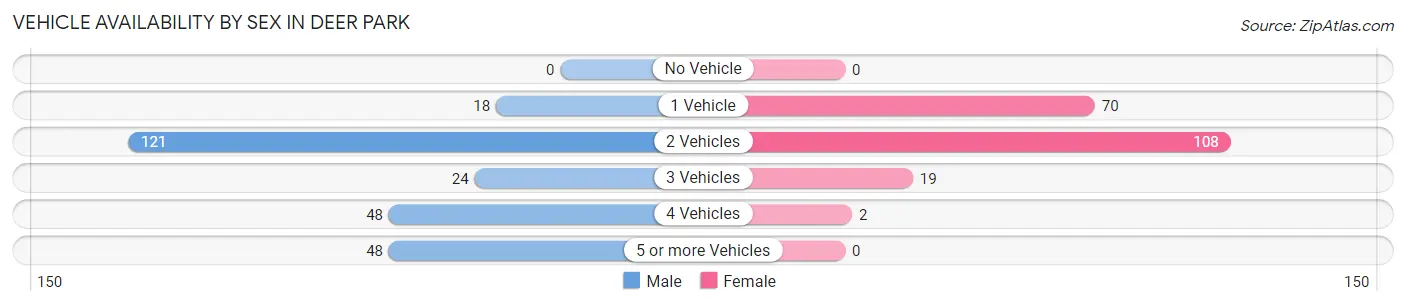
| Vehicles Available | Male | Female |
| No Vehicle | 0 (0.0%) | 0 (0.0%) |
| 1 Vehicle | 18 (7.0%) | 70 (35.2%) |
| 2 Vehicles | 121 (46.7%) | 108 (54.3%) |
| 3 Vehicles | 24 (9.3%) | 19 (9.6%) |
| 4 Vehicles | 48 (18.5%) | 2 (1.0%) |
| 5 or more Vehicles | 48 (18.5%) | 0 (0.0%) |
| Total | 259 (100.0%) | 199 (100.0%) |
Commute Time in Deer Park
The most frequently occuring commute durations in Deer Park are 10 to 14 minutes (95 commuters, 22.8%), 20 to 24 minutes (76 commuters, 18.3%), and 15 to 19 minutes (68 commuters, 16.4%).
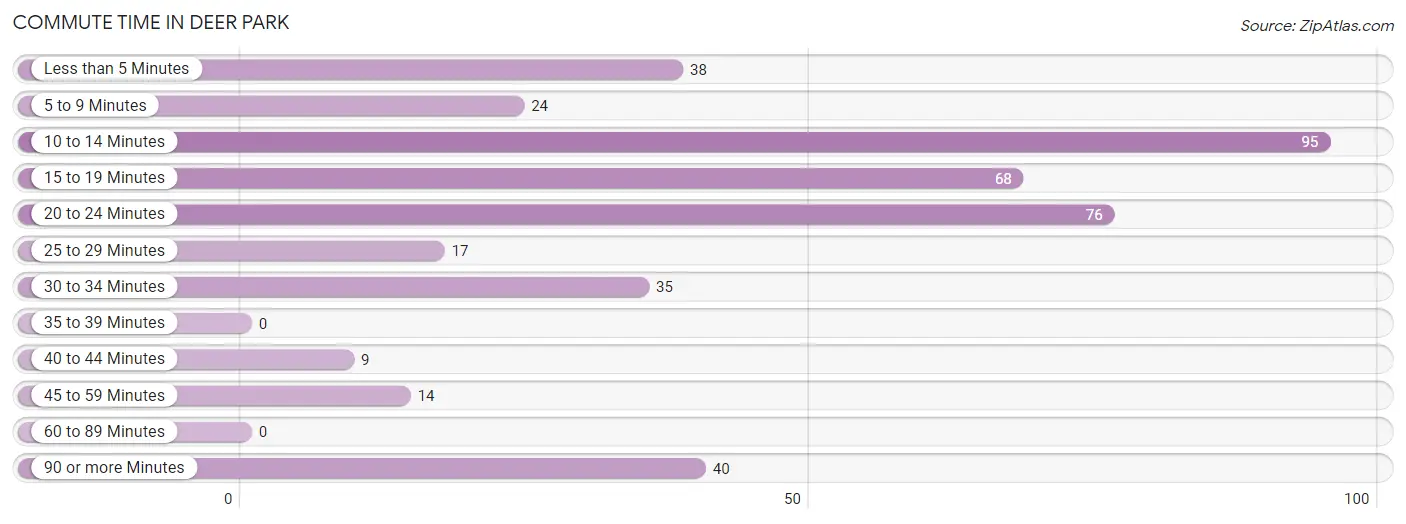
| Commute Time | # Commuters | % Commuters |
| Less than 5 Minutes | 38 | 9.1% |
| 5 to 9 Minutes | 24 | 5.8% |
| 10 to 14 Minutes | 95 | 22.8% |
| 15 to 19 Minutes | 68 | 16.4% |
| 20 to 24 Minutes | 76 | 18.3% |
| 25 to 29 Minutes | 17 | 4.1% |
| 30 to 34 Minutes | 35 | 8.4% |
| 35 to 39 Minutes | 0 | 0.0% |
| 40 to 44 Minutes | 9 | 2.2% |
| 45 to 59 Minutes | 14 | 3.4% |
| 60 to 89 Minutes | 0 | 0.0% |
| 90 or more Minutes | 40 | 9.6% |
Commute Time by Sex in Deer Park
The most common commute times in Deer Park are 10 to 14 minutes (57 commuters, 23.8%) for males and 20 to 24 minutes (44 commuters, 24.9%) for females.
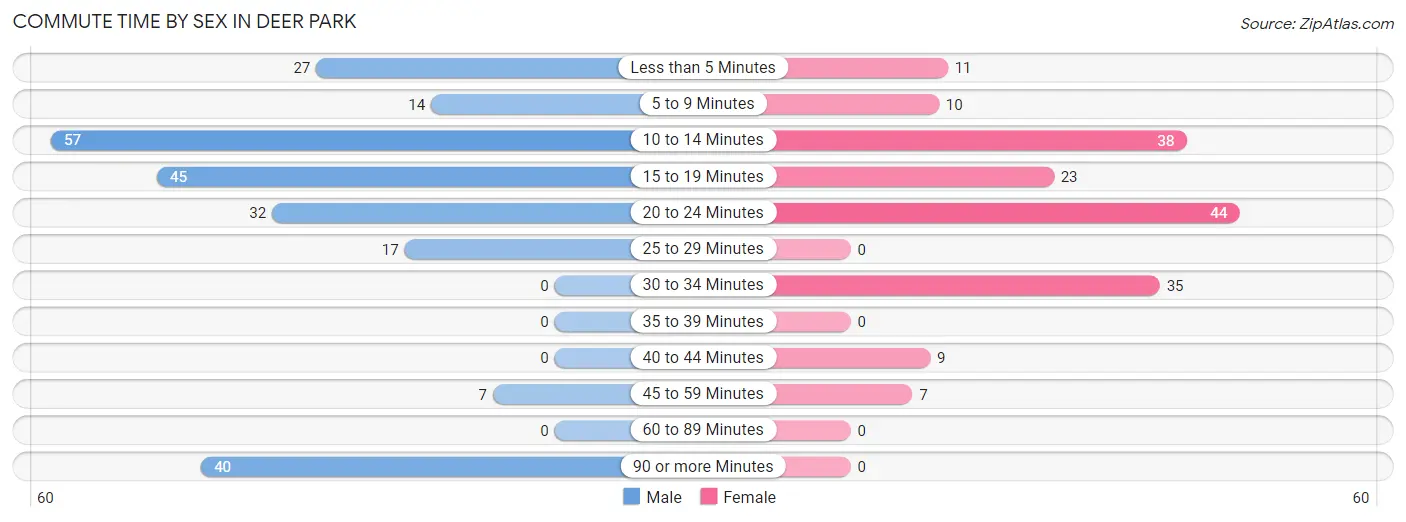
| Commute Time | Male | Female |
| Less than 5 Minutes | 27 (11.3%) | 11 (6.2%) |
| 5 to 9 Minutes | 14 (5.9%) | 10 (5.7%) |
| 10 to 14 Minutes | 57 (23.8%) | 38 (21.5%) |
| 15 to 19 Minutes | 45 (18.8%) | 23 (13.0%) |
| 20 to 24 Minutes | 32 (13.4%) | 44 (24.9%) |
| 25 to 29 Minutes | 17 (7.1%) | 0 (0.0%) |
| 30 to 34 Minutes | 0 (0.0%) | 35 (19.8%) |
| 35 to 39 Minutes | 0 (0.0%) | 0 (0.0%) |
| 40 to 44 Minutes | 0 (0.0%) | 9 (5.1%) |
| 45 to 59 Minutes | 7 (2.9%) | 7 (4.0%) |
| 60 to 89 Minutes | 0 (0.0%) | 0 (0.0%) |
| 90 or more Minutes | 40 (16.7%) | 0 (0.0%) |
Time of Departure to Work by Sex in Deer Park
The most frequent times of departure to work in Deer Park are 6:30 AM to 6:59 AM (52, 21.8%) for males and 9:00 AM to 9:59 AM (61, 34.5%) for females.
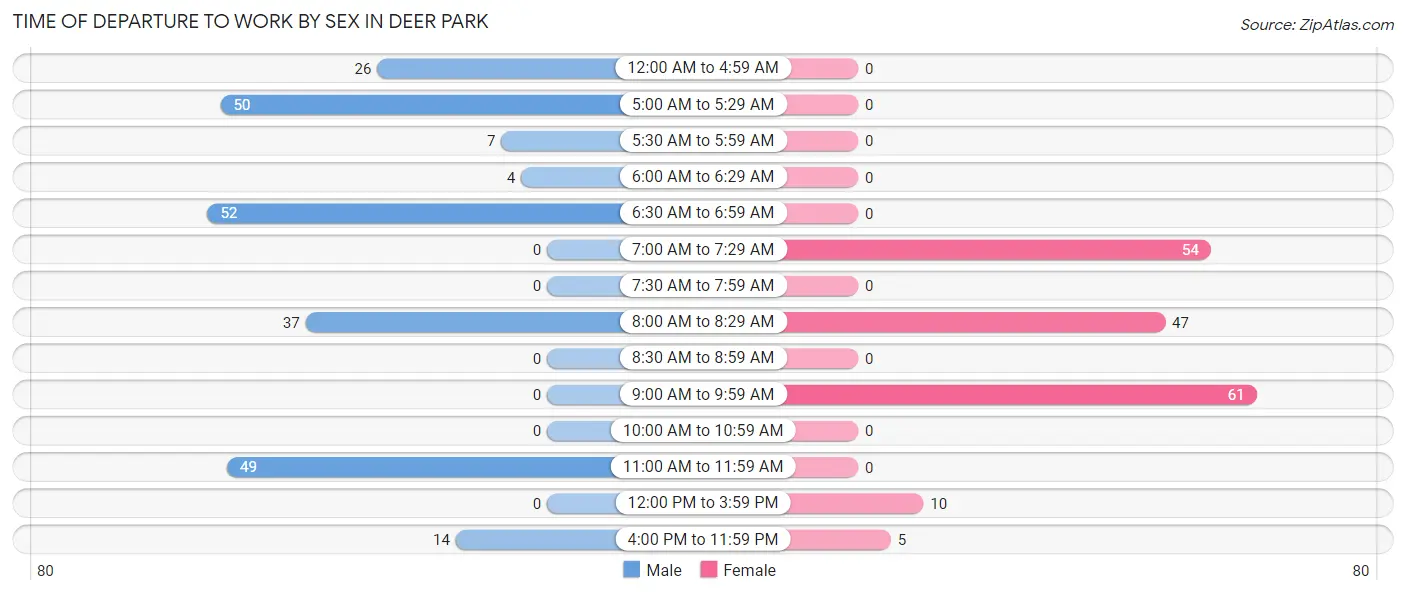
| Time of Departure | Male | Female |
| 12:00 AM to 4:59 AM | 26 (10.9%) | 0 (0.0%) |
| 5:00 AM to 5:29 AM | 50 (20.9%) | 0 (0.0%) |
| 5:30 AM to 5:59 AM | 7 (2.9%) | 0 (0.0%) |
| 6:00 AM to 6:29 AM | 4 (1.7%) | 0 (0.0%) |
| 6:30 AM to 6:59 AM | 52 (21.8%) | 0 (0.0%) |
| 7:00 AM to 7:29 AM | 0 (0.0%) | 54 (30.5%) |
| 7:30 AM to 7:59 AM | 0 (0.0%) | 0 (0.0%) |
| 8:00 AM to 8:29 AM | 37 (15.5%) | 47 (26.6%) |
| 8:30 AM to 8:59 AM | 0 (0.0%) | 0 (0.0%) |
| 9:00 AM to 9:59 AM | 0 (0.0%) | 61 (34.5%) |
| 10:00 AM to 10:59 AM | 0 (0.0%) | 0 (0.0%) |
| 11:00 AM to 11:59 AM | 49 (20.5%) | 0 (0.0%) |
| 12:00 PM to 3:59 PM | 0 (0.0%) | 10 (5.7%) |
| 4:00 PM to 11:59 PM | 14 (5.9%) | 5 (2.8%) |
| Total | 239 (100.0%) | 177 (100.0%) |
Housing Occupancy in Deer Park
Occupancy by Ownership in Deer Park
Of the total 379 dwellings in Deer Park, owner-occupied units account for 262 (69.1%), while renter-occupied units make up 117 (30.9%).
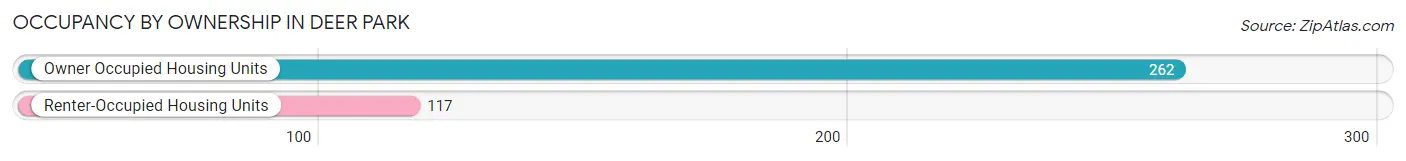
| Occupancy | # Housing Units | % Housing Units |
| Owner Occupied Housing Units | 262 | 69.1% |
| Renter-Occupied Housing Units | 117 | 30.9% |
| Total Occupied Housing Units | 379 | 100.0% |
Occupancy by Household Size in Deer Park
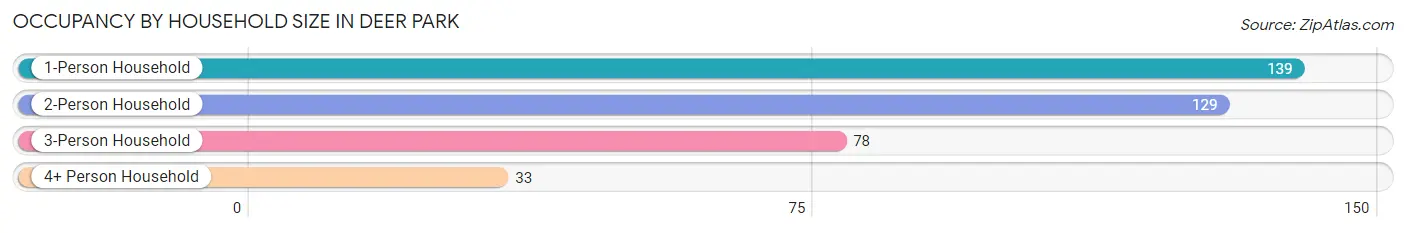
| Household Size | # Housing Units | % Housing Units |
| 1-Person Household | 139 | 36.7% |
| 2-Person Household | 129 | 34.0% |
| 3-Person Household | 78 | 20.6% |
| 4+ Person Household | 33 | 8.7% |
| Total Housing Units | 379 | 100.0% |
Occupancy by Ownership by Household Size in Deer Park
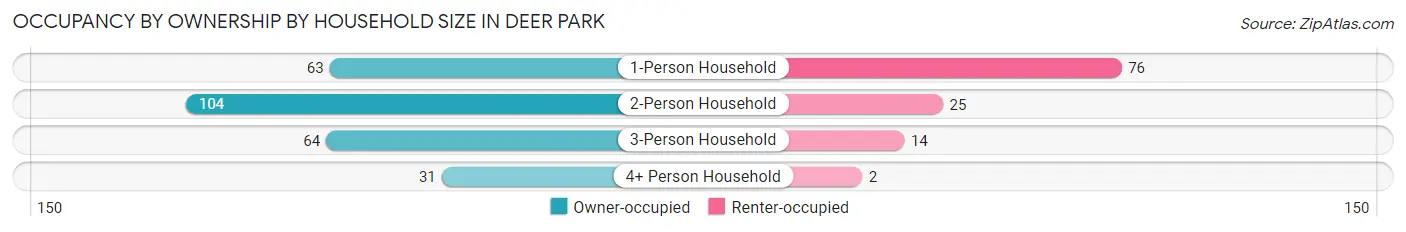
| Household Size | Owner-occupied | Renter-occupied |
| 1-Person Household | 63 (45.3%) | 76 (54.7%) |
| 2-Person Household | 104 (80.6%) | 25 (19.4%) |
| 3-Person Household | 64 (82.1%) | 14 (17.9%) |
| 4+ Person Household | 31 (93.9%) | 2 (6.1%) |
| Total Housing Units | 262 (69.1%) | 117 (30.9%) |
Occupancy by Educational Attainment in Deer Park
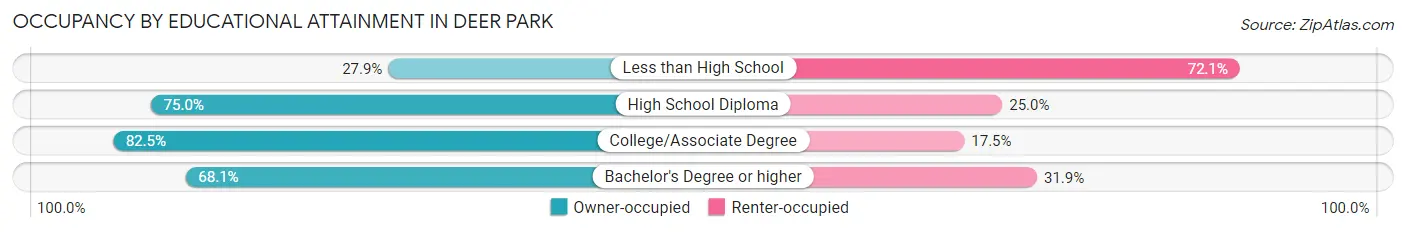
| Household Size | Owner-occupied | Renter-occupied |
| Less than High School | 12 (27.9%) | 31 (72.1%) |
| High School Diploma | 6 (75.0%) | 2 (25.0%) |
| College/Associate Degree | 118 (82.5%) | 25 (17.5%) |
| Bachelor's Degree or higher | 126 (68.1%) | 59 (31.9%) |
Occupancy by Age of Householder in Deer Park
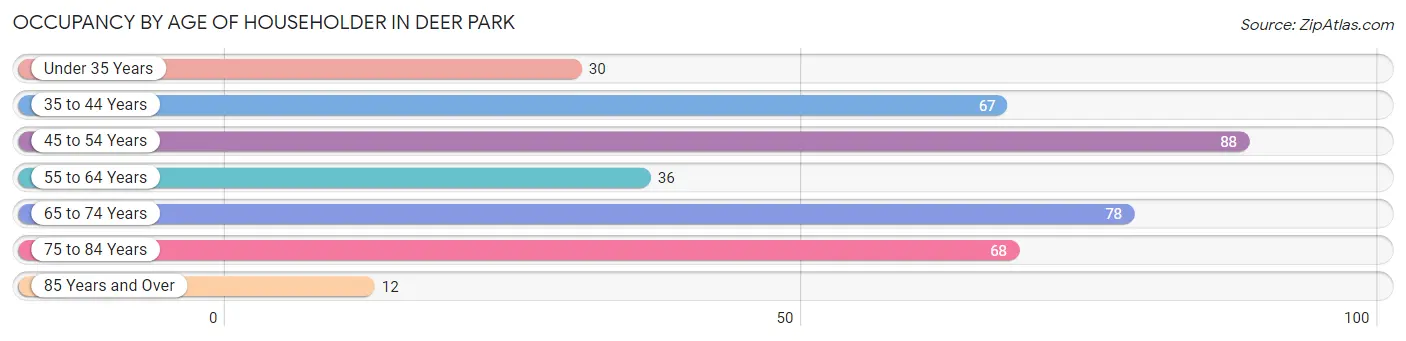
| Age Bracket | # Households | % Households |
| Under 35 Years | 30 | 7.9% |
| 35 to 44 Years | 67 | 17.7% |
| 45 to 54 Years | 88 | 23.2% |
| 55 to 64 Years | 36 | 9.5% |
| 65 to 74 Years | 78 | 20.6% |
| 75 to 84 Years | 68 | 17.9% |
| 85 Years and Over | 12 | 3.2% |
| Total | 379 | 100.0% |
Housing Finances in Deer Park
Median Income by Occupancy in Deer Park
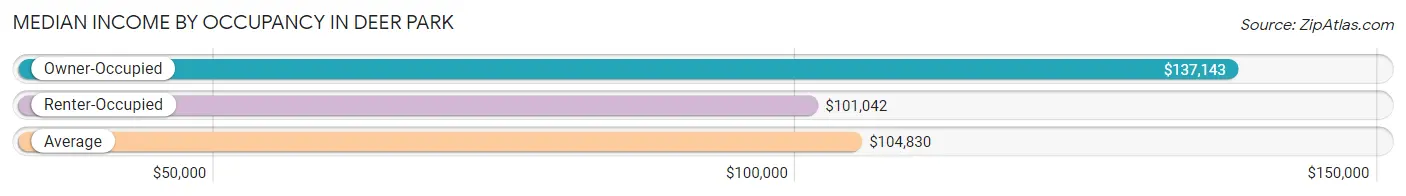
| Occupancy Type | # Households | Median Income |
| Owner-Occupied | 262 (69.1%) | $137,143 |
| Renter-Occupied | 117 (30.9%) | $101,042 |
| Average | 379 (100.0%) | $104,830 |
Occupancy by Householder Income Bracket in Deer Park
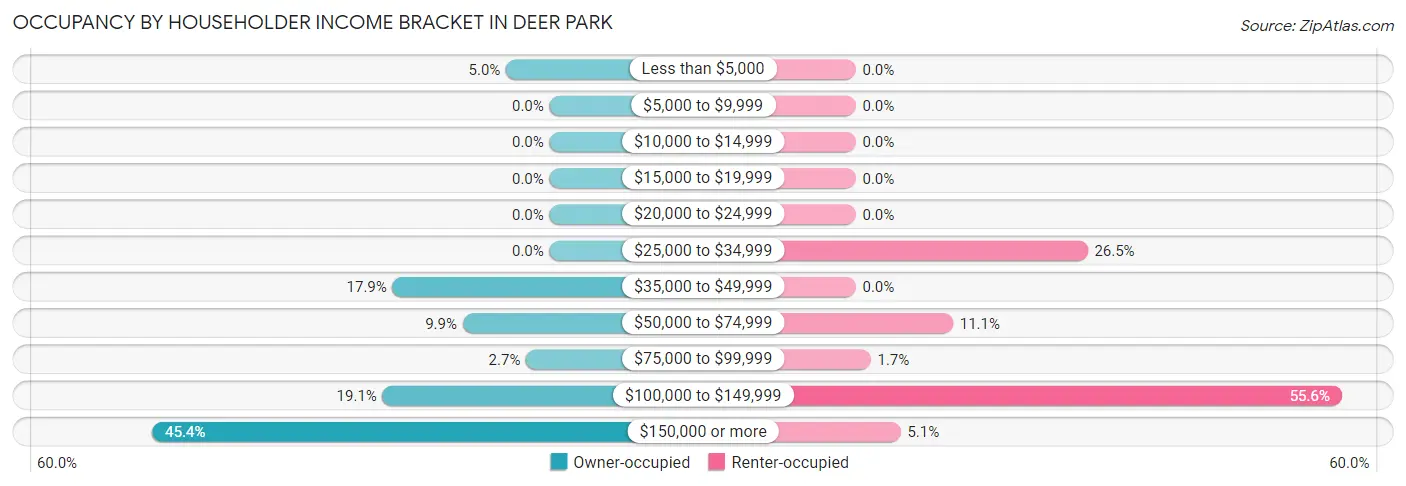
| Income Bracket | Owner-occupied | Renter-occupied |
| Less than $5,000 | 13 (5.0%) | 0 (0.0%) |
| $5,000 to $9,999 | 0 (0.0%) | 0 (0.0%) |
| $10,000 to $14,999 | 0 (0.0%) | 0 (0.0%) |
| $15,000 to $19,999 | 0 (0.0%) | 0 (0.0%) |
| $20,000 to $24,999 | 0 (0.0%) | 0 (0.0%) |
| $25,000 to $34,999 | 0 (0.0%) | 31 (26.5%) |
| $35,000 to $49,999 | 47 (17.9%) | 0 (0.0%) |
| $50,000 to $74,999 | 26 (9.9%) | 13 (11.1%) |
| $75,000 to $99,999 | 7 (2.7%) | 2 (1.7%) |
| $100,000 to $149,999 | 50 (19.1%) | 65 (55.6%) |
| $150,000 or more | 119 (45.4%) | 6 (5.1%) |
| Total | 262 (100.0%) | 117 (100.0%) |
Monthly Housing Cost Tiers in Deer Park
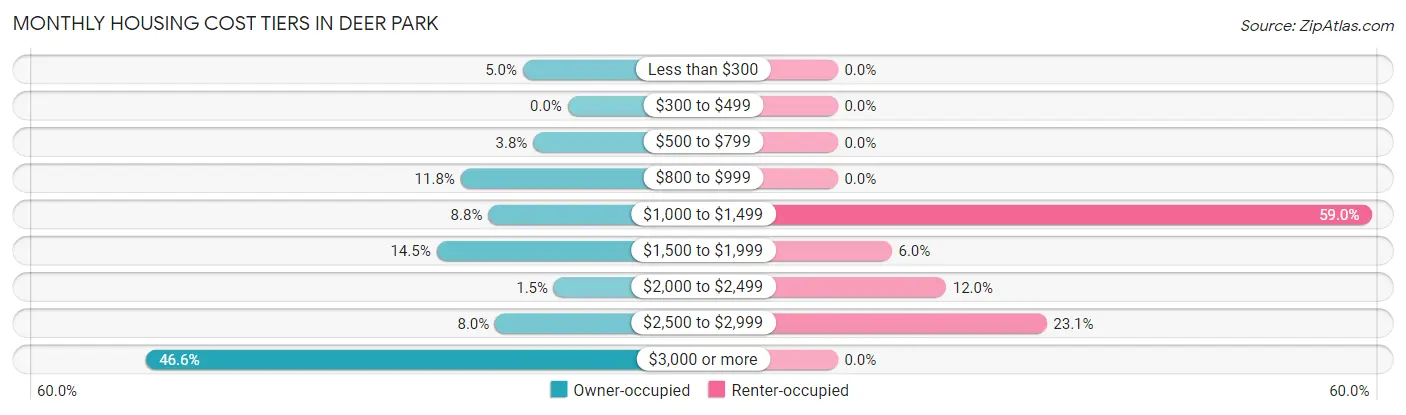
| Monthly Cost | Owner-occupied | Renter-occupied |
| Less than $300 | 13 (5.0%) | 0 (0.0%) |
| $300 to $499 | 0 (0.0%) | 0 (0.0%) |
| $500 to $799 | 10 (3.8%) | 0 (0.0%) |
| $800 to $999 | 31 (11.8%) | 0 (0.0%) |
| $1,000 to $1,499 | 23 (8.8%) | 69 (59.0%) |
| $1,500 to $1,999 | 38 (14.5%) | 7 (6.0%) |
| $2,000 to $2,499 | 4 (1.5%) | 14 (12.0%) |
| $2,500 to $2,999 | 21 (8.0%) | 27 (23.1%) |
| $3,000 or more | 122 (46.6%) | 0 (0.0%) |
| Total | 262 (100.0%) | 117 (100.0%) |
Physical Housing Characteristics in Deer Park
Housing Structures in Deer Park
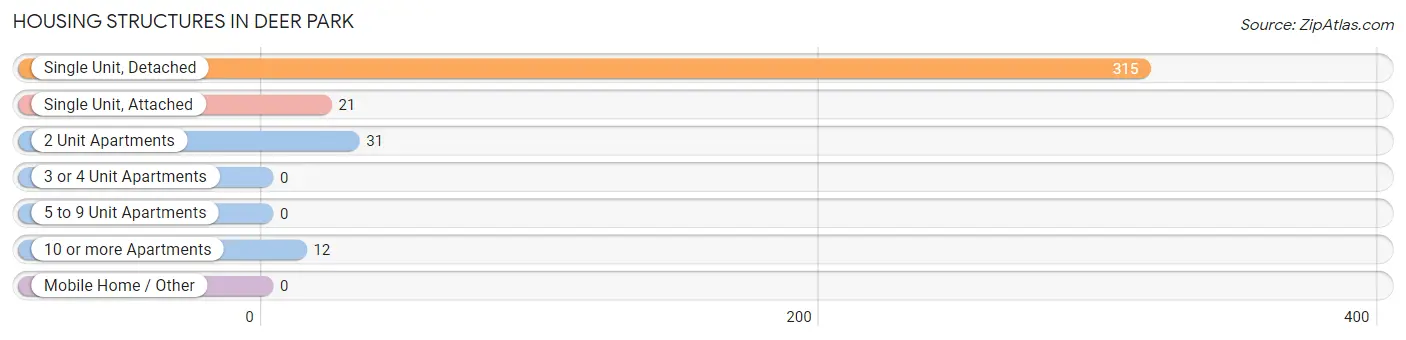
| Structure Type | # Housing Units | % Housing Units |
| Single Unit, Detached | 315 | 83.1% |
| Single Unit, Attached | 21 | 5.5% |
| 2 Unit Apartments | 31 | 8.2% |
| 3 or 4 Unit Apartments | 0 | 0.0% |
| 5 to 9 Unit Apartments | 0 | 0.0% |
| 10 or more Apartments | 12 | 3.2% |
| Mobile Home / Other | 0 | 0.0% |
| Total | 379 | 100.0% |
Housing Structures by Occupancy in Deer Park
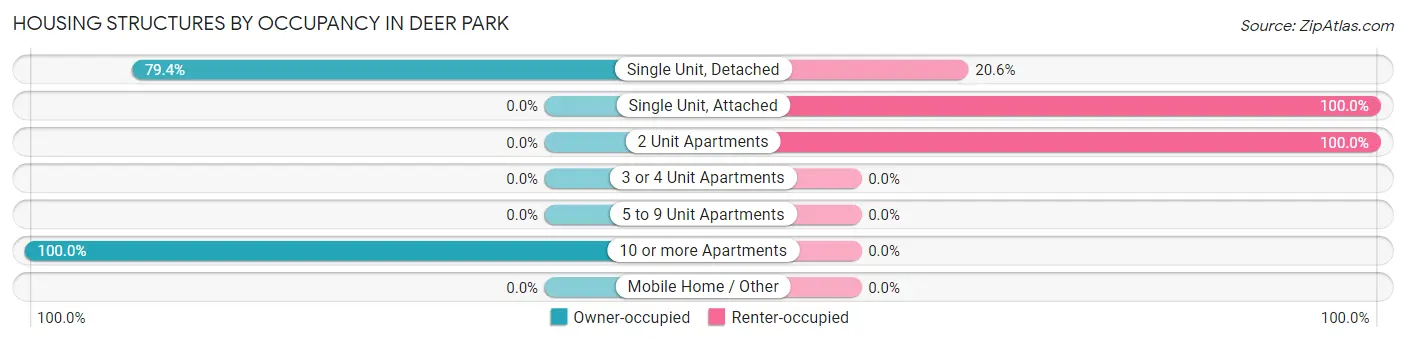
| Structure Type | Owner-occupied | Renter-occupied |
| Single Unit, Detached | 250 (79.4%) | 65 (20.6%) |
| Single Unit, Attached | 0 (0.0%) | 21 (100.0%) |
| 2 Unit Apartments | 0 (0.0%) | 31 (100.0%) |
| 3 or 4 Unit Apartments | 0 (0.0%) | 0 (0.0%) |
| 5 to 9 Unit Apartments | 0 (0.0%) | 0 (0.0%) |
| 10 or more Apartments | 12 (100.0%) | 0 (0.0%) |
| Mobile Home / Other | 0 (0.0%) | 0 (0.0%) |
| Total | 262 (69.1%) | 117 (30.9%) |
Housing Structures by Number of Rooms in Deer Park
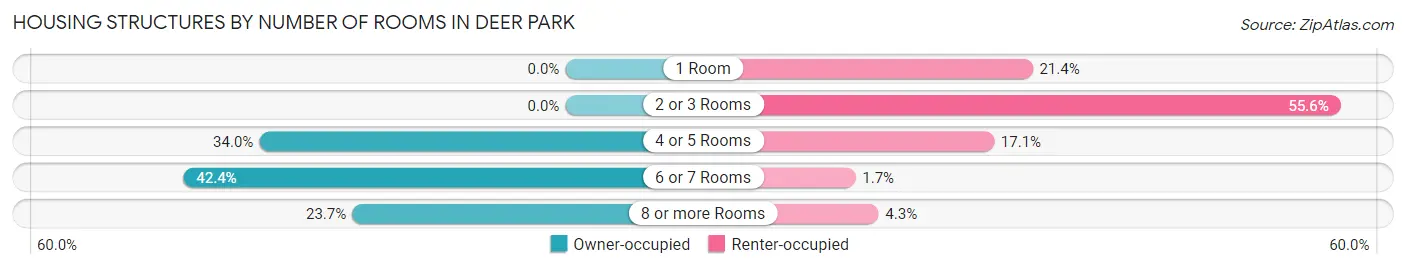
| Number of Rooms | Owner-occupied | Renter-occupied |
| 1 Room | 0 (0.0%) | 25 (21.4%) |
| 2 or 3 Rooms | 0 (0.0%) | 65 (55.6%) |
| 4 or 5 Rooms | 89 (34.0%) | 20 (17.1%) |
| 6 or 7 Rooms | 111 (42.4%) | 2 (1.7%) |
| 8 or more Rooms | 62 (23.7%) | 5 (4.3%) |
| Total | 262 (100.0%) | 117 (100.0%) |
Housing Structure by Heating Type in Deer Park
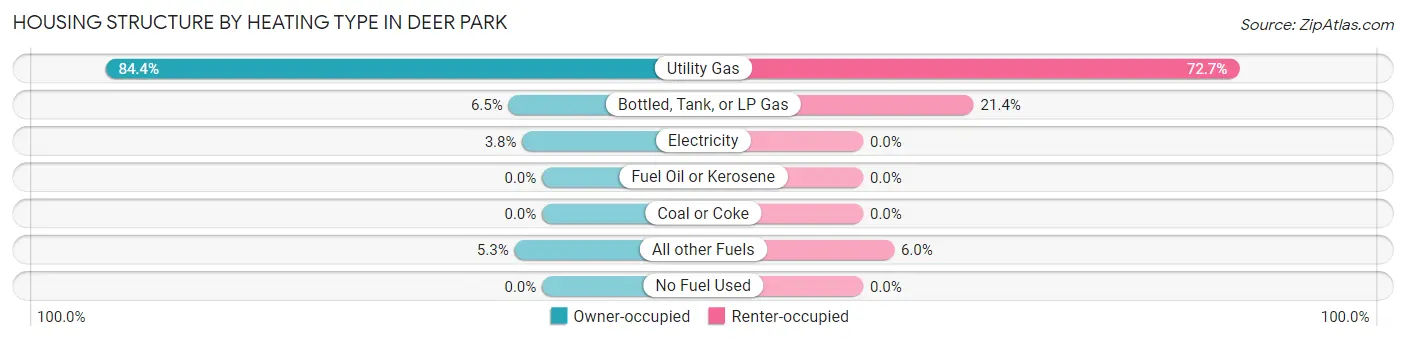
| Heating Type | Owner-occupied | Renter-occupied |
| Utility Gas | 221 (84.4%) | 85 (72.7%) |
| Bottled, Tank, or LP Gas | 17 (6.5%) | 25 (21.4%) |
| Electricity | 10 (3.8%) | 0 (0.0%) |
| Fuel Oil or Kerosene | 0 (0.0%) | 0 (0.0%) |
| Coal or Coke | 0 (0.0%) | 0 (0.0%) |
| All other Fuels | 14 (5.3%) | 7 (6.0%) |
| No Fuel Used | 0 (0.0%) | 0 (0.0%) |
| Total | 262 (100.0%) | 117 (100.0%) |
Household Vehicle Usage in Deer Park
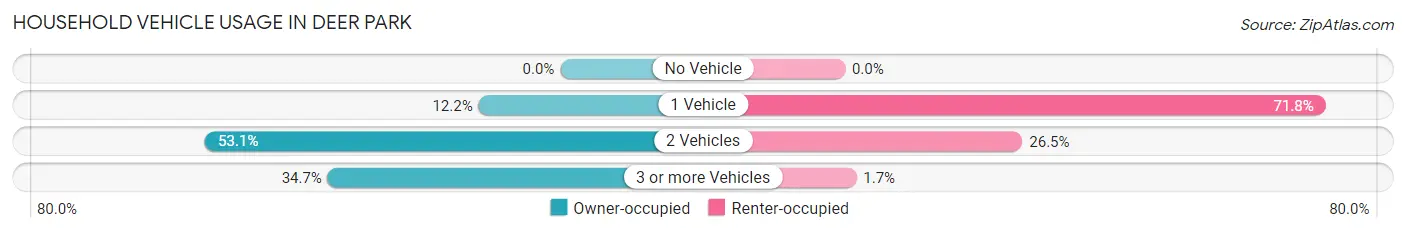
| Vehicles per Household | Owner-occupied | Renter-occupied |
| No Vehicle | 0 (0.0%) | 0 (0.0%) |
| 1 Vehicle | 32 (12.2%) | 84 (71.8%) |
| 2 Vehicles | 139 (53.0%) | 31 (26.5%) |
| 3 or more Vehicles | 91 (34.7%) | 2 (1.7%) |
| Total | 262 (100.0%) | 117 (100.0%) |
Real Estate & Mortgages in Deer Park
Real Estate and Mortgage Overview in Deer Park
| Characteristic | Without Mortgage | With Mortgage |
| Housing Units | 91 | 171 |
| Median Property Value | $848,200 | $1,034,100 |
| Median Household Income | - | - |
| Monthly Housing Costs | $915 | $108 |
| Real Estate Taxes | $4,500 | $0 |
Property Value by Mortgage Status in Deer Park
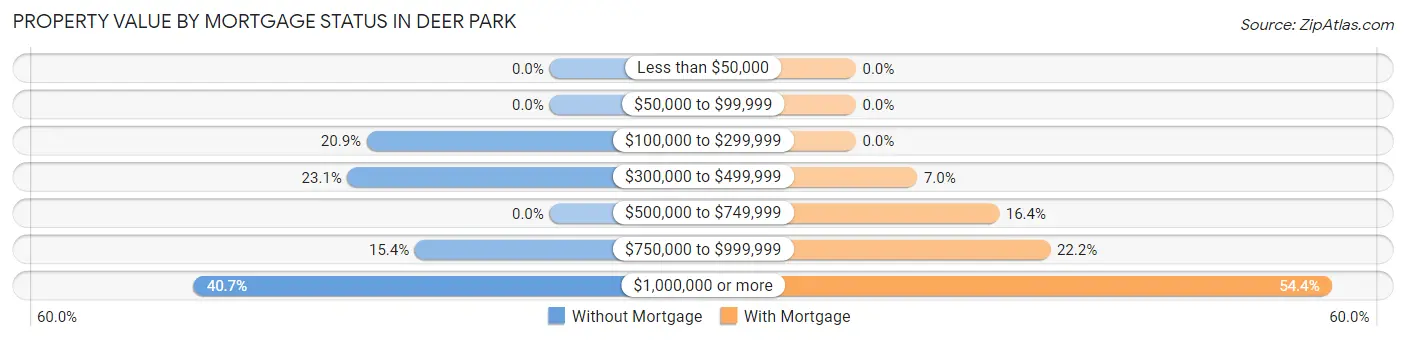
| Property Value | Without Mortgage | With Mortgage |
| Less than $50,000 | 0 (0.0%) | 0 (0.0%) |
| $50,000 to $99,999 | 0 (0.0%) | 0 (0.0%) |
| $100,000 to $299,999 | 19 (20.9%) | 0 (0.0%) |
| $300,000 to $499,999 | 21 (23.1%) | 12 (7.0%) |
| $500,000 to $749,999 | 0 (0.0%) | 28 (16.4%) |
| $750,000 to $999,999 | 14 (15.4%) | 38 (22.2%) |
| $1,000,000 or more | 37 (40.7%) | 93 (54.4%) |
| Total | 91 (100.0%) | 171 (100.0%) |
Household Income by Mortgage Status in Deer Park
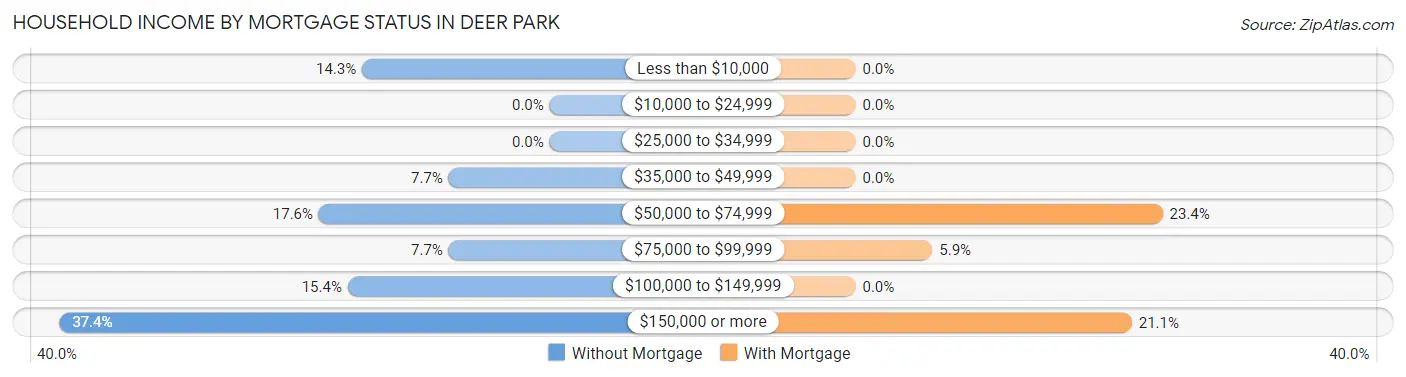
| Household Income | Without Mortgage | With Mortgage |
| Less than $10,000 | 13 (14.3%) | 0 (0.0%) |
| $10,000 to $24,999 | 0 (0.0%) | 0 (0.0%) |
| $25,000 to $34,999 | 0 (0.0%) | 0 (0.0%) |
| $35,000 to $49,999 | 7 (7.7%) | 0 (0.0%) |
| $50,000 to $74,999 | 16 (17.6%) | 40 (23.4%) |
| $75,000 to $99,999 | 7 (7.7%) | 10 (5.9%) |
| $100,000 to $149,999 | 14 (15.4%) | 0 (0.0%) |
| $150,000 or more | 34 (37.4%) | 36 (21.0%) |
| Total | 91 (100.0%) | 171 (100.0%) |
Property Value to Household Income Ratio in Deer Park
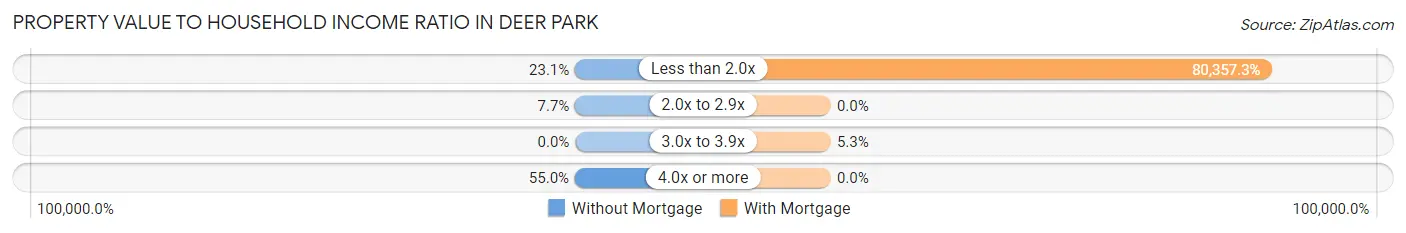
| Value-to-Income Ratio | Without Mortgage | With Mortgage |
| Less than 2.0x | 21 (23.1%) | 137,411 (80,357.3%) |
| 2.0x to 2.9x | 7 (7.7%) | 0 (0.0%) |
| 3.0x to 3.9x | 0 (0.0%) | 9 (5.3%) |
| 4.0x or more | 50 (54.9%) | 0 (0.0%) |
| Total | 91 (100.0%) | 171 (100.0%) |
Real Estate Taxes by Mortgage Status in Deer Park
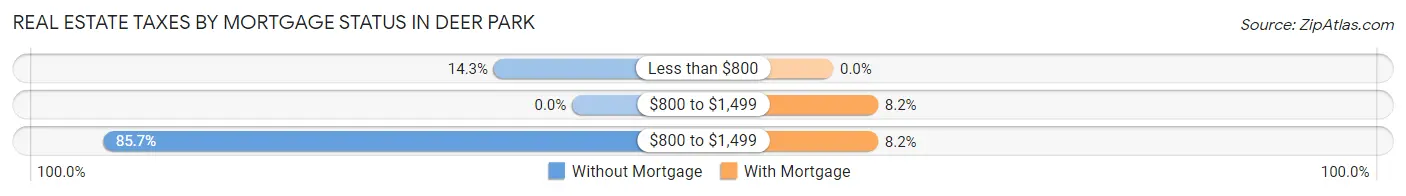
| Property Taxes | Without Mortgage | With Mortgage |
| Less than $800 | 13 (14.3%) | 0 (0.0%) |
| $800 to $1,499 | 0 (0.0%) | 14 (8.2%) |
| $800 to $1,499 | 78 (85.7%) | 14 (8.2%) |
| Total | 91 (100.0%) | 171 (100.0%) |
Health & Disability in Deer Park
Health Insurance Coverage by Age in Deer Park
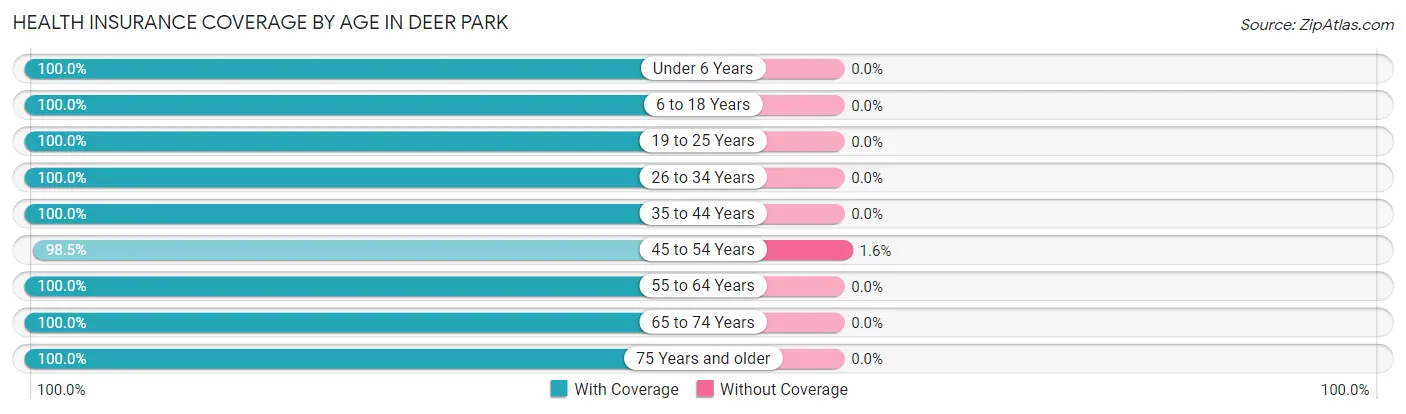
| Age Bracket | With Coverage | Without Coverage |
| Under 6 Years | 14 (100.0%) | 0 (0.0%) |
| 6 to 18 Years | 98 (100.0%) | 0 (0.0%) |
| 19 to 25 Years | 2 (100.0%) | 0 (0.0%) |
| 26 to 34 Years | 89 (100.0%) | 0 (0.0%) |
| 35 to 44 Years | 95 (100.0%) | 0 (0.0%) |
| 45 to 54 Years | 190 (98.5%) | 3 (1.5%) |
| 55 to 64 Years | 66 (100.0%) | 0 (0.0%) |
| 65 to 74 Years | 124 (100.0%) | 0 (0.0%) |
| 75 Years and older | 98 (100.0%) | 0 (0.0%) |
| Total | 776 (99.6%) | 3 (0.4%) |
Health Insurance Coverage by Citizenship Status in Deer Park
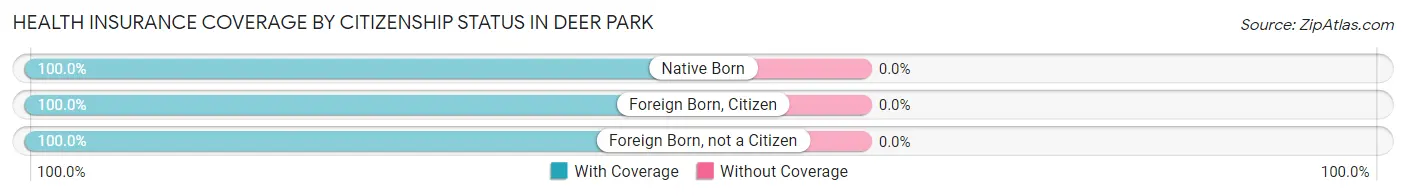
| Citizenship Status | With Coverage | Without Coverage |
| Native Born | 14 (100.0%) | 0 (0.0%) |
| Foreign Born, Citizen | 98 (100.0%) | 0 (0.0%) |
| Foreign Born, not a Citizen | 2 (100.0%) | 0 (0.0%) |
Health Insurance Coverage by Household Income in Deer Park
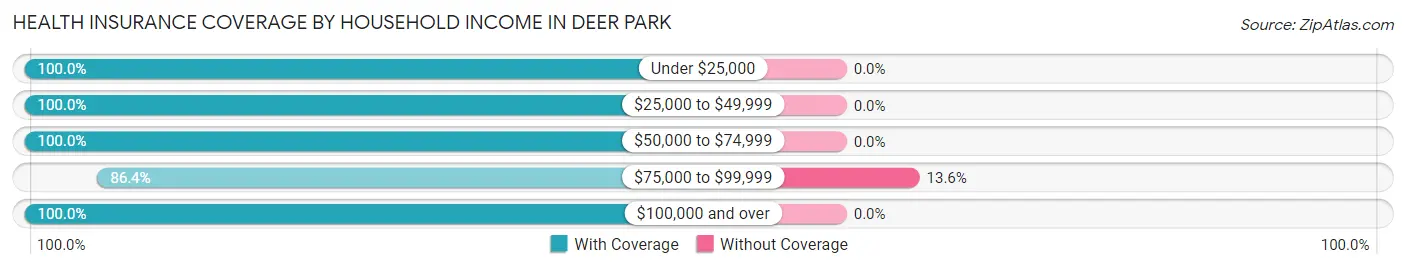
| Household Income | With Coverage | Without Coverage |
| Under $25,000 | 27 (100.0%) | 0 (0.0%) |
| $25,000 to $49,999 | 96 (100.0%) | 0 (0.0%) |
| $50,000 to $74,999 | 45 (100.0%) | 0 (0.0%) |
| $75,000 to $99,999 | 19 (86.4%) | 3 (13.6%) |
| $100,000 and over | 589 (100.0%) | 0 (0.0%) |
Public vs Private Health Insurance Coverage by Age in Deer Park
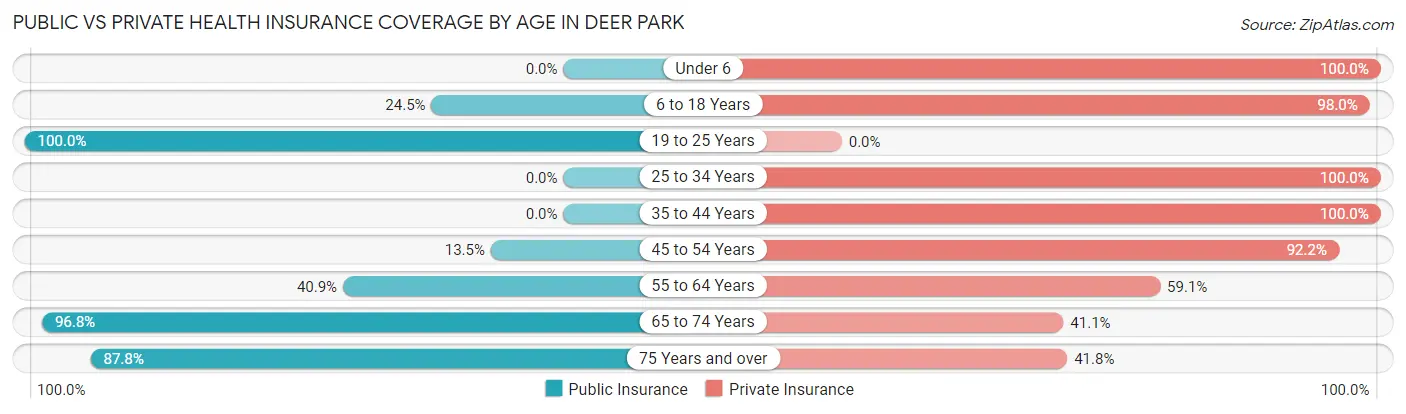
| Age Bracket | Public Insurance | Private Insurance |
| Under 6 | 0 (0.0%) | 14 (100.0%) |
| 6 to 18 Years | 24 (24.5%) | 96 (98.0%) |
| 19 to 25 Years | 2 (100.0%) | 0 (0.0%) |
| 25 to 34 Years | 0 (0.0%) | 89 (100.0%) |
| 35 to 44 Years | 0 (0.0%) | 95 (100.0%) |
| 45 to 54 Years | 26 (13.5%) | 178 (92.2%) |
| 55 to 64 Years | 27 (40.9%) | 39 (59.1%) |
| 65 to 74 Years | 120 (96.8%) | 51 (41.1%) |
| 75 Years and over | 86 (87.8%) | 41 (41.8%) |
| Total | 285 (36.6%) | 603 (77.4%) |
Disability Status by Sex by Age in Deer Park
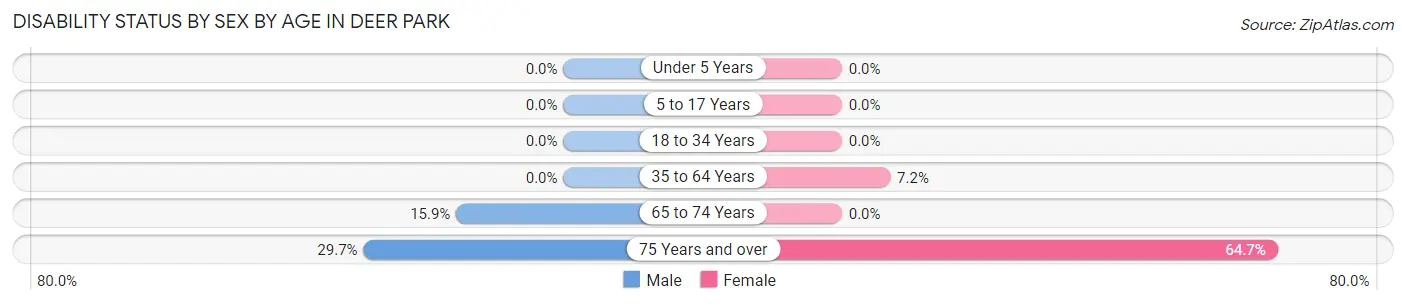
| Age Bracket | Male | Female |
| Under 5 Years | 0 (0.0%) | 0 (0.0%) |
| 5 to 17 Years | 0 (0.0%) | 0 (0.0%) |
| 18 to 34 Years | 0 (0.0%) | 0 (0.0%) |
| 35 to 64 Years | 0 (0.0%) | 13 (7.2%) |
| 65 to 74 Years | 7 (15.9%) | 0 (0.0%) |
| 75 Years and over | 19 (29.7%) | 22 (64.7%) |
Disability Class by Sex by Age in Deer Park
Disability Class: Hearing Difficulty
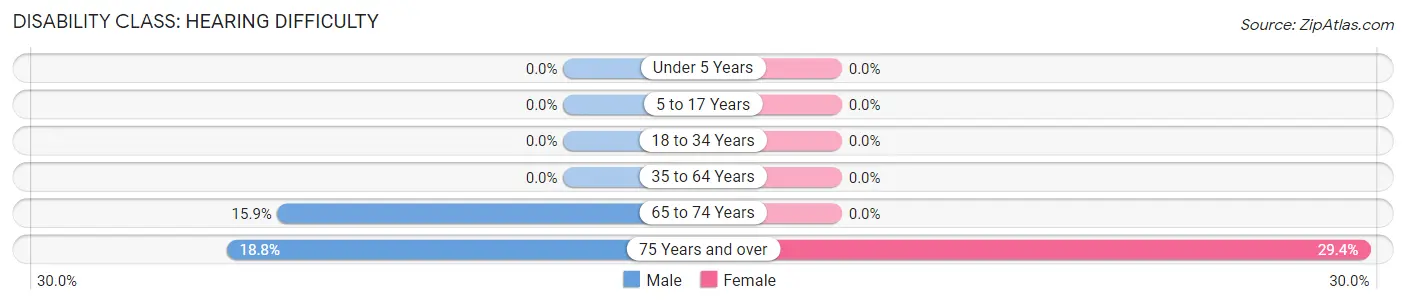
| Age Bracket | Male | Female |
| Under 5 Years | 0 (0.0%) | 0 (0.0%) |
| 5 to 17 Years | 0 (0.0%) | 0 (0.0%) |
| 18 to 34 Years | 0 (0.0%) | 0 (0.0%) |
| 35 to 64 Years | 0 (0.0%) | 0 (0.0%) |
| 65 to 74 Years | 7 (15.9%) | 0 (0.0%) |
| 75 Years and over | 12 (18.8%) | 10 (29.4%) |
Disability Class: Vision Difficulty
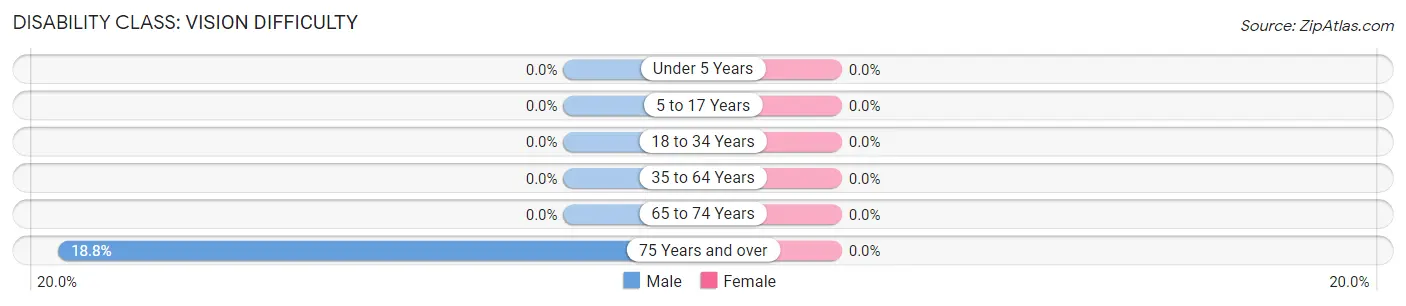
| Age Bracket | Male | Female |
| Under 5 Years | 0 (0.0%) | 0 (0.0%) |
| 5 to 17 Years | 0 (0.0%) | 0 (0.0%) |
| 18 to 34 Years | 0 (0.0%) | 0 (0.0%) |
| 35 to 64 Years | 0 (0.0%) | 0 (0.0%) |
| 65 to 74 Years | 0 (0.0%) | 0 (0.0%) |
| 75 Years and over | 12 (18.8%) | 0 (0.0%) |
Disability Class: Cognitive Difficulty
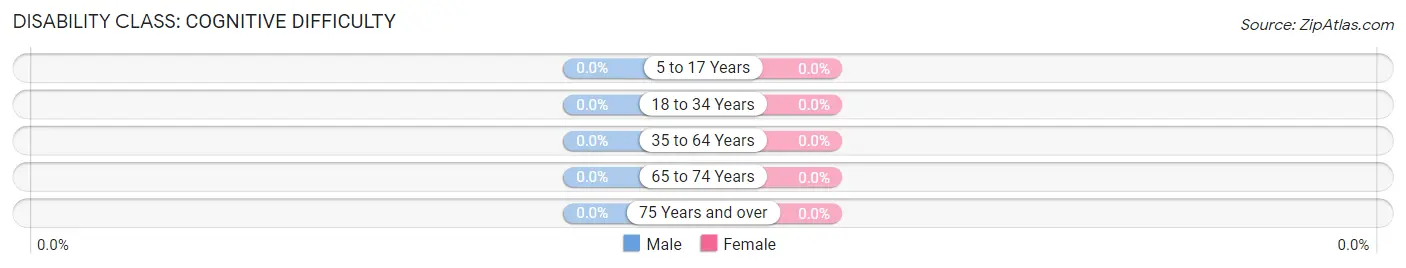
| Age Bracket | Male | Female |
| 5 to 17 Years | 0 (0.0%) | 0 (0.0%) |
| 18 to 34 Years | 0 (0.0%) | 0 (0.0%) |
| 35 to 64 Years | 0 (0.0%) | 0 (0.0%) |
| 65 to 74 Years | 0 (0.0%) | 0 (0.0%) |
| 75 Years and over | 0 (0.0%) | 0 (0.0%) |
Disability Class: Ambulatory Difficulty
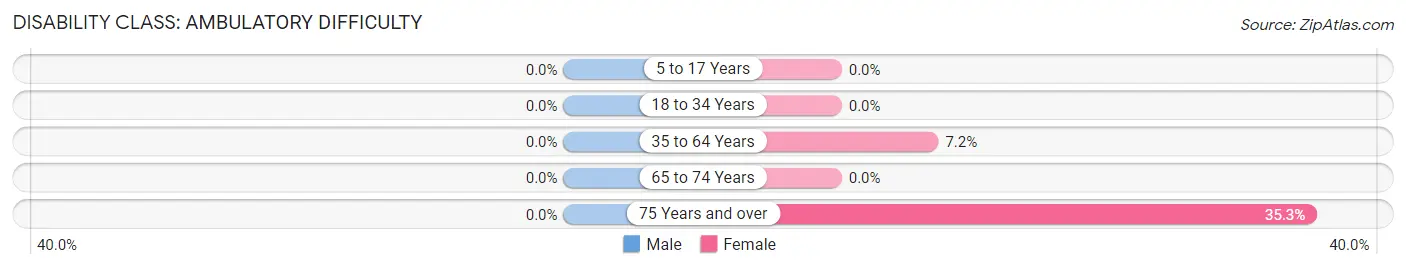
| Age Bracket | Male | Female |
| 5 to 17 Years | 0 (0.0%) | 0 (0.0%) |
| 18 to 34 Years | 0 (0.0%) | 0 (0.0%) |
| 35 to 64 Years | 0 (0.0%) | 13 (7.2%) |
| 65 to 74 Years | 0 (0.0%) | 0 (0.0%) |
| 75 Years and over | 0 (0.0%) | 12 (35.3%) |
Disability Class: Self-Care Difficulty
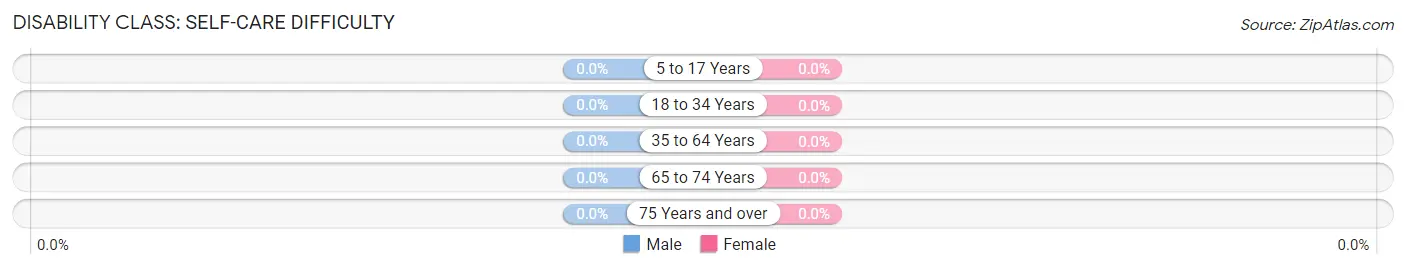
| Age Bracket | Male | Female |
| 5 to 17 Years | 0 (0.0%) | 0 (0.0%) |
| 18 to 34 Years | 0 (0.0%) | 0 (0.0%) |
| 35 to 64 Years | 0 (0.0%) | 0 (0.0%) |
| 65 to 74 Years | 0 (0.0%) | 0 (0.0%) |
| 75 Years and over | 0 (0.0%) | 0 (0.0%) |
Technology Access in Deer Park
Computing Device Access in Deer Park
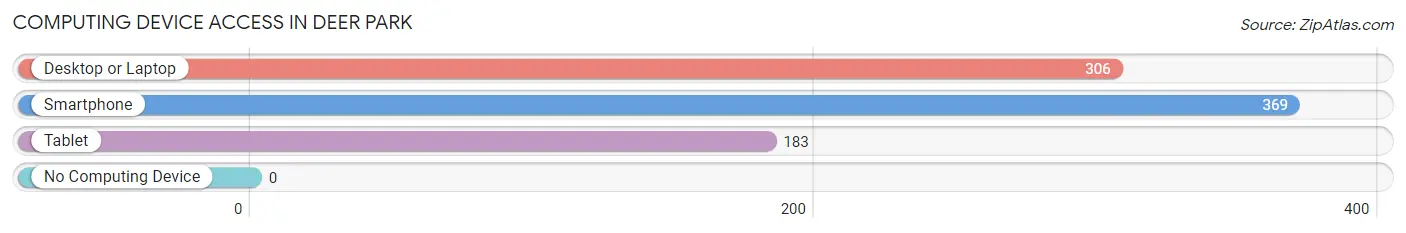
| Device Type | # Households | % Households |
| Desktop or Laptop | 306 | 80.7% |
| Smartphone | 369 | 97.4% |
| Tablet | 183 | 48.3% |
| No Computing Device | 0 | 0.0% |
| Total | 379 | 100.0% |
Internet Access in Deer Park
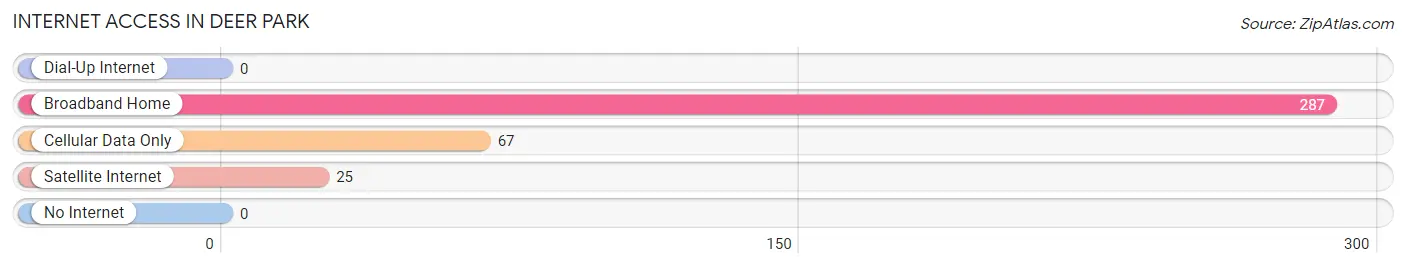
| Internet Type | # Households | % Households |
| Dial-Up Internet | 0 | 0.0% |
| Broadband Home | 287 | 75.7% |
| Cellular Data Only | 67 | 17.7% |
| Satellite Internet | 25 | 6.6% |
| No Internet | 0 | 0.0% |
| Total | 379 | 100.0% |
Deer Park Summary
Deer Park is a small unincorporated community located in the foothills of the Sierra Nevada Mountains in El Dorado County, California. The community is situated at an elevation of 2,845 feet (867 m) and is located approximately 10 miles (16 km) east of Placerville. The population of Deer Park was estimated to be 1,845 in 2020.
History
Deer Park was originally inhabited by the Miwok Native Americans, who lived in the area for thousands of years before the arrival of European settlers. The first recorded European settler in the area was John Sutter, who established a trading post in the area in 1848. The area was later settled by miners during the California Gold Rush of 1849. The town was officially founded in 1851 and was named after the abundance of deer in the area.
In the late 19th century, Deer Park was a popular destination for tourists and vacationers. The town was home to several resorts, including the Deer Park Hotel, which was built in 1875 and was one of the most popular resorts in the area. The hotel was destroyed by fire in 1891 and was never rebuilt.
Geography
Deer Park is located in the foothills of the Sierra Nevada Mountains in El Dorado County, California. The community is situated at an elevation of 2,845 feet (867 m) and is located approximately 10 miles (16 km) east of Placerville. The town is surrounded by the Eldorado National Forest and is located near the South Fork of the American River.
The climate in Deer Park is characterized by hot, dry summers and cool, wet winters. The average annual temperature is 54°F (12°C), with an average high of 79°F (26°C) in July and an average low of 30°F (-1°C) in January. The average annual precipitation is 28 inches (71 cm).
Economy
Deer Park’s economy is largely based on tourism and recreation. The town is home to several resorts, campgrounds, and recreational activities, including fishing, hiking, and mountain biking. The town is also home to several wineries and vineyards, as well as a number of restaurants and shops.
Demographics
As of 2020, the population of Deer Park was estimated to be 1,845. The racial makeup of the town was 94.2% White, 0.7% African American, 0.7% Native American, 0.7% Asian, 0.2% Pacific Islander, 1.2% from other races, and 2.2% from two or more races. Hispanic or Latino of any race were 4.2% of the population.
The median household income in Deer Park was $50,938 in 2019, and the median family income was $58,750. The per capita income was $25,938. About 11.2% of families and 14.2% of the population were below the poverty line, including 18.2% of those under age 18 and 8.2% of those age 65 or over.
Common Questions
What is Per Capita Income in Deer Park?
Per Capita income in Deer Park is $77,504.
What is the Median Family Income in Deer Park?
Median Family Income in Deer Park is $158,594.
What is the Median Household income in Deer Park?
Median Household Income in Deer Park is $104,830.
What is Income or Wage Gap in Deer Park?
Income or Wage Gap in Deer Park is 26.5%.
Women in Deer Park earn 73.5 cents for every dollar earned by a man.
What is Inequality or Gini Index in Deer Park?
Inequality or Gini Index in Deer Park is 0.50.
What is the Total Population of Deer Park?
Total Population of Deer Park is 835.
What is the Total Male Population of Deer Park?
Total Male Population of Deer Park is 359.
What is the Total Female Population of Deer Park?
Total Female Population of Deer Park is 476.
What is the Ratio of Males per 100 Females in Deer Park?
There are 75.42 Males per 100 Females in Deer Park.
What is the Ratio of Females per 100 Males in Deer Park?
There are 132.59 Females per 100 Males in Deer Park.
What is the Median Population Age in Deer Park?
Median Population Age in Deer Park is 49.5 Years.
What is the Average Family Size in Deer Park
Average Family Size in Deer Park is 2.6 People.
What is the Average Household Size in Deer Park
Average Household Size in Deer Park is 2.1 People.
How Large is the Labor Force in Deer Park?
There are 484 People in the Labor Forcein in Deer Park.
What is the Percentage of People in the Labor Force in Deer Park?
66.0% of People are in the Labor Force in Deer Park.
What is the Unemployment Rate in Deer Park?
Unemployment Rate in Deer Park is 0.8%.