Zip Codes with the Highest Percentage of Population Employed in Health Care & Social Assistance in Danville, CA
RELATED REPORTS & OPTIONS
Health Care & Social Assistance
Danville
Compare Zip Codes
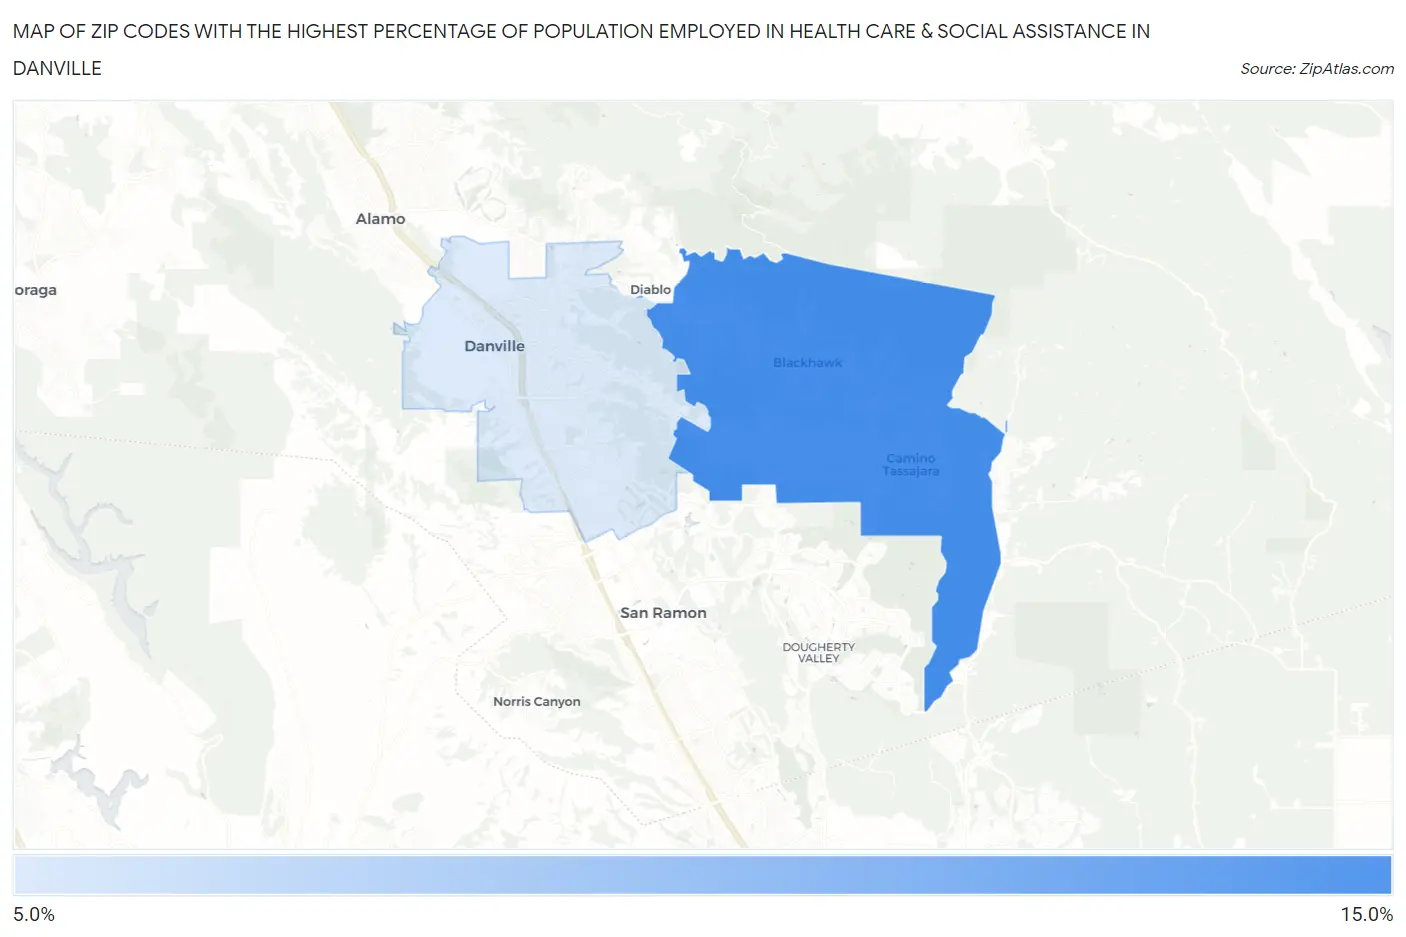
Map of Zip Codes with the Highest Percentage of Population Employed in Health Care & Social Assistance in Danville
0.0%
15.0%
Zip Codes with the Highest Percentage of Population Employed in Health Care & Social Assistance in Danville, CA
| Zip Code | % Employed | vs State | vs National | |
| 1. | 94506 | 12.0% | 12.7%(-0.715)#843 | 13.9%(-1.91)#18,975 |
| 2. | 94526 | 11.6% | 12.7%(-1.10)#920 | 13.9%(-2.29)#19,856 |
1
Common Questions
What are the Top Zip Codes with the Highest Percentage of Population Employed in Health Care & Social Assistance in Danville, CA?
Top Zip Codes with the Highest Percentage of Population Employed in Health Care & Social Assistance in Danville, CA are:
What zip code has the Highest Percentage of Population Employed in Health Care & Social Assistance in Danville, CA?
94506 has the Highest Percentage of Population Employed in Health Care & Social Assistance in Danville, CA with 12.0%.
What is the Percentage of Population Employed in Health Care & Social Assistance in Danville, CA?
Percentage of Population Employed in Health Care & Social Assistance in Danville is 12.0%.
What is the Percentage of Population Employed in Health Care & Social Assistance in California?
Percentage of Population Employed in Health Care & Social Assistance in California is 12.7%.
What is the Percentage of Population Employed in Health Care & Social Assistance in the United States?
Percentage of Population Employed in Health Care & Social Assistance in the United States is 13.9%.