Zip Codes with the Highest Percentage of Households Heated by Bottled Gas / Liquid Propane in Danville, CA
RELATED REPORTS & OPTIONS
Bottled Gas / LP Heating
Danville
Compare Zip Codes
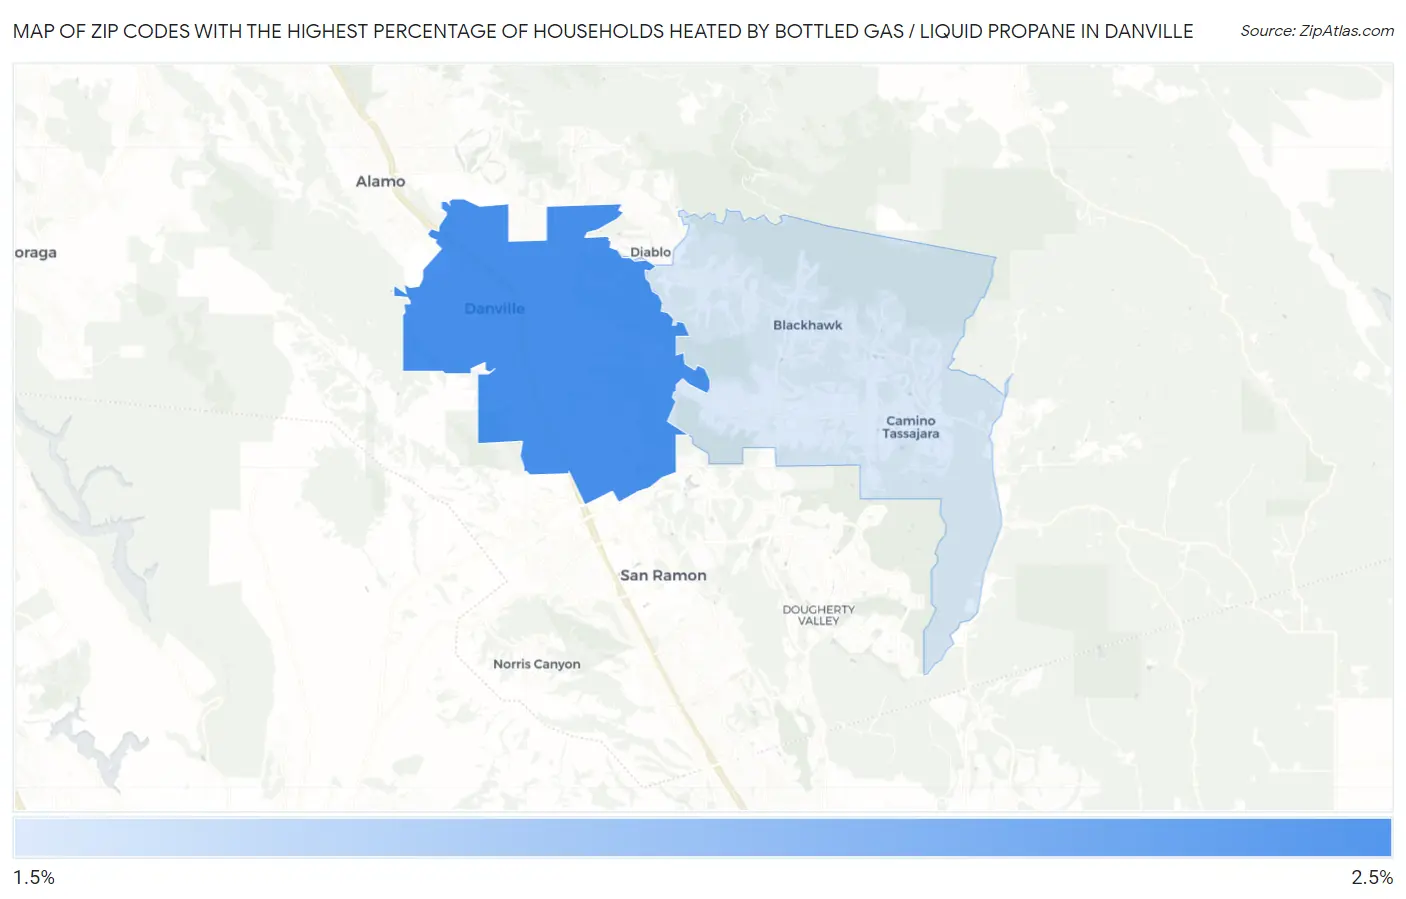
Map of Zip Codes with the Highest Percentage of Households Heated by Bottled Gas / Liquid Propane in Danville
0.0%
2.5%
Zip Codes with the Highest Percentage of Households Heated by Bottled Gas / Liquid Propane in Danville, CA
| Zip Code | Bottled Gas / LP Heating | vs State | vs National | |
| 1. | 94526 | 2.5% | 3.5%(-1.00)#790 | 4.9%(-2.40)#21,941 |
| 2. | 94506 | 2.1% | 3.5%(-1.40)#903 | 4.9%(-2.80)#22,898 |
1
Common Questions
What are the Top Zip Codes with the Highest Percentage of Households Heated by Bottled Gas / Liquid Propane in Danville, CA?
Top Zip Codes with the Highest Percentage of Households Heated by Bottled Gas / Liquid Propane in Danville, CA are:
What zip code has the Highest Percentage of Households Heated by Bottled Gas / Liquid Propane in Danville, CA?
94526 has the Highest Percentage of Households Heated by Bottled Gas / Liquid Propane in Danville, CA with 2.5%.
What is the Percentage of Households Heated by Bottled Gas / Liquid Propane in Danville, CA?
Percentage of Households Heated by Bottled Gas / Liquid Propane in Danville is 2.6%.
What is the Percentage of Households Heated by Bottled Gas / Liquid Propane in California?
Percentage of Households Heated by Bottled Gas / Liquid Propane in California is 3.5%.
What is the Percentage of Households Heated by Bottled Gas / Liquid Propane in the United States?
Percentage of Households Heated by Bottled Gas / Liquid Propane in the United States is 4.9%.