Crowley Lake, CA Map & Demographics
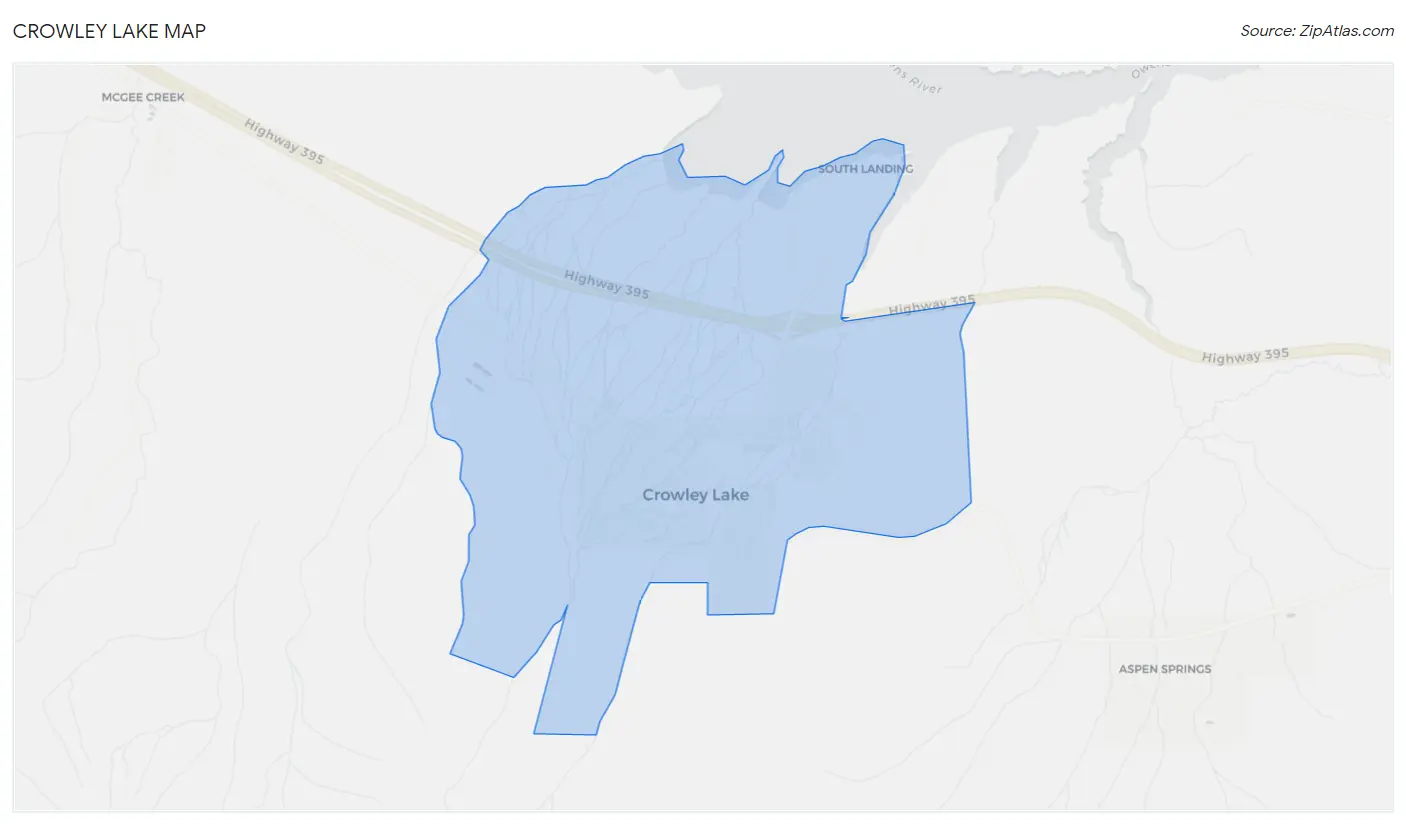
Crowley Lake Map
Crowley Lake Overview
$42,248
PER CAPITA INCOME
$101,154
AVG FAMILY INCOME
$102,143
AVG HOUSEHOLD INCOME
6.7%
WAGE / INCOME GAP [ % ]
93.3¢/ $1
WAGE / INCOME GAP [ $ ]
0.43
INEQUALITY / GINI INDEX
1,066
TOTAL POPULATION
728
MALE POPULATION
338
FEMALE POPULATION
215.38
MALES / 100 FEMALES
46.43
FEMALES / 100 MALES
38.6
MEDIAN AGE
2.6
AVG FAMILY SIZE
2.4
AVG HOUSEHOLD SIZE
649
LABOR FORCE [ PEOPLE ]
83.4%
PERCENT IN LABOR FORCE
Crowley Lake Area Codes
Income in Crowley Lake
Income Overview in Crowley Lake
Per Capita Income in Crowley Lake is $42,248, while median incomes of families and households are $101,154 and $102,143 respectively.
| Characteristic | Number | Measure |
| Per Capita Income | 1,066 | $42,248 |
| Median Family Income | 364 | $101,154 |
| Mean Family Income | 364 | $98,761 |
| Median Household Income | 438 | $102,143 |
| Mean Household Income | 438 | $100,364 |
| Income Deficit | 364 | $0 |
| Wage / Income Gap (%) | 1,066 | 6.72% |
| Wage / Income Gap ($) | 1,066 | 93.28¢ per $1 |
| Gini / Inequality Index | 1,066 | 0.43 |
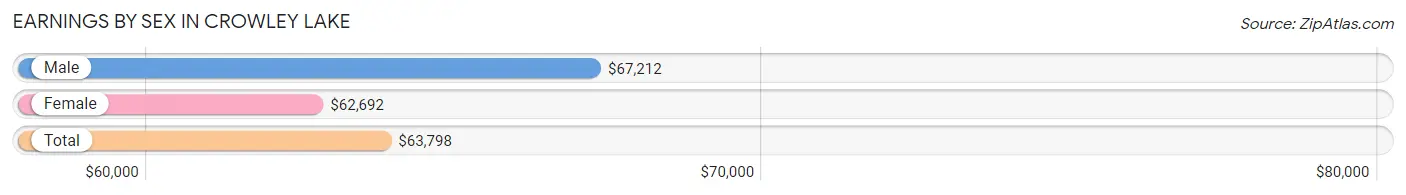
Earnings by Sex in Crowley Lake
Average Earnings in Crowley Lake are $63,798, $67,212 for men and $62,692 for women, a difference of 6.7%.
| Sex | Number | Average Earnings |
| Male | 409 (61.9%) | $67,212 |
| Female | 252 (38.1%) | $62,692 |
| Total | 661 (100.0%) | $63,798 |
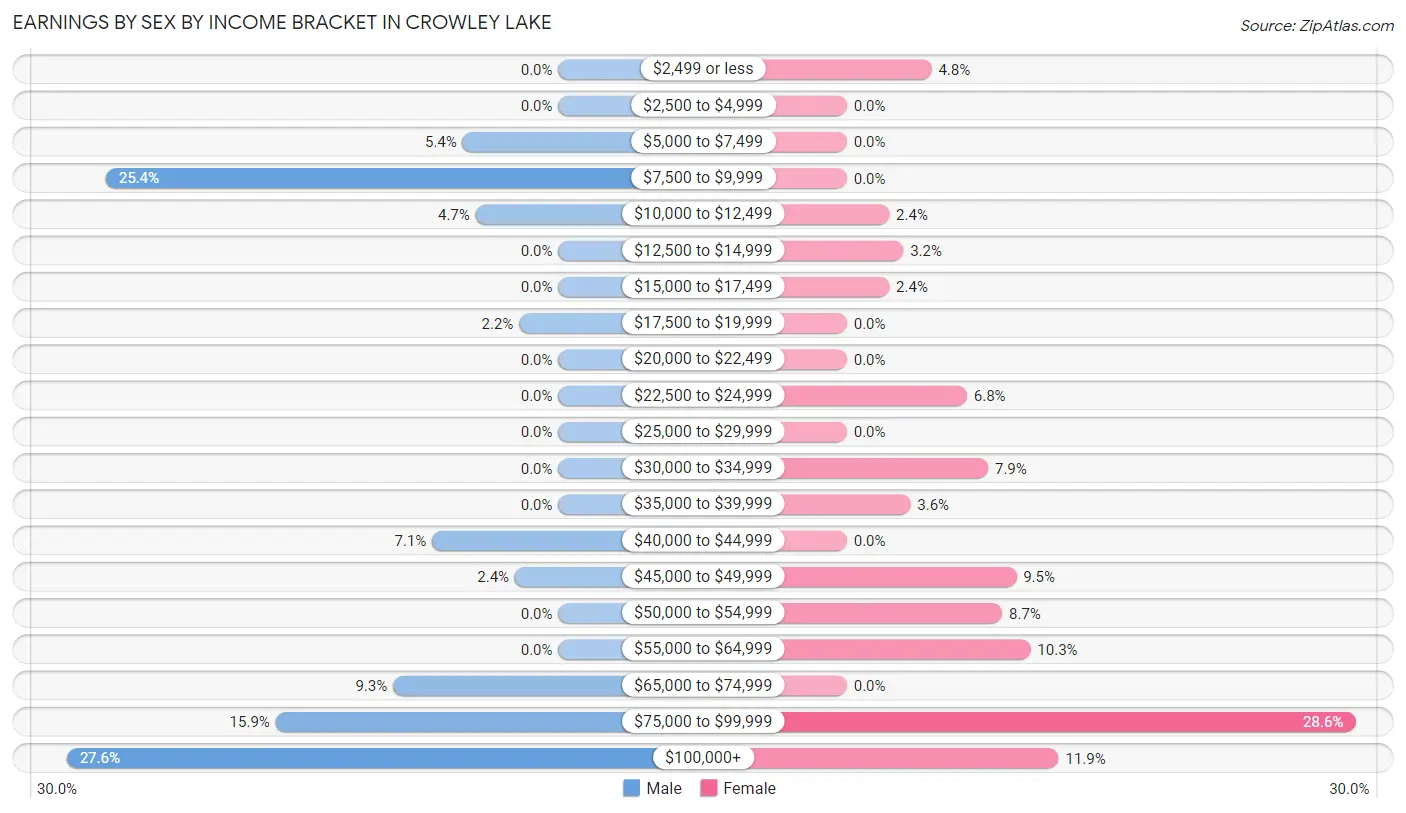
Earnings by Sex by Income Bracket in Crowley Lake
The most common earnings brackets in Crowley Lake are $100,000+ for men (113 | 27.6%) and $75,000 to $99,999 for women (72 | 28.6%).
| Income | Male | Female |
| $2,499 or less | 0 (0.0%) | 12 (4.8%) |
| $2,500 to $4,999 | 0 (0.0%) | 0 (0.0%) |
| $5,000 to $7,499 | 22 (5.4%) | 0 (0.0%) |
| $7,500 to $9,999 | 104 (25.4%) | 0 (0.0%) |
| $10,000 to $12,499 | 19 (4.6%) | 6 (2.4%) |
| $12,500 to $14,999 | 0 (0.0%) | 8 (3.2%) |
| $15,000 to $17,499 | 0 (0.0%) | 6 (2.4%) |
| $17,500 to $19,999 | 9 (2.2%) | 0 (0.0%) |
| $20,000 to $22,499 | 0 (0.0%) | 0 (0.0%) |
| $22,500 to $24,999 | 0 (0.0%) | 17 (6.8%) |
| $25,000 to $29,999 | 0 (0.0%) | 0 (0.0%) |
| $30,000 to $34,999 | 0 (0.0%) | 20 (7.9%) |
| $35,000 to $39,999 | 0 (0.0%) | 9 (3.6%) |
| $40,000 to $44,999 | 29 (7.1%) | 0 (0.0%) |
| $45,000 to $49,999 | 10 (2.4%) | 24 (9.5%) |
| $50,000 to $54,999 | 0 (0.0%) | 22 (8.7%) |
| $55,000 to $64,999 | 0 (0.0%) | 26 (10.3%) |
| $65,000 to $74,999 | 38 (9.3%) | 0 (0.0%) |
| $75,000 to $99,999 | 65 (15.9%) | 72 (28.6%) |
| $100,000+ | 113 (27.6%) | 30 (11.9%) |
| Total | 409 (100.0%) | 252 (100.0%) |
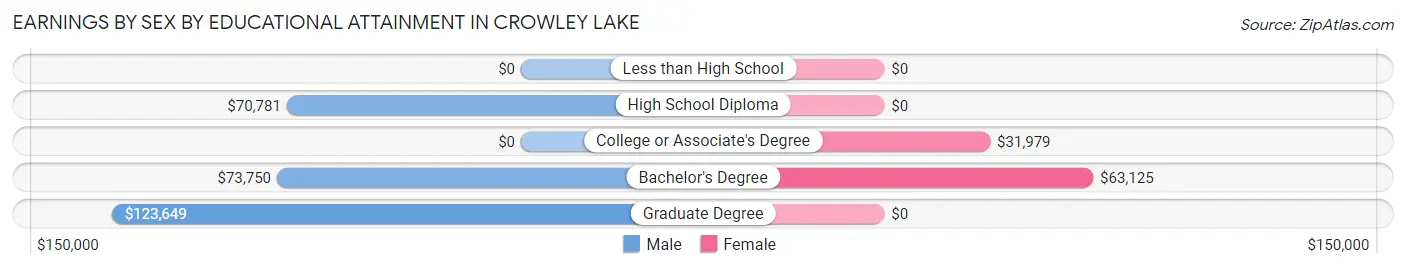
Earnings by Sex by Educational Attainment in Crowley Lake
Average earnings in Crowley Lake are $67,212 for men and $63,654 for women, a difference of 5.3%. Men with an educational attainment of graduate degree enjoy the highest average annual earnings of $123,649, while those with high school diploma education earn the least with $70,781. Women with an educational attainment of bachelor's degree earn the most with the average annual earnings of $63,125, while those with college or associate's degree education have the smallest earnings of $31,979.
| Educational Attainment | Male Income | Female Income |
| Less than High School | - | - |
| High School Diploma | $70,781 | $0 |
| College or Associate's Degree | - | - |
| Bachelor's Degree | $73,750 | $63,125 |
| Graduate Degree | $123,649 | $0 |
| Total | $67,212 | $63,654 |
Family Income in Crowley Lake
Family Income Brackets in Crowley Lake
According to the Crowley Lake family income data, there are 104 families falling into the less than $10,000 income range, which is the most common income bracket and makes up 28.6% of all families.
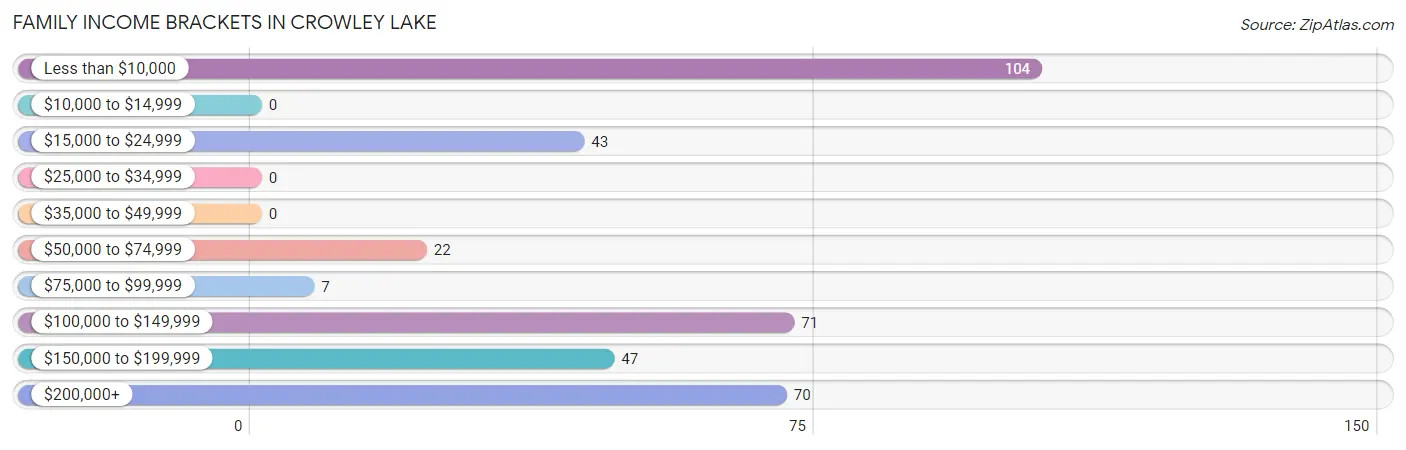
| Income Bracket | # Families | % Families |
| Less than $10,000 | 104 | 28.6% |
| $10,000 to $14,999 | 0 | 0.0% |
| $15,000 to $24,999 | 43 | 11.8% |
| $25,000 to $34,999 | 0 | 0.0% |
| $35,000 to $49,999 | 0 | 0.0% |
| $50,000 to $74,999 | 22 | 6.0% |
| $75,000 to $99,999 | 7 | 1.9% |
| $100,000 to $149,999 | 71 | 19.5% |
| $150,000 to $199,999 | 47 | 12.9% |
| $200,000+ | 70 | 19.2% |
Family Income by Famaliy Size in Crowley Lake
3-person families (77 | 21.1%) account for the highest median family income in Crowley Lake with $218,149 per family, while 3-person families (77 | 21.1%) have the highest median income of $72,716 per family member.
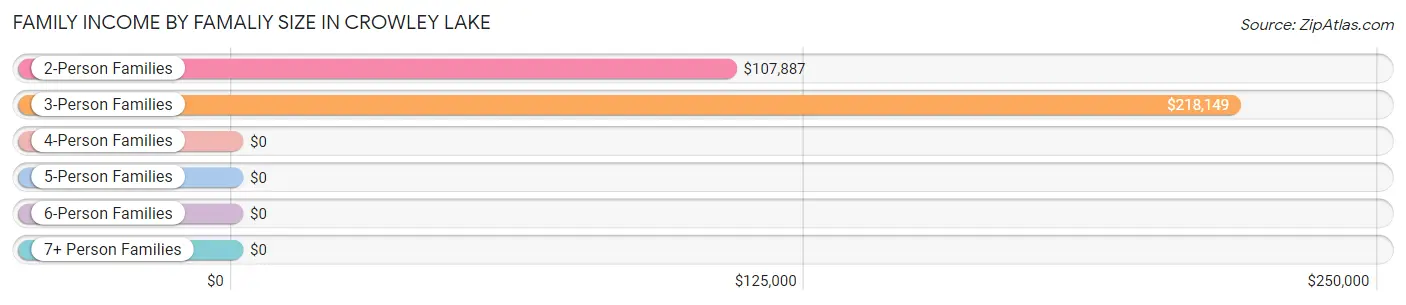
| Income Bracket | # Families | Median Income |
| 2-Person Families | 157 (43.1%) | $107,887 |
| 3-Person Families | 77 (21.1%) | $218,149 |
| 4-Person Families | 123 (33.8%) | $0 |
| 5-Person Families | 7 (1.9%) | $0 |
| 6-Person Families | 0 (0.0%) | $0 |
| 7+ Person Families | 0 (0.0%) | $0 |
| Total | 364 (100.0%) | $101,154 |
Family Income by Number of Earners in Crowley Lake
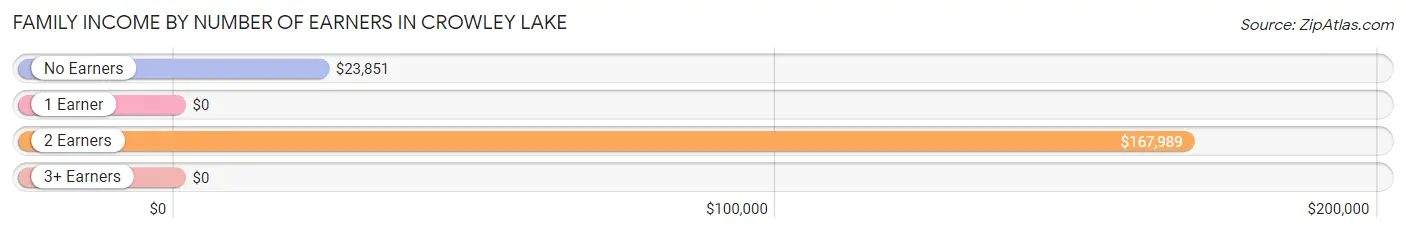
| Number of Earners | # Families | Median Income |
| No Earners | 52 (14.3%) | $23,851 |
| 1 Earner | 104 (28.6%) | $0 |
| 2 Earners | 201 (55.2%) | $167,989 |
| 3+ Earners | 7 (1.9%) | $0 |
| Total | 364 (100.0%) | $101,154 |
Household Income in Crowley Lake
Household Income Brackets in Crowley Lake
With 165 households falling in the category, the $15,000 to $24,999 income range is the most frequent in Crowley Lake, accounting for 37.7% of all households.
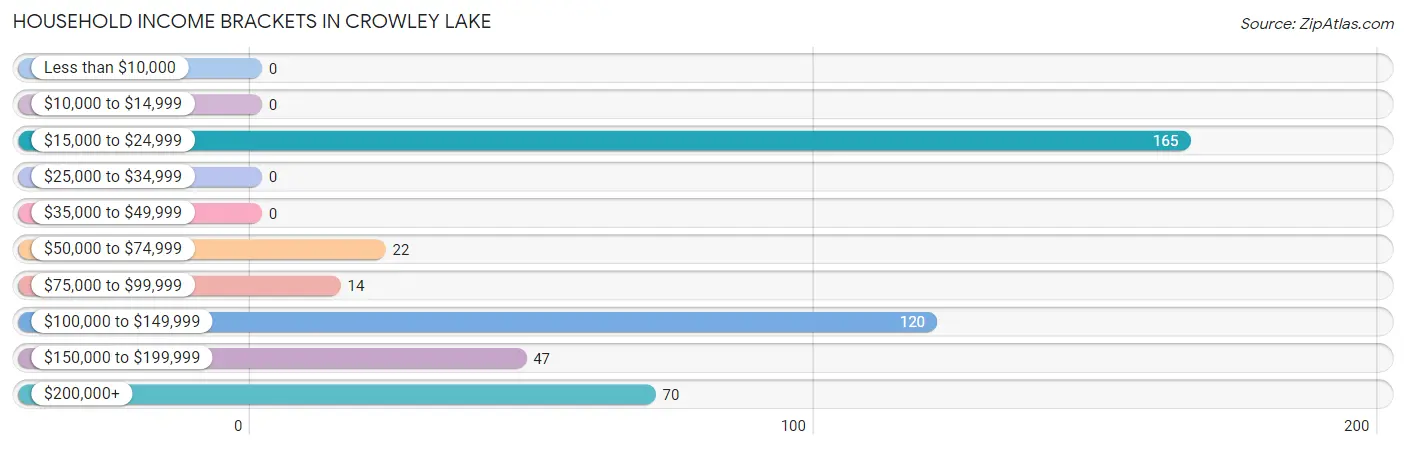
| Income Bracket | # Households | % Households |
| Less than $10,000 | 0 | 0.0% |
| $10,000 to $14,999 | 0 | 0.0% |
| $15,000 to $24,999 | 165 | 37.7% |
| $25,000 to $34,999 | 0 | 0.0% |
| $35,000 to $49,999 | 0 | 0.0% |
| $50,000 to $74,999 | 22 | 5.0% |
| $75,000 to $99,999 | 14 | 3.2% |
| $100,000 to $149,999 | 120 | 27.4% |
| $150,000 to $199,999 | 47 | 10.7% |
| $200,000+ | 70 | 16.0% |
Household Income by Householder Age in Crowley Lake
The median household income in Crowley Lake is $102,143, with the highest median household income of $108,750 found in the 45 to 64 years age bracket for the primary householder. A total of 127 households (29.0%) fall into this category.
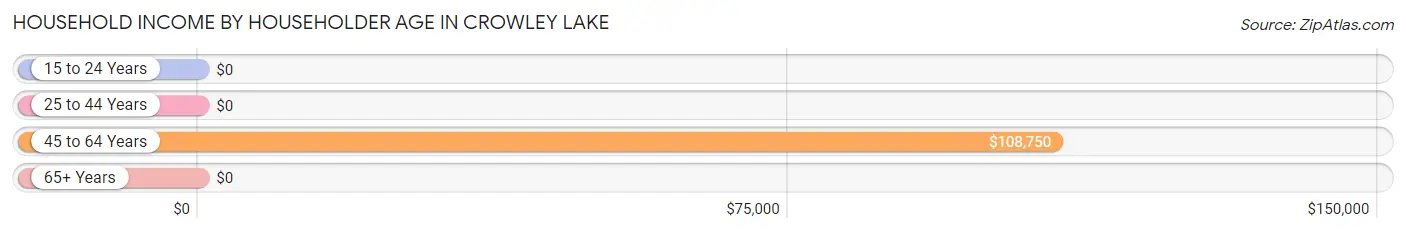
| Income Bracket | # Households | Median Income |
| 15 to 24 Years | 0 (0.0%) | $0 |
| 25 to 44 Years | 250 (57.1%) | $0 |
| 45 to 64 Years | 127 (29.0%) | $108,750 |
| 65+ Years | 61 (13.9%) | $0 |
| Total | 438 (100.0%) | $102,143 |
Poverty in Crowley Lake
Income Below Poverty by Sex and Age in Crowley Lake
With 45.9% poverty level for males and 5.3% for females among the residents of Crowley Lake, 12 to 14 year old males and 55 to 64 year old females are the most vulnerable to poverty, with 21 males (100.0%) and 6 females (13.6%) in their respective age groups living below the poverty level.
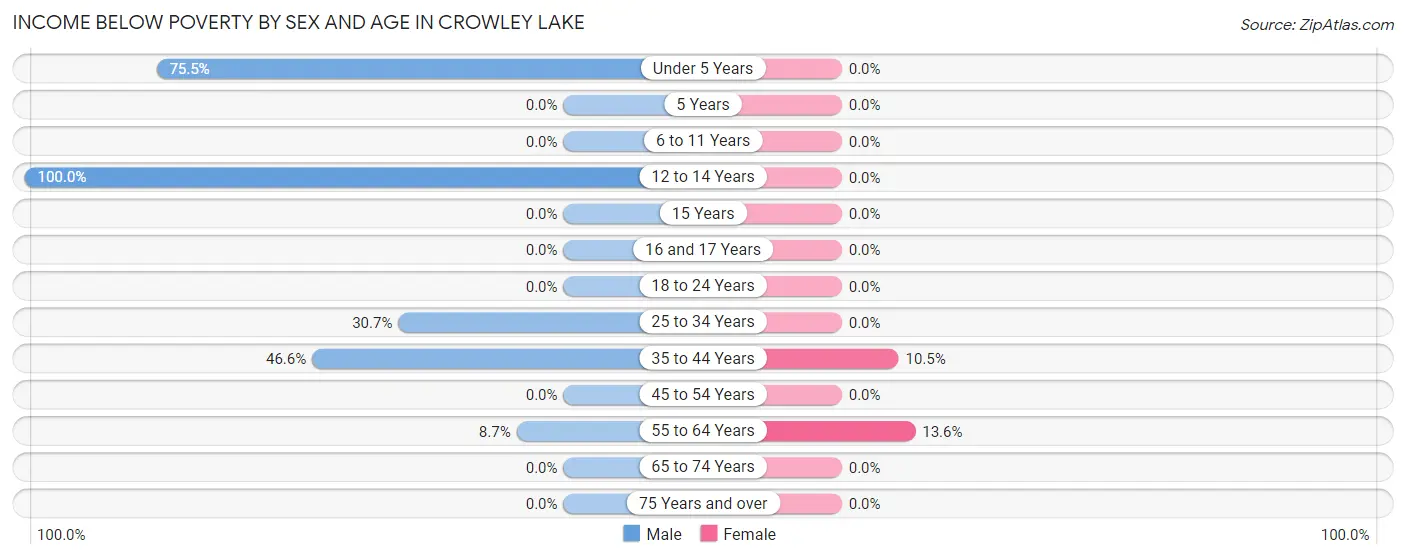
| Age Bracket | Male | Female |
| Under 5 Years | 182 (75.5%) | 0 (0.0%) |
| 5 Years | 0 (0.0%) | 0 (0.0%) |
| 6 to 11 Years | 0 (0.0%) | 0 (0.0%) |
| 12 to 14 Years | 21 (100.0%) | 0 (0.0%) |
| 15 Years | 0 (0.0%) | 0 (0.0%) |
| 16 and 17 Years | 0 (0.0%) | 0 (0.0%) |
| 18 to 24 Years | 0 (0.0%) | 0 (0.0%) |
| 25 to 34 Years | 19 (30.6%) | 0 (0.0%) |
| 35 to 44 Years | 104 (46.6%) | 12 (10.5%) |
| 45 to 54 Years | 0 (0.0%) | 0 (0.0%) |
| 55 to 64 Years | 8 (8.7%) | 6 (13.6%) |
| 65 to 74 Years | 0 (0.0%) | 0 (0.0%) |
| 75 Years and over | 0 (0.0%) | 0 (0.0%) |
| Total | 334 (45.9%) | 18 (5.3%) |
Income Above Poverty by Sex and Age in Crowley Lake
According to the poverty statistics in Crowley Lake, males aged 15 years and females aged 6 to 11 years are the age groups that are most secure financially, with 100.0% of males and 100.0% of females in these age groups living above the poverty line.
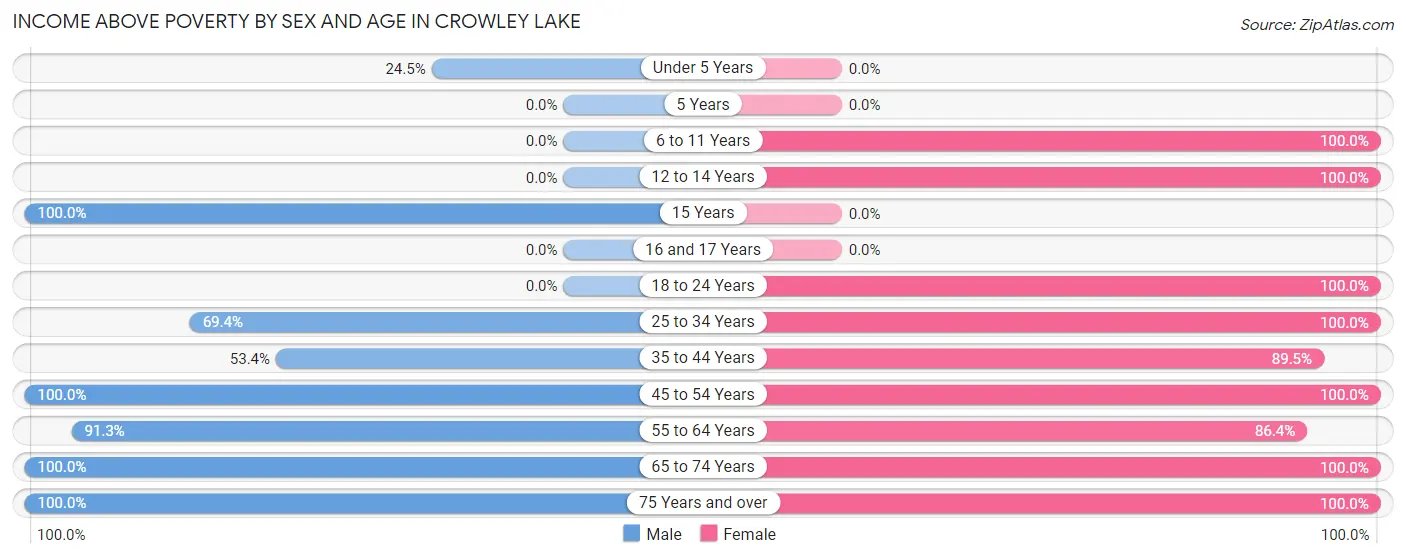
| Age Bracket | Male | Female |
| Under 5 Years | 59 (24.5%) | 0 (0.0%) |
| 5 Years | 0 (0.0%) | 0 (0.0%) |
| 6 to 11 Years | 0 (0.0%) | 7 (100.0%) |
| 12 to 14 Years | 0 (0.0%) | 16 (100.0%) |
| 15 Years | 3 (100.0%) | 0 (0.0%) |
| 16 and 17 Years | 0 (0.0%) | 0 (0.0%) |
| 18 to 24 Years | 0 (0.0%) | 20 (100.0%) |
| 25 to 34 Years | 43 (69.4%) | 32 (100.0%) |
| 35 to 44 Years | 119 (53.4%) | 102 (89.5%) |
| 45 to 54 Years | 51 (100.0%) | 34 (100.0%) |
| 55 to 64 Years | 84 (91.3%) | 38 (86.4%) |
| 65 to 74 Years | 7 (100.0%) | 14 (100.0%) |
| 75 Years and over | 28 (100.0%) | 57 (100.0%) |
| Total | 394 (54.1%) | 320 (94.7%) |
Income Below Poverty Among Married-Couple Families in Crowley Lake
The poverty statistics for married-couple families in Crowley Lake show that 2.3% or 6 of the total 260 families live below the poverty line. Families with no children have the highest poverty rate of 3.8%, comprising of 6 families. On the other hand, families with 1 or 2 children have the lowest poverty rate of 0.0%, which includes 0 families.
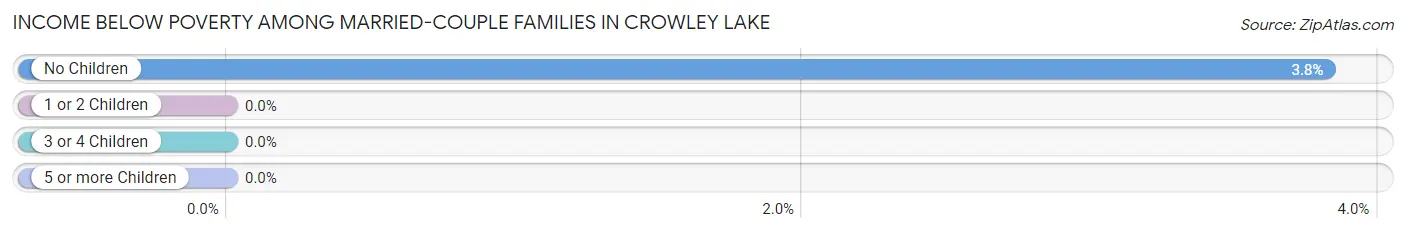
| Children | Above Poverty | Below Poverty |
| No Children | 151 (96.2%) | 6 (3.8%) |
| 1 or 2 Children | 103 (100.0%) | 0 (0.0%) |
| 3 or 4 Children | 0 (0.0%) | 0 (0.0%) |
| 5 or more Children | 0 (0.0%) | 0 (0.0%) |
| Total | 254 (97.7%) | 6 (2.3%) |
Income Below Poverty Among Single-Parent Households in Crowley Lake
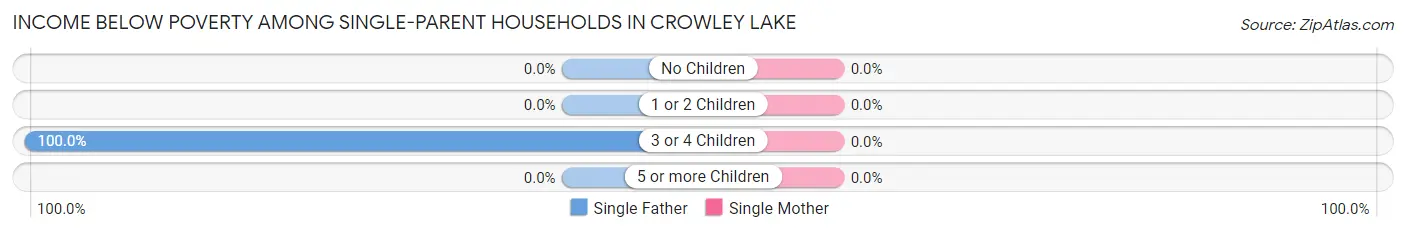
| Children | Single Father | Single Mother |
| No Children | 0 (0.0%) | 0 (0.0%) |
| 1 or 2 Children | 0 (0.0%) | 0 (0.0%) |
| 3 or 4 Children | 104 (100.0%) | 0 (0.0%) |
| 5 or more Children | 0 (0.0%) | 0 (0.0%) |
| Total | 104 (100.0%) | 0 (0.0%) |
Income Below Poverty Among Married-Couple vs Single-Parent Households in Crowley Lake
The poverty data for Crowley Lake shows that 6 of the married-couple family households (2.3%) and 104 of the single-parent households (100.0%) are living below the poverty level. Within the married-couple family households, those with no children have the highest poverty rate, with 6 households (3.8%) falling below the poverty line. Among the single-parent households, those with 3 or 4 children have the highest poverty rate, with 104 household (100.0%) living below poverty.
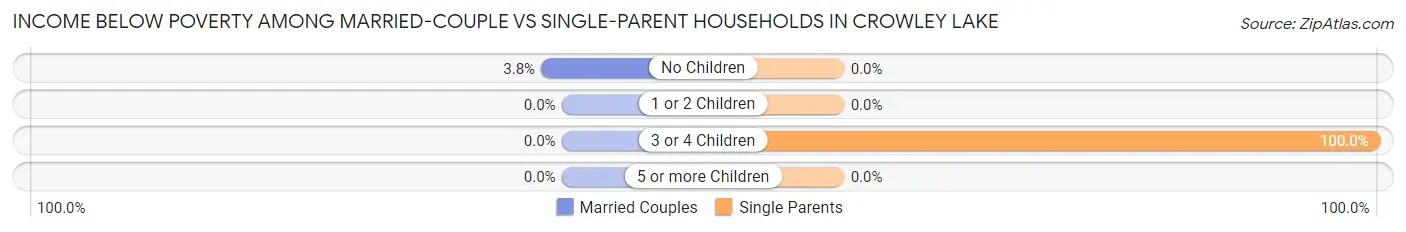
| Children | Married-Couple Families | Single-Parent Households |
| No Children | 6 (3.8%) | 0 (0.0%) |
| 1 or 2 Children | 0 (0.0%) | 0 (0.0%) |
| 3 or 4 Children | 0 (0.0%) | 104 (100.0%) |
| 5 or more Children | 0 (0.0%) | 0 (0.0%) |
| Total | 6 (2.3%) | 104 (100.0%) |
Race in Crowley Lake
The most populous races in Crowley Lake are White / Caucasian (751 | 70.5%), Hispanic or Latino (297 | 27.9%), and Two or more Races (286 | 26.8%).
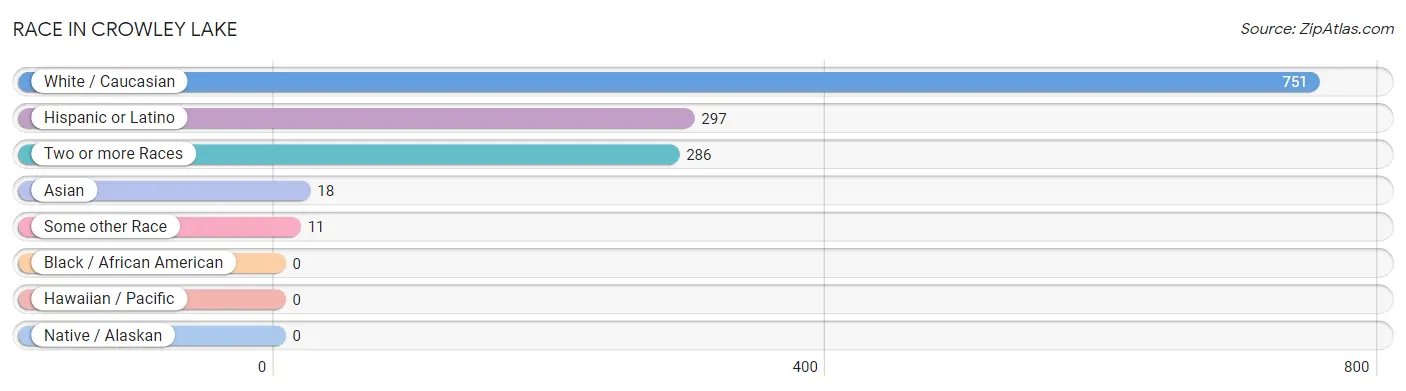
| Race | # Population | % Population |
| Asian | 18 | 1.7% |
| Black / African American | 0 | 0.0% |
| Hawaiian / Pacific | 0 | 0.0% |
| Hispanic or Latino | 297 | 27.9% |
| Native / Alaskan | 0 | 0.0% |
| White / Caucasian | 751 | 70.5% |
| Two or more Races | 286 | 26.8% |
| Some other Race | 11 | 1.0% |
| Total | 1,066 | 100.0% |
Ancestry in Crowley Lake
The most populous ancestries reported in Crowley Lake are Mexican (297 | 27.9%), French (83 | 7.8%), British (65 | 6.1%), Irish (56 | 5.2%), and German (54 | 5.1%), together accounting for 52.1% of all Crowley Lake residents.
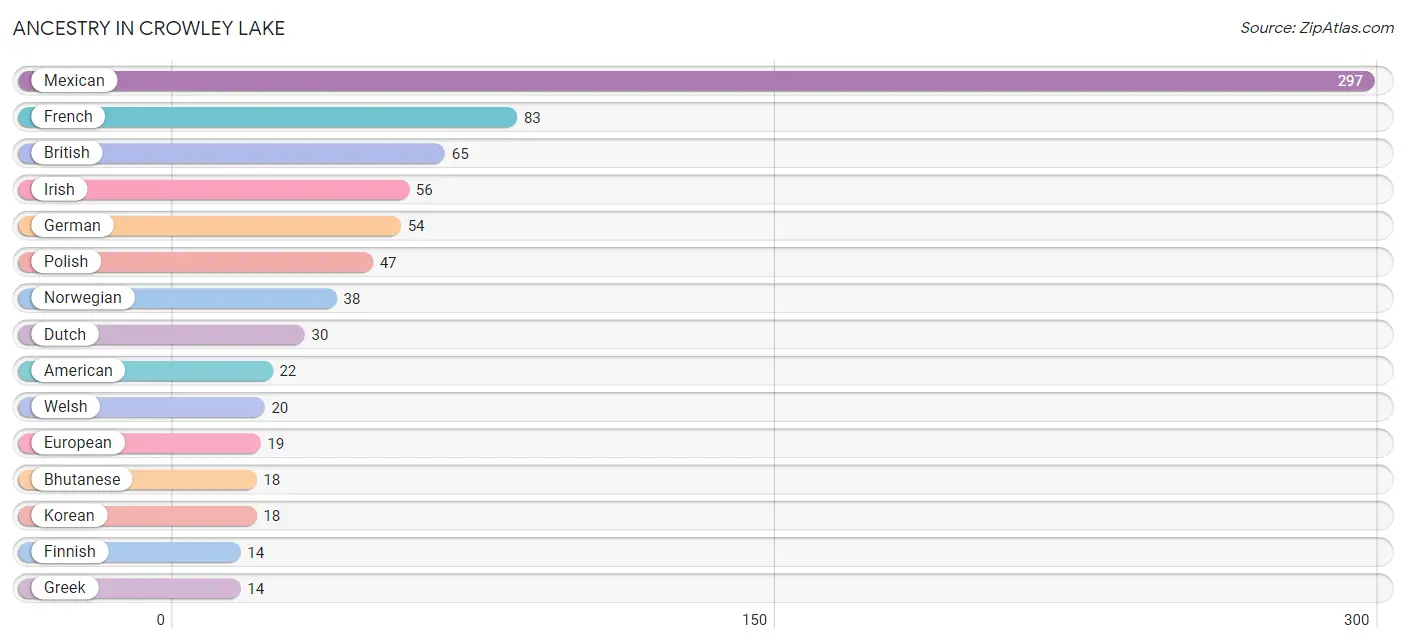
| Ancestry | # Population | % Population |
| American | 22 | 2.1% |
| Bhutanese | 18 | 1.7% |
| British | 65 | 6.1% |
| Dutch | 30 | 2.8% |
| English | 8 | 0.7% |
| European | 19 | 1.8% |
| Finnish | 14 | 1.3% |
| French | 83 | 7.8% |
| German | 54 | 5.1% |
| Greek | 14 | 1.3% |
| Irish | 56 | 5.2% |
| Italian | 8 | 0.7% |
| Korean | 18 | 1.7% |
| Mexican | 297 | 27.9% |
| Norwegian | 38 | 3.6% |
| Polish | 47 | 4.4% |
| Scottish | 8 | 0.7% |
| Swiss | 8 | 0.7% |
| Welsh | 20 | 1.9% | View All 19 Rows |
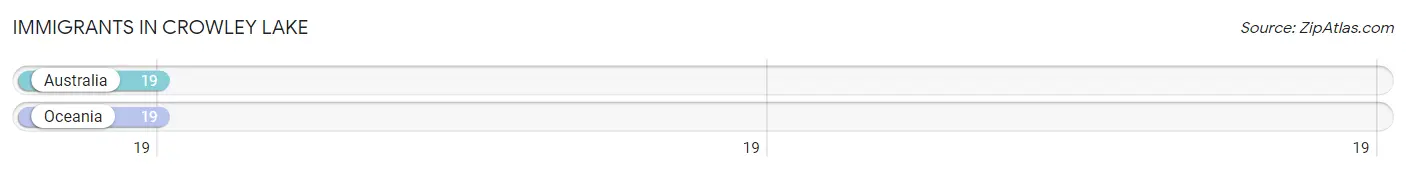
Immigrants in Crowley Lake
The most numerous immigrant groups reported in Crowley Lake came from Australia (19 | 1.8%), and Oceania (19 | 1.8%), together accounting for 3.6% of all Crowley Lake residents.
| Immigration Origin | # Population | % Population |
| Australia | 19 | 1.8% |
| Oceania | 19 | 1.8% | View All 2 Rows |
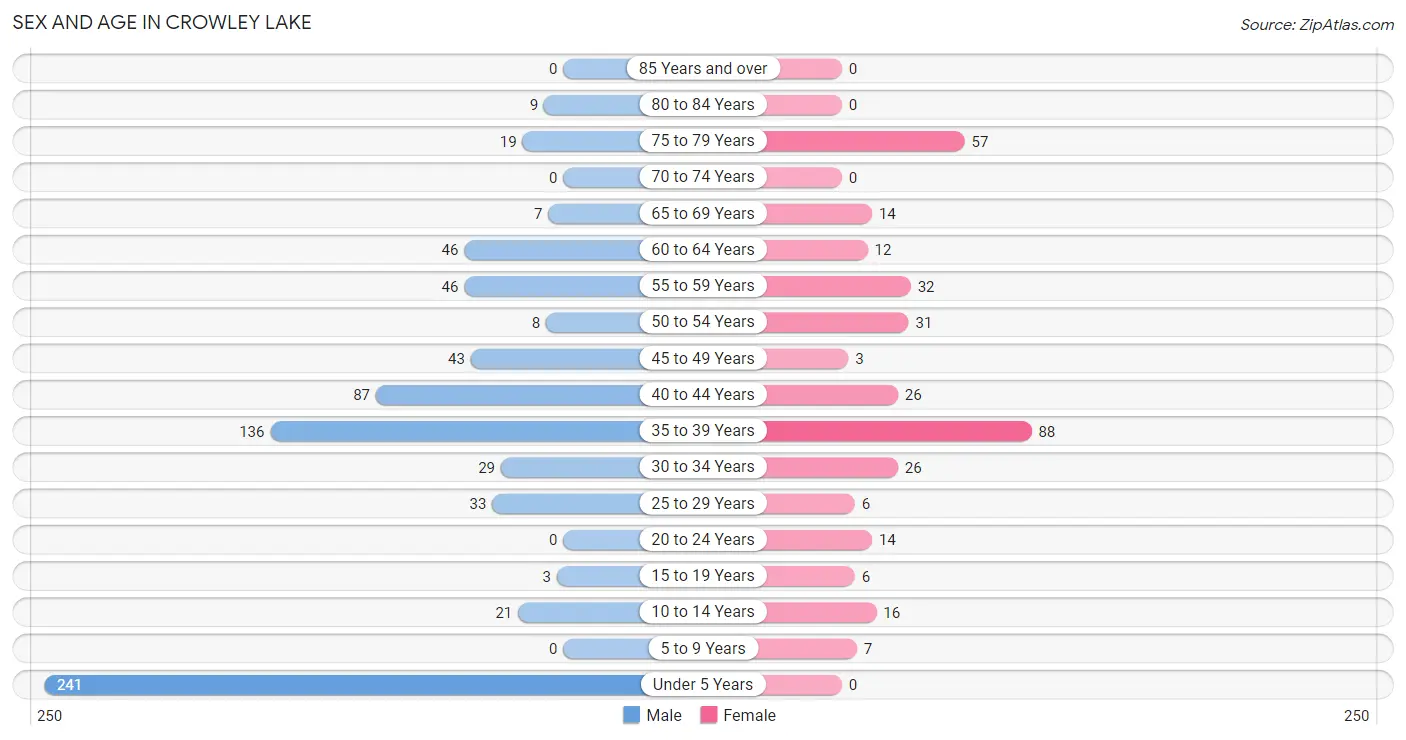
Sex and Age in Crowley Lake
Sex and Age in Crowley Lake
The most populous age groups in Crowley Lake are Under 5 Years (241 | 33.1%) for men and 35 to 39 Years (88 | 26.0%) for women.
| Age Bracket | Male | Female |
| Under 5 Years | 241 (33.1%) | 0 (0.0%) |
| 5 to 9 Years | 0 (0.0%) | 7 (2.1%) |
| 10 to 14 Years | 21 (2.9%) | 16 (4.7%) |
| 15 to 19 Years | 3 (0.4%) | 6 (1.8%) |
| 20 to 24 Years | 0 (0.0%) | 14 (4.1%) |
| 25 to 29 Years | 33 (4.5%) | 6 (1.8%) |
| 30 to 34 Years | 29 (4.0%) | 26 (7.7%) |
| 35 to 39 Years | 136 (18.7%) | 88 (26.0%) |
| 40 to 44 Years | 87 (11.9%) | 26 (7.7%) |
| 45 to 49 Years | 43 (5.9%) | 3 (0.9%) |
| 50 to 54 Years | 8 (1.1%) | 31 (9.2%) |
| 55 to 59 Years | 46 (6.3%) | 32 (9.5%) |
| 60 to 64 Years | 46 (6.3%) | 12 (3.5%) |
| 65 to 69 Years | 7 (1.0%) | 14 (4.1%) |
| 70 to 74 Years | 0 (0.0%) | 0 (0.0%) |
| 75 to 79 Years | 19 (2.6%) | 57 (16.9%) |
| 80 to 84 Years | 9 (1.2%) | 0 (0.0%) |
| 85 Years and over | 0 (0.0%) | 0 (0.0%) |
| Total | 728 (100.0%) | 338 (100.0%) |
Families and Households in Crowley Lake
Median Family Size in Crowley Lake
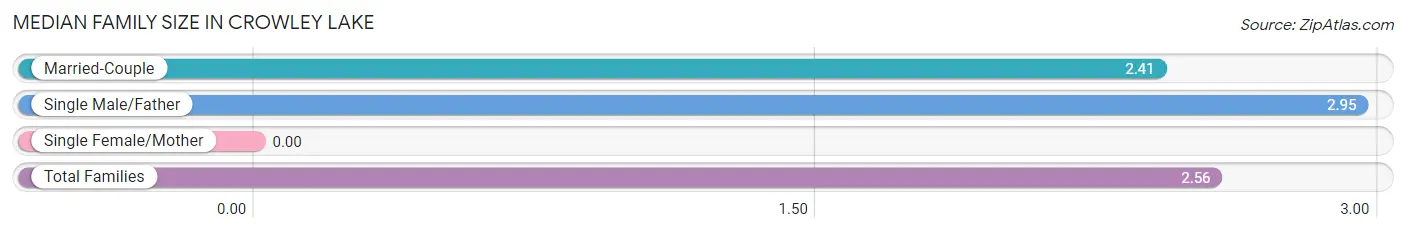
| Family Type | # Families | Family Size |
| Married-Couple | 260 (71.4%) | 2.41 |
| Single Male/Father | 104 (28.6%) | 2.95 |
| Single Female/Mother | 0 (0.0%) | - |
| Total Families | 364 (100.0%) | 2.56 |
Median Household Size in Crowley Lake
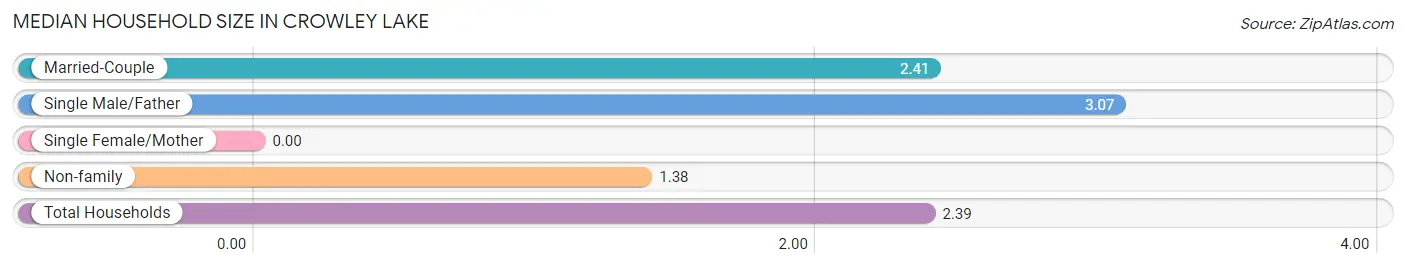
| Household Type | # Households | Household Size |
| Married-Couple | 260 (59.4%) | 2.41 |
| Single Male/Father | 104 (23.7%) | 3.07 |
| Single Female/Mother | 0 (0.0%) | - |
| Non-family | 74 (16.9%) | 1.38 |
| Total Households | 438 (100.0%) | 2.39 |
Household Size by Marriage Status in Crowley Lake
Out of a total of 438 households in Crowley Lake, 364 (83.1%) are family households, while 74 (16.9%) are nonfamily households. The most numerous type of family households are 2-person households, comprising 157, and the most common type of nonfamily households are 1-person households, comprising 45.
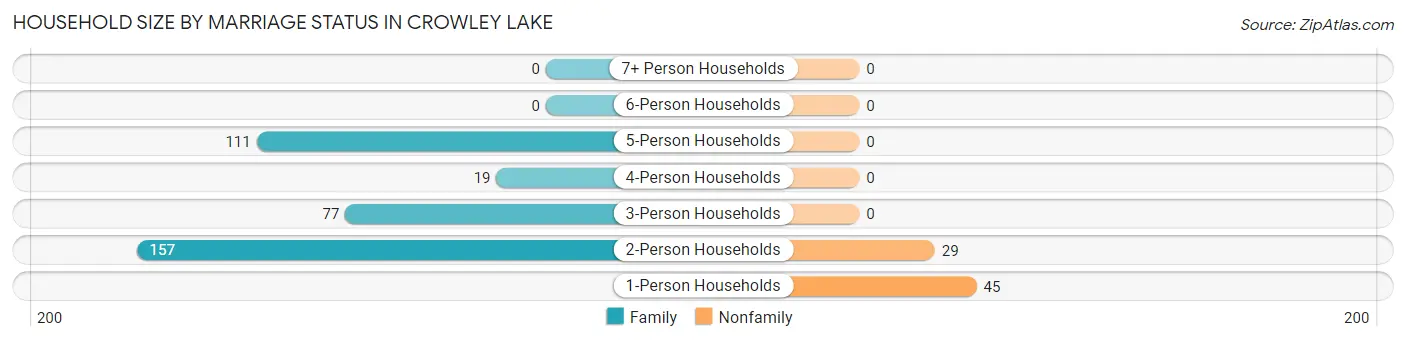
| Household Size | Family Households | Nonfamily Households |
| 1-Person Households | - | 45 (10.3%) |
| 2-Person Households | 157 (35.8%) | 29 (6.6%) |
| 3-Person Households | 77 (17.6%) | 0 (0.0%) |
| 4-Person Households | 19 (4.3%) | 0 (0.0%) |
| 5-Person Households | 111 (25.3%) | 0 (0.0%) |
| 6-Person Households | 0 (0.0%) | 0 (0.0%) |
| 7+ Person Households | 0 (0.0%) | 0 (0.0%) |
| Total | 364 (83.1%) | 74 (16.9%) |
Female Fertility in Crowley Lake
Fertility by Age in Crowley Lake
Average fertility rate in Crowley Lake is 260.0 births per 1,000 women. Women in the age bracket of 35 to 50 years have the highest fertility rate with 351.0 births per 1,000 women. Women in the age bracket of 35 to 50 years acount for 100.0% of all women with births.
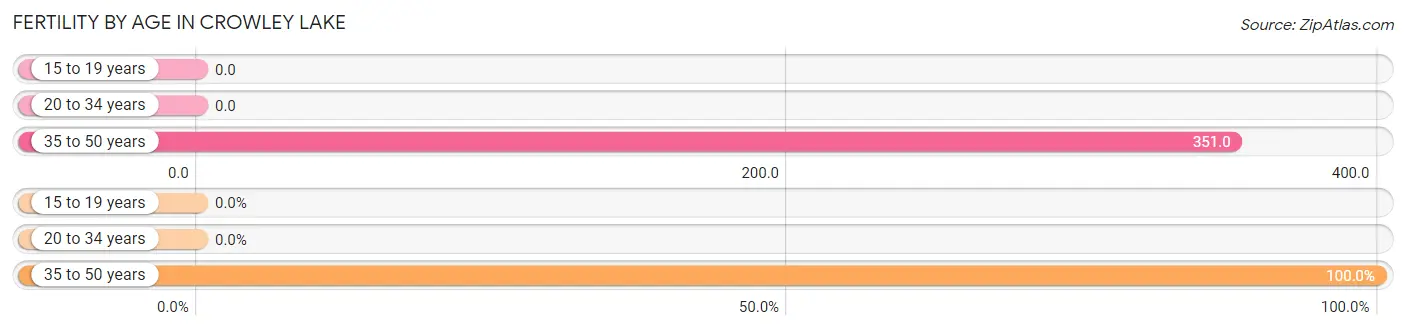
| Age Bracket | Women with Births | Births / 1,000 Women |
| 15 to 19 years | 0 (0.0%) | 0.0 |
| 20 to 34 years | 0 (0.0%) | 0.0 |
| 35 to 50 years | 52 (100.0%) | 351.0 |
| Total | 52 (100.0%) | 260.0 |
Fertility by Age by Marriage Status in Crowley Lake
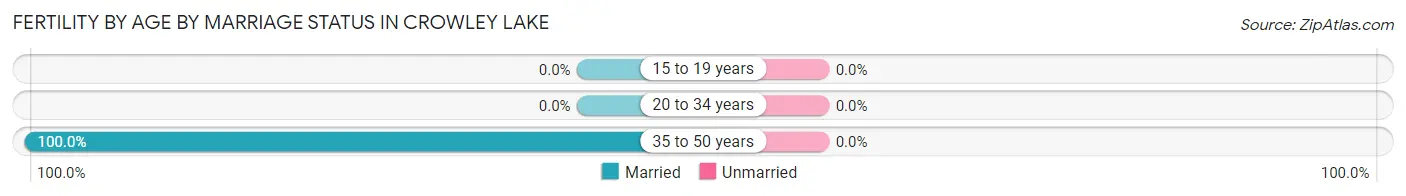
| Age Bracket | Married | Unmarried |
| 15 to 19 years | 0 (0.0%) | 0 (0.0%) |
| 20 to 34 years | 0 (0.0%) | 0 (0.0%) |
| 35 to 50 years | 52 (100.0%) | 0 (0.0%) |
| Total | 52 (100.0%) | 0 (0.0%) |
Fertility by Education in Crowley Lake
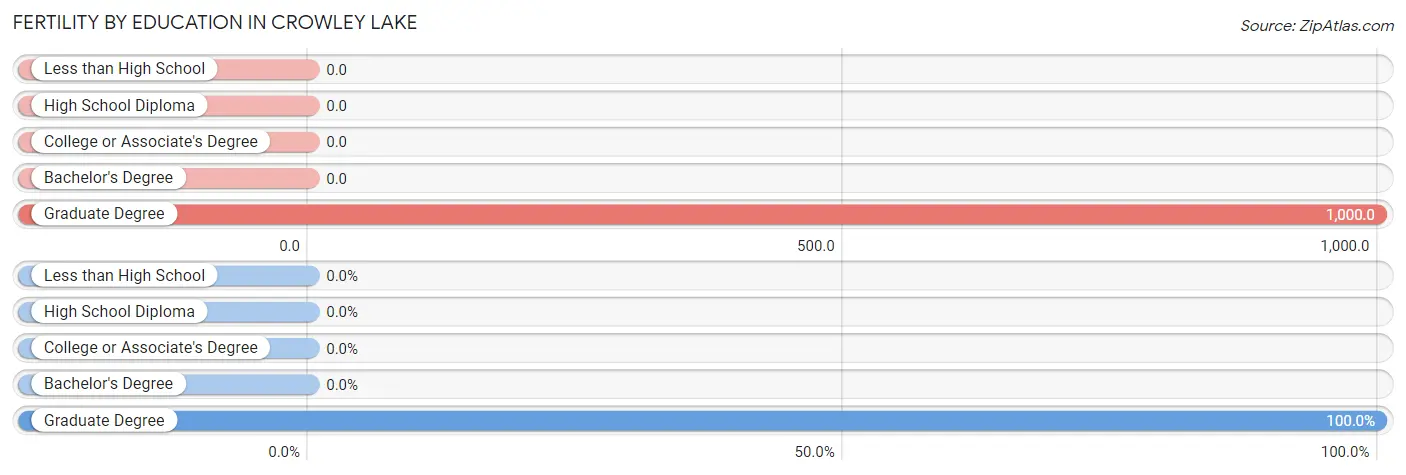
| Educational Attainment | Women with Births | Births / 1,000 Women |
| Less than High School | 0 (0.0%) | 0.0 |
| High School Diploma | 0 (0.0%) | 0.0 |
| College or Associate's Degree | 0 (0.0%) | 0.0 |
| Bachelor's Degree | 0 (0.0%) | 0.0 |
| Graduate Degree | 52 (100.0%) | 1,000.0 |
| Total | 52 (100.0%) | 260.0 |
Fertility by Education by Marriage Status in Crowley Lake
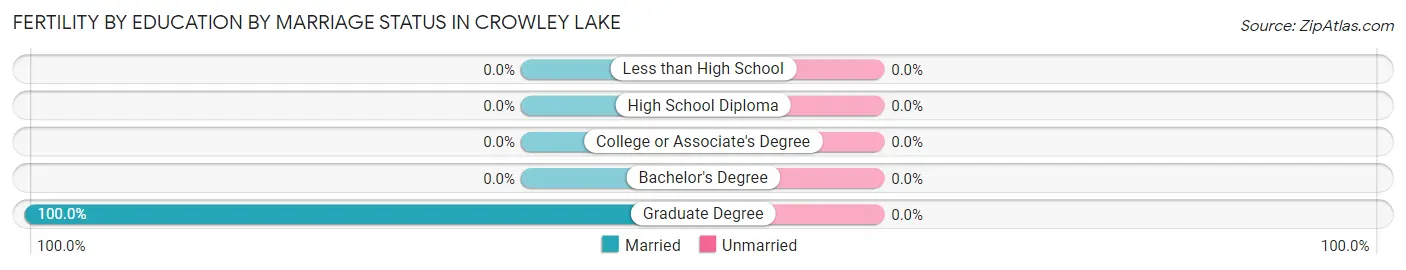
| Educational Attainment | Married | Unmarried |
| Less than High School | 0 (0.0%) | 0 (0.0%) |
| High School Diploma | 0 (0.0%) | 0 (0.0%) |
| College or Associate's Degree | 0 (0.0%) | 0 (0.0%) |
| Bachelor's Degree | 0 (0.0%) | 0 (0.0%) |
| Graduate Degree | 52 (100.0%) | 0 (0.0%) |
| Total | 52 (100.0%) | 0 (0.0%) |
Employment Characteristics in Crowley Lake
Employment by Class of Employer in Crowley Lake
Among the 649 employed individuals in Crowley Lake, private company employees (386 | 59.5%), not-for-profit organizations (118 | 18.2%), and state government employees (50 | 7.7%) make up the most common classes of employment.
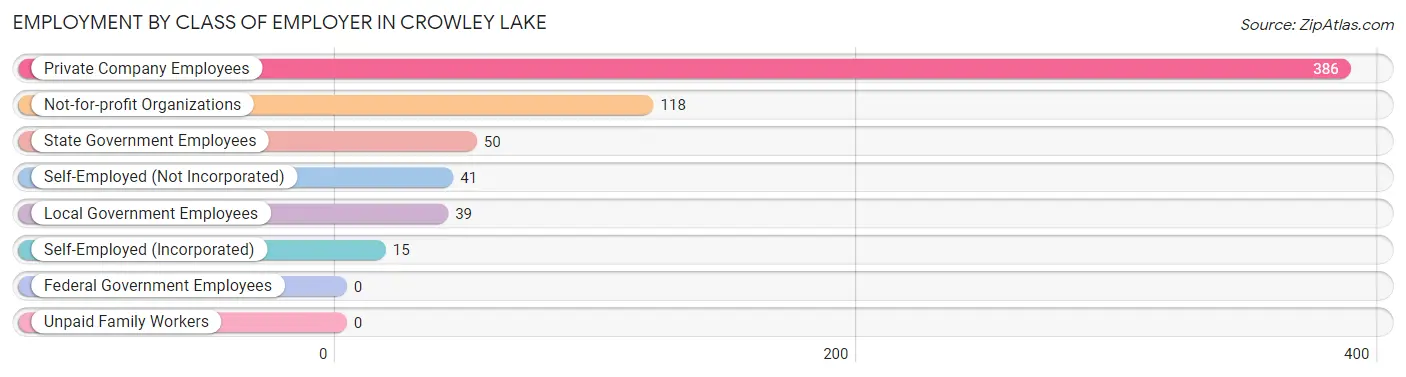
| Employer Class | # Employees | % Employees |
| Private Company Employees | 386 | 59.5% |
| Self-Employed (Incorporated) | 15 | 2.3% |
| Self-Employed (Not Incorporated) | 41 | 6.3% |
| Not-for-profit Organizations | 118 | 18.2% |
| Local Government Employees | 39 | 6.0% |
| State Government Employees | 50 | 7.7% |
| Federal Government Employees | 0 | 0.0% |
| Unpaid Family Workers | 0 | 0.0% |
| Total | 649 | 100.0% |
Employment Status by Age in Crowley Lake
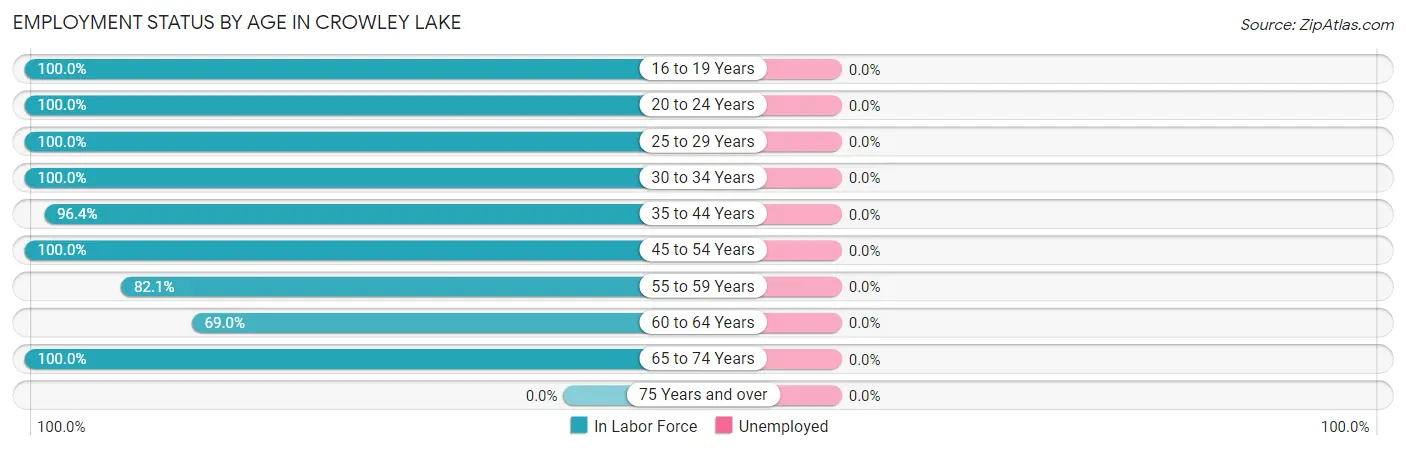
| Age Bracket | In Labor Force | Unemployed |
| 16 to 19 Years | 6 (100.0%) | 0 (0.0%) |
| 20 to 24 Years | 14 (100.0%) | 0 (0.0%) |
| 25 to 29 Years | 39 (100.0%) | 0 (0.0%) |
| 30 to 34 Years | 55 (100.0%) | 0 (0.0%) |
| 35 to 44 Years | 325 (96.4%) | 0 (0.0%) |
| 45 to 54 Years | 85 (100.0%) | 0 (0.0%) |
| 55 to 59 Years | 64 (82.1%) | 0 (0.0%) |
| 60 to 64 Years | 40 (69.0%) | 0 (0.0%) |
| 65 to 74 Years | 21 (100.0%) | 0 (0.0%) |
| 75 Years and over | 0 (0.0%) | 0 (0.0%) |
| Total | 649 (83.4%) | 0 (0.0%) |
Employment Status by Educational Attainment in Crowley Lake
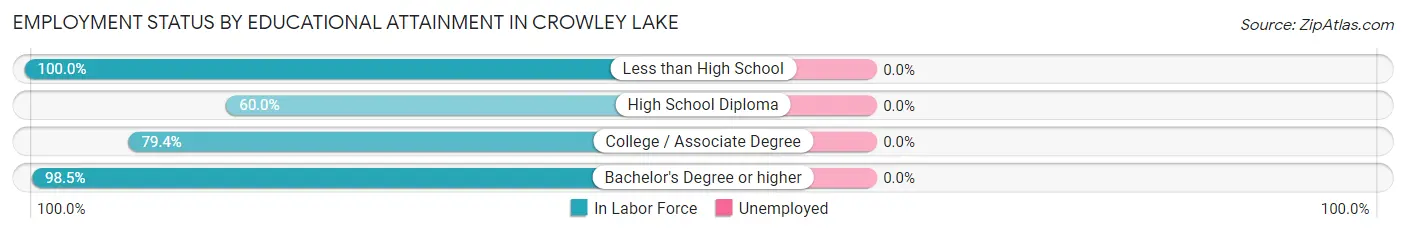
| Educational Attainment | In Labor Force | Unemployed |
| Less than High School | 104 (100.0%) | 0 (0.0%) |
| High School Diploma | 18 (60.0%) | 0 (0.0%) |
| College / Associate Degree | 100 (79.4%) | 0 (0.0%) |
| Bachelor's Degree or higher | 386 (98.5%) | 0 (0.0%) |
| Total | 608 (93.3%) | 0 (0.0%) |
Employment Occupations by Sex in Crowley Lake
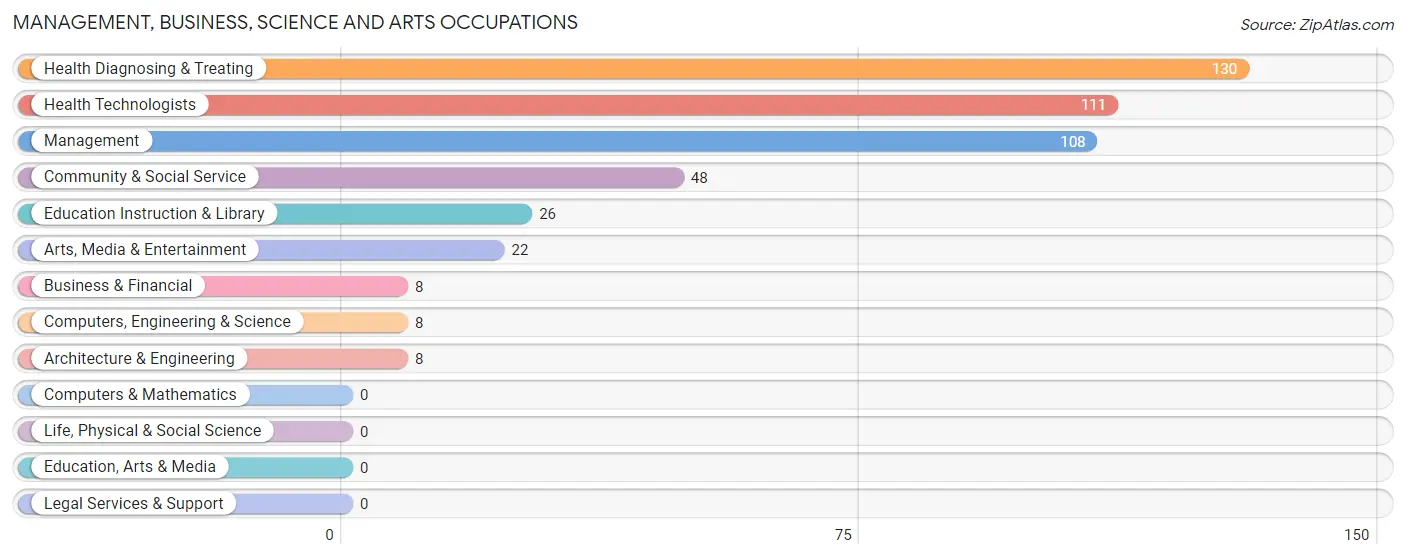
Management, Business, Science and Arts Occupations
The most common Management, Business, Science and Arts occupations in Crowley Lake are Health Diagnosing & Treating (130 | 20.0%), Health Technologists (111 | 17.1%), Management (108 | 16.6%), Community & Social Service (48 | 7.4%), and Education Instruction & Library (26 | 4.0%).
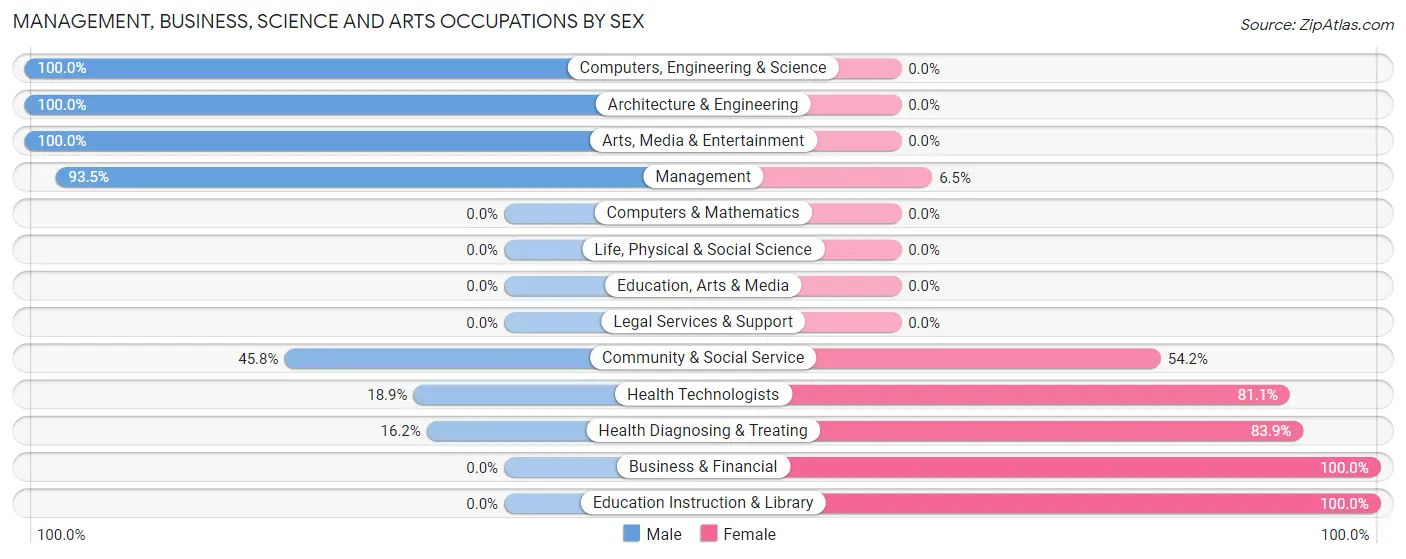
Management, Business, Science and Arts Occupations by Sex
Within the Management, Business, Science and Arts occupations in Crowley Lake, the most male-oriented occupations are Computers, Engineering & Science (100.0%), Architecture & Engineering (100.0%), and Arts, Media & Entertainment (100.0%), while the most female-oriented occupations are Business & Financial (100.0%), Education Instruction & Library (100.0%), and Health Diagnosing & Treating (83.9%).
| Occupation | Male | Female |
| Management | 101 (93.5%) | 7 (6.5%) |
| Business & Financial | 0 (0.0%) | 8 (100.0%) |
| Computers, Engineering & Science | 8 (100.0%) | 0 (0.0%) |
| Computers & Mathematics | 0 (0.0%) | 0 (0.0%) |
| Architecture & Engineering | 8 (100.0%) | 0 (0.0%) |
| Life, Physical & Social Science | 0 (0.0%) | 0 (0.0%) |
| Community & Social Service | 22 (45.8%) | 26 (54.2%) |
| Education, Arts & Media | 0 (0.0%) | 0 (0.0%) |
| Legal Services & Support | 0 (0.0%) | 0 (0.0%) |
| Education Instruction & Library | 0 (0.0%) | 26 (100.0%) |
| Arts, Media & Entertainment | 22 (100.0%) | 0 (0.0%) |
| Health Diagnosing & Treating | 21 (16.2%) | 109 (83.9%) |
| Health Technologists | 21 (18.9%) | 90 (81.1%) |
| Total (Category) | 152 (50.3%) | 150 (49.7%) |
| Total (Overall) | 409 (63.0%) | 240 (37.0%) |
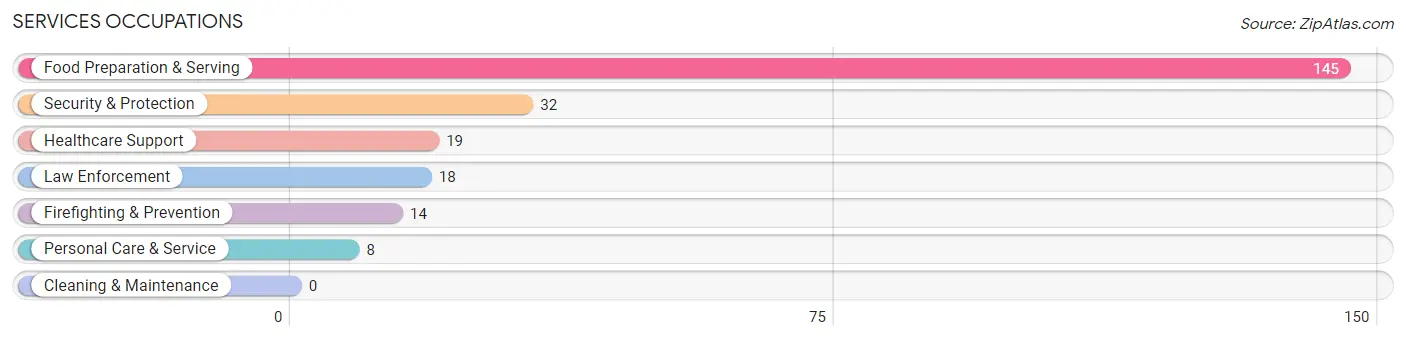
Services Occupations
The most common Services occupations in Crowley Lake are Food Preparation & Serving (145 | 22.3%), Security & Protection (32 | 4.9%), Healthcare Support (19 | 2.9%), Law Enforcement (18 | 2.8%), and Firefighting & Prevention (14 | 2.2%).
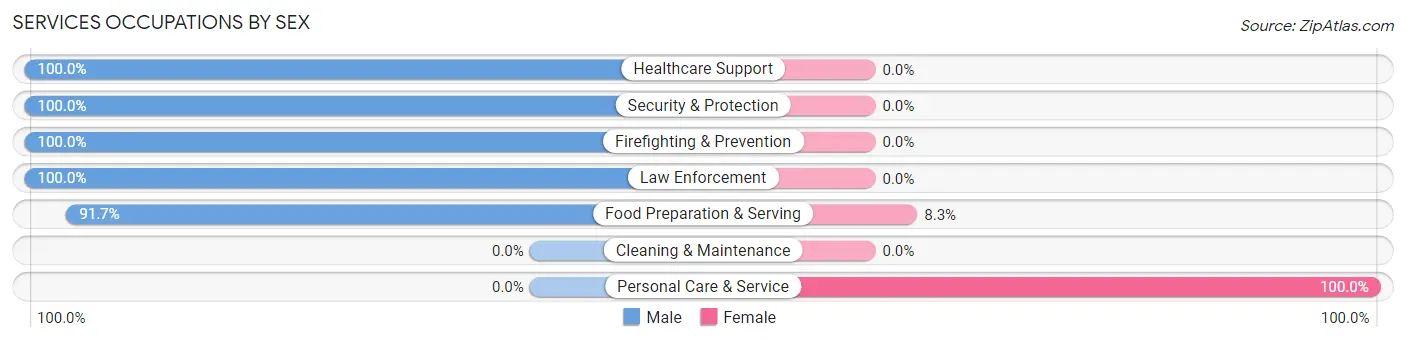
Services Occupations by Sex
Within the Services occupations in Crowley Lake, the most male-oriented occupations are Healthcare Support (100.0%), Security & Protection (100.0%), and Firefighting & Prevention (100.0%), while the most female-oriented occupations are Personal Care & Service (100.0%), and Food Preparation & Serving (8.3%).
| Occupation | Male | Female |
| Healthcare Support | 19 (100.0%) | 0 (0.0%) |
| Security & Protection | 32 (100.0%) | 0 (0.0%) |
| Firefighting & Prevention | 14 (100.0%) | 0 (0.0%) |
| Law Enforcement | 18 (100.0%) | 0 (0.0%) |
| Food Preparation & Serving | 133 (91.7%) | 12 (8.3%) |
| Cleaning & Maintenance | 0 (0.0%) | 0 (0.0%) |
| Personal Care & Service | 0 (0.0%) | 8 (100.0%) |
| Total (Category) | 184 (90.2%) | 20 (9.8%) |
| Total (Overall) | 409 (63.0%) | 240 (37.0%) |
Sales and Office Occupations
The most common Sales and Office occupations in Crowley Lake are Office & Administration (75 | 11.6%), and Sales & Related (7 | 1.1%).
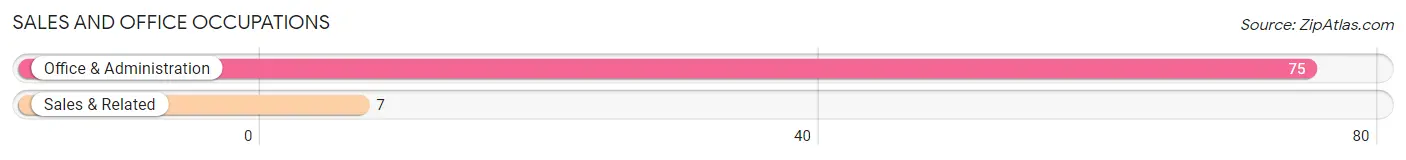
Sales and Office Occupations by Sex
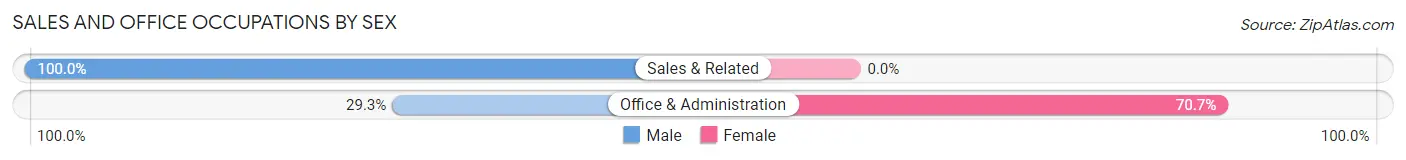
| Occupation | Male | Female |
| Sales & Related | 7 (100.0%) | 0 (0.0%) |
| Office & Administration | 22 (29.3%) | 53 (70.7%) |
| Total (Category) | 29 (35.4%) | 53 (64.6%) |
| Total (Overall) | 409 (63.0%) | 240 (37.0%) |
Natural Resources, Construction and Maintenance Occupations
The most common Natural Resources, Construction and Maintenance occupations in Crowley Lake are , and Construction & Extraction (15 | 2.3%).
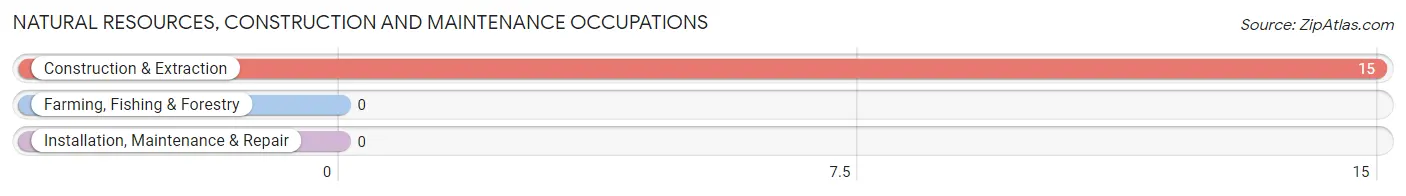
Natural Resources, Construction and Maintenance Occupations by Sex
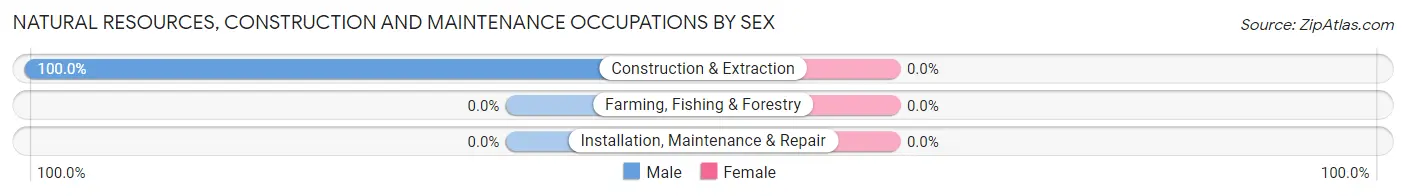
| Occupation | Male | Female |
| Farming, Fishing & Forestry | 0 (0.0%) | 0 (0.0%) |
| Construction & Extraction | 15 (100.0%) | 0 (0.0%) |
| Installation, Maintenance & Repair | 0 (0.0%) | 0 (0.0%) |
| Total (Category) | 15 (100.0%) | 0 (0.0%) |
| Total (Overall) | 409 (63.0%) | 240 (37.0%) |
Production, Transportation and Moving Occupations
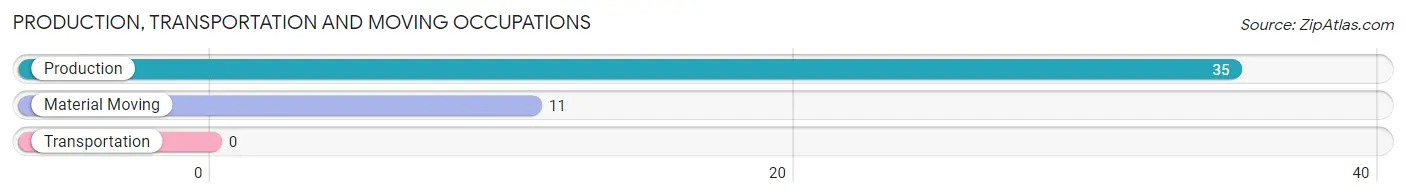
The most common Production, Transportation and Moving occupations in Crowley Lake are Production (35 | 5.4%), and Material Moving (11 | 1.7%).
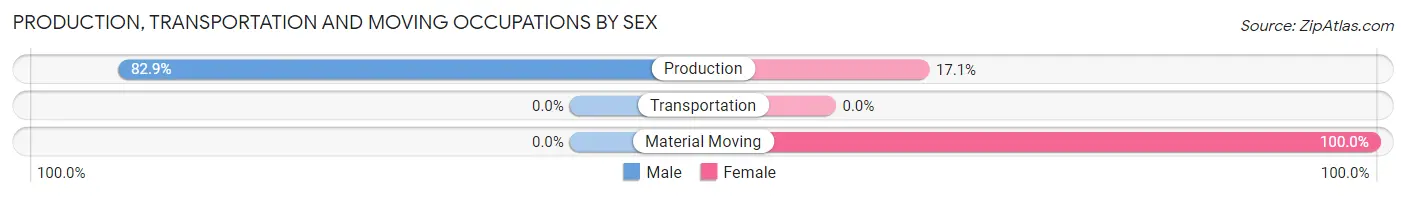
Production, Transportation and Moving Occupations by Sex
| Occupation | Male | Female |
| Production | 29 (82.9%) | 6 (17.1%) |
| Transportation | 0 (0.0%) | 0 (0.0%) |
| Material Moving | 0 (0.0%) | 11 (100.0%) |
| Total (Category) | 29 (63.0%) | 17 (37.0%) |
| Total (Overall) | 409 (63.0%) | 240 (37.0%) |
Employment Industries by Sex in Crowley Lake
Employment Industries in Crowley Lake
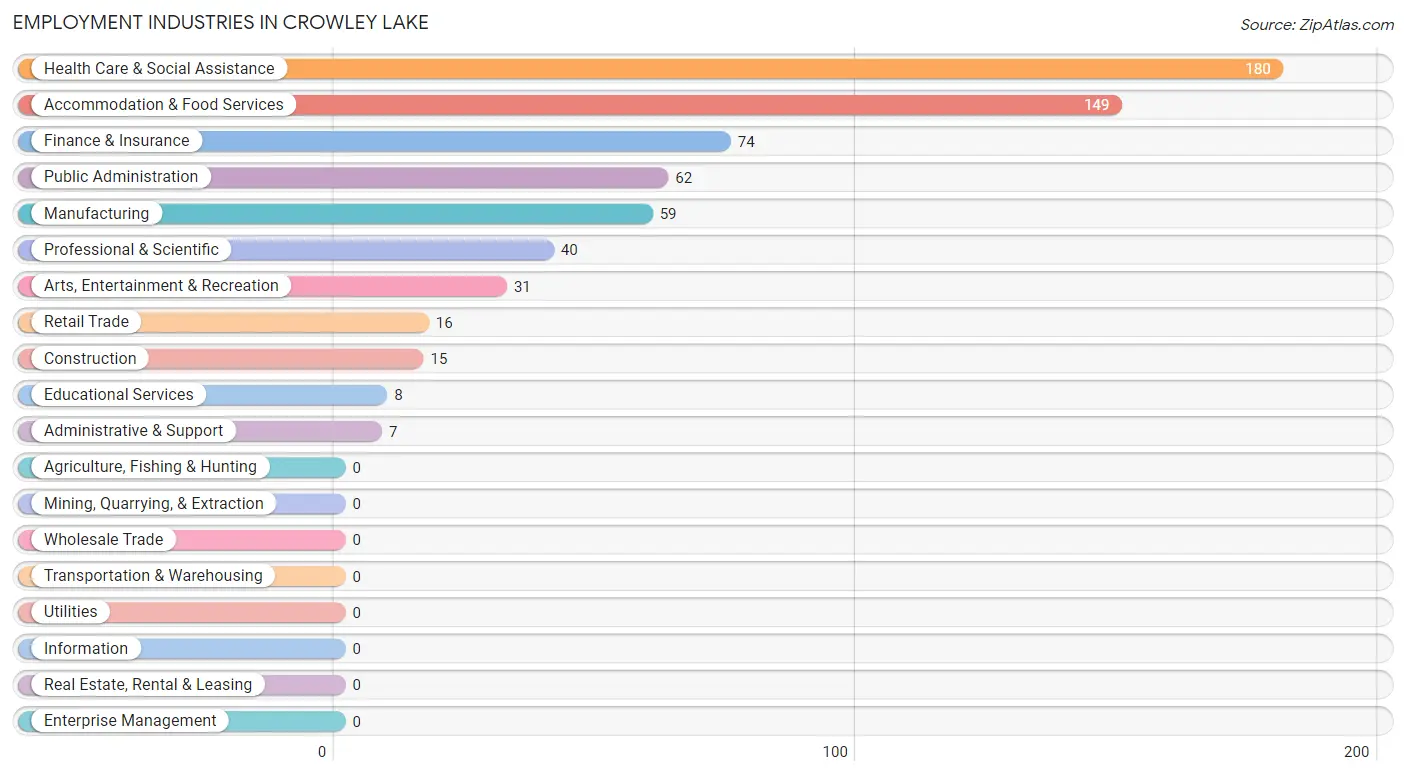
The major employment industries in Crowley Lake include Health Care & Social Assistance (180 | 27.7%), Accommodation & Food Services (149 | 23.0%), Finance & Insurance (74 | 11.4%), Public Administration (62 | 9.6%), and Manufacturing (59 | 9.1%).
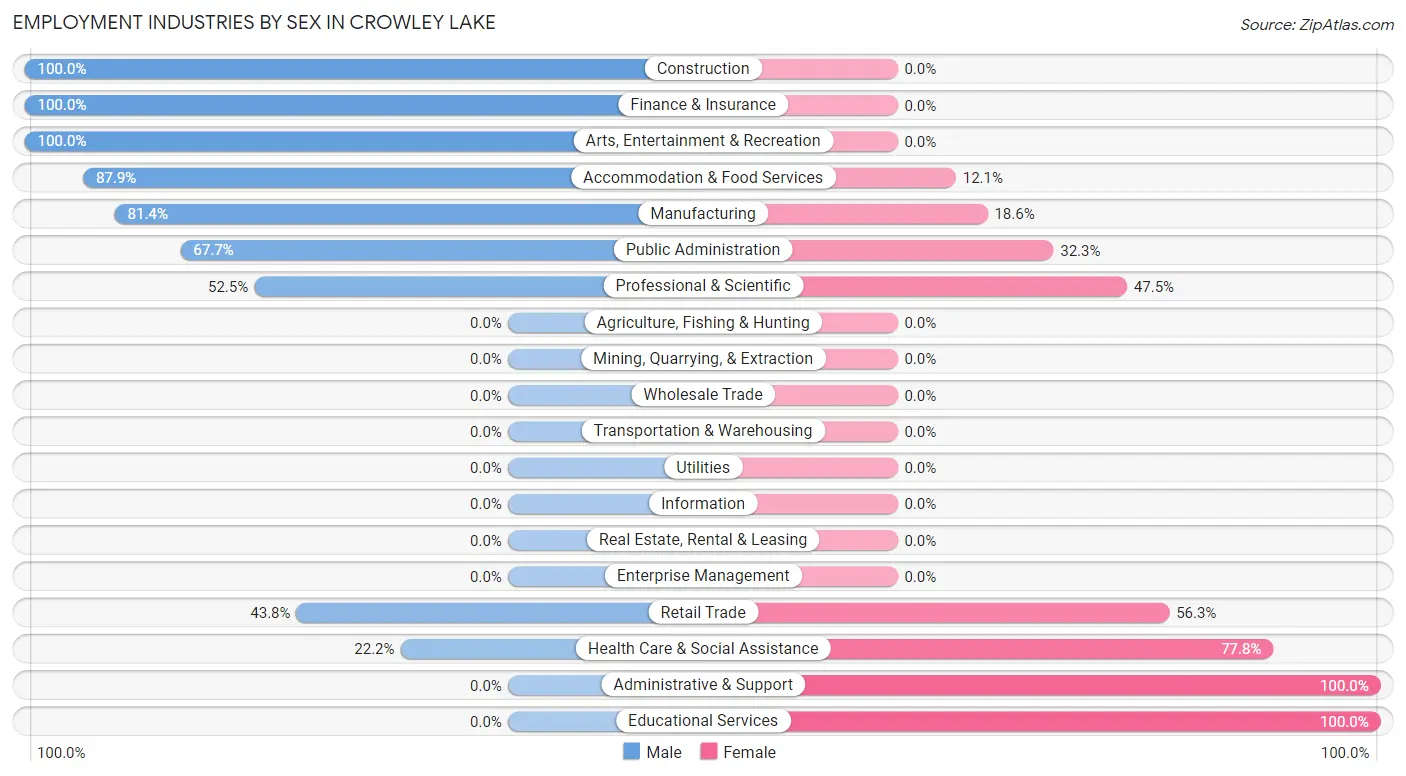
Employment Industries by Sex in Crowley Lake
The Crowley Lake industries that see more men than women are Construction (100.0%), Finance & Insurance (100.0%), and Arts, Entertainment & Recreation (100.0%), whereas the industries that tend to have a higher number of women are Administrative & Support (100.0%), Educational Services (100.0%), and Health Care & Social Assistance (77.8%).
| Industry | Male | Female |
| Agriculture, Fishing & Hunting | 0 (0.0%) | 0 (0.0%) |
| Mining, Quarrying, & Extraction | 0 (0.0%) | 0 (0.0%) |
| Construction | 15 (100.0%) | 0 (0.0%) |
| Manufacturing | 48 (81.4%) | 11 (18.6%) |
| Wholesale Trade | 0 (0.0%) | 0 (0.0%) |
| Retail Trade | 7 (43.8%) | 9 (56.2%) |
| Transportation & Warehousing | 0 (0.0%) | 0 (0.0%) |
| Utilities | 0 (0.0%) | 0 (0.0%) |
| Information | 0 (0.0%) | 0 (0.0%) |
| Finance & Insurance | 74 (100.0%) | 0 (0.0%) |
| Real Estate, Rental & Leasing | 0 (0.0%) | 0 (0.0%) |
| Professional & Scientific | 21 (52.5%) | 19 (47.5%) |
| Enterprise Management | 0 (0.0%) | 0 (0.0%) |
| Administrative & Support | 0 (0.0%) | 7 (100.0%) |
| Educational Services | 0 (0.0%) | 8 (100.0%) |
| Health Care & Social Assistance | 40 (22.2%) | 140 (77.8%) |
| Arts, Entertainment & Recreation | 31 (100.0%) | 0 (0.0%) |
| Accommodation & Food Services | 131 (87.9%) | 18 (12.1%) |
| Public Administration | 42 (67.7%) | 20 (32.3%) |
| Total | 409 (63.0%) | 240 (37.0%) |
Education in Crowley Lake
School Enrollment in Crowley Lake
The most common levels of schooling among the 195 students in Crowley Lake are nursery / preschool (88 | 45.1%), college / undergraduate (60 | 30.8%), and middle school (29 | 14.9%).
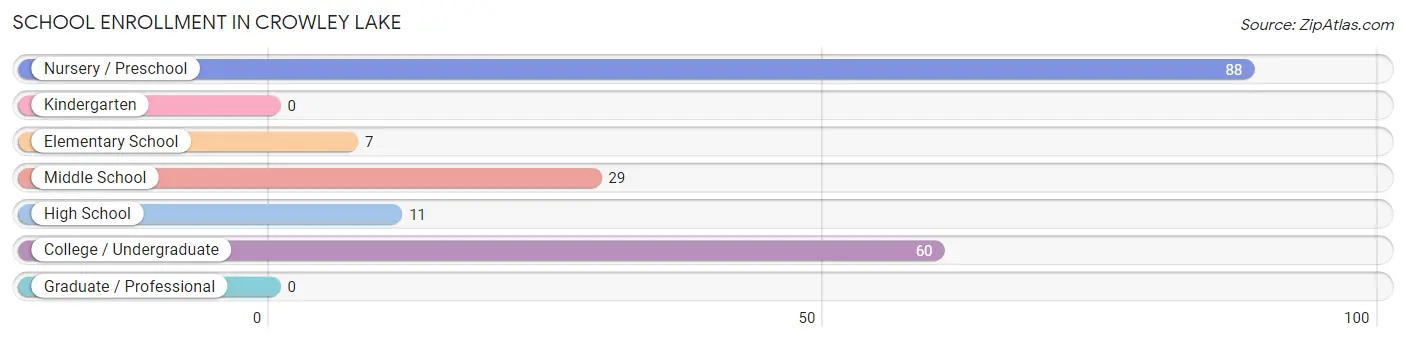
| School Level | # Students | % Students |
| Nursery / Preschool | 88 | 45.1% |
| Kindergarten | 0 | 0.0% |
| Elementary School | 7 | 3.6% |
| Middle School | 29 | 14.9% |
| High School | 11 | 5.6% |
| College / Undergraduate | 60 | 30.8% |
| Graduate / Professional | 0 | 0.0% |
| Total | 195 | 100.0% |
School Enrollment by Age by Funding Source in Crowley Lake
Out of a total of 195 students who are enrolled in schools in Crowley Lake, 44 (22.6%) attend a private institution, while the remaining 151 (77.4%) are enrolled in public schools. The age group of 5 to 9 year old has the highest likelihood of being enrolled in private schools, with 7 (100.0% in the age bracket) enrolled. Conversely, the age group of 3 to 4 year olds has the lowest likelihood of being enrolled in a private school, with 88 (100.0% in the age bracket) attending a public institution.
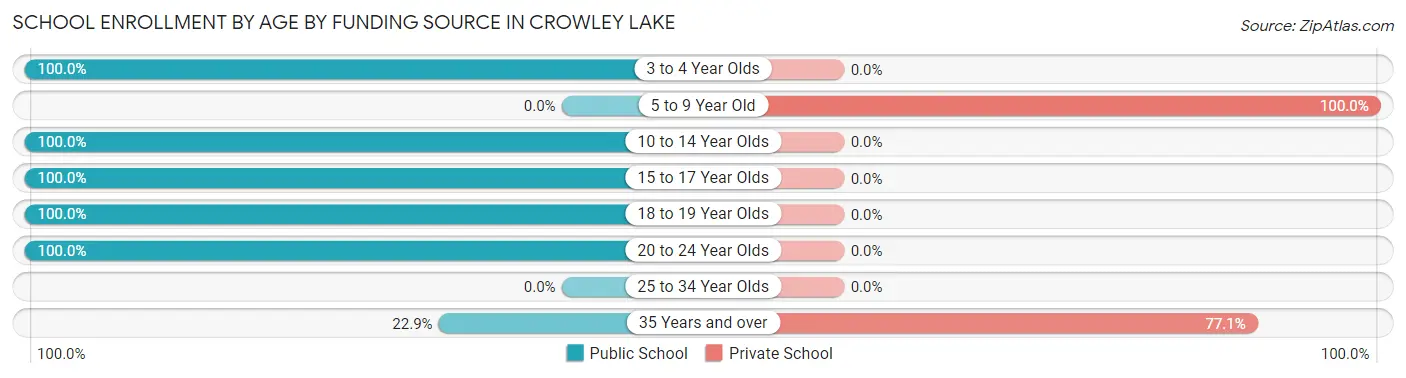
| Age Bracket | Public School | Private School |
| 3 to 4 Year Olds | 88 (100.0%) | 0 (0.0%) |
| 5 to 9 Year Old | 0 (0.0%) | 7 (100.0%) |
| 10 to 14 Year Olds | 37 (100.0%) | 0 (0.0%) |
| 15 to 17 Year Olds | 3 (100.0%) | 0 (0.0%) |
| 18 to 19 Year Olds | 6 (100.0%) | 0 (0.0%) |
| 20 to 24 Year Olds | 6 (100.0%) | 0 (0.0%) |
| 25 to 34 Year Olds | 0 (0.0%) | 0 (0.0%) |
| 35 Years and over | 11 (22.9%) | 37 (77.1%) |
| Total | 151 (77.4%) | 44 (22.6%) |
Educational Attainment by Field of Study in Crowley Lake
Business (134 | 32.5%), psychology (98 | 23.7%), social sciences (33 | 8.0%), science & technology (29 | 7.0%), and literature & languages (29 | 7.0%) are the most common fields of study among 413 individuals in Crowley Lake who have obtained a bachelor's degree or higher.
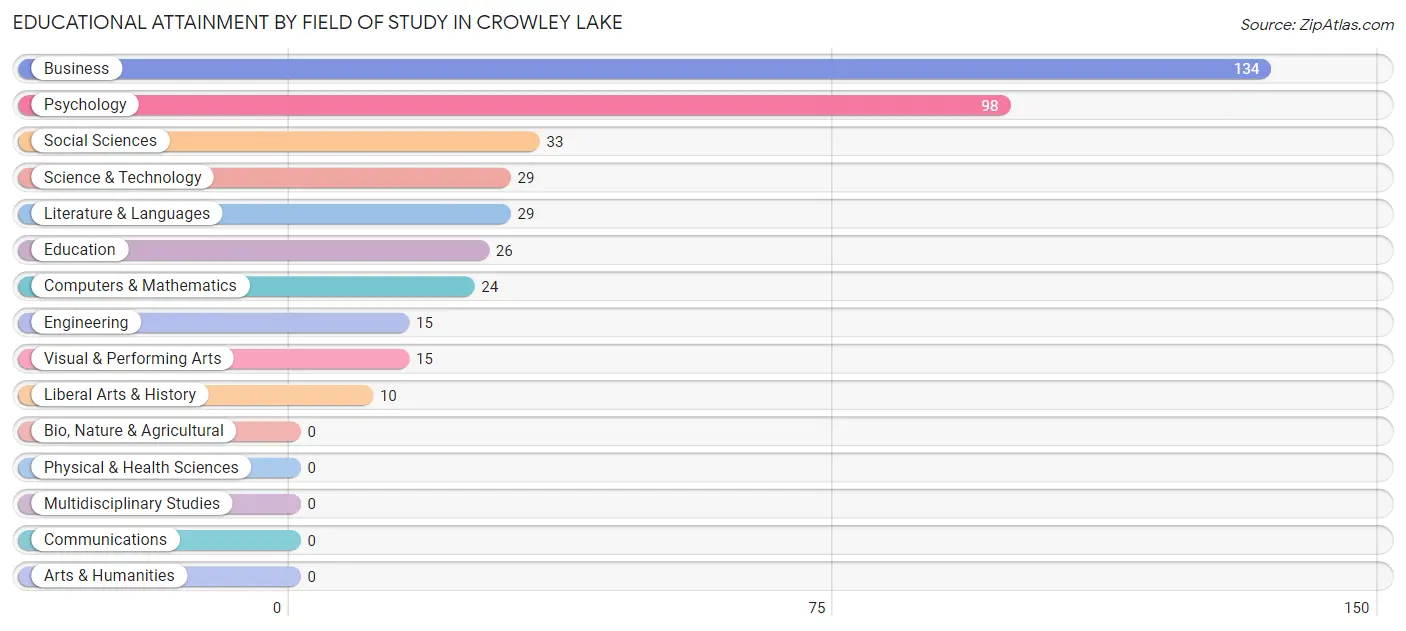
| Field of Study | # Graduates | % Graduates |
| Computers & Mathematics | 24 | 5.8% |
| Bio, Nature & Agricultural | 0 | 0.0% |
| Physical & Health Sciences | 0 | 0.0% |
| Psychology | 98 | 23.7% |
| Social Sciences | 33 | 8.0% |
| Engineering | 15 | 3.6% |
| Multidisciplinary Studies | 0 | 0.0% |
| Science & Technology | 29 | 7.0% |
| Business | 134 | 32.5% |
| Education | 26 | 6.3% |
| Literature & Languages | 29 | 7.0% |
| Liberal Arts & History | 10 | 2.4% |
| Visual & Performing Arts | 15 | 3.6% |
| Communications | 0 | 0.0% |
| Arts & Humanities | 0 | 0.0% |
| Total | 413 | 100.0% |
Transportation & Commute in Crowley Lake
Vehicle Availability by Sex in Crowley Lake
The most prevalent vehicle ownership categories in Crowley Lake are males with 2 vehicles (162, accounting for 41.5%) and females with 2 vehicles (114, making up 67.5%).
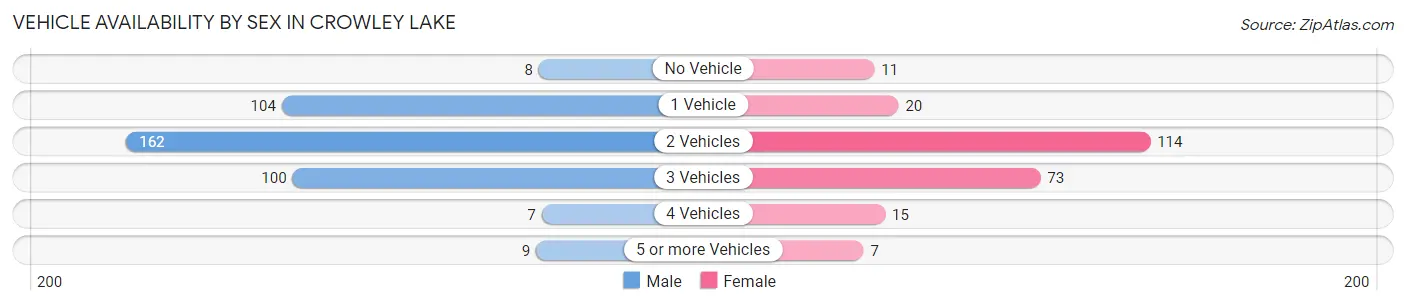
| Vehicles Available | Male | Female |
| No Vehicle | 8 (2.1%) | 11 (4.6%) |
| 1 Vehicle | 104 (26.7%) | 20 (8.3%) |
| 2 Vehicles | 162 (41.5%) | 114 (47.5%) |
| 3 Vehicles | 100 (25.6%) | 73 (30.4%) |
| 4 Vehicles | 7 (1.8%) | 15 (6.2%) |
| 5 or more Vehicles | 9 (2.3%) | 7 (2.9%) |
| Total | 390 (100.0%) | 240 (100.0%) |
Commute Time in Crowley Lake
The most frequently occuring commute durations in Crowley Lake are 20 to 24 minutes (147 commuters, 28.0%), 15 to 19 minutes (114 commuters, 21.7%), and 45 to 59 minutes (104 commuters, 19.8%).
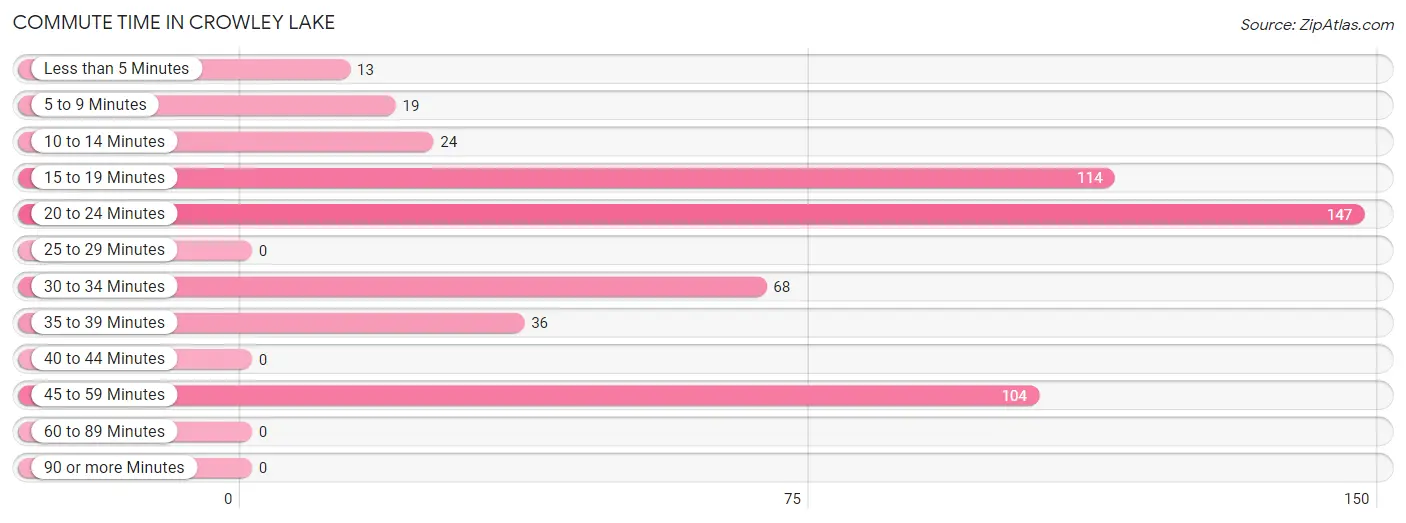
| Commute Time | # Commuters | % Commuters |
| Less than 5 Minutes | 13 | 2.5% |
| 5 to 9 Minutes | 19 | 3.6% |
| 10 to 14 Minutes | 24 | 4.6% |
| 15 to 19 Minutes | 114 | 21.7% |
| 20 to 24 Minutes | 147 | 28.0% |
| 25 to 29 Minutes | 0 | 0.0% |
| 30 to 34 Minutes | 68 | 13.0% |
| 35 to 39 Minutes | 36 | 6.9% |
| 40 to 44 Minutes | 0 | 0.0% |
| 45 to 59 Minutes | 104 | 19.8% |
| 60 to 89 Minutes | 0 | 0.0% |
| 90 or more Minutes | 0 | 0.0% |
Commute Time by Sex in Crowley Lake
The most common commute times in Crowley Lake are 45 to 59 minutes (104 commuters, 32.3%) for males and 20 to 24 minutes (87 commuters, 42.9%) for females.
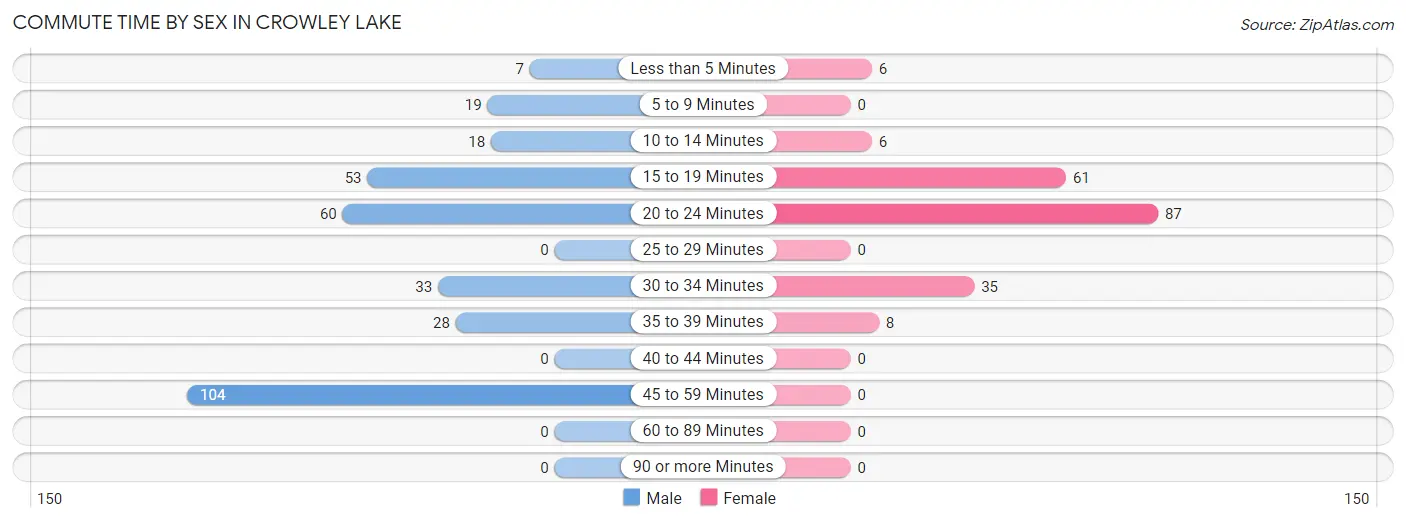
| Commute Time | Male | Female |
| Less than 5 Minutes | 7 (2.2%) | 6 (3.0%) |
| 5 to 9 Minutes | 19 (5.9%) | 0 (0.0%) |
| 10 to 14 Minutes | 18 (5.6%) | 6 (3.0%) |
| 15 to 19 Minutes | 53 (16.5%) | 61 (30.0%) |
| 20 to 24 Minutes | 60 (18.6%) | 87 (42.9%) |
| 25 to 29 Minutes | 0 (0.0%) | 0 (0.0%) |
| 30 to 34 Minutes | 33 (10.2%) | 35 (17.2%) |
| 35 to 39 Minutes | 28 (8.7%) | 8 (3.9%) |
| 40 to 44 Minutes | 0 (0.0%) | 0 (0.0%) |
| 45 to 59 Minutes | 104 (32.3%) | 0 (0.0%) |
| 60 to 89 Minutes | 0 (0.0%) | 0 (0.0%) |
| 90 or more Minutes | 0 (0.0%) | 0 (0.0%) |
Time of Departure to Work by Sex in Crowley Lake
The most frequent times of departure to work in Crowley Lake are 12:00 PM to 3:59 PM (121, 37.6%) for males and 7:30 AM to 7:59 AM (79, 38.9%) for females.
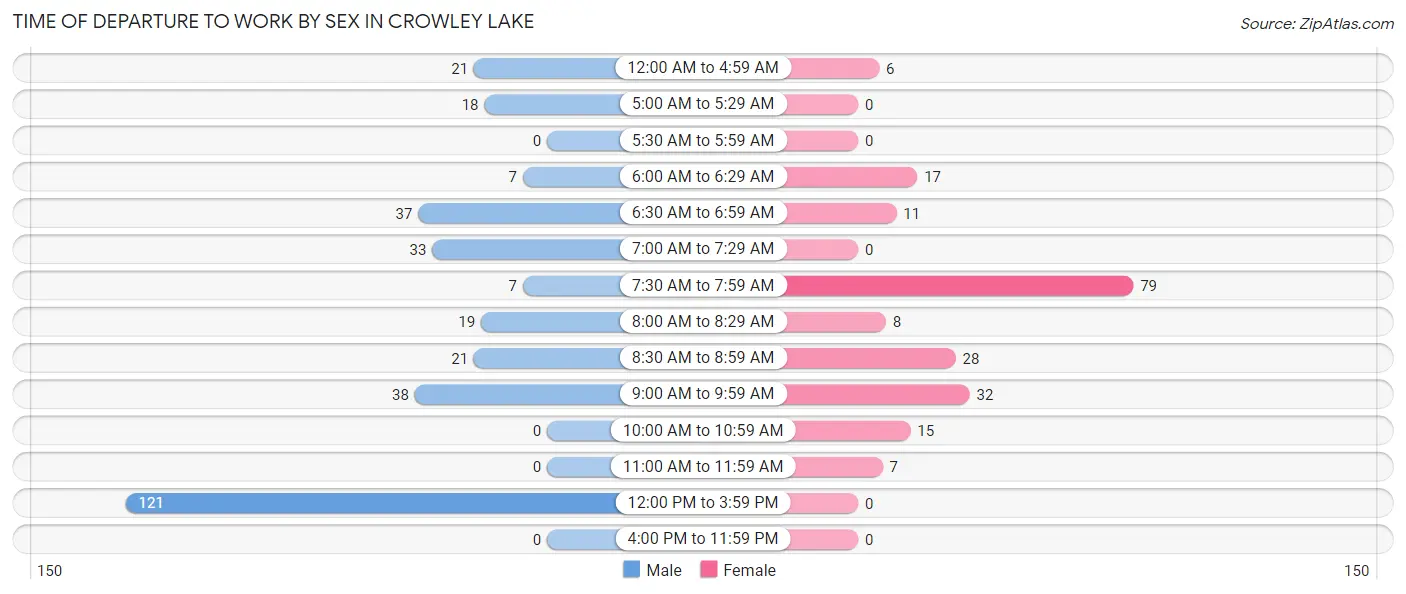
| Time of Departure | Male | Female |
| 12:00 AM to 4:59 AM | 21 (6.5%) | 6 (3.0%) |
| 5:00 AM to 5:29 AM | 18 (5.6%) | 0 (0.0%) |
| 5:30 AM to 5:59 AM | 0 (0.0%) | 0 (0.0%) |
| 6:00 AM to 6:29 AM | 7 (2.2%) | 17 (8.4%) |
| 6:30 AM to 6:59 AM | 37 (11.5%) | 11 (5.4%) |
| 7:00 AM to 7:29 AM | 33 (10.2%) | 0 (0.0%) |
| 7:30 AM to 7:59 AM | 7 (2.2%) | 79 (38.9%) |
| 8:00 AM to 8:29 AM | 19 (5.9%) | 8 (3.9%) |
| 8:30 AM to 8:59 AM | 21 (6.5%) | 28 (13.8%) |
| 9:00 AM to 9:59 AM | 38 (11.8%) | 32 (15.8%) |
| 10:00 AM to 10:59 AM | 0 (0.0%) | 15 (7.4%) |
| 11:00 AM to 11:59 AM | 0 (0.0%) | 7 (3.5%) |
| 12:00 PM to 3:59 PM | 121 (37.6%) | 0 (0.0%) |
| 4:00 PM to 11:59 PM | 0 (0.0%) | 0 (0.0%) |
| Total | 322 (100.0%) | 203 (100.0%) |
Housing Occupancy in Crowley Lake
Occupancy by Ownership in Crowley Lake
Of the total 438 dwellings in Crowley Lake, owner-occupied units account for 420 (95.9%), while renter-occupied units make up 18 (4.1%).
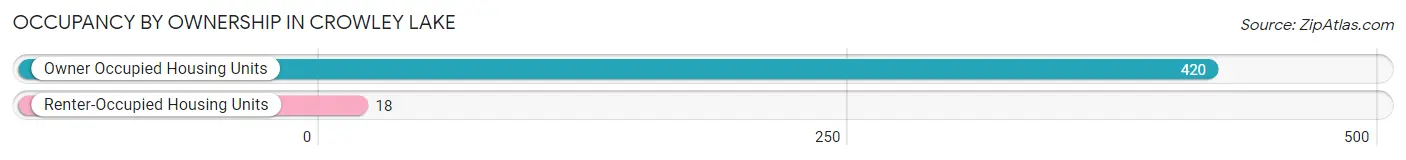
| Occupancy | # Housing Units | % Housing Units |
| Owner Occupied Housing Units | 420 | 95.9% |
| Renter-Occupied Housing Units | 18 | 4.1% |
| Total Occupied Housing Units | 438 | 100.0% |
Occupancy by Household Size in Crowley Lake
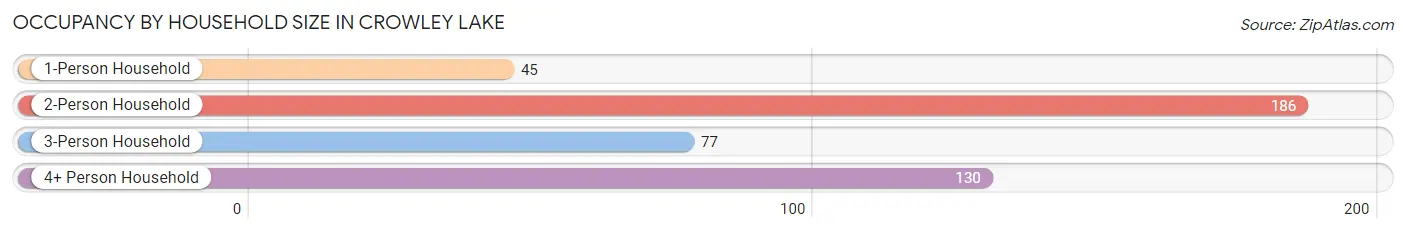
| Household Size | # Housing Units | % Housing Units |
| 1-Person Household | 45 | 10.3% |
| 2-Person Household | 186 | 42.5% |
| 3-Person Household | 77 | 17.6% |
| 4+ Person Household | 130 | 29.7% |
| Total Housing Units | 438 | 100.0% |
Occupancy by Ownership by Household Size in Crowley Lake
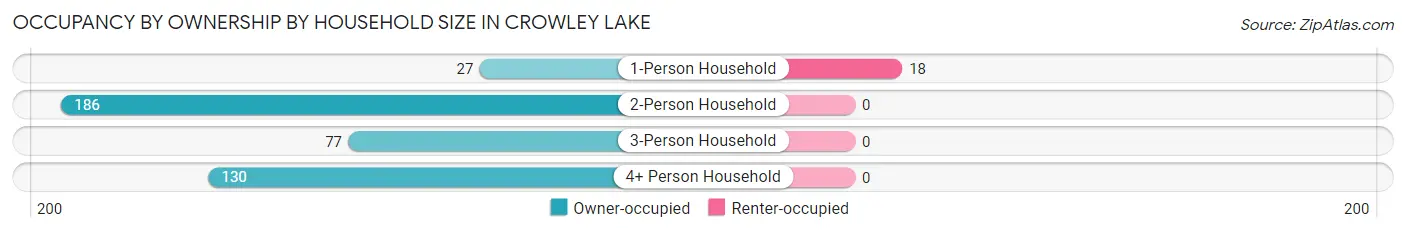
| Household Size | Owner-occupied | Renter-occupied |
| 1-Person Household | 27 (60.0%) | 18 (40.0%) |
| 2-Person Household | 186 (100.0%) | 0 (0.0%) |
| 3-Person Household | 77 (100.0%) | 0 (0.0%) |
| 4+ Person Household | 130 (100.0%) | 0 (0.0%) |
| Total Housing Units | 420 (95.9%) | 18 (4.1%) |
Occupancy by Educational Attainment in Crowley Lake
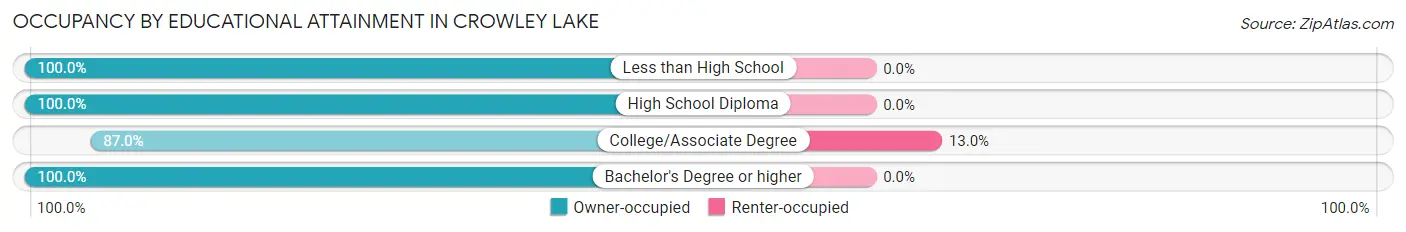
| Household Size | Owner-occupied | Renter-occupied |
| Less than High School | 104 (100.0%) | 0 (0.0%) |
| High School Diploma | 15 (100.0%) | 0 (0.0%) |
| College/Associate Degree | 120 (87.0%) | 18 (13.0%) |
| Bachelor's Degree or higher | 181 (100.0%) | 0 (0.0%) |
Occupancy by Age of Householder in Crowley Lake
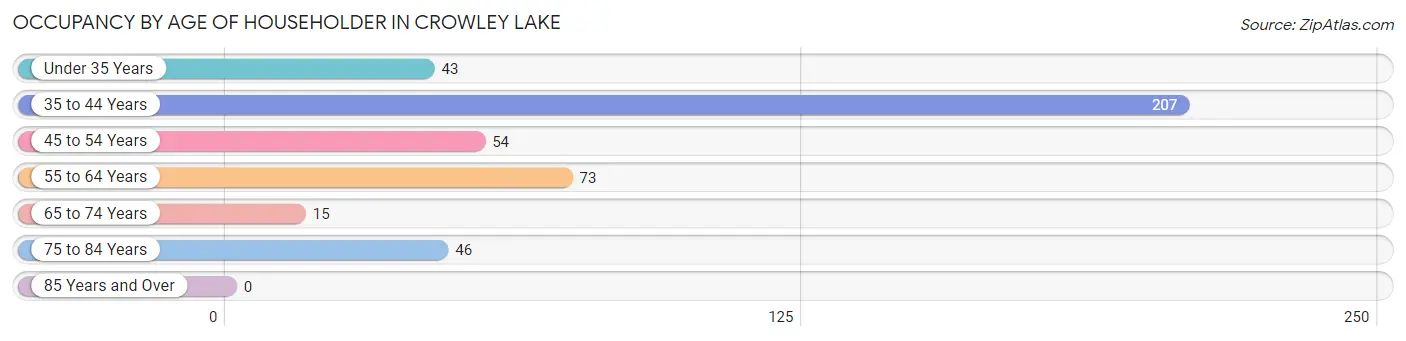
| Age Bracket | # Households | % Households |
| Under 35 Years | 43 | 9.8% |
| 35 to 44 Years | 207 | 47.3% |
| 45 to 54 Years | 54 | 12.3% |
| 55 to 64 Years | 73 | 16.7% |
| 65 to 74 Years | 15 | 3.4% |
| 75 to 84 Years | 46 | 10.5% |
| 85 Years and Over | 0 | 0.0% |
| Total | 438 | 100.0% |
Housing Finances in Crowley Lake
Median Income by Occupancy in Crowley Lake
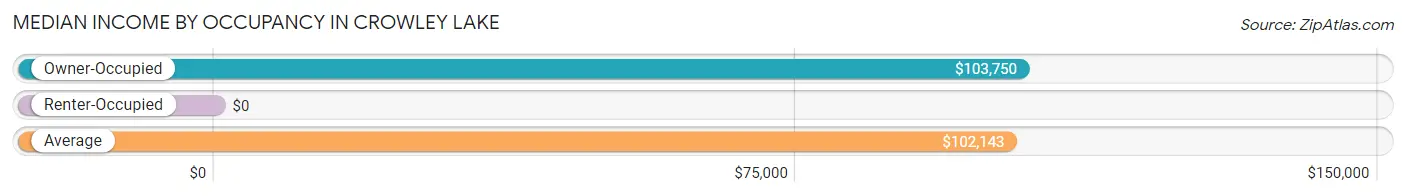
| Occupancy Type | # Households | Median Income |
| Owner-Occupied | 420 (95.9%) | $103,750 |
| Renter-Occupied | 18 (4.1%) | $0 |
| Average | 438 (100.0%) | $102,143 |
Occupancy by Householder Income Bracket in Crowley Lake
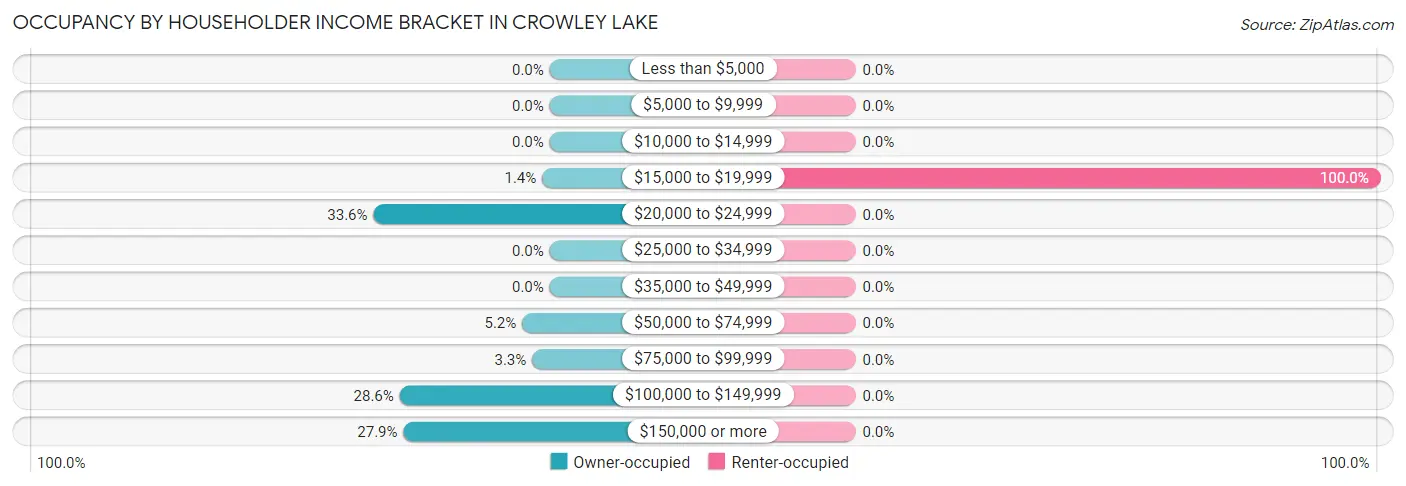
| Income Bracket | Owner-occupied | Renter-occupied |
| Less than $5,000 | 0 (0.0%) | 0 (0.0%) |
| $5,000 to $9,999 | 0 (0.0%) | 0 (0.0%) |
| $10,000 to $14,999 | 0 (0.0%) | 0 (0.0%) |
| $15,000 to $19,999 | 6 (1.4%) | 18 (100.0%) |
| $20,000 to $24,999 | 141 (33.6%) | 0 (0.0%) |
| $25,000 to $34,999 | 0 (0.0%) | 0 (0.0%) |
| $35,000 to $49,999 | 0 (0.0%) | 0 (0.0%) |
| $50,000 to $74,999 | 22 (5.2%) | 0 (0.0%) |
| $75,000 to $99,999 | 14 (3.3%) | 0 (0.0%) |
| $100,000 to $149,999 | 120 (28.6%) | 0 (0.0%) |
| $150,000 or more | 117 (27.9%) | 0 (0.0%) |
| Total | 420 (100.0%) | 18 (100.0%) |
Monthly Housing Cost Tiers in Crowley Lake
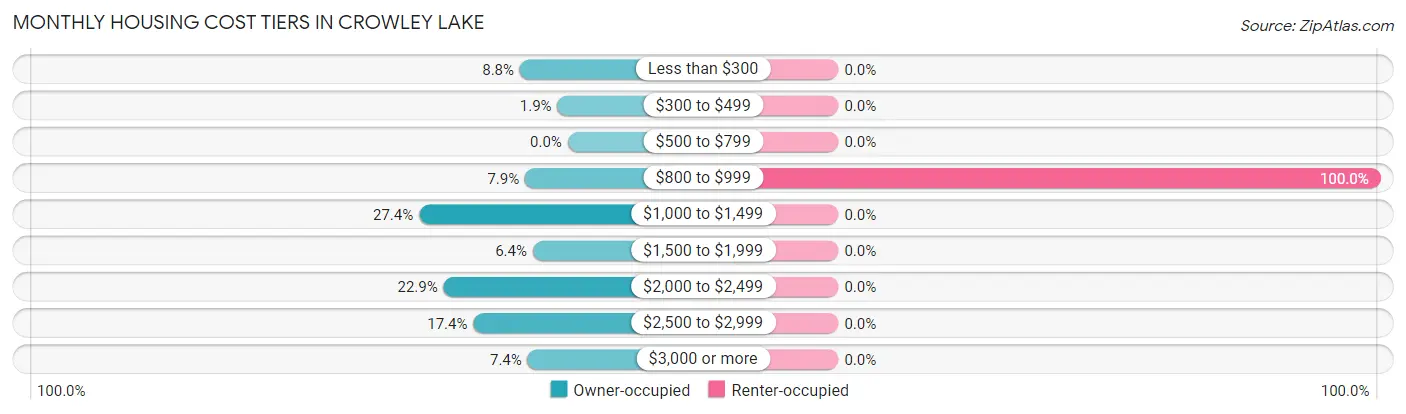
| Monthly Cost | Owner-occupied | Renter-occupied |
| Less than $300 | 37 (8.8%) | 0 (0.0%) |
| $300 to $499 | 8 (1.9%) | 0 (0.0%) |
| $500 to $799 | 0 (0.0%) | 0 (0.0%) |
| $800 to $999 | 33 (7.9%) | 18 (100.0%) |
| $1,000 to $1,499 | 115 (27.4%) | 0 (0.0%) |
| $1,500 to $1,999 | 27 (6.4%) | 0 (0.0%) |
| $2,000 to $2,499 | 96 (22.9%) | 0 (0.0%) |
| $2,500 to $2,999 | 73 (17.4%) | 0 (0.0%) |
| $3,000 or more | 31 (7.4%) | 0 (0.0%) |
| Total | 420 (100.0%) | 18 (100.0%) |
Physical Housing Characteristics in Crowley Lake
Housing Structures in Crowley Lake
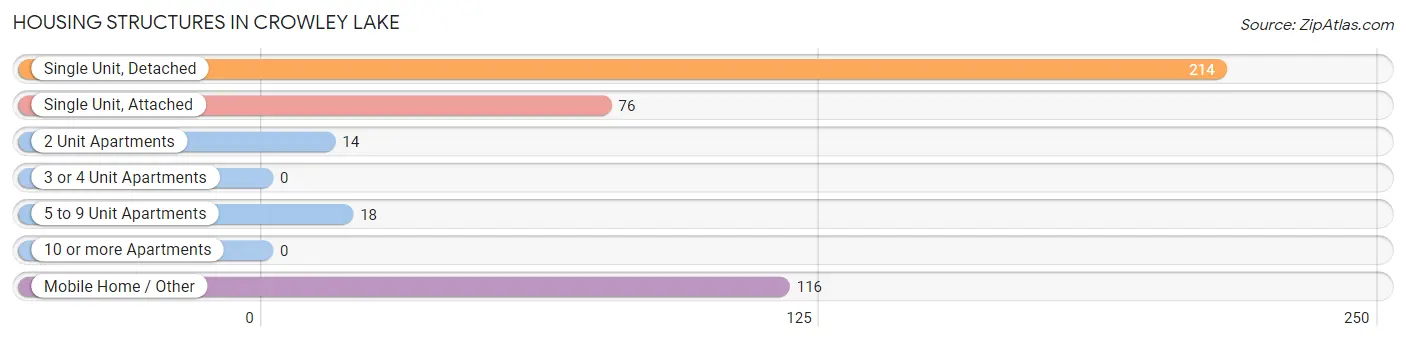
| Structure Type | # Housing Units | % Housing Units |
| Single Unit, Detached | 214 | 48.9% |
| Single Unit, Attached | 76 | 17.3% |
| 2 Unit Apartments | 14 | 3.2% |
| 3 or 4 Unit Apartments | 0 | 0.0% |
| 5 to 9 Unit Apartments | 18 | 4.1% |
| 10 or more Apartments | 0 | 0.0% |
| Mobile Home / Other | 116 | 26.5% |
| Total | 438 | 100.0% |
Housing Structures by Occupancy in Crowley Lake
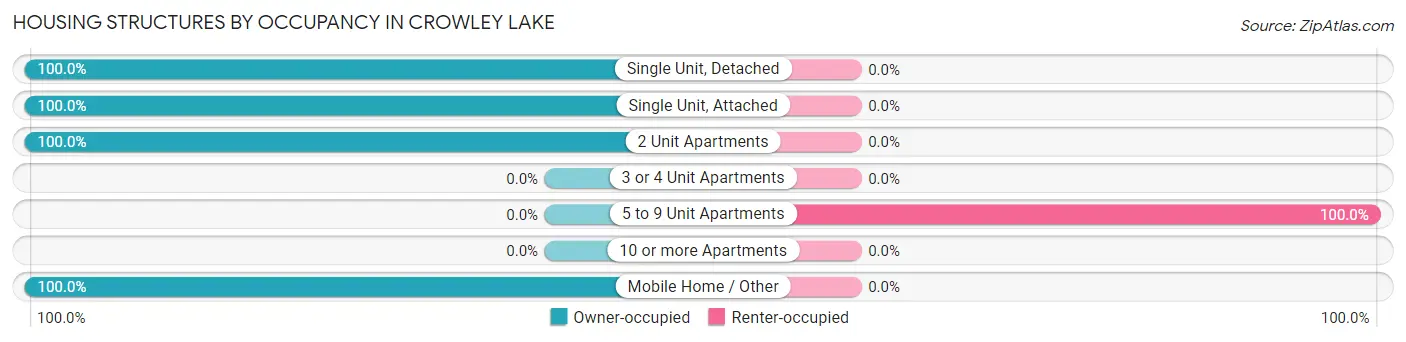
| Structure Type | Owner-occupied | Renter-occupied |
| Single Unit, Detached | 214 (100.0%) | 0 (0.0%) |
| Single Unit, Attached | 76 (100.0%) | 0 (0.0%) |
| 2 Unit Apartments | 14 (100.0%) | 0 (0.0%) |
| 3 or 4 Unit Apartments | 0 (0.0%) | 0 (0.0%) |
| 5 to 9 Unit Apartments | 0 (0.0%) | 18 (100.0%) |
| 10 or more Apartments | 0 (0.0%) | 0 (0.0%) |
| Mobile Home / Other | 116 (100.0%) | 0 (0.0%) |
| Total | 420 (95.9%) | 18 (4.1%) |
Housing Structures by Number of Rooms in Crowley Lake
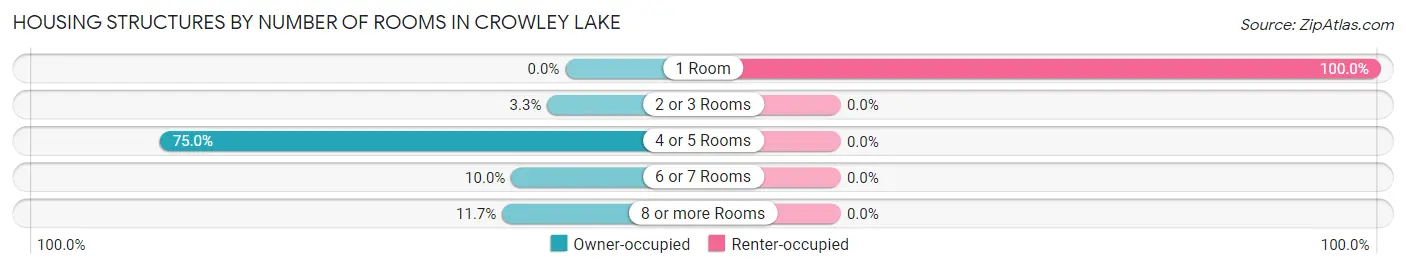
| Number of Rooms | Owner-occupied | Renter-occupied |
| 1 Room | 0 (0.0%) | 18 (100.0%) |
| 2 or 3 Rooms | 14 (3.3%) | 0 (0.0%) |
| 4 or 5 Rooms | 315 (75.0%) | 0 (0.0%) |
| 6 or 7 Rooms | 42 (10.0%) | 0 (0.0%) |
| 8 or more Rooms | 49 (11.7%) | 0 (0.0%) |
| Total | 420 (100.0%) | 18 (100.0%) |
Housing Structure by Heating Type in Crowley Lake
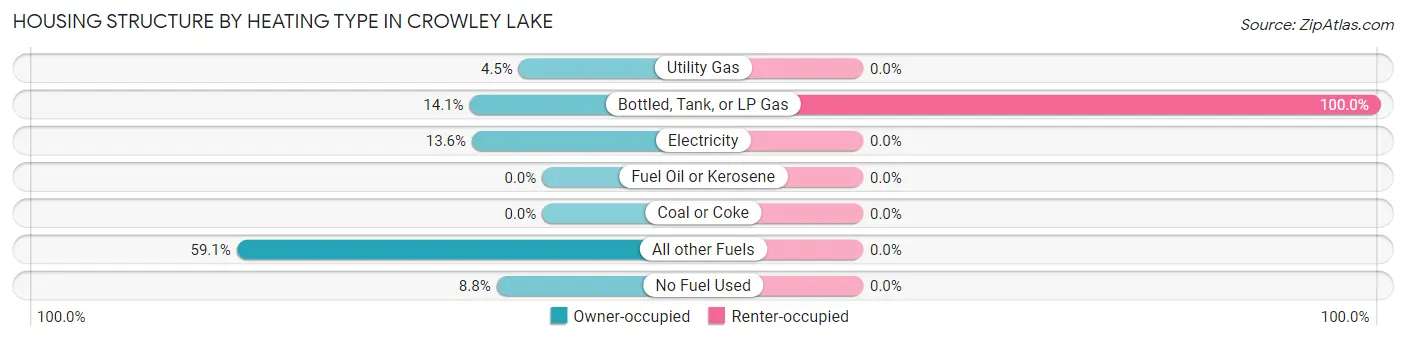
| Heating Type | Owner-occupied | Renter-occupied |
| Utility Gas | 19 (4.5%) | 0 (0.0%) |
| Bottled, Tank, or LP Gas | 59 (14.1%) | 18 (100.0%) |
| Electricity | 57 (13.6%) | 0 (0.0%) |
| Fuel Oil or Kerosene | 0 (0.0%) | 0 (0.0%) |
| Coal or Coke | 0 (0.0%) | 0 (0.0%) |
| All other Fuels | 248 (59.1%) | 0 (0.0%) |
| No Fuel Used | 37 (8.8%) | 0 (0.0%) |
| Total | 420 (100.0%) | 18 (100.0%) |
Household Vehicle Usage in Crowley Lake
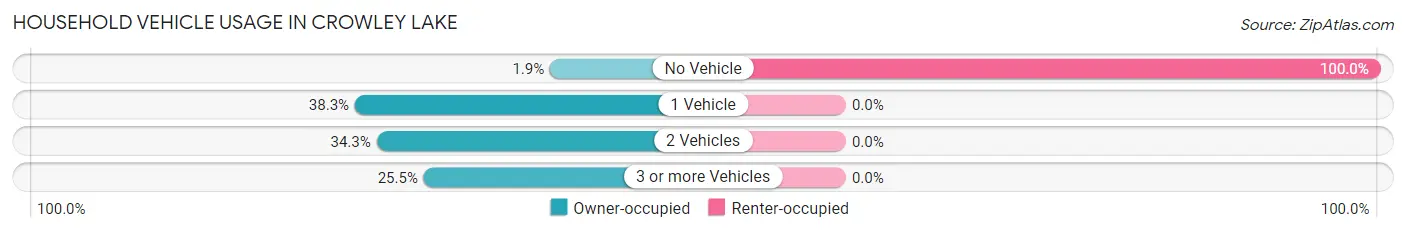
| Vehicles per Household | Owner-occupied | Renter-occupied |
| No Vehicle | 8 (1.9%) | 18 (100.0%) |
| 1 Vehicle | 161 (38.3%) | 0 (0.0%) |
| 2 Vehicles | 144 (34.3%) | 0 (0.0%) |
| 3 or more Vehicles | 107 (25.5%) | 0 (0.0%) |
| Total | 420 (100.0%) | 18 (100.0%) |
Real Estate & Mortgages in Crowley Lake
Real Estate and Mortgage Overview in Crowley Lake
| Characteristic | Without Mortgage | With Mortgage |
| Housing Units | 186 | 234 |
| Median Property Value | $9,999 | $628,000 |
| Median Household Income | $24,043 | $102 |
| Monthly Housing Costs | $1,411 | $31 |
| Real Estate Taxes | $199 | $0 |
Property Value by Mortgage Status in Crowley Lake
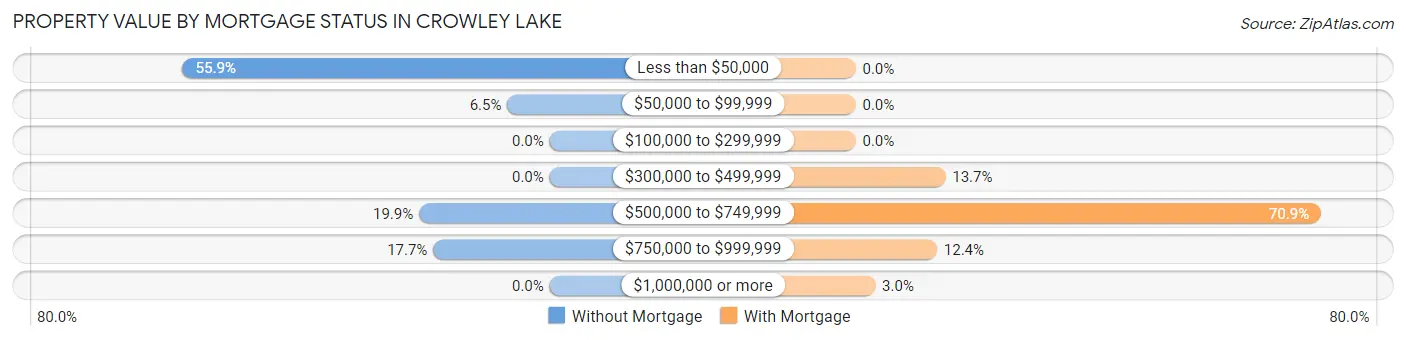
| Property Value | Without Mortgage | With Mortgage |
| Less than $50,000 | 104 (55.9%) | 0 (0.0%) |
| $50,000 to $99,999 | 12 (6.5%) | 0 (0.0%) |
| $100,000 to $299,999 | 0 (0.0%) | 0 (0.0%) |
| $300,000 to $499,999 | 0 (0.0%) | 32 (13.7%) |
| $500,000 to $749,999 | 37 (19.9%) | 166 (70.9%) |
| $750,000 to $999,999 | 33 (17.7%) | 29 (12.4%) |
| $1,000,000 or more | 0 (0.0%) | 7 (3.0%) |
| Total | 186 (100.0%) | 234 (100.0%) |
Household Income by Mortgage Status in Crowley Lake
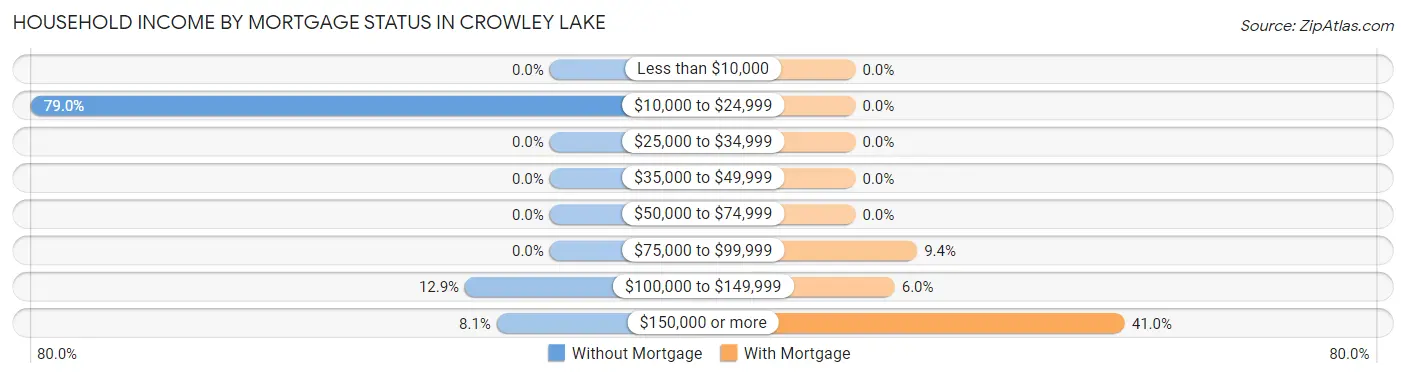
| Household Income | Without Mortgage | With Mortgage |
| Less than $10,000 | 0 (0.0%) | 0 (0.0%) |
| $10,000 to $24,999 | 147 (79.0%) | 0 (0.0%) |
| $25,000 to $34,999 | 0 (0.0%) | 0 (0.0%) |
| $35,000 to $49,999 | 0 (0.0%) | 0 (0.0%) |
| $50,000 to $74,999 | 0 (0.0%) | 0 (0.0%) |
| $75,000 to $99,999 | 0 (0.0%) | 22 (9.4%) |
| $100,000 to $149,999 | 24 (12.9%) | 14 (6.0%) |
| $150,000 or more | 15 (8.1%) | 96 (41.0%) |
| Total | 186 (100.0%) | 234 (100.0%) |
Property Value to Household Income Ratio in Crowley Lake
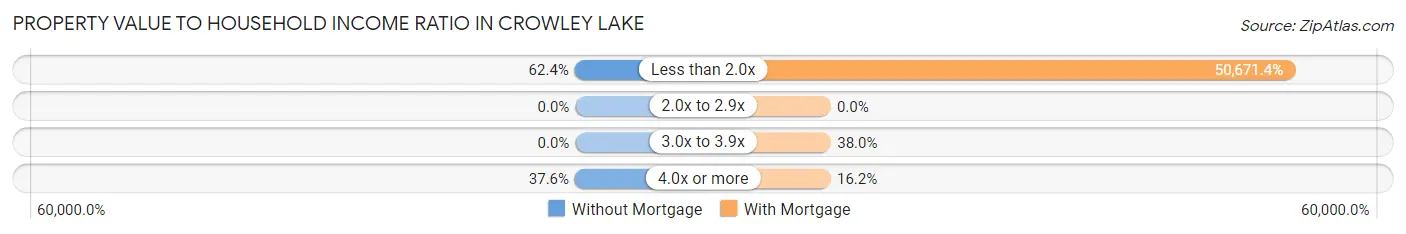
| Value-to-Income Ratio | Without Mortgage | With Mortgage |
| Less than 2.0x | 116 (62.4%) | 118,571 (50,671.4%) |
| 2.0x to 2.9x | 0 (0.0%) | 0 (0.0%) |
| 3.0x to 3.9x | 0 (0.0%) | 89 (38.0%) |
| 4.0x or more | 70 (37.6%) | 38 (16.2%) |
| Total | 186 (100.0%) | 234 (100.0%) |
Real Estate Taxes by Mortgage Status in Crowley Lake
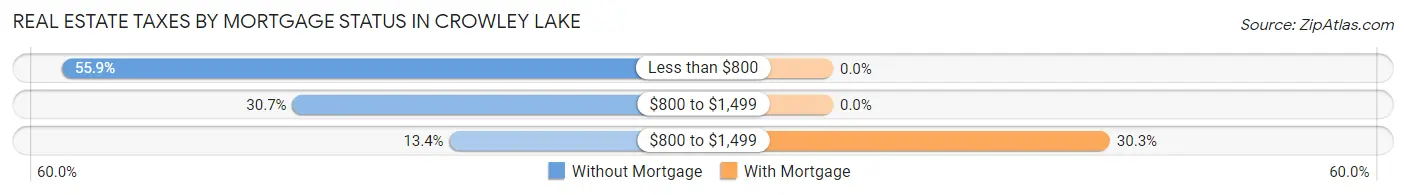
| Property Taxes | Without Mortgage | With Mortgage |
| Less than $800 | 104 (55.9%) | 0 (0.0%) |
| $800 to $1,499 | 57 (30.6%) | 0 (0.0%) |
| $800 to $1,499 | 25 (13.4%) | 71 (30.3%) |
| Total | 186 (100.0%) | 234 (100.0%) |
Health & Disability in Crowley Lake
Health Insurance Coverage by Age in Crowley Lake
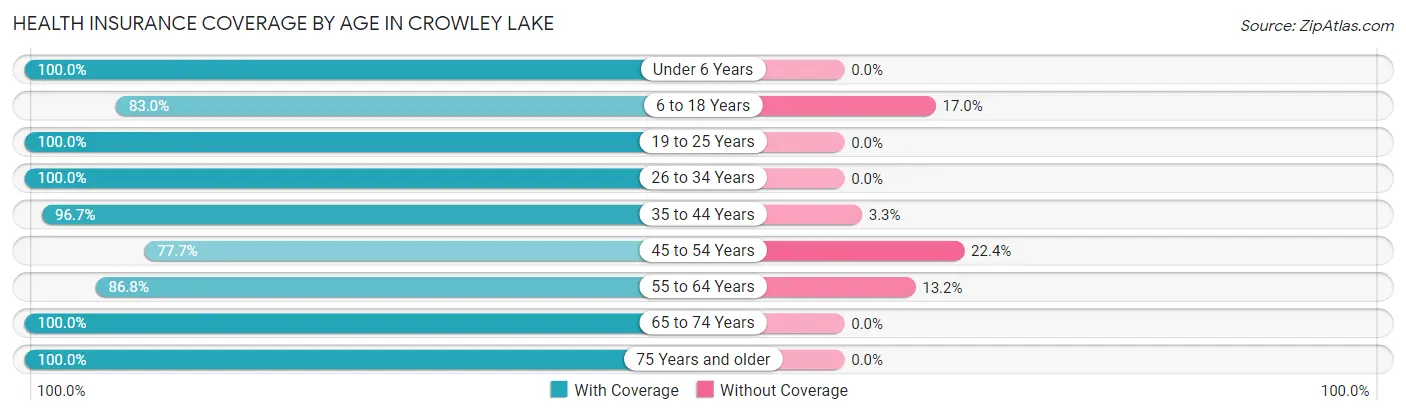
| Age Bracket | With Coverage | Without Coverage |
| Under 6 Years | 241 (100.0%) | 0 (0.0%) |
| 6 to 18 Years | 39 (83.0%) | 8 (17.0%) |
| 19 to 25 Years | 34 (100.0%) | 0 (0.0%) |
| 26 to 34 Years | 80 (100.0%) | 0 (0.0%) |
| 35 to 44 Years | 326 (96.7%) | 11 (3.3%) |
| 45 to 54 Years | 66 (77.6%) | 19 (22.4%) |
| 55 to 64 Years | 118 (86.8%) | 18 (13.2%) |
| 65 to 74 Years | 21 (100.0%) | 0 (0.0%) |
| 75 Years and older | 85 (100.0%) | 0 (0.0%) |
| Total | 1,010 (94.8%) | 56 (5.2%) |
Health Insurance Coverage by Citizenship Status in Crowley Lake
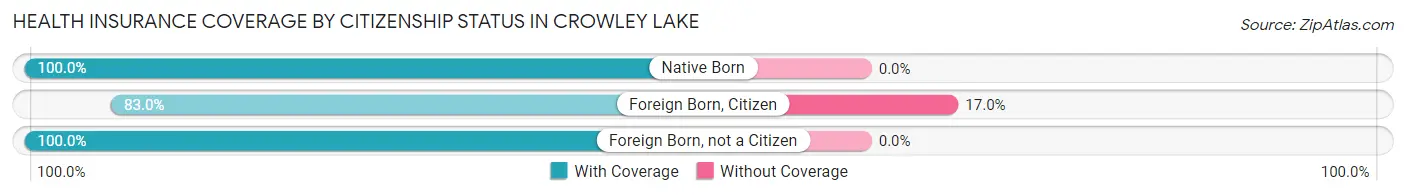
| Citizenship Status | With Coverage | Without Coverage |
| Native Born | 241 (100.0%) | 0 (0.0%) |
| Foreign Born, Citizen | 39 (83.0%) | 8 (17.0%) |
| Foreign Born, not a Citizen | 34 (100.0%) | 0 (0.0%) |
Health Insurance Coverage by Household Income in Crowley Lake
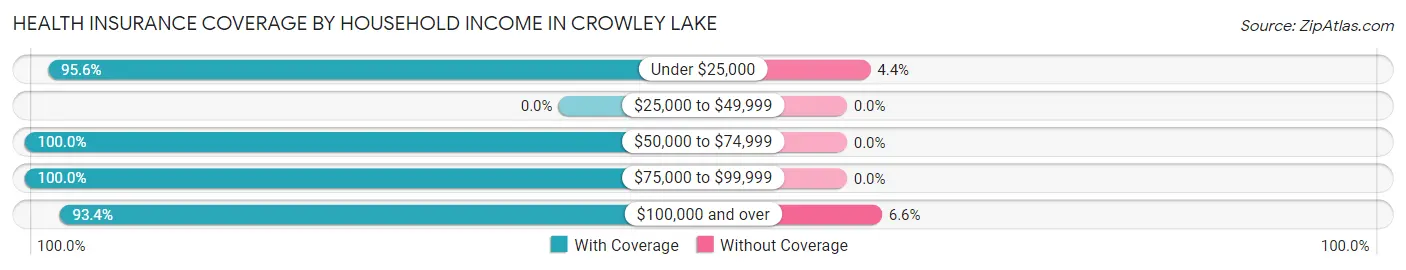
| Household Income | With Coverage | Without Coverage |
| Under $25,000 | 389 (95.6%) | 18 (4.4%) |
| $25,000 to $49,999 | 0 (0.0%) | 0 (0.0%) |
| $50,000 to $74,999 | 41 (100.0%) | 0 (0.0%) |
| $75,000 to $99,999 | 20 (100.0%) | 0 (0.0%) |
| $100,000 and over | 541 (93.4%) | 38 (6.6%) |
Public vs Private Health Insurance Coverage by Age in Crowley Lake
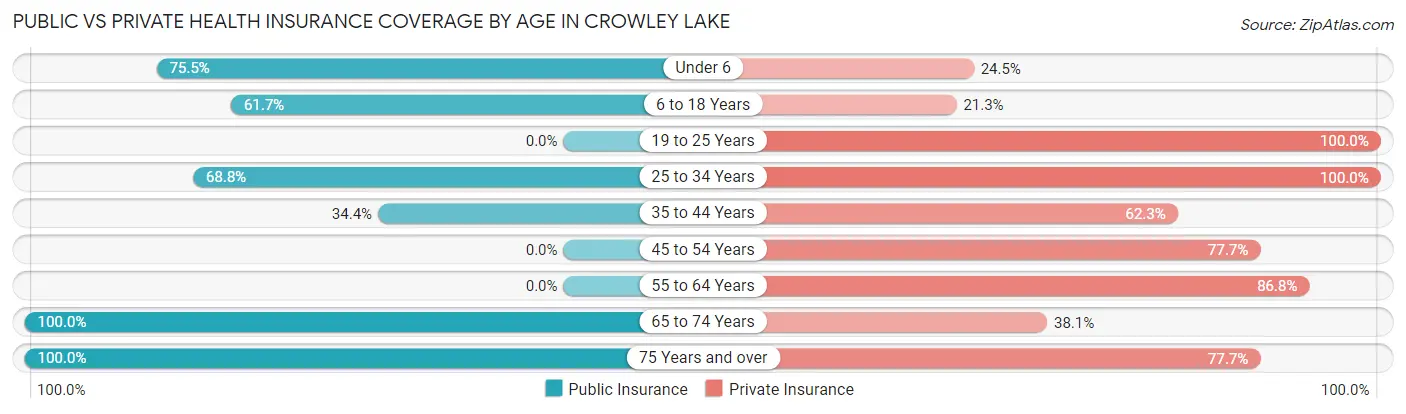
| Age Bracket | Public Insurance | Private Insurance |
| Under 6 | 182 (75.5%) | 59 (24.5%) |
| 6 to 18 Years | 29 (61.7%) | 10 (21.3%) |
| 19 to 25 Years | 0 (0.0%) | 34 (100.0%) |
| 25 to 34 Years | 55 (68.8%) | 80 (100.0%) |
| 35 to 44 Years | 116 (34.4%) | 210 (62.3%) |
| 45 to 54 Years | 0 (0.0%) | 66 (77.6%) |
| 55 to 64 Years | 0 (0.0%) | 118 (86.8%) |
| 65 to 74 Years | 21 (100.0%) | 8 (38.1%) |
| 75 Years and over | 85 (100.0%) | 66 (77.6%) |
| Total | 488 (45.8%) | 651 (61.1%) |
Disability Status by Sex by Age in Crowley Lake
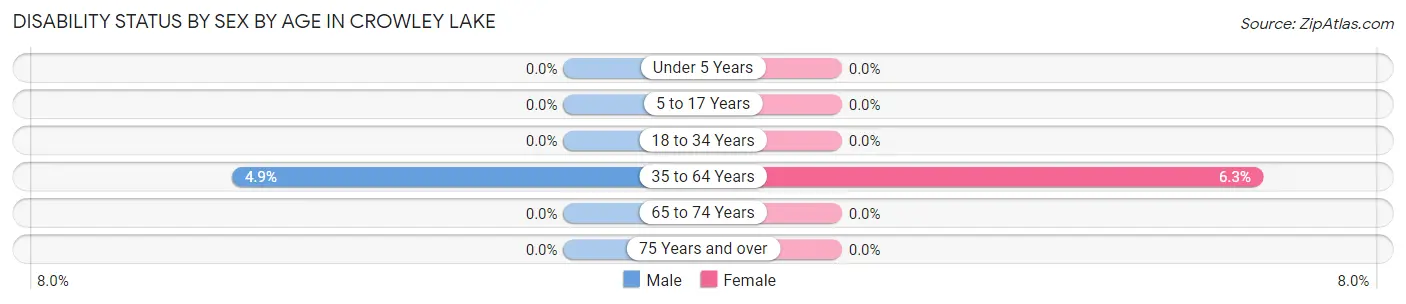
| Age Bracket | Male | Female |
| Under 5 Years | 0 (0.0%) | 0 (0.0%) |
| 5 to 17 Years | 0 (0.0%) | 0 (0.0%) |
| 18 to 34 Years | 0 (0.0%) | 0 (0.0%) |
| 35 to 64 Years | 18 (4.9%) | 12 (6.2%) |
| 65 to 74 Years | 0 (0.0%) | 0 (0.0%) |
| 75 Years and over | 0 (0.0%) | 0 (0.0%) |
Disability Class by Sex by Age in Crowley Lake
Disability Class: Hearing Difficulty
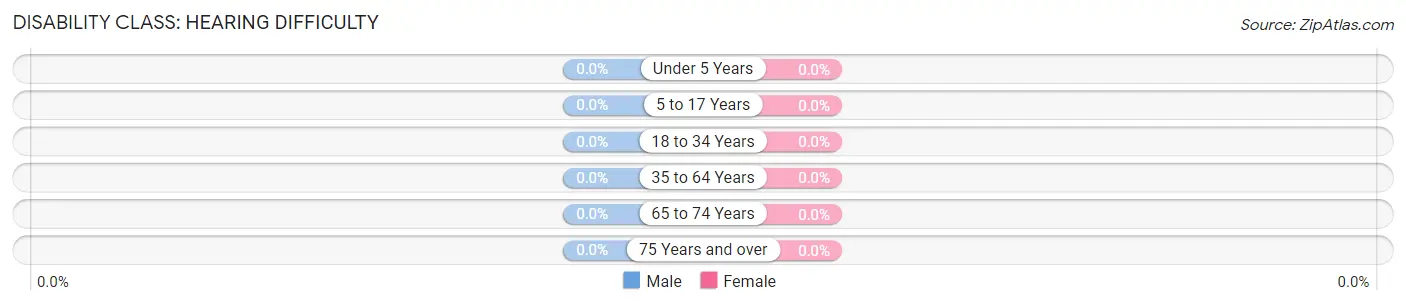
| Age Bracket | Male | Female |
| Under 5 Years | 0 (0.0%) | 0 (0.0%) |
| 5 to 17 Years | 0 (0.0%) | 0 (0.0%) |
| 18 to 34 Years | 0 (0.0%) | 0 (0.0%) |
| 35 to 64 Years | 0 (0.0%) | 0 (0.0%) |
| 65 to 74 Years | 0 (0.0%) | 0 (0.0%) |
| 75 Years and over | 0 (0.0%) | 0 (0.0%) |
Disability Class: Vision Difficulty
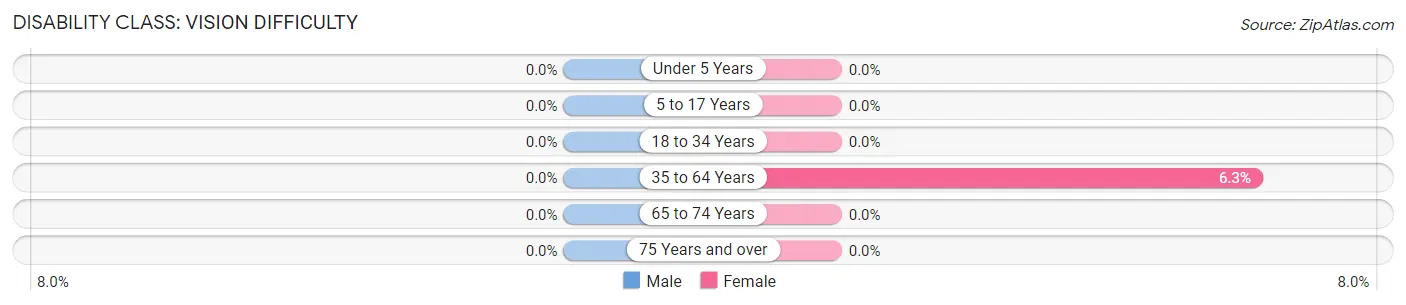
| Age Bracket | Male | Female |
| Under 5 Years | 0 (0.0%) | 0 (0.0%) |
| 5 to 17 Years | 0 (0.0%) | 0 (0.0%) |
| 18 to 34 Years | 0 (0.0%) | 0 (0.0%) |
| 35 to 64 Years | 0 (0.0%) | 12 (6.2%) |
| 65 to 74 Years | 0 (0.0%) | 0 (0.0%) |
| 75 Years and over | 0 (0.0%) | 0 (0.0%) |
Disability Class: Cognitive Difficulty
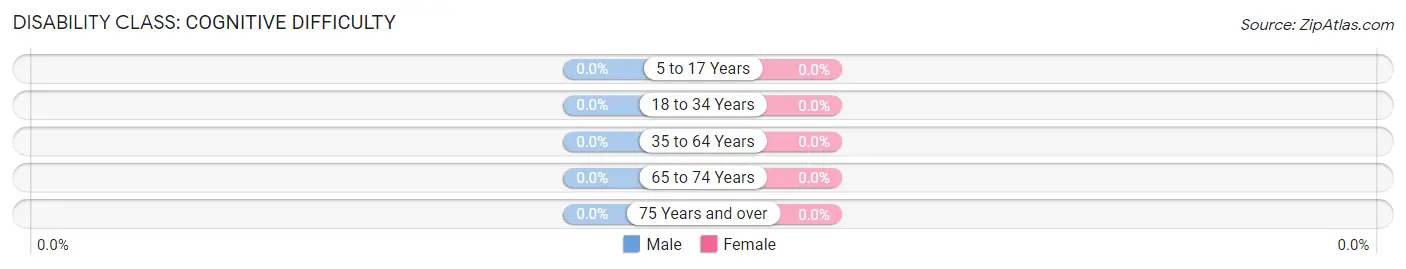
| Age Bracket | Male | Female |
| 5 to 17 Years | 0 (0.0%) | 0 (0.0%) |
| 18 to 34 Years | 0 (0.0%) | 0 (0.0%) |
| 35 to 64 Years | 0 (0.0%) | 0 (0.0%) |
| 65 to 74 Years | 0 (0.0%) | 0 (0.0%) |
| 75 Years and over | 0 (0.0%) | 0 (0.0%) |
Disability Class: Ambulatory Difficulty
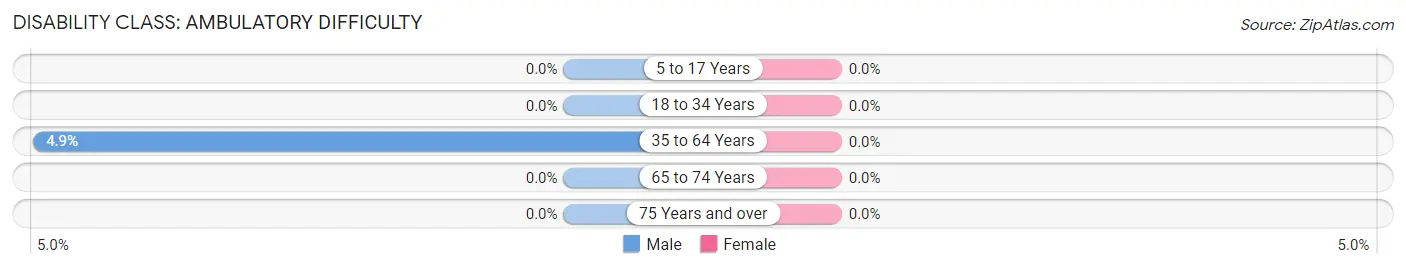
| Age Bracket | Male | Female |
| 5 to 17 Years | 0 (0.0%) | 0 (0.0%) |
| 18 to 34 Years | 0 (0.0%) | 0 (0.0%) |
| 35 to 64 Years | 18 (4.9%) | 0 (0.0%) |
| 65 to 74 Years | 0 (0.0%) | 0 (0.0%) |
| 75 Years and over | 0 (0.0%) | 0 (0.0%) |
Disability Class: Self-Care Difficulty
| Age Bracket | Male | Female |
| 5 to 17 Years | 0 (0.0%) | 0 (0.0%) |
| 18 to 34 Years | 0 (0.0%) | 0 (0.0%) |
| 35 to 64 Years | 0 (0.0%) | 0 (0.0%) |
| 65 to 74 Years | 0 (0.0%) | 0 (0.0%) |
| 75 Years and over | 0 (0.0%) | 0 (0.0%) |
Technology Access in Crowley Lake
Computing Device Access in Crowley Lake
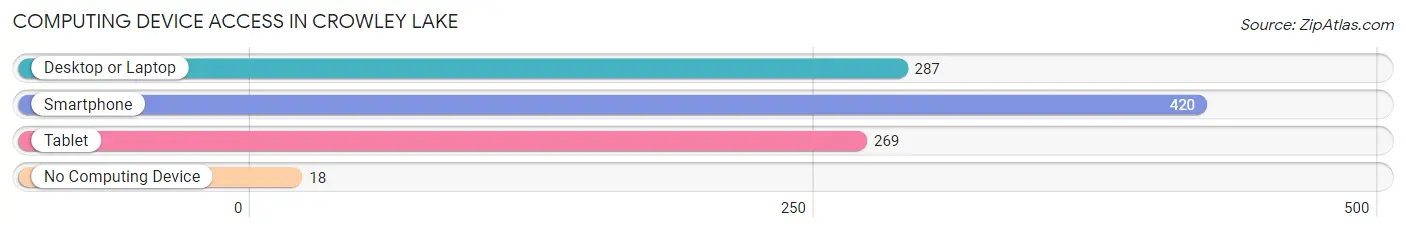
| Device Type | # Households | % Households |
| Desktop or Laptop | 287 | 65.5% |
| Smartphone | 420 | 95.9% |
| Tablet | 269 | 61.4% |
| No Computing Device | 18 | 4.1% |
| Total | 438 | 100.0% |
Internet Access in Crowley Lake
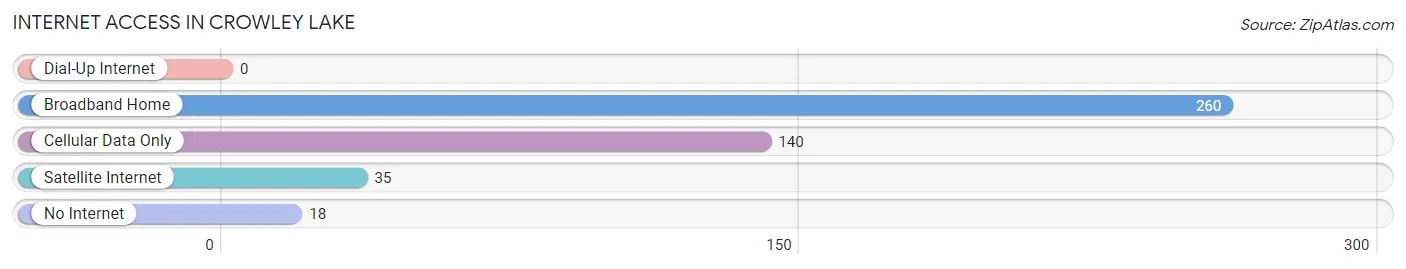
| Internet Type | # Households | % Households |
| Dial-Up Internet | 0 | 0.0% |
| Broadband Home | 260 | 59.4% |
| Cellular Data Only | 140 | 32.0% |
| Satellite Internet | 35 | 8.0% |
| No Internet | 18 | 4.1% |
| Total | 438 | 100.0% |
Crowley Lake Summary
Crowley Lake is a small unincorporated community located in Mono County, California, United States. It is situated in the Eastern Sierra Nevada Mountains, approximately 20 miles south of the town of Mammoth Lakes. The lake itself is a large, shallow, alkaline lake, and is the largest natural lake in California. It is a popular destination for fishing, camping, and other outdoor activities.
History
The area around Crowley Lake has been inhabited for thousands of years by the Paiute and Mono Native American tribes. The lake was named after Bishop Thomas Crowley, who was the first Catholic Bishop of California. The lake was first used for fishing and recreation in the late 1800s, and the first resort was built in the area in the early 1900s.
In the 1950s, the lake was used as a test site for the U.S. Navy's rocket program. The lake was also used as a training site for the U.S. Army's 10th Mountain Division during World War II.
Geography
Crowley Lake is located in the Eastern Sierra Nevada Mountains, at an elevation of 6,906 feet. The lake is approximately 8 miles long and 2 miles wide, and is the largest natural lake in California. The lake is fed by several small streams, and is surrounded by sagebrush and juniper trees. The lake is shallow, with an average depth of only 10 feet.
The area around Crowley Lake is mostly desert, with hot summers and cold winters. The average annual temperature is around 50 degrees Fahrenheit, and the average annual precipitation is around 10 inches.
Economy
The economy of Crowley Lake is largely based on tourism and recreation. The lake is a popular destination for fishing, camping, and other outdoor activities. There are several resorts and campgrounds in the area, as well as a marina and boat launch.
The area is also home to several small businesses, including restaurants, stores, and a gas station. The local economy is also supported by the nearby ski resort at Mammoth Mountain.
Demographics
As of the 2010 census, the population of Crowley Lake was 1,093. The population is mostly white (90.3%), with a small percentage of Native American (2.2%), Hispanic (2.1%), and Asian (1.2%) residents. The median household income is $45,000, and the median age is 44.
Conclusion
Crowley Lake is a small unincorporated community located in Mono County, California. It is situated in the Eastern Sierra Nevada Mountains, and is a popular destination for fishing, camping, and other outdoor activities. The economy of Crowley Lake is largely based on tourism and recreation, and the population is mostly white. The area is a great destination for outdoor enthusiasts, and offers a variety of activities for visitors to enjoy.
Common Questions
What is Per Capita Income in Crowley Lake?
Per Capita income in Crowley Lake is $42,248.
What is the Median Family Income in Crowley Lake?
Median Family Income in Crowley Lake is $101,154.
What is the Median Household income in Crowley Lake?
Median Household Income in Crowley Lake is $102,143.
What is Income or Wage Gap in Crowley Lake?
Income or Wage Gap in Crowley Lake is 6.7%.
Women in Crowley Lake earn 93.3 cents for every dollar earned by a man.
What is Inequality or Gini Index in Crowley Lake?
Inequality or Gini Index in Crowley Lake is 0.43.
What is the Total Population of Crowley Lake?
Total Population of Crowley Lake is 1,066.
What is the Total Male Population of Crowley Lake?
Total Male Population of Crowley Lake is 728.
What is the Total Female Population of Crowley Lake?
Total Female Population of Crowley Lake is 338.
What is the Ratio of Males per 100 Females in Crowley Lake?
There are 215.38 Males per 100 Females in Crowley Lake.
What is the Ratio of Females per 100 Males in Crowley Lake?
There are 46.43 Females per 100 Males in Crowley Lake.
What is the Median Population Age in Crowley Lake?
Median Population Age in Crowley Lake is 38.6 Years.
What is the Average Family Size in Crowley Lake
Average Family Size in Crowley Lake is 2.6 People.
What is the Average Household Size in Crowley Lake
Average Household Size in Crowley Lake is 2.4 People.
How Large is the Labor Force in Crowley Lake?
There are 649 People in the Labor Forcein in Crowley Lake.
What is the Percentage of People in the Labor Force in Crowley Lake?
83.4% of People are in the Labor Force in Crowley Lake.