Cobb, CA Map & Demographics
Cobb Map
Cobb Overview
$58,594
PER CAPITA INCOME
$112,292
AVG FAMILY INCOME
$109,241
AVG HOUSEHOLD INCOME
0.39
INEQUALITY / GINI INDEX
685
TOTAL POPULATION
480
MALE POPULATION
205
FEMALE POPULATION
234.15
MALES / 100 FEMALES
42.71
FEMALES / 100 MALES
57.8
MEDIAN AGE
2.2
AVG FAMILY SIZE
1.8
AVG HOUSEHOLD SIZE
309
LABOR FORCE [ PEOPLE ]
48.1%
PERCENT IN LABOR FORCE
Cobb Zip Codes
Cobb Area Codes
Income in Cobb
Income Overview in Cobb
Per Capita Income in Cobb is $58,594, while median incomes of families and households are $112,292 and $109,241 respectively.
| Characteristic | Number | Measure |
| Per Capita Income | 685 | $58,594 |
| Median Family Income | 246 | $112,292 |
| Mean Family Income | 246 | $136,139 |
| Median Household Income | 381 | $109,241 |
| Mean Household Income | 381 | $103,331 |
| Income Deficit | 246 | $0 |
| Wage / Income Gap (%) | 685 | 0.00% |
| Wage / Income Gap ($) | 685 | 100.00¢ per $1 |
| Gini / Inequality Index | 685 | 0.39 |
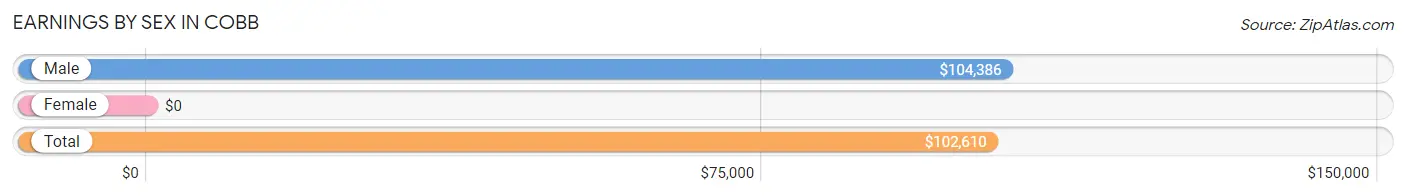
Earnings by Sex in Cobb
| Sex | Number | Average Earnings |
| Male | 228 (73.8%) | $104,386 |
| Female | 81 (26.2%) | $0 |
| Total | 309 (100.0%) | $102,610 |
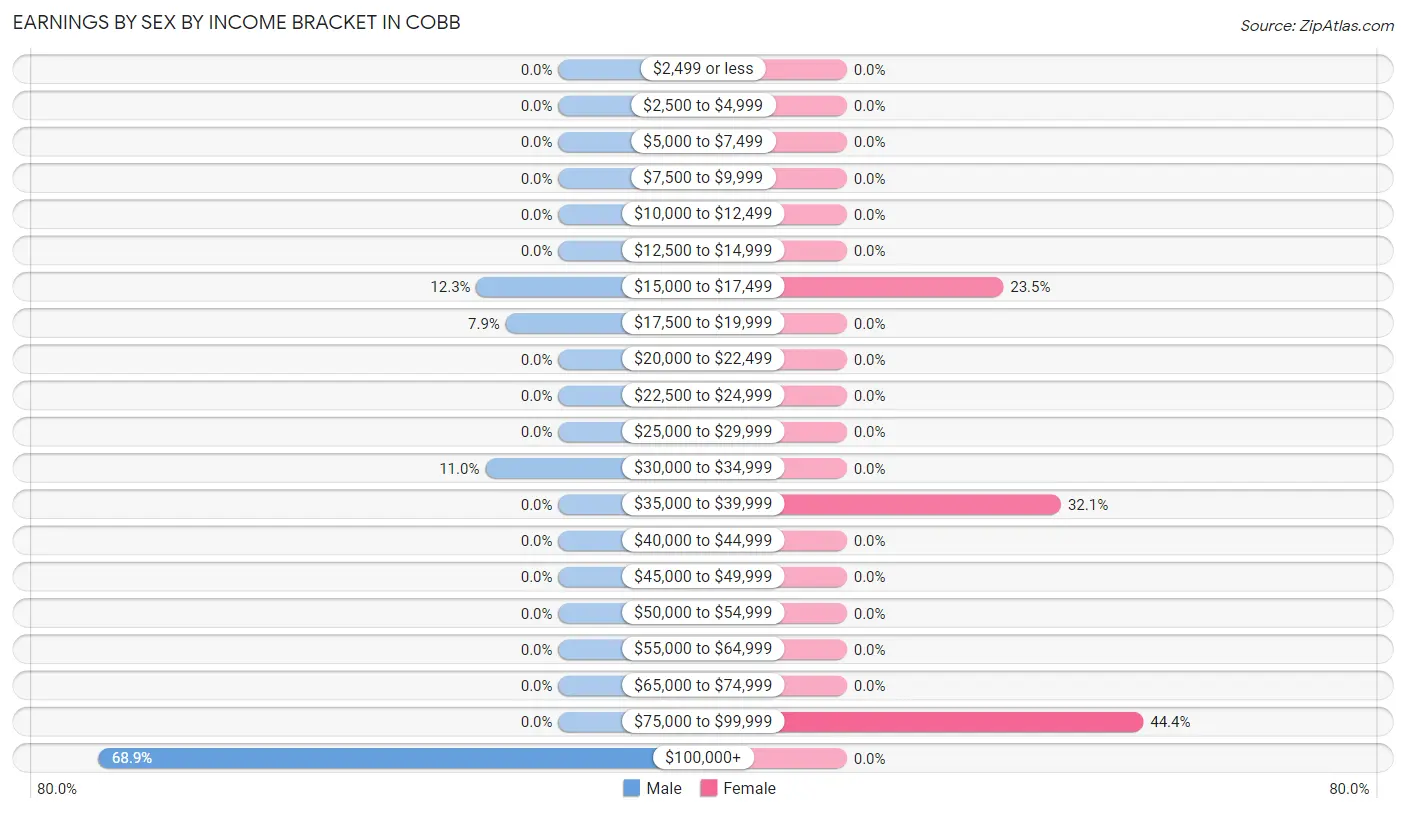
Earnings by Sex by Income Bracket in Cobb
The most common earnings brackets in Cobb are $100,000+ for men (157 | 68.9%) and $75,000 to $99,999 for women (36 | 44.4%).
| Income | Male | Female |
| $2,499 or less | 0 (0.0%) | 0 (0.0%) |
| $2,500 to $4,999 | 0 (0.0%) | 0 (0.0%) |
| $5,000 to $7,499 | 0 (0.0%) | 0 (0.0%) |
| $7,500 to $9,999 | 0 (0.0%) | 0 (0.0%) |
| $10,000 to $12,499 | 0 (0.0%) | 0 (0.0%) |
| $12,500 to $14,999 | 0 (0.0%) | 0 (0.0%) |
| $15,000 to $17,499 | 28 (12.3%) | 19 (23.5%) |
| $17,500 to $19,999 | 18 (7.9%) | 0 (0.0%) |
| $20,000 to $22,499 | 0 (0.0%) | 0 (0.0%) |
| $22,500 to $24,999 | 0 (0.0%) | 0 (0.0%) |
| $25,000 to $29,999 | 0 (0.0%) | 0 (0.0%) |
| $30,000 to $34,999 | 25 (11.0%) | 0 (0.0%) |
| $35,000 to $39,999 | 0 (0.0%) | 26 (32.1%) |
| $40,000 to $44,999 | 0 (0.0%) | 0 (0.0%) |
| $45,000 to $49,999 | 0 (0.0%) | 0 (0.0%) |
| $50,000 to $54,999 | 0 (0.0%) | 0 (0.0%) |
| $55,000 to $64,999 | 0 (0.0%) | 0 (0.0%) |
| $65,000 to $74,999 | 0 (0.0%) | 0 (0.0%) |
| $75,000 to $99,999 | 0 (0.0%) | 36 (44.4%) |
| $100,000+ | 157 (68.9%) | 0 (0.0%) |
| Total | 228 (100.0%) | 81 (100.0%) |
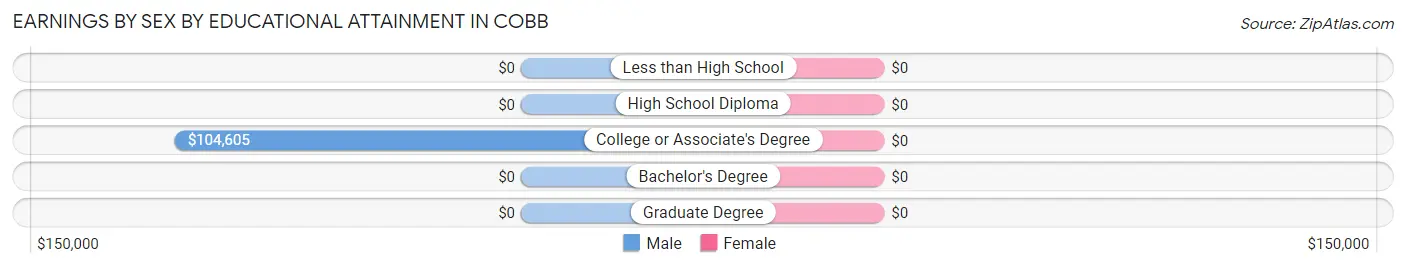
Earnings by Sex by Educational Attainment in Cobb
| Educational Attainment | Male Income | Female Income |
| Less than High School | - | - |
| High School Diploma | - | - |
| College or Associate's Degree | $104,605 | $0 |
| Bachelor's Degree | - | - |
| Graduate Degree | - | - |
| Total | $104,386 | $0 |
Family Income in Cobb
Family Income Brackets in Cobb
According to the Cobb family income data, there are 100 families falling into the $100,000 to $149,999 income range, which is the most common income bracket and makes up 40.6% of all families.
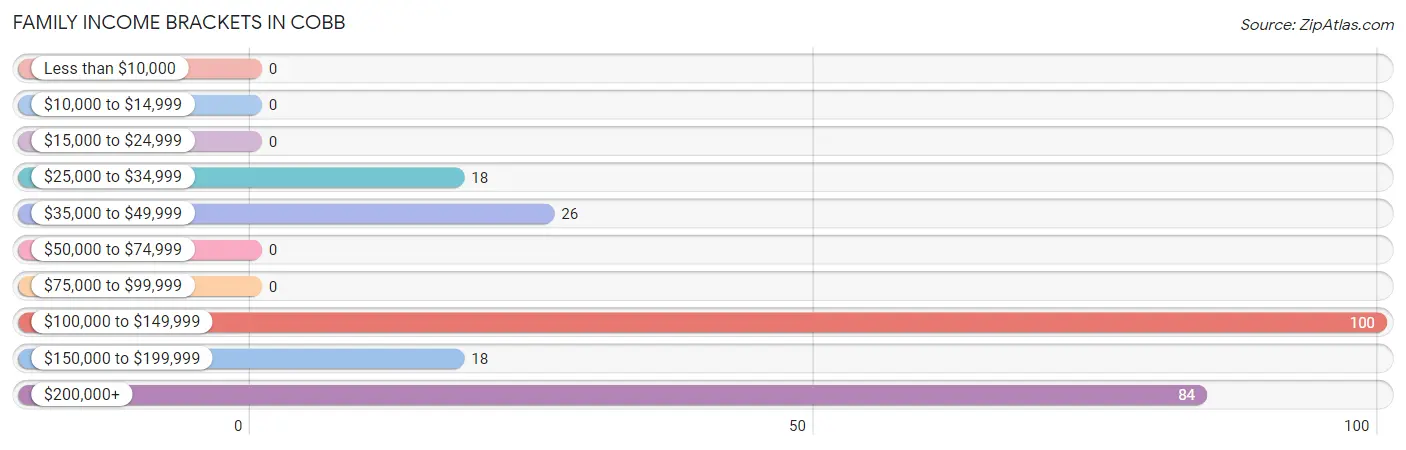
| Income Bracket | # Families | % Families |
| Less than $10,000 | 0 | 0.0% |
| $10,000 to $14,999 | 0 | 0.0% |
| $15,000 to $24,999 | 0 | 0.0% |
| $25,000 to $34,999 | 18 | 7.3% |
| $35,000 to $49,999 | 26 | 10.6% |
| $50,000 to $74,999 | 0 | 0.0% |
| $75,000 to $99,999 | 0 | 0.0% |
| $100,000 to $149,999 | 100 | 40.7% |
| $150,000 to $199,999 | 18 | 7.3% |
| $200,000+ | 84 | 34.1% |
Family Income by Famaliy Size in Cobb
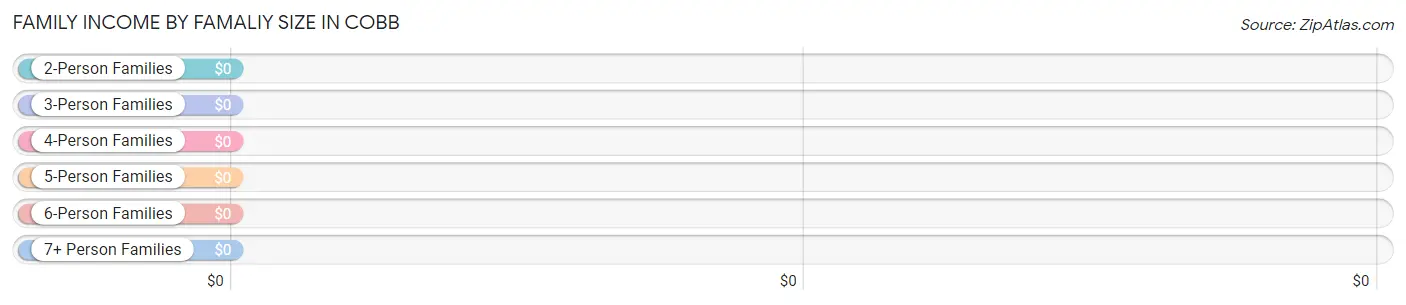
| Income Bracket | # Families | Median Income |
| 2-Person Families | 228 (92.7%) | $0 |
| 3-Person Families | 18 (7.3%) | $0 |
| 4-Person Families | 0 (0.0%) | $0 |
| 5-Person Families | 0 (0.0%) | $0 |
| 6-Person Families | 0 (0.0%) | $0 |
| 7+ Person Families | 0 (0.0%) | $0 |
| Total | 246 (100.0%) | $112,292 |
Family Income by Number of Earners in Cobb
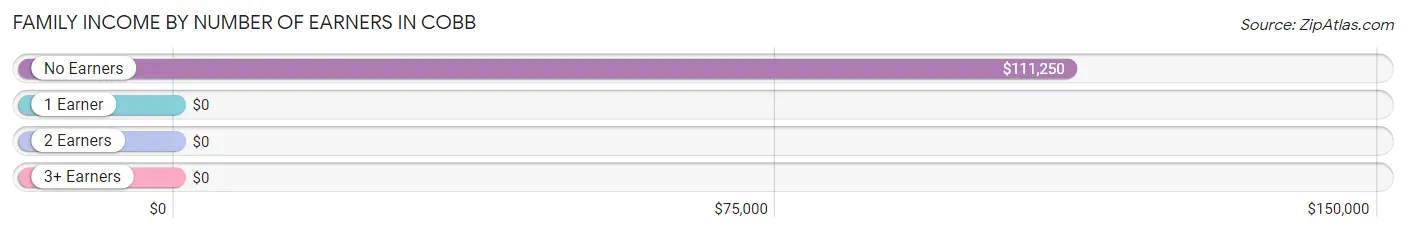
| Number of Earners | # Families | Median Income |
| No Earners | 92 (37.4%) | $111,250 |
| 1 Earner | 62 (25.2%) | $0 |
| 2 Earners | 92 (37.4%) | $0 |
| 3+ Earners | 0 (0.0%) | $0 |
| Total | 246 (100.0%) | $112,292 |
Household Income in Cobb
Household Income Brackets in Cobb
With 126 households falling in the category, the $100,000 to $149,999 income range is the most frequent in Cobb, accounting for 33.1% of all households.
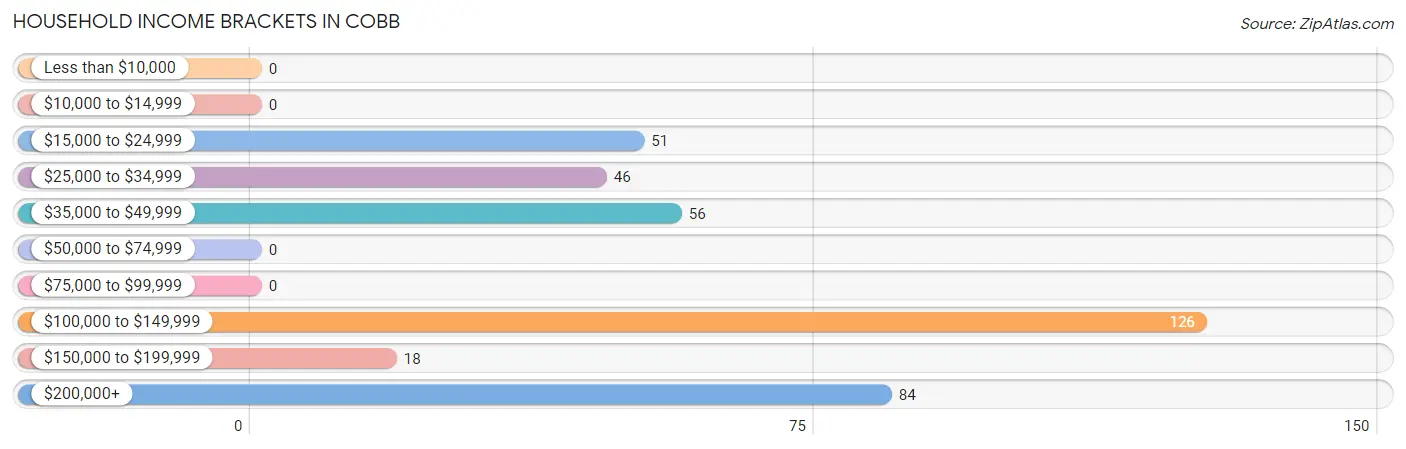
| Income Bracket | # Households | % Households |
| Less than $10,000 | 0 | 0.0% |
| $10,000 to $14,999 | 0 | 0.0% |
| $15,000 to $24,999 | 51 | 13.4% |
| $25,000 to $34,999 | 46 | 12.1% |
| $35,000 to $49,999 | 56 | 14.7% |
| $50,000 to $74,999 | 0 | 0.0% |
| $75,000 to $99,999 | 0 | 0.0% |
| $100,000 to $149,999 | 126 | 33.1% |
| $150,000 to $199,999 | 18 | 4.7% |
| $200,000+ | 84 | 22.0% |
Household Income by Householder Age in Cobb
The median household income in Cobb is $109,241, with the highest median household income of $108,616 found in the 65+ years age bracket for the primary householder. A total of 175 households (45.9%) fall into this category.
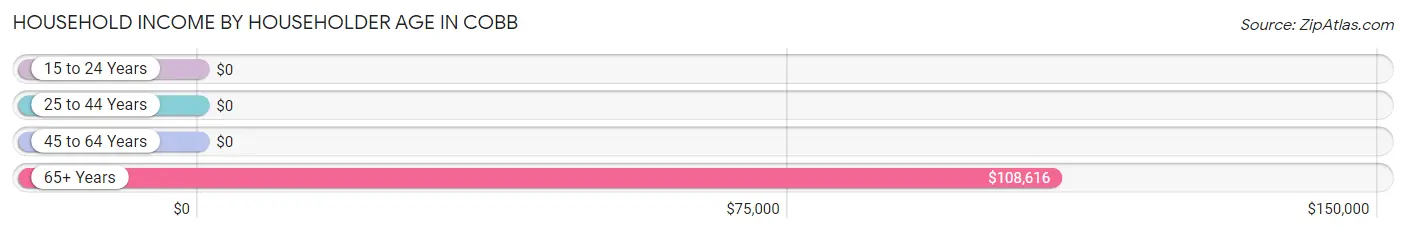
| Income Bracket | # Households | Median Income |
| 15 to 24 Years | 0 (0.0%) | $0 |
| 25 to 44 Years | 110 (28.9%) | $0 |
| 45 to 64 Years | 96 (25.2%) | $0 |
| 65+ Years | 175 (45.9%) | $108,616 |
| Total | 381 (100.0%) | $109,241 |
Poverty in Cobb
Income Below Poverty by Sex and Age in Cobb
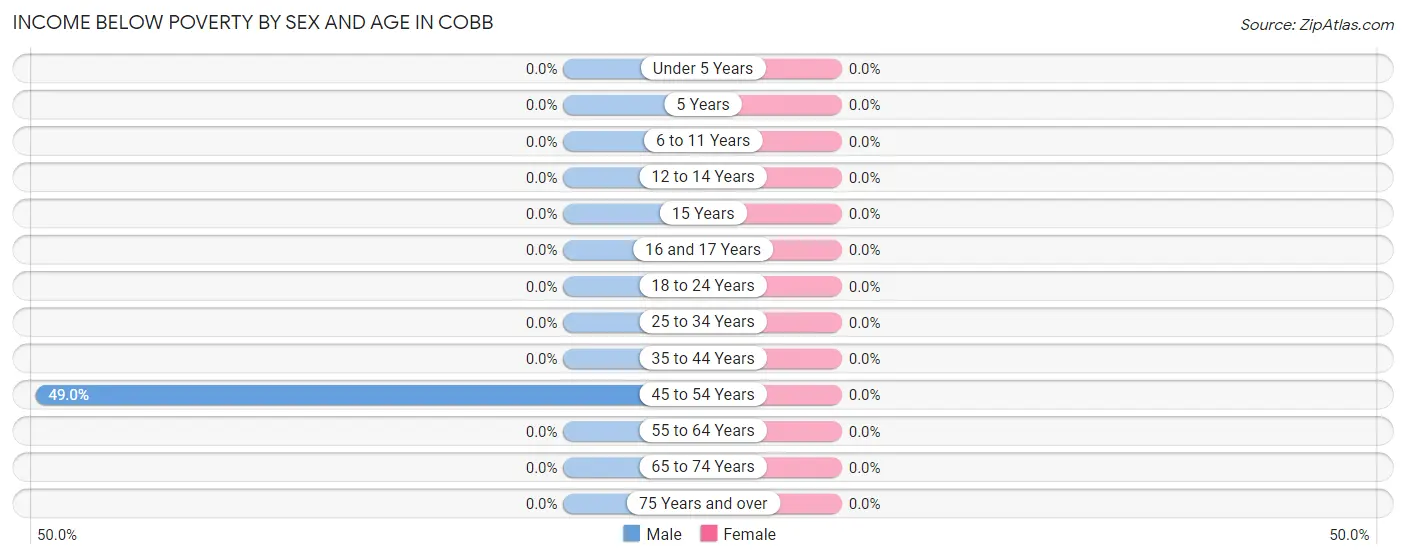
| Age Bracket | Male | Female |
| Under 5 Years | 0 (0.0%) | 0 (0.0%) |
| 5 Years | 0 (0.0%) | 0 (0.0%) |
| 6 to 11 Years | 0 (0.0%) | 0 (0.0%) |
| 12 to 14 Years | 0 (0.0%) | 0 (0.0%) |
| 15 Years | 0 (0.0%) | 0 (0.0%) |
| 16 and 17 Years | 0 (0.0%) | 0 (0.0%) |
| 18 to 24 Years | 0 (0.0%) | 0 (0.0%) |
| 25 to 34 Years | 0 (0.0%) | 0 (0.0%) |
| 35 to 44 Years | 0 (0.0%) | 0 (0.0%) |
| 45 to 54 Years | 24 (49.0%) | 0 (0.0%) |
| 55 to 64 Years | 0 (0.0%) | 0 (0.0%) |
| 65 to 74 Years | 0 (0.0%) | 0 (0.0%) |
| 75 Years and over | 0 (0.0%) | 0 (0.0%) |
| Total | 24 (5.0%) | 0 (0.0%) |
Income Above Poverty by Sex and Age in Cobb
According to the poverty statistics in Cobb, males aged 12 to 14 years and females aged 6 to 11 years are the age groups that are most secure financially, with 100.0% of males and 100.0% of females in these age groups living above the poverty line.
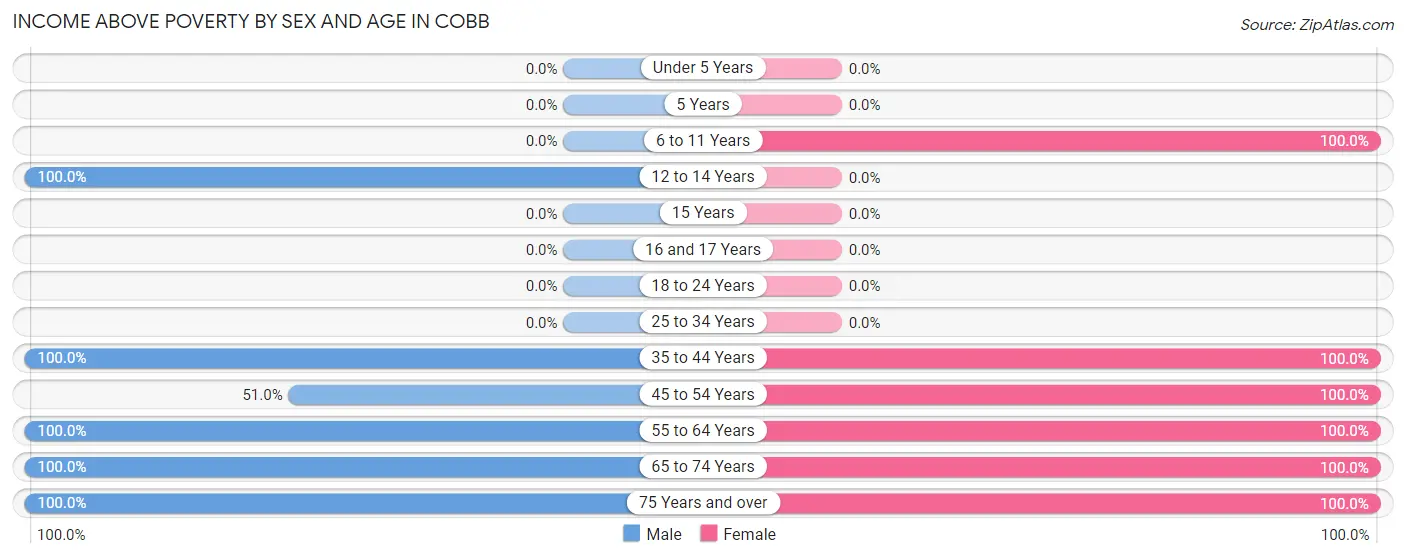
| Age Bracket | Male | Female |
| Under 5 Years | 0 (0.0%) | 0 (0.0%) |
| 5 Years | 0 (0.0%) | 0 (0.0%) |
| 6 to 11 Years | 0 (0.0%) | 17 (100.0%) |
| 12 to 14 Years | 25 (100.0%) | 0 (0.0%) |
| 15 Years | 0 (0.0%) | 0 (0.0%) |
| 16 and 17 Years | 0 (0.0%) | 0 (0.0%) |
| 18 to 24 Years | 0 (0.0%) | 0 (0.0%) |
| 25 to 34 Years | 0 (0.0%) | 0 (0.0%) |
| 35 to 44 Years | 131 (100.0%) | 36 (100.0%) |
| 45 to 54 Years | 25 (51.0%) | 19 (100.0%) |
| 55 to 64 Years | 156 (100.0%) | 40 (100.0%) |
| 65 to 74 Years | 101 (100.0%) | 65 (100.0%) |
| 75 Years and over | 18 (100.0%) | 28 (100.0%) |
| Total | 456 (95.0%) | 205 (100.0%) |
Income Below Poverty Among Married-Couple Families in Cobb
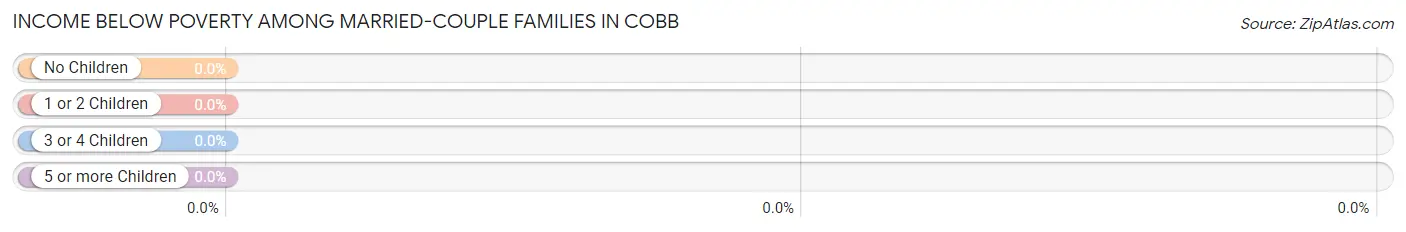
| Children | Above Poverty | Below Poverty |
| No Children | 200 (100.0%) | 0 (0.0%) |
| 1 or 2 Children | 0 (0.0%) | 0 (0.0%) |
| 3 or 4 Children | 0 (0.0%) | 0 (0.0%) |
| 5 or more Children | 0 (0.0%) | 0 (0.0%) |
| Total | 200 (100.0%) | 0 (0.0%) |
Income Below Poverty Among Single-Parent Households in Cobb
| Children | Single Father | Single Mother |
| No Children | 0 (0.0%) | 0 (0.0%) |
| 1 or 2 Children | 0 (0.0%) | 0 (0.0%) |
| 3 or 4 Children | 0 (0.0%) | 0 (0.0%) |
| 5 or more Children | 0 (0.0%) | 0 (0.0%) |
| Total | 0 (0.0%) | 0 (0.0%) |
Income Below Poverty Among Married-Couple vs Single-Parent Households in Cobb
| Children | Married-Couple Families | Single-Parent Households |
| No Children | 0 (0.0%) | 0 (0.0%) |
| 1 or 2 Children | 0 (0.0%) | 0 (0.0%) |
| 3 or 4 Children | 0 (0.0%) | 0 (0.0%) |
| 5 or more Children | 0 (0.0%) | 0 (0.0%) |
| Total | 0 (0.0%) | 0 (0.0%) |
Race in Cobb
The most populous races in Cobb are White / Caucasian (575 | 83.9%), Hawaiian / Pacific (73 | 10.7%), and Hispanic or Latino (37 | 5.4%).
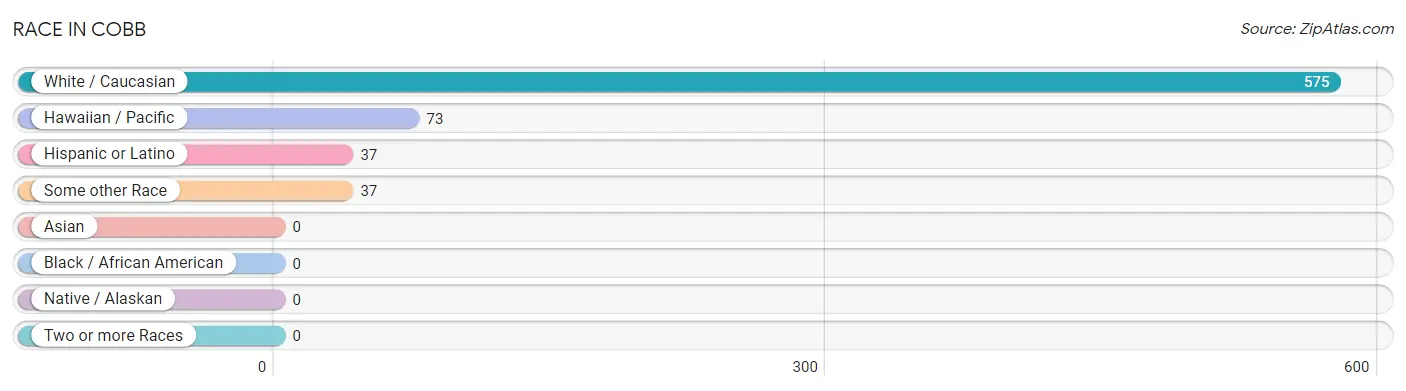
| Race | # Population | % Population |
| Asian | 0 | 0.0% |
| Black / African American | 0 | 0.0% |
| Hawaiian / Pacific | 73 | 10.7% |
| Hispanic or Latino | 37 | 5.4% |
| Native / Alaskan | 0 | 0.0% |
| White / Caucasian | 575 | 83.9% |
| Two or more Races | 0 | 0.0% |
| Some other Race | 37 | 5.4% |
| Total | 685 | 100.0% |
Ancestry in Cobb
The most populous ancestries reported in Cobb are German (121 | 17.7%), Irish (104 | 15.2%), Samoan (73 | 10.7%), French (60 | 8.8%), and Mexican (37 | 5.4%), together accounting for 57.7% of all Cobb residents.
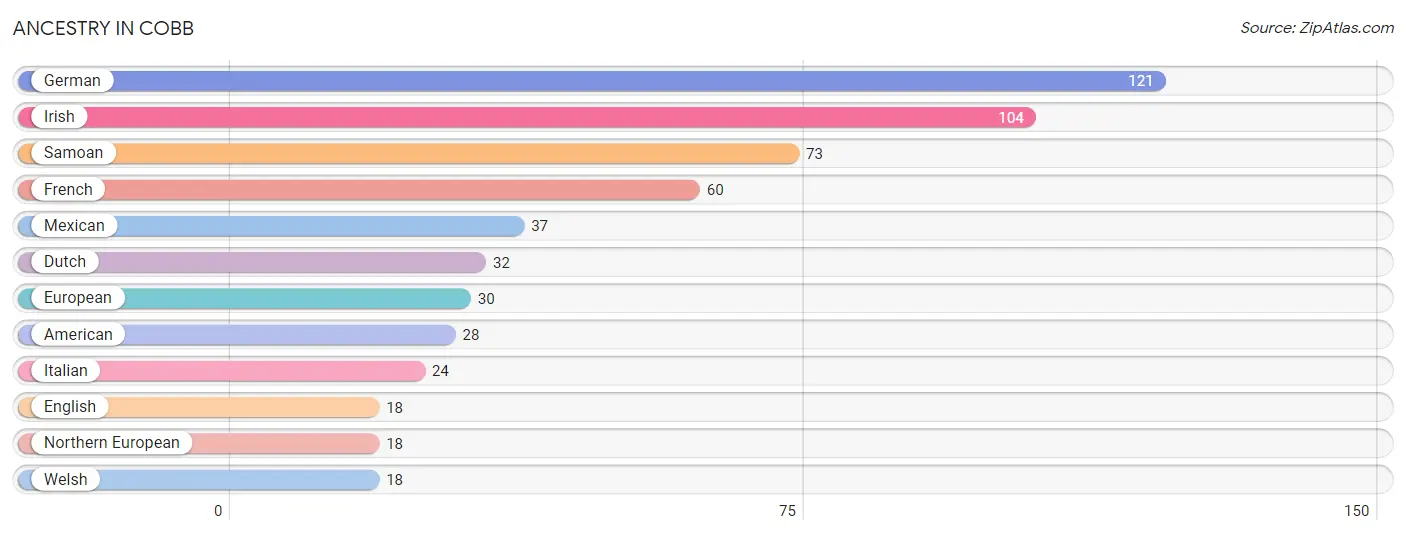
| Ancestry | # Population | % Population |
| American | 28 | 4.1% |
| Dutch | 32 | 4.7% |
| English | 18 | 2.6% |
| European | 30 | 4.4% |
| French | 60 | 8.8% |
| German | 121 | 17.7% |
| Irish | 104 | 15.2% |
| Italian | 24 | 3.5% |
| Mexican | 37 | 5.4% |
| Northern European | 18 | 2.6% |
| Samoan | 73 | 10.7% |
| Welsh | 18 | 2.6% | View All 12 Rows |
Immigrants in Cobb
The most numerous immigrant groups reported in Cobb came from , and Oceania (73 | 10.7%), together accounting for 10.7% of all Cobb residents.

| Immigration Origin | # Population | % Population |
| Oceania | 73 | 10.7% | View All 1 Rows |
Sex and Age in Cobb
Sex and Age in Cobb
The most populous age groups in Cobb are 35 to 39 Years (131 | 27.3%) for men and 70 to 74 Years (65 | 31.7%) for women.
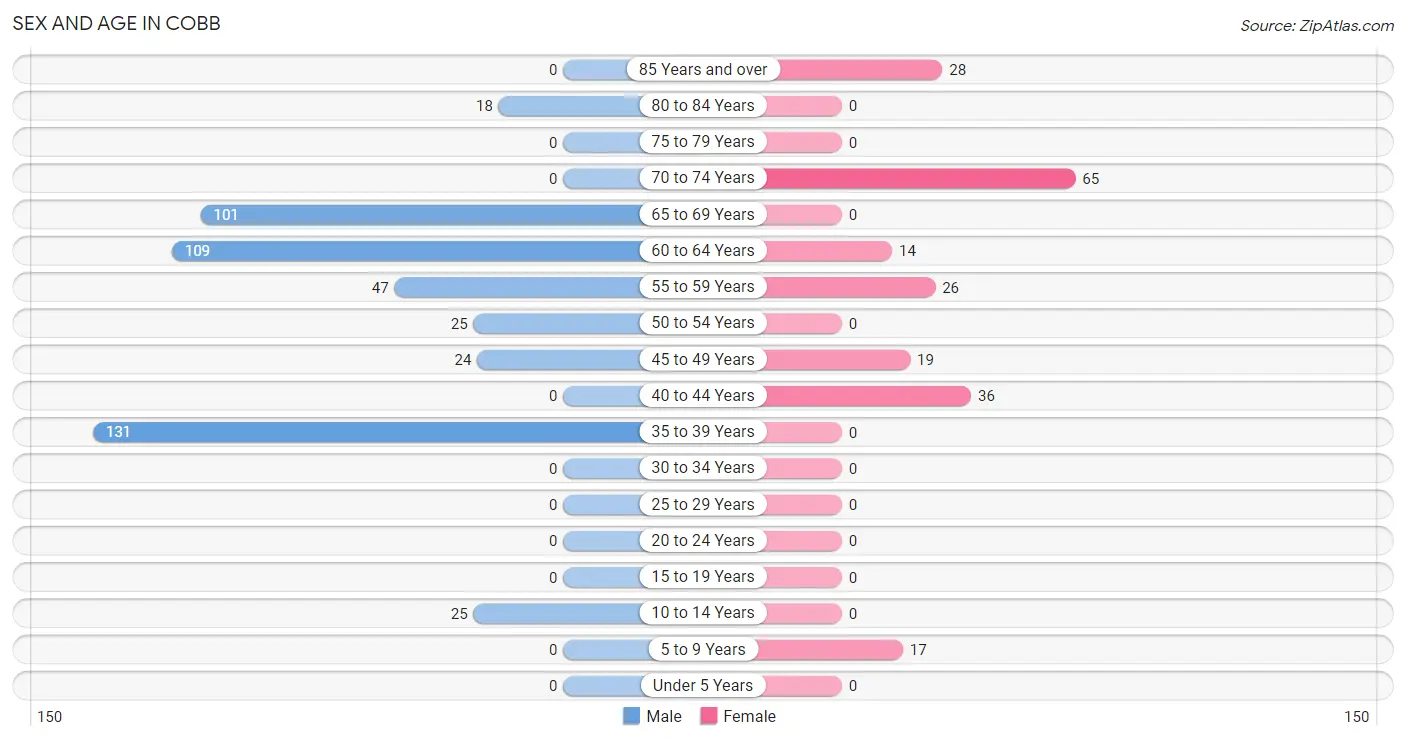
| Age Bracket | Male | Female |
| Under 5 Years | 0 (0.0%) | 0 (0.0%) |
| 5 to 9 Years | 0 (0.0%) | 17 (8.3%) |
| 10 to 14 Years | 25 (5.2%) | 0 (0.0%) |
| 15 to 19 Years | 0 (0.0%) | 0 (0.0%) |
| 20 to 24 Years | 0 (0.0%) | 0 (0.0%) |
| 25 to 29 Years | 0 (0.0%) | 0 (0.0%) |
| 30 to 34 Years | 0 (0.0%) | 0 (0.0%) |
| 35 to 39 Years | 131 (27.3%) | 0 (0.0%) |
| 40 to 44 Years | 0 (0.0%) | 36 (17.6%) |
| 45 to 49 Years | 24 (5.0%) | 19 (9.3%) |
| 50 to 54 Years | 25 (5.2%) | 0 (0.0%) |
| 55 to 59 Years | 47 (9.8%) | 26 (12.7%) |
| 60 to 64 Years | 109 (22.7%) | 14 (6.8%) |
| 65 to 69 Years | 101 (21.0%) | 0 (0.0%) |
| 70 to 74 Years | 0 (0.0%) | 65 (31.7%) |
| 75 to 79 Years | 0 (0.0%) | 0 (0.0%) |
| 80 to 84 Years | 18 (3.7%) | 0 (0.0%) |
| 85 Years and over | 0 (0.0%) | 28 (13.7%) |
| Total | 480 (100.0%) | 205 (100.0%) |
Families and Households in Cobb
Median Family Size in Cobb
The median family size in Cobb is 2.16 persons per family, with single male/father families (18 | 7.3%) accounting for the largest median family size of 3.33 persons per family. On the other hand, married-couple families (200 | 81.3%) represent the smallest median family size with 2.04 persons per family.
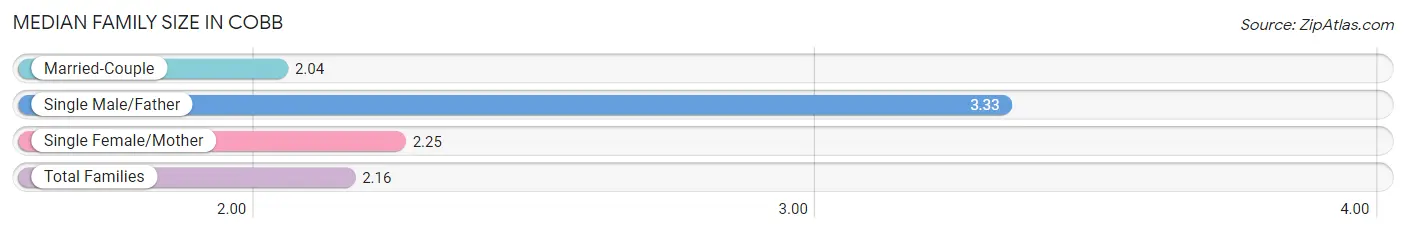
| Family Type | # Families | Family Size |
| Married-Couple | 200 (81.3%) | 2.04 |
| Single Male/Father | 18 (7.3%) | 3.33 |
| Single Female/Mother | 28 (11.4%) | 2.25 |
| Total Families | 246 (100.0%) | 2.16 |
Median Household Size in Cobb
The median household size in Cobb is 1.80 persons per household, with single male/father households (18 | 4.7%) accounting for the largest median household size of 3.33 persons per household. non-family households (135 | 35.4%) represent the smallest median household size with 1.14 persons per household.
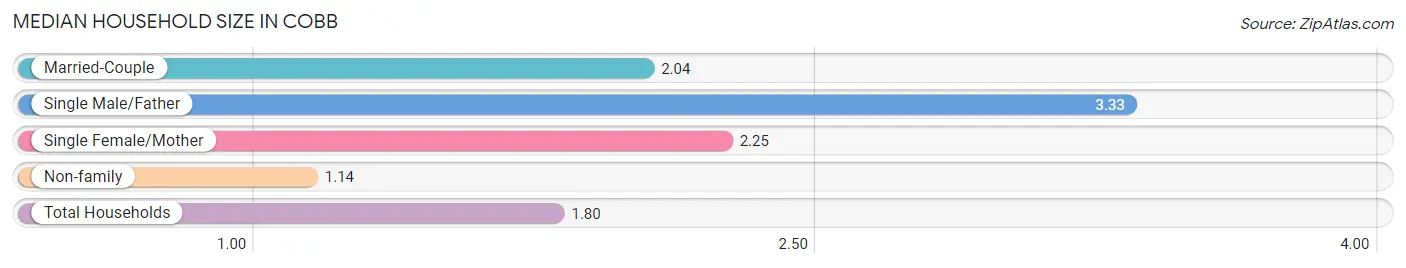
| Household Type | # Households | Household Size |
| Married-Couple | 200 (52.5%) | 2.04 |
| Single Male/Father | 18 (4.7%) | 3.33 |
| Single Female/Mother | 28 (7.3%) | 2.25 |
| Non-family | 135 (35.4%) | 1.14 |
| Total Households | 381 (100.0%) | 1.80 |
Household Size by Marriage Status in Cobb
Out of a total of 381 households in Cobb, 246 (64.6%) are family households, while 135 (35.4%) are nonfamily households. The most numerous type of family households are 2-person households, comprising 228, and the most common type of nonfamily households are 1-person households, comprising 111.
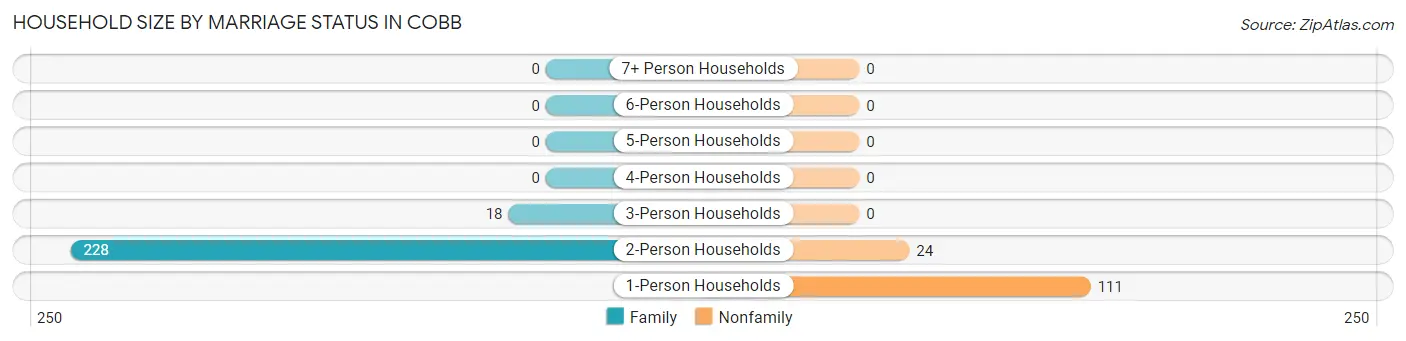
| Household Size | Family Households | Nonfamily Households |
| 1-Person Households | - | 111 (29.1%) |
| 2-Person Households | 228 (59.8%) | 24 (6.3%) |
| 3-Person Households | 18 (4.7%) | 0 (0.0%) |
| 4-Person Households | 0 (0.0%) | 0 (0.0%) |
| 5-Person Households | 0 (0.0%) | 0 (0.0%) |
| 6-Person Households | 0 (0.0%) | 0 (0.0%) |
| 7+ Person Households | 0 (0.0%) | 0 (0.0%) |
| Total | 246 (64.6%) | 135 (35.4%) |
Female Fertility in Cobb
Fertility by Age in Cobb
| Age Bracket | Women with Births | Births / 1,000 Women |
| 15 to 19 years | 0 (0.0%) | 0.0 |
| 20 to 34 years | 0 (0.0%) | 0.0 |
| 35 to 50 years | 0 (0.0%) | 0.0 |
| Total | 0 (0.0%) | 0.0 |
Fertility by Age by Marriage Status in Cobb
| Age Bracket | Married | Unmarried |
| 15 to 19 years | 0 (0.0%) | 0 (0.0%) |
| 20 to 34 years | 0 (0.0%) | 0 (0.0%) |
| 35 to 50 years | 0 (0.0%) | 0 (0.0%) |
| Total | 0 (0.0%) | 0 (0.0%) |
Fertility by Education in Cobb
| Educational Attainment | Women with Births | Births / 1,000 Women |
| Less than High School | 0 (0.0%) | 0.0 |
| High School Diploma | 0 (0.0%) | 0.0 |
| College or Associate's Degree | 0 (0.0%) | 0.0 |
| Bachelor's Degree | 0 (0.0%) | 0.0 |
| Graduate Degree | 0 (0.0%) | 0.0 |
| Total | 0 (0.0%) | 0.0 |
Fertility by Education by Marriage Status in Cobb
| Educational Attainment | Married | Unmarried |
| Less than High School | 0 (0.0%) | 0 (0.0%) |
| High School Diploma | 0 (0.0%) | 0 (0.0%) |
| College or Associate's Degree | 0 (0.0%) | 0 (0.0%) |
| Bachelor's Degree | 0 (0.0%) | 0 (0.0%) |
| Graduate Degree | 0 (0.0%) | 0 (0.0%) |
| Total | 0 (0.0%) | 0 (0.0%) |
Employment Characteristics in Cobb
Employment by Class of Employer in Cobb
Among the 291 employed individuals in Cobb, private company employees (152 | 52.2%), not-for-profit organizations (57 | 19.6%), and self-employed (not incorporated) (46 | 15.8%) make up the most common classes of employment.
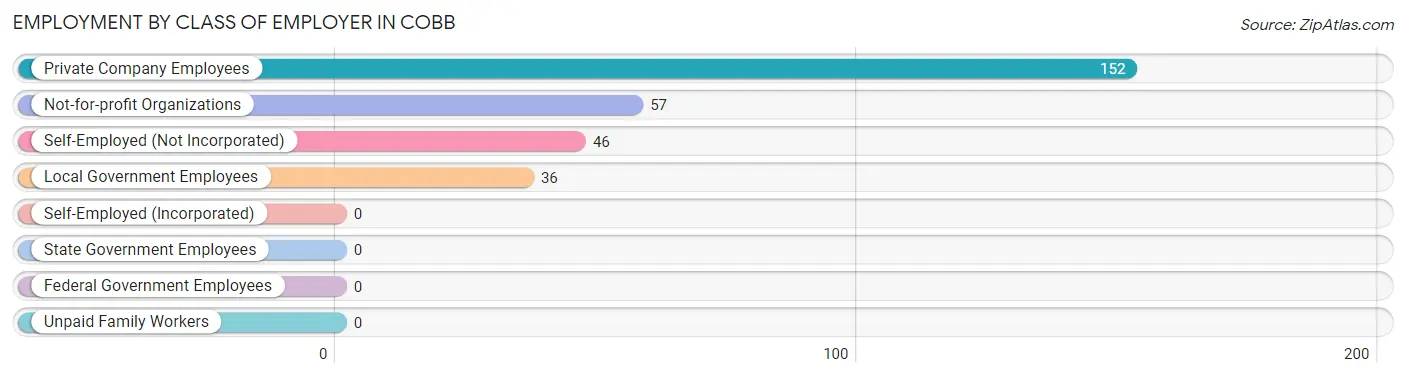
| Employer Class | # Employees | % Employees |
| Private Company Employees | 152 | 52.2% |
| Self-Employed (Incorporated) | 0 | 0.0% |
| Self-Employed (Not Incorporated) | 46 | 15.8% |
| Not-for-profit Organizations | 57 | 19.6% |
| Local Government Employees | 36 | 12.4% |
| State Government Employees | 0 | 0.0% |
| Federal Government Employees | 0 | 0.0% |
| Unpaid Family Workers | 0 | 0.0% |
| Total | 291 | 100.0% |
Employment Status by Age in Cobb
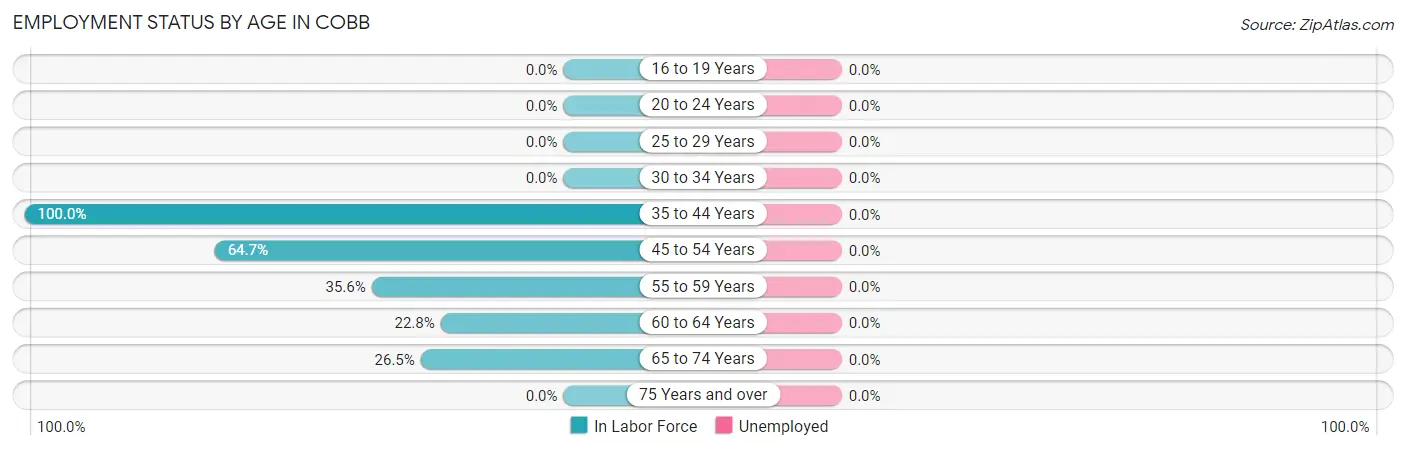
| Age Bracket | In Labor Force | Unemployed |
| 16 to 19 Years | 0 (0.0%) | 0 (0.0%) |
| 20 to 24 Years | 0 (0.0%) | 0 (0.0%) |
| 25 to 29 Years | 0 (0.0%) | 0 (0.0%) |
| 30 to 34 Years | 0 (0.0%) | 0 (0.0%) |
| 35 to 44 Years | 167 (100.0%) | 0 (0.0%) |
| 45 to 54 Years | 44 (64.7%) | 0 (0.0%) |
| 55 to 59 Years | 26 (35.6%) | 0 (0.0%) |
| 60 to 64 Years | 28 (22.8%) | 0 (0.0%) |
| 65 to 74 Years | 44 (26.5%) | 0 (0.0%) |
| 75 Years and over | 0 (0.0%) | 0 (0.0%) |
| Total | 309 (48.1%) | 0 (0.0%) |
Employment Status by Educational Attainment in Cobb
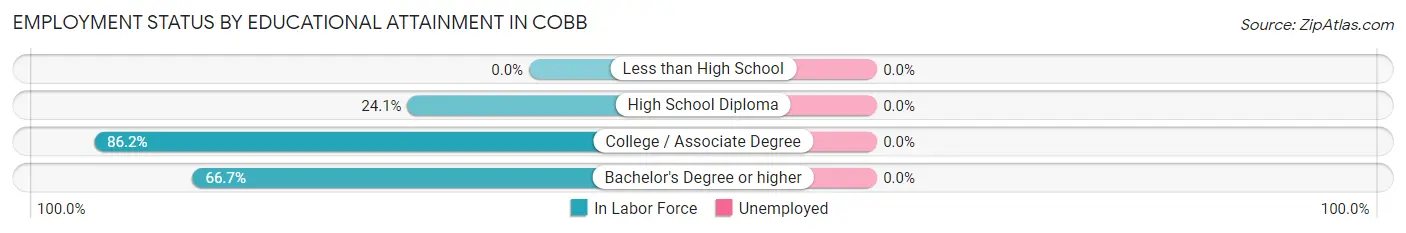
| Educational Attainment | In Labor Force | Unemployed |
| Less than High School | 0 (0.0%) | 0 (0.0%) |
| High School Diploma | 26 (24.1%) | 0 (0.0%) |
| College / Associate Degree | 175 (86.2%) | 0 (0.0%) |
| Bachelor's Degree or higher | 64 (66.7%) | 0 (0.0%) |
| Total | 265 (61.5%) | 0 (0.0%) |
Employment Occupations by Sex in Cobb
Management, Business, Science and Arts Occupations
The most common Management, Business, Science and Arts occupations in Cobb are Management (85 | 27.5%), Community & Social Service (54 | 17.5%), and Education Instruction & Library (54 | 17.5%).
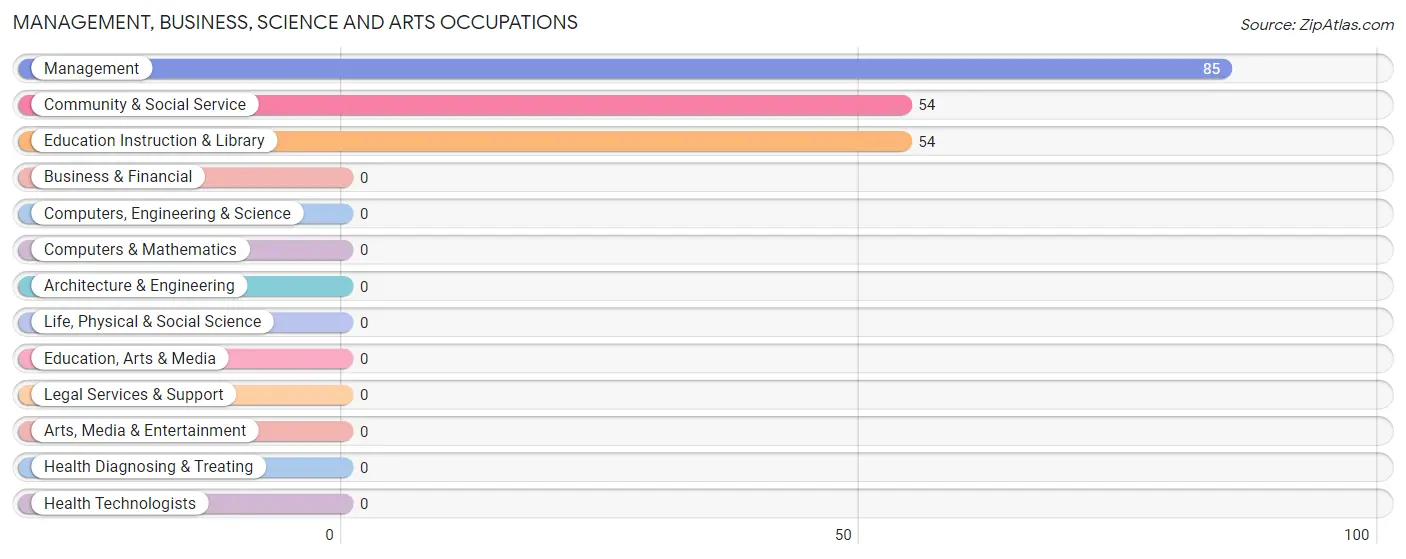
Management, Business, Science and Arts Occupations by Sex
Within the Management, Business, Science and Arts occupations in Cobb, the most male-oriented occupations are Management (100.0%), Community & Social Service (33.3%), and Education Instruction & Library (33.3%), while the most female-oriented occupations are Community & Social Service (66.7%), and Education Instruction & Library (66.7%).
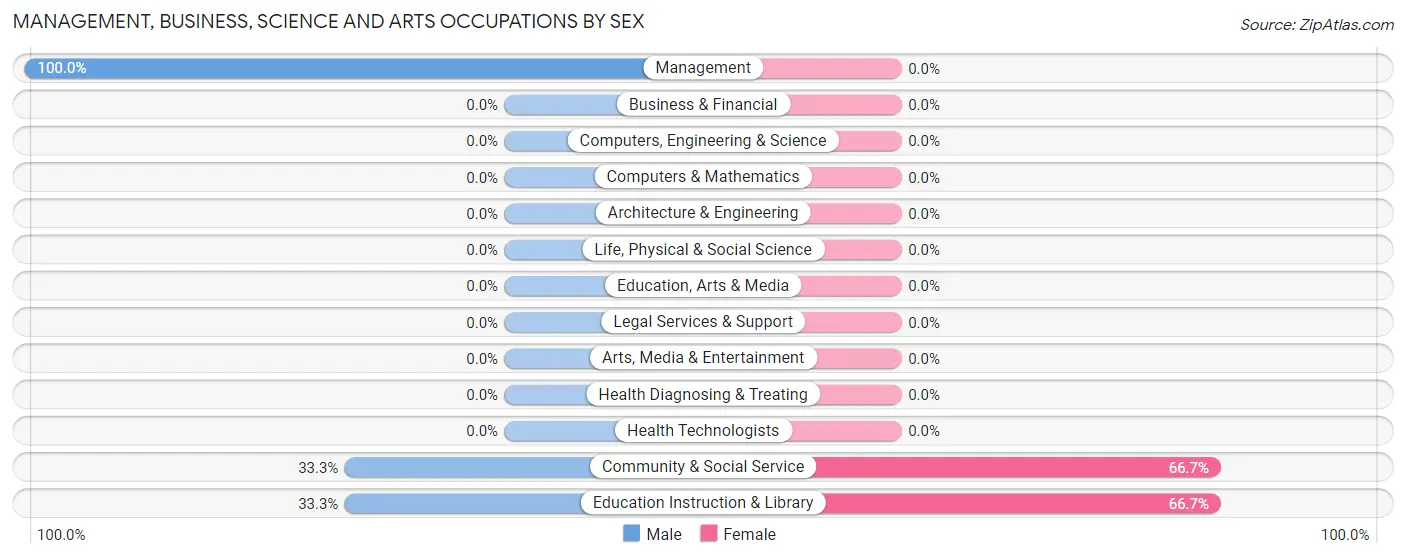
| Occupation | Male | Female |
| Management | 85 (100.0%) | 0 (0.0%) |
| Business & Financial | 0 (0.0%) | 0 (0.0%) |
| Computers, Engineering & Science | 0 (0.0%) | 0 (0.0%) |
| Computers & Mathematics | 0 (0.0%) | 0 (0.0%) |
| Architecture & Engineering | 0 (0.0%) | 0 (0.0%) |
| Life, Physical & Social Science | 0 (0.0%) | 0 (0.0%) |
| Community & Social Service | 18 (33.3%) | 36 (66.7%) |
| Education, Arts & Media | 0 (0.0%) | 0 (0.0%) |
| Legal Services & Support | 0 (0.0%) | 0 (0.0%) |
| Education Instruction & Library | 18 (33.3%) | 36 (66.7%) |
| Arts, Media & Entertainment | 0 (0.0%) | 0 (0.0%) |
| Health Diagnosing & Treating | 0 (0.0%) | 0 (0.0%) |
| Health Technologists | 0 (0.0%) | 0 (0.0%) |
| Total (Category) | 103 (74.1%) | 36 (25.9%) |
| Total (Overall) | 228 (73.8%) | 81 (26.2%) |
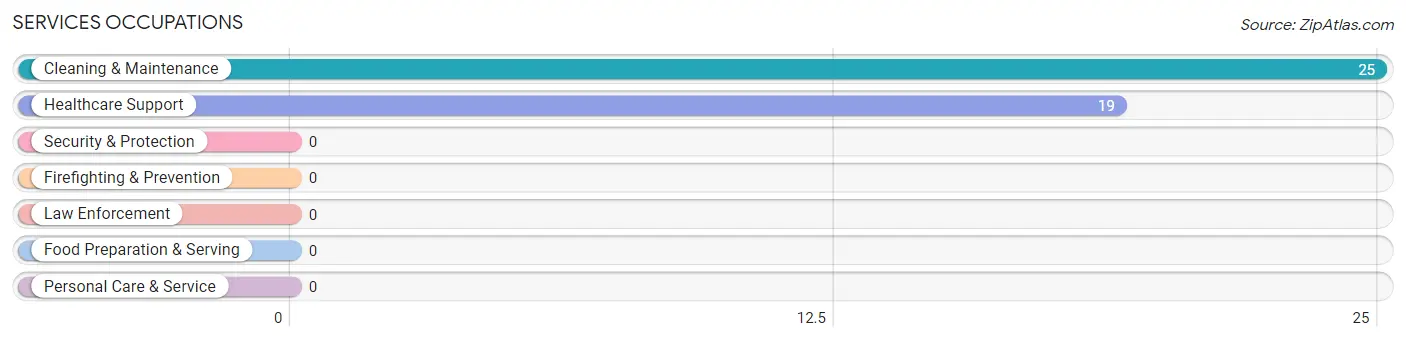
Services Occupations
The most common Services occupations in Cobb are Cleaning & Maintenance (25 | 8.1%), and Healthcare Support (19 | 6.1%).
Services Occupations by Sex
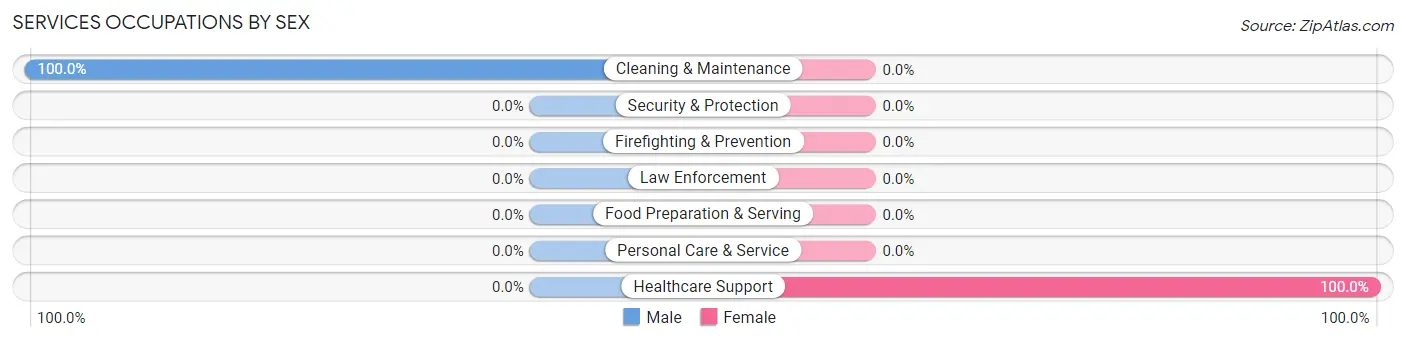
| Occupation | Male | Female |
| Healthcare Support | 0 (0.0%) | 19 (100.0%) |
| Security & Protection | 0 (0.0%) | 0 (0.0%) |
| Firefighting & Prevention | 0 (0.0%) | 0 (0.0%) |
| Law Enforcement | 0 (0.0%) | 0 (0.0%) |
| Food Preparation & Serving | 0 (0.0%) | 0 (0.0%) |
| Cleaning & Maintenance | 25 (100.0%) | 0 (0.0%) |
| Personal Care & Service | 0 (0.0%) | 0 (0.0%) |
| Total (Category) | 25 (56.8%) | 19 (43.2%) |
| Total (Overall) | 228 (73.8%) | 81 (26.2%) |
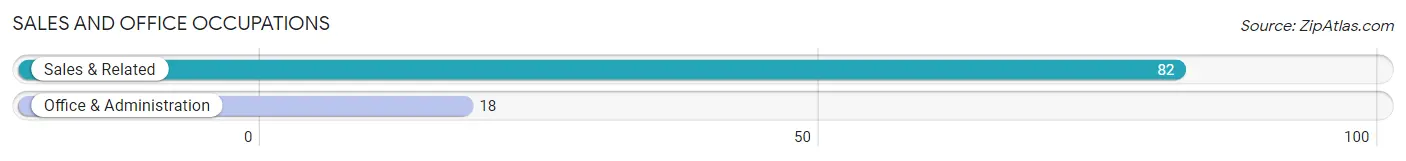
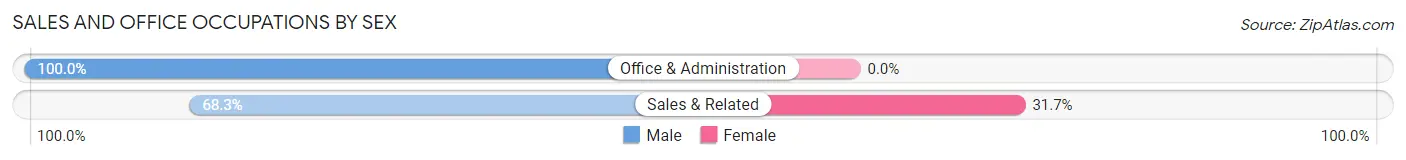
Sales and Office Occupations
The most common Sales and Office occupations in Cobb are Sales & Related (82 | 26.5%), and Office & Administration (18 | 5.8%).
Sales and Office Occupations by Sex
| Occupation | Male | Female |
| Sales & Related | 56 (68.3%) | 26 (31.7%) |
| Office & Administration | 18 (100.0%) | 0 (0.0%) |
| Total (Category) | 74 (74.0%) | 26 (26.0%) |
| Total (Overall) | 228 (73.8%) | 81 (26.2%) |
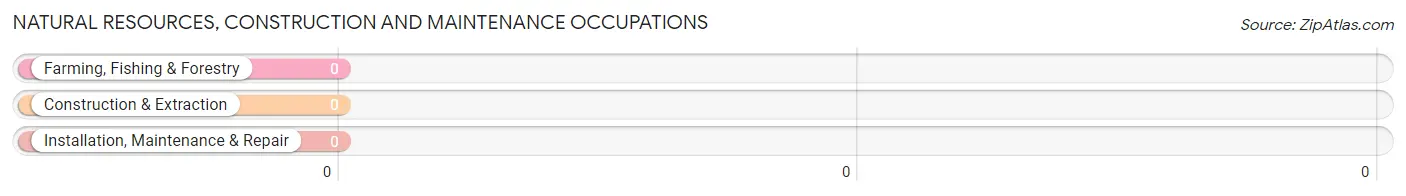
Natural Resources, Construction and Maintenance Occupations
Natural Resources, Construction and Maintenance Occupations by Sex
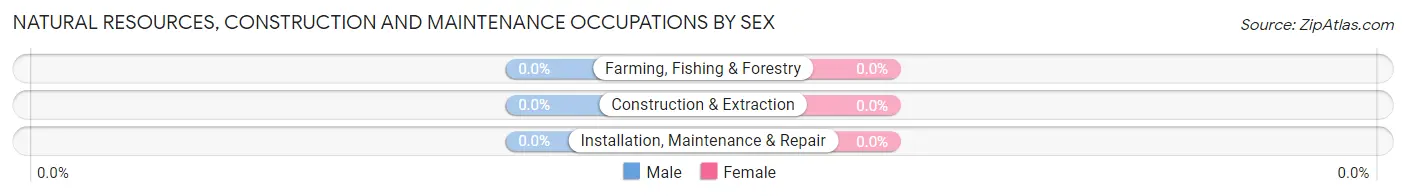
| Occupation | Male | Female |
| Farming, Fishing & Forestry | 0 (0.0%) | 0 (0.0%) |
| Construction & Extraction | 0 (0.0%) | 0 (0.0%) |
| Installation, Maintenance & Repair | 0 (0.0%) | 0 (0.0%) |
| Total (Category) | 0 (0.0%) | 0 (0.0%) |
| Total (Overall) | 228 (73.8%) | 81 (26.2%) |
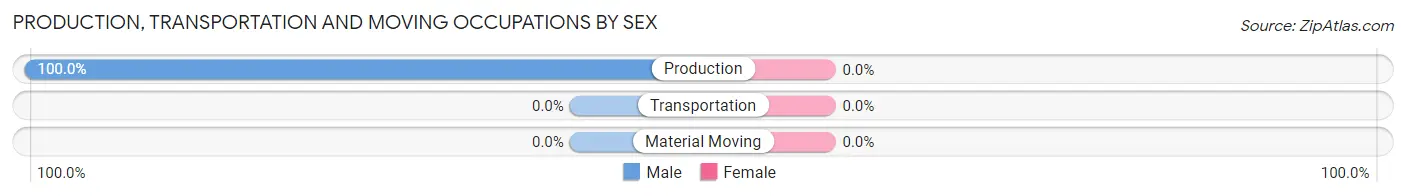
Production, Transportation and Moving Occupations
The most common Production, Transportation and Moving occupations in Cobb are , and Production (26 | 8.4%).
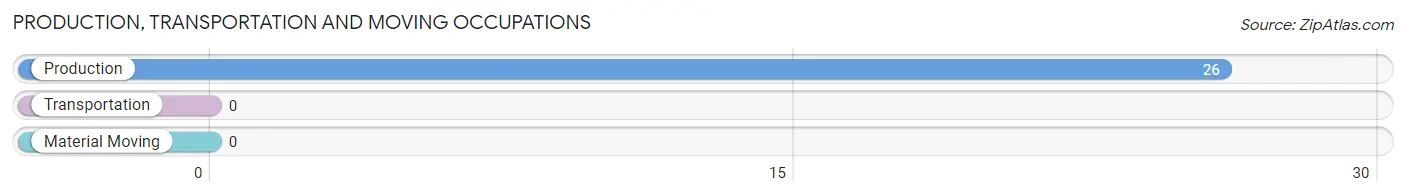
Production, Transportation and Moving Occupations by Sex
| Occupation | Male | Female |
| Production | 26 (100.0%) | 0 (0.0%) |
| Transportation | 0 (0.0%) | 0 (0.0%) |
| Material Moving | 0 (0.0%) | 0 (0.0%) |
| Total (Category) | 26 (100.0%) | 0 (0.0%) |
| Total (Overall) | 228 (73.8%) | 81 (26.2%) |
Employment Industries by Sex in Cobb
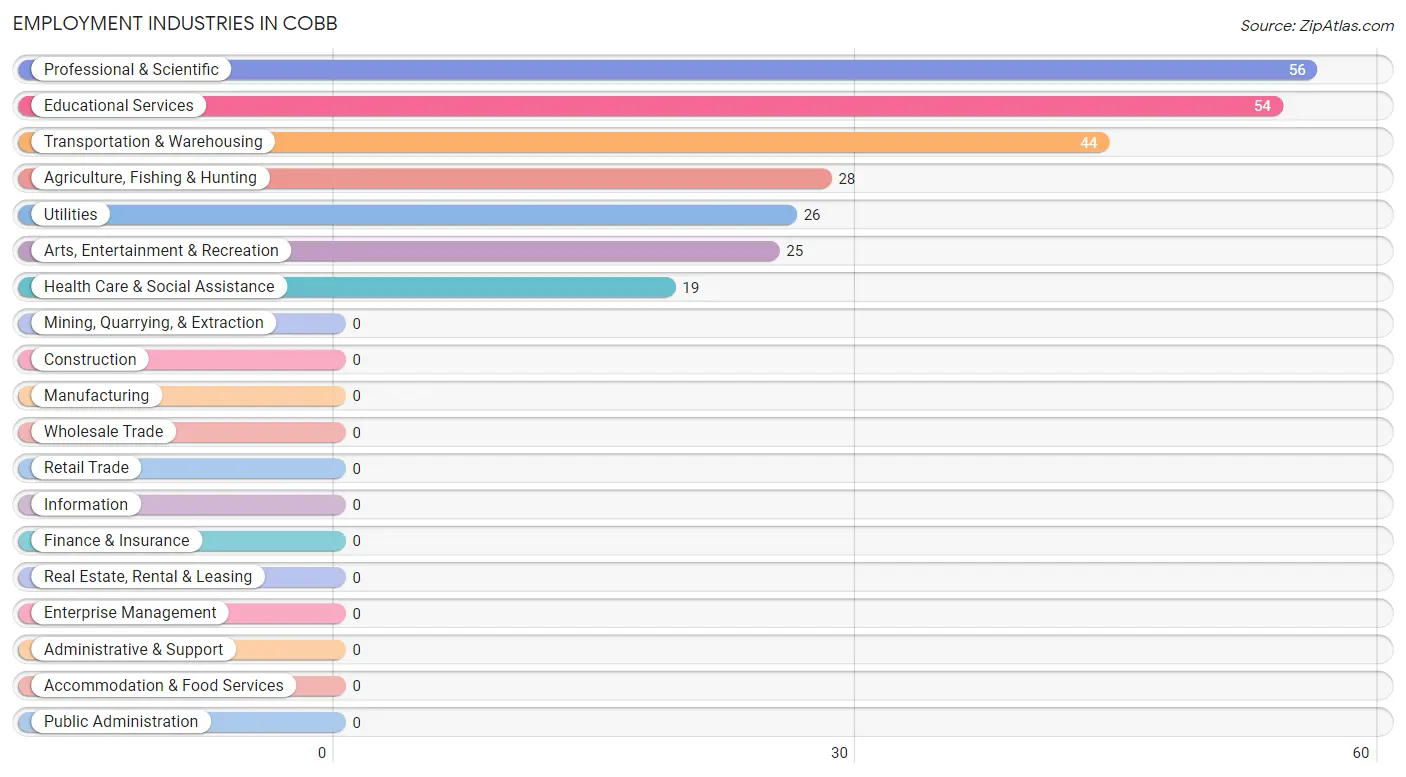
Employment Industries in Cobb
The major employment industries in Cobb include Professional & Scientific (56 | 18.1%), Educational Services (54 | 17.5%), Transportation & Warehousing (44 | 14.2%), Agriculture, Fishing & Hunting (28 | 9.1%), and Utilities (26 | 8.4%).
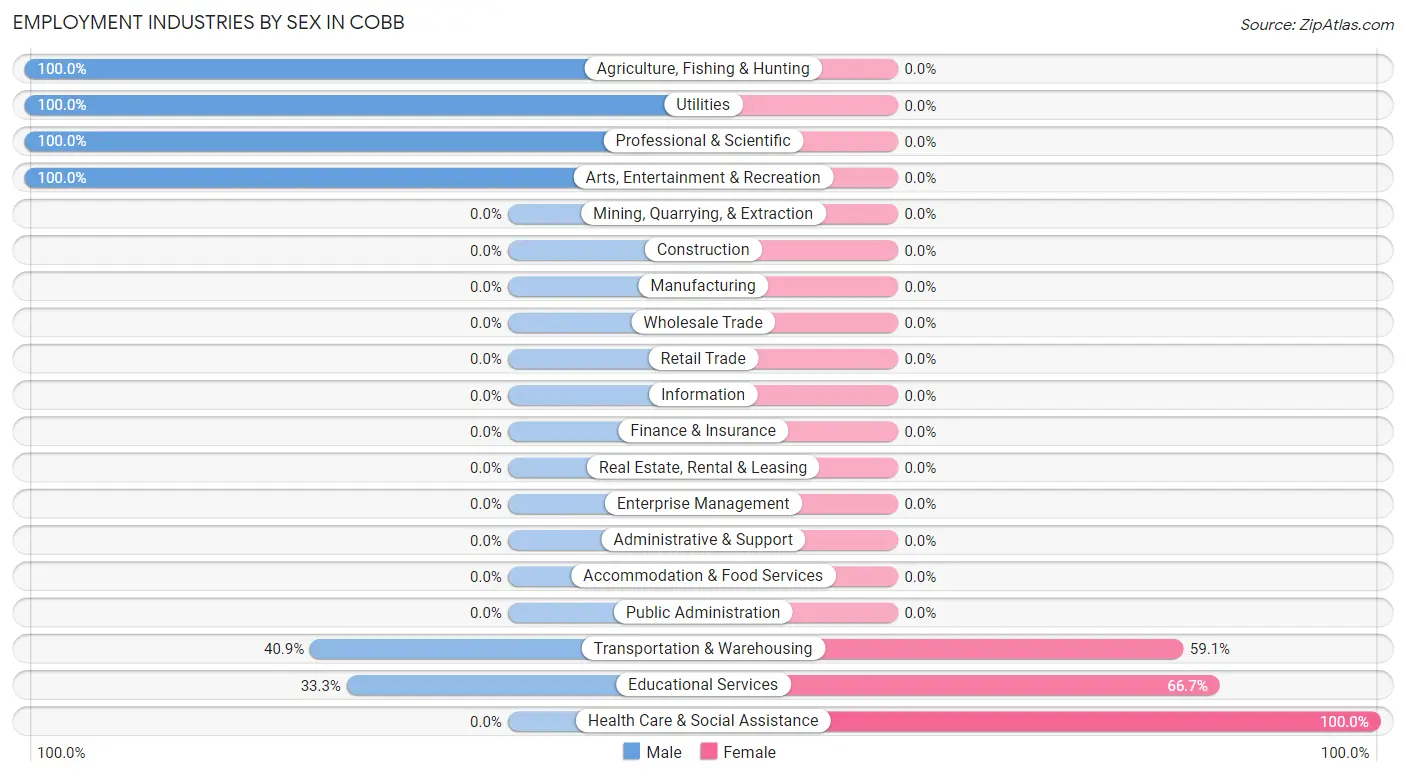
Employment Industries by Sex in Cobb
The Cobb industries that see more men than women are Agriculture, Fishing & Hunting (100.0%), Utilities (100.0%), and Professional & Scientific (100.0%), whereas the industries that tend to have a higher number of women are Health Care & Social Assistance (100.0%), Educational Services (66.7%), and Transportation & Warehousing (59.1%).
| Industry | Male | Female |
| Agriculture, Fishing & Hunting | 28 (100.0%) | 0 (0.0%) |
| Mining, Quarrying, & Extraction | 0 (0.0%) | 0 (0.0%) |
| Construction | 0 (0.0%) | 0 (0.0%) |
| Manufacturing | 0 (0.0%) | 0 (0.0%) |
| Wholesale Trade | 0 (0.0%) | 0 (0.0%) |
| Retail Trade | 0 (0.0%) | 0 (0.0%) |
| Transportation & Warehousing | 18 (40.9%) | 26 (59.1%) |
| Utilities | 26 (100.0%) | 0 (0.0%) |
| Information | 0 (0.0%) | 0 (0.0%) |
| Finance & Insurance | 0 (0.0%) | 0 (0.0%) |
| Real Estate, Rental & Leasing | 0 (0.0%) | 0 (0.0%) |
| Professional & Scientific | 56 (100.0%) | 0 (0.0%) |
| Enterprise Management | 0 (0.0%) | 0 (0.0%) |
| Administrative & Support | 0 (0.0%) | 0 (0.0%) |
| Educational Services | 18 (33.3%) | 36 (66.7%) |
| Health Care & Social Assistance | 0 (0.0%) | 19 (100.0%) |
| Arts, Entertainment & Recreation | 25 (100.0%) | 0 (0.0%) |
| Accommodation & Food Services | 0 (0.0%) | 0 (0.0%) |
| Public Administration | 0 (0.0%) | 0 (0.0%) |
| Total | 228 (73.8%) | 81 (26.2%) |
Education in Cobb
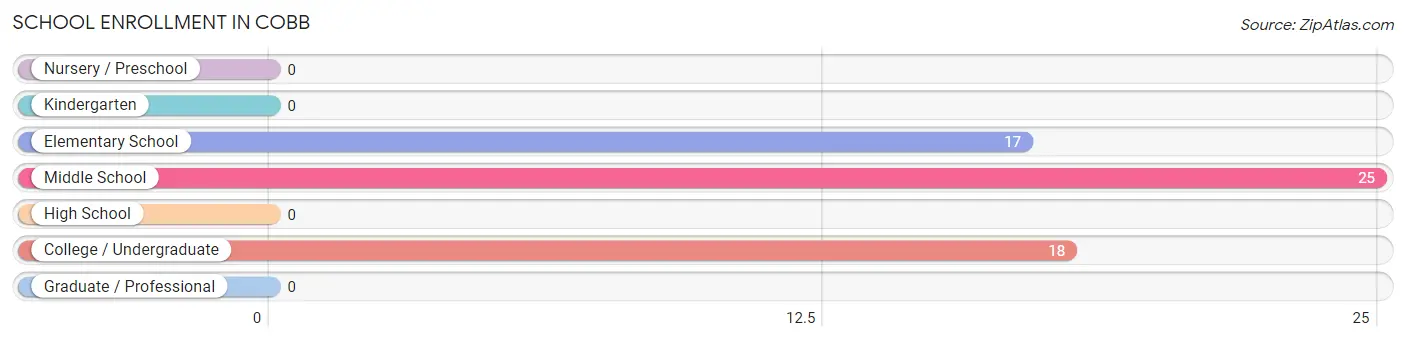
School Enrollment in Cobb
The most common levels of schooling among the 60 students in Cobb are middle school (25 | 41.7%), college / undergraduate (18 | 30.0%), and elementary school (17 | 28.3%).
| School Level | # Students | % Students |
| Nursery / Preschool | 0 | 0.0% |
| Kindergarten | 0 | 0.0% |
| Elementary School | 17 | 28.3% |
| Middle School | 25 | 41.7% |
| High School | 0 | 0.0% |
| College / Undergraduate | 18 | 30.0% |
| Graduate / Professional | 0 | 0.0% |
| Total | 60 | 100.0% |
School Enrollment by Age by Funding Source in Cobb
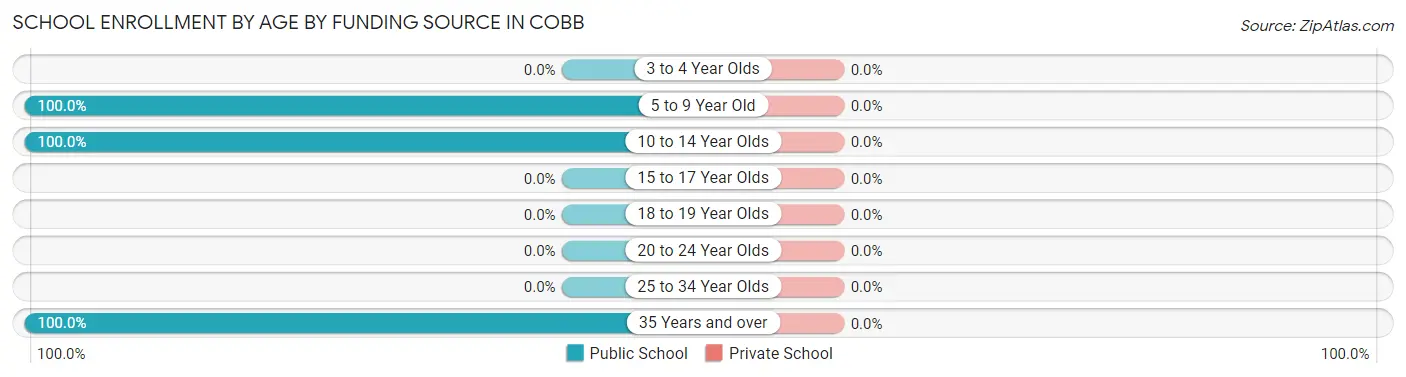
| Age Bracket | Public School | Private School |
| 3 to 4 Year Olds | 0 (0.0%) | 0 (0.0%) |
| 5 to 9 Year Old | 17 (100.0%) | 0 (0.0%) |
| 10 to 14 Year Olds | 25 (100.0%) | 0 (0.0%) |
| 15 to 17 Year Olds | 0 (0.0%) | 0 (0.0%) |
| 18 to 19 Year Olds | 0 (0.0%) | 0 (0.0%) |
| 20 to 24 Year Olds | 0 (0.0%) | 0 (0.0%) |
| 25 to 34 Year Olds | 0 (0.0%) | 0 (0.0%) |
| 35 Years and over | 18 (100.0%) | 0 (0.0%) |
| Total | 60 (100.0%) | 0 (0.0%) |
Educational Attainment by Field of Study in Cobb
Education (50 | 24.5%), literature & languages (36 | 17.6%), psychology (28 | 13.7%), computers & mathematics (27 | 13.2%), and science & technology (27 | 13.2%) are the most common fields of study among 204 individuals in Cobb who have obtained a bachelor's degree or higher.
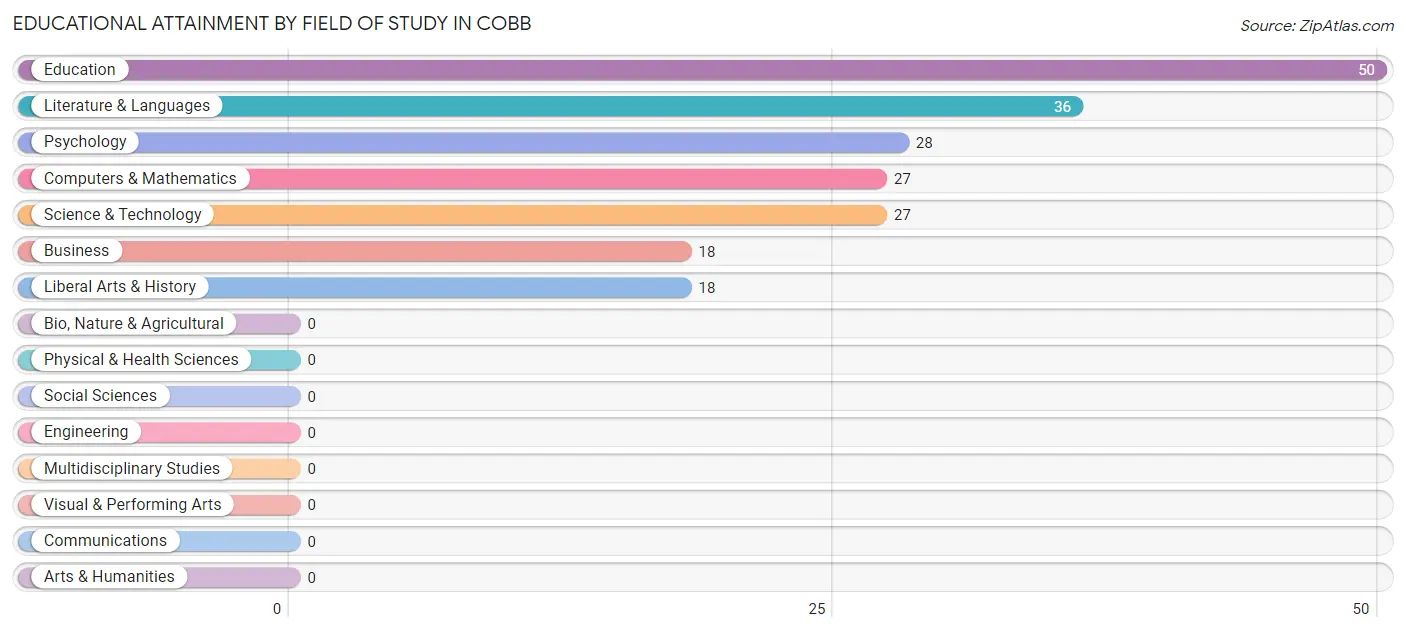
| Field of Study | # Graduates | % Graduates |
| Computers & Mathematics | 27 | 13.2% |
| Bio, Nature & Agricultural | 0 | 0.0% |
| Physical & Health Sciences | 0 | 0.0% |
| Psychology | 28 | 13.7% |
| Social Sciences | 0 | 0.0% |
| Engineering | 0 | 0.0% |
| Multidisciplinary Studies | 0 | 0.0% |
| Science & Technology | 27 | 13.2% |
| Business | 18 | 8.8% |
| Education | 50 | 24.5% |
| Literature & Languages | 36 | 17.6% |
| Liberal Arts & History | 18 | 8.8% |
| Visual & Performing Arts | 0 | 0.0% |
| Communications | 0 | 0.0% |
| Arts & Humanities | 0 | 0.0% |
| Total | 204 | 100.0% |
Transportation & Commute in Cobb
Vehicle Availability by Sex in Cobb
The most prevalent vehicle ownership categories in Cobb are males with 2 vehicles (166, accounting for 79.0%) and females with 2 vehicles (36, making up 204.9%).
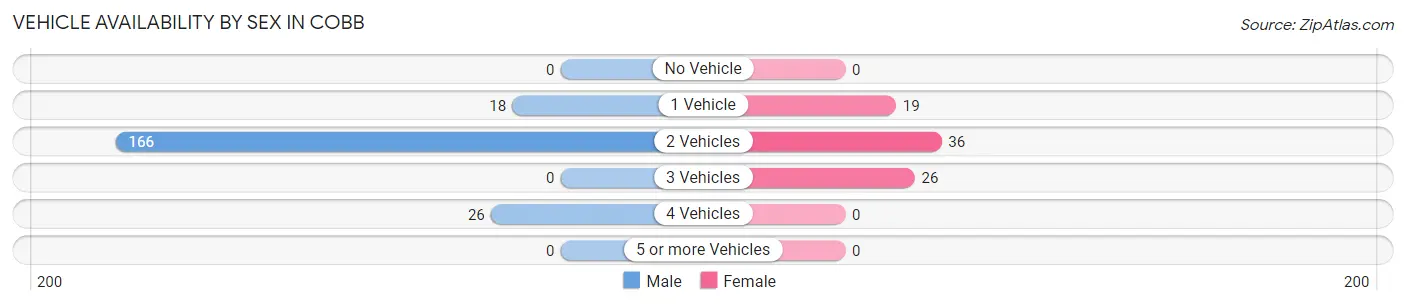
| Vehicles Available | Male | Female |
| No Vehicle | 0 (0.0%) | 0 (0.0%) |
| 1 Vehicle | 18 (8.6%) | 19 (23.5%) |
| 2 Vehicles | 166 (79.0%) | 36 (44.4%) |
| 3 Vehicles | 0 (0.0%) | 26 (32.1%) |
| 4 Vehicles | 26 (12.4%) | 0 (0.0%) |
| 5 or more Vehicles | 0 (0.0%) | 0 (0.0%) |
| Total | 210 (100.0%) | 81 (100.0%) |
Commute Time in Cobb
The most frequently occuring commute durations in Cobb are 90 or more minutes (113 commuters, 43.0%), 20 to 24 minutes (81 commuters, 30.8%), and 35 to 39 minutes (26 commuters, 9.9%).
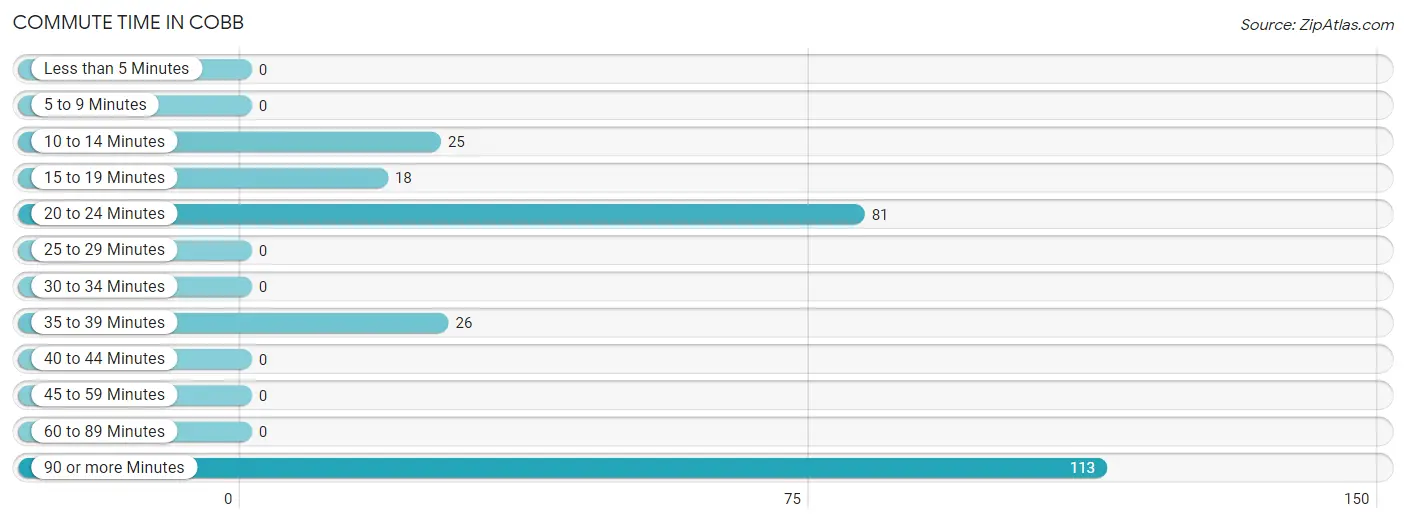
| Commute Time | # Commuters | % Commuters |
| Less than 5 Minutes | 0 | 0.0% |
| 5 to 9 Minutes | 0 | 0.0% |
| 10 to 14 Minutes | 25 | 9.5% |
| 15 to 19 Minutes | 18 | 6.8% |
| 20 to 24 Minutes | 81 | 30.8% |
| 25 to 29 Minutes | 0 | 0.0% |
| 30 to 34 Minutes | 0 | 0.0% |
| 35 to 39 Minutes | 26 | 9.9% |
| 40 to 44 Minutes | 0 | 0.0% |
| 45 to 59 Minutes | 0 | 0.0% |
| 60 to 89 Minutes | 0 | 0.0% |
| 90 or more Minutes | 113 | 43.0% |
Commute Time by Sex in Cobb
The most common commute times in Cobb are 90 or more minutes (113 commuters, 62.1%) for males and 20 to 24 minutes (55 commuters, 67.9%) for females.
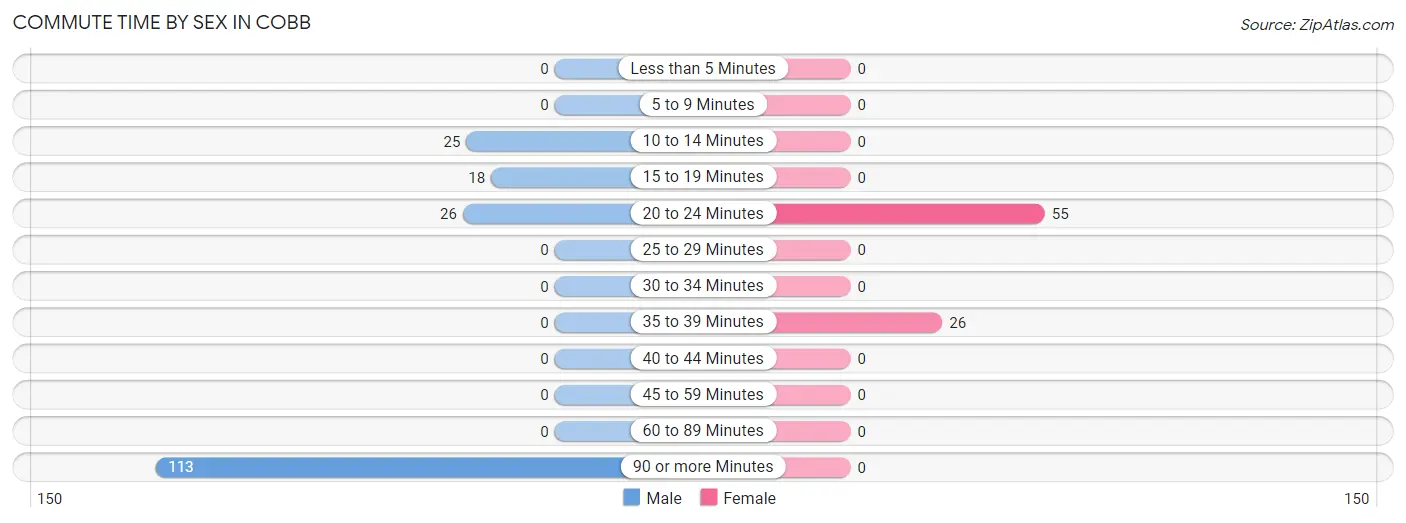
| Commute Time | Male | Female |
| Less than 5 Minutes | 0 (0.0%) | 0 (0.0%) |
| 5 to 9 Minutes | 0 (0.0%) | 0 (0.0%) |
| 10 to 14 Minutes | 25 (13.7%) | 0 (0.0%) |
| 15 to 19 Minutes | 18 (9.9%) | 0 (0.0%) |
| 20 to 24 Minutes | 26 (14.3%) | 55 (67.9%) |
| 25 to 29 Minutes | 0 (0.0%) | 0 (0.0%) |
| 30 to 34 Minutes | 0 (0.0%) | 0 (0.0%) |
| 35 to 39 Minutes | 0 (0.0%) | 26 (32.1%) |
| 40 to 44 Minutes | 0 (0.0%) | 0 (0.0%) |
| 45 to 59 Minutes | 0 (0.0%) | 0 (0.0%) |
| 60 to 89 Minutes | 0 (0.0%) | 0 (0.0%) |
| 90 or more Minutes | 113 (62.1%) | 0 (0.0%) |
Time of Departure to Work by Sex in Cobb
The most frequent times of departure to work in Cobb are 5:00 AM to 5:29 AM (164, 90.1%) for males and 7:00 AM to 7:29 AM (36, 44.4%) for females.
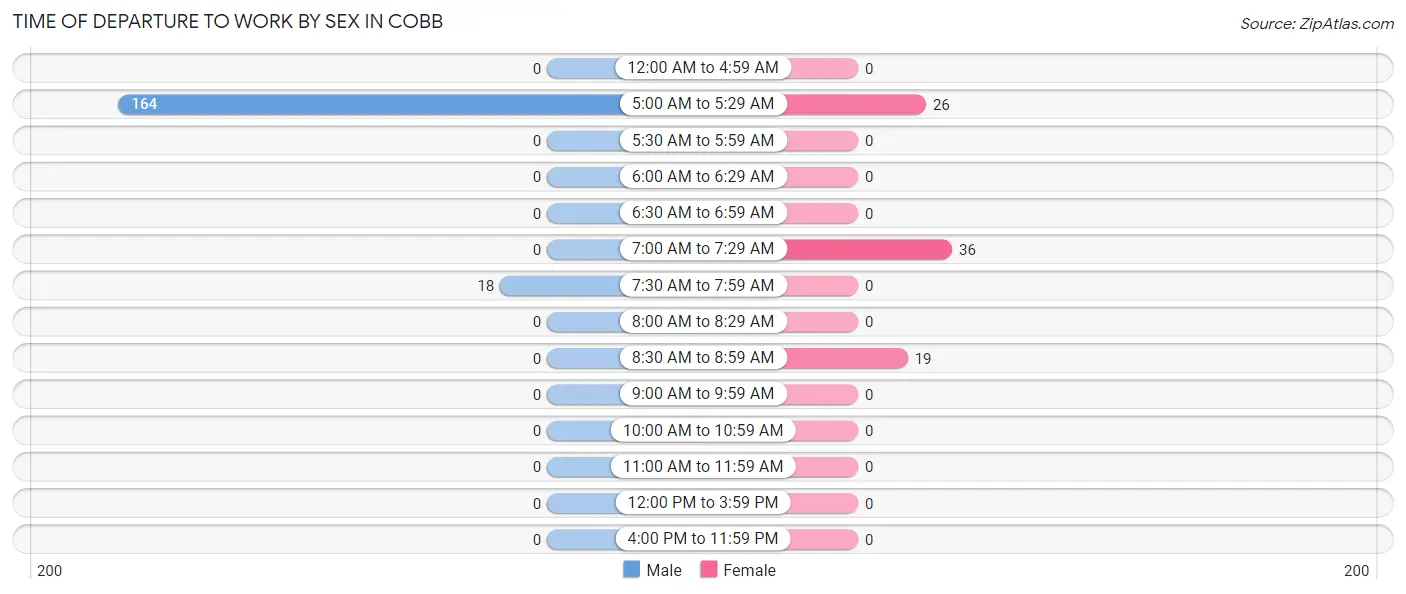
| Time of Departure | Male | Female |
| 12:00 AM to 4:59 AM | 0 (0.0%) | 0 (0.0%) |
| 5:00 AM to 5:29 AM | 164 (90.1%) | 26 (32.1%) |
| 5:30 AM to 5:59 AM | 0 (0.0%) | 0 (0.0%) |
| 6:00 AM to 6:29 AM | 0 (0.0%) | 0 (0.0%) |
| 6:30 AM to 6:59 AM | 0 (0.0%) | 0 (0.0%) |
| 7:00 AM to 7:29 AM | 0 (0.0%) | 36 (44.4%) |
| 7:30 AM to 7:59 AM | 18 (9.9%) | 0 (0.0%) |
| 8:00 AM to 8:29 AM | 0 (0.0%) | 0 (0.0%) |
| 8:30 AM to 8:59 AM | 0 (0.0%) | 19 (23.5%) |
| 9:00 AM to 9:59 AM | 0 (0.0%) | 0 (0.0%) |
| 10:00 AM to 10:59 AM | 0 (0.0%) | 0 (0.0%) |
| 11:00 AM to 11:59 AM | 0 (0.0%) | 0 (0.0%) |
| 12:00 PM to 3:59 PM | 0 (0.0%) | 0 (0.0%) |
| 4:00 PM to 11:59 PM | 0 (0.0%) | 0 (0.0%) |
| Total | 182 (100.0%) | 81 (100.0%) |
Housing Occupancy in Cobb
Occupancy by Ownership in Cobb
Of the total 381 dwellings in Cobb, owner-occupied units account for 309 (81.1%), while renter-occupied units make up 72 (18.9%).
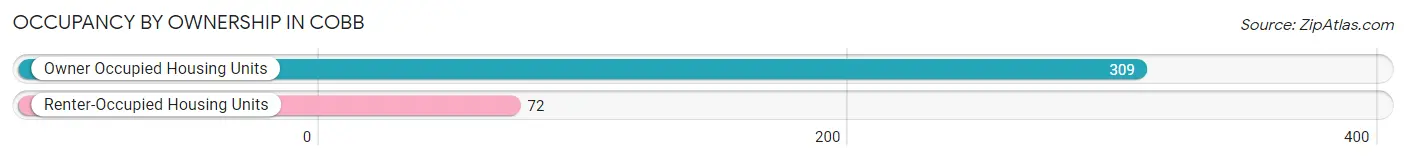
| Occupancy | # Housing Units | % Housing Units |
| Owner Occupied Housing Units | 309 | 81.1% |
| Renter-Occupied Housing Units | 72 | 18.9% |
| Total Occupied Housing Units | 381 | 100.0% |
Occupancy by Household Size in Cobb
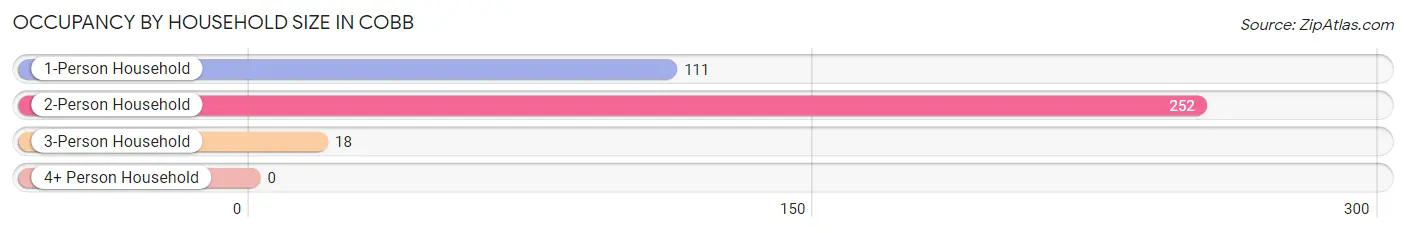
| Household Size | # Housing Units | % Housing Units |
| 1-Person Household | 111 | 29.1% |
| 2-Person Household | 252 | 66.1% |
| 3-Person Household | 18 | 4.7% |
| 4+ Person Household | 0 | 0.0% |
| Total Housing Units | 381 | 100.0% |
Occupancy by Ownership by Household Size in Cobb
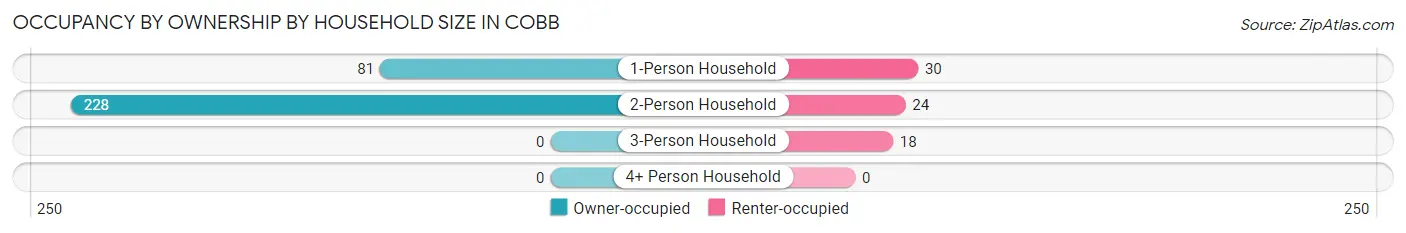
| Household Size | Owner-occupied | Renter-occupied |
| 1-Person Household | 81 (73.0%) | 30 (27.0%) |
| 2-Person Household | 228 (90.5%) | 24 (9.5%) |
| 3-Person Household | 0 (0.0%) | 18 (100.0%) |
| 4+ Person Household | 0 (0.0%) | 0 (0.0%) |
| Total Housing Units | 309 (81.1%) | 72 (18.9%) |
Occupancy by Educational Attainment in Cobb
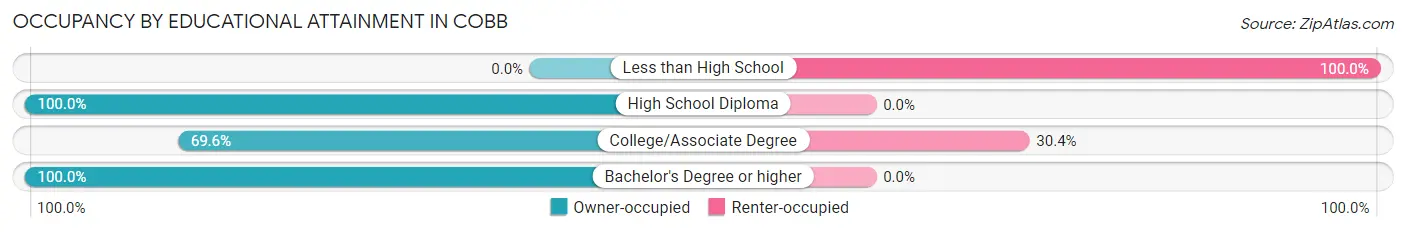
| Household Size | Owner-occupied | Renter-occupied |
| Less than High School | 0 (0.0%) | 24 (100.0%) |
| High School Diploma | 54 (100.0%) | 0 (0.0%) |
| College/Associate Degree | 110 (69.6%) | 48 (30.4%) |
| Bachelor's Degree or higher | 145 (100.0%) | 0 (0.0%) |
Occupancy by Age of Householder in Cobb
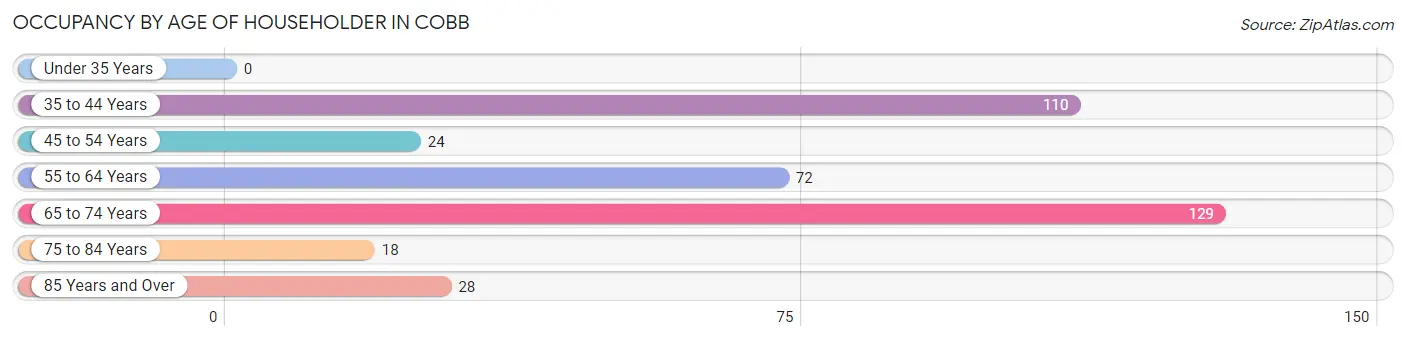
| Age Bracket | # Households | % Households |
| Under 35 Years | 0 | 0.0% |
| 35 to 44 Years | 110 | 28.9% |
| 45 to 54 Years | 24 | 6.3% |
| 55 to 64 Years | 72 | 18.9% |
| 65 to 74 Years | 129 | 33.9% |
| 75 to 84 Years | 18 | 4.7% |
| 85 Years and Over | 28 | 7.3% |
| Total | 381 | 100.0% |
Housing Finances in Cobb
Median Income by Occupancy in Cobb
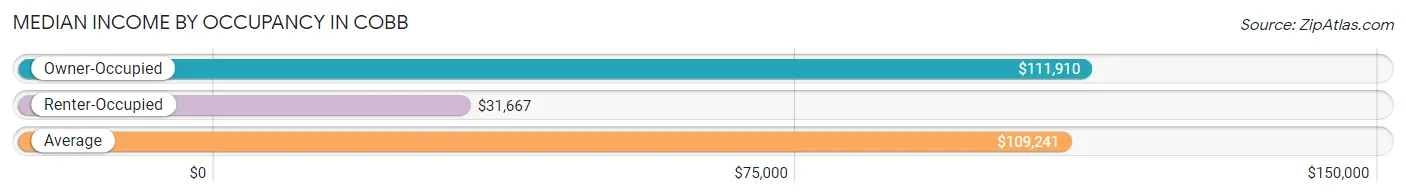
| Occupancy Type | # Households | Median Income |
| Owner-Occupied | 309 (81.1%) | $111,910 |
| Renter-Occupied | 72 (18.9%) | $31,667 |
| Average | 381 (100.0%) | $109,241 |
Occupancy by Householder Income Bracket in Cobb
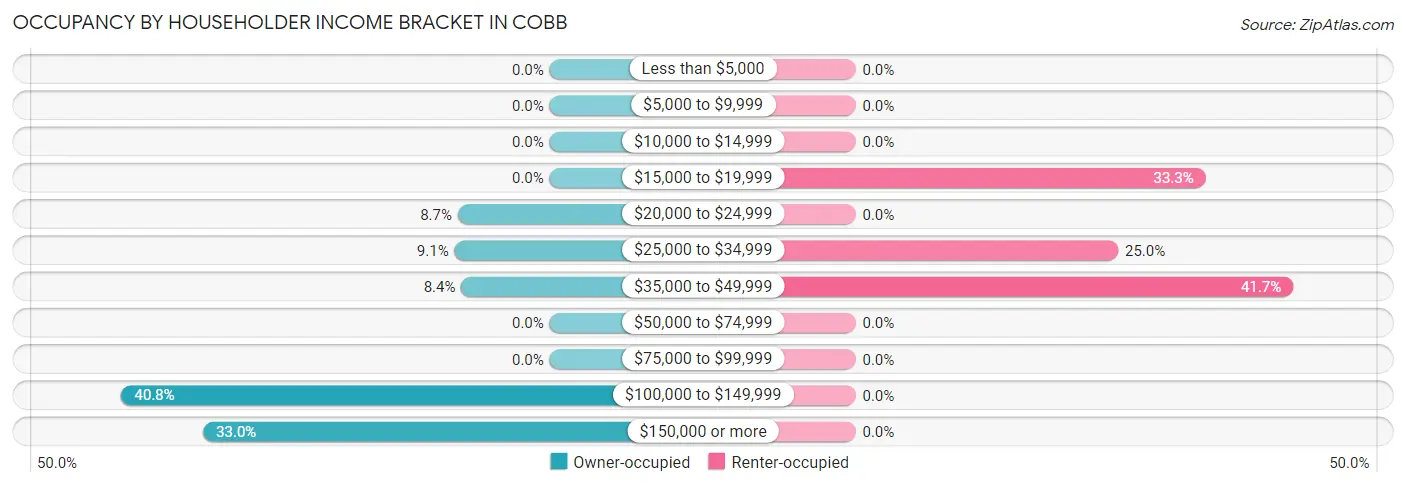
| Income Bracket | Owner-occupied | Renter-occupied |
| Less than $5,000 | 0 (0.0%) | 0 (0.0%) |
| $5,000 to $9,999 | 0 (0.0%) | 0 (0.0%) |
| $10,000 to $14,999 | 0 (0.0%) | 0 (0.0%) |
| $15,000 to $19,999 | 0 (0.0%) | 24 (33.3%) |
| $20,000 to $24,999 | 27 (8.7%) | 0 (0.0%) |
| $25,000 to $34,999 | 28 (9.1%) | 18 (25.0%) |
| $35,000 to $49,999 | 26 (8.4%) | 30 (41.7%) |
| $50,000 to $74,999 | 0 (0.0%) | 0 (0.0%) |
| $75,000 to $99,999 | 0 (0.0%) | 0 (0.0%) |
| $100,000 to $149,999 | 126 (40.8%) | 0 (0.0%) |
| $150,000 or more | 102 (33.0%) | 0 (0.0%) |
| Total | 309 (100.0%) | 72 (100.0%) |
Monthly Housing Cost Tiers in Cobb
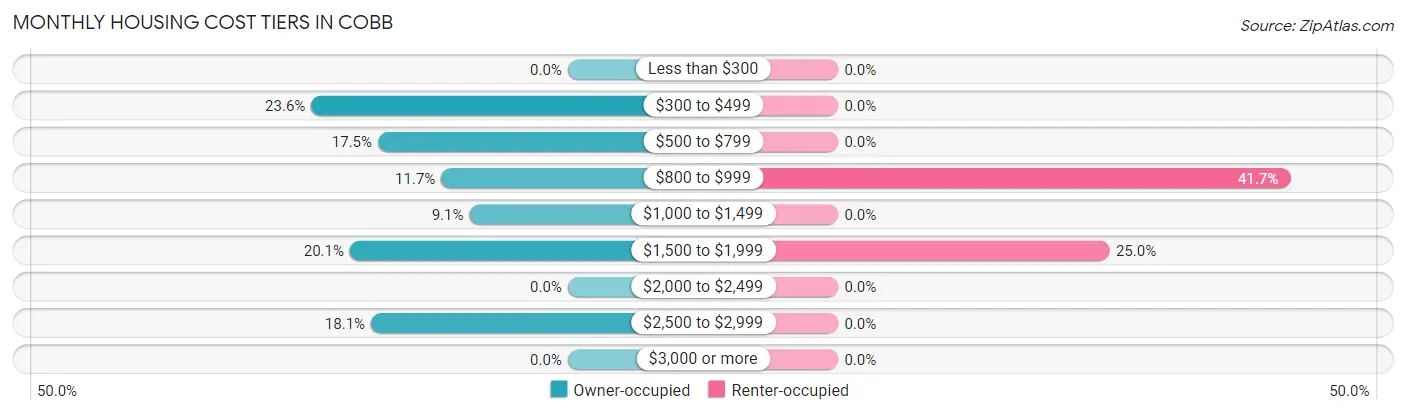
| Monthly Cost | Owner-occupied | Renter-occupied |
| Less than $300 | 0 (0.0%) | 0 (0.0%) |
| $300 to $499 | 73 (23.6%) | 0 (0.0%) |
| $500 to $799 | 54 (17.5%) | 0 (0.0%) |
| $800 to $999 | 36 (11.7%) | 30 (41.7%) |
| $1,000 to $1,499 | 28 (9.1%) | 0 (0.0%) |
| $1,500 to $1,999 | 62 (20.1%) | 18 (25.0%) |
| $2,000 to $2,499 | 0 (0.0%) | 0 (0.0%) |
| $2,500 to $2,999 | 56 (18.1%) | 0 (0.0%) |
| $3,000 or more | 0 (0.0%) | 0 (0.0%) |
| Total | 309 (100.0%) | 72 (100.0%) |
Physical Housing Characteristics in Cobb
Housing Structures in Cobb
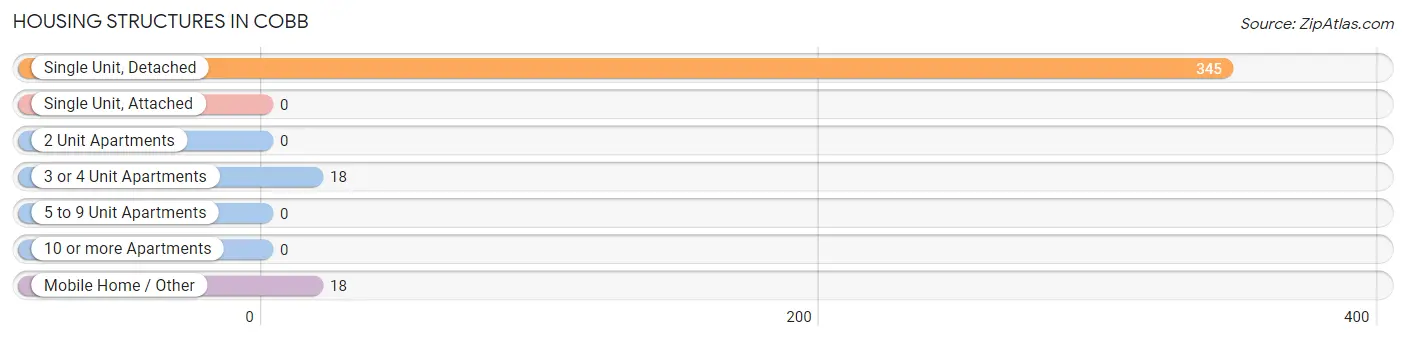
| Structure Type | # Housing Units | % Housing Units |
| Single Unit, Detached | 345 | 90.5% |
| Single Unit, Attached | 0 | 0.0% |
| 2 Unit Apartments | 0 | 0.0% |
| 3 or 4 Unit Apartments | 18 | 4.7% |
| 5 to 9 Unit Apartments | 0 | 0.0% |
| 10 or more Apartments | 0 | 0.0% |
| Mobile Home / Other | 18 | 4.7% |
| Total | 381 | 100.0% |
Housing Structures by Occupancy in Cobb
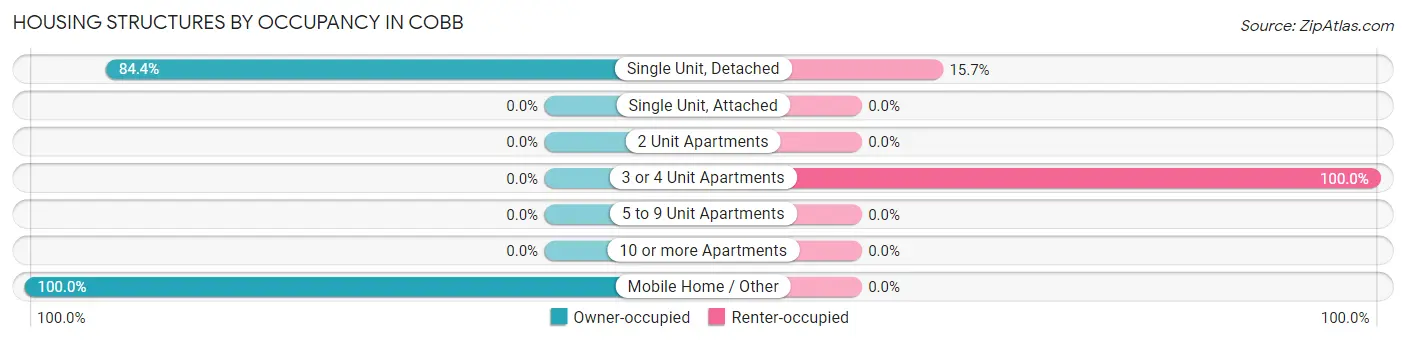
| Structure Type | Owner-occupied | Renter-occupied |
| Single Unit, Detached | 291 (84.4%) | 54 (15.7%) |
| Single Unit, Attached | 0 (0.0%) | 0 (0.0%) |
| 2 Unit Apartments | 0 (0.0%) | 0 (0.0%) |
| 3 or 4 Unit Apartments | 0 (0.0%) | 18 (100.0%) |
| 5 to 9 Unit Apartments | 0 (0.0%) | 0 (0.0%) |
| 10 or more Apartments | 0 (0.0%) | 0 (0.0%) |
| Mobile Home / Other | 18 (100.0%) | 0 (0.0%) |
| Total | 309 (81.1%) | 72 (18.9%) |
Housing Structures by Number of Rooms in Cobb
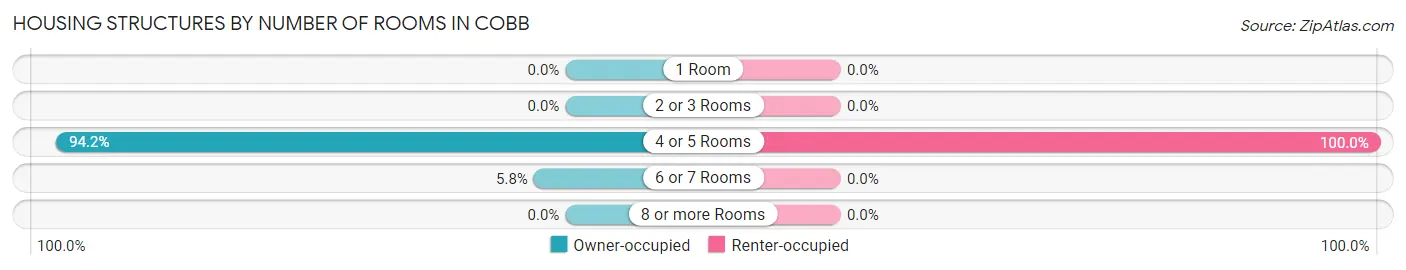
| Number of Rooms | Owner-occupied | Renter-occupied |
| 1 Room | 0 (0.0%) | 0 (0.0%) |
| 2 or 3 Rooms | 0 (0.0%) | 0 (0.0%) |
| 4 or 5 Rooms | 291 (94.2%) | 72 (100.0%) |
| 6 or 7 Rooms | 18 (5.8%) | 0 (0.0%) |
| 8 or more Rooms | 0 (0.0%) | 0 (0.0%) |
| Total | 309 (100.0%) | 72 (100.0%) |
Housing Structure by Heating Type in Cobb
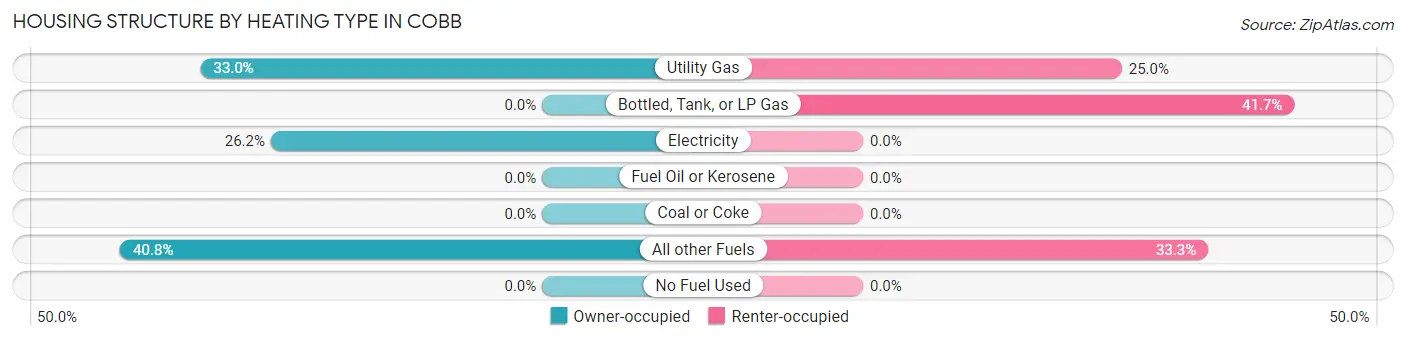
| Heating Type | Owner-occupied | Renter-occupied |
| Utility Gas | 102 (33.0%) | 18 (25.0%) |
| Bottled, Tank, or LP Gas | 0 (0.0%) | 30 (41.7%) |
| Electricity | 81 (26.2%) | 0 (0.0%) |
| Fuel Oil or Kerosene | 0 (0.0%) | 0 (0.0%) |
| Coal or Coke | 0 (0.0%) | 0 (0.0%) |
| All other Fuels | 126 (40.8%) | 24 (33.3%) |
| No Fuel Used | 0 (0.0%) | 0 (0.0%) |
| Total | 309 (100.0%) | 72 (100.0%) |
Household Vehicle Usage in Cobb
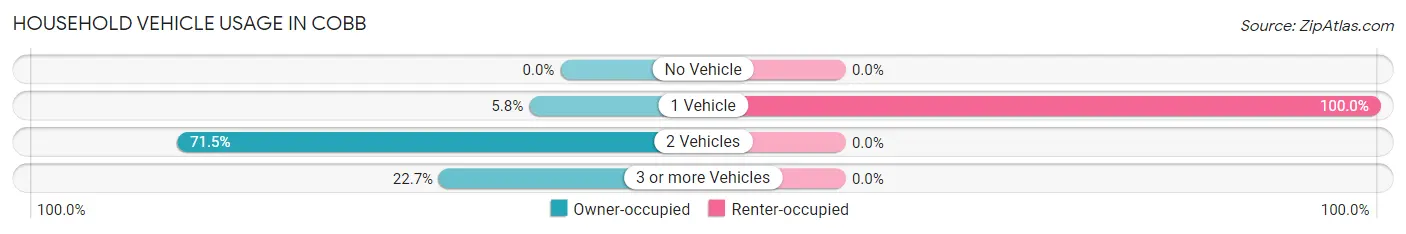
| Vehicles per Household | Owner-occupied | Renter-occupied |
| No Vehicle | 0 (0.0%) | 0 (0.0%) |
| 1 Vehicle | 18 (5.8%) | 72 (100.0%) |
| 2 Vehicles | 221 (71.5%) | 0 (0.0%) |
| 3 or more Vehicles | 70 (22.7%) | 0 (0.0%) |
| Total | 309 (100.0%) | 72 (100.0%) |
Real Estate & Mortgages in Cobb
Real Estate and Mortgage Overview in Cobb
| Characteristic | Without Mortgage | With Mortgage |
| Housing Units | 163 | 146 |
| Median Property Value | $208,600 | $0 |
| Median Household Income | $112,983 | $56 |
| Monthly Housing Costs | $716 | $0 |
| Real Estate Taxes | $1,662 | $0 |
Property Value by Mortgage Status in Cobb
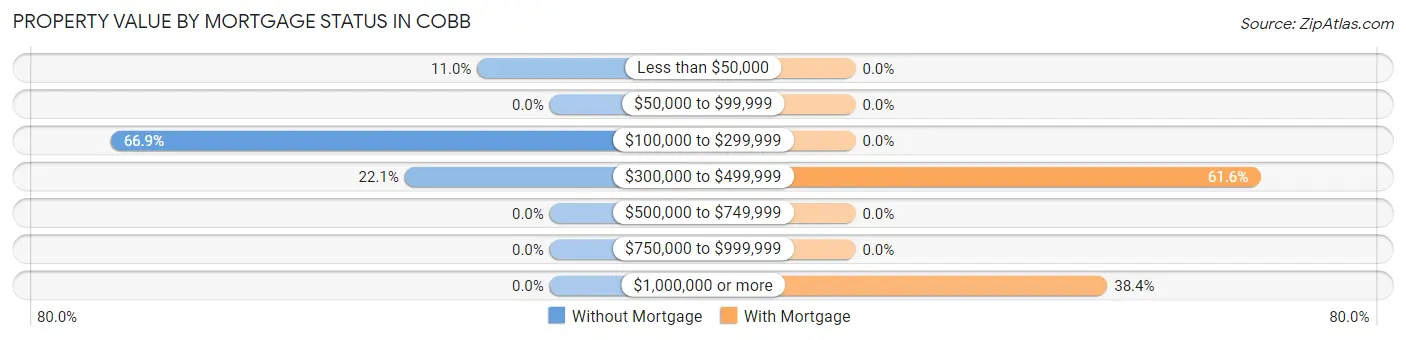
| Property Value | Without Mortgage | With Mortgage |
| Less than $50,000 | 18 (11.0%) | 0 (0.0%) |
| $50,000 to $99,999 | 0 (0.0%) | 0 (0.0%) |
| $100,000 to $299,999 | 109 (66.9%) | 0 (0.0%) |
| $300,000 to $499,999 | 36 (22.1%) | 90 (61.6%) |
| $500,000 to $749,999 | 0 (0.0%) | 0 (0.0%) |
| $750,000 to $999,999 | 0 (0.0%) | 0 (0.0%) |
| $1,000,000 or more | 0 (0.0%) | 56 (38.4%) |
| Total | 163 (100.0%) | 146 (100.0%) |
Household Income by Mortgage Status in Cobb
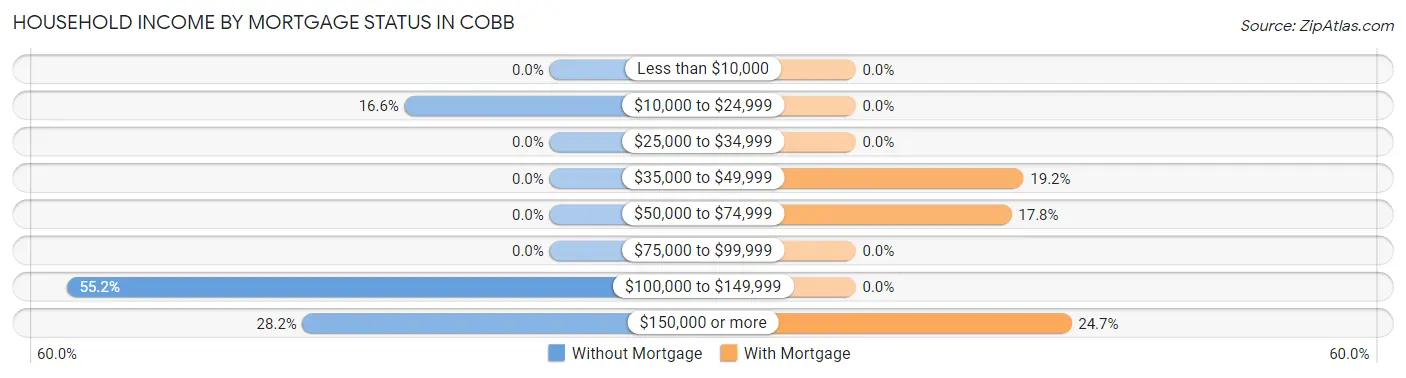
| Household Income | Without Mortgage | With Mortgage |
| Less than $10,000 | 0 (0.0%) | 0 (0.0%) |
| $10,000 to $24,999 | 27 (16.6%) | 0 (0.0%) |
| $25,000 to $34,999 | 0 (0.0%) | 0 (0.0%) |
| $35,000 to $49,999 | 0 (0.0%) | 28 (19.2%) |
| $50,000 to $74,999 | 0 (0.0%) | 26 (17.8%) |
| $75,000 to $99,999 | 0 (0.0%) | 0 (0.0%) |
| $100,000 to $149,999 | 90 (55.2%) | 0 (0.0%) |
| $150,000 or more | 46 (28.2%) | 36 (24.7%) |
| Total | 163 (100.0%) | 146 (100.0%) |
Property Value to Household Income Ratio in Cobb
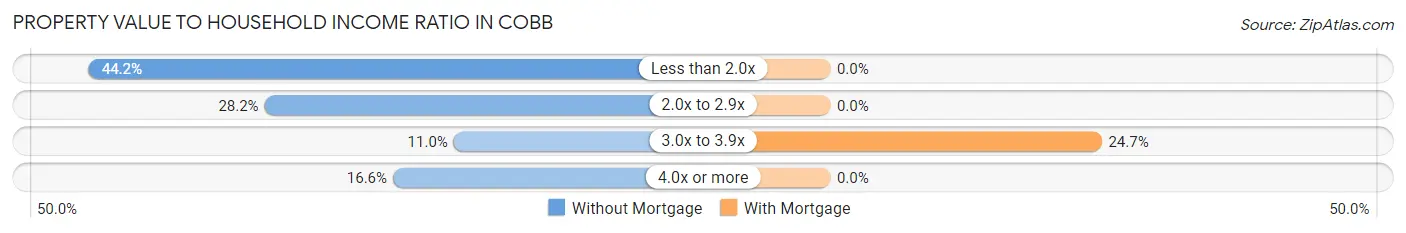
| Value-to-Income Ratio | Without Mortgage | With Mortgage |
| Less than 2.0x | 72 (44.2%) | 0 (0.0%) |
| 2.0x to 2.9x | 46 (28.2%) | 0 (0.0%) |
| 3.0x to 3.9x | 18 (11.0%) | 36 (24.7%) |
| 4.0x or more | 27 (16.6%) | 0 (0.0%) |
| Total | 163 (100.0%) | 146 (100.0%) |
Real Estate Taxes by Mortgage Status in Cobb
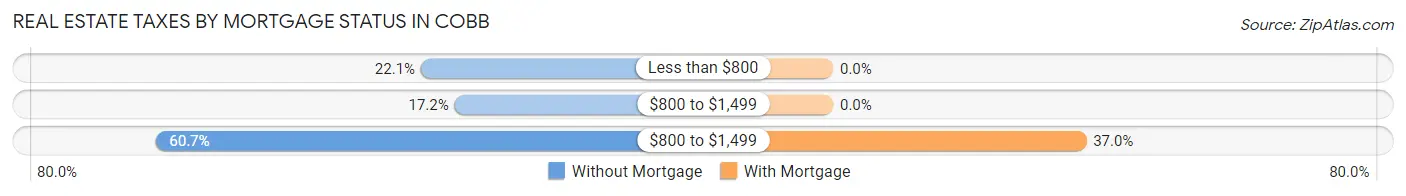
| Property Taxes | Without Mortgage | With Mortgage |
| Less than $800 | 36 (22.1%) | 0 (0.0%) |
| $800 to $1,499 | 28 (17.2%) | 0 (0.0%) |
| $800 to $1,499 | 99 (60.7%) | 54 (37.0%) |
| Total | 163 (100.0%) | 146 (100.0%) |
Health & Disability in Cobb
Health Insurance Coverage by Age in Cobb
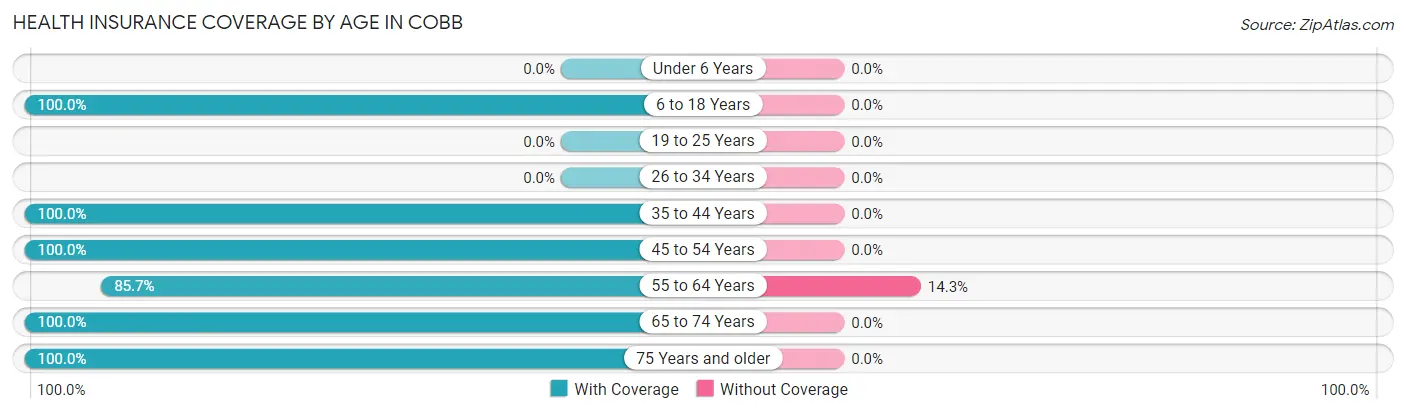
| Age Bracket | With Coverage | Without Coverage |
| Under 6 Years | 0 (0.0%) | 0 (0.0%) |
| 6 to 18 Years | 42 (100.0%) | 0 (0.0%) |
| 19 to 25 Years | 0 (0.0%) | 0 (0.0%) |
| 26 to 34 Years | 0 (0.0%) | 0 (0.0%) |
| 35 to 44 Years | 167 (100.0%) | 0 (0.0%) |
| 45 to 54 Years | 68 (100.0%) | 0 (0.0%) |
| 55 to 64 Years | 168 (85.7%) | 28 (14.3%) |
| 65 to 74 Years | 166 (100.0%) | 0 (0.0%) |
| 75 Years and older | 46 (100.0%) | 0 (0.0%) |
| Total | 657 (95.9%) | 28 (4.1%) |
Health Insurance Coverage by Citizenship Status in Cobb
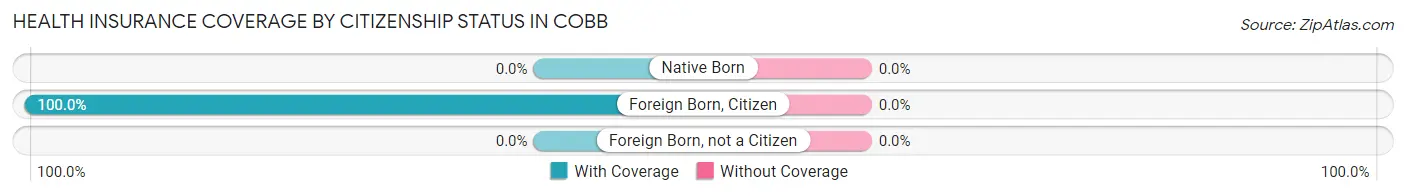
| Citizenship Status | With Coverage | Without Coverage |
| Native Born | 0 (0.0%) | 0 (0.0%) |
| Foreign Born, Citizen | 42 (100.0%) | 0 (0.0%) |
| Foreign Born, not a Citizen | 0 (0.0%) | 0 (0.0%) |
Health Insurance Coverage by Household Income in Cobb
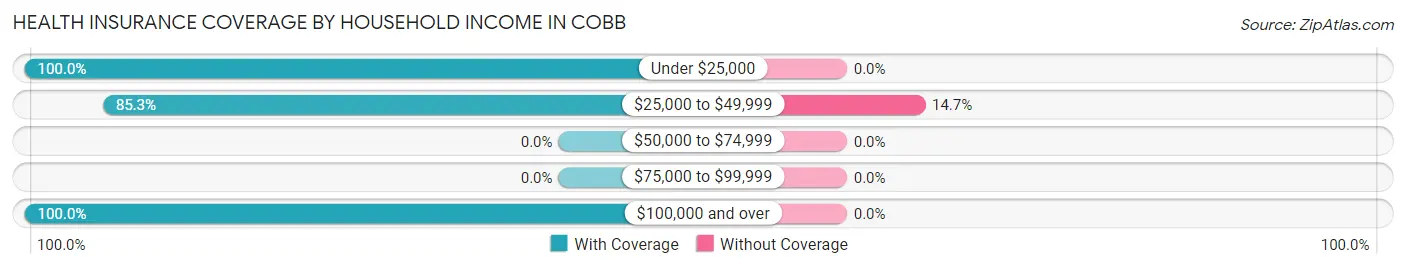
| Household Income | With Coverage | Without Coverage |
| Under $25,000 | 70 (100.0%) | 0 (0.0%) |
| $25,000 to $49,999 | 163 (85.3%) | 28 (14.7%) |
| $50,000 to $74,999 | 0 (0.0%) | 0 (0.0%) |
| $75,000 to $99,999 | 0 (0.0%) | 0 (0.0%) |
| $100,000 and over | 424 (100.0%) | 0 (0.0%) |
Public vs Private Health Insurance Coverage by Age in Cobb
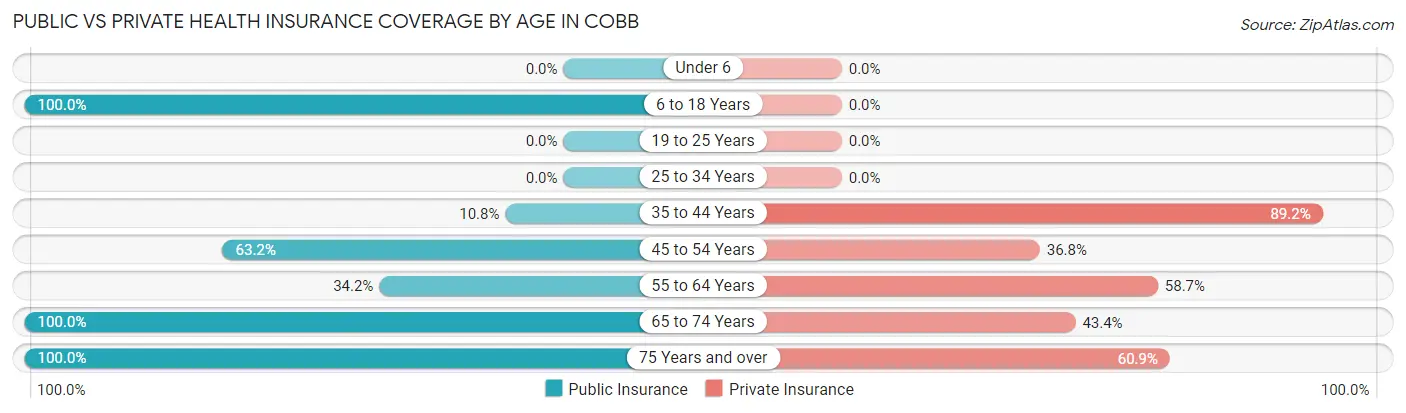
| Age Bracket | Public Insurance | Private Insurance |
| Under 6 | 0 (0.0%) | 0 (0.0%) |
| 6 to 18 Years | 42 (100.0%) | 0 (0.0%) |
| 19 to 25 Years | 0 (0.0%) | 0 (0.0%) |
| 25 to 34 Years | 0 (0.0%) | 0 (0.0%) |
| 35 to 44 Years | 18 (10.8%) | 149 (89.2%) |
| 45 to 54 Years | 43 (63.2%) | 25 (36.8%) |
| 55 to 64 Years | 67 (34.2%) | 115 (58.7%) |
| 65 to 74 Years | 166 (100.0%) | 72 (43.4%) |
| 75 Years and over | 46 (100.0%) | 28 (60.9%) |
| Total | 382 (55.8%) | 389 (56.8%) |
Disability Status by Sex by Age in Cobb
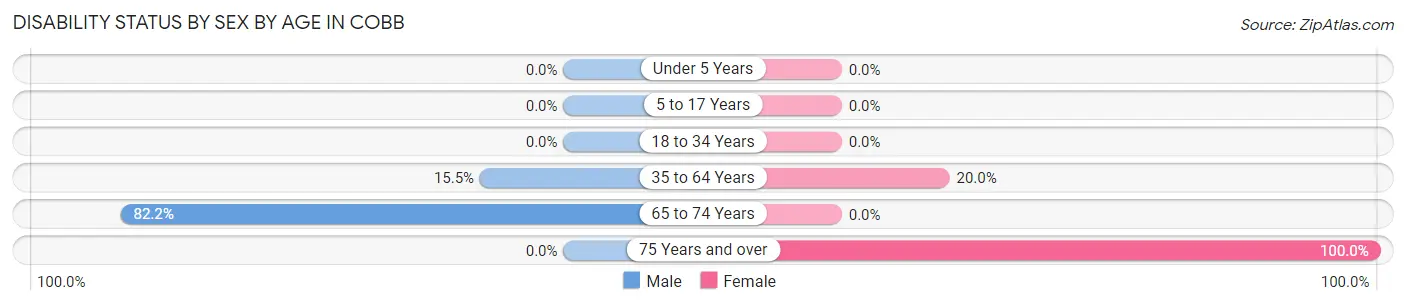
| Age Bracket | Male | Female |
| Under 5 Years | 0 (0.0%) | 0 (0.0%) |
| 5 to 17 Years | 0 (0.0%) | 0 (0.0%) |
| 18 to 34 Years | 0 (0.0%) | 0 (0.0%) |
| 35 to 64 Years | 52 (15.5%) | 19 (20.0%) |
| 65 to 74 Years | 83 (82.2%) | 0 (0.0%) |
| 75 Years and over | 0 (0.0%) | 28 (100.0%) |
Disability Class by Sex by Age in Cobb
Disability Class: Hearing Difficulty
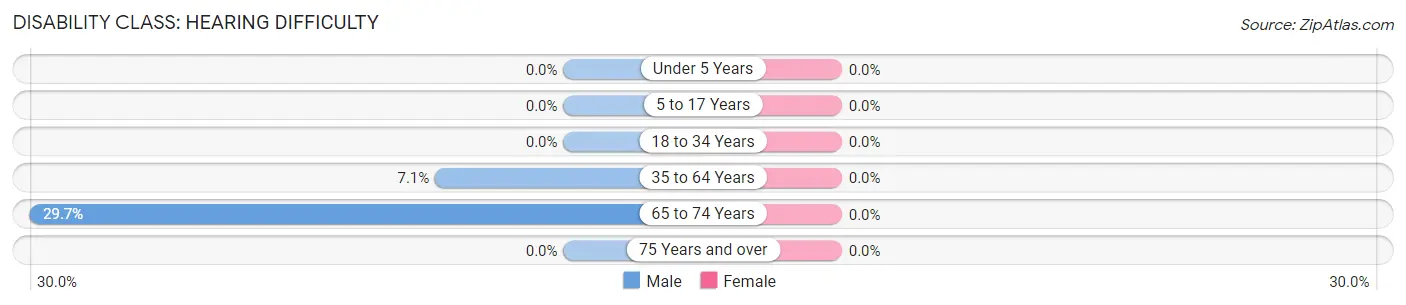
| Age Bracket | Male | Female |
| Under 5 Years | 0 (0.0%) | 0 (0.0%) |
| 5 to 17 Years | 0 (0.0%) | 0 (0.0%) |
| 18 to 34 Years | 0 (0.0%) | 0 (0.0%) |
| 35 to 64 Years | 24 (7.1%) | 0 (0.0%) |
| 65 to 74 Years | 30 (29.7%) | 0 (0.0%) |
| 75 Years and over | 0 (0.0%) | 0 (0.0%) |
Disability Class: Vision Difficulty
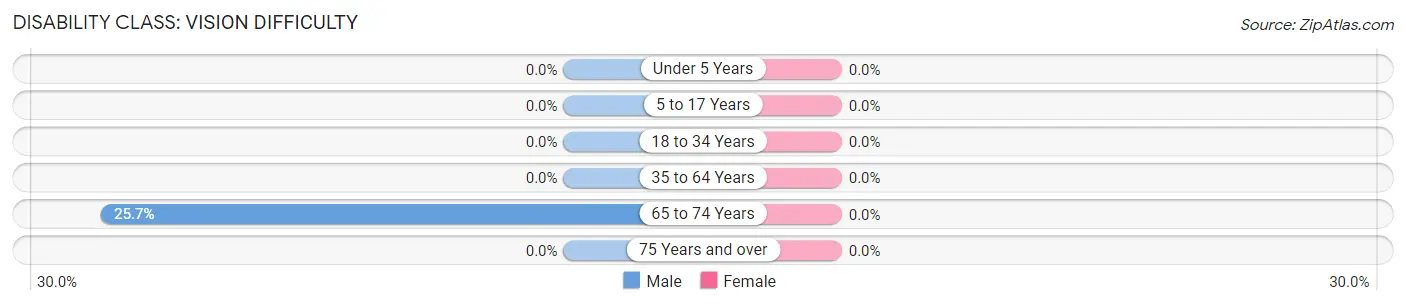
| Age Bracket | Male | Female |
| Under 5 Years | 0 (0.0%) | 0 (0.0%) |
| 5 to 17 Years | 0 (0.0%) | 0 (0.0%) |
| 18 to 34 Years | 0 (0.0%) | 0 (0.0%) |
| 35 to 64 Years | 0 (0.0%) | 0 (0.0%) |
| 65 to 74 Years | 26 (25.7%) | 0 (0.0%) |
| 75 Years and over | 0 (0.0%) | 0 (0.0%) |
Disability Class: Cognitive Difficulty
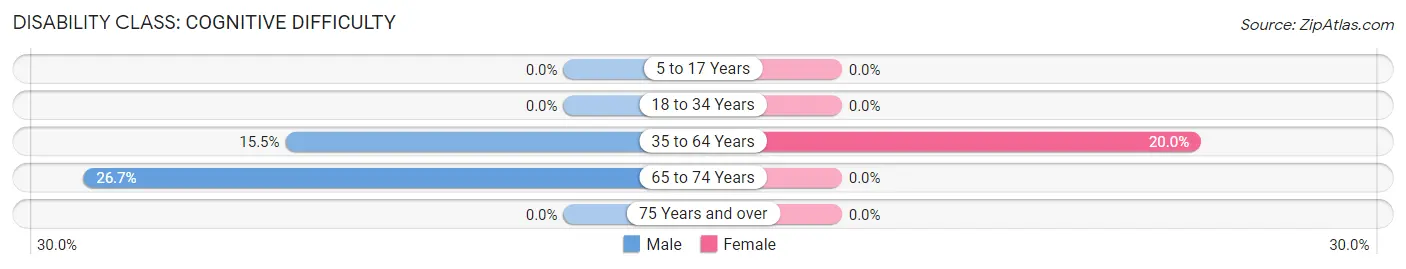
| Age Bracket | Male | Female |
| 5 to 17 Years | 0 (0.0%) | 0 (0.0%) |
| 18 to 34 Years | 0 (0.0%) | 0 (0.0%) |
| 35 to 64 Years | 52 (15.5%) | 19 (20.0%) |
| 65 to 74 Years | 27 (26.7%) | 0 (0.0%) |
| 75 Years and over | 0 (0.0%) | 0 (0.0%) |
Disability Class: Ambulatory Difficulty
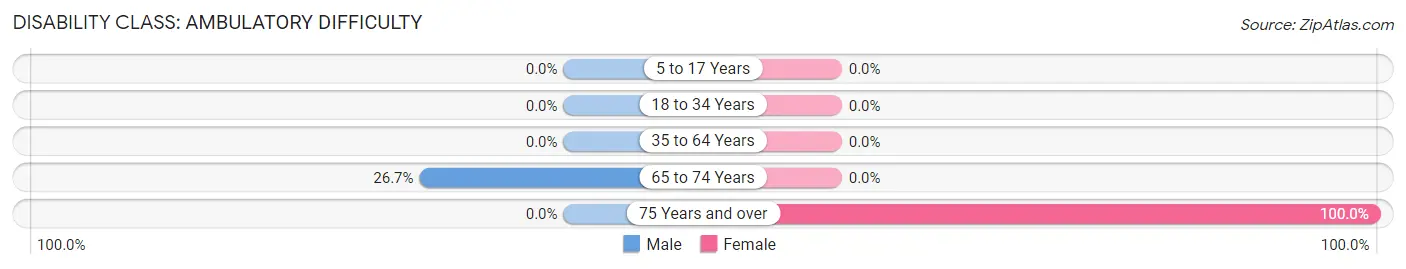
| Age Bracket | Male | Female |
| 5 to 17 Years | 0 (0.0%) | 0 (0.0%) |
| 18 to 34 Years | 0 (0.0%) | 0 (0.0%) |
| 35 to 64 Years | 0 (0.0%) | 0 (0.0%) |
| 65 to 74 Years | 27 (26.7%) | 0 (0.0%) |
| 75 Years and over | 0 (0.0%) | 28 (100.0%) |
Disability Class: Self-Care Difficulty
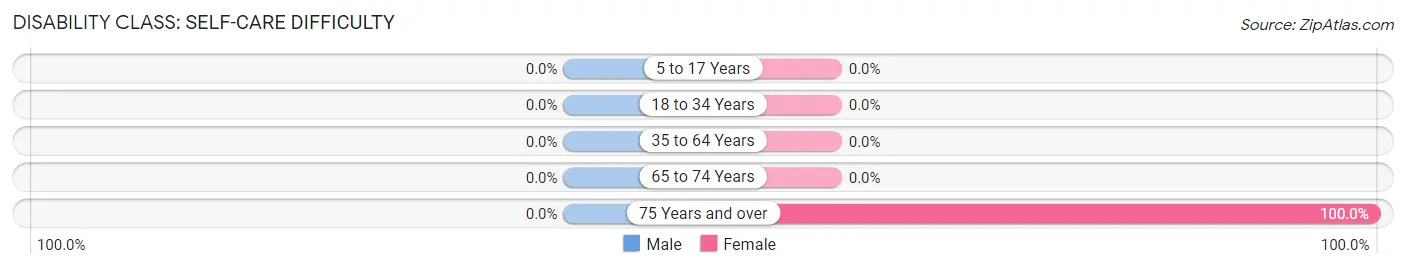
| Age Bracket | Male | Female |
| 5 to 17 Years | 0 (0.0%) | 0 (0.0%) |
| 18 to 34 Years | 0 (0.0%) | 0 (0.0%) |
| 35 to 64 Years | 0 (0.0%) | 0 (0.0%) |
| 65 to 74 Years | 0 (0.0%) | 0 (0.0%) |
| 75 Years and over | 0 (0.0%) | 28 (100.0%) |
Technology Access in Cobb
Computing Device Access in Cobb
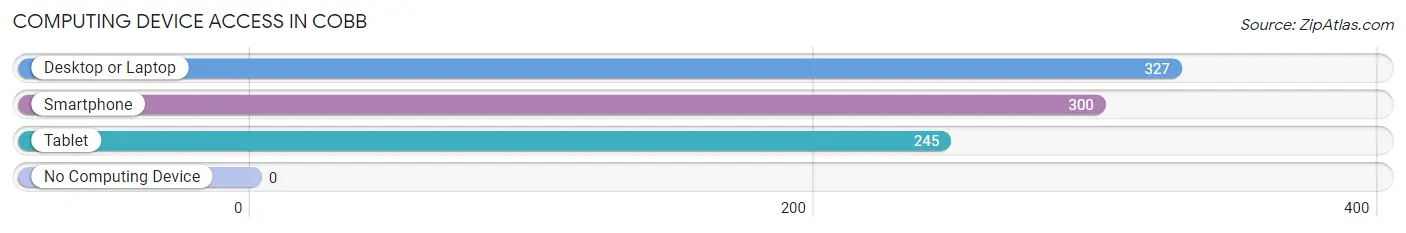
| Device Type | # Households | % Households |
| Desktop or Laptop | 327 | 85.8% |
| Smartphone | 300 | 78.7% |
| Tablet | 245 | 64.3% |
| No Computing Device | 0 | 0.0% |
| Total | 381 | 100.0% |
Internet Access in Cobb
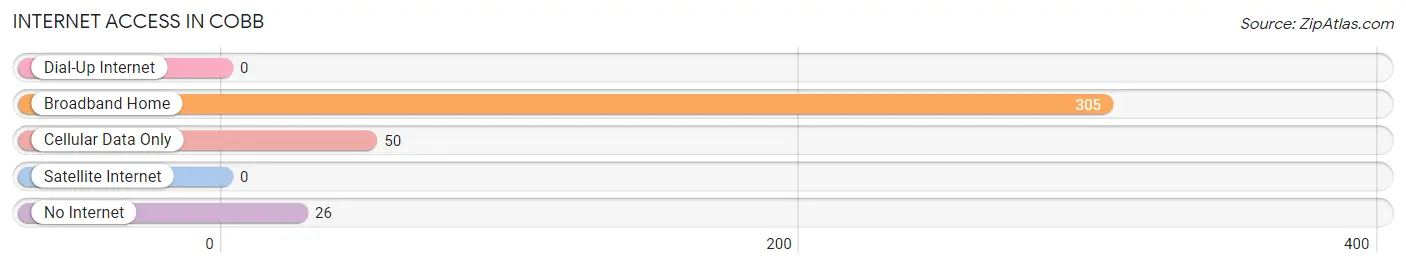
| Internet Type | # Households | % Households |
| Dial-Up Internet | 0 | 0.0% |
| Broadband Home | 305 | 80.0% |
| Cellular Data Only | 50 | 13.1% |
| Satellite Internet | 0 | 0.0% |
| No Internet | 26 | 6.8% |
| Total | 381 | 100.0% |
Cobb Summary
Cobb is a small unincorporated community located in the foothills of the Mayacamas Mountains in Sonoma County, California. It is situated in the northern part of the county, approximately 10 miles east of Santa Rosa and about 50 miles north of San Francisco. The population of Cobb is estimated to be around 1,000 people.
History
The area now known as Cobb was originally inhabited by the Pomo people, who lived in the area for thousands of years before the arrival of Europeans. The first Europeans to settle in the area were Spanish missionaries, who established a mission in nearby Santa Rosa in 1823. The area was later settled by American settlers in the mid-1800s, and the town of Cobb was officially founded in 1876.
The town was named after John Cobb, a local rancher who owned a large amount of land in the area. Cobb was a popular stop for travelers on the stagecoach line that ran between Santa Rosa and Calistoga. The town also had a post office, a general store, a blacksmith shop, and a hotel.
Geography
Cobb is located in the northern part of Sonoma County, in the foothills of the Mayacamas Mountains. The town is situated at an elevation of 1,400 feet, and is surrounded by rolling hills and oak woodlands. The climate in Cobb is mild, with warm summers and cool winters.
The town is located approximately 10 miles east of Santa Rosa and 50 miles north of San Francisco. It is accessible by Highway 29, which runs through the town.
Economy
The economy of Cobb is largely based on agriculture and tourism. The town is home to several wineries, including the renowned Chateau St. Jean Winery. The winery produces a variety of award-winning wines, and is a popular destination for wine-tasting tours.
The town is also home to several small businesses, including a general store, a cafe, and a few antique shops. The town is a popular destination for outdoor recreation, and is home to several hiking trails and camping sites.
Demographics
As of the 2010 census, the population of Cobb was estimated to be 1,000 people. The racial makeup of the town was 94.2% White, 0.7% African American, 0.7% Native American, 0.7% Asian, 0.3% Pacific Islander, and 2.3% from other races. The median household income in Cobb was $50,000, and the median age was 44.
Cobb is a small, rural community with a close-knit population. The town is known for its friendly atmosphere and laid-back lifestyle. It is a popular destination for outdoor recreation, and is home to several wineries and small businesses.
Common Questions
What is Per Capita Income in Cobb?
Per Capita income in Cobb is $58,594.
What is the Median Family Income in Cobb?
Median Family Income in Cobb is $112,292.
What is the Median Household income in Cobb?
Median Household Income in Cobb is $109,241.
What is Inequality or Gini Index in Cobb?
Inequality or Gini Index in Cobb is 0.39.
What is the Total Population of Cobb?
Total Population of Cobb is 685.
What is the Total Male Population of Cobb?
Total Male Population of Cobb is 480.
What is the Total Female Population of Cobb?
Total Female Population of Cobb is 205.
What is the Ratio of Males per 100 Females in Cobb?
There are 234.15 Males per 100 Females in Cobb.
What is the Ratio of Females per 100 Males in Cobb?
There are 42.71 Females per 100 Males in Cobb.
What is the Median Population Age in Cobb?
Median Population Age in Cobb is 57.8 Years.
What is the Average Family Size in Cobb
Average Family Size in Cobb is 2.2 People.
What is the Average Household Size in Cobb
Average Household Size in Cobb is 1.8 People.
How Large is the Labor Force in Cobb?
There are 309 People in the Labor Forcein in Cobb.
What is the Percentage of People in the Labor Force in Cobb?
48.1% of People are in the Labor Force in Cobb.