Cloverdale, CA Map & Demographics
Cloverdale Map
Cloverdale Overview
$46,037
PER CAPITA INCOME
$116,092
AVG FAMILY INCOME
$96,894
AVG HOUSEHOLD INCOME
25.9%
WAGE / INCOME GAP [ % ]
74.1¢/ $1
WAGE / INCOME GAP [ $ ]
$10,891
FAMILY INCOME DEFICIT
0.41
INEQUALITY / GINI INDEX
8,964
TOTAL POPULATION
4,449
MALE POPULATION
4,515
FEMALE POPULATION
98.54
MALES / 100 FEMALES
101.48
FEMALES / 100 MALES
42.0
MEDIAN AGE
3.0
AVG FAMILY SIZE
2.6
AVG HOUSEHOLD SIZE
4,529
LABOR FORCE [ PEOPLE ]
61.3%
PERCENT IN LABOR FORCE
3.8%
UNEMPLOYMENT RATE
Cloverdale Zip Codes
Cloverdale Area Codes
Income in Cloverdale
Income Overview in Cloverdale
Per Capita Income in Cloverdale is $46,037, while median incomes of families and households are $116,092 and $96,894 respectively.
| Characteristic | Number | Measure |
| Per Capita Income | 8,964 | $46,037 |
| Median Family Income | 2,354 | $116,092 |
| Mean Family Income | 2,354 | $132,384 |
| Median Household Income | 3,442 | $96,894 |
| Mean Household Income | 3,442 | $119,116 |
| Income Deficit | 2,354 | $10,891 |
| Wage / Income Gap (%) | 8,964 | 25.92% |
| Wage / Income Gap ($) | 8,964 | 74.08¢ per $1 |
| Gini / Inequality Index | 8,964 | 0.41 |
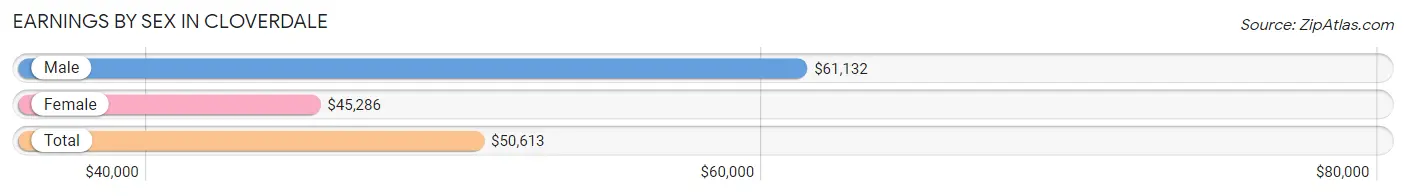
Earnings by Sex in Cloverdale
Average Earnings in Cloverdale are $50,613, $61,132 for men and $45,286 for women, a difference of 25.9%.
| Sex | Number | Average Earnings |
| Male | 2,581 (54.5%) | $61,132 |
| Female | 2,156 (45.5%) | $45,286 |
| Total | 4,737 (100.0%) | $50,613 |
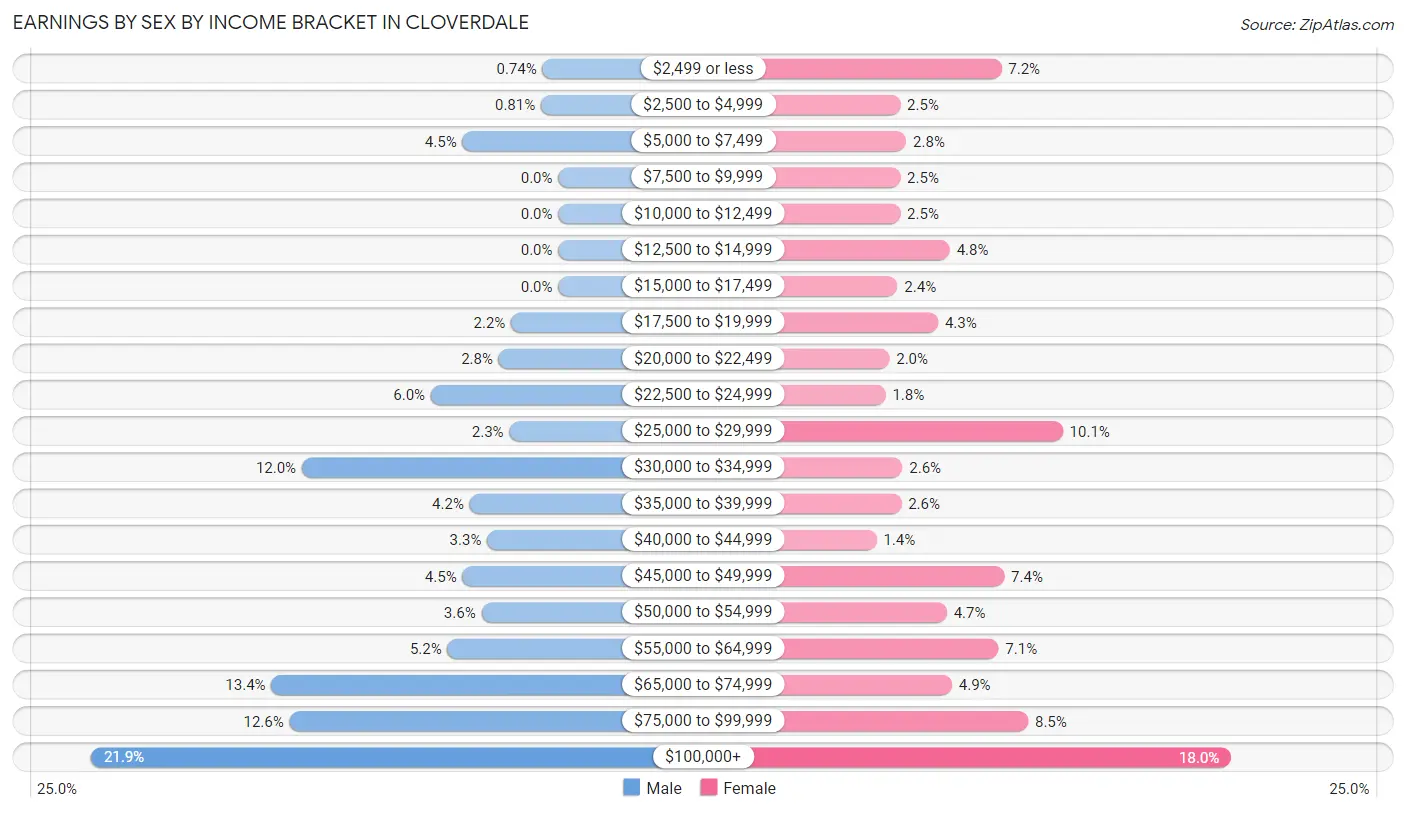
Earnings by Sex by Income Bracket in Cloverdale
The most common earnings brackets in Cloverdale are $100,000+ for men (565 | 21.9%) and $100,000+ for women (388 | 18.0%).
| Income | Male | Female |
| $2,499 or less | 19 (0.7%) | 156 (7.2%) |
| $2,500 to $4,999 | 21 (0.8%) | 54 (2.5%) |
| $5,000 to $7,499 | 116 (4.5%) | 60 (2.8%) |
| $7,500 to $9,999 | 0 (0.0%) | 54 (2.5%) |
| $10,000 to $12,499 | 0 (0.0%) | 54 (2.5%) |
| $12,500 to $14,999 | 0 (0.0%) | 104 (4.8%) |
| $15,000 to $17,499 | 0 (0.0%) | 51 (2.4%) |
| $17,500 to $19,999 | 57 (2.2%) | 92 (4.3%) |
| $20,000 to $22,499 | 72 (2.8%) | 43 (2.0%) |
| $22,500 to $24,999 | 154 (6.0%) | 39 (1.8%) |
| $25,000 to $29,999 | 59 (2.3%) | 218 (10.1%) |
| $30,000 to $34,999 | 310 (12.0%) | 56 (2.6%) |
| $35,000 to $39,999 | 107 (4.2%) | 55 (2.5%) |
| $40,000 to $44,999 | 86 (3.3%) | 30 (1.4%) |
| $45,000 to $49,999 | 116 (4.5%) | 159 (7.4%) |
| $50,000 to $54,999 | 93 (3.6%) | 101 (4.7%) |
| $55,000 to $64,999 | 134 (5.2%) | 153 (7.1%) |
| $65,000 to $74,999 | 347 (13.4%) | 106 (4.9%) |
| $75,000 to $99,999 | 325 (12.6%) | 183 (8.5%) |
| $100,000+ | 565 (21.9%) | 388 (18.0%) |
| Total | 2,581 (100.0%) | 2,156 (100.0%) |
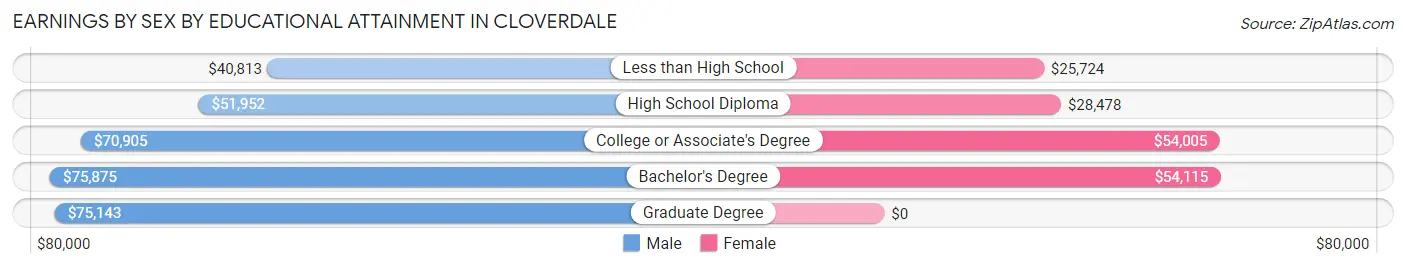
Earnings by Sex by Educational Attainment in Cloverdale
Average earnings in Cloverdale are $65,734 for men and $46,560 for women, a difference of 29.2%. Men with an educational attainment of bachelor's degree enjoy the highest average annual earnings of $75,875, while those with less than high school education earn the least with $40,813. Women with an educational attainment of bachelor's degree earn the most with the average annual earnings of $54,115, while those with less than high school education have the smallest earnings of $25,724.
| Educational Attainment | Male Income | Female Income |
| Less than High School | $40,813 | $25,724 |
| High School Diploma | $51,952 | $28,478 |
| College or Associate's Degree | $70,905 | $54,005 |
| Bachelor's Degree | $75,875 | $54,115 |
| Graduate Degree | $75,143 | $0 |
| Total | $65,734 | $46,560 |
Family Income in Cloverdale
Family Income Brackets in Cloverdale
According to the Cloverdale family income data, there are 577 families falling into the $100,000 to $149,999 income range, which is the most common income bracket and makes up 24.5% of all families. Conversely, the less than $10,000 income bracket is the least frequent group with only 16 families (0.7%) belonging to this category.
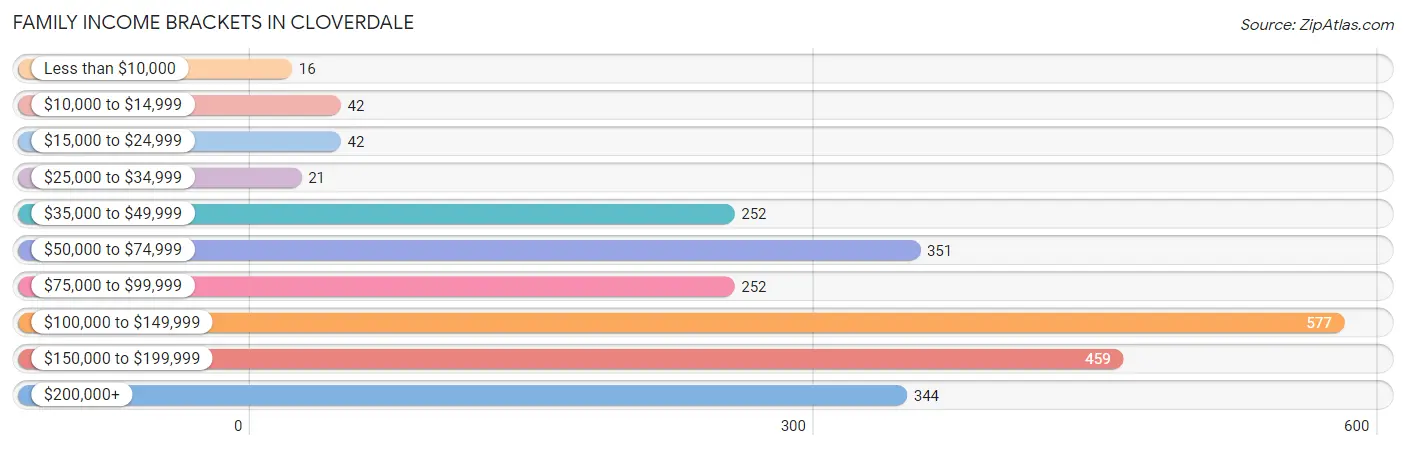
| Income Bracket | # Families | % Families |
| Less than $10,000 | 16 | 0.7% |
| $10,000 to $14,999 | 42 | 1.8% |
| $15,000 to $24,999 | 42 | 1.8% |
| $25,000 to $34,999 | 21 | 0.9% |
| $35,000 to $49,999 | 252 | 10.7% |
| $50,000 to $74,999 | 351 | 14.9% |
| $75,000 to $99,999 | 252 | 10.7% |
| $100,000 to $149,999 | 577 | 24.5% |
| $150,000 to $199,999 | 459 | 19.5% |
| $200,000+ | 344 | 14.6% |
Family Income by Famaliy Size in Cloverdale
4-person families (781 | 33.2%) account for the highest median family income in Cloverdale with $149,432 per family, while 3-person families (379 | 16.1%) have the highest median income of $49,072 per family member.
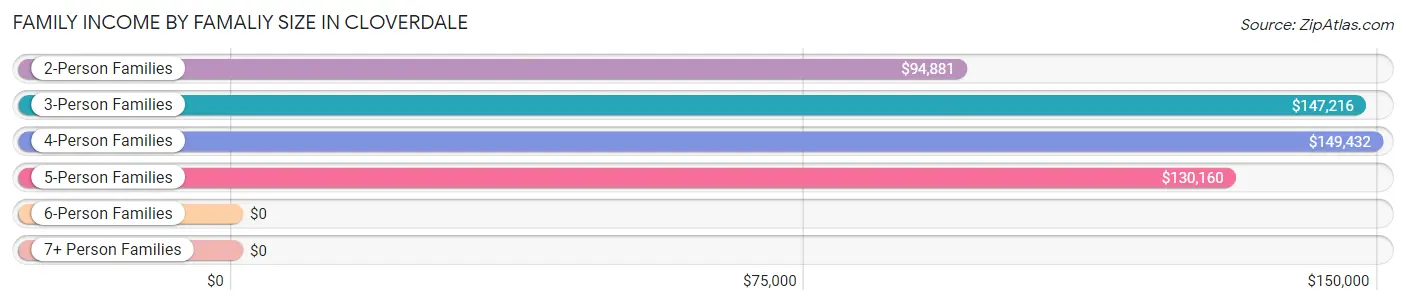
| Income Bracket | # Families | Median Income |
| 2-Person Families | 1,026 (43.6%) | $94,881 |
| 3-Person Families | 379 (16.1%) | $147,216 |
| 4-Person Families | 781 (33.2%) | $149,432 |
| 5-Person Families | 168 (7.1%) | $130,160 |
| 6-Person Families | 0 (0.0%) | $0 |
| 7+ Person Families | 0 (0.0%) | $0 |
| Total | 2,354 (100.0%) | $116,092 |
Family Income by Number of Earners in Cloverdale
The median family income in Cloverdale is $116,092, with families comprising 2 earners (862) having the highest median family income of $138,929, while families with no earners (334) have the lowest median family income of $71,957, accounting for 36.6% and 14.2% of families, respectively.
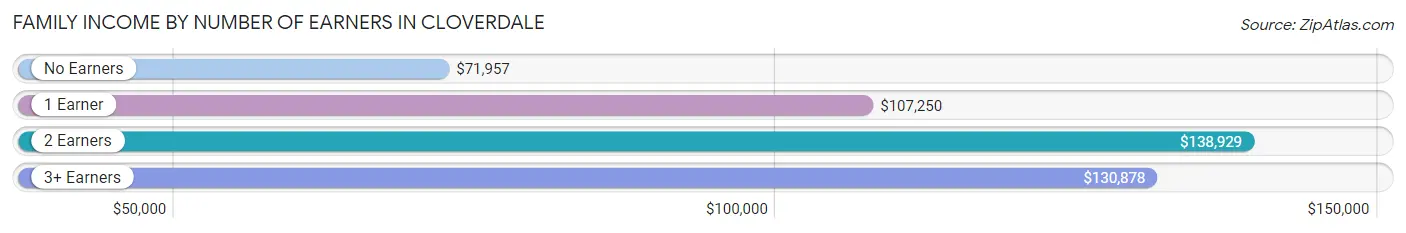
| Number of Earners | # Families | Median Income |
| No Earners | 334 (14.2%) | $71,957 |
| 1 Earner | 839 (35.6%) | $107,250 |
| 2 Earners | 862 (36.6%) | $138,929 |
| 3+ Earners | 319 (13.6%) | $130,878 |
| Total | 2,354 (100.0%) | $116,092 |
Household Income in Cloverdale
Household Income Brackets in Cloverdale
With 654 households falling in the category, the $100,000 to $149,999 income range is the most frequent in Cloverdale, accounting for 19.0% of all households. In contrast, only 86 households (2.5%) fall into the less than $10,000 income bracket, making it the least populous group.
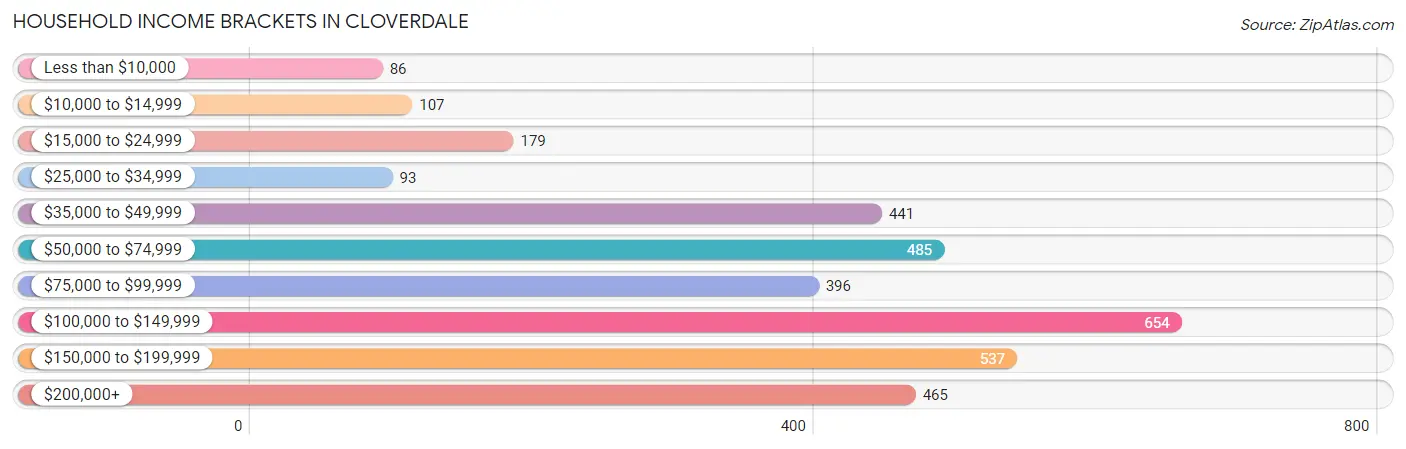
| Income Bracket | # Households | % Households |
| Less than $10,000 | 86 | 2.5% |
| $10,000 to $14,999 | 107 | 3.1% |
| $15,000 to $24,999 | 179 | 5.2% |
| $25,000 to $34,999 | 93 | 2.7% |
| $35,000 to $49,999 | 441 | 12.8% |
| $50,000 to $74,999 | 485 | 14.1% |
| $75,000 to $99,999 | 396 | 11.5% |
| $100,000 to $149,999 | 654 | 19.0% |
| $150,000 to $199,999 | 537 | 15.6% |
| $200,000+ | 465 | 13.5% |
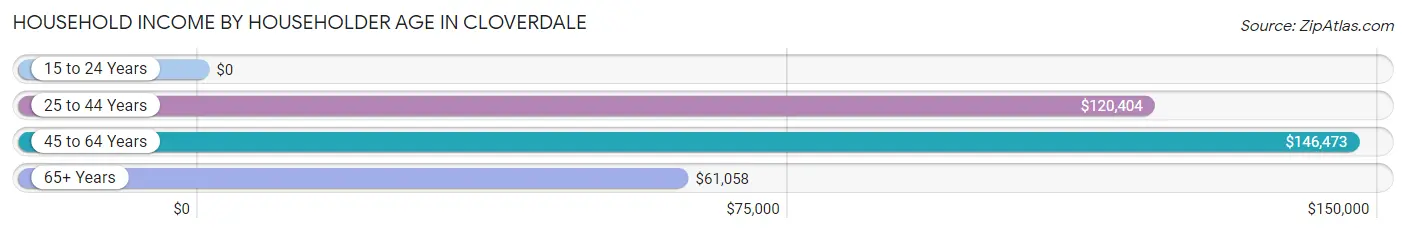
Household Income by Householder Age in Cloverdale
The median household income in Cloverdale is $96,894, with the highest median household income of $146,473 found in the 45 to 64 years age bracket for the primary householder. A total of 1,238 households (36.0%) fall into this category. Meanwhile, the 15 to 24 years age bracket for the primary householder has the lowest median household income of $0, with 83 households (2.4%) in this group.
| Income Bracket | # Households | Median Income |
| 15 to 24 Years | 83 (2.4%) | $0 |
| 25 to 44 Years | 933 (27.1%) | $120,404 |
| 45 to 64 Years | 1,238 (36.0%) | $146,473 |
| 65+ Years | 1,188 (34.5%) | $61,058 |
| Total | 3,442 (100.0%) | $96,894 |
Poverty in Cloverdale
Income Below Poverty by Sex and Age in Cloverdale
With 4.1% poverty level for males and 8.3% for females among the residents of Cloverdale, 16 and 17 year old males and 25 to 34 year old females are the most vulnerable to poverty, with 60 males (39.2%) and 76 females (18.9%) in their respective age groups living below the poverty level.
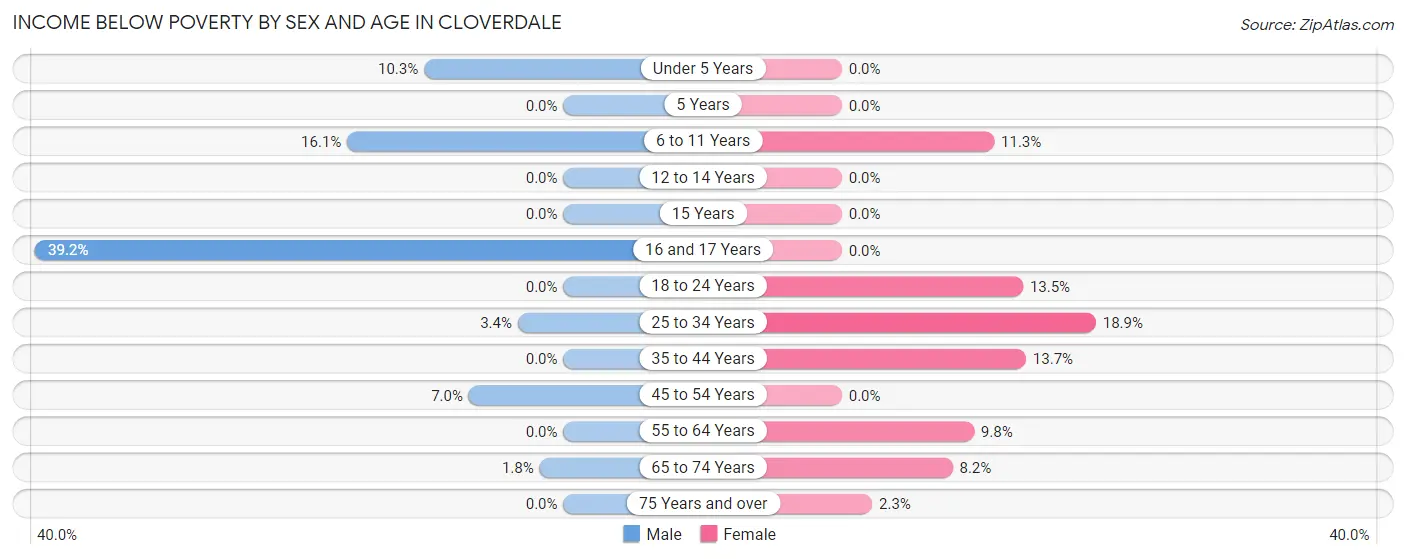
| Age Bracket | Male | Female |
| Under 5 Years | 6 (10.3%) | 0 (0.0%) |
| 5 Years | 0 (0.0%) | 0 (0.0%) |
| 6 to 11 Years | 48 (16.1%) | 44 (11.3%) |
| 12 to 14 Years | 0 (0.0%) | 0 (0.0%) |
| 15 Years | 0 (0.0%) | 0 (0.0%) |
| 16 and 17 Years | 60 (39.2%) | 0 (0.0%) |
| 18 to 24 Years | 0 (0.0%) | 46 (13.5%) |
| 25 to 34 Years | 18 (3.4%) | 76 (18.9%) |
| 35 to 44 Years | 0 (0.0%) | 83 (13.7%) |
| 45 to 54 Years | 33 (7.0%) | 0 (0.0%) |
| 55 to 64 Years | 0 (0.0%) | 58 (9.8%) |
| 65 to 74 Years | 11 (1.8%) | 49 (8.2%) |
| 75 Years and over | 0 (0.0%) | 8 (2.2%) |
| Total | 176 (4.1%) | 364 (8.3%) |
Income Above Poverty by Sex and Age in Cloverdale
According to the poverty statistics in Cloverdale, males aged 5 years and females aged under 5 years are the age groups that are most secure financially, with 100.0% of males and 100.0% of females in these age groups living above the poverty line.
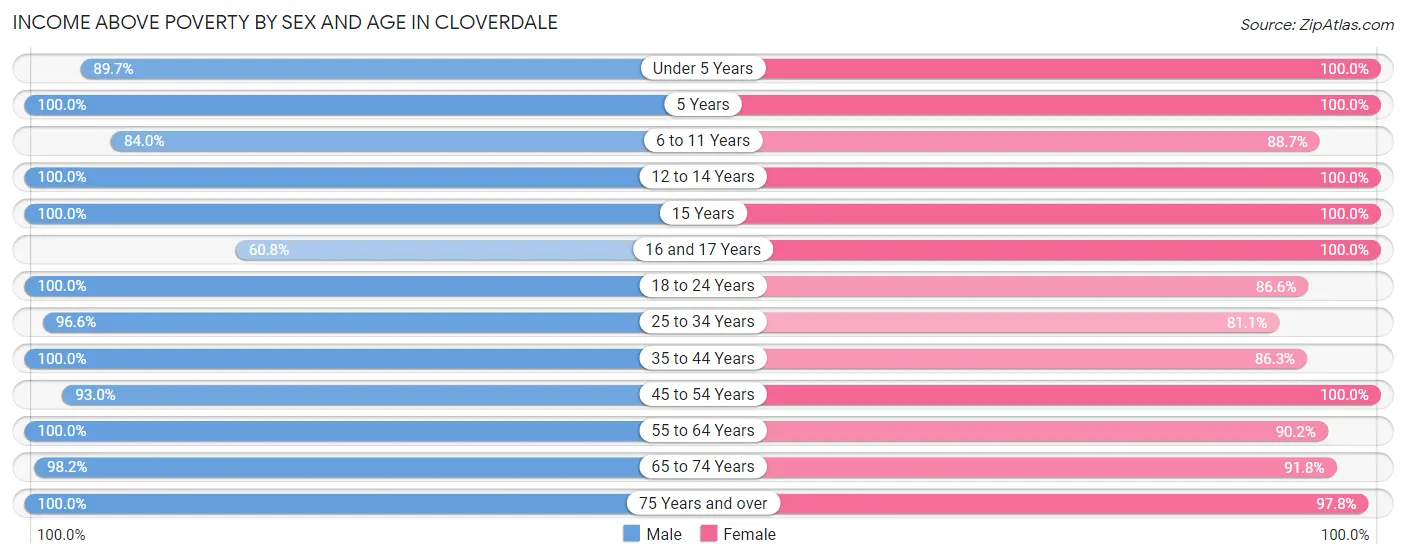
| Age Bracket | Male | Female |
| Under 5 Years | 52 (89.7%) | 183 (100.0%) |
| 5 Years | 83 (100.0%) | 14 (100.0%) |
| 6 to 11 Years | 251 (84.0%) | 345 (88.7%) |
| 12 to 14 Years | 100 (100.0%) | 189 (100.0%) |
| 15 Years | 45 (100.0%) | 26 (100.0%) |
| 16 and 17 Years | 93 (60.8%) | 128 (100.0%) |
| 18 to 24 Years | 257 (100.0%) | 296 (86.6%) |
| 25 to 34 Years | 515 (96.6%) | 327 (81.1%) |
| 35 to 44 Years | 898 (100.0%) | 524 (86.3%) |
| 45 to 54 Years | 437 (93.0%) | 587 (100.0%) |
| 55 to 64 Years | 566 (100.0%) | 533 (90.2%) |
| 65 to 74 Years | 611 (98.2%) | 547 (91.8%) |
| 75 Years and over | 217 (100.0%) | 347 (97.8%) |
| Total | 4,125 (95.9%) | 4,046 (91.7%) |
Income Below Poverty Among Married-Couple Families in Cloverdale
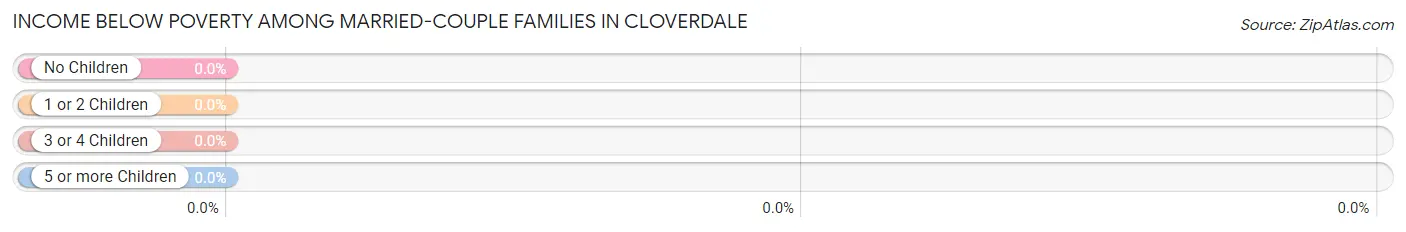
| Children | Above Poverty | Below Poverty |
| No Children | 1,169 (100.0%) | 0 (0.0%) |
| 1 or 2 Children | 651 (100.0%) | 0 (0.0%) |
| 3 or 4 Children | 72 (100.0%) | 0 (0.0%) |
| 5 or more Children | 0 (0.0%) | 0 (0.0%) |
| Total | 1,892 (100.0%) | 0 (0.0%) |
Income Below Poverty Among Single-Parent Households in Cloverdale
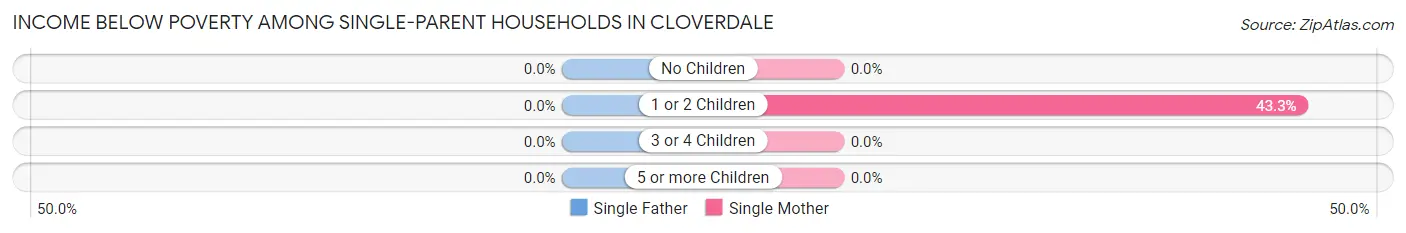
| Children | Single Father | Single Mother |
| No Children | 0 (0.0%) | 0 (0.0%) |
| 1 or 2 Children | 0 (0.0%) | 58 (43.3%) |
| 3 or 4 Children | 0 (0.0%) | 0 (0.0%) |
| 5 or more Children | 0 (0.0%) | 0 (0.0%) |
| Total | 0 (0.0%) | 58 (16.2%) |
Income Below Poverty Among Married-Couple vs Single-Parent Households in Cloverdale
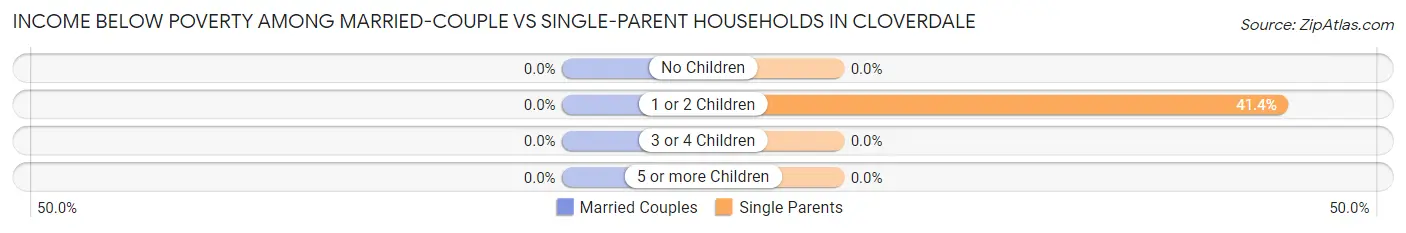
| Children | Married-Couple Families | Single-Parent Households |
| No Children | 0 (0.0%) | 0 (0.0%) |
| 1 or 2 Children | 0 (0.0%) | 58 (41.4%) |
| 3 or 4 Children | 0 (0.0%) | 0 (0.0%) |
| 5 or more Children | 0 (0.0%) | 0 (0.0%) |
| Total | 0 (0.0%) | 58 (12.6%) |
Race in Cloverdale
The most populous races in Cloverdale are White / Caucasian (6,197 | 69.1%), Hispanic or Latino (3,281 | 36.6%), and Some other Race (1,509 | 16.8%).
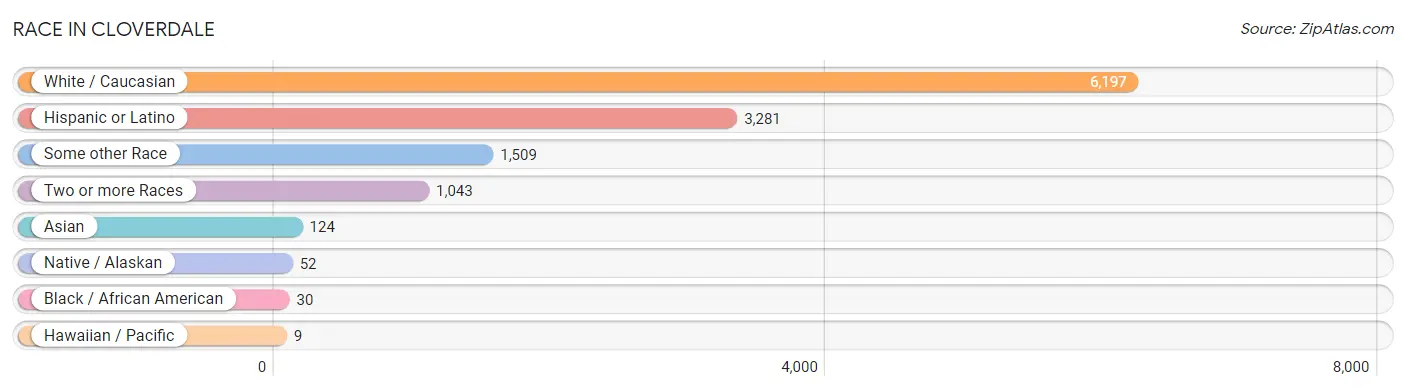
| Race | # Population | % Population |
| Asian | 124 | 1.4% |
| Black / African American | 30 | 0.3% |
| Hawaiian / Pacific | 9 | 0.1% |
| Hispanic or Latino | 3,281 | 36.6% |
| Native / Alaskan | 52 | 0.6% |
| White / Caucasian | 6,197 | 69.1% |
| Two or more Races | 1,043 | 11.6% |
| Some other Race | 1,509 | 16.8% |
| Total | 8,964 | 100.0% |
Ancestry in Cloverdale
The most populous ancestries reported in Cloverdale are Mexican (2,919 | 32.6%), Irish (968 | 10.8%), English (858 | 9.6%), German (857 | 9.6%), and Italian (529 | 5.9%), together accounting for 68.4% of all Cloverdale residents.
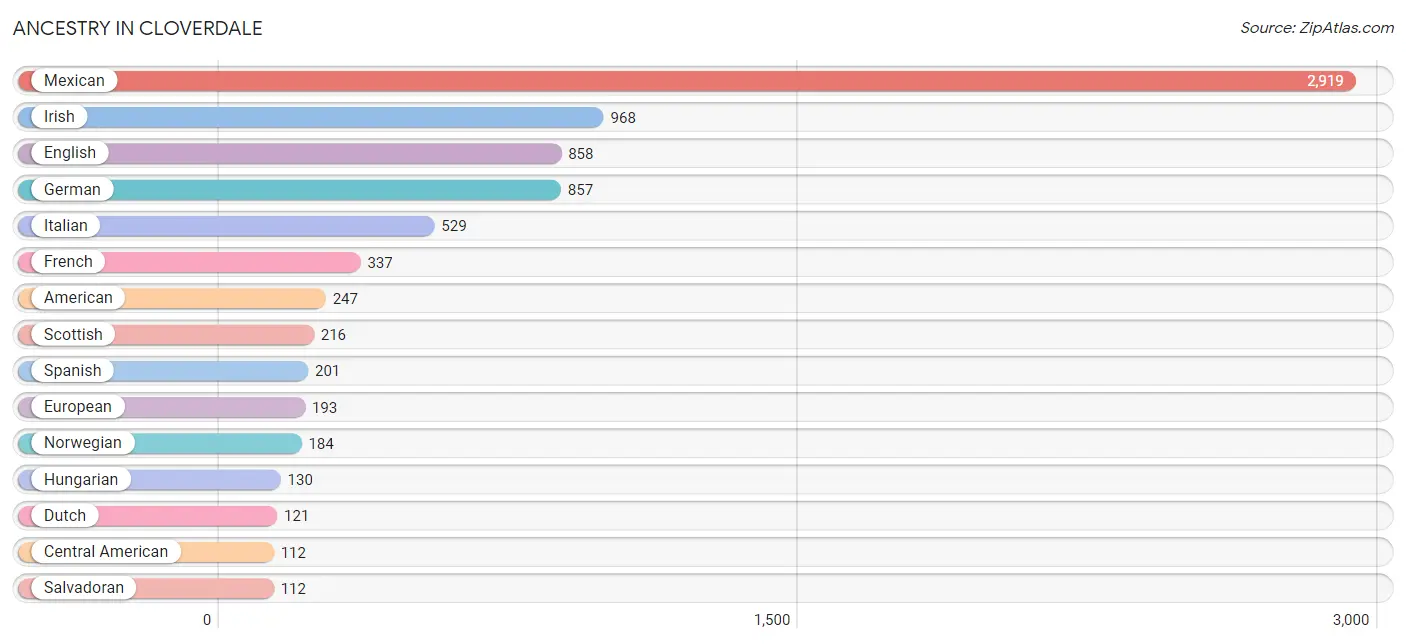
| Ancestry | # Population | % Population |
| American | 247 | 2.8% |
| Arab | 6 | 0.1% |
| Armenian | 10 | 0.1% |
| Austrian | 10 | 0.1% |
| British | 69 | 0.8% |
| Canadian | 27 | 0.3% |
| Central American | 112 | 1.3% |
| Cherokee | 44 | 0.5% |
| Czech | 48 | 0.5% |
| Czechoslovakian | 20 | 0.2% |
| Danish | 16 | 0.2% |
| Dutch | 121 | 1.3% |
| Eastern European | 14 | 0.2% |
| Egyptian | 6 | 0.1% |
| English | 858 | 9.6% |
| Estonian | 19 | 0.2% |
| European | 193 | 2.1% |
| Finnish | 19 | 0.2% |
| French | 337 | 3.8% |
| French American Indian | 11 | 0.1% |
| French Canadian | 39 | 0.4% |
| German | 857 | 9.6% |
| Greek | 98 | 1.1% |
| Hungarian | 130 | 1.5% |
| Icelander | 23 | 0.3% |
| Indian (Asian) | 99 | 1.1% |
| Irish | 968 | 10.8% |
| Italian | 529 | 5.9% |
| Korean | 58 | 0.6% |
| Latvian | 22 | 0.3% |
| Mexican | 2,919 | 32.6% |
| Northern European | 70 | 0.8% |
| Norwegian | 184 | 2.1% |
| Polish | 99 | 1.1% |
| Portuguese | 77 | 0.9% |
| Puerto Rican | 23 | 0.3% |
| Romanian | 20 | 0.2% |
| Russian | 21 | 0.2% |
| Salvadoran | 112 | 1.3% |
| Scandinavian | 40 | 0.4% |
| Scotch-Irish | 95 | 1.1% |
| Scottish | 216 | 2.4% |
| Spaniard | 18 | 0.2% |
| Spanish | 201 | 2.2% |
| Swedish | 105 | 1.2% |
| Swiss | 12 | 0.1% |
| Thai | 88 | 1.0% |
| Ukrainian | 26 | 0.3% |
| Welsh | 46 | 0.5% |
| Yugoslavian | 26 | 0.3% | View All 50 Rows |
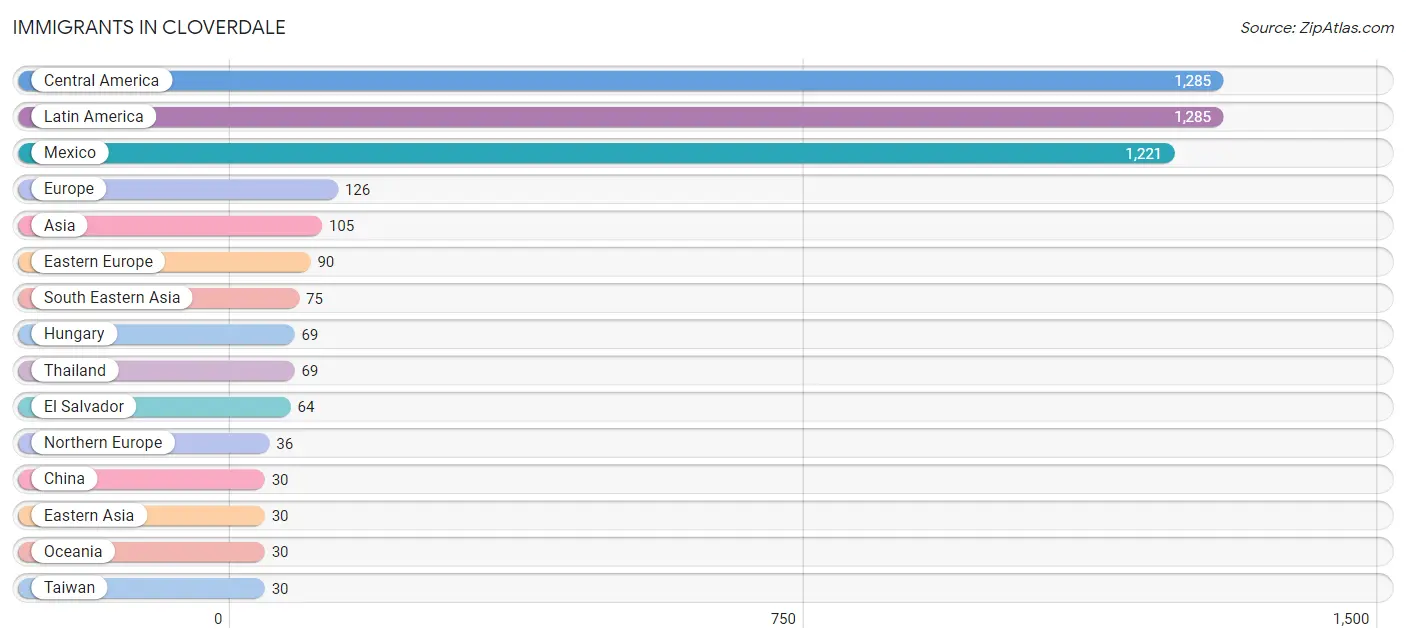
Immigrants in Cloverdale
The most numerous immigrant groups reported in Cloverdale came from Central America (1,285 | 14.3%), Latin America (1,285 | 14.3%), Mexico (1,221 | 13.6%), Europe (126 | 1.4%), and Asia (105 | 1.2%), together accounting for 44.9% of all Cloverdale residents.
| Immigration Origin | # Population | % Population |
| Asia | 105 | 1.2% |
| Australia | 21 | 0.2% |
| Canada | 10 | 0.1% |
| Central America | 1,285 | 14.3% |
| China | 30 | 0.3% |
| Czechoslovakia | 21 | 0.2% |
| Denmark | 16 | 0.2% |
| Eastern Asia | 30 | 0.3% |
| Eastern Europe | 90 | 1.0% |
| El Salvador | 64 | 0.7% |
| England | 6 | 0.1% |
| Europe | 126 | 1.4% |
| Fiji | 9 | 0.1% |
| Hungary | 69 | 0.8% |
| Latin America | 1,285 | 14.3% |
| Mexico | 1,221 | 13.6% |
| Northern Europe | 36 | 0.4% |
| Oceania | 30 | 0.3% |
| Philippines | 6 | 0.1% |
| Scotland | 14 | 0.2% |
| South Eastern Asia | 75 | 0.8% |
| Taiwan | 30 | 0.3% |
| Thailand | 69 | 0.8% | View All 23 Rows |
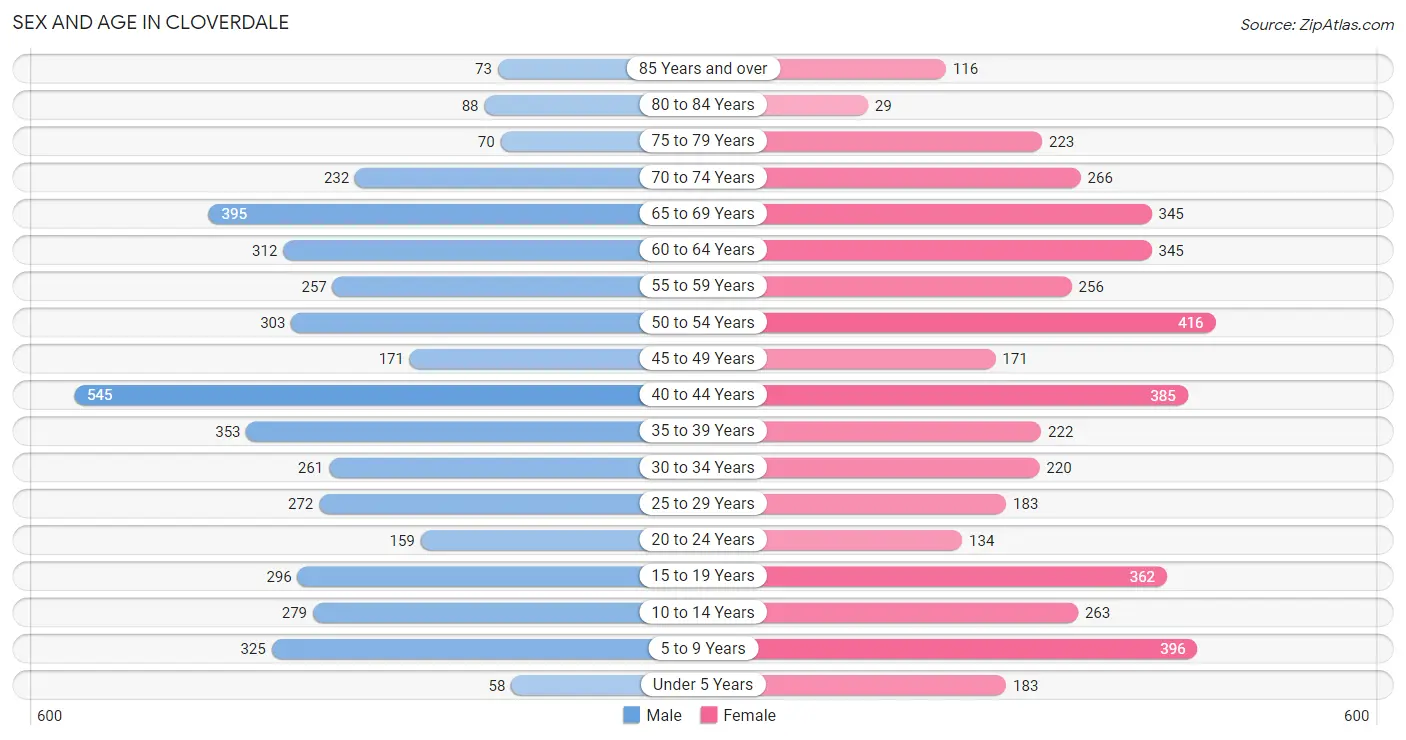
Sex and Age in Cloverdale
Sex and Age in Cloverdale
The most populous age groups in Cloverdale are 40 to 44 Years (545 | 12.2%) for men and 50 to 54 Years (416 | 9.2%) for women.
| Age Bracket | Male | Female |
| Under 5 Years | 58 (1.3%) | 183 (4.1%) |
| 5 to 9 Years | 325 (7.3%) | 396 (8.8%) |
| 10 to 14 Years | 279 (6.3%) | 263 (5.8%) |
| 15 to 19 Years | 296 (6.7%) | 362 (8.0%) |
| 20 to 24 Years | 159 (3.6%) | 134 (3.0%) |
| 25 to 29 Years | 272 (6.1%) | 183 (4.1%) |
| 30 to 34 Years | 261 (5.9%) | 220 (4.9%) |
| 35 to 39 Years | 353 (7.9%) | 222 (4.9%) |
| 40 to 44 Years | 545 (12.2%) | 385 (8.5%) |
| 45 to 49 Years | 171 (3.8%) | 171 (3.8%) |
| 50 to 54 Years | 303 (6.8%) | 416 (9.2%) |
| 55 to 59 Years | 257 (5.8%) | 256 (5.7%) |
| 60 to 64 Years | 312 (7.0%) | 345 (7.6%) |
| 65 to 69 Years | 395 (8.9%) | 345 (7.6%) |
| 70 to 74 Years | 232 (5.2%) | 266 (5.9%) |
| 75 to 79 Years | 70 (1.6%) | 223 (4.9%) |
| 80 to 84 Years | 88 (2.0%) | 29 (0.6%) |
| 85 Years and over | 73 (1.6%) | 116 (2.6%) |
| Total | 4,449 (100.0%) | 4,515 (100.0%) |
Families and Households in Cloverdale
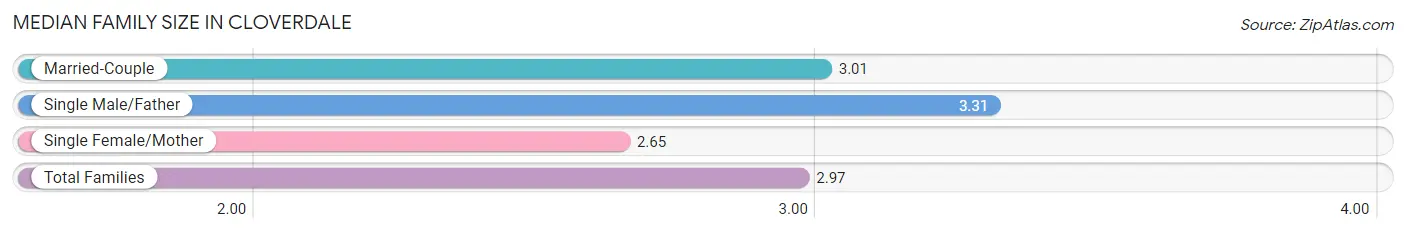
Median Family Size in Cloverdale
The median family size in Cloverdale is 2.97 persons per family, with single male/father families (104 | 4.4%) accounting for the largest median family size of 3.31 persons per family. On the other hand, single female/mother families (358 | 15.2%) represent the smallest median family size with 2.65 persons per family.
| Family Type | # Families | Family Size |
| Married-Couple | 1,892 (80.4%) | 3.01 |
| Single Male/Father | 104 (4.4%) | 3.31 |
| Single Female/Mother | 358 (15.2%) | 2.65 |
| Total Families | 2,354 (100.0%) | 2.97 |
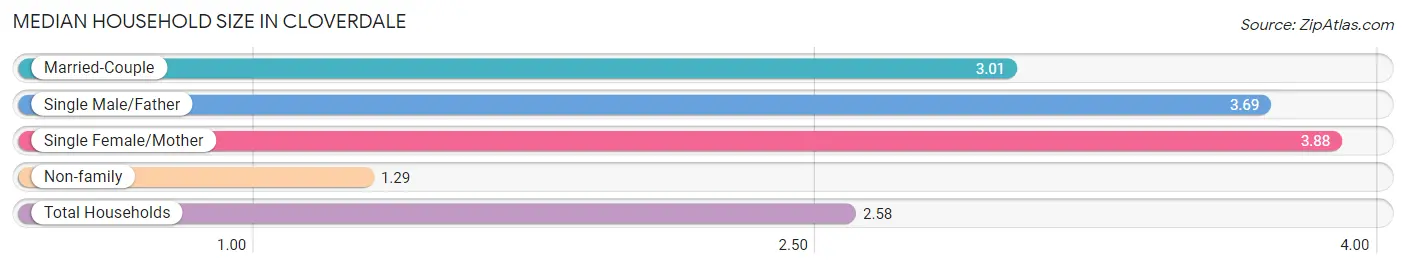
Median Household Size in Cloverdale
The median household size in Cloverdale is 2.58 persons per household, with single female/mother households (358 | 10.4%) accounting for the largest median household size of 3.88 persons per household. non-family households (1,088 | 31.6%) represent the smallest median household size with 1.29 persons per household.
| Household Type | # Households | Household Size |
| Married-Couple | 1,892 (55.0%) | 3.01 |
| Single Male/Father | 104 (3.0%) | 3.69 |
| Single Female/Mother | 358 (10.4%) | 3.88 |
| Non-family | 1,088 (31.6%) | 1.29 |
| Total Households | 3,442 (100.0%) | 2.58 |
Household Size by Marriage Status in Cloverdale
Out of a total of 3,442 households in Cloverdale, 2,354 (68.4%) are family households, while 1,088 (31.6%) are nonfamily households. The most numerous type of family households are 2-person households, comprising 1,004, and the most common type of nonfamily households are 1-person households, comprising 827.
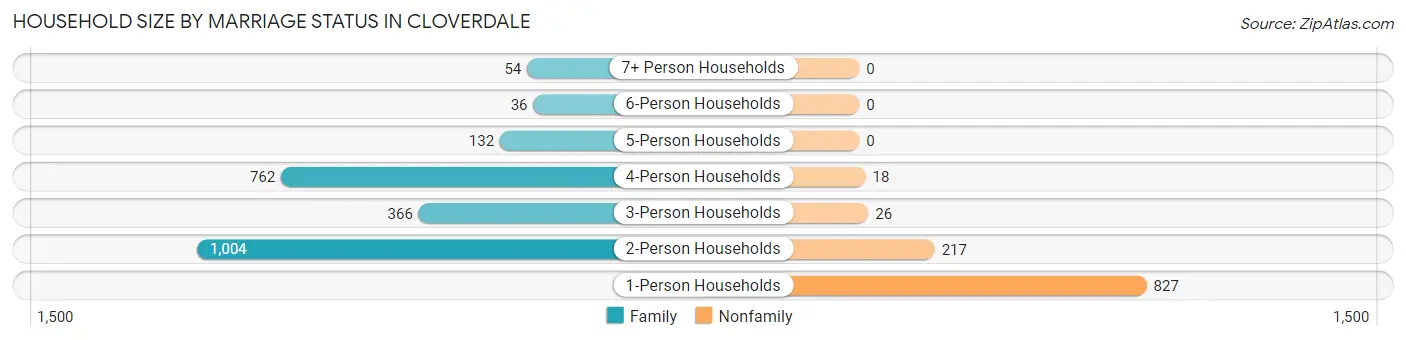
| Household Size | Family Households | Nonfamily Households |
| 1-Person Households | - | 827 (24.0%) |
| 2-Person Households | 1,004 (29.2%) | 217 (6.3%) |
| 3-Person Households | 366 (10.6%) | 26 (0.8%) |
| 4-Person Households | 762 (22.1%) | 18 (0.5%) |
| 5-Person Households | 132 (3.8%) | 0 (0.0%) |
| 6-Person Households | 36 (1.1%) | 0 (0.0%) |
| 7+ Person Households | 54 (1.6%) | 0 (0.0%) |
| Total | 2,354 (68.4%) | 1,088 (31.6%) |
Female Fertility in Cloverdale
Fertility by Age in Cloverdale
Average fertility rate in Cloverdale is 23.0 births per 1,000 women. Women in the age bracket of 20 to 34 years have the highest fertility rate with 35.0 births per 1,000 women. Women in the age bracket of 35 to 50 years acount for 51.3% of all women with births.
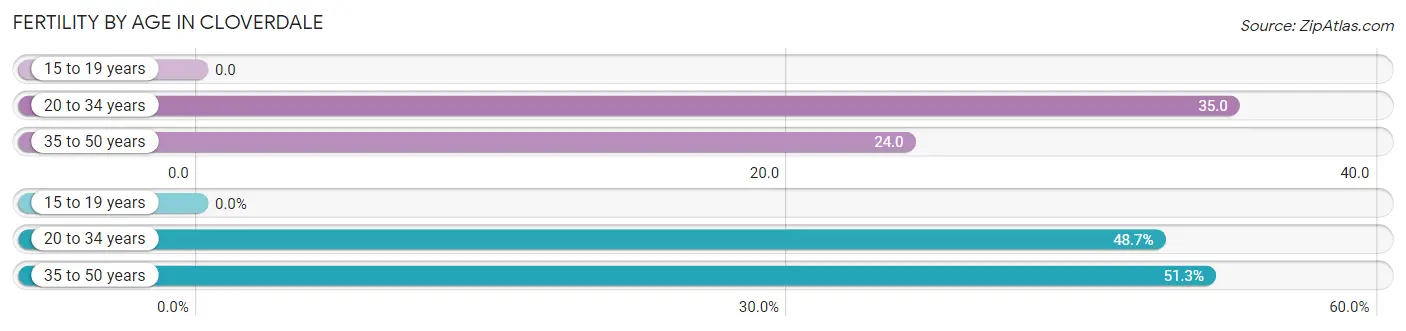
| Age Bracket | Women with Births | Births / 1,000 Women |
| 15 to 19 years | 0 (0.0%) | 0.0 |
| 20 to 34 years | 19 (48.7%) | 35.0 |
| 35 to 50 years | 20 (51.3%) | 24.0 |
| Total | 39 (100.0%) | 23.0 |
Fertility by Age by Marriage Status in Cloverdale
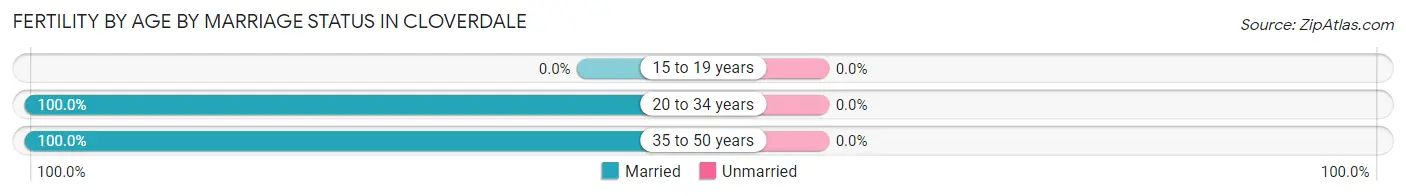
| Age Bracket | Married | Unmarried |
| 15 to 19 years | 0 (0.0%) | 0 (0.0%) |
| 20 to 34 years | 19 (100.0%) | 0 (0.0%) |
| 35 to 50 years | 20 (100.0%) | 0 (0.0%) |
| Total | 39 (100.0%) | 0 (0.0%) |
Fertility by Education in Cloverdale
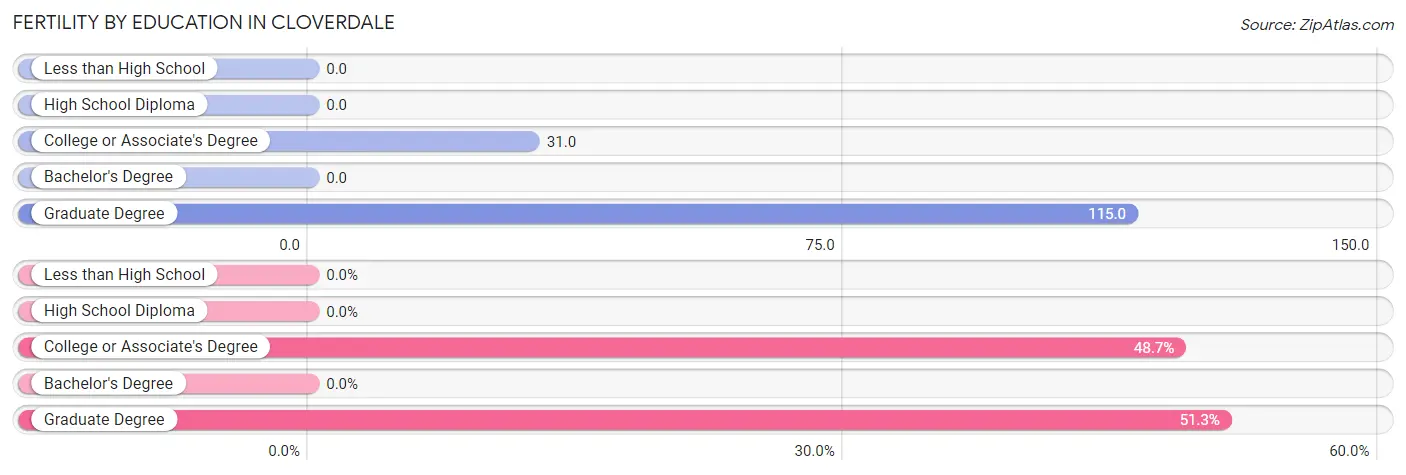
| Educational Attainment | Women with Births | Births / 1,000 Women |
| Less than High School | 0 (0.0%) | 0.0 |
| High School Diploma | 0 (0.0%) | 0.0 |
| College or Associate's Degree | 19 (48.7%) | 31.0 |
| Bachelor's Degree | 0 (0.0%) | 0.0 |
| Graduate Degree | 20 (51.3%) | 115.0 |
| Total | 39 (100.0%) | 23.0 |
Fertility by Education by Marriage Status in Cloverdale
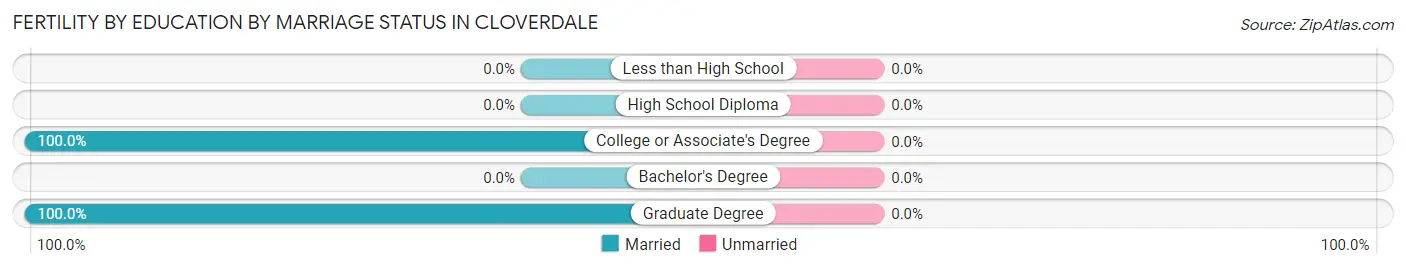
| Educational Attainment | Married | Unmarried |
| Less than High School | 0 (0.0%) | 0 (0.0%) |
| High School Diploma | 0 (0.0%) | 0 (0.0%) |
| College or Associate's Degree | 19 (100.0%) | 0 (0.0%) |
| Bachelor's Degree | 0 (0.0%) | 0 (0.0%) |
| Graduate Degree | 20 (100.0%) | 0 (0.0%) |
| Total | 39 (100.0%) | 0 (0.0%) |
Employment Characteristics in Cloverdale
Employment by Class of Employer in Cloverdale
Among the 4,357 employed individuals in Cloverdale, private company employees (2,962 | 68.0%), local government employees (423 | 9.7%), and not-for-profit organizations (354 | 8.1%) make up the most common classes of employment.
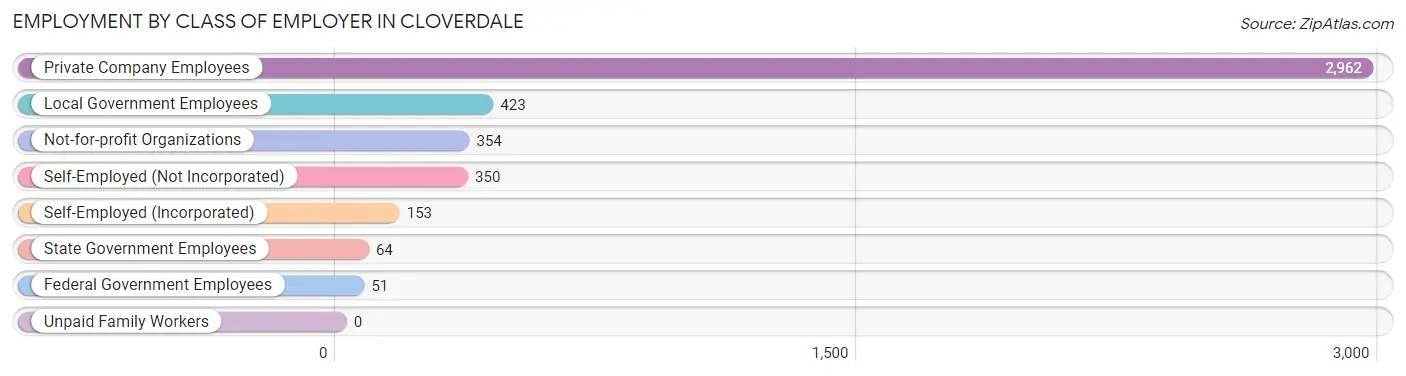
| Employer Class | # Employees | % Employees |
| Private Company Employees | 2,962 | 68.0% |
| Self-Employed (Incorporated) | 153 | 3.5% |
| Self-Employed (Not Incorporated) | 350 | 8.0% |
| Not-for-profit Organizations | 354 | 8.1% |
| Local Government Employees | 423 | 9.7% |
| State Government Employees | 64 | 1.5% |
| Federal Government Employees | 51 | 1.2% |
| Unpaid Family Workers | 0 | 0.0% |
| Total | 4,357 | 100.0% |
Employment Status by Age in Cloverdale
According to the labor force statistics for Cloverdale, out of the total population over 16 years of age (7,389), 61.3% or 4,529 individuals are in the labor force, with 3.8% or 172 of them unemployed. The age group with the highest labor force participation rate is 25 to 29 years, with 91.9% or 418 individuals in the labor force. Within the labor force, the 30 to 34 years age range has the highest percentage of unemployed individuals, with 17.9% or 70 of them being unemployed.
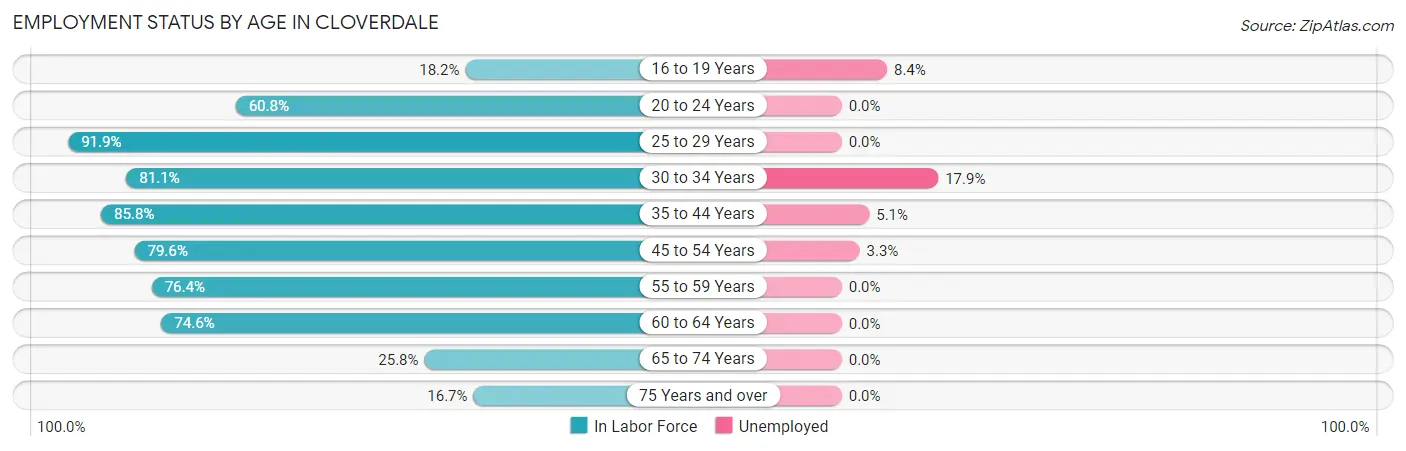
| Age Bracket | In Labor Force | Unemployed |
| 16 to 19 Years | 107 (18.2%) | 9 (8.4%) |
| 20 to 24 Years | 178 (60.8%) | 0 (0.0%) |
| 25 to 29 Years | 418 (91.9%) | 0 (0.0%) |
| 30 to 34 Years | 390 (81.1%) | 70 (17.9%) |
| 35 to 44 Years | 1,291 (85.8%) | 66 (5.1%) |
| 45 to 54 Years | 845 (79.6%) | 28 (3.3%) |
| 55 to 59 Years | 392 (76.4%) | 0 (0.0%) |
| 60 to 64 Years | 490 (74.6%) | 0 (0.0%) |
| 65 to 74 Years | 319 (25.8%) | 0 (0.0%) |
| 75 Years and over | 100 (16.7%) | 0 (0.0%) |
| Total | 4,529 (61.3%) | 172 (3.8%) |
Employment Status by Educational Attainment in Cloverdale
According to labor force statistics for Cloverdale, 81.9% of individuals (3,826) out of the total population between 25 and 64 years of age (4,672) are in the labor force, with 4.3% or 165 of them being unemployed. The group with the highest labor force participation rate are those with the educational attainment of bachelor's degree or higher, with 84.1% or 877 individuals in the labor force. Within the labor force, individuals with high school diploma education have the highest percentage of unemployment, with 8.2% or 63 of them being unemployed.
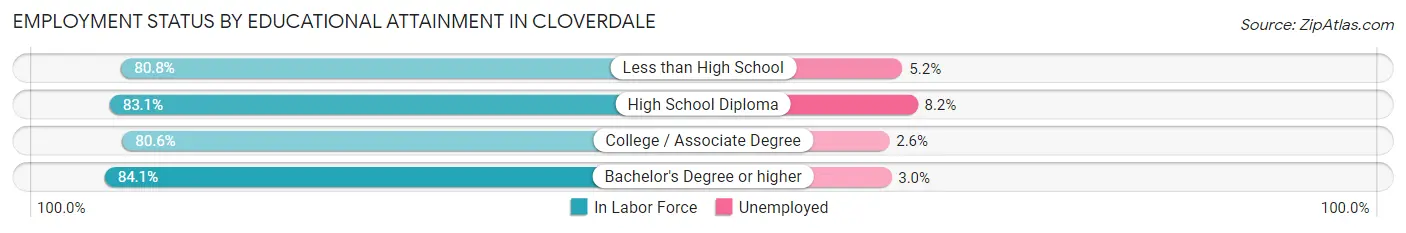
| Educational Attainment | In Labor Force | Unemployed |
| Less than High School | 673 (80.8%) | 43 (5.2%) |
| High School Diploma | 765 (83.1%) | 76 (8.2%) |
| College / Associate Degree | 1,511 (80.6%) | 49 (2.6%) |
| Bachelor's Degree or higher | 877 (84.1%) | 31 (3.0%) |
| Total | 3,826 (81.9%) | 201 (4.3%) |
Employment Occupations by Sex in Cloverdale
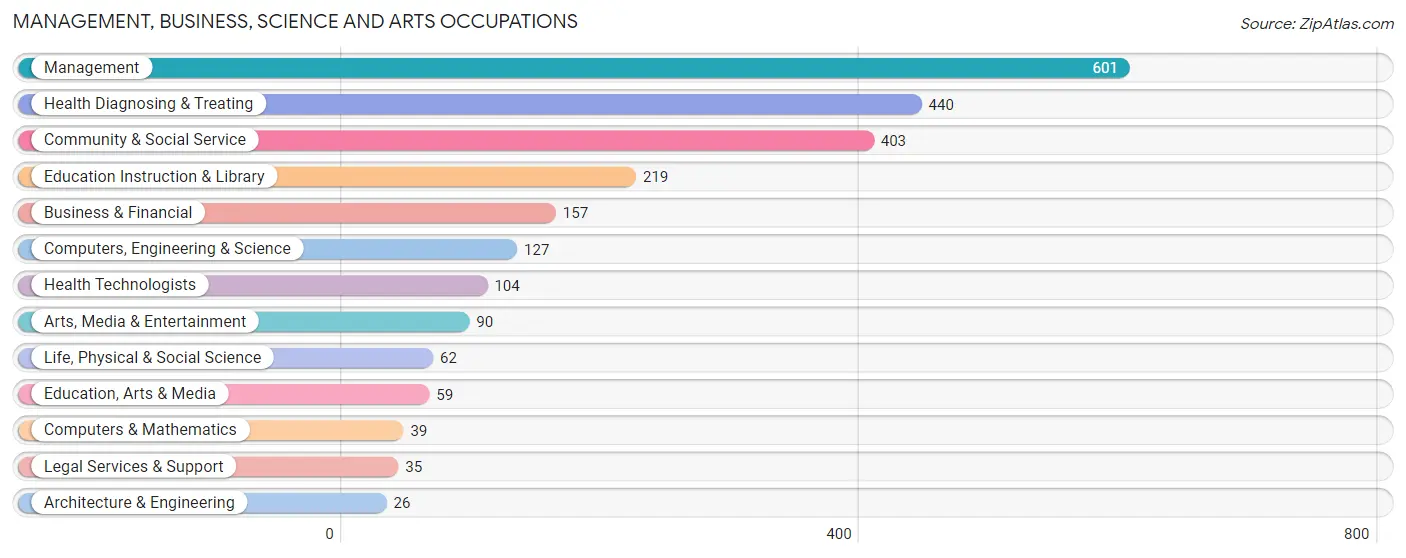
Management, Business, Science and Arts Occupations
The most common Management, Business, Science and Arts occupations in Cloverdale are Management (601 | 13.8%), Health Diagnosing & Treating (440 | 10.1%), Community & Social Service (403 | 9.2%), Education Instruction & Library (219 | 5.0%), and Business & Financial (157 | 3.6%).
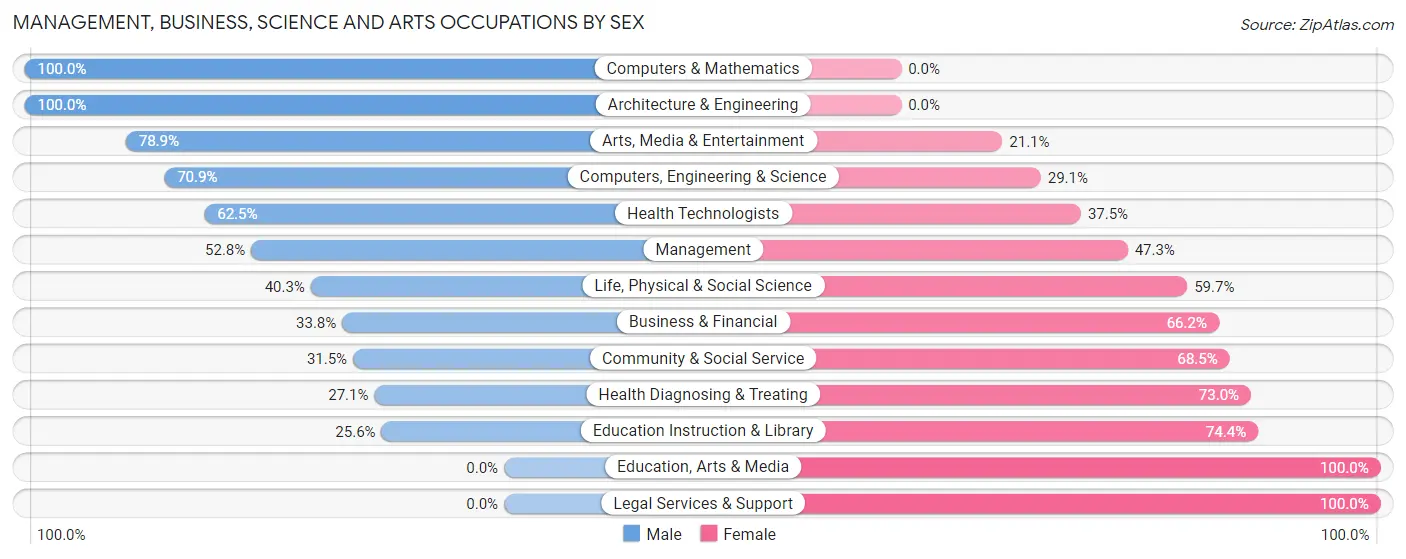
Management, Business, Science and Arts Occupations by Sex
Within the Management, Business, Science and Arts occupations in Cloverdale, the most male-oriented occupations are Computers & Mathematics (100.0%), Architecture & Engineering (100.0%), and Arts, Media & Entertainment (78.9%), while the most female-oriented occupations are Education, Arts & Media (100.0%), Legal Services & Support (100.0%), and Education Instruction & Library (74.4%).
| Occupation | Male | Female |
| Management | 317 (52.7%) | 284 (47.2%) |
| Business & Financial | 53 (33.8%) | 104 (66.2%) |
| Computers, Engineering & Science | 90 (70.9%) | 37 (29.1%) |
| Computers & Mathematics | 39 (100.0%) | 0 (0.0%) |
| Architecture & Engineering | 26 (100.0%) | 0 (0.0%) |
| Life, Physical & Social Science | 25 (40.3%) | 37 (59.7%) |
| Community & Social Service | 127 (31.5%) | 276 (68.5%) |
| Education, Arts & Media | 0 (0.0%) | 59 (100.0%) |
| Legal Services & Support | 0 (0.0%) | 35 (100.0%) |
| Education Instruction & Library | 56 (25.6%) | 163 (74.4%) |
| Arts, Media & Entertainment | 71 (78.9%) | 19 (21.1%) |
| Health Diagnosing & Treating | 119 (27.1%) | 321 (73.0%) |
| Health Technologists | 65 (62.5%) | 39 (37.5%) |
| Total (Category) | 706 (40.9%) | 1,022 (59.1%) |
| Total (Overall) | 2,419 (55.5%) | 1,938 (44.5%) |
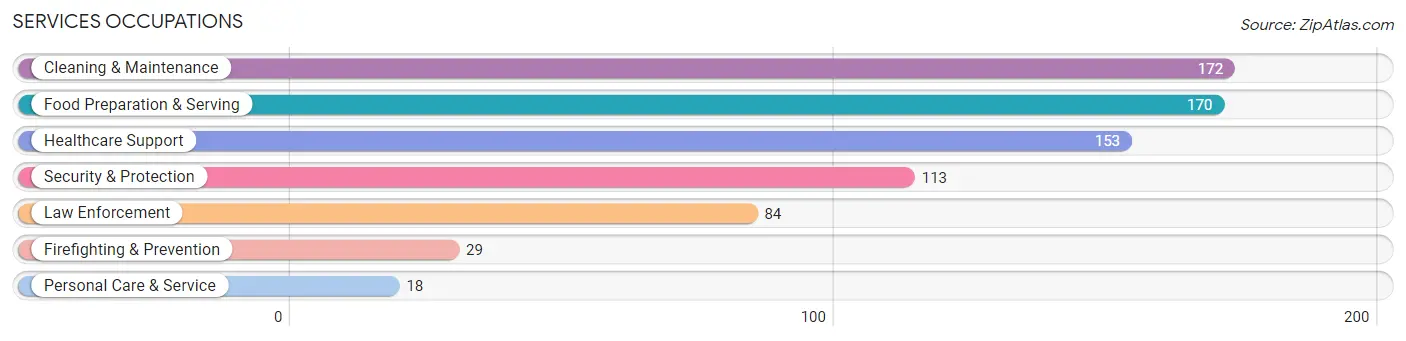
Services Occupations
The most common Services occupations in Cloverdale are Cleaning & Maintenance (172 | 4.0%), Food Preparation & Serving (170 | 3.9%), Healthcare Support (153 | 3.5%), Security & Protection (113 | 2.6%), and Law Enforcement (84 | 1.9%).
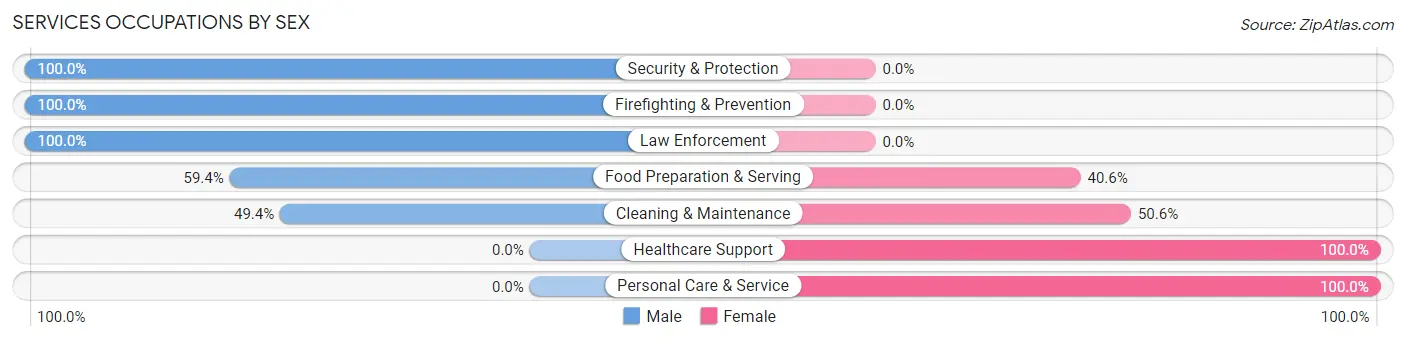
Services Occupations by Sex
Within the Services occupations in Cloverdale, the most male-oriented occupations are Security & Protection (100.0%), Firefighting & Prevention (100.0%), and Law Enforcement (100.0%), while the most female-oriented occupations are Healthcare Support (100.0%), Personal Care & Service (100.0%), and Cleaning & Maintenance (50.6%).
| Occupation | Male | Female |
| Healthcare Support | 0 (0.0%) | 153 (100.0%) |
| Security & Protection | 113 (100.0%) | 0 (0.0%) |
| Firefighting & Prevention | 29 (100.0%) | 0 (0.0%) |
| Law Enforcement | 84 (100.0%) | 0 (0.0%) |
| Food Preparation & Serving | 101 (59.4%) | 69 (40.6%) |
| Cleaning & Maintenance | 85 (49.4%) | 87 (50.6%) |
| Personal Care & Service | 0 (0.0%) | 18 (100.0%) |
| Total (Category) | 299 (47.8%) | 327 (52.2%) |
| Total (Overall) | 2,419 (55.5%) | 1,938 (44.5%) |
Sales and Office Occupations
The most common Sales and Office occupations in Cloverdale are Sales & Related (422 | 9.7%), and Office & Administration (302 | 6.9%).

Sales and Office Occupations by Sex
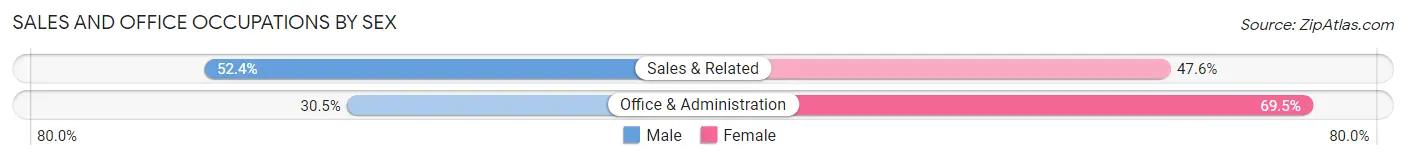
| Occupation | Male | Female |
| Sales & Related | 221 (52.4%) | 201 (47.6%) |
| Office & Administration | 92 (30.5%) | 210 (69.5%) |
| Total (Category) | 313 (43.2%) | 411 (56.8%) |
| Total (Overall) | 2,419 (55.5%) | 1,938 (44.5%) |
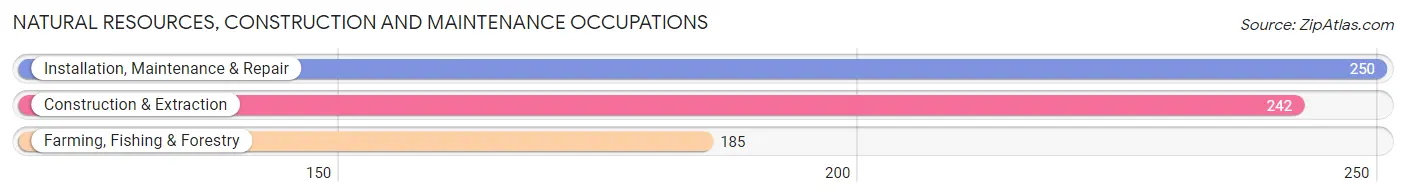
Natural Resources, Construction and Maintenance Occupations
The most common Natural Resources, Construction and Maintenance occupations in Cloverdale are Installation, Maintenance & Repair (250 | 5.7%), Construction & Extraction (242 | 5.6%), and Farming, Fishing & Forestry (185 | 4.3%).
Natural Resources, Construction and Maintenance Occupations by Sex
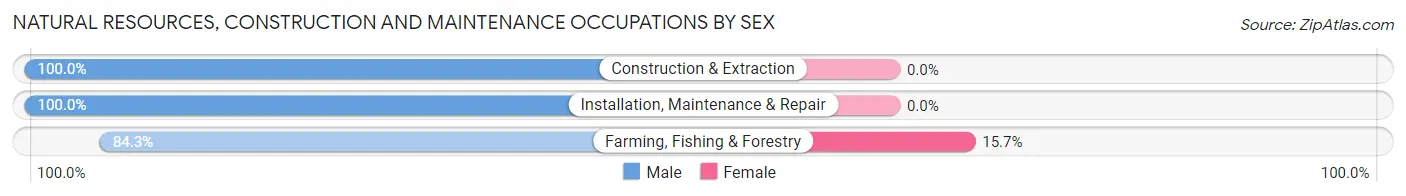
| Occupation | Male | Female |
| Farming, Fishing & Forestry | 156 (84.3%) | 29 (15.7%) |
| Construction & Extraction | 242 (100.0%) | 0 (0.0%) |
| Installation, Maintenance & Repair | 250 (100.0%) | 0 (0.0%) |
| Total (Category) | 648 (95.7%) | 29 (4.3%) |
| Total (Overall) | 2,419 (55.5%) | 1,938 (44.5%) |
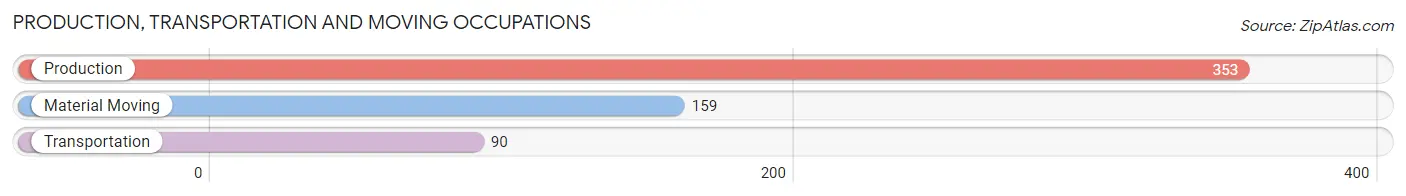
Production, Transportation and Moving Occupations
The most common Production, Transportation and Moving occupations in Cloverdale are Production (353 | 8.1%), Material Moving (159 | 3.6%), and Transportation (90 | 2.1%).
Production, Transportation and Moving Occupations by Sex
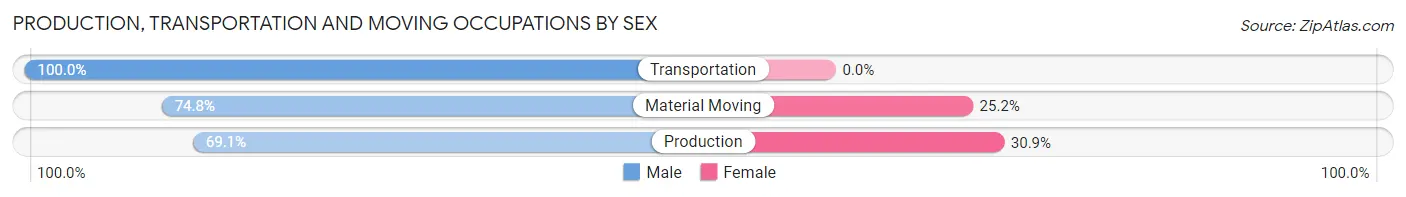
| Occupation | Male | Female |
| Production | 244 (69.1%) | 109 (30.9%) |
| Transportation | 90 (100.0%) | 0 (0.0%) |
| Material Moving | 119 (74.8%) | 40 (25.2%) |
| Total (Category) | 453 (75.2%) | 149 (24.7%) |
| Total (Overall) | 2,419 (55.5%) | 1,938 (44.5%) |
Employment Industries by Sex in Cloverdale
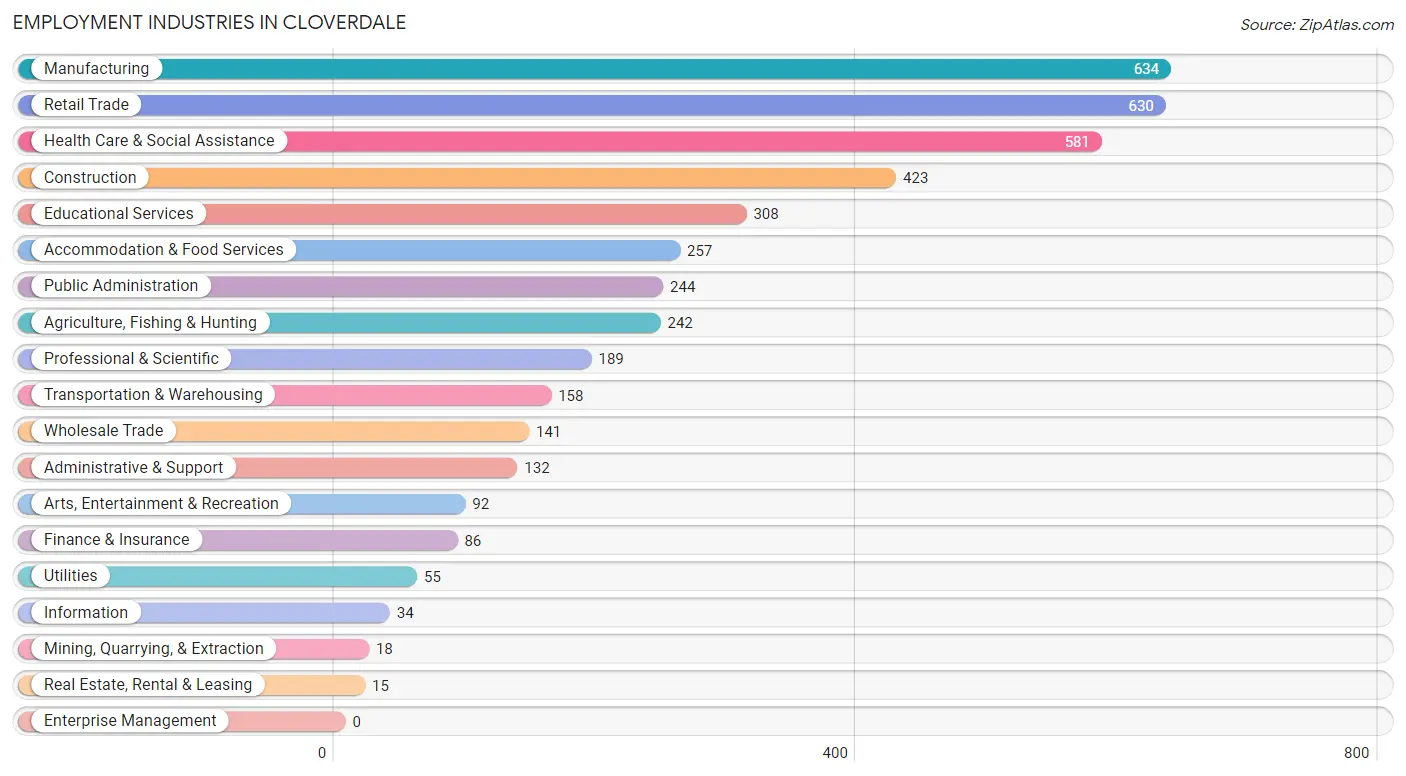
Employment Industries in Cloverdale
The major employment industries in Cloverdale include Manufacturing (634 | 14.5%), Retail Trade (630 | 14.5%), Health Care & Social Assistance (581 | 13.3%), Construction (423 | 9.7%), and Educational Services (308 | 7.1%).
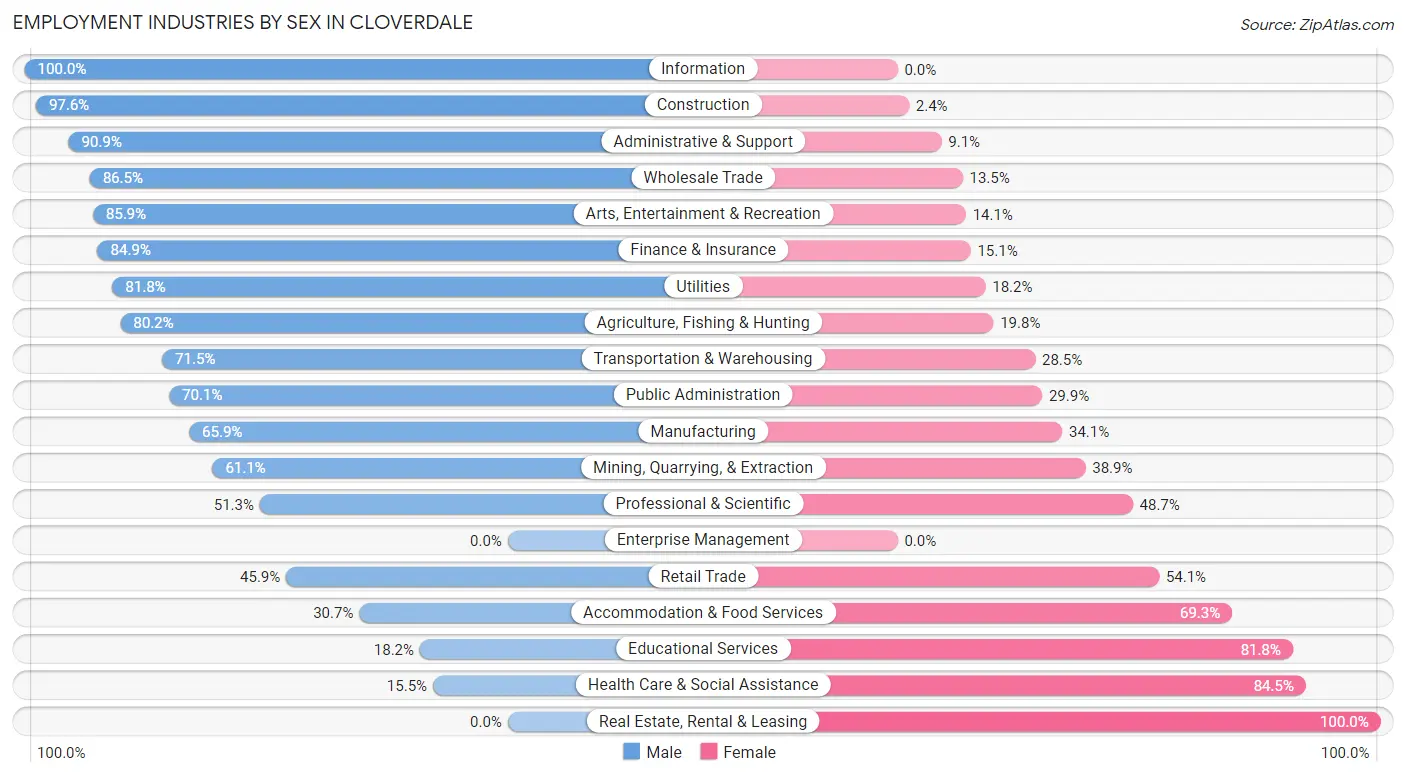
Employment Industries by Sex in Cloverdale
The Cloverdale industries that see more men than women are Information (100.0%), Construction (97.6%), and Administrative & Support (90.9%), whereas the industries that tend to have a higher number of women are Real Estate, Rental & Leasing (100.0%), Health Care & Social Assistance (84.5%), and Educational Services (81.8%).
| Industry | Male | Female |
| Agriculture, Fishing & Hunting | 194 (80.2%) | 48 (19.8%) |
| Mining, Quarrying, & Extraction | 11 (61.1%) | 7 (38.9%) |
| Construction | 413 (97.6%) | 10 (2.4%) |
| Manufacturing | 418 (65.9%) | 216 (34.1%) |
| Wholesale Trade | 122 (86.5%) | 19 (13.5%) |
| Retail Trade | 289 (45.9%) | 341 (54.1%) |
| Transportation & Warehousing | 113 (71.5%) | 45 (28.5%) |
| Utilities | 45 (81.8%) | 10 (18.2%) |
| Information | 34 (100.0%) | 0 (0.0%) |
| Finance & Insurance | 73 (84.9%) | 13 (15.1%) |
| Real Estate, Rental & Leasing | 0 (0.0%) | 15 (100.0%) |
| Professional & Scientific | 97 (51.3%) | 92 (48.7%) |
| Enterprise Management | 0 (0.0%) | 0 (0.0%) |
| Administrative & Support | 120 (90.9%) | 12 (9.1%) |
| Educational Services | 56 (18.2%) | 252 (81.8%) |
| Health Care & Social Assistance | 90 (15.5%) | 491 (84.5%) |
| Arts, Entertainment & Recreation | 79 (85.9%) | 13 (14.1%) |
| Accommodation & Food Services | 79 (30.7%) | 178 (69.3%) |
| Public Administration | 171 (70.1%) | 73 (29.9%) |
| Total | 2,419 (55.5%) | 1,938 (44.5%) |
Education in Cloverdale
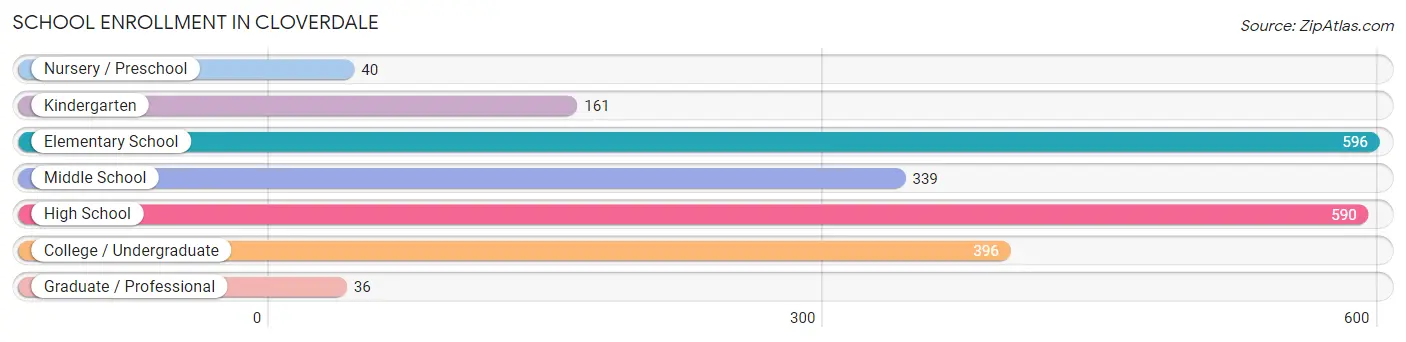
School Enrollment in Cloverdale
The most common levels of schooling among the 2,158 students in Cloverdale are elementary school (596 | 27.6%), high school (590 | 27.3%), and college / undergraduate (396 | 18.3%).
| School Level | # Students | % Students |
| Nursery / Preschool | 40 | 1.8% |
| Kindergarten | 161 | 7.5% |
| Elementary School | 596 | 27.6% |
| Middle School | 339 | 15.7% |
| High School | 590 | 27.3% |
| College / Undergraduate | 396 | 18.3% |
| Graduate / Professional | 36 | 1.7% |
| Total | 2,158 | 100.0% |
School Enrollment by Age by Funding Source in Cloverdale
Out of a total of 2,158 students who are enrolled in schools in Cloverdale, 97 (4.5%) attend a private institution, while the remaining 2,061 (95.5%) are enrolled in public schools. The age group of 3 to 4 year olds has the highest likelihood of being enrolled in private schools, with 10 (45.5% in the age bracket) enrolled. Conversely, the age group of 15 to 17 year olds has the lowest likelihood of being enrolled in a private school, with 352 (100.0% in the age bracket) attending a public institution.
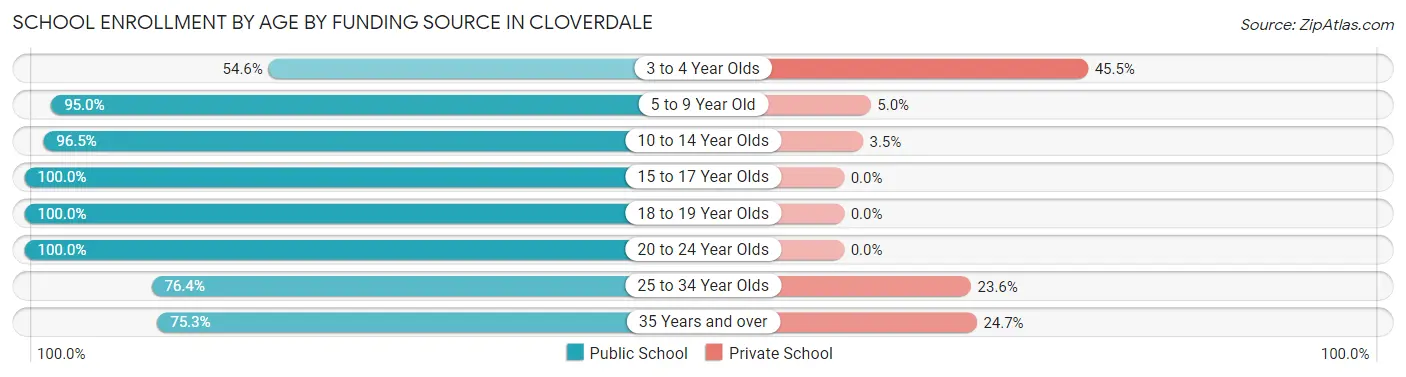
| Age Bracket | Public School | Private School |
| 3 to 4 Year Olds | 12 (54.5%) | 10 (45.5%) |
| 5 to 9 Year Old | 612 (95.0%) | 32 (5.0%) |
| 10 to 14 Year Olds | 523 (96.5%) | 19 (3.5%) |
| 15 to 17 Year Olds | 352 (100.0%) | 0 (0.0%) |
| 18 to 19 Year Olds | 306 (100.0%) | 0 (0.0%) |
| 20 to 24 Year Olds | 144 (100.0%) | 0 (0.0%) |
| 25 to 34 Year Olds | 42 (76.4%) | 13 (23.6%) |
| 35 Years and over | 70 (75.3%) | 23 (24.7%) |
| Total | 2,061 (95.5%) | 97 (4.5%) |
Educational Attainment by Field of Study in Cloverdale
Social sciences (273 | 16.1%), bio, nature & agricultural (228 | 13.4%), business (194 | 11.4%), arts & humanities (194 | 11.4%), and literature & languages (159 | 9.4%) are the most common fields of study among 1,697 individuals in Cloverdale who have obtained a bachelor's degree or higher.
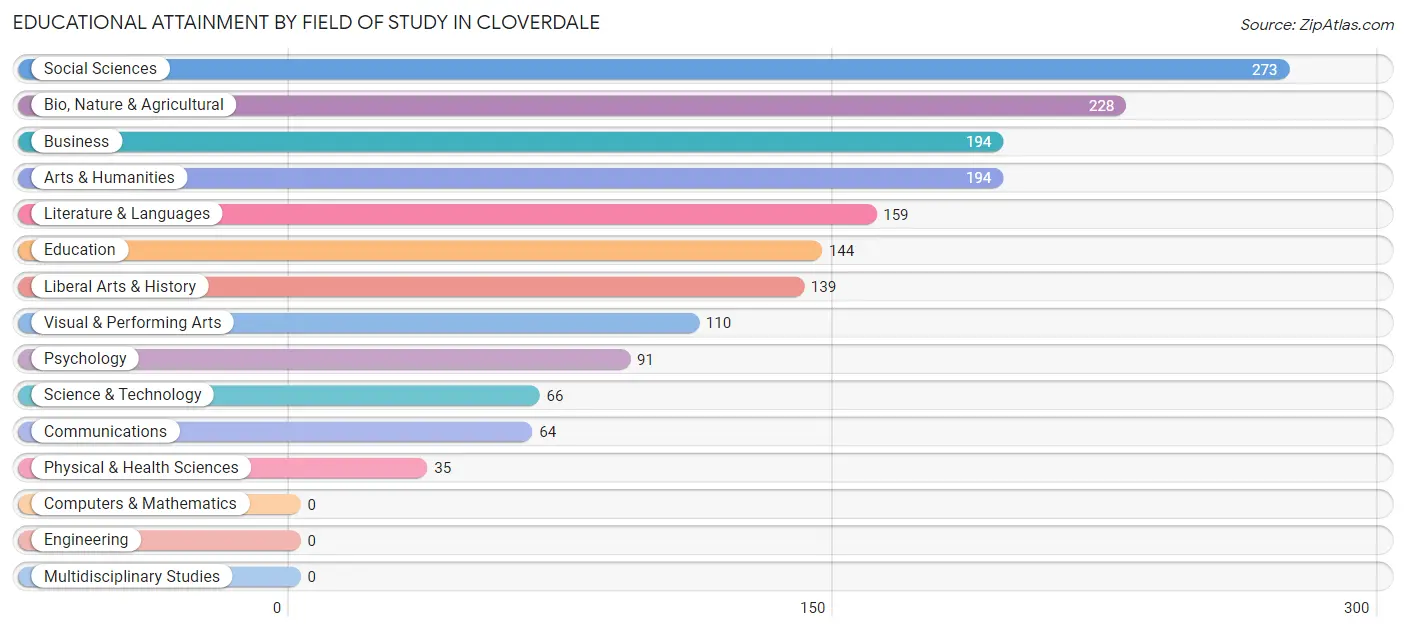
| Field of Study | # Graduates | % Graduates |
| Computers & Mathematics | 0 | 0.0% |
| Bio, Nature & Agricultural | 228 | 13.4% |
| Physical & Health Sciences | 35 | 2.1% |
| Psychology | 91 | 5.4% |
| Social Sciences | 273 | 16.1% |
| Engineering | 0 | 0.0% |
| Multidisciplinary Studies | 0 | 0.0% |
| Science & Technology | 66 | 3.9% |
| Business | 194 | 11.4% |
| Education | 144 | 8.5% |
| Literature & Languages | 159 | 9.4% |
| Liberal Arts & History | 139 | 8.2% |
| Visual & Performing Arts | 110 | 6.5% |
| Communications | 64 | 3.8% |
| Arts & Humanities | 194 | 11.4% |
| Total | 1,697 | 100.0% |
Transportation & Commute in Cloverdale
Vehicle Availability by Sex in Cloverdale
The most prevalent vehicle ownership categories in Cloverdale are males with 2 vehicles (922, accounting for 38.1%) and females with 2 vehicles (654, making up 47.6%).
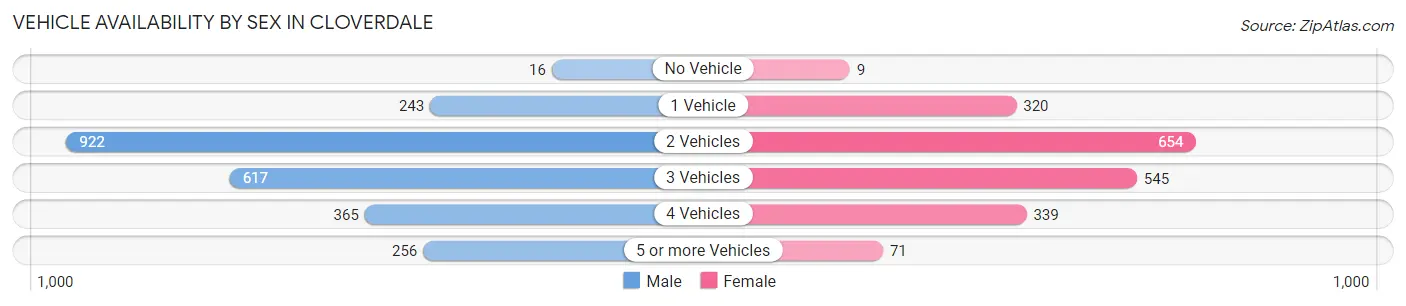
| Vehicles Available | Male | Female |
| No Vehicle | 16 (0.7%) | 9 (0.5%) |
| 1 Vehicle | 243 (10.1%) | 320 (16.5%) |
| 2 Vehicles | 922 (38.1%) | 654 (33.8%) |
| 3 Vehicles | 617 (25.5%) | 545 (28.1%) |
| 4 Vehicles | 365 (15.1%) | 339 (17.5%) |
| 5 or more Vehicles | 256 (10.6%) | 71 (3.7%) |
| Total | 2,419 (100.0%) | 1,938 (100.0%) |
Commute Time in Cloverdale
The most frequently occuring commute durations in Cloverdale are 5 to 9 minutes (698 commuters, 17.6%), 45 to 59 minutes (674 commuters, 17.0%), and 30 to 34 minutes (580 commuters, 14.6%).
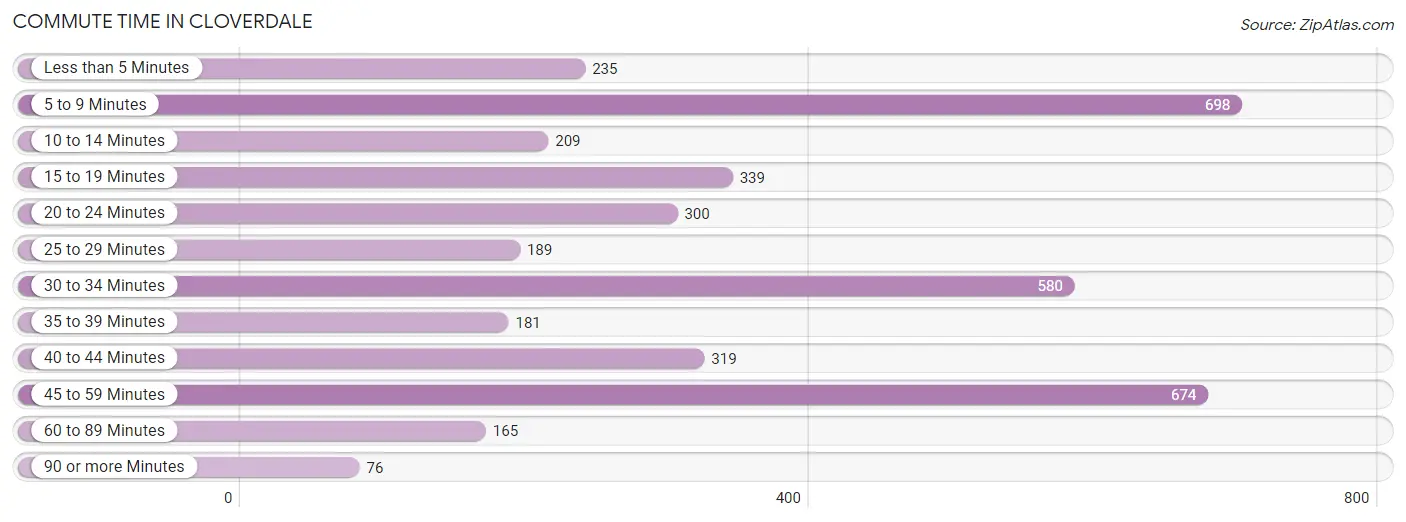
| Commute Time | # Commuters | % Commuters |
| Less than 5 Minutes | 235 | 5.9% |
| 5 to 9 Minutes | 698 | 17.6% |
| 10 to 14 Minutes | 209 | 5.3% |
| 15 to 19 Minutes | 339 | 8.6% |
| 20 to 24 Minutes | 300 | 7.6% |
| 25 to 29 Minutes | 189 | 4.8% |
| 30 to 34 Minutes | 580 | 14.6% |
| 35 to 39 Minutes | 181 | 4.6% |
| 40 to 44 Minutes | 319 | 8.1% |
| 45 to 59 Minutes | 674 | 17.0% |
| 60 to 89 Minutes | 165 | 4.2% |
| 90 or more Minutes | 76 | 1.9% |
Commute Time by Sex in Cloverdale
The most common commute times in Cloverdale are 45 to 59 minutes (363 commuters, 16.4%) for males and 5 to 9 minutes (346 commuters, 19.8%) for females.
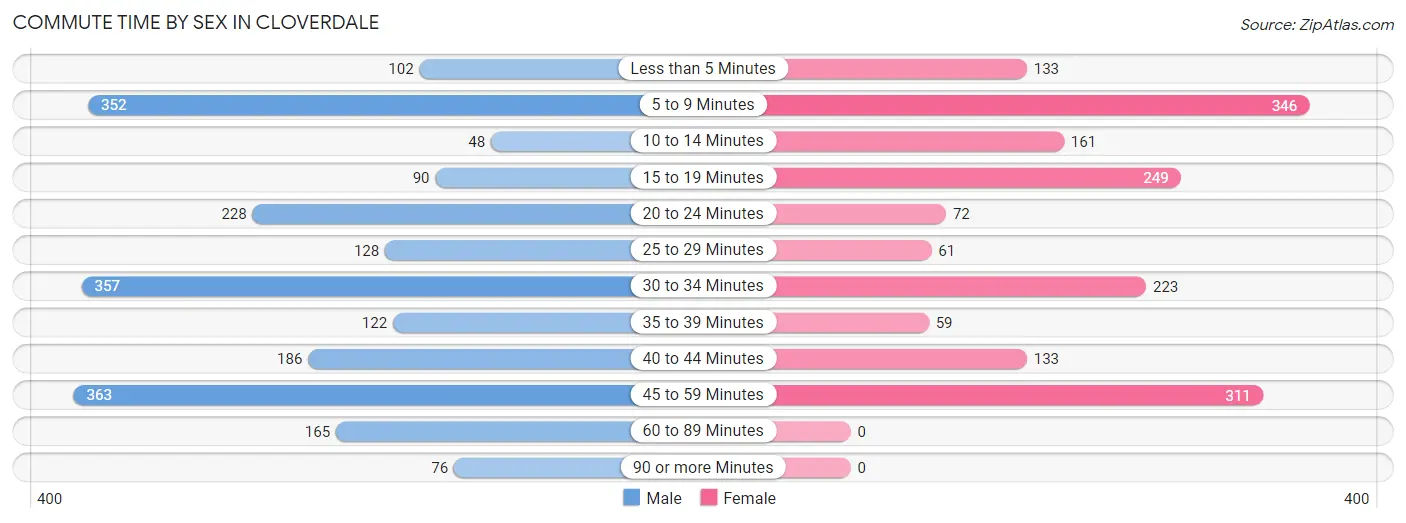
| Commute Time | Male | Female |
| Less than 5 Minutes | 102 (4.6%) | 133 (7.6%) |
| 5 to 9 Minutes | 352 (15.9%) | 346 (19.8%) |
| 10 to 14 Minutes | 48 (2.2%) | 161 (9.2%) |
| 15 to 19 Minutes | 90 (4.1%) | 249 (14.2%) |
| 20 to 24 Minutes | 228 (10.3%) | 72 (4.1%) |
| 25 to 29 Minutes | 128 (5.8%) | 61 (3.5%) |
| 30 to 34 Minutes | 357 (16.1%) | 223 (12.8%) |
| 35 to 39 Minutes | 122 (5.5%) | 59 (3.4%) |
| 40 to 44 Minutes | 186 (8.4%) | 133 (7.6%) |
| 45 to 59 Minutes | 363 (16.4%) | 311 (17.8%) |
| 60 to 89 Minutes | 165 (7.4%) | 0 (0.0%) |
| 90 or more Minutes | 76 (3.4%) | 0 (0.0%) |
Time of Departure to Work by Sex in Cloverdale
The most frequent times of departure to work in Cloverdale are 7:00 AM to 7:29 AM (345, 15.6%) for males and 8:30 AM to 8:59 AM (328, 18.8%) for females.
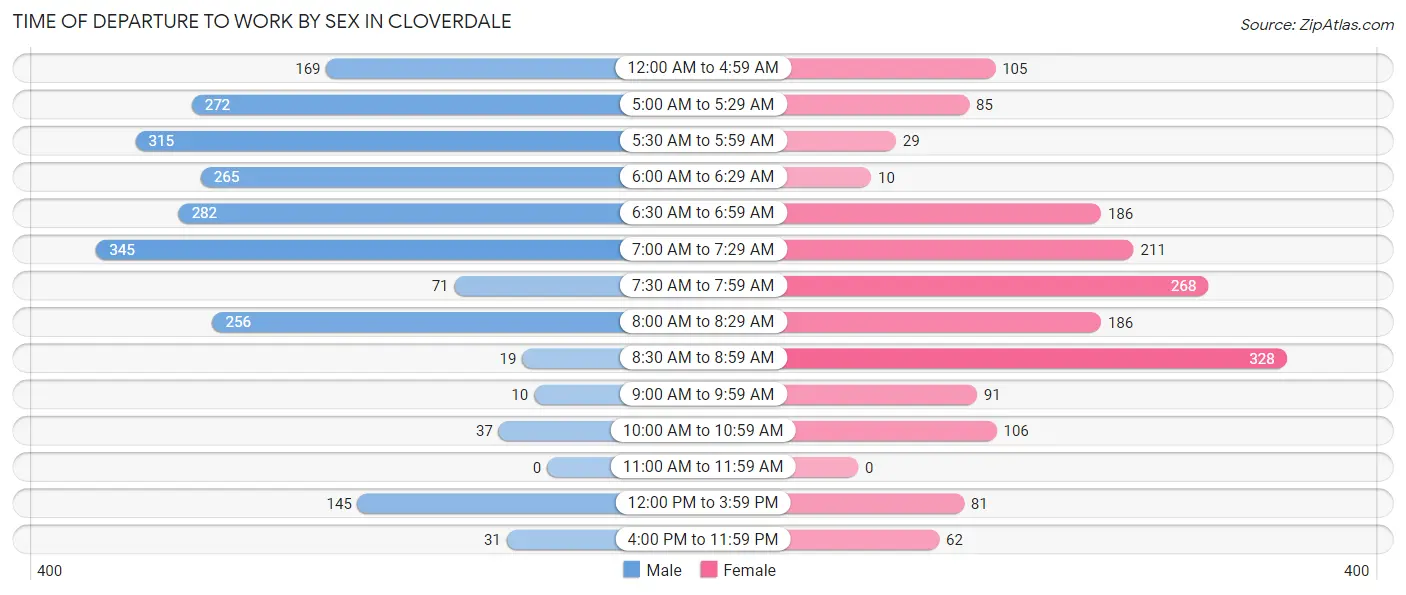
| Time of Departure | Male | Female |
| 12:00 AM to 4:59 AM | 169 (7.6%) | 105 (6.0%) |
| 5:00 AM to 5:29 AM | 272 (12.3%) | 85 (4.9%) |
| 5:30 AM to 5:59 AM | 315 (14.2%) | 29 (1.7%) |
| 6:00 AM to 6:29 AM | 265 (11.9%) | 10 (0.6%) |
| 6:30 AM to 6:59 AM | 282 (12.7%) | 186 (10.6%) |
| 7:00 AM to 7:29 AM | 345 (15.6%) | 211 (12.1%) |
| 7:30 AM to 7:59 AM | 71 (3.2%) | 268 (15.3%) |
| 8:00 AM to 8:29 AM | 256 (11.6%) | 186 (10.6%) |
| 8:30 AM to 8:59 AM | 19 (0.9%) | 328 (18.8%) |
| 9:00 AM to 9:59 AM | 10 (0.4%) | 91 (5.2%) |
| 10:00 AM to 10:59 AM | 37 (1.7%) | 106 (6.1%) |
| 11:00 AM to 11:59 AM | 0 (0.0%) | 0 (0.0%) |
| 12:00 PM to 3:59 PM | 145 (6.5%) | 81 (4.6%) |
| 4:00 PM to 11:59 PM | 31 (1.4%) | 62 (3.5%) |
| Total | 2,217 (100.0%) | 1,748 (100.0%) |
Housing Occupancy in Cloverdale
Occupancy by Ownership in Cloverdale
Of the total 3,442 dwellings in Cloverdale, owner-occupied units account for 2,384 (69.3%), while renter-occupied units make up 1,058 (30.7%).
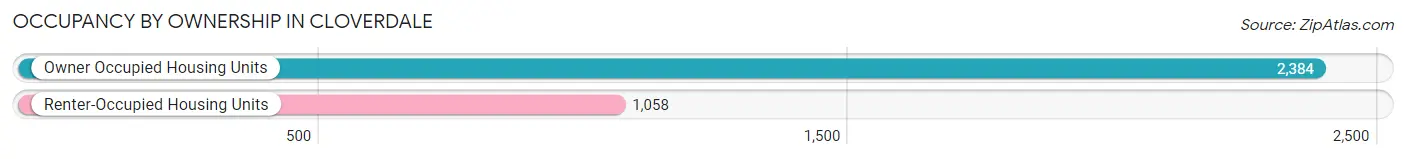
| Occupancy | # Housing Units | % Housing Units |
| Owner Occupied Housing Units | 2,384 | 69.3% |
| Renter-Occupied Housing Units | 1,058 | 30.7% |
| Total Occupied Housing Units | 3,442 | 100.0% |
Occupancy by Household Size in Cloverdale
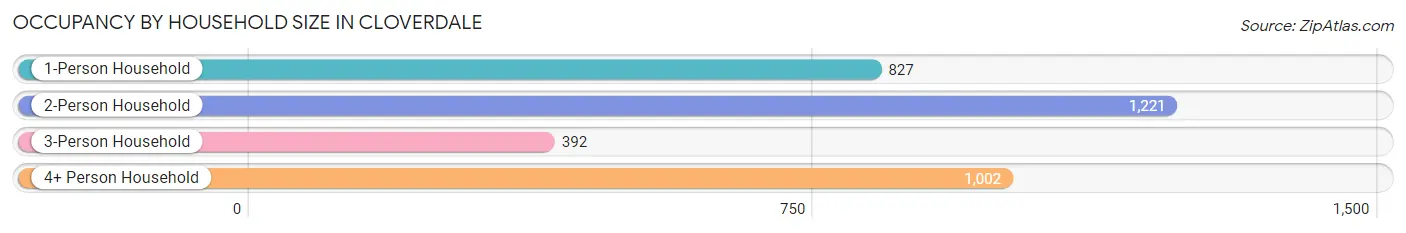
| Household Size | # Housing Units | % Housing Units |
| 1-Person Household | 827 | 24.0% |
| 2-Person Household | 1,221 | 35.5% |
| 3-Person Household | 392 | 11.4% |
| 4+ Person Household | 1,002 | 29.1% |
| Total Housing Units | 3,442 | 100.0% |
Occupancy by Ownership by Household Size in Cloverdale
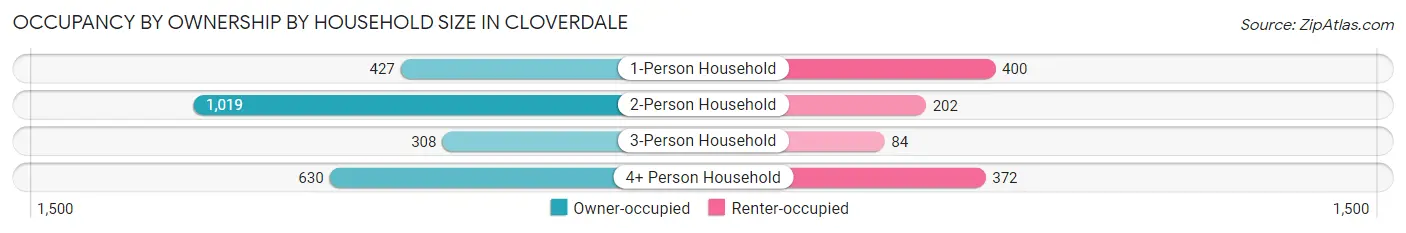
| Household Size | Owner-occupied | Renter-occupied |
| 1-Person Household | 427 (51.6%) | 400 (48.4%) |
| 2-Person Household | 1,019 (83.5%) | 202 (16.5%) |
| 3-Person Household | 308 (78.6%) | 84 (21.4%) |
| 4+ Person Household | 630 (62.9%) | 372 (37.1%) |
| Total Housing Units | 2,384 (69.3%) | 1,058 (30.7%) |
Occupancy by Educational Attainment in Cloverdale
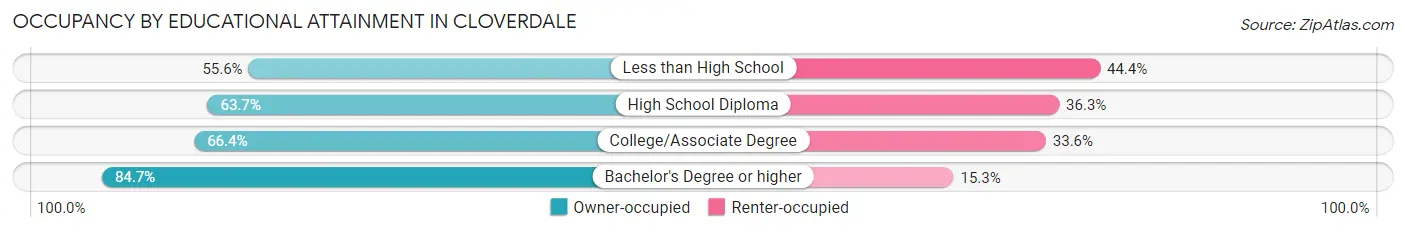
| Household Size | Owner-occupied | Renter-occupied |
| Less than High School | 292 (55.6%) | 233 (44.4%) |
| High School Diploma | 288 (63.7%) | 164 (36.3%) |
| College/Associate Degree | 1,026 (66.4%) | 520 (33.6%) |
| Bachelor's Degree or higher | 778 (84.7%) | 141 (15.3%) |
Occupancy by Age of Householder in Cloverdale
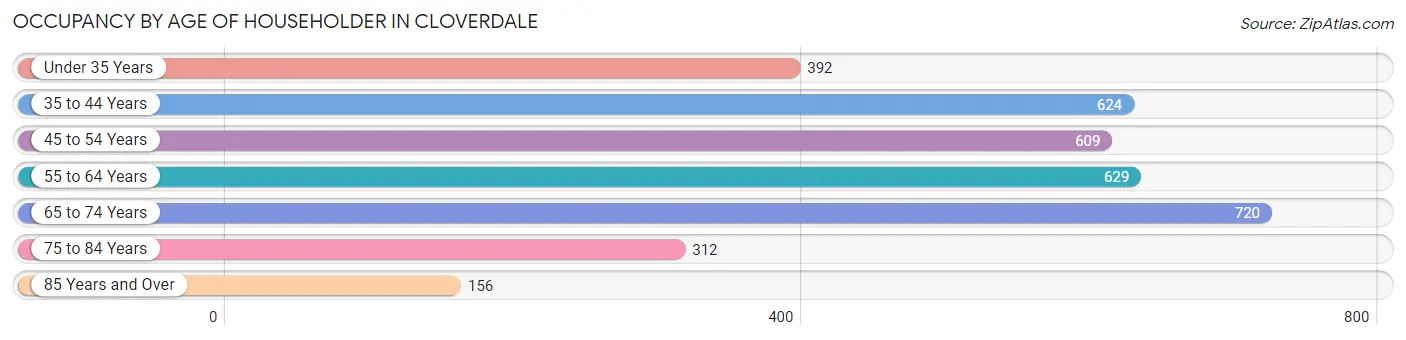
| Age Bracket | # Households | % Households |
| Under 35 Years | 392 | 11.4% |
| 35 to 44 Years | 624 | 18.1% |
| 45 to 54 Years | 609 | 17.7% |
| 55 to 64 Years | 629 | 18.3% |
| 65 to 74 Years | 720 | 20.9% |
| 75 to 84 Years | 312 | 9.1% |
| 85 Years and Over | 156 | 4.5% |
| Total | 3,442 | 100.0% |
Housing Finances in Cloverdale
Median Income by Occupancy in Cloverdale
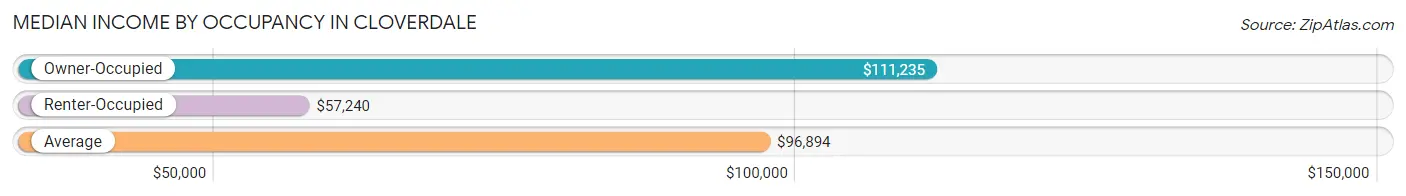
| Occupancy Type | # Households | Median Income |
| Owner-Occupied | 2,384 (69.3%) | $111,235 |
| Renter-Occupied | 1,058 (30.7%) | $57,240 |
| Average | 3,442 (100.0%) | $96,894 |
Occupancy by Householder Income Bracket in Cloverdale
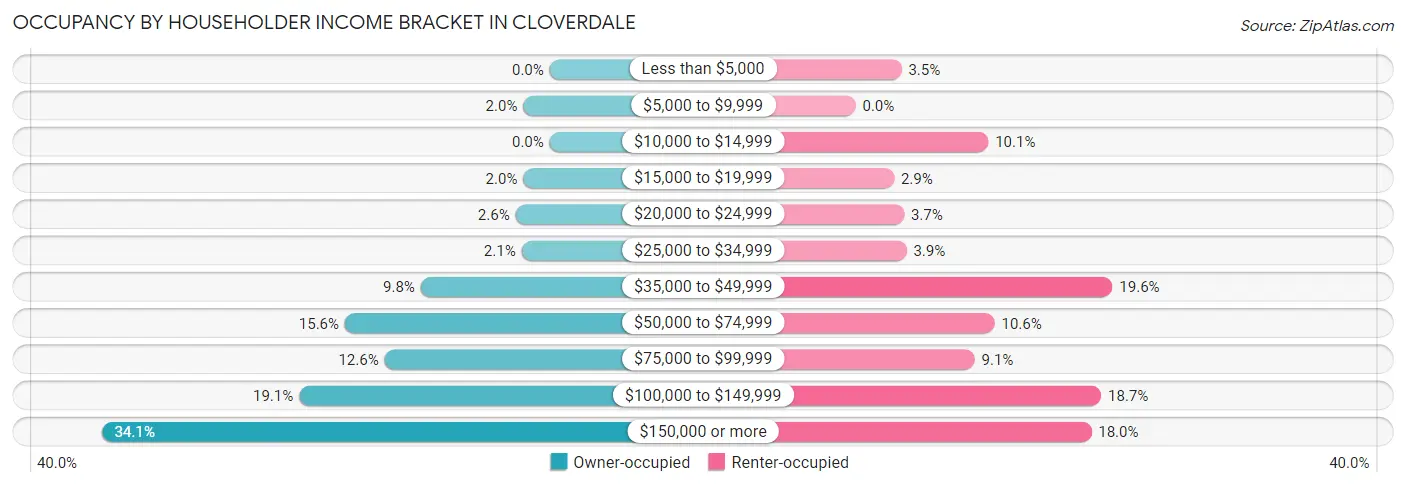
| Income Bracket | Owner-occupied | Renter-occupied |
| Less than $5,000 | 0 (0.0%) | 37 (3.5%) |
| $5,000 to $9,999 | 48 (2.0%) | 0 (0.0%) |
| $10,000 to $14,999 | 0 (0.0%) | 107 (10.1%) |
| $15,000 to $19,999 | 48 (2.0%) | 31 (2.9%) |
| $20,000 to $24,999 | 62 (2.6%) | 39 (3.7%) |
| $25,000 to $34,999 | 51 (2.1%) | 41 (3.9%) |
| $35,000 to $49,999 | 234 (9.8%) | 207 (19.6%) |
| $50,000 to $74,999 | 372 (15.6%) | 112 (10.6%) |
| $75,000 to $99,999 | 300 (12.6%) | 96 (9.1%) |
| $100,000 to $149,999 | 455 (19.1%) | 198 (18.7%) |
| $150,000 or more | 814 (34.1%) | 190 (18.0%) |
| Total | 2,384 (100.0%) | 1,058 (100.0%) |
Monthly Housing Cost Tiers in Cloverdale
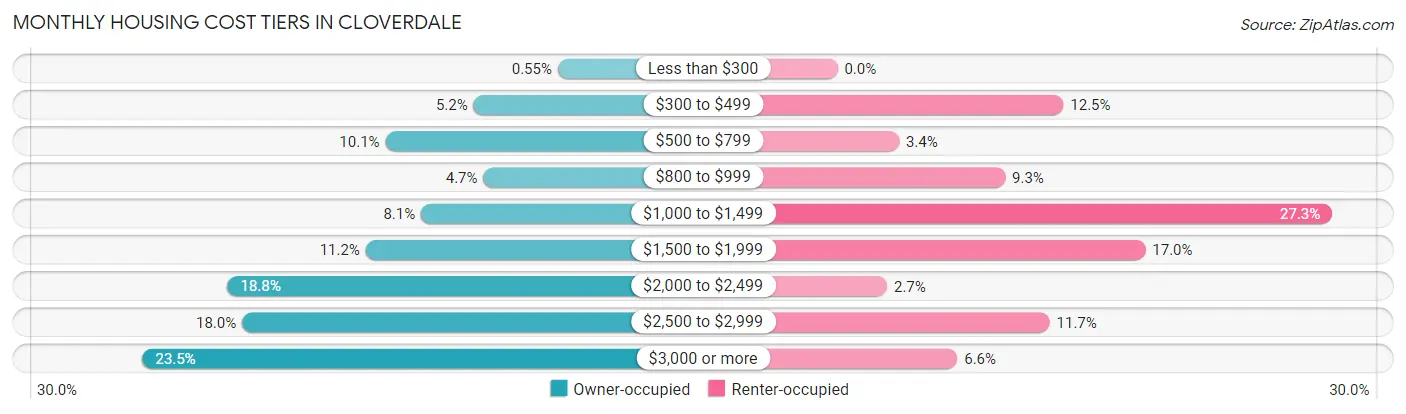
| Monthly Cost | Owner-occupied | Renter-occupied |
| Less than $300 | 13 (0.5%) | 0 (0.0%) |
| $300 to $499 | 124 (5.2%) | 132 (12.5%) |
| $500 to $799 | 240 (10.1%) | 36 (3.4%) |
| $800 to $999 | 111 (4.7%) | 98 (9.3%) |
| $1,000 to $1,499 | 193 (8.1%) | 289 (27.3%) |
| $1,500 to $1,999 | 266 (11.2%) | 180 (17.0%) |
| $2,000 to $2,499 | 448 (18.8%) | 29 (2.7%) |
| $2,500 to $2,999 | 429 (18.0%) | 124 (11.7%) |
| $3,000 or more | 560 (23.5%) | 70 (6.6%) |
| Total | 2,384 (100.0%) | 1,058 (100.0%) |
Physical Housing Characteristics in Cloverdale
Housing Structures in Cloverdale
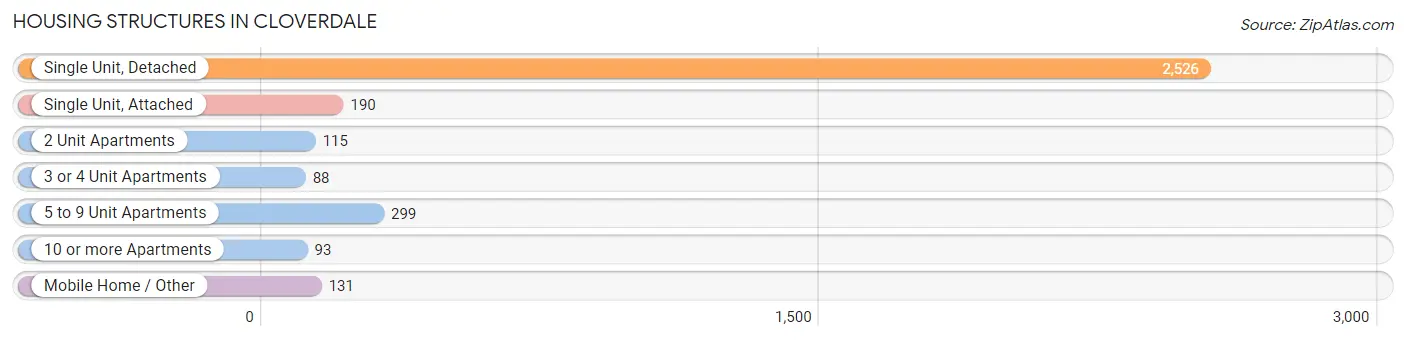
| Structure Type | # Housing Units | % Housing Units |
| Single Unit, Detached | 2,526 | 73.4% |
| Single Unit, Attached | 190 | 5.5% |
| 2 Unit Apartments | 115 | 3.3% |
| 3 or 4 Unit Apartments | 88 | 2.6% |
| 5 to 9 Unit Apartments | 299 | 8.7% |
| 10 or more Apartments | 93 | 2.7% |
| Mobile Home / Other | 131 | 3.8% |
| Total | 3,442 | 100.0% |
Housing Structures by Occupancy in Cloverdale
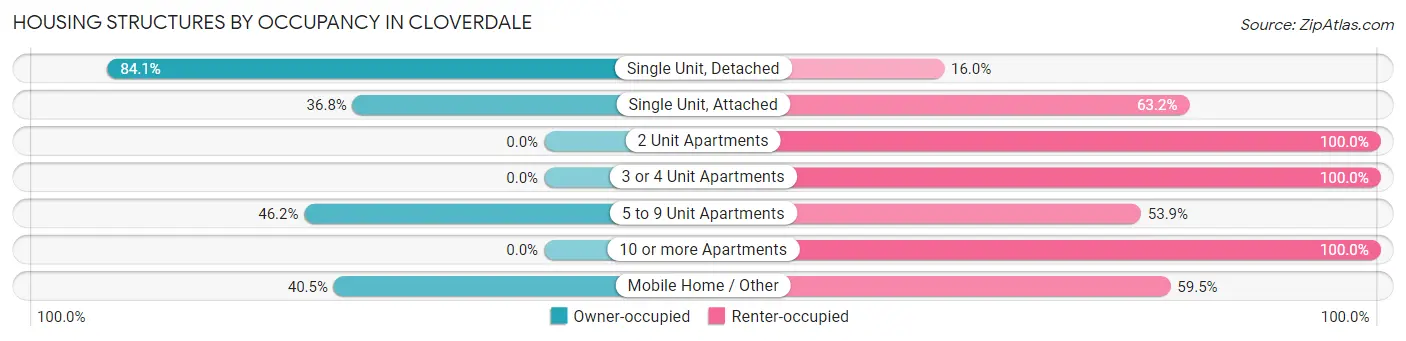
| Structure Type | Owner-occupied | Renter-occupied |
| Single Unit, Detached | 2,123 (84.1%) | 403 (16.0%) |
| Single Unit, Attached | 70 (36.8%) | 120 (63.2%) |
| 2 Unit Apartments | 0 (0.0%) | 115 (100.0%) |
| 3 or 4 Unit Apartments | 0 (0.0%) | 88 (100.0%) |
| 5 to 9 Unit Apartments | 138 (46.2%) | 161 (53.8%) |
| 10 or more Apartments | 0 (0.0%) | 93 (100.0%) |
| Mobile Home / Other | 53 (40.5%) | 78 (59.5%) |
| Total | 2,384 (69.3%) | 1,058 (30.7%) |
Housing Structures by Number of Rooms in Cloverdale
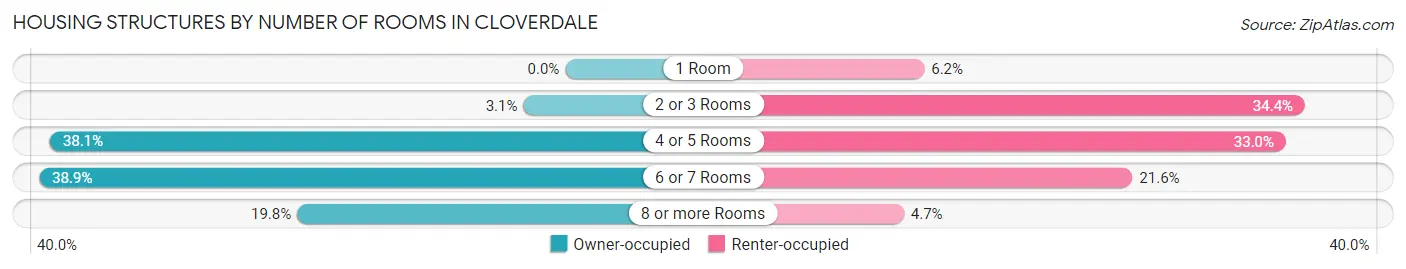
| Number of Rooms | Owner-occupied | Renter-occupied |
| 1 Room | 0 (0.0%) | 66 (6.2%) |
| 2 or 3 Rooms | 74 (3.1%) | 364 (34.4%) |
| 4 or 5 Rooms | 909 (38.1%) | 349 (33.0%) |
| 6 or 7 Rooms | 928 (38.9%) | 229 (21.6%) |
| 8 or more Rooms | 473 (19.8%) | 50 (4.7%) |
| Total | 2,384 (100.0%) | 1,058 (100.0%) |
Housing Structure by Heating Type in Cloverdale
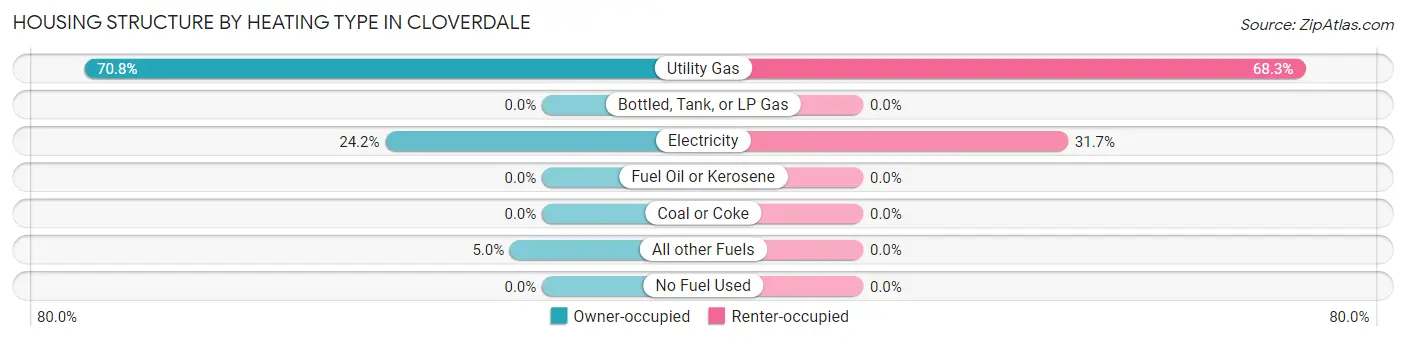
| Heating Type | Owner-occupied | Renter-occupied |
| Utility Gas | 1,688 (70.8%) | 723 (68.3%) |
| Bottled, Tank, or LP Gas | 0 (0.0%) | 0 (0.0%) |
| Electricity | 578 (24.2%) | 335 (31.7%) |
| Fuel Oil or Kerosene | 0 (0.0%) | 0 (0.0%) |
| Coal or Coke | 0 (0.0%) | 0 (0.0%) |
| All other Fuels | 118 (5.0%) | 0 (0.0%) |
| No Fuel Used | 0 (0.0%) | 0 (0.0%) |
| Total | 2,384 (100.0%) | 1,058 (100.0%) |
Household Vehicle Usage in Cloverdale
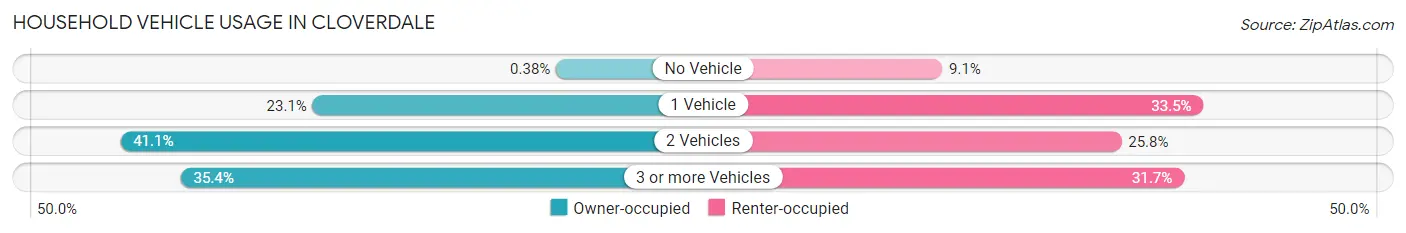
| Vehicles per Household | Owner-occupied | Renter-occupied |
| No Vehicle | 9 (0.4%) | 96 (9.1%) |
| 1 Vehicle | 551 (23.1%) | 354 (33.5%) |
| 2 Vehicles | 979 (41.1%) | 273 (25.8%) |
| 3 or more Vehicles | 845 (35.4%) | 335 (31.7%) |
| Total | 2,384 (100.0%) | 1,058 (100.0%) |
Real Estate & Mortgages in Cloverdale
Real Estate and Mortgage Overview in Cloverdale
| Characteristic | Without Mortgage | With Mortgage |
| Housing Units | 593 | 1,791 |
| Median Property Value | $574,700 | $606,700 |
| Median Household Income | $63,875 | $758 |
| Monthly Housing Costs | $646 | $560 |
| Real Estate Taxes | $2,979 | $17 |
Property Value by Mortgage Status in Cloverdale
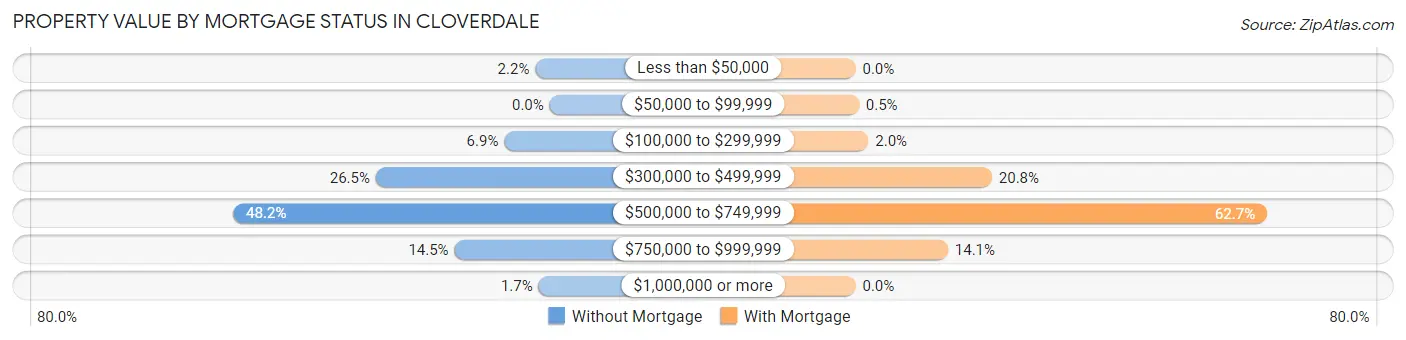
| Property Value | Without Mortgage | With Mortgage |
| Less than $50,000 | 13 (2.2%) | 0 (0.0%) |
| $50,000 to $99,999 | 0 (0.0%) | 9 (0.5%) |
| $100,000 to $299,999 | 41 (6.9%) | 35 (1.9%) |
| $300,000 to $499,999 | 157 (26.5%) | 372 (20.8%) |
| $500,000 to $749,999 | 286 (48.2%) | 1,123 (62.7%) |
| $750,000 to $999,999 | 86 (14.5%) | 252 (14.1%) |
| $1,000,000 or more | 10 (1.7%) | 0 (0.0%) |
| Total | 593 (100.0%) | 1,791 (100.0%) |
Household Income by Mortgage Status in Cloverdale
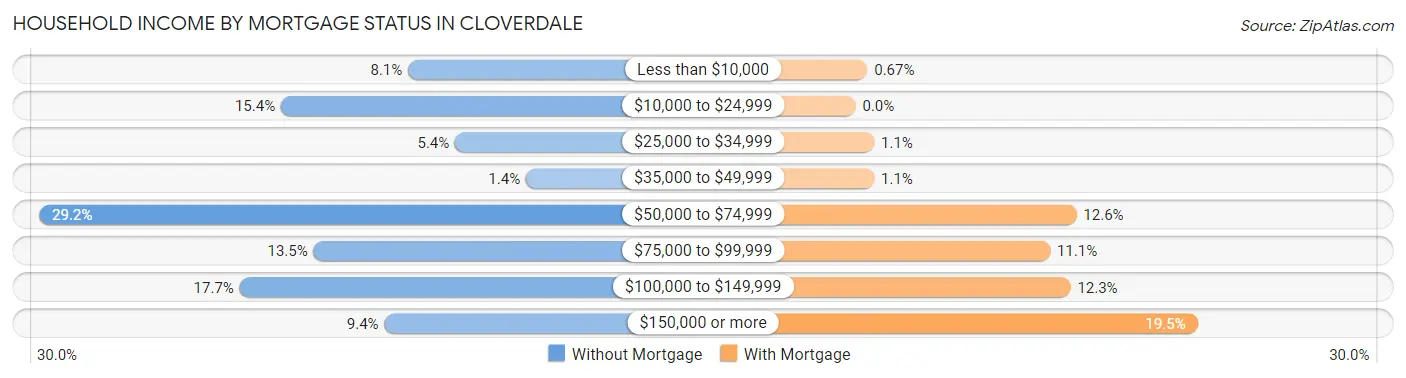
| Household Income | Without Mortgage | With Mortgage |
| Less than $10,000 | 48 (8.1%) | 12 (0.7%) |
| $10,000 to $24,999 | 91 (15.3%) | 0 (0.0%) |
| $25,000 to $34,999 | 32 (5.4%) | 19 (1.1%) |
| $35,000 to $49,999 | 8 (1.3%) | 19 (1.1%) |
| $50,000 to $74,999 | 173 (29.2%) | 226 (12.6%) |
| $75,000 to $99,999 | 80 (13.5%) | 199 (11.1%) |
| $100,000 to $149,999 | 105 (17.7%) | 220 (12.3%) |
| $150,000 or more | 56 (9.4%) | 350 (19.5%) |
| Total | 593 (100.0%) | 1,791 (100.0%) |
Property Value to Household Income Ratio in Cloverdale
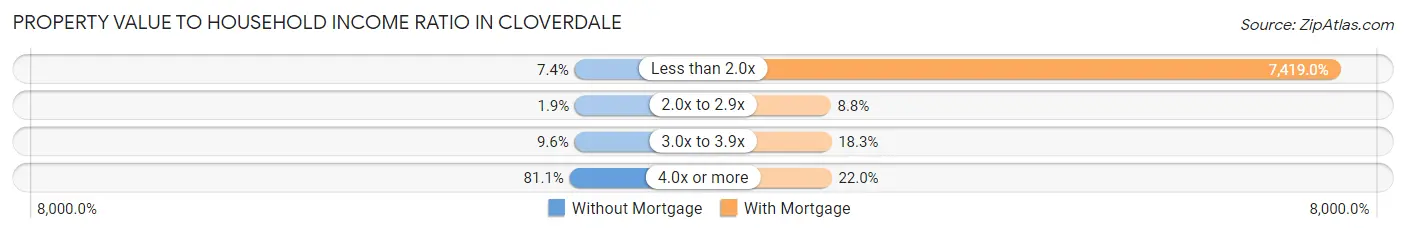
| Value-to-Income Ratio | Without Mortgage | With Mortgage |
| Less than 2.0x | 44 (7.4%) | 132,875 (7,419.0%) |
| 2.0x to 2.9x | 11 (1.8%) | 158 (8.8%) |
| 3.0x to 3.9x | 57 (9.6%) | 327 (18.3%) |
| 4.0x or more | 481 (81.1%) | 394 (22.0%) |
| Total | 593 (100.0%) | 1,791 (100.0%) |
Real Estate Taxes by Mortgage Status in Cloverdale
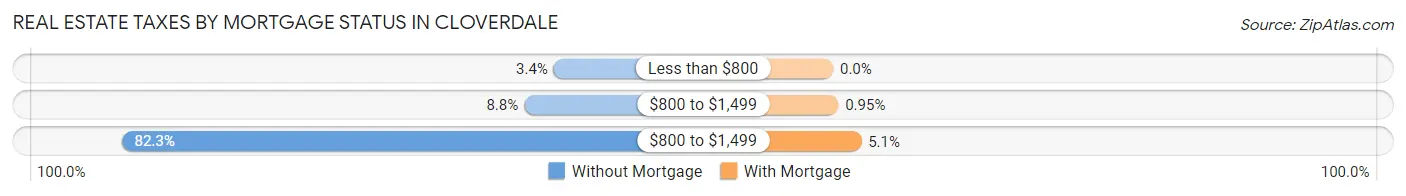
| Property Taxes | Without Mortgage | With Mortgage |
| Less than $800 | 20 (3.4%) | 0 (0.0%) |
| $800 to $1,499 | 52 (8.8%) | 17 (0.9%) |
| $800 to $1,499 | 488 (82.3%) | 92 (5.1%) |
| Total | 593 (100.0%) | 1,791 (100.0%) |
Health & Disability in Cloverdale
Health Insurance Coverage by Age in Cloverdale
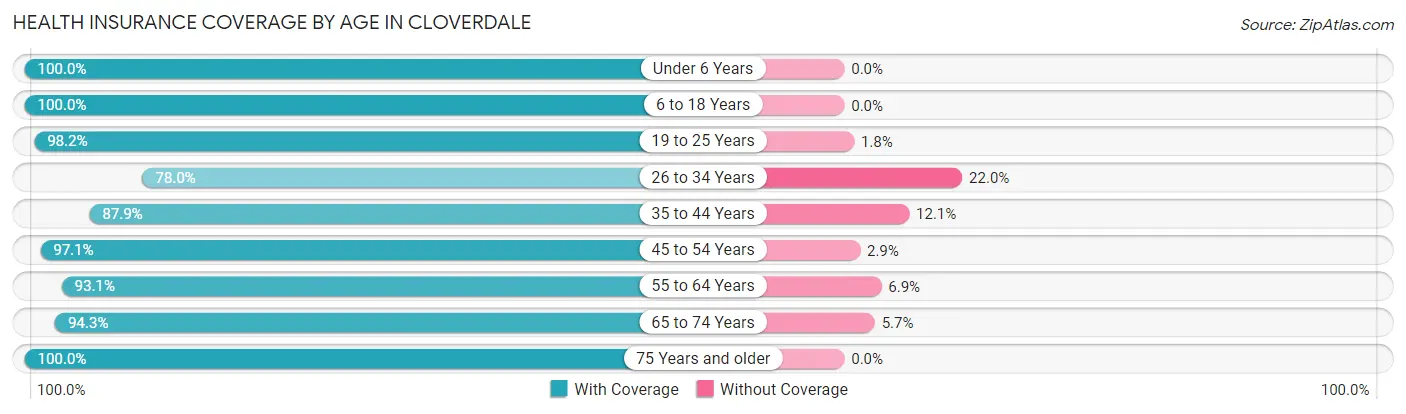
| Age Bracket | With Coverage | Without Coverage |
| Under 6 Years | 338 (100.0%) | 0 (0.0%) |
| 6 to 18 Years | 1,684 (100.0%) | 0 (0.0%) |
| 19 to 25 Years | 491 (98.2%) | 9 (1.8%) |
| 26 to 34 Years | 678 (78.0%) | 191 (22.0%) |
| 35 to 44 Years | 1,323 (87.9%) | 182 (12.1%) |
| 45 to 54 Years | 1,026 (97.1%) | 31 (2.9%) |
| 55 to 64 Years | 1,077 (93.1%) | 80 (6.9%) |
| 65 to 74 Years | 1,149 (94.3%) | 69 (5.7%) |
| 75 Years and older | 572 (100.0%) | 0 (0.0%) |
| Total | 8,338 (93.7%) | 562 (6.3%) |
Health Insurance Coverage by Citizenship Status in Cloverdale
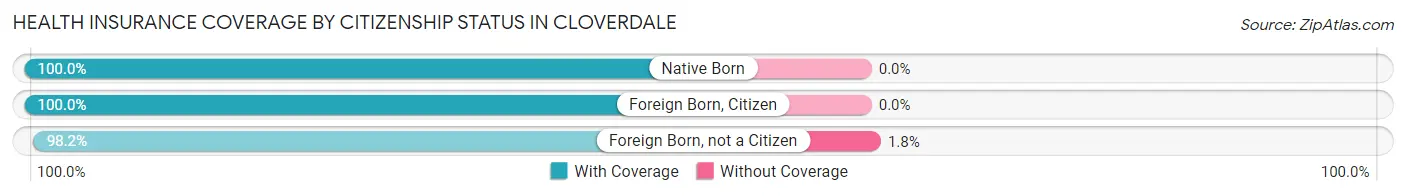
| Citizenship Status | With Coverage | Without Coverage |
| Native Born | 338 (100.0%) | 0 (0.0%) |
| Foreign Born, Citizen | 1,684 (100.0%) | 0 (0.0%) |
| Foreign Born, not a Citizen | 491 (98.2%) | 9 (1.8%) |
Health Insurance Coverage by Household Income in Cloverdale
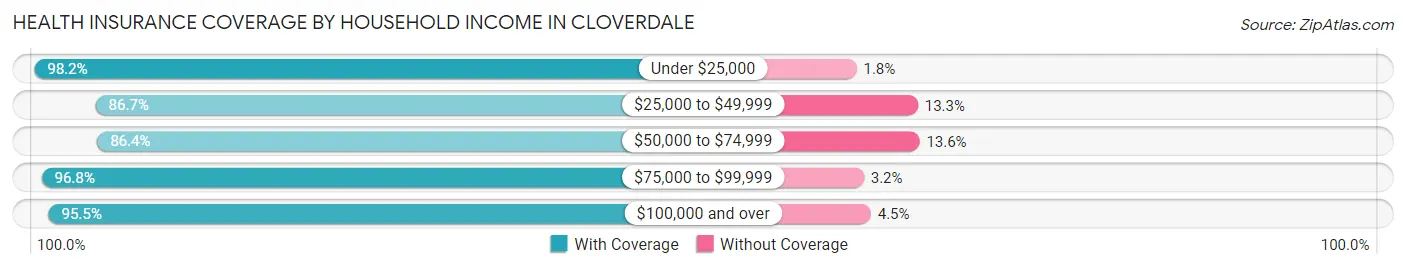
| Household Income | With Coverage | Without Coverage |
| Under $25,000 | 485 (98.2%) | 9 (1.8%) |
| $25,000 to $49,999 | 808 (86.7%) | 124 (13.3%) |
| $50,000 to $74,999 | 1,073 (86.4%) | 169 (13.6%) |
| $75,000 to $99,999 | 1,401 (96.8%) | 46 (3.2%) |
| $100,000 and over | 4,545 (95.5%) | 214 (4.5%) |
Public vs Private Health Insurance Coverage by Age in Cloverdale
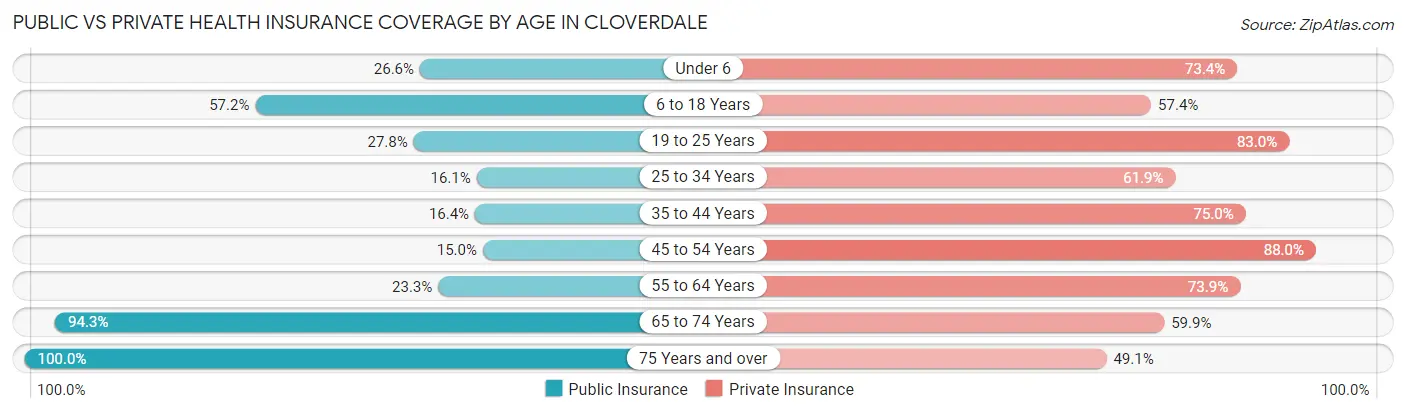
| Age Bracket | Public Insurance | Private Insurance |
| Under 6 | 90 (26.6%) | 248 (73.4%) |
| 6 to 18 Years | 963 (57.2%) | 967 (57.4%) |
| 19 to 25 Years | 139 (27.8%) | 415 (83.0%) |
| 25 to 34 Years | 140 (16.1%) | 538 (61.9%) |
| 35 to 44 Years | 247 (16.4%) | 1,128 (75.0%) |
| 45 to 54 Years | 158 (14.9%) | 930 (88.0%) |
| 55 to 64 Years | 269 (23.3%) | 855 (73.9%) |
| 65 to 74 Years | 1,149 (94.3%) | 729 (59.9%) |
| 75 Years and over | 572 (100.0%) | 281 (49.1%) |
| Total | 3,727 (41.9%) | 6,091 (68.4%) |
Disability Status by Sex by Age in Cloverdale
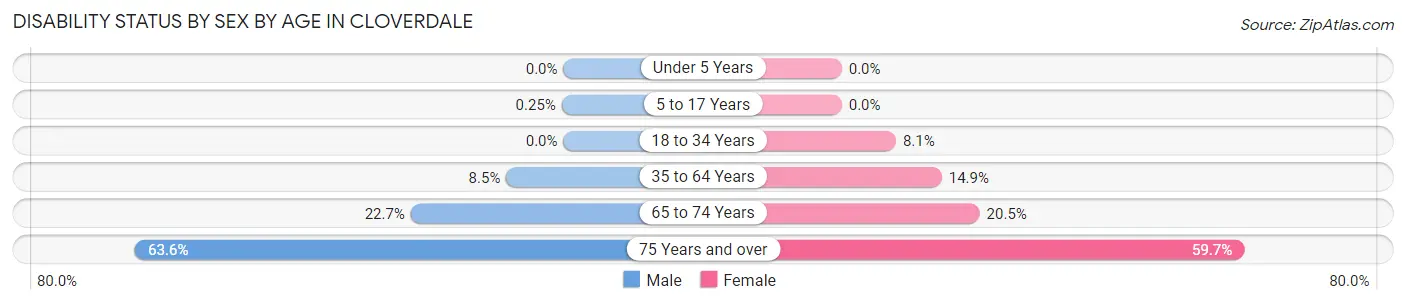
| Age Bracket | Male | Female |
| Under 5 Years | 0 (0.0%) | 0 (0.0%) |
| 5 to 17 Years | 2 (0.3%) | 0 (0.0%) |
| 18 to 34 Years | 0 (0.0%) | 60 (8.1%) |
| 35 to 64 Years | 164 (8.5%) | 265 (14.8%) |
| 65 to 74 Years | 141 (22.7%) | 122 (20.5%) |
| 75 Years and over | 138 (63.6%) | 212 (59.7%) |
Disability Class by Sex by Age in Cloverdale
Disability Class: Hearing Difficulty
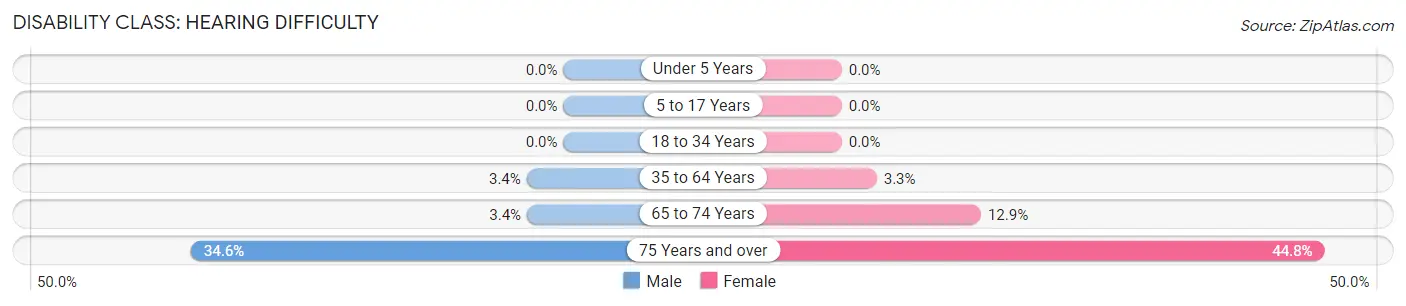
| Age Bracket | Male | Female |
| Under 5 Years | 0 (0.0%) | 0 (0.0%) |
| 5 to 17 Years | 0 (0.0%) | 0 (0.0%) |
| 18 to 34 Years | 0 (0.0%) | 0 (0.0%) |
| 35 to 64 Years | 66 (3.4%) | 58 (3.3%) |
| 65 to 74 Years | 21 (3.4%) | 77 (12.9%) |
| 75 Years and over | 75 (34.6%) | 159 (44.8%) |
Disability Class: Vision Difficulty
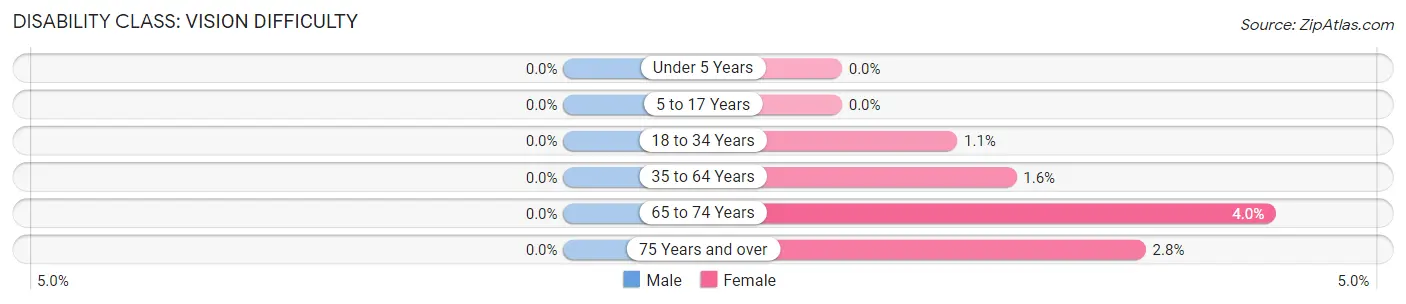
| Age Bracket | Male | Female |
| Under 5 Years | 0 (0.0%) | 0 (0.0%) |
| 5 to 17 Years | 0 (0.0%) | 0 (0.0%) |
| 18 to 34 Years | 0 (0.0%) | 8 (1.1%) |
| 35 to 64 Years | 0 (0.0%) | 29 (1.6%) |
| 65 to 74 Years | 0 (0.0%) | 24 (4.0%) |
| 75 Years and over | 0 (0.0%) | 10 (2.8%) |
Disability Class: Cognitive Difficulty
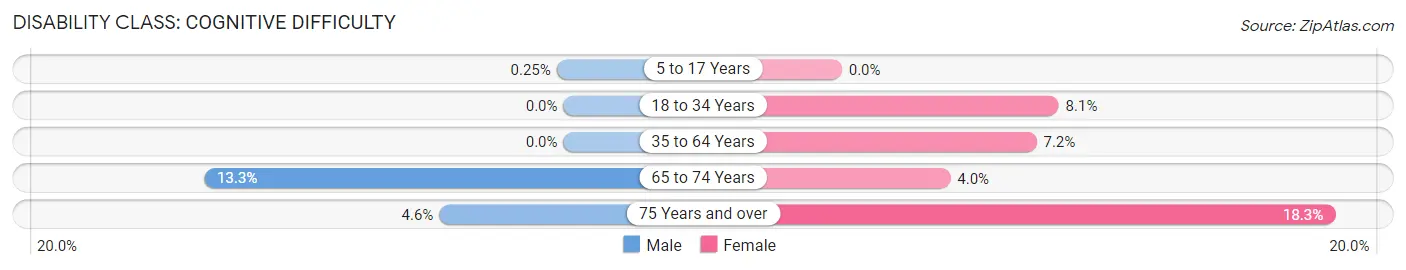
| Age Bracket | Male | Female |
| 5 to 17 Years | 2 (0.3%) | 0 (0.0%) |
| 18 to 34 Years | 0 (0.0%) | 60 (8.1%) |
| 35 to 64 Years | 0 (0.0%) | 129 (7.2%) |
| 65 to 74 Years | 83 (13.3%) | 24 (4.0%) |
| 75 Years and over | 10 (4.6%) | 65 (18.3%) |
Disability Class: Ambulatory Difficulty
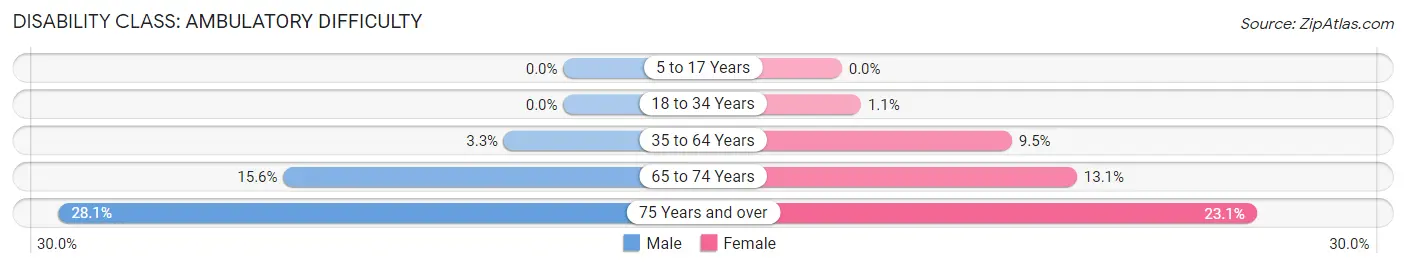
| Age Bracket | Male | Female |
| 5 to 17 Years | 0 (0.0%) | 0 (0.0%) |
| 18 to 34 Years | 0 (0.0%) | 8 (1.1%) |
| 35 to 64 Years | 64 (3.3%) | 169 (9.5%) |
| 65 to 74 Years | 97 (15.6%) | 78 (13.1%) |
| 75 Years and over | 61 (28.1%) | 82 (23.1%) |
Disability Class: Self-Care Difficulty
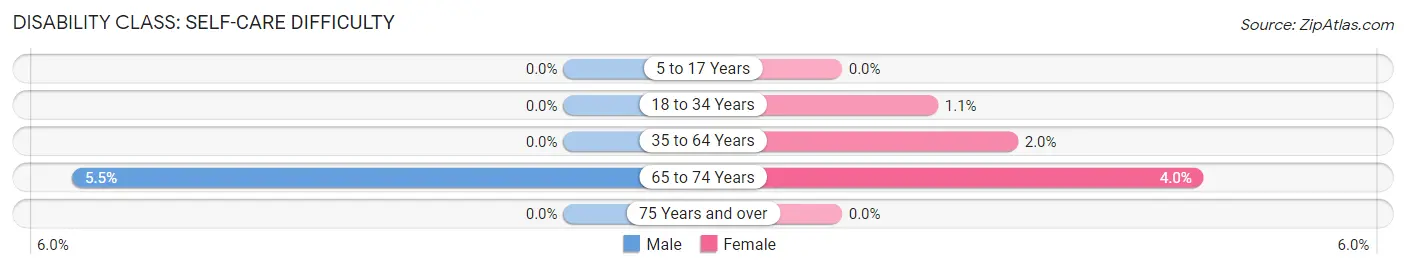
| Age Bracket | Male | Female |
| 5 to 17 Years | 0 (0.0%) | 0 (0.0%) |
| 18 to 34 Years | 0 (0.0%) | 8 (1.1%) |
| 35 to 64 Years | 0 (0.0%) | 35 (2.0%) |
| 65 to 74 Years | 34 (5.5%) | 24 (4.0%) |
| 75 Years and over | 0 (0.0%) | 0 (0.0%) |
Technology Access in Cloverdale
Computing Device Access in Cloverdale
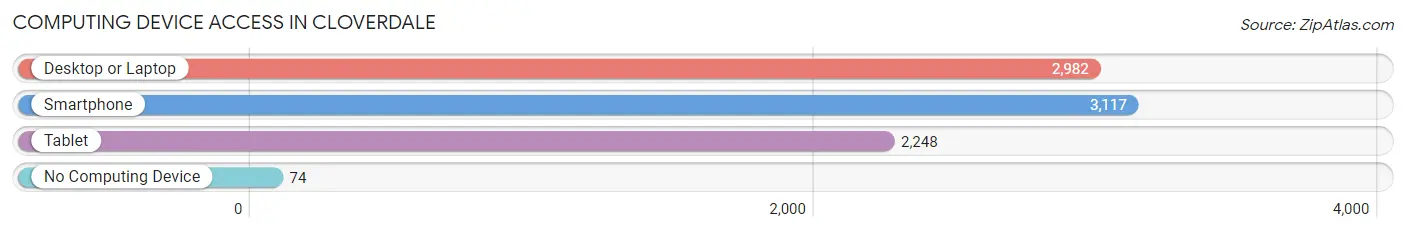
| Device Type | # Households | % Households |
| Desktop or Laptop | 2,982 | 86.6% |
| Smartphone | 3,117 | 90.6% |
| Tablet | 2,248 | 65.3% |
| No Computing Device | 74 | 2.1% |
| Total | 3,442 | 100.0% |
Internet Access in Cloverdale
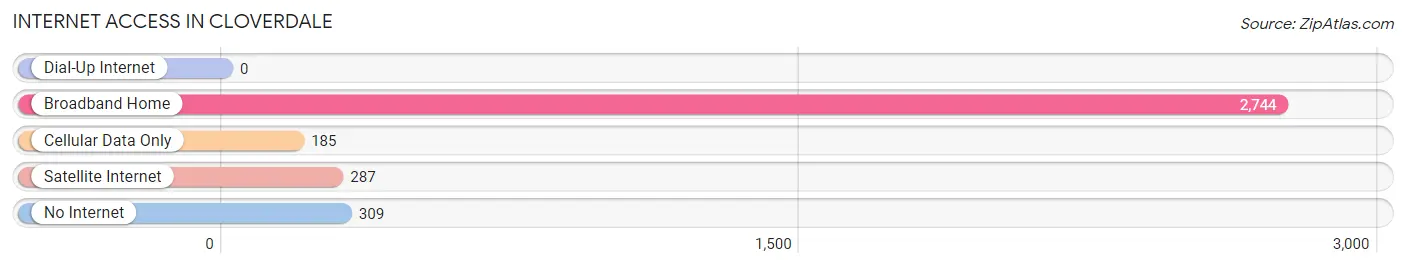
| Internet Type | # Households | % Households |
| Dial-Up Internet | 0 | 0.0% |
| Broadband Home | 2,744 | 79.7% |
| Cellular Data Only | 185 | 5.4% |
| Satellite Internet | 287 | 8.3% |
| No Internet | 309 | 9.0% |
| Total | 3,442 | 100.0% |
Cloverdale Summary
Cloverdale is a city located in Sonoma County, California, United States. It is situated in the northern part of the county, about 85 miles north of San Francisco. The population was 8,618 at the 2010 census. Cloverdale is known for its historic downtown, which is home to many shops, restaurants, and other businesses.
Geography
Cloverdale is located at the northern end of Sonoma County, in the northern part of the state of California. It is situated in the Russian River Valley, at the intersection of U.S. Route 101 and State Route 128. The city is bordered by the towns of Geyserville to the east, Healdsburg to the south, and Windsor to the west. The city is located about 85 miles north of San Francisco.
The city has a total area of 2.2 square miles, all of which is land. The terrain is mostly flat, with some rolling hills. The climate is Mediterranean, with warm, dry summers and cool, wet winters.
History
Cloverdale was founded in 1872 by a group of settlers from the East Coast. The town was named after the clover fields that surrounded it. The town quickly grew, and by the early 1900s it had become a major agricultural center. The town was also known for its wineries, which produced some of the finest wines in the region.
In the 1950s, the town began to decline as the agricultural industry shifted away from the area. The population dropped from a high of over 10,000 in the 1940s to just over 8,000 in the 2000s.
Economy
Cloverdale’s economy is largely based on agriculture and tourism. The city is home to several wineries, which produce some of the finest wines in the region. The city is also home to several small businesses, including restaurants, shops, and other services.
The city is also home to several large employers, including Cloverdale Unified School District, Cloverdale Citrus Products, and Cloverdale Foods. The city is also home to several small businesses, including restaurants, shops, and other services.
Demographics
As of the 2010 census, the population of Cloverdale was 8,618. The racial makeup of the city was 77.3% White, 0.7% African American, 1.2% Native American, 0.7% Asian, 0.1% Pacific Islander, 16.3% from other races, and 3.9% from two or more races. Hispanic or Latino of any race were 28.2% of the population.
The median income for a household in the city was $45,944, and the median income for a family was $51,944. The per capita income for the city was $21,944. About 14.3% of families and 17.7% of the population were below the poverty line, including 25.3% of those under age 18 and 8.2% of those age 65 or over.
Common Questions
What is Per Capita Income in Cloverdale?
Per Capita income in Cloverdale is $46,037.
What is the Median Family Income in Cloverdale?
Median Family Income in Cloverdale is $116,092.
What is the Median Household income in Cloverdale?
Median Household Income in Cloverdale is $96,894.
What is Income or Wage Gap in Cloverdale?
Income or Wage Gap in Cloverdale is 25.9%.
Women in Cloverdale earn 74.1 cents for every dollar earned by a man.
What is Family Income Deficit in Cloverdale?
Family Income Deficit in Cloverdale is $10,891.
Families that are below poverty line in Cloverdale earn $10,891 less on average than the poverty threshold level.
What is Inequality or Gini Index in Cloverdale?
Inequality or Gini Index in Cloverdale is 0.41.
What is the Total Population of Cloverdale?
Total Population of Cloverdale is 8,964.
What is the Total Male Population of Cloverdale?
Total Male Population of Cloverdale is 4,449.
What is the Total Female Population of Cloverdale?
Total Female Population of Cloverdale is 4,515.
What is the Ratio of Males per 100 Females in Cloverdale?
There are 98.54 Males per 100 Females in Cloverdale.
What is the Ratio of Females per 100 Males in Cloverdale?
There are 101.48 Females per 100 Males in Cloverdale.
What is the Median Population Age in Cloverdale?
Median Population Age in Cloverdale is 42.0 Years.
What is the Average Family Size in Cloverdale
Average Family Size in Cloverdale is 3.0 People.
What is the Average Household Size in Cloverdale
Average Household Size in Cloverdale is 2.6 People.
How Large is the Labor Force in Cloverdale?
There are 4,529 People in the Labor Forcein in Cloverdale.
What is the Percentage of People in the Labor Force in Cloverdale?
61.3% of People are in the Labor Force in Cloverdale.
What is the Unemployment Rate in Cloverdale?
Unemployment Rate in Cloverdale is 3.8%.