Caspar, CA Map & Demographics
Caspar Map
Caspar Overview
$94,817
PER CAPITA INCOME
$236,387
AVG FAMILY INCOME
$235,805
AVG HOUSEHOLD INCOME
46.1%
WAGE / INCOME GAP [ % ]
53.9¢/ $1
WAGE / INCOME GAP [ $ ]
0.42
INEQUALITY / GINI INDEX
360
TOTAL POPULATION
135
MALE POPULATION
225
FEMALE POPULATION
60.00
MALES / 100 FEMALES
166.67
FEMALES / 100 MALES
42.1
MEDIAN AGE
2.6
AVG FAMILY SIZE
2.2
AVG HOUSEHOLD SIZE
162
LABOR FORCE [ PEOPLE ]
62.3%
PERCENT IN LABOR FORCE
Caspar Zip Codes
Caspar Area Codes
Income in Caspar
Income Overview in Caspar
Per Capita Income in Caspar is $94,817, while median incomes of families and households are $236,387 and $235,805 respectively.
| Characteristic | Number | Measure |
| Per Capita Income | 360 | $94,817 |
| Median Family Income | 125 | $236,387 |
| Mean Family Income | 125 | $286,035 |
| Median Household Income | 159 | $235,805 |
| Mean Household Income | 159 | $228,018 |
| Income Deficit | 125 | $0 |
| Wage / Income Gap (%) | 360 | 46.07% |
| Wage / Income Gap ($) | 360 | 53.93¢ per $1 |
| Gini / Inequality Index | 360 | 0.42 |
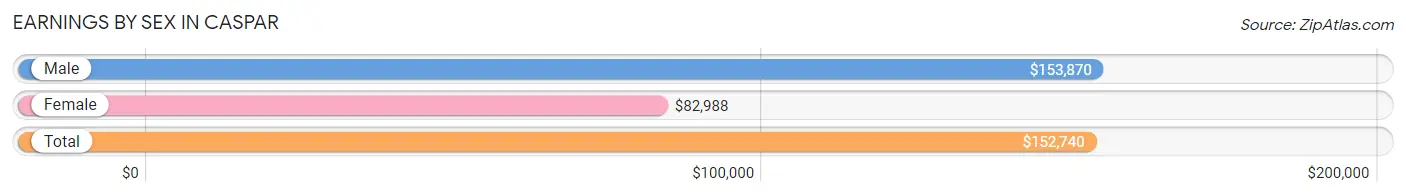
Earnings by Sex in Caspar
Average Earnings in Caspar are $152,740, $153,870 for men and $82,988 for women, a difference of 46.1%.
| Sex | Number | Average Earnings |
| Male | 108 (62.1%) | $153,870 |
| Female | 66 (37.9%) | $82,988 |
| Total | 174 (100.0%) | $152,740 |
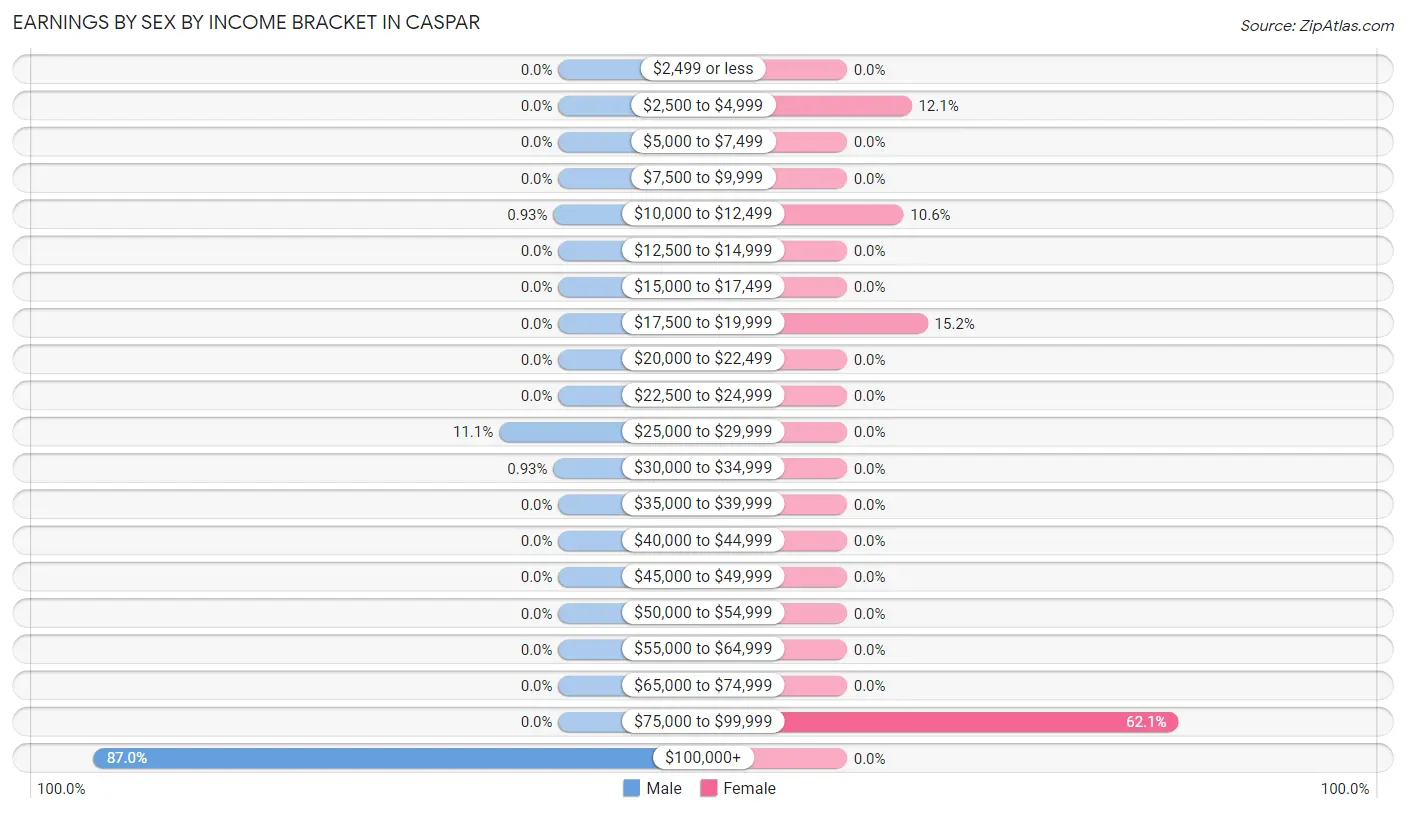
Earnings by Sex by Income Bracket in Caspar
The most common earnings brackets in Caspar are $100,000+ for men (94 | 87.0%) and $75,000 to $99,999 for women (41 | 62.1%).
| Income | Male | Female |
| $2,499 or less | 0 (0.0%) | 0 (0.0%) |
| $2,500 to $4,999 | 0 (0.0%) | 8 (12.1%) |
| $5,000 to $7,499 | 0 (0.0%) | 0 (0.0%) |
| $7,500 to $9,999 | 0 (0.0%) | 0 (0.0%) |
| $10,000 to $12,499 | 1 (0.9%) | 7 (10.6%) |
| $12,500 to $14,999 | 0 (0.0%) | 0 (0.0%) |
| $15,000 to $17,499 | 0 (0.0%) | 0 (0.0%) |
| $17,500 to $19,999 | 0 (0.0%) | 10 (15.1%) |
| $20,000 to $22,499 | 0 (0.0%) | 0 (0.0%) |
| $22,500 to $24,999 | 0 (0.0%) | 0 (0.0%) |
| $25,000 to $29,999 | 12 (11.1%) | 0 (0.0%) |
| $30,000 to $34,999 | 1 (0.9%) | 0 (0.0%) |
| $35,000 to $39,999 | 0 (0.0%) | 0 (0.0%) |
| $40,000 to $44,999 | 0 (0.0%) | 0 (0.0%) |
| $45,000 to $49,999 | 0 (0.0%) | 0 (0.0%) |
| $50,000 to $54,999 | 0 (0.0%) | 0 (0.0%) |
| $55,000 to $64,999 | 0 (0.0%) | 0 (0.0%) |
| $65,000 to $74,999 | 0 (0.0%) | 0 (0.0%) |
| $75,000 to $99,999 | 0 (0.0%) | 41 (62.1%) |
| $100,000+ | 94 (87.0%) | 0 (0.0%) |
| Total | 108 (100.0%) | 66 (100.0%) |
Earnings by Sex by Educational Attainment in Caspar
| Educational Attainment | Male Income | Female Income |
| Less than High School | - | - |
| High School Diploma | - | - |
| College or Associate's Degree | - | - |
| Bachelor's Degree | - | - |
| Graduate Degree | - | - |
| Total | $153,904 | $82,988 |
Family Income in Caspar
Family Income Brackets in Caspar
According to the Caspar family income data, there are 103 families falling into the $200,000+ income range, which is the most common income bracket and makes up 82.4% of all families.
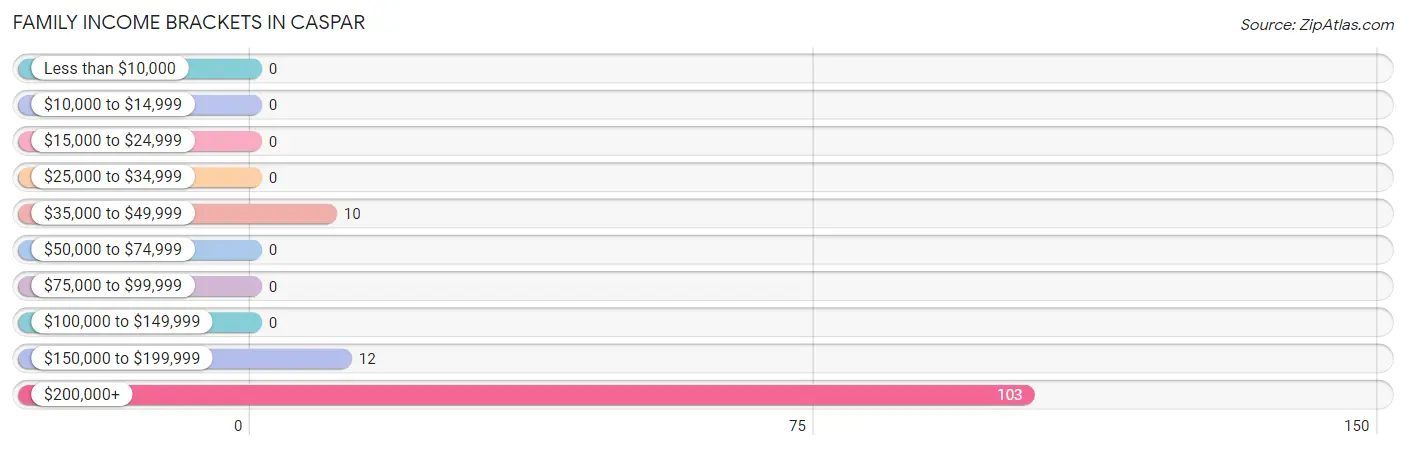
| Income Bracket | # Families | % Families |
| Less than $10,000 | 0 | 0.0% |
| $10,000 to $14,999 | 0 | 0.0% |
| $15,000 to $24,999 | 0 | 0.0% |
| $25,000 to $34,999 | 0 | 0.0% |
| $35,000 to $49,999 | 10 | 8.0% |
| $50,000 to $74,999 | 0 | 0.0% |
| $75,000 to $99,999 | 0 | 0.0% |
| $100,000 to $149,999 | 0 | 0.0% |
| $150,000 to $199,999 | 12 | 9.6% |
| $200,000+ | 103 | 82.4% |
Family Income by Famaliy Size in Caspar
2-person families (52 | 41.6%) account for the highest median family income in Caspar with $250,001 per family, while 2-person families (52 | 41.6%) have the highest median income of $125,000 per family member.
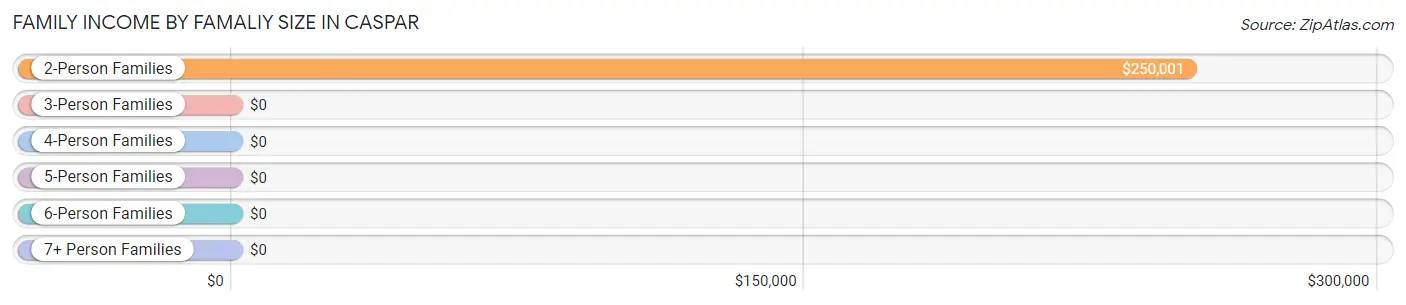
| Income Bracket | # Families | Median Income |
| 2-Person Families | 52 (41.6%) | $250,001 |
| 3-Person Families | 0 (0.0%) | $0 |
| 4-Person Families | 73 (58.4%) | $0 |
| 5-Person Families | 0 (0.0%) | $0 |
| 6-Person Families | 0 (0.0%) | $0 |
| 7+ Person Families | 0 (0.0%) | $0 |
| Total | 125 (100.0%) | $236,387 |
Family Income by Number of Earners in Caspar
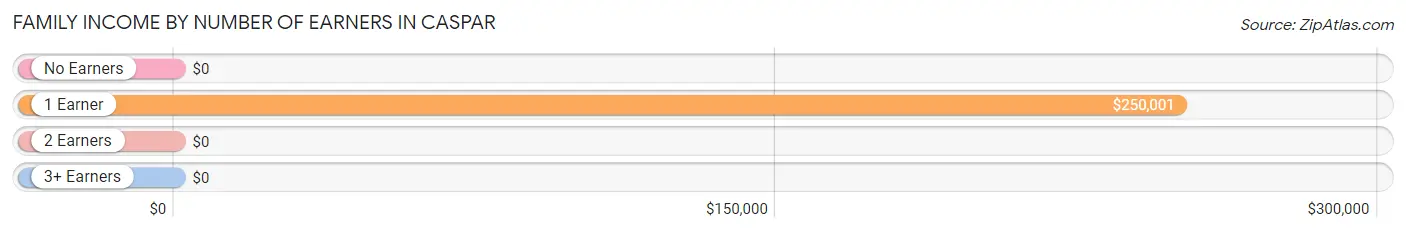
| Number of Earners | # Families | Median Income |
| No Earners | 12 (9.6%) | $0 |
| 1 Earner | 40 (32.0%) | $250,001 |
| 2 Earners | 73 (58.4%) | $0 |
| 3+ Earners | 0 (0.0%) | $0 |
| Total | 125 (100.0%) | $236,387 |
Household Income in Caspar
Household Income Brackets in Caspar
With 103 households falling in the category, the $200,000+ income range is the most frequent in Caspar, accounting for 64.8% of all households.
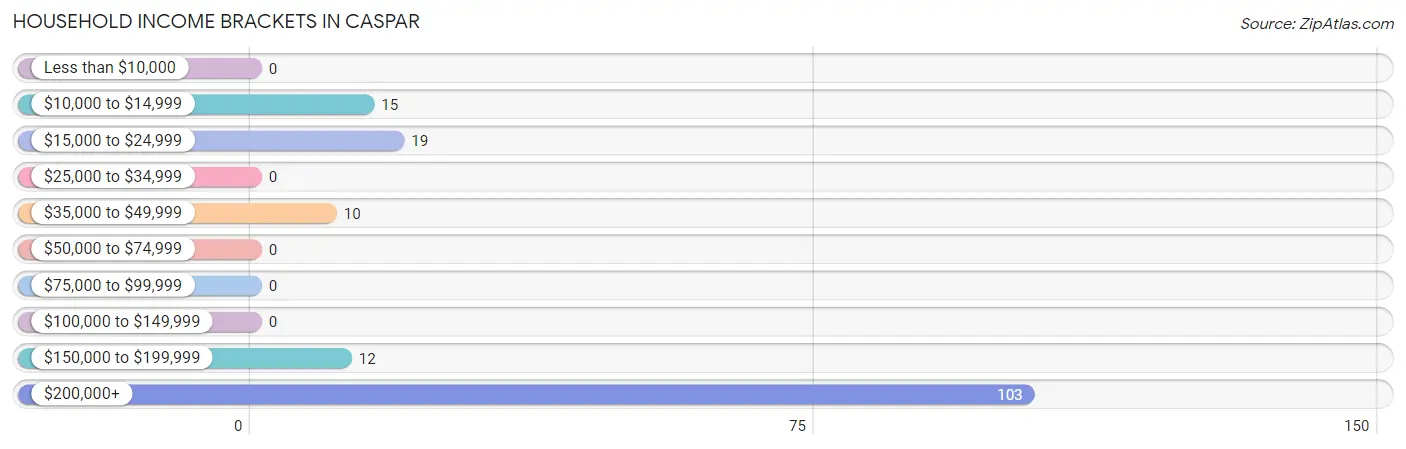
| Income Bracket | # Households | % Households |
| Less than $10,000 | 0 | 0.0% |
| $10,000 to $14,999 | 15 | 9.4% |
| $15,000 to $24,999 | 19 | 11.9% |
| $25,000 to $34,999 | 0 | 0.0% |
| $35,000 to $49,999 | 10 | 6.3% |
| $50,000 to $74,999 | 0 | 0.0% |
| $75,000 to $99,999 | 0 | 0.0% |
| $100,000 to $149,999 | 0 | 0.0% |
| $150,000 to $199,999 | 12 | 7.5% |
| $200,000+ | 103 | 64.8% |
Household Income by Householder Age in Caspar
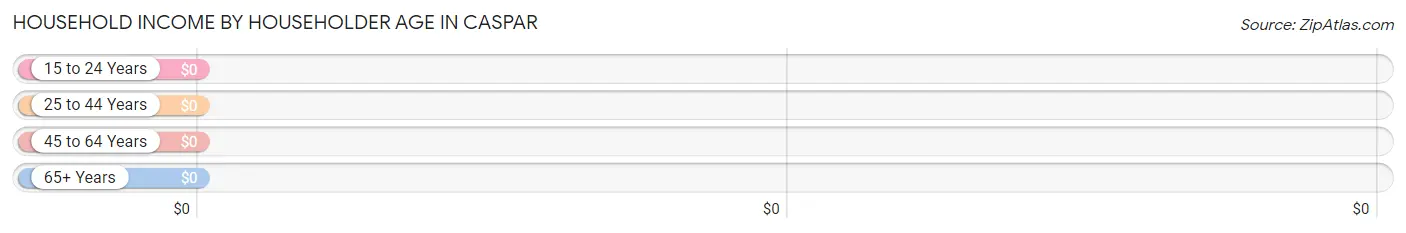
| Income Bracket | # Households | Median Income |
| 15 to 24 Years | 0 (0.0%) | $0 |
| 25 to 44 Years | 73 (45.9%) | $0 |
| 45 to 64 Years | 10 (6.3%) | $0 |
| 65+ Years | 76 (47.8%) | $0 |
| Total | 159 (100.0%) | $235,805 |
Poverty in Caspar
Income Below Poverty by Sex and Age in Caspar
With 1.5% poverty level for males and 6.7% for females among the residents of Caspar, 18 to 24 year old males and 75 year old and over females are the most vulnerable to poverty, with 1 males (33.3%) and 8 females (22.2%) in their respective age groups living below the poverty level.
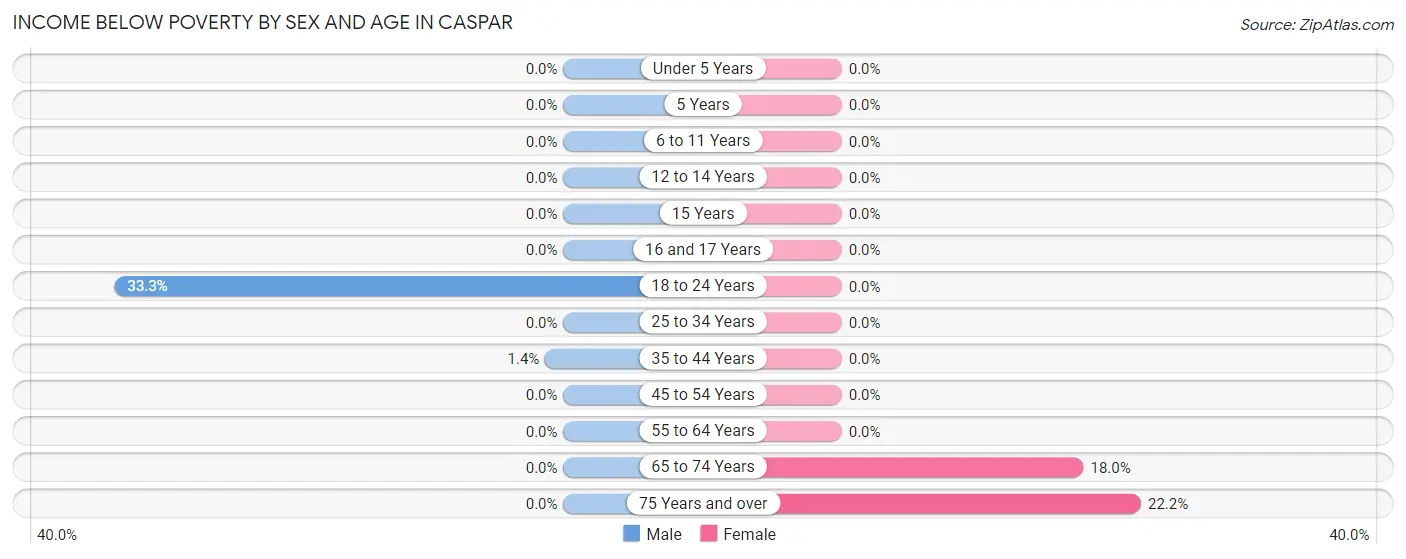
| Age Bracket | Male | Female |
| Under 5 Years | 0 (0.0%) | 0 (0.0%) |
| 5 Years | 0 (0.0%) | 0 (0.0%) |
| 6 to 11 Years | 0 (0.0%) | 0 (0.0%) |
| 12 to 14 Years | 0 (0.0%) | 0 (0.0%) |
| 15 Years | 0 (0.0%) | 0 (0.0%) |
| 16 and 17 Years | 0 (0.0%) | 0 (0.0%) |
| 18 to 24 Years | 1 (33.3%) | 0 (0.0%) |
| 25 to 34 Years | 0 (0.0%) | 0 (0.0%) |
| 35 to 44 Years | 1 (1.3%) | 0 (0.0%) |
| 45 to 54 Years | 0 (0.0%) | 0 (0.0%) |
| 55 to 64 Years | 0 (0.0%) | 0 (0.0%) |
| 65 to 74 Years | 0 (0.0%) | 7 (17.9%) |
| 75 Years and over | 0 (0.0%) | 8 (22.2%) |
| Total | 2 (1.5%) | 15 (6.7%) |
Income Above Poverty by Sex and Age in Caspar
According to the poverty statistics in Caspar, males aged 55 to 64 years and females aged under 5 years are the age groups that are most secure financially, with 100.0% of males and 100.0% of females in these age groups living above the poverty line.
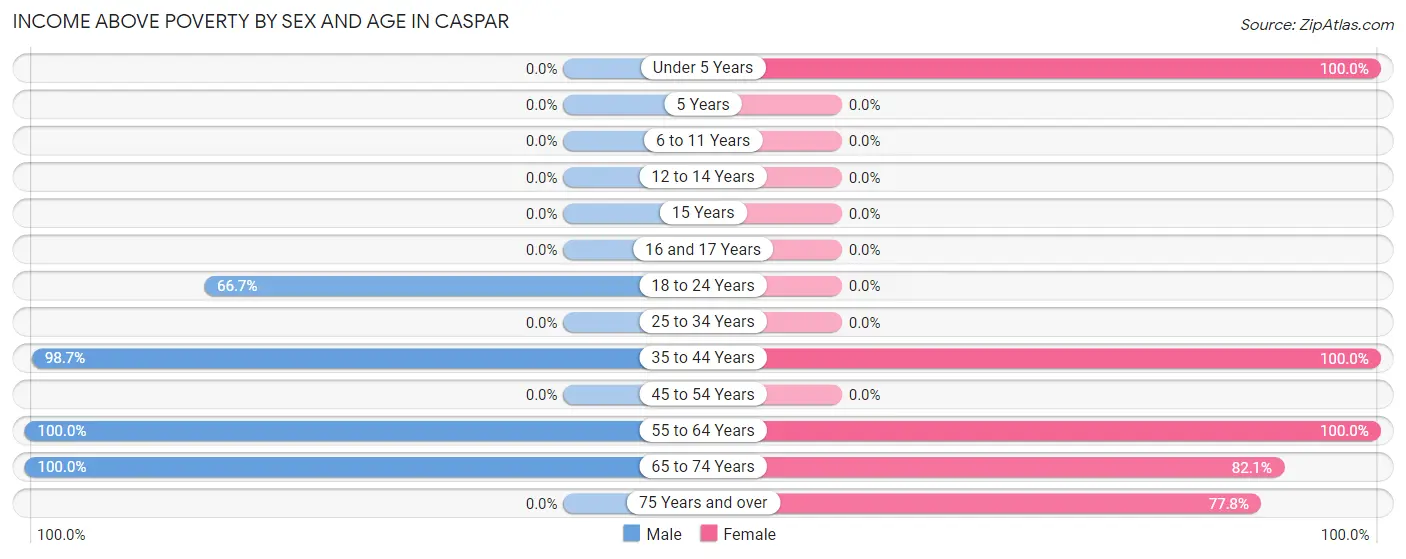
| Age Bracket | Male | Female |
| Under 5 Years | 0 (0.0%) | 99 (100.0%) |
| 5 Years | 0 (0.0%) | 0 (0.0%) |
| 6 to 11 Years | 0 (0.0%) | 0 (0.0%) |
| 12 to 14 Years | 0 (0.0%) | 0 (0.0%) |
| 15 Years | 0 (0.0%) | 0 (0.0%) |
| 16 and 17 Years | 0 (0.0%) | 0 (0.0%) |
| 18 to 24 Years | 2 (66.7%) | 0 (0.0%) |
| 25 to 34 Years | 0 (0.0%) | 0 (0.0%) |
| 35 to 44 Years | 73 (98.7%) | 41 (100.0%) |
| 45 to 54 Years | 0 (0.0%) | 0 (0.0%) |
| 55 to 64 Years | 11 (100.0%) | 10 (100.0%) |
| 65 to 74 Years | 46 (100.0%) | 32 (82.1%) |
| 75 Years and over | 0 (0.0%) | 28 (77.8%) |
| Total | 132 (98.5%) | 210 (93.3%) |
Income Below Poverty Among Married-Couple Families in Caspar
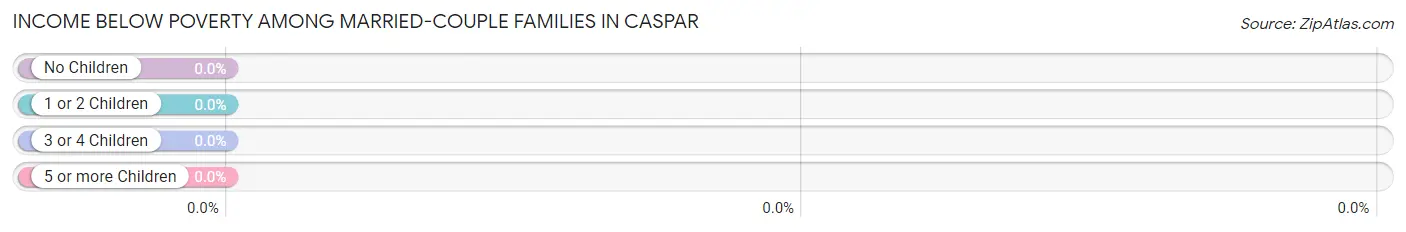
| Children | Above Poverty | Below Poverty |
| No Children | 52 (100.0%) | 0 (0.0%) |
| 1 or 2 Children | 73 (100.0%) | 0 (0.0%) |
| 3 or 4 Children | 0 (0.0%) | 0 (0.0%) |
| 5 or more Children | 0 (0.0%) | 0 (0.0%) |
| Total | 125 (100.0%) | 0 (0.0%) |
Income Below Poverty Among Single-Parent Households in Caspar
| Children | Single Father | Single Mother |
| No Children | 0 (0.0%) | 0 (0.0%) |
| 1 or 2 Children | 0 (0.0%) | 0 (0.0%) |
| 3 or 4 Children | 0 (0.0%) | 0 (0.0%) |
| 5 or more Children | 0 (0.0%) | 0 (0.0%) |
| Total | 0 (0.0%) | 0 (0.0%) |
Income Below Poverty Among Married-Couple vs Single-Parent Households in Caspar
| Children | Married-Couple Families | Single-Parent Households |
| No Children | 0 (0.0%) | 0 (0.0%) |
| 1 or 2 Children | 0 (0.0%) | 0 (0.0%) |
| 3 or 4 Children | 0 (0.0%) | 0 (0.0%) |
| 5 or more Children | 0 (0.0%) | 0 (0.0%) |
| Total | 0 (0.0%) | 0 (0.0%) |
Race in Caspar
The most populous races in Caspar are White / Caucasian (217 | 60.3%), Two or more Races (99 | 27.5%), and Asian (41 | 11.4%).
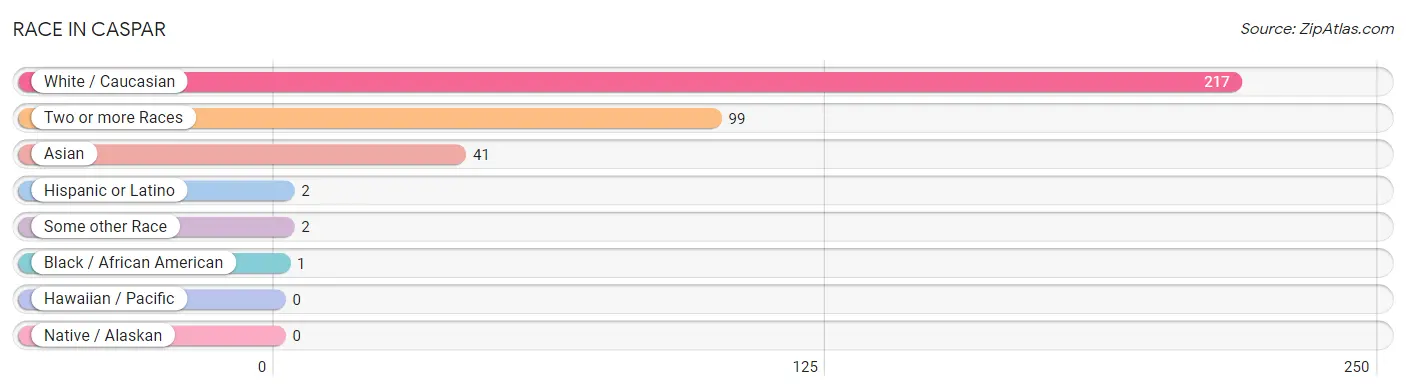
| Race | # Population | % Population |
| Asian | 41 | 11.4% |
| Black / African American | 1 | 0.3% |
| Hawaiian / Pacific | 0 | 0.0% |
| Hispanic or Latino | 2 | 0.6% |
| Native / Alaskan | 0 | 0.0% |
| White / Caucasian | 217 | 60.3% |
| Two or more Races | 99 | 27.5% |
| Some other Race | 2 | 0.6% |
| Total | 360 | 100.0% |
Ancestry in Caspar
The most populous ancestries reported in Caspar are Burmese (140 | 38.9%), American (99 | 27.5%), Portuguese (83 | 23.1%), English (61 | 16.9%), and Irish (20 | 5.6%), together accounting for 112.0% of all Caspar residents.
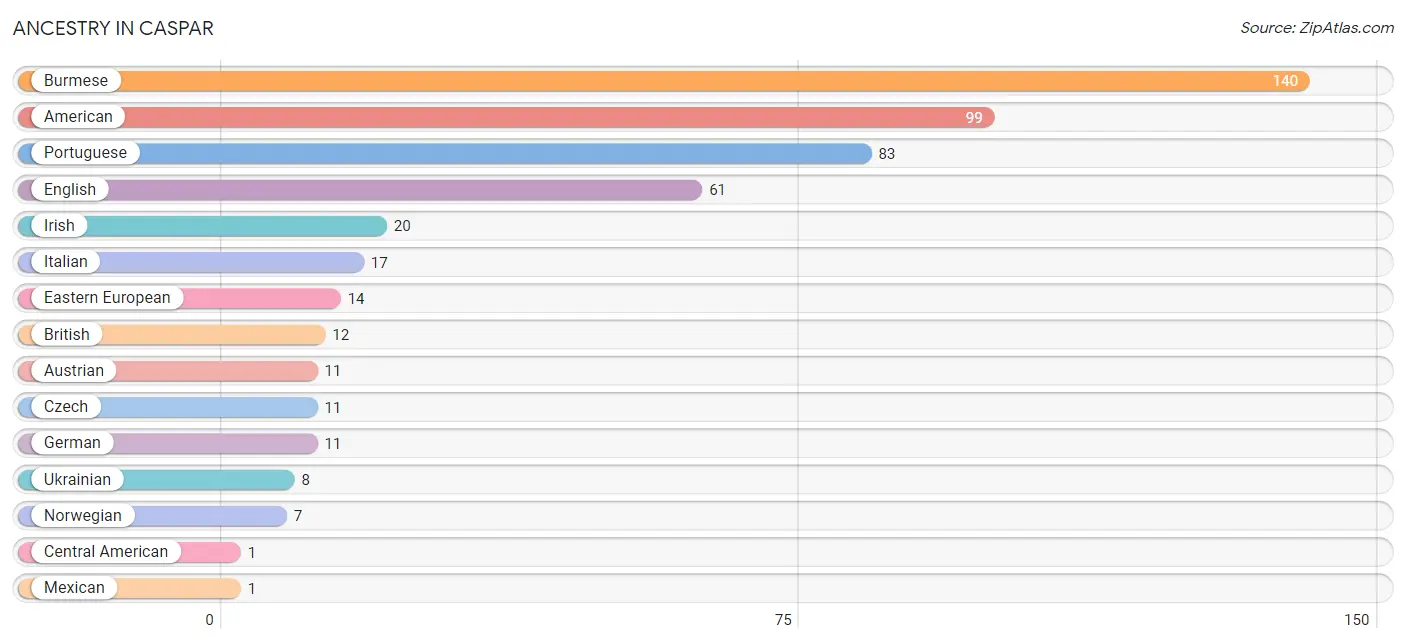
| Ancestry | # Population | % Population |
| American | 99 | 27.5% |
| Austrian | 11 | 3.1% |
| British | 12 | 3.3% |
| Burmese | 140 | 38.9% |
| Central American | 1 | 0.3% |
| Czech | 11 | 3.1% |
| Eastern European | 14 | 3.9% |
| English | 61 | 16.9% |
| German | 11 | 3.1% |
| Irish | 20 | 5.6% |
| Italian | 17 | 4.7% |
| Mexican | 1 | 0.3% |
| Norwegian | 7 | 1.9% |
| Portuguese | 83 | 23.1% |
| Salvadoran | 1 | 0.3% |
| Scottish | 1 | 0.3% |
| Ukrainian | 8 | 2.2% | View All 17 Rows |
Immigrants in Caspar
The most numerous immigrant groups reported in Caspar came from Asia (41 | 11.4%), Eastern Asia (41 | 11.4%), Korea (41 | 11.4%), Central America (1 | 0.3%), and Latin America (1 | 0.3%), together accounting for 34.7% of all Caspar residents.
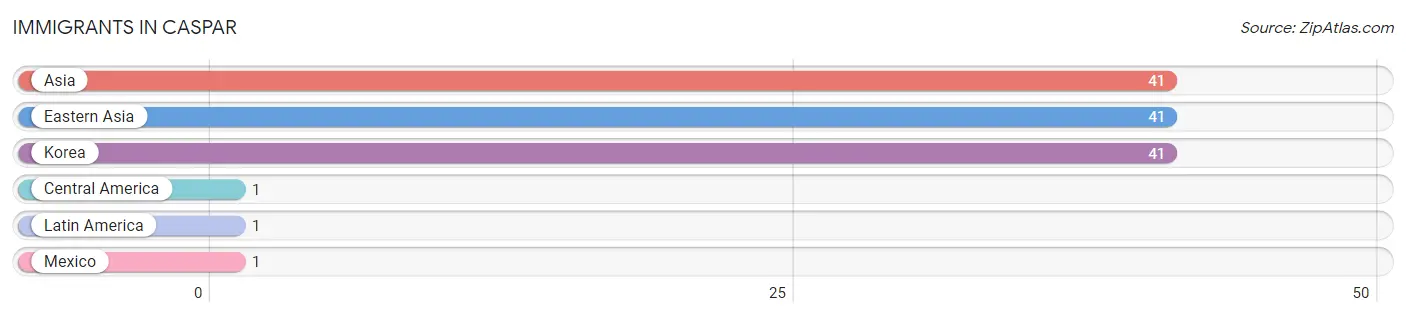
| Immigration Origin | # Population | % Population |
| Asia | 41 | 11.4% |
| Central America | 1 | 0.3% |
| Eastern Asia | 41 | 11.4% |
| Korea | 41 | 11.4% |
| Latin America | 1 | 0.3% |
| Mexico | 1 | 0.3% | View All 6 Rows |
Sex and Age in Caspar
Sex and Age in Caspar
The most populous age groups in Caspar are 35 to 39 Years (74 | 54.8%) for men and Under 5 Years (99 | 44.0%) for women.
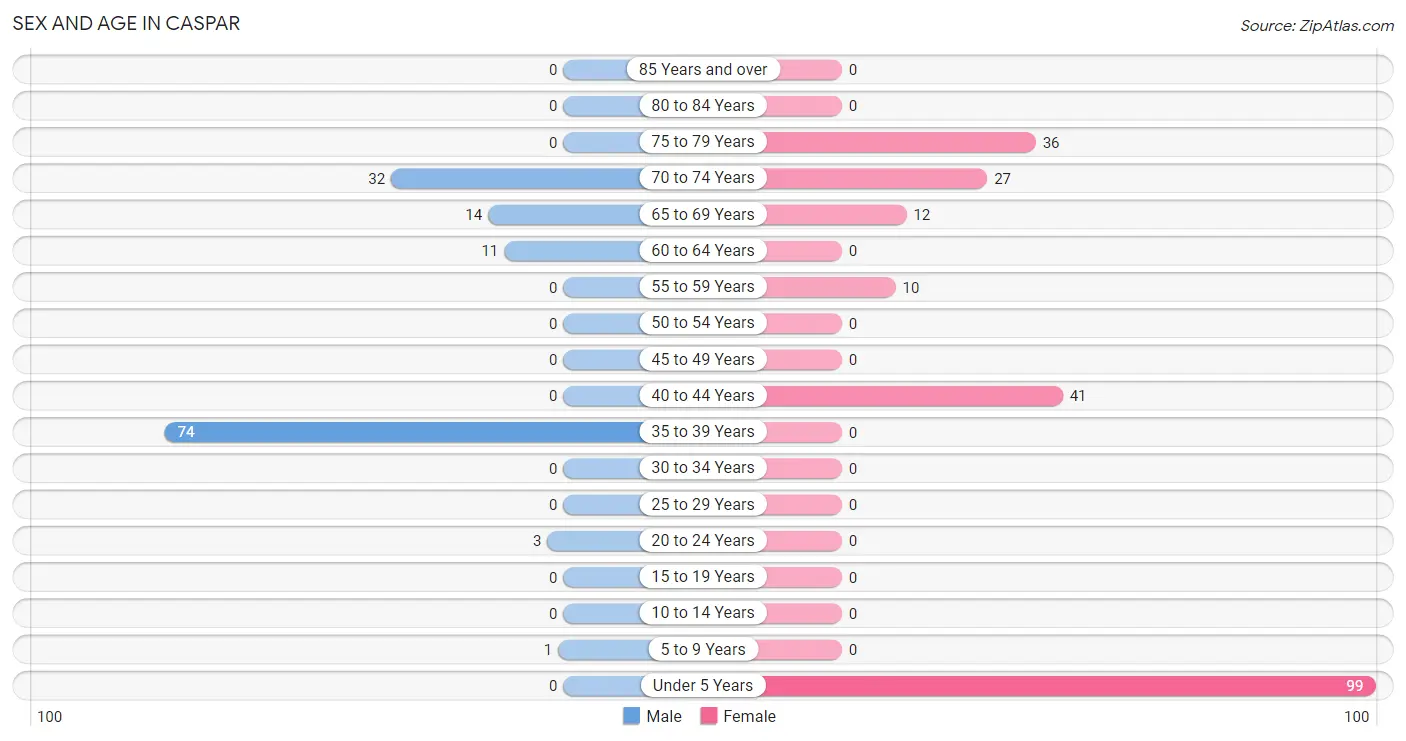
| Age Bracket | Male | Female |
| Under 5 Years | 0 (0.0%) | 99 (44.0%) |
| 5 to 9 Years | 1 (0.7%) | 0 (0.0%) |
| 10 to 14 Years | 0 (0.0%) | 0 (0.0%) |
| 15 to 19 Years | 0 (0.0%) | 0 (0.0%) |
| 20 to 24 Years | 3 (2.2%) | 0 (0.0%) |
| 25 to 29 Years | 0 (0.0%) | 0 (0.0%) |
| 30 to 34 Years | 0 (0.0%) | 0 (0.0%) |
| 35 to 39 Years | 74 (54.8%) | 0 (0.0%) |
| 40 to 44 Years | 0 (0.0%) | 41 (18.2%) |
| 45 to 49 Years | 0 (0.0%) | 0 (0.0%) |
| 50 to 54 Years | 0 (0.0%) | 0 (0.0%) |
| 55 to 59 Years | 0 (0.0%) | 10 (4.4%) |
| 60 to 64 Years | 11 (8.2%) | 0 (0.0%) |
| 65 to 69 Years | 14 (10.4%) | 12 (5.3%) |
| 70 to 74 Years | 32 (23.7%) | 27 (12.0%) |
| 75 to 79 Years | 0 (0.0%) | 36 (16.0%) |
| 80 to 84 Years | 0 (0.0%) | 0 (0.0%) |
| 85 Years and over | 0 (0.0%) | 0 (0.0%) |
| Total | 135 (100.0%) | 225 (100.0%) |
Families and Households in Caspar
Median Family Size in Caspar
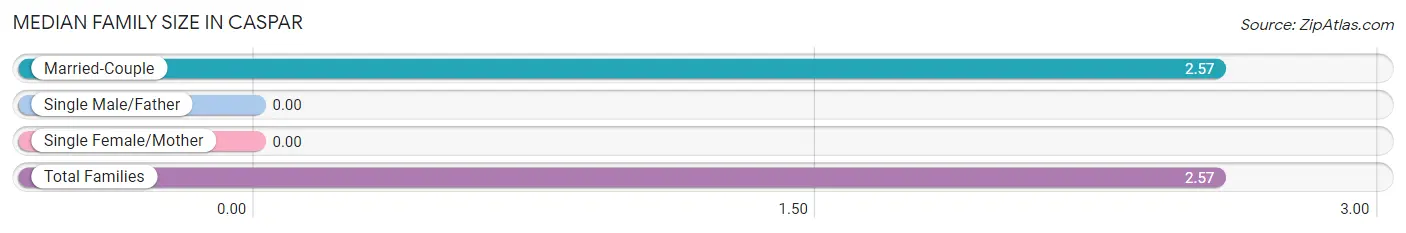
| Family Type | # Families | Family Size |
| Married-Couple | 125 (100.0%) | 2.57 |
| Single Male/Father | 0 (0.0%) | - |
| Single Female/Mother | 0 (0.0%) | - |
| Total Families | 125 (100.0%) | 2.57 |
Median Household Size in Caspar
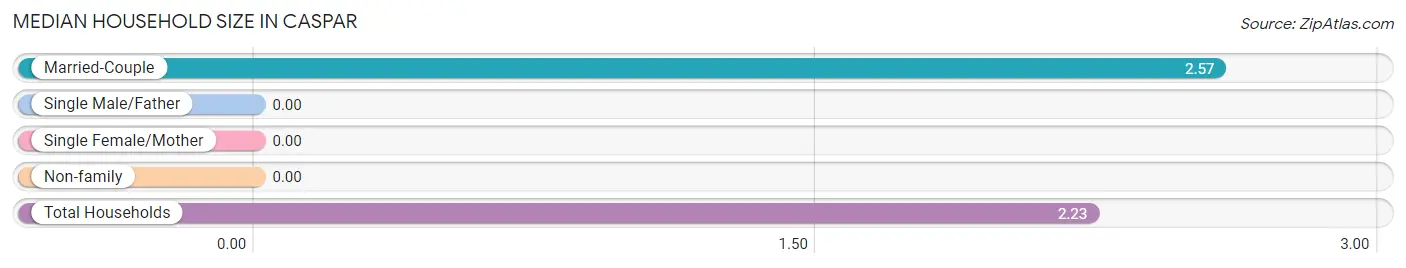
| Household Type | # Households | Household Size |
| Married-Couple | 125 (78.6%) | 2.57 |
| Single Male/Father | 0 (0.0%) | - |
| Single Female/Mother | 0 (0.0%) | - |
| Non-family | 34 (21.4%) | - |
| Total Households | 159 (100.0%) | 2.23 |
Household Size by Marriage Status in Caspar
Out of a total of 159 households in Caspar, 125 (78.6%) are family households, while 34 (21.4%) are nonfamily households. The most numerous type of family households are 4-person households, comprising 73, and the most common type of nonfamily households are 1-person households, comprising 34.
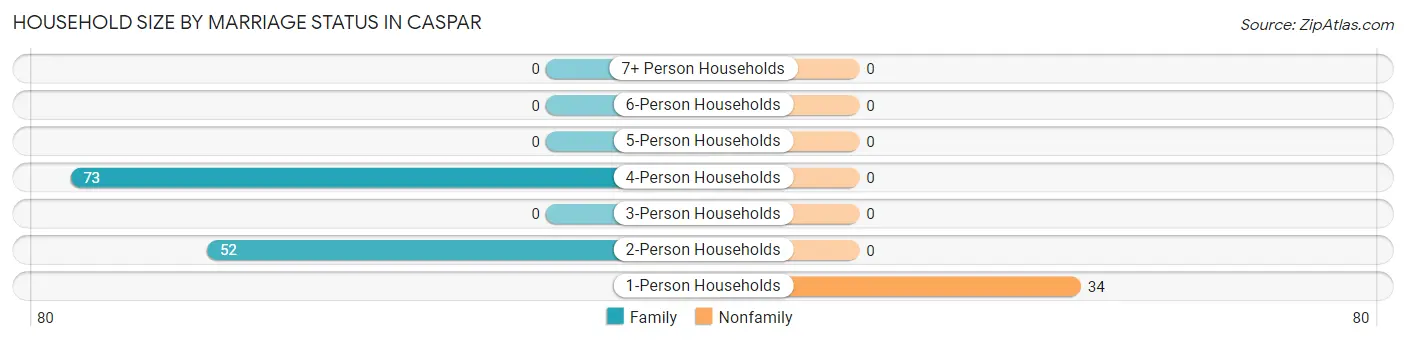
| Household Size | Family Households | Nonfamily Households |
| 1-Person Households | - | 34 (21.4%) |
| 2-Person Households | 52 (32.7%) | 0 (0.0%) |
| 3-Person Households | 0 (0.0%) | 0 (0.0%) |
| 4-Person Households | 73 (45.9%) | 0 (0.0%) |
| 5-Person Households | 0 (0.0%) | 0 (0.0%) |
| 6-Person Households | 0 (0.0%) | 0 (0.0%) |
| 7+ Person Households | 0 (0.0%) | 0 (0.0%) |
| Total | 125 (78.6%) | 34 (21.4%) |
Female Fertility in Caspar
Fertility by Age in Caspar
| Age Bracket | Women with Births | Births / 1,000 Women |
| 15 to 19 years | 0 (0.0%) | 0.0 |
| 20 to 34 years | 0 (0.0%) | 0.0 |
| 35 to 50 years | 0 (0.0%) | 0.0 |
| Total | 0 (0.0%) | 0.0 |
Fertility by Age by Marriage Status in Caspar
| Age Bracket | Married | Unmarried |
| 15 to 19 years | 0 (0.0%) | 0 (0.0%) |
| 20 to 34 years | 0 (0.0%) | 0 (0.0%) |
| 35 to 50 years | 0 (0.0%) | 0 (0.0%) |
| Total | 0 (0.0%) | 0 (0.0%) |
Fertility by Education in Caspar
| Educational Attainment | Women with Births | Births / 1,000 Women |
| Less than High School | 0 (0.0%) | 0.0 |
| High School Diploma | 0 (0.0%) | 0.0 |
| College or Associate's Degree | 0 (0.0%) | 0.0 |
| Bachelor's Degree | 0 (0.0%) | 0.0 |
| Graduate Degree | 0 (0.0%) | 0.0 |
| Total | 0 (0.0%) | 0.0 |
Fertility by Education by Marriage Status in Caspar
| Educational Attainment | Married | Unmarried |
| Less than High School | 0 (0.0%) | 0 (0.0%) |
| High School Diploma | 0 (0.0%) | 0 (0.0%) |
| College or Associate's Degree | 0 (0.0%) | 0 (0.0%) |
| Bachelor's Degree | 0 (0.0%) | 0 (0.0%) |
| Graduate Degree | 0 (0.0%) | 0 (0.0%) |
| Total | 0 (0.0%) | 0 (0.0%) |
Employment Characteristics in Caspar
Employment by Class of Employer in Caspar
Among the 162 employed individuals in Caspar, local government employees (73 | 45.1%), private company employees (50 | 30.9%), and self-employed (not incorporated) (39 | 24.1%) make up the most common classes of employment.
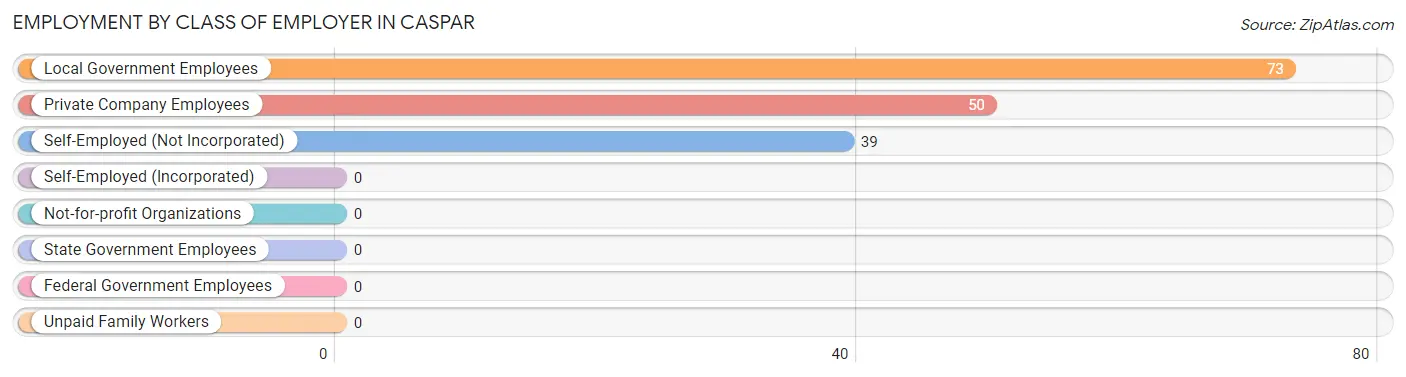
| Employer Class | # Employees | % Employees |
| Private Company Employees | 50 | 30.9% |
| Self-Employed (Incorporated) | 0 | 0.0% |
| Self-Employed (Not Incorporated) | 39 | 24.1% |
| Not-for-profit Organizations | 0 | 0.0% |
| Local Government Employees | 73 | 45.1% |
| State Government Employees | 0 | 0.0% |
| Federal Government Employees | 0 | 0.0% |
| Unpaid Family Workers | 0 | 0.0% |
| Total | 162 | 100.0% |
Employment Status by Age in Caspar
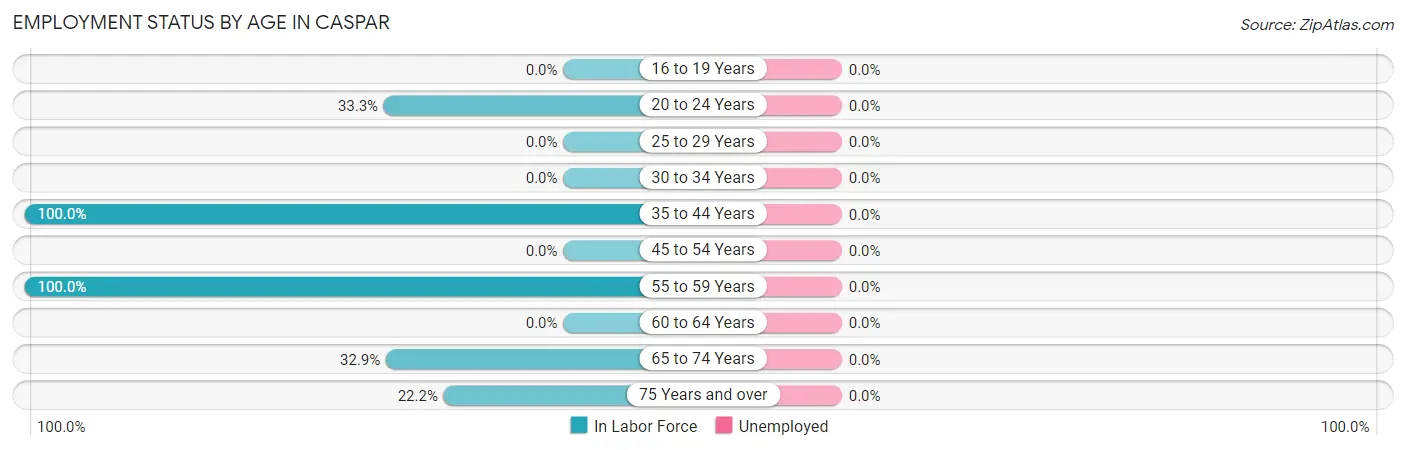
| Age Bracket | In Labor Force | Unemployed |
| 16 to 19 Years | 0 (0.0%) | 0 (0.0%) |
| 20 to 24 Years | 1 (33.3%) | 0 (0.0%) |
| 25 to 29 Years | 0 (0.0%) | 0 (0.0%) |
| 30 to 34 Years | 0 (0.0%) | 0 (0.0%) |
| 35 to 44 Years | 115 (100.0%) | 0 (0.0%) |
| 45 to 54 Years | 0 (0.0%) | 0 (0.0%) |
| 55 to 59 Years | 10 (100.0%) | 0 (0.0%) |
| 60 to 64 Years | 0 (0.0%) | 0 (0.0%) |
| 65 to 74 Years | 28 (32.9%) | 0 (0.0%) |
| 75 Years and over | 8 (22.2%) | 0 (0.0%) |
| Total | 162 (62.3%) | 0 (0.0%) |
Employment Status by Educational Attainment in Caspar
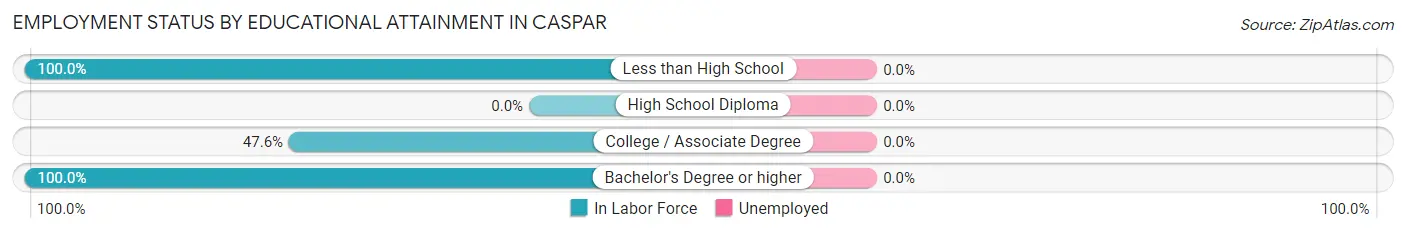
| Educational Attainment | In Labor Force | Unemployed |
| Less than High School | 1 (100.0%) | 0 (0.0%) |
| High School Diploma | 0 (0.0%) | 0 (0.0%) |
| College / Associate Degree | 10 (47.6%) | 0 (0.0%) |
| Bachelor's Degree or higher | 114 (100.0%) | 0 (0.0%) |
| Total | 125 (91.9%) | 0 (0.0%) |
Employment Occupations by Sex in Caspar
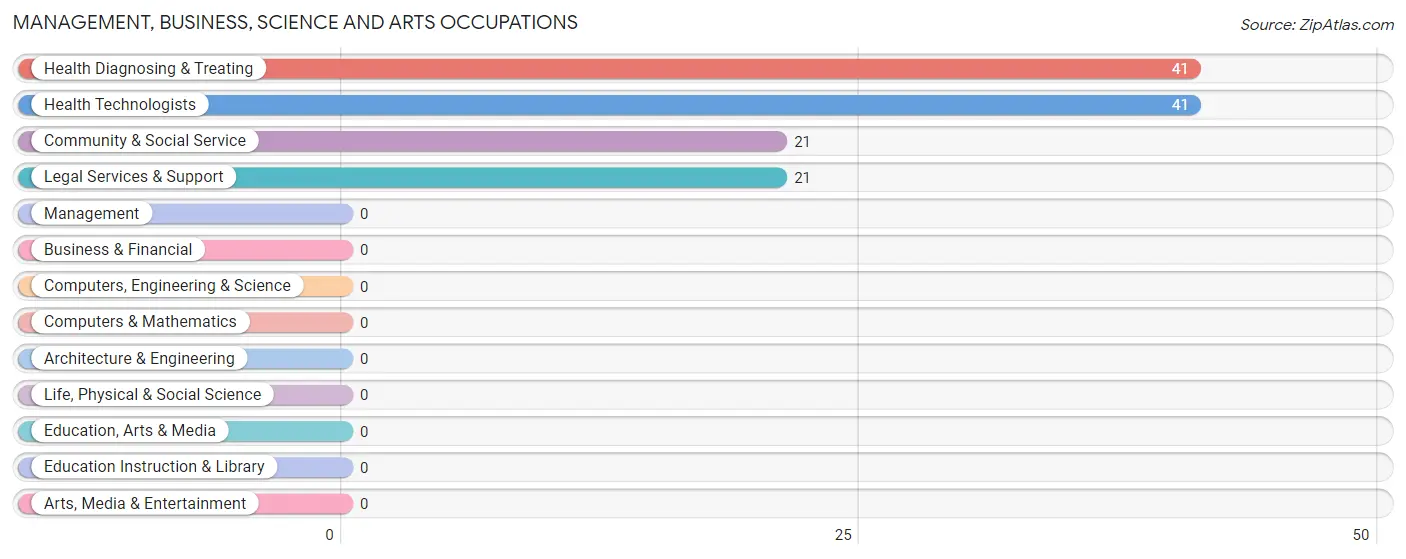
Management, Business, Science and Arts Occupations
The most common Management, Business, Science and Arts occupations in Caspar are Health Diagnosing & Treating (41 | 25.3%), Health Technologists (41 | 25.3%), Community & Social Service (21 | 13.0%), and Legal Services & Support (21 | 13.0%).
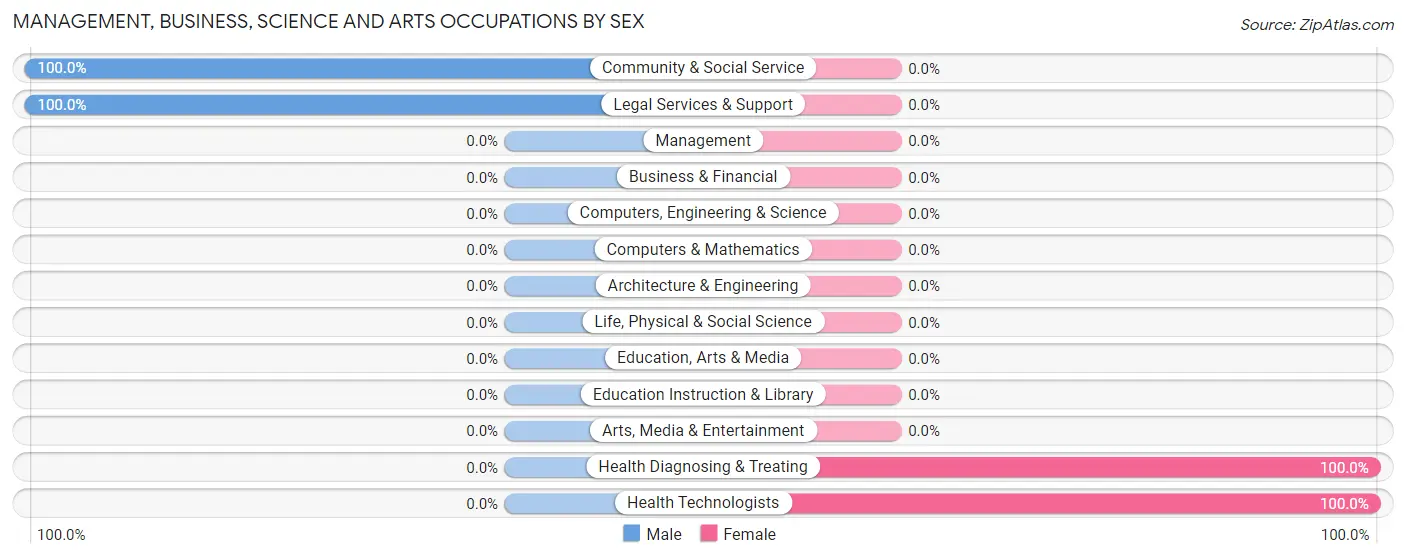
Management, Business, Science and Arts Occupations by Sex
Within the Management, Business, Science and Arts occupations in Caspar, the most male-oriented occupations are Community & Social Service (100.0%), and Legal Services & Support (100.0%), while the most female-oriented occupations are Health Diagnosing & Treating (100.0%), and Health Technologists (100.0%).
| Occupation | Male | Female |
| Management | 0 (0.0%) | 0 (0.0%) |
| Business & Financial | 0 (0.0%) | 0 (0.0%) |
| Computers, Engineering & Science | 0 (0.0%) | 0 (0.0%) |
| Computers & Mathematics | 0 (0.0%) | 0 (0.0%) |
| Architecture & Engineering | 0 (0.0%) | 0 (0.0%) |
| Life, Physical & Social Science | 0 (0.0%) | 0 (0.0%) |
| Community & Social Service | 21 (100.0%) | 0 (0.0%) |
| Education, Arts & Media | 0 (0.0%) | 0 (0.0%) |
| Legal Services & Support | 21 (100.0%) | 0 (0.0%) |
| Education Instruction & Library | 0 (0.0%) | 0 (0.0%) |
| Arts, Media & Entertainment | 0 (0.0%) | 0 (0.0%) |
| Health Diagnosing & Treating | 0 (0.0%) | 41 (100.0%) |
| Health Technologists | 0 (0.0%) | 41 (100.0%) |
| Total (Category) | 21 (33.9%) | 41 (66.1%) |
| Total (Overall) | 96 (59.3%) | 66 (40.7%) |
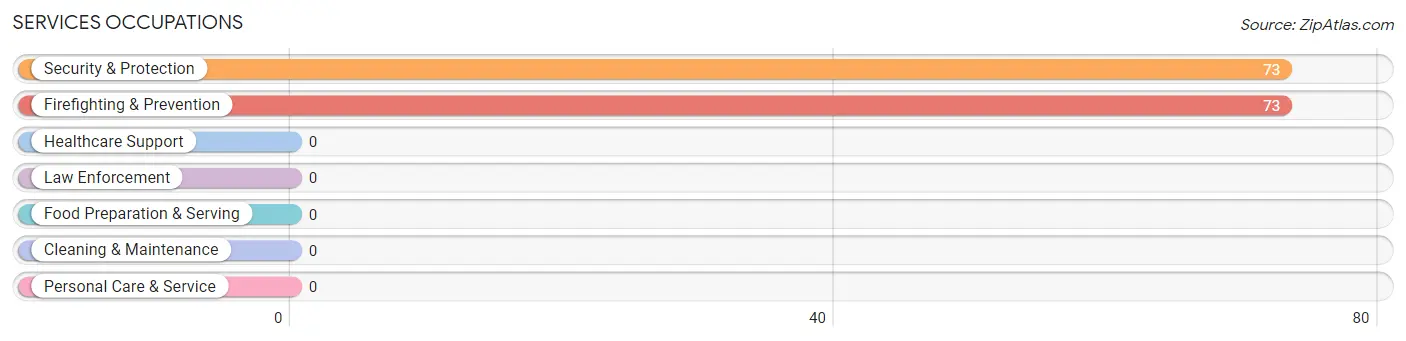
Services Occupations
The most common Services occupations in Caspar are Security & Protection (73 | 45.1%), and Firefighting & Prevention (73 | 45.1%).
Services Occupations by Sex
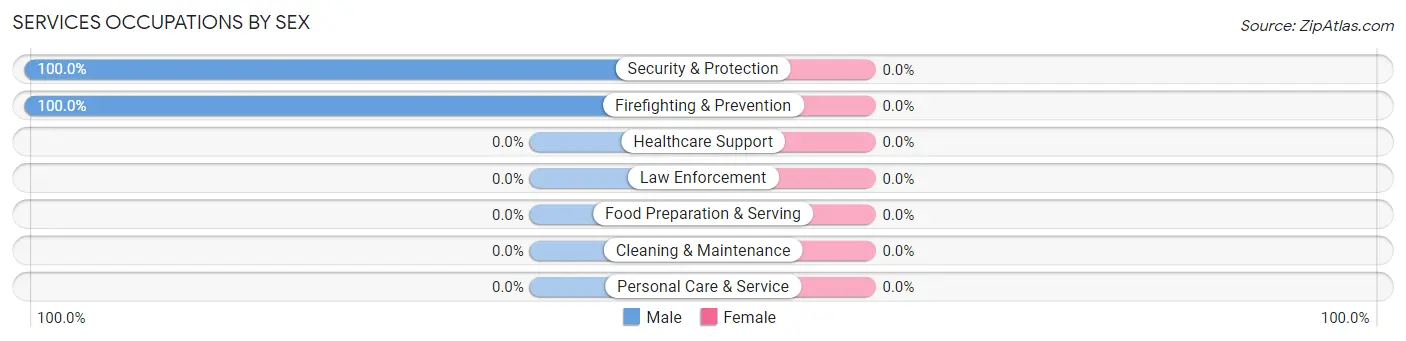
| Occupation | Male | Female |
| Healthcare Support | 0 (0.0%) | 0 (0.0%) |
| Security & Protection | 73 (100.0%) | 0 (0.0%) |
| Firefighting & Prevention | 73 (100.0%) | 0 (0.0%) |
| Law Enforcement | 0 (0.0%) | 0 (0.0%) |
| Food Preparation & Serving | 0 (0.0%) | 0 (0.0%) |
| Cleaning & Maintenance | 0 (0.0%) | 0 (0.0%) |
| Personal Care & Service | 0 (0.0%) | 0 (0.0%) |
| Total (Category) | 73 (100.0%) | 0 (0.0%) |
| Total (Overall) | 96 (59.3%) | 66 (40.7%) |
Sales and Office Occupations
The most common Sales and Office occupations in Caspar are , and Sales & Related (7 | 4.3%).
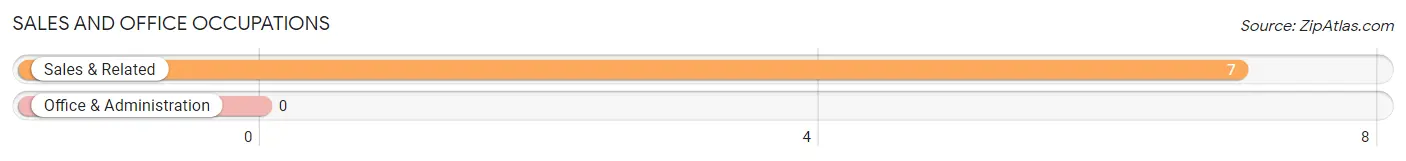
Sales and Office Occupations by Sex

| Occupation | Male | Female |
| Sales & Related | 0 (0.0%) | 7 (100.0%) |
| Office & Administration | 0 (0.0%) | 0 (0.0%) |
| Total (Category) | 0 (0.0%) | 7 (100.0%) |
| Total (Overall) | 96 (59.3%) | 66 (40.7%) |
Natural Resources, Construction and Maintenance Occupations
The most common Natural Resources, Construction and Maintenance occupations in Caspar are , and Farming, Fishing & Forestry (1 | 0.6%).
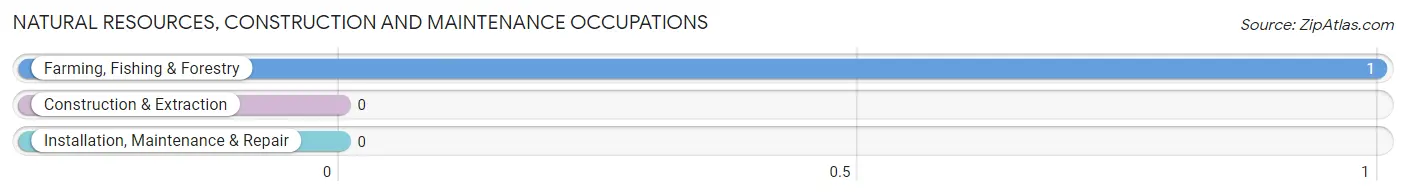
Natural Resources, Construction and Maintenance Occupations by Sex
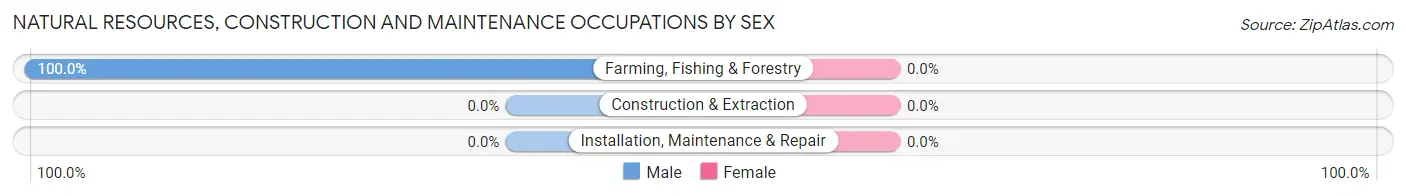
| Occupation | Male | Female |
| Farming, Fishing & Forestry | 1 (100.0%) | 0 (0.0%) |
| Construction & Extraction | 0 (0.0%) | 0 (0.0%) |
| Installation, Maintenance & Repair | 0 (0.0%) | 0 (0.0%) |
| Total (Category) | 1 (100.0%) | 0 (0.0%) |
| Total (Overall) | 96 (59.3%) | 66 (40.7%) |
Production, Transportation and Moving Occupations
The most common Production, Transportation and Moving occupations in Caspar are Production (18 | 11.1%), and Material Moving (1 | 0.6%).
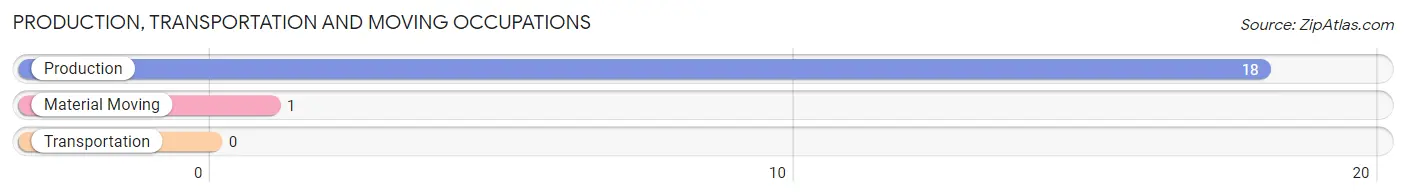
Production, Transportation and Moving Occupations by Sex
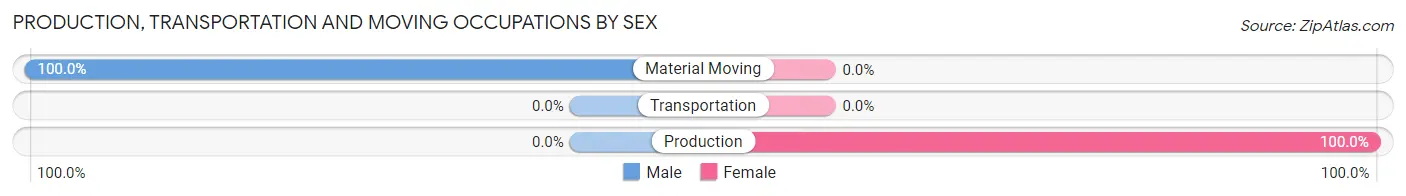
| Occupation | Male | Female |
| Production | 0 (0.0%) | 18 (100.0%) |
| Transportation | 0 (0.0%) | 0 (0.0%) |
| Material Moving | 1 (100.0%) | 0 (0.0%) |
| Total (Category) | 1 (5.3%) | 18 (94.7%) |
| Total (Overall) | 96 (59.3%) | 66 (40.7%) |
Employment Industries by Sex in Caspar
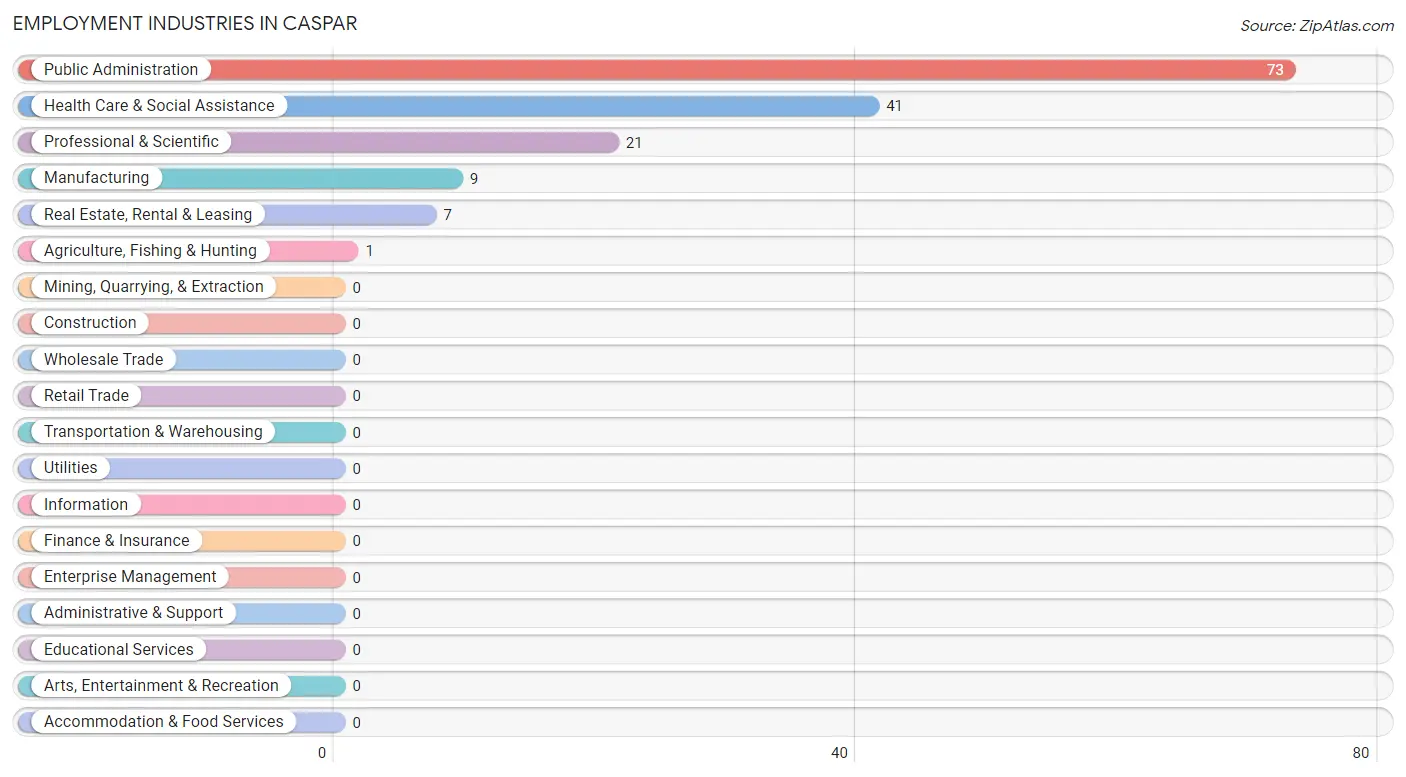
Employment Industries in Caspar
The major employment industries in Caspar include Public Administration (73 | 45.1%), Health Care & Social Assistance (41 | 25.3%), Professional & Scientific (21 | 13.0%), Manufacturing (9 | 5.6%), and Real Estate, Rental & Leasing (7 | 4.3%).
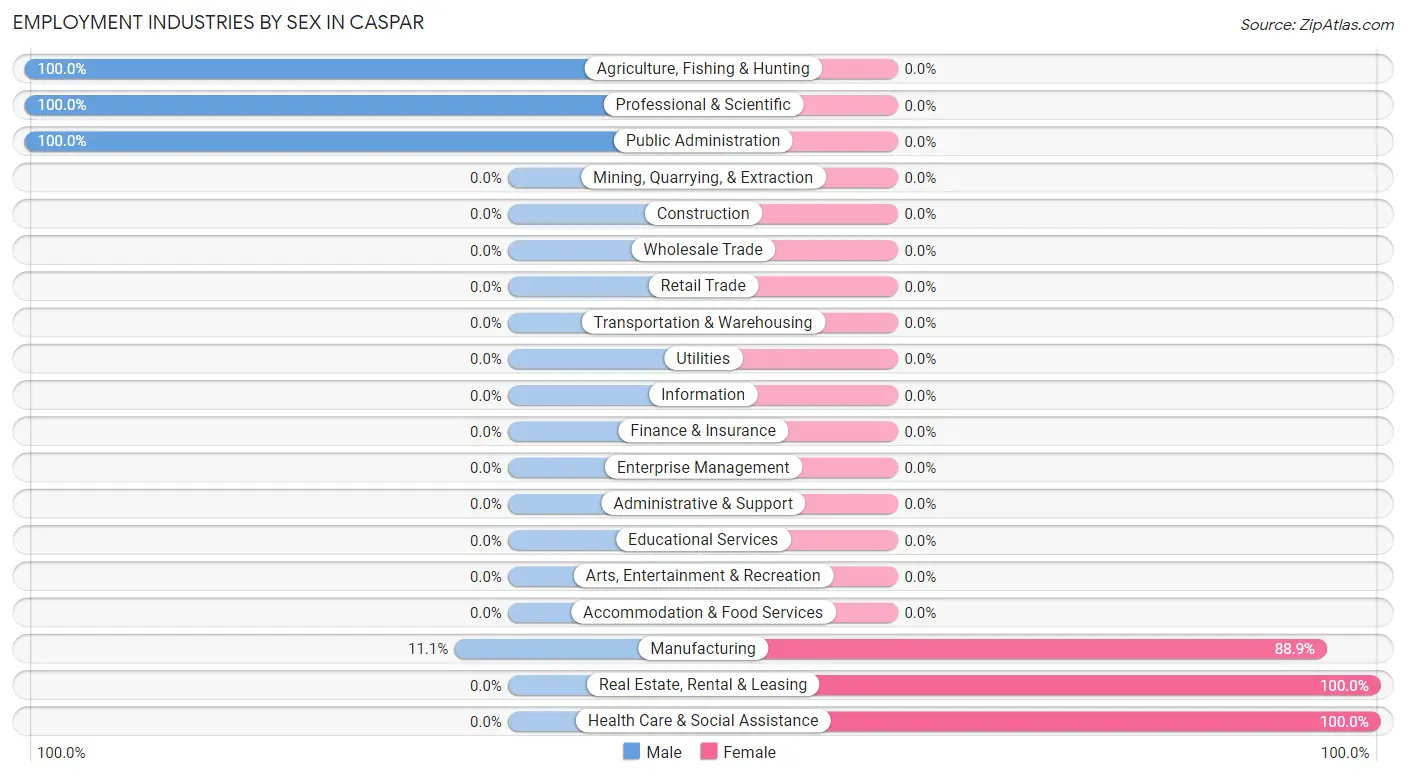
Employment Industries by Sex in Caspar
The Caspar industries that see more men than women are Agriculture, Fishing & Hunting (100.0%), Professional & Scientific (100.0%), and Public Administration (100.0%), whereas the industries that tend to have a higher number of women are Real Estate, Rental & Leasing (100.0%), Health Care & Social Assistance (100.0%), and Manufacturing (88.9%).
| Industry | Male | Female |
| Agriculture, Fishing & Hunting | 1 (100.0%) | 0 (0.0%) |
| Mining, Quarrying, & Extraction | 0 (0.0%) | 0 (0.0%) |
| Construction | 0 (0.0%) | 0 (0.0%) |
| Manufacturing | 1 (11.1%) | 8 (88.9%) |
| Wholesale Trade | 0 (0.0%) | 0 (0.0%) |
| Retail Trade | 0 (0.0%) | 0 (0.0%) |
| Transportation & Warehousing | 0 (0.0%) | 0 (0.0%) |
| Utilities | 0 (0.0%) | 0 (0.0%) |
| Information | 0 (0.0%) | 0 (0.0%) |
| Finance & Insurance | 0 (0.0%) | 0 (0.0%) |
| Real Estate, Rental & Leasing | 0 (0.0%) | 7 (100.0%) |
| Professional & Scientific | 21 (100.0%) | 0 (0.0%) |
| Enterprise Management | 0 (0.0%) | 0 (0.0%) |
| Administrative & Support | 0 (0.0%) | 0 (0.0%) |
| Educational Services | 0 (0.0%) | 0 (0.0%) |
| Health Care & Social Assistance | 0 (0.0%) | 41 (100.0%) |
| Arts, Entertainment & Recreation | 0 (0.0%) | 0 (0.0%) |
| Accommodation & Food Services | 0 (0.0%) | 0 (0.0%) |
| Public Administration | 73 (100.0%) | 0 (0.0%) |
| Total | 96 (59.3%) | 66 (40.7%) |
Education in Caspar
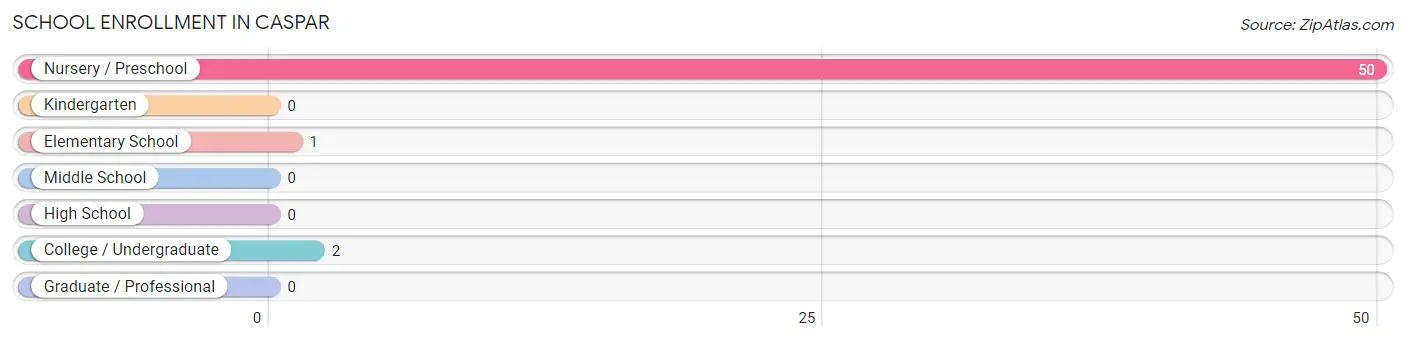
School Enrollment in Caspar
The most common levels of schooling among the 53 students in Caspar are nursery / preschool (50 | 94.3%), college / undergraduate (2 | 3.8%), and elementary school (1 | 1.9%).
| School Level | # Students | % Students |
| Nursery / Preschool | 50 | 94.3% |
| Kindergarten | 0 | 0.0% |
| Elementary School | 1 | 1.9% |
| Middle School | 0 | 0.0% |
| High School | 0 | 0.0% |
| College / Undergraduate | 2 | 3.8% |
| Graduate / Professional | 0 | 0.0% |
| Total | 53 | 100.0% |
School Enrollment by Age by Funding Source in Caspar
Out of a total of 53 students who are enrolled in schools in Caspar, 50 (94.3%) attend a private institution, while the remaining 3 (5.7%) are enrolled in public schools. The age group of 3 to 4 year olds has the highest likelihood of being enrolled in private schools, with 50 (100.0% in the age bracket) enrolled. Conversely, the age group of 5 to 9 year old has the lowest likelihood of being enrolled in a private school, with 1 (100.0% in the age bracket) attending a public institution.
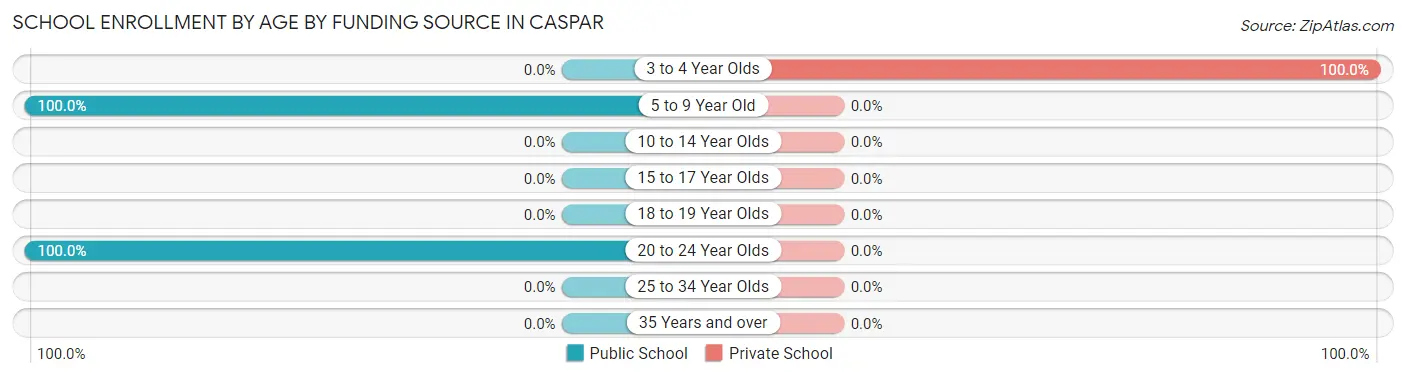
| Age Bracket | Public School | Private School |
| 3 to 4 Year Olds | 0 (0.0%) | 50 (100.0%) |
| 5 to 9 Year Old | 1 (100.0%) | 0 (0.0%) |
| 10 to 14 Year Olds | 0 (0.0%) | 0 (0.0%) |
| 15 to 17 Year Olds | 0 (0.0%) | 0 (0.0%) |
| 18 to 19 Year Olds | 0 (0.0%) | 0 (0.0%) |
| 20 to 24 Year Olds | 2 (100.0%) | 0 (0.0%) |
| 25 to 34 Year Olds | 0 (0.0%) | 0 (0.0%) |
| 35 Years and over | 0 (0.0%) | 0 (0.0%) |
| Total | 3 (5.7%) | 50 (94.3%) |
Educational Attainment by Field of Study in Caspar
Business (73 | 27.0%), science & technology (50 | 18.5%), liberal arts & history (38 | 14.1%), literature & languages (37 | 13.7%), and social sciences (25 | 9.3%) are the most common fields of study among 270 individuals in Caspar who have obtained a bachelor's degree or higher.
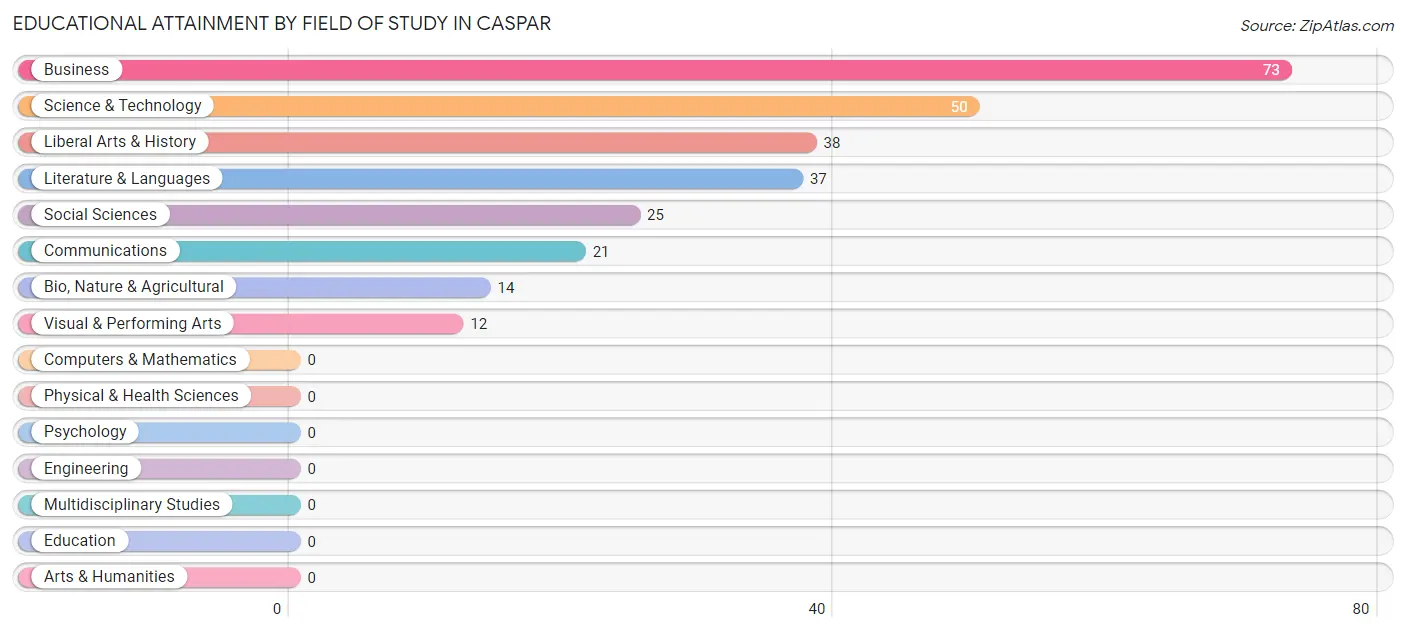
| Field of Study | # Graduates | % Graduates |
| Computers & Mathematics | 0 | 0.0% |
| Bio, Nature & Agricultural | 14 | 5.2% |
| Physical & Health Sciences | 0 | 0.0% |
| Psychology | 0 | 0.0% |
| Social Sciences | 25 | 9.3% |
| Engineering | 0 | 0.0% |
| Multidisciplinary Studies | 0 | 0.0% |
| Science & Technology | 50 | 18.5% |
| Business | 73 | 27.0% |
| Education | 0 | 0.0% |
| Literature & Languages | 37 | 13.7% |
| Liberal Arts & History | 38 | 14.1% |
| Visual & Performing Arts | 12 | 4.4% |
| Communications | 21 | 7.8% |
| Arts & Humanities | 0 | 0.0% |
| Total | 270 | 100.0% |
Transportation & Commute in Caspar
Vehicle Availability by Sex in Caspar
The most prevalent vehicle ownership categories in Caspar are males with 4 vehicles (73, accounting for 77.7%) and females with 4 vehicles (41, making up 110.6%).
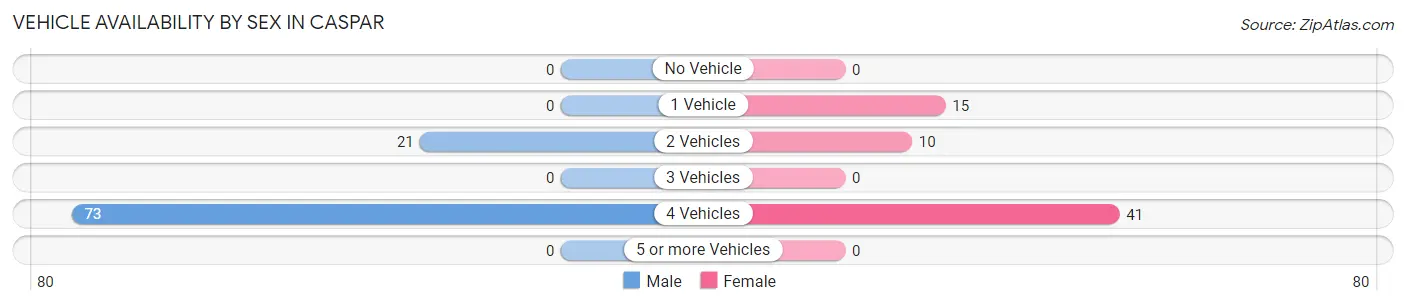
| Vehicles Available | Male | Female |
| No Vehicle | 0 (0.0%) | 0 (0.0%) |
| 1 Vehicle | 0 (0.0%) | 15 (22.7%) |
| 2 Vehicles | 21 (22.3%) | 10 (15.1%) |
| 3 Vehicles | 0 (0.0%) | 0 (0.0%) |
| 4 Vehicles | 73 (77.7%) | 41 (62.1%) |
| 5 or more Vehicles | 0 (0.0%) | 0 (0.0%) |
| Total | 94 (100.0%) | 66 (100.0%) |
Commute Time in Caspar
The most frequently occuring commute durations in Caspar are 5 to 9 minutes (74 commuters, 60.2%), less than 5 minutes (41 commuters, 33.3%), and 40 to 44 minutes (7 commuters, 5.7%).
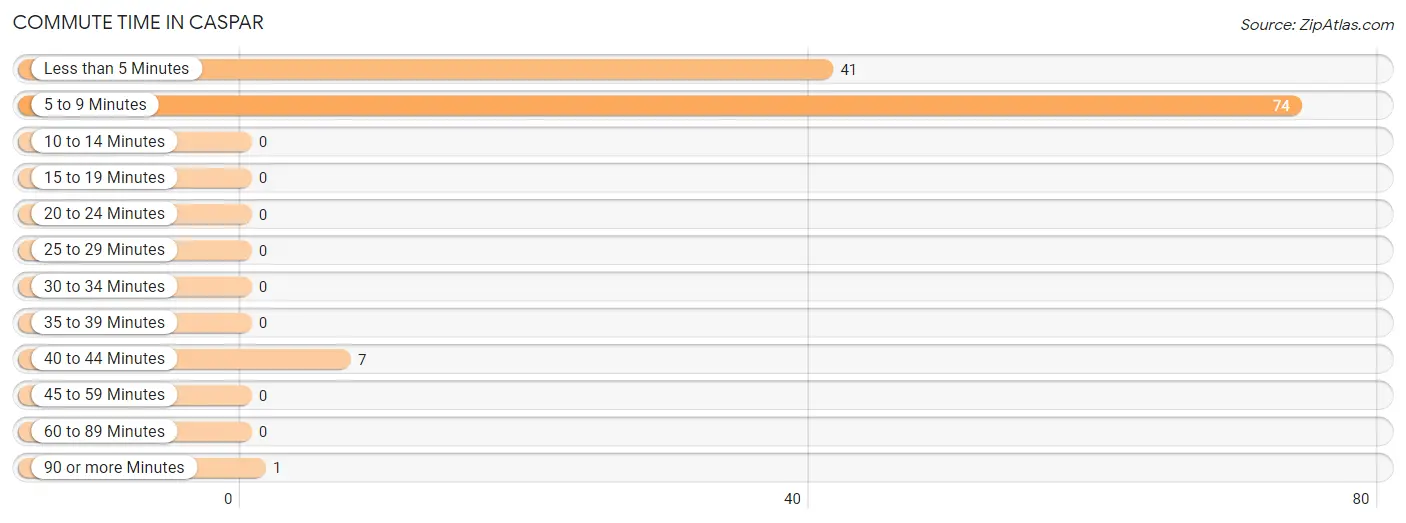
| Commute Time | # Commuters | % Commuters |
| Less than 5 Minutes | 41 | 33.3% |
| 5 to 9 Minutes | 74 | 60.2% |
| 10 to 14 Minutes | 0 | 0.0% |
| 15 to 19 Minutes | 0 | 0.0% |
| 20 to 24 Minutes | 0 | 0.0% |
| 25 to 29 Minutes | 0 | 0.0% |
| 30 to 34 Minutes | 0 | 0.0% |
| 35 to 39 Minutes | 0 | 0.0% |
| 40 to 44 Minutes | 7 | 5.7% |
| 45 to 59 Minutes | 0 | 0.0% |
| 60 to 89 Minutes | 0 | 0.0% |
| 90 or more Minutes | 1 | 0.8% |
Commute Time by Sex in Caspar
The most common commute times in Caspar are 5 to 9 minutes (74 commuters, 98.7%) for males and less than 5 minutes (41 commuters, 85.4%) for females.
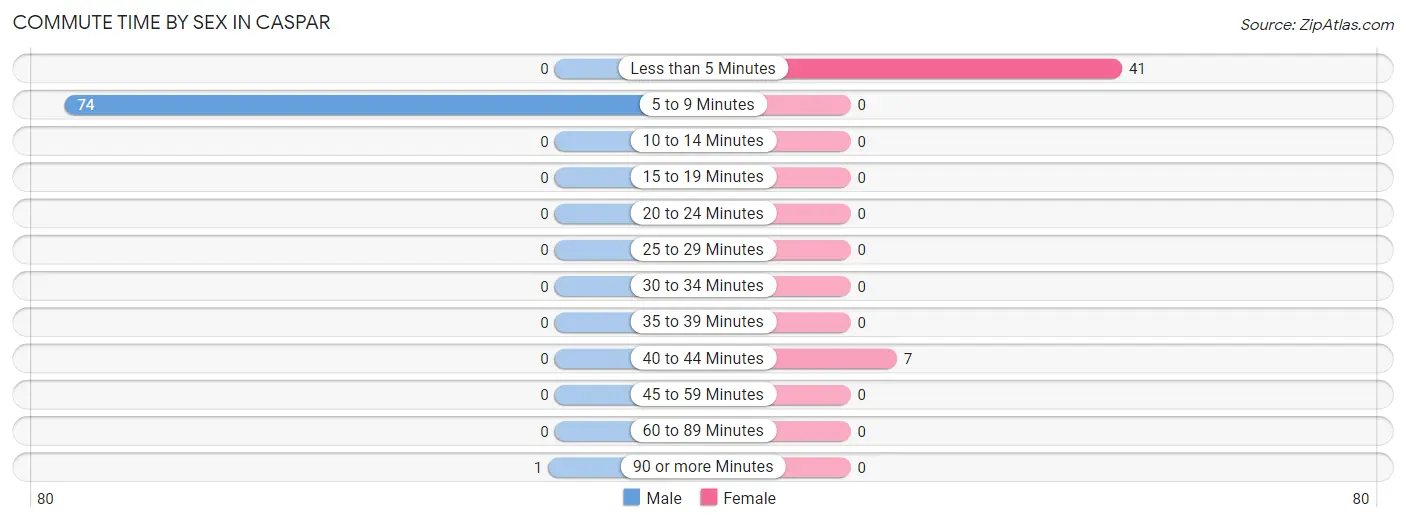
| Commute Time | Male | Female |
| Less than 5 Minutes | 0 (0.0%) | 41 (85.4%) |
| 5 to 9 Minutes | 74 (98.7%) | 0 (0.0%) |
| 10 to 14 Minutes | 0 (0.0%) | 0 (0.0%) |
| 15 to 19 Minutes | 0 (0.0%) | 0 (0.0%) |
| 20 to 24 Minutes | 0 (0.0%) | 0 (0.0%) |
| 25 to 29 Minutes | 0 (0.0%) | 0 (0.0%) |
| 30 to 34 Minutes | 0 (0.0%) | 0 (0.0%) |
| 35 to 39 Minutes | 0 (0.0%) | 0 (0.0%) |
| 40 to 44 Minutes | 0 (0.0%) | 7 (14.6%) |
| 45 to 59 Minutes | 0 (0.0%) | 0 (0.0%) |
| 60 to 89 Minutes | 0 (0.0%) | 0 (0.0%) |
| 90 or more Minutes | 1 (1.3%) | 0 (0.0%) |
Time of Departure to Work by Sex in Caspar
The most frequent times of departure to work in Caspar are 7:30 AM to 7:59 AM (73, 97.3%) for males and 8:00 AM to 8:29 AM (41, 85.4%) for females.
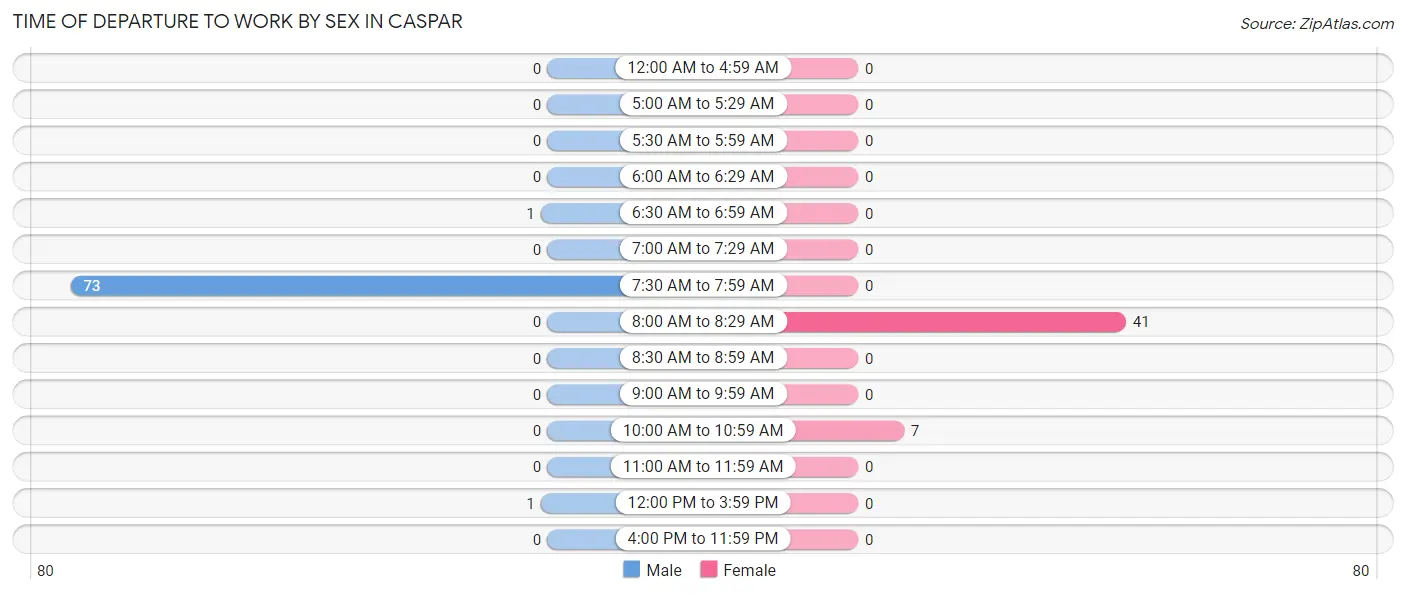
| Time of Departure | Male | Female |
| 12:00 AM to 4:59 AM | 0 (0.0%) | 0 (0.0%) |
| 5:00 AM to 5:29 AM | 0 (0.0%) | 0 (0.0%) |
| 5:30 AM to 5:59 AM | 0 (0.0%) | 0 (0.0%) |
| 6:00 AM to 6:29 AM | 0 (0.0%) | 0 (0.0%) |
| 6:30 AM to 6:59 AM | 1 (1.3%) | 0 (0.0%) |
| 7:00 AM to 7:29 AM | 0 (0.0%) | 0 (0.0%) |
| 7:30 AM to 7:59 AM | 73 (97.3%) | 0 (0.0%) |
| 8:00 AM to 8:29 AM | 0 (0.0%) | 41 (85.4%) |
| 8:30 AM to 8:59 AM | 0 (0.0%) | 0 (0.0%) |
| 9:00 AM to 9:59 AM | 0 (0.0%) | 0 (0.0%) |
| 10:00 AM to 10:59 AM | 0 (0.0%) | 7 (14.6%) |
| 11:00 AM to 11:59 AM | 0 (0.0%) | 0 (0.0%) |
| 12:00 PM to 3:59 PM | 1 (1.3%) | 0 (0.0%) |
| 4:00 PM to 11:59 PM | 0 (0.0%) | 0 (0.0%) |
| Total | 75 (100.0%) | 48 (100.0%) |
Housing Occupancy in Caspar
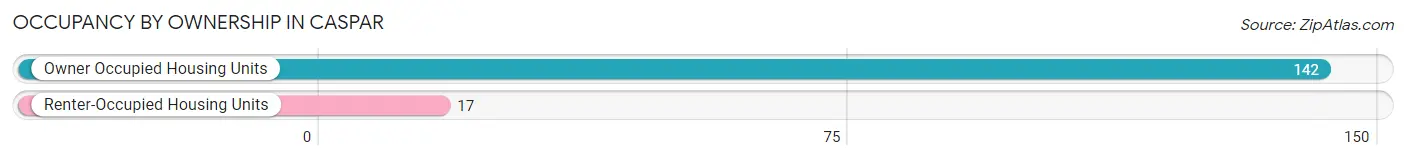
Occupancy by Ownership in Caspar
Of the total 159 dwellings in Caspar, owner-occupied units account for 142 (89.3%), while renter-occupied units make up 17 (10.7%).
| Occupancy | # Housing Units | % Housing Units |
| Owner Occupied Housing Units | 142 | 89.3% |
| Renter-Occupied Housing Units | 17 | 10.7% |
| Total Occupied Housing Units | 159 | 100.0% |
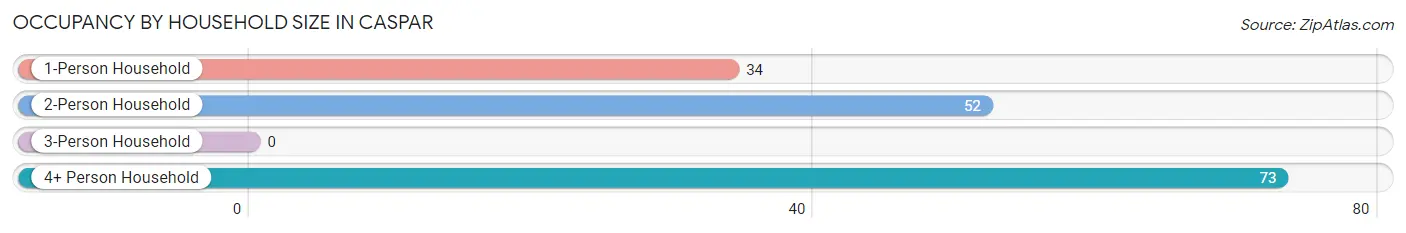
Occupancy by Household Size in Caspar
| Household Size | # Housing Units | % Housing Units |
| 1-Person Household | 34 | 21.4% |
| 2-Person Household | 52 | 32.7% |
| 3-Person Household | 0 | 0.0% |
| 4+ Person Household | 73 | 45.9% |
| Total Housing Units | 159 | 100.0% |
Occupancy by Ownership by Household Size in Caspar
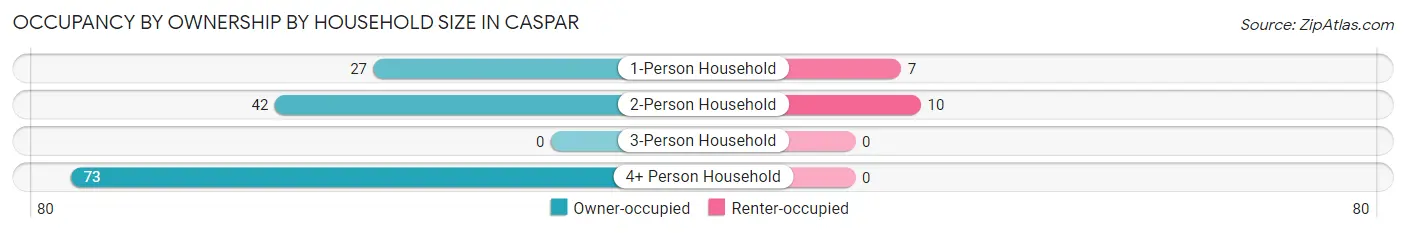
| Household Size | Owner-occupied | Renter-occupied |
| 1-Person Household | 27 (79.4%) | 7 (20.6%) |
| 2-Person Household | 42 (80.8%) | 10 (19.2%) |
| 3-Person Household | 0 (0.0%) | 0 (0.0%) |
| 4+ Person Household | 73 (100.0%) | 0 (0.0%) |
| Total Housing Units | 142 (89.3%) | 17 (10.7%) |
Occupancy by Educational Attainment in Caspar
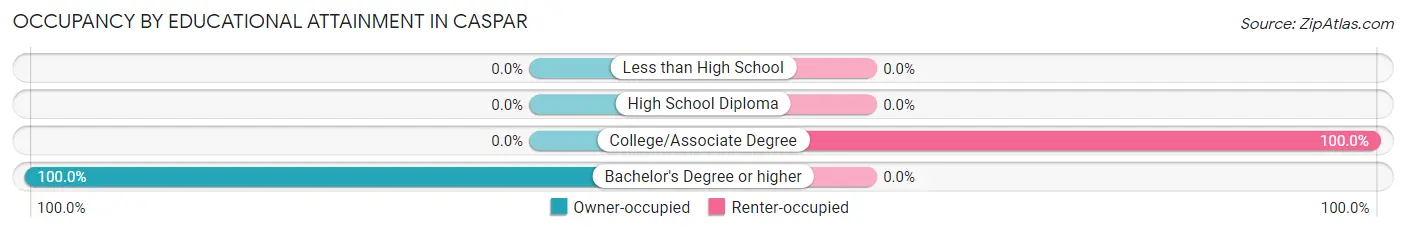
| Household Size | Owner-occupied | Renter-occupied |
| Less than High School | 0 (0.0%) | 0 (0.0%) |
| High School Diploma | 0 (0.0%) | 0 (0.0%) |
| College/Associate Degree | 0 (0.0%) | 17 (100.0%) |
| Bachelor's Degree or higher | 142 (100.0%) | 0 (0.0%) |
Occupancy by Age of Householder in Caspar
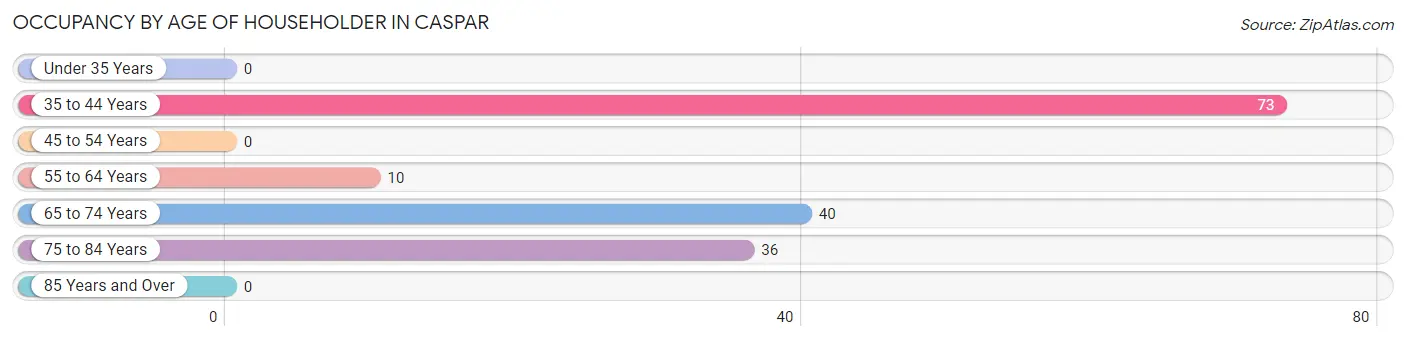
| Age Bracket | # Households | % Households |
| Under 35 Years | 0 | 0.0% |
| 35 to 44 Years | 73 | 45.9% |
| 45 to 54 Years | 0 | 0.0% |
| 55 to 64 Years | 10 | 6.3% |
| 65 to 74 Years | 40 | 25.2% |
| 75 to 84 Years | 36 | 22.6% |
| 85 Years and Over | 0 | 0.0% |
| Total | 159 | 100.0% |
Housing Finances in Caspar
Median Income by Occupancy in Caspar
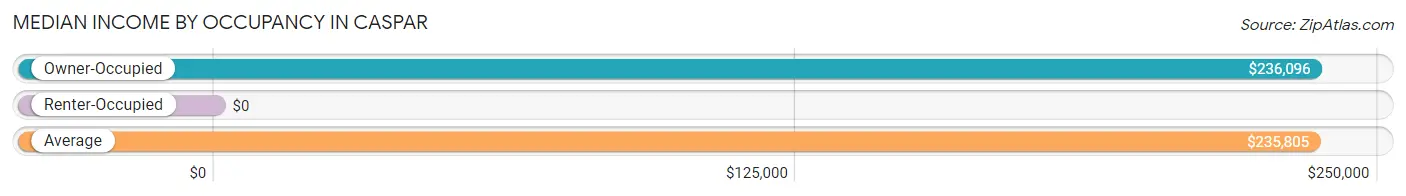
| Occupancy Type | # Households | Median Income |
| Owner-Occupied | 142 (89.3%) | $236,096 |
| Renter-Occupied | 17 (10.7%) | $0 |
| Average | 159 (100.0%) | $235,805 |
Occupancy by Householder Income Bracket in Caspar
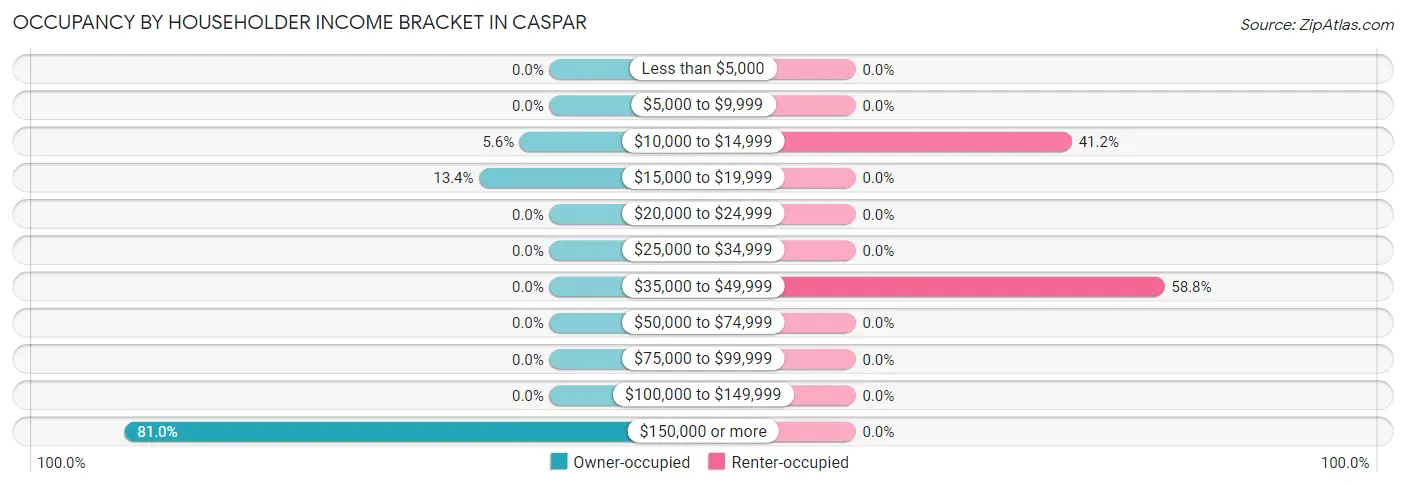
| Income Bracket | Owner-occupied | Renter-occupied |
| Less than $5,000 | 0 (0.0%) | 0 (0.0%) |
| $5,000 to $9,999 | 0 (0.0%) | 0 (0.0%) |
| $10,000 to $14,999 | 8 (5.6%) | 7 (41.2%) |
| $15,000 to $19,999 | 19 (13.4%) | 0 (0.0%) |
| $20,000 to $24,999 | 0 (0.0%) | 0 (0.0%) |
| $25,000 to $34,999 | 0 (0.0%) | 0 (0.0%) |
| $35,000 to $49,999 | 0 (0.0%) | 10 (58.8%) |
| $50,000 to $74,999 | 0 (0.0%) | 0 (0.0%) |
| $75,000 to $99,999 | 0 (0.0%) | 0 (0.0%) |
| $100,000 to $149,999 | 0 (0.0%) | 0 (0.0%) |
| $150,000 or more | 115 (81.0%) | 0 (0.0%) |
| Total | 142 (100.0%) | 17 (100.0%) |
Monthly Housing Cost Tiers in Caspar
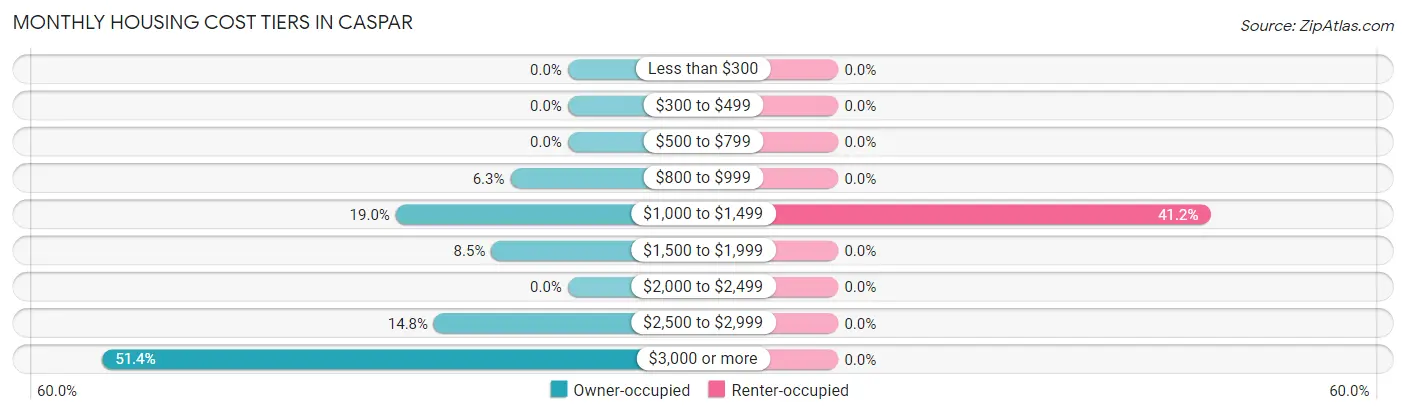
| Monthly Cost | Owner-occupied | Renter-occupied |
| Less than $300 | 0 (0.0%) | 0 (0.0%) |
| $300 to $499 | 0 (0.0%) | 0 (0.0%) |
| $500 to $799 | 0 (0.0%) | 0 (0.0%) |
| $800 to $999 | 9 (6.3%) | 0 (0.0%) |
| $1,000 to $1,499 | 27 (19.0%) | 7 (41.2%) |
| $1,500 to $1,999 | 12 (8.5%) | 0 (0.0%) |
| $2,000 to $2,499 | 0 (0.0%) | 0 (0.0%) |
| $2,500 to $2,999 | 21 (14.8%) | 0 (0.0%) |
| $3,000 or more | 73 (51.4%) | 0 (0.0%) |
| Total | 142 (100.0%) | 17 (100.0%) |
Physical Housing Characteristics in Caspar
Housing Structures in Caspar
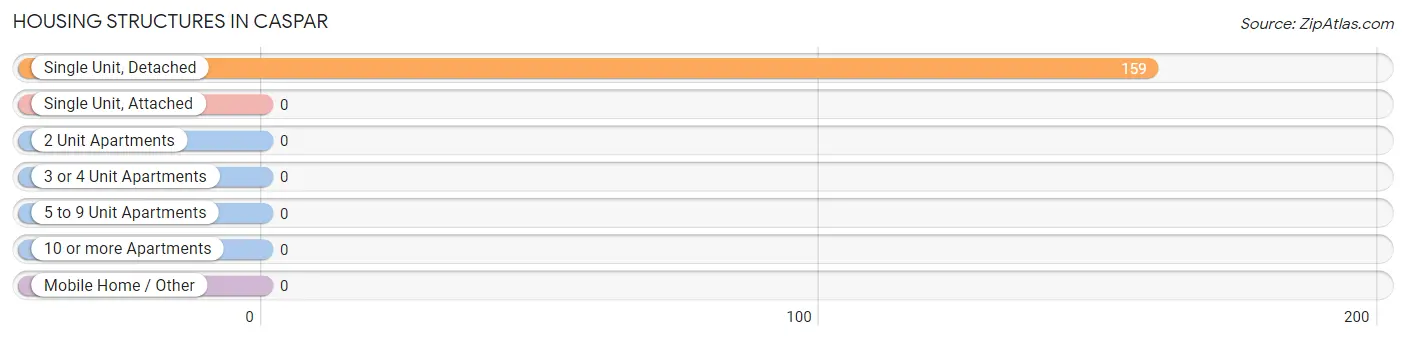
| Structure Type | # Housing Units | % Housing Units |
| Single Unit, Detached | 159 | 100.0% |
| Single Unit, Attached | 0 | 0.0% |
| 2 Unit Apartments | 0 | 0.0% |
| 3 or 4 Unit Apartments | 0 | 0.0% |
| 5 to 9 Unit Apartments | 0 | 0.0% |
| 10 or more Apartments | 0 | 0.0% |
| Mobile Home / Other | 0 | 0.0% |
| Total | 159 | 100.0% |
Housing Structures by Occupancy in Caspar
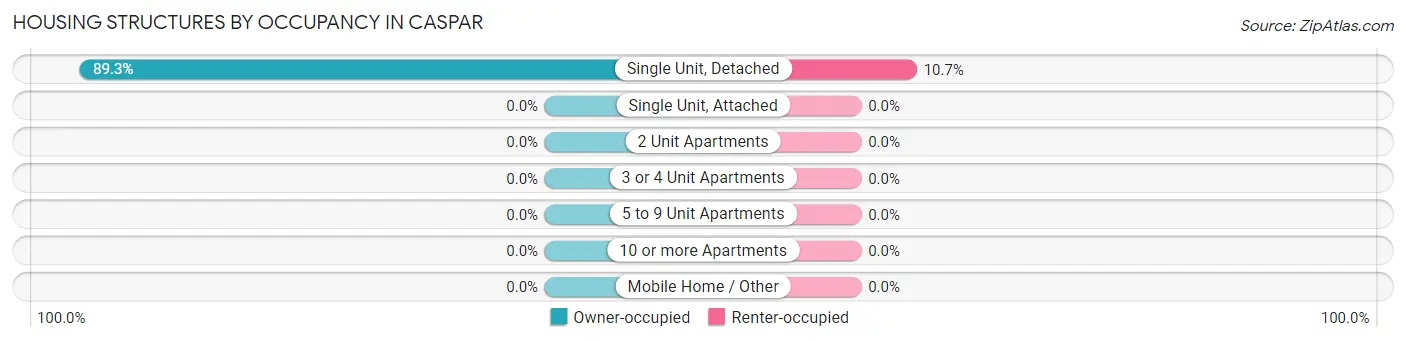
| Structure Type | Owner-occupied | Renter-occupied |
| Single Unit, Detached | 142 (89.3%) | 17 (10.7%) |
| Single Unit, Attached | 0 (0.0%) | 0 (0.0%) |
| 2 Unit Apartments | 0 (0.0%) | 0 (0.0%) |
| 3 or 4 Unit Apartments | 0 (0.0%) | 0 (0.0%) |
| 5 to 9 Unit Apartments | 0 (0.0%) | 0 (0.0%) |
| 10 or more Apartments | 0 (0.0%) | 0 (0.0%) |
| Mobile Home / Other | 0 (0.0%) | 0 (0.0%) |
| Total | 142 (89.3%) | 17 (10.7%) |
Housing Structures by Number of Rooms in Caspar
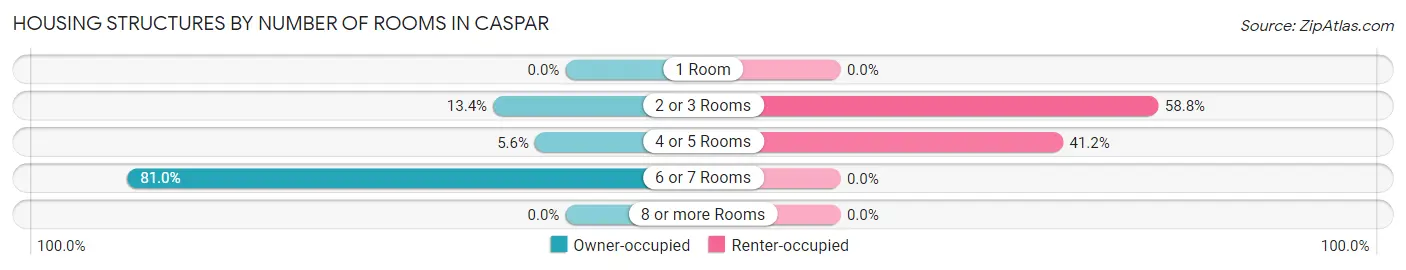
| Number of Rooms | Owner-occupied | Renter-occupied |
| 1 Room | 0 (0.0%) | 0 (0.0%) |
| 2 or 3 Rooms | 19 (13.4%) | 10 (58.8%) |
| 4 or 5 Rooms | 8 (5.6%) | 7 (41.2%) |
| 6 or 7 Rooms | 115 (81.0%) | 0 (0.0%) |
| 8 or more Rooms | 0 (0.0%) | 0 (0.0%) |
| Total | 142 (100.0%) | 17 (100.0%) |
Housing Structure by Heating Type in Caspar
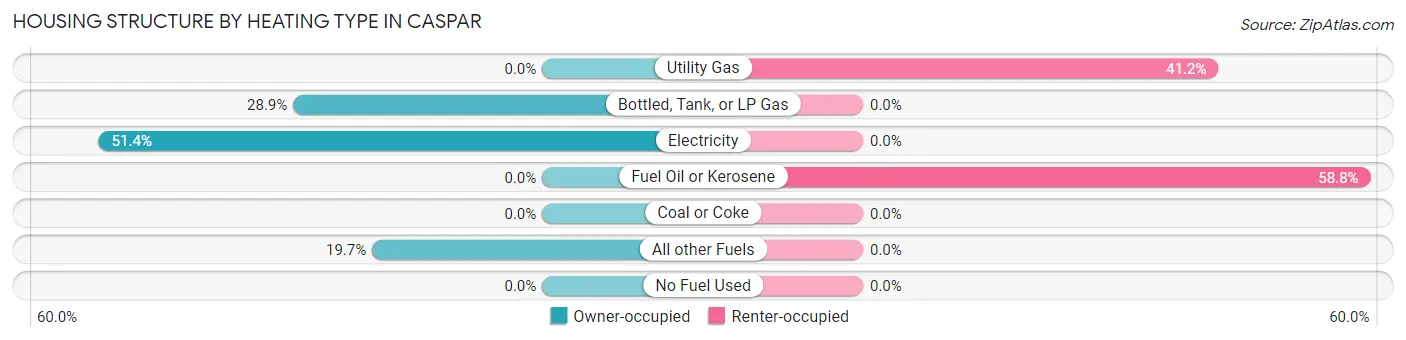
| Heating Type | Owner-occupied | Renter-occupied |
| Utility Gas | 0 (0.0%) | 7 (41.2%) |
| Bottled, Tank, or LP Gas | 41 (28.9%) | 0 (0.0%) |
| Electricity | 73 (51.4%) | 0 (0.0%) |
| Fuel Oil or Kerosene | 0 (0.0%) | 10 (58.8%) |
| Coal or Coke | 0 (0.0%) | 0 (0.0%) |
| All other Fuels | 28 (19.7%) | 0 (0.0%) |
| No Fuel Used | 0 (0.0%) | 0 (0.0%) |
| Total | 142 (100.0%) | 17 (100.0%) |
Household Vehicle Usage in Caspar
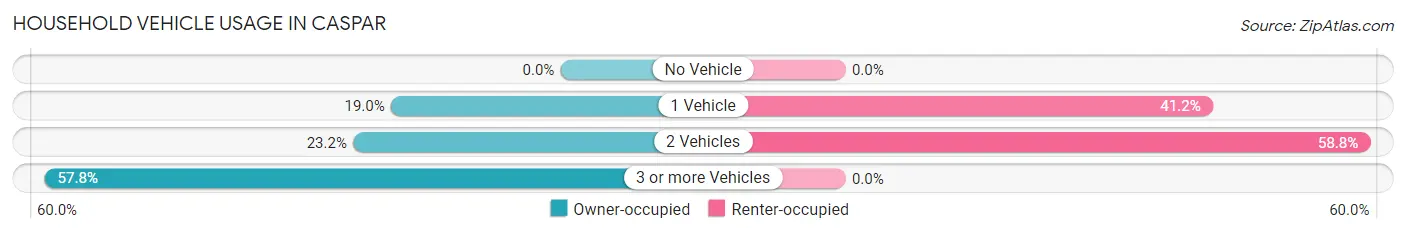
| Vehicles per Household | Owner-occupied | Renter-occupied |
| No Vehicle | 0 (0.0%) | 0 (0.0%) |
| 1 Vehicle | 27 (19.0%) | 7 (41.2%) |
| 2 Vehicles | 33 (23.2%) | 10 (58.8%) |
| 3 or more Vehicles | 82 (57.8%) | 0 (0.0%) |
| Total | 142 (100.0%) | 17 (100.0%) |
Real Estate & Mortgages in Caspar
Real Estate and Mortgage Overview in Caspar
| Characteristic | Without Mortgage | With Mortgage |
| Housing Units | 38 | 104 |
| Median Property Value | $2,000,001 | $1,071,900 |
| Median Household Income | $250,001 | $85 |
| Monthly Housing Costs | $1,501 | $73 |
| Real Estate Taxes | $10,001 | $0 |
Property Value by Mortgage Status in Caspar
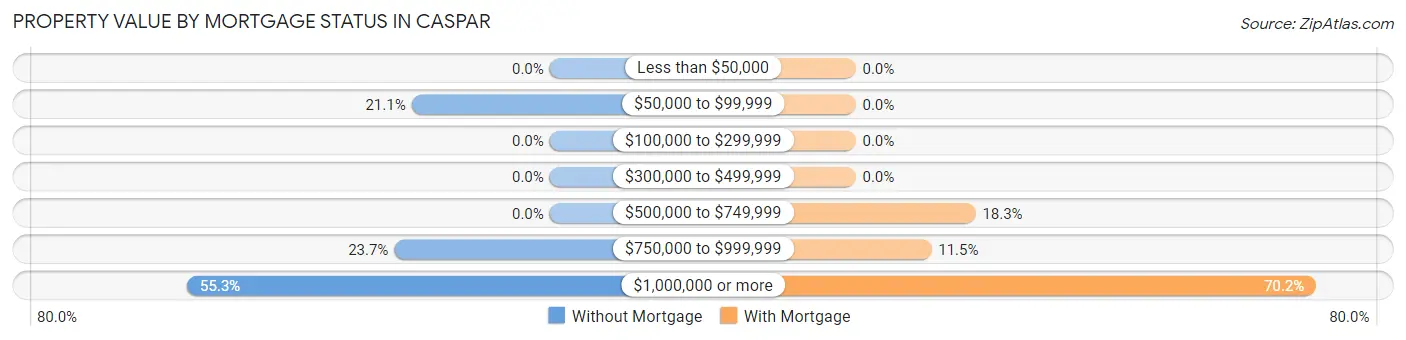
| Property Value | Without Mortgage | With Mortgage |
| Less than $50,000 | 0 (0.0%) | 0 (0.0%) |
| $50,000 to $99,999 | 8 (21.0%) | 0 (0.0%) |
| $100,000 to $299,999 | 0 (0.0%) | 0 (0.0%) |
| $300,000 to $499,999 | 0 (0.0%) | 0 (0.0%) |
| $500,000 to $749,999 | 0 (0.0%) | 19 (18.3%) |
| $750,000 to $999,999 | 9 (23.7%) | 12 (11.5%) |
| $1,000,000 or more | 21 (55.3%) | 73 (70.2%) |
| Total | 38 (100.0%) | 104 (100.0%) |
Household Income by Mortgage Status in Caspar
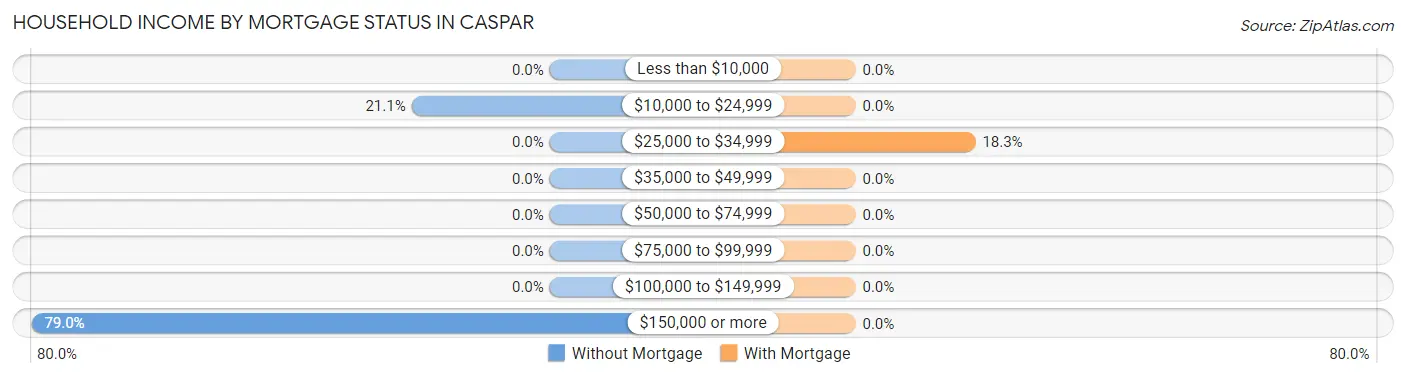
| Household Income | Without Mortgage | With Mortgage |
| Less than $10,000 | 0 (0.0%) | 0 (0.0%) |
| $10,000 to $24,999 | 8 (21.0%) | 0 (0.0%) |
| $25,000 to $34,999 | 0 (0.0%) | 19 (18.3%) |
| $35,000 to $49,999 | 0 (0.0%) | 0 (0.0%) |
| $50,000 to $74,999 | 0 (0.0%) | 0 (0.0%) |
| $75,000 to $99,999 | 0 (0.0%) | 0 (0.0%) |
| $100,000 to $149,999 | 0 (0.0%) | 0 (0.0%) |
| $150,000 or more | 30 (78.9%) | 0 (0.0%) |
| Total | 38 (100.0%) | 104 (100.0%) |
Property Value to Household Income Ratio in Caspar
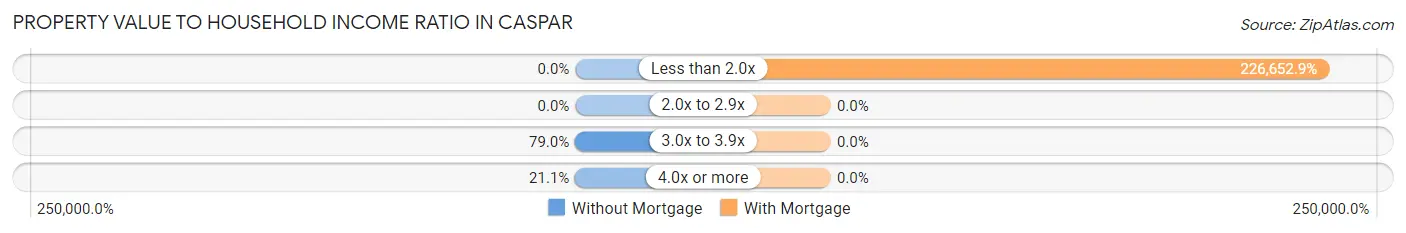
| Value-to-Income Ratio | Without Mortgage | With Mortgage |
| Less than 2.0x | 0 (0.0%) | 235,719 (226,652.9%) |
| 2.0x to 2.9x | 0 (0.0%) | 0 (0.0%) |
| 3.0x to 3.9x | 30 (78.9%) | 0 (0.0%) |
| 4.0x or more | 8 (21.0%) | 0 (0.0%) |
| Total | 38 (100.0%) | 104 (100.0%) |
Real Estate Taxes by Mortgage Status in Caspar
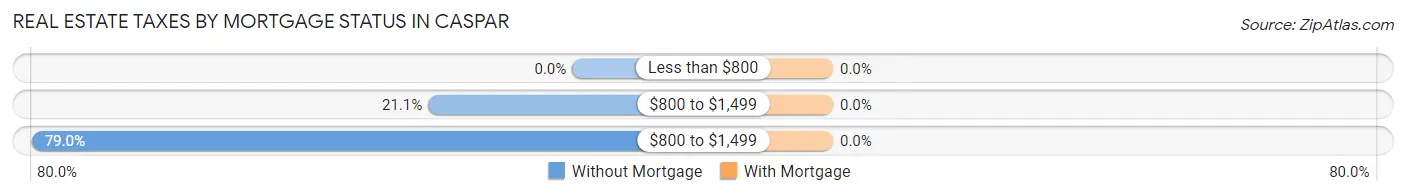
| Property Taxes | Without Mortgage | With Mortgage |
| Less than $800 | 0 (0.0%) | 0 (0.0%) |
| $800 to $1,499 | 8 (21.0%) | 0 (0.0%) |
| $800 to $1,499 | 30 (78.9%) | 0 (0.0%) |
| Total | 38 (100.0%) | 104 (100.0%) |
Health & Disability in Caspar
Health Insurance Coverage by Age in Caspar
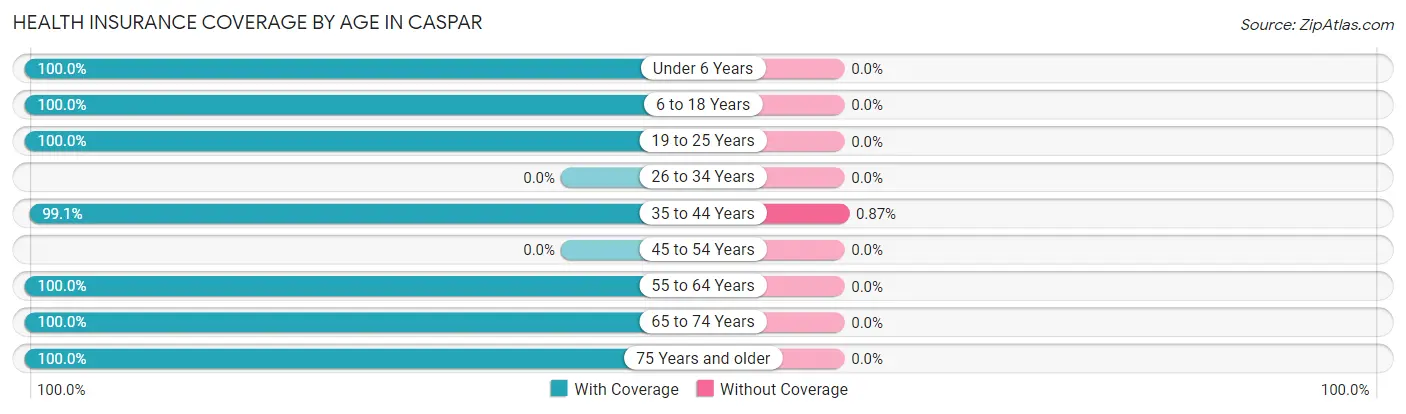
| Age Bracket | With Coverage | Without Coverage |
| Under 6 Years | 99 (100.0%) | 0 (0.0%) |
| 6 to 18 Years | 1 (100.0%) | 0 (0.0%) |
| 19 to 25 Years | 3 (100.0%) | 0 (0.0%) |
| 26 to 34 Years | 0 (0.0%) | 0 (0.0%) |
| 35 to 44 Years | 114 (99.1%) | 1 (0.9%) |
| 45 to 54 Years | 0 (0.0%) | 0 (0.0%) |
| 55 to 64 Years | 21 (100.0%) | 0 (0.0%) |
| 65 to 74 Years | 85 (100.0%) | 0 (0.0%) |
| 75 Years and older | 36 (100.0%) | 0 (0.0%) |
| Total | 359 (99.7%) | 1 (0.3%) |
Health Insurance Coverage by Citizenship Status in Caspar

| Citizenship Status | With Coverage | Without Coverage |
| Native Born | 99 (100.0%) | 0 (0.0%) |
| Foreign Born, Citizen | 1 (100.0%) | 0 (0.0%) |
| Foreign Born, not a Citizen | 3 (100.0%) | 0 (0.0%) |
Health Insurance Coverage by Household Income in Caspar
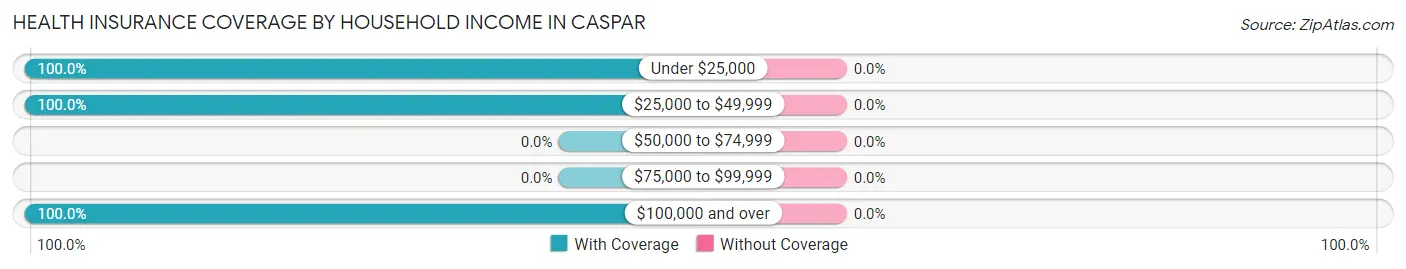
| Household Income | With Coverage | Without Coverage |
| Under $25,000 | 34 (100.0%) | 0 (0.0%) |
| $25,000 to $49,999 | 21 (100.0%) | 0 (0.0%) |
| $50,000 to $74,999 | 0 (0.0%) | 0 (0.0%) |
| $75,000 to $99,999 | 0 (0.0%) | 0 (0.0%) |
| $100,000 and over | 300 (100.0%) | 0 (0.0%) |
Public vs Private Health Insurance Coverage by Age in Caspar
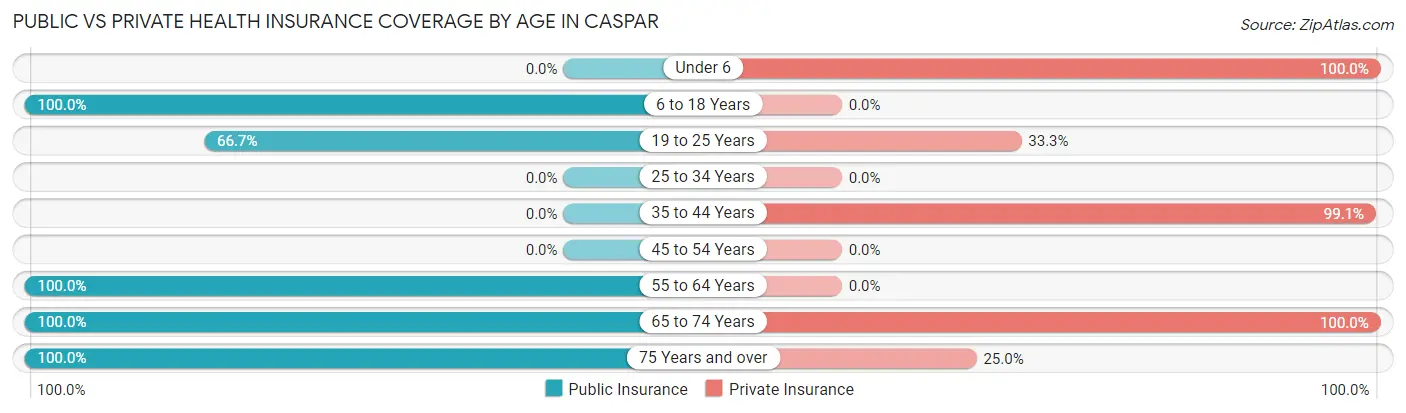
| Age Bracket | Public Insurance | Private Insurance |
| Under 6 | 0 (0.0%) | 99 (100.0%) |
| 6 to 18 Years | 1 (100.0%) | 0 (0.0%) |
| 19 to 25 Years | 2 (66.7%) | 1 (33.3%) |
| 25 to 34 Years | 0 (0.0%) | 0 (0.0%) |
| 35 to 44 Years | 0 (0.0%) | 114 (99.1%) |
| 45 to 54 Years | 0 (0.0%) | 0 (0.0%) |
| 55 to 64 Years | 21 (100.0%) | 0 (0.0%) |
| 65 to 74 Years | 85 (100.0%) | 85 (100.0%) |
| 75 Years and over | 36 (100.0%) | 9 (25.0%) |
| Total | 145 (40.3%) | 308 (85.6%) |
Disability Status by Sex by Age in Caspar
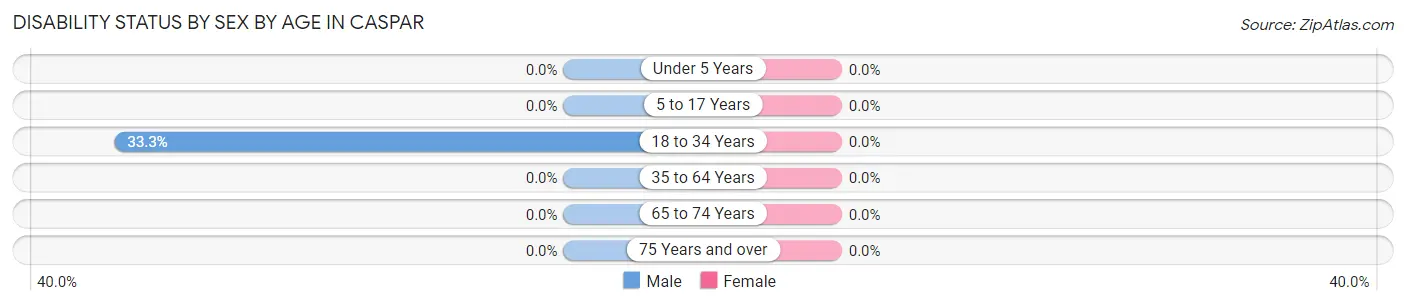
| Age Bracket | Male | Female |
| Under 5 Years | 0 (0.0%) | 0 (0.0%) |
| 5 to 17 Years | 0 (0.0%) | 0 (0.0%) |
| 18 to 34 Years | 1 (33.3%) | 0 (0.0%) |
| 35 to 64 Years | 0 (0.0%) | 0 (0.0%) |
| 65 to 74 Years | 0 (0.0%) | 0 (0.0%) |
| 75 Years and over | 0 (0.0%) | 0 (0.0%) |
Disability Class by Sex by Age in Caspar
Disability Class: Hearing Difficulty
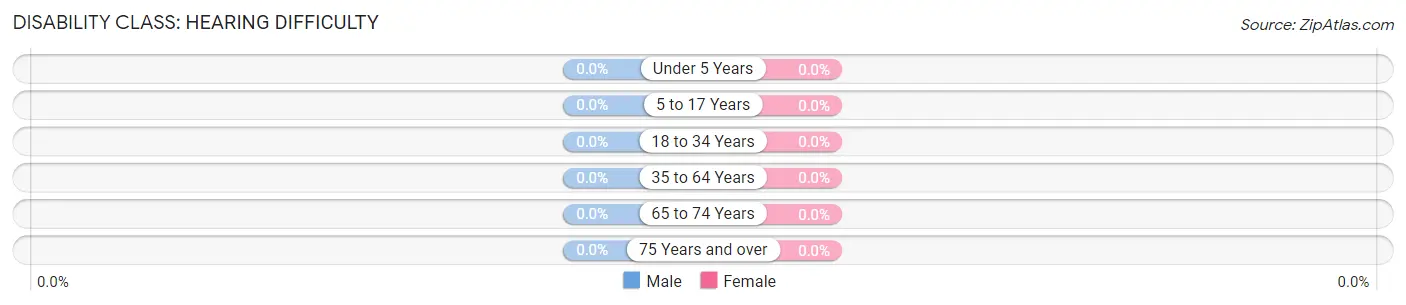
| Age Bracket | Male | Female |
| Under 5 Years | 0 (0.0%) | 0 (0.0%) |
| 5 to 17 Years | 0 (0.0%) | 0 (0.0%) |
| 18 to 34 Years | 0 (0.0%) | 0 (0.0%) |
| 35 to 64 Years | 0 (0.0%) | 0 (0.0%) |
| 65 to 74 Years | 0 (0.0%) | 0 (0.0%) |
| 75 Years and over | 0 (0.0%) | 0 (0.0%) |
Disability Class: Vision Difficulty
| Age Bracket | Male | Female |
| Under 5 Years | 0 (0.0%) | 0 (0.0%) |
| 5 to 17 Years | 0 (0.0%) | 0 (0.0%) |
| 18 to 34 Years | 0 (0.0%) | 0 (0.0%) |
| 35 to 64 Years | 0 (0.0%) | 0 (0.0%) |
| 65 to 74 Years | 0 (0.0%) | 0 (0.0%) |
| 75 Years and over | 0 (0.0%) | 0 (0.0%) |
Disability Class: Cognitive Difficulty
| Age Bracket | Male | Female |
| 5 to 17 Years | 0 (0.0%) | 0 (0.0%) |
| 18 to 34 Years | 1 (33.3%) | 0 (0.0%) |
| 35 to 64 Years | 0 (0.0%) | 0 (0.0%) |
| 65 to 74 Years | 0 (0.0%) | 0 (0.0%) |
| 75 Years and over | 0 (0.0%) | 0 (0.0%) |
Disability Class: Ambulatory Difficulty
| Age Bracket | Male | Female |
| 5 to 17 Years | 0 (0.0%) | 0 (0.0%) |
| 18 to 34 Years | 0 (0.0%) | 0 (0.0%) |
| 35 to 64 Years | 0 (0.0%) | 0 (0.0%) |
| 65 to 74 Years | 0 (0.0%) | 0 (0.0%) |
| 75 Years and over | 0 (0.0%) | 0 (0.0%) |
Disability Class: Self-Care Difficulty
| Age Bracket | Male | Female |
| 5 to 17 Years | 0 (0.0%) | 0 (0.0%) |
| 18 to 34 Years | 0 (0.0%) | 0 (0.0%) |
| 35 to 64 Years | 0 (0.0%) | 0 (0.0%) |
| 65 to 74 Years | 0 (0.0%) | 0 (0.0%) |
| 75 Years and over | 0 (0.0%) | 0 (0.0%) |
Technology Access in Caspar
Computing Device Access in Caspar
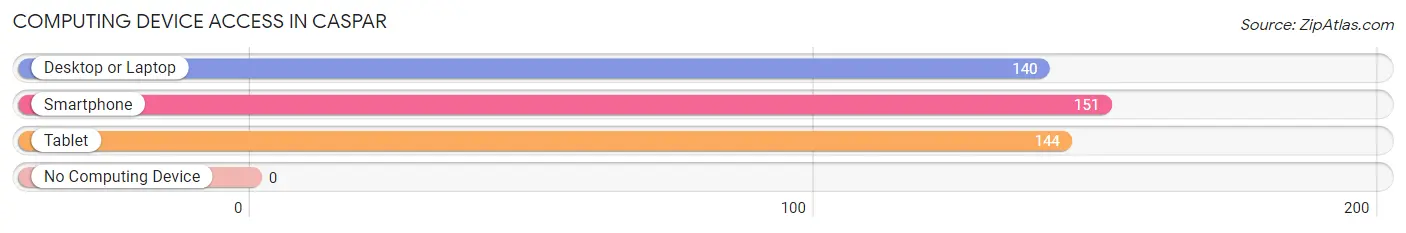
| Device Type | # Households | % Households |
| Desktop or Laptop | 140 | 88.0% |
| Smartphone | 151 | 95.0% |
| Tablet | 144 | 90.6% |
| No Computing Device | 0 | 0.0% |
| Total | 159 | 100.0% |
Internet Access in Caspar
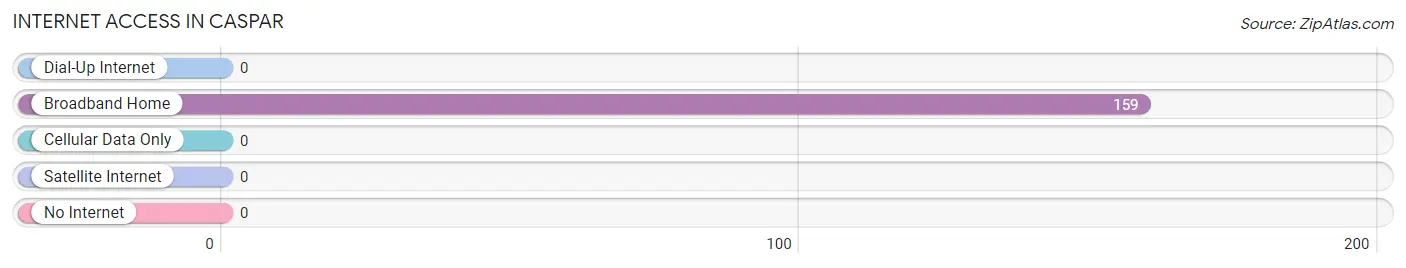
| Internet Type | # Households | % Households |
| Dial-Up Internet | 0 | 0.0% |
| Broadband Home | 159 | 100.0% |
| Cellular Data Only | 0 | 0.0% |
| Satellite Internet | 0 | 0.0% |
| No Internet | 0 | 0.0% |
| Total | 159 | 100.0% |
Caspar Summary
Caspar is a small unincorporated community located in Mendocino County, California. It is situated on the Pacific Coast, approximately 10 miles south of Fort Bragg and about two hours north of San Francisco. The population of Caspar was estimated to be around 200 people in 2000.
History
The area now known as Caspar was originally inhabited by the Pomo people, who lived in the area for thousands of years before the arrival of Europeans. The first Europeans to settle in the area were Russian fur traders, who established a trading post in the area in 1812. The area was later settled by American settlers in the 1850s, who established a lumber mill and a wharf. The town was named after Caspar Wistar, a Philadelphia Quaker who owned the land.
In the late 19th century, Caspar became a popular tourist destination, with visitors coming to enjoy the area’s natural beauty and to take advantage of the nearby lumber mill. The town was also home to a number of artists, including the renowned photographer Edward Weston, who lived in Caspar for a time.
Geography
Caspar is located on the Pacific Coast, approximately 10 miles south of Fort Bragg and about two hours north of San Francisco. The town is situated on a small peninsula, surrounded by the Pacific Ocean to the west and Caspar Creek to the east. The area is characterized by rugged coastline, with rocky cliffs and sandy beaches. The town is also home to a number of small coves and inlets, which provide shelter for boats and other watercraft.
Economy
The economy of Caspar is largely based on tourism, with visitors coming to enjoy the area’s natural beauty and to take advantage of the nearby lumber mill. The town is also home to a number of small businesses, including restaurants, galleries, and shops. In addition, the town is home to a number of artists, who often display their work in local galleries.
Demographics
As of the 2000 census, the population of Caspar was estimated to be around 200 people. The racial makeup of the town was 94.5% White, 0.5% African American, 0.5% Native American, 0.5% Asian, 0.5% Pacific Islander, and 3.5% from other races. The median household income was $37,500, and the median family income was $41,250. The per capita income was $20,000.
Common Questions
What is Per Capita Income in Caspar?
Per Capita income in Caspar is $94,817.
What is the Median Family Income in Caspar?
Median Family Income in Caspar is $236,387.
What is the Median Household income in Caspar?
Median Household Income in Caspar is $235,805.
What is Income or Wage Gap in Caspar?
Income or Wage Gap in Caspar is 46.1%.
Women in Caspar earn 53.9 cents for every dollar earned by a man.
What is Inequality or Gini Index in Caspar?
Inequality or Gini Index in Caspar is 0.42.
What is the Total Population of Caspar?
Total Population of Caspar is 360.
What is the Total Male Population of Caspar?
Total Male Population of Caspar is 135.
What is the Total Female Population of Caspar?
Total Female Population of Caspar is 225.
What is the Ratio of Males per 100 Females in Caspar?
There are 60.00 Males per 100 Females in Caspar.
What is the Ratio of Females per 100 Males in Caspar?
There are 166.67 Females per 100 Males in Caspar.
What is the Median Population Age in Caspar?
Median Population Age in Caspar is 42.1 Years.
What is the Average Family Size in Caspar
Average Family Size in Caspar is 2.6 People.
What is the Average Household Size in Caspar
Average Household Size in Caspar is 2.2 People.
How Large is the Labor Force in Caspar?
There are 162 People in the Labor Forcein in Caspar.
What is the Percentage of People in the Labor Force in Caspar?
62.3% of People are in the Labor Force in Caspar.