Calimesa, CA Map & Demographics
Calimesa Map
Calimesa Overview
$34,901
PER CAPITA INCOME
$92,306
AVG FAMILY INCOME
$74,236
AVG HOUSEHOLD INCOME
17.7%
WAGE / INCOME GAP [ % ]
82.3¢/ $1
WAGE / INCOME GAP [ $ ]
0.41
INEQUALITY / GINI INDEX
10,366
TOTAL POPULATION
5,147
MALE POPULATION
5,219
FEMALE POPULATION
98.62
MALES / 100 FEMALES
101.40
FEMALES / 100 MALES
44.0
MEDIAN AGE
3.3
AVG FAMILY SIZE
2.7
AVG HOUSEHOLD SIZE
4,587
LABOR FORCE [ PEOPLE ]
54.3%
PERCENT IN LABOR FORCE
2.3%
UNEMPLOYMENT RATE
Calimesa Zip Codes
Calimesa Area Codes
Income in Calimesa
Income Overview in Calimesa
Per Capita Income in Calimesa is $34,901, while median incomes of families and households are $92,306 and $74,236 respectively.
| Characteristic | Number | Measure |
| Per Capita Income | 10,366 | $34,901 |
| Median Family Income | 2,707 | $92,306 |
| Mean Family Income | 2,707 | $110,938 |
| Median Household Income | 3,767 | $74,236 |
| Mean Household Income | 3,767 | $93,432 |
| Income Deficit | 2,707 | $0 |
| Wage / Income Gap (%) | 10,366 | 17.65% |
| Wage / Income Gap ($) | 10,366 | 82.35¢ per $1 |
| Gini / Inequality Index | 10,366 | 0.41 |
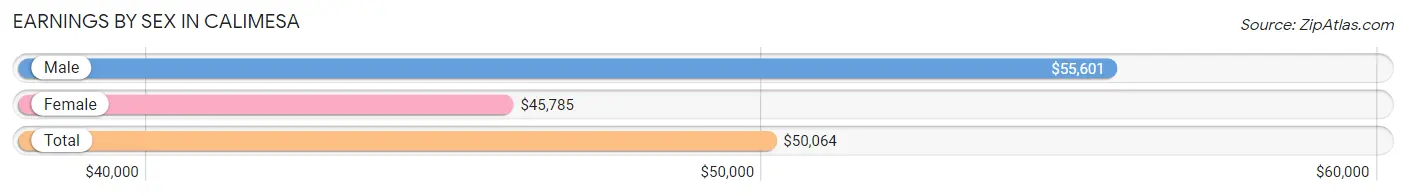
Earnings by Sex in Calimesa
Average Earnings in Calimesa are $50,064, $55,601 for men and $45,785 for women, a difference of 17.6%.
| Sex | Number | Average Earnings |
| Male | 2,482 (53.3%) | $55,601 |
| Female | 2,174 (46.7%) | $45,785 |
| Total | 4,656 (100.0%) | $50,064 |
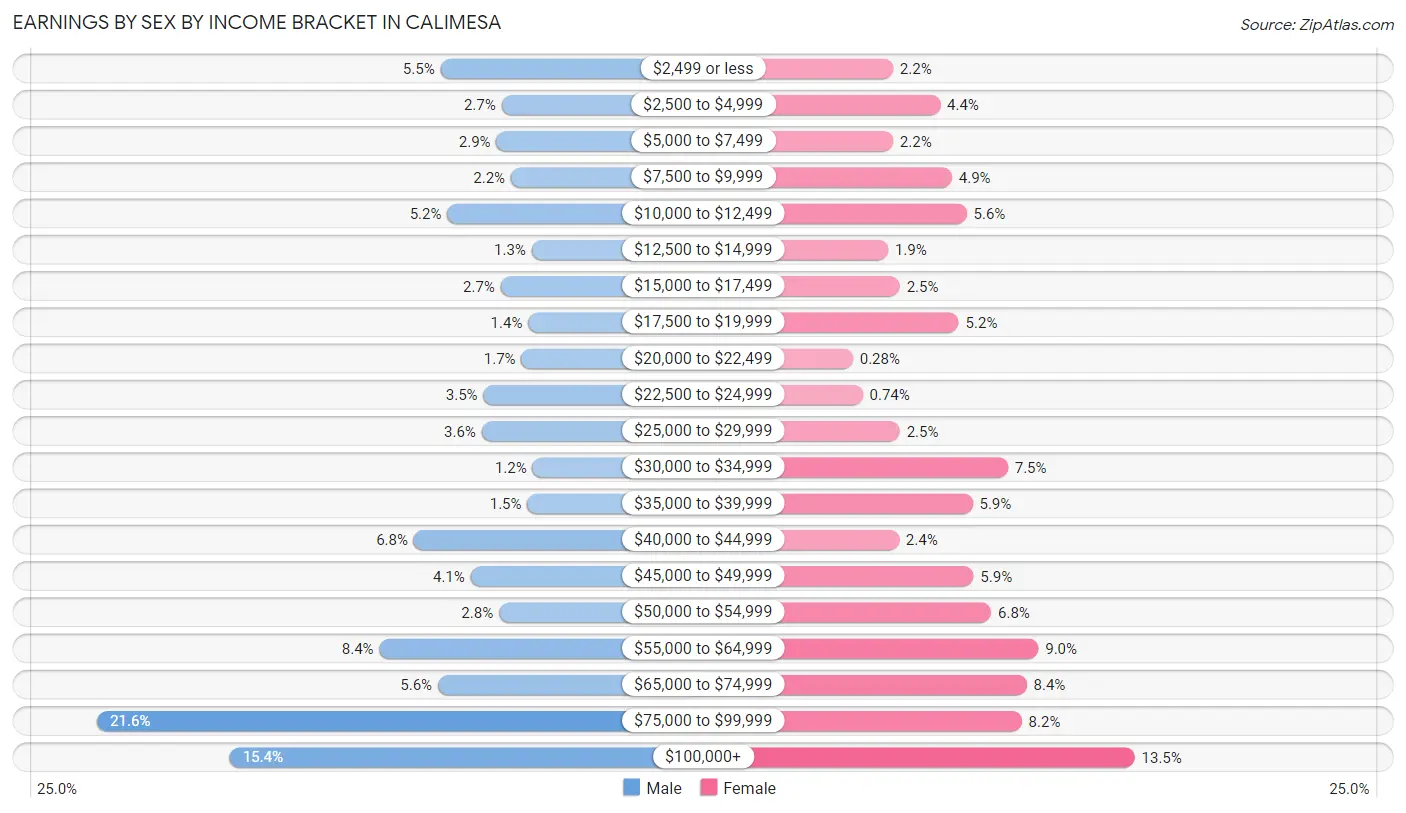
Earnings by Sex by Income Bracket in Calimesa
The most common earnings brackets in Calimesa are $75,000 to $99,999 for men (536 | 21.6%) and $100,000+ for women (293 | 13.5%).
| Income | Male | Female |
| $2,499 or less | 137 (5.5%) | 47 (2.2%) |
| $2,500 to $4,999 | 66 (2.7%) | 95 (4.4%) |
| $5,000 to $7,499 | 72 (2.9%) | 47 (2.2%) |
| $7,500 to $9,999 | 55 (2.2%) | 107 (4.9%) |
| $10,000 to $12,499 | 129 (5.2%) | 122 (5.6%) |
| $12,500 to $14,999 | 31 (1.3%) | 42 (1.9%) |
| $15,000 to $17,499 | 67 (2.7%) | 54 (2.5%) |
| $17,500 to $19,999 | 35 (1.4%) | 114 (5.2%) |
| $20,000 to $22,499 | 43 (1.7%) | 6 (0.3%) |
| $22,500 to $24,999 | 87 (3.5%) | 16 (0.7%) |
| $25,000 to $29,999 | 89 (3.6%) | 54 (2.5%) |
| $30,000 to $34,999 | 30 (1.2%) | 164 (7.5%) |
| $35,000 to $39,999 | 36 (1.5%) | 128 (5.9%) |
| $40,000 to $44,999 | 168 (6.8%) | 53 (2.4%) |
| $45,000 to $49,999 | 102 (4.1%) | 129 (5.9%) |
| $50,000 to $54,999 | 69 (2.8%) | 147 (6.8%) |
| $55,000 to $64,999 | 208 (8.4%) | 195 (9.0%) |
| $65,000 to $74,999 | 140 (5.6%) | 183 (8.4%) |
| $75,000 to $99,999 | 536 (21.6%) | 178 (8.2%) |
| $100,000+ | 382 (15.4%) | 293 (13.5%) |
| Total | 2,482 (100.0%) | 2,174 (100.0%) |
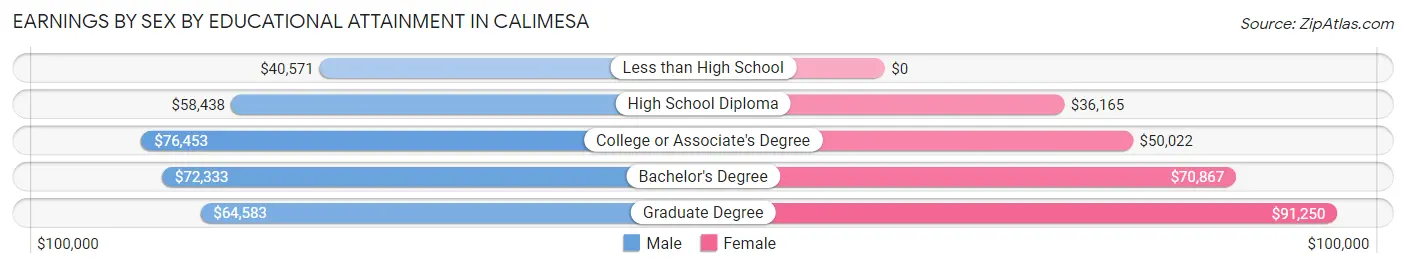
Earnings by Sex by Educational Attainment in Calimesa
Average earnings in Calimesa are $62,151 for men and $51,452 for women, a difference of 17.2%. Men with an educational attainment of college or associate's degree enjoy the highest average annual earnings of $76,453, while those with less than high school education earn the least with $40,571. Women with an educational attainment of graduate degree earn the most with the average annual earnings of $91,250, while those with high school diploma education have the smallest earnings of $36,165.
| Educational Attainment | Male Income | Female Income |
| Less than High School | $40,571 | $0 |
| High School Diploma | $58,438 | $36,165 |
| College or Associate's Degree | $76,453 | $50,022 |
| Bachelor's Degree | $72,333 | $70,867 |
| Graduate Degree | $64,583 | $91,250 |
| Total | $62,151 | $51,452 |
Family Income in Calimesa
Family Income Brackets in Calimesa
According to the Calimesa family income data, there are 633 families falling into the $50,000 to $74,999 income range, which is the most common income bracket and makes up 23.4% of all families.
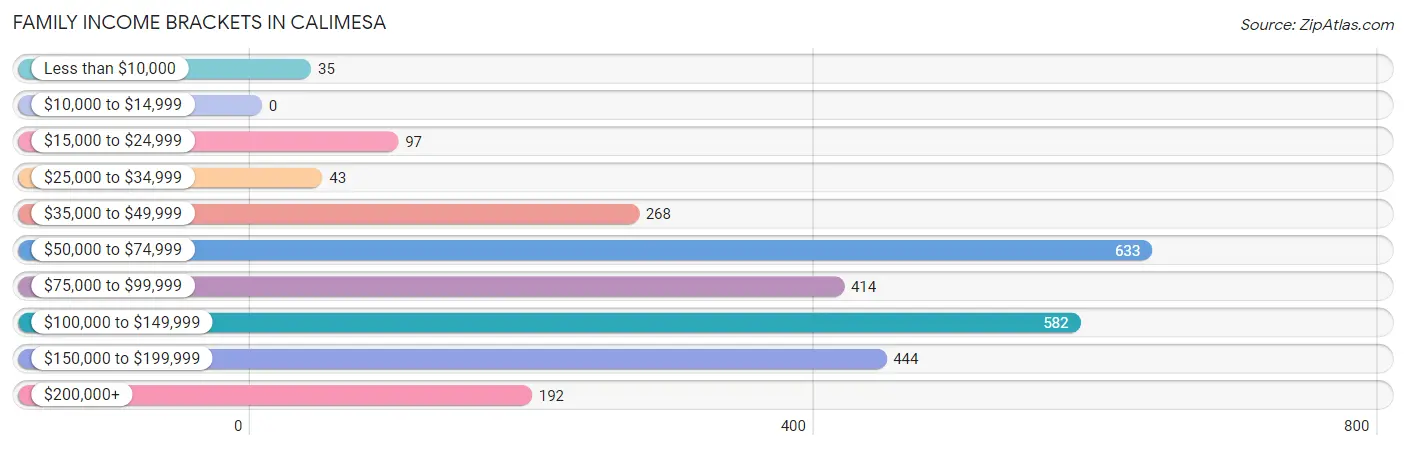
| Income Bracket | # Families | % Families |
| Less than $10,000 | 35 | 1.3% |
| $10,000 to $14,999 | 0 | 0.0% |
| $15,000 to $24,999 | 97 | 3.6% |
| $25,000 to $34,999 | 43 | 1.6% |
| $35,000 to $49,999 | 268 | 9.9% |
| $50,000 to $74,999 | 633 | 23.4% |
| $75,000 to $99,999 | 414 | 15.3% |
| $100,000 to $149,999 | 582 | 21.5% |
| $150,000 to $199,999 | 444 | 16.4% |
| $200,000+ | 192 | 7.1% |
Family Income by Famaliy Size in Calimesa
4-person families (347 | 12.8%) account for the highest median family income in Calimesa with $151,012 per family, while 4-person families (347 | 12.8%) have the highest median income of $37,753 per family member.
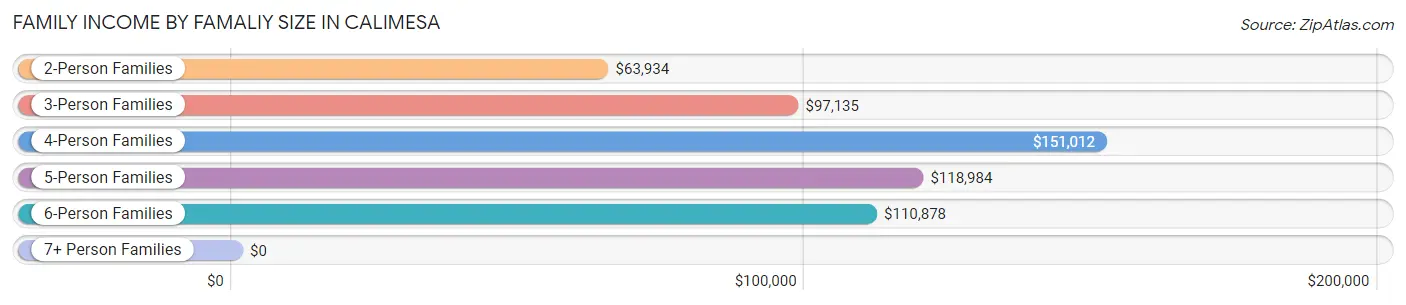
| Income Bracket | # Families | Median Income |
| 2-Person Families | 1,205 (44.5%) | $63,934 |
| 3-Person Families | 606 (22.4%) | $97,135 |
| 4-Person Families | 347 (12.8%) | $151,012 |
| 5-Person Families | 390 (14.4%) | $118,984 |
| 6-Person Families | 140 (5.2%) | $110,878 |
| 7+ Person Families | 19 (0.7%) | $0 |
| Total | 2,707 (100.0%) | $92,306 |
Family Income by Number of Earners in Calimesa
The median family income in Calimesa is $92,306, with families comprising 3+ earners (378) having the highest median family income of $154,263, while families with no earners (608) have the lowest median family income of $52,054, accounting for 14.0% and 22.5% of families, respectively.
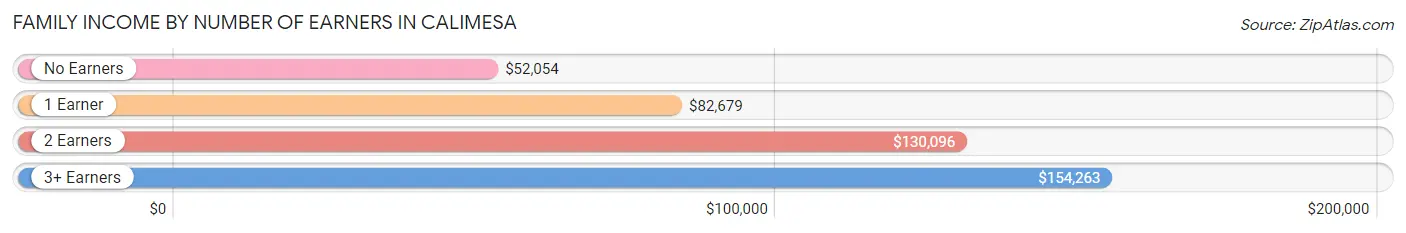
| Number of Earners | # Families | Median Income |
| No Earners | 608 (22.5%) | $52,054 |
| 1 Earner | 776 (28.7%) | $82,679 |
| 2 Earners | 945 (34.9%) | $130,096 |
| 3+ Earners | 378 (14.0%) | $154,263 |
| Total | 2,707 (100.0%) | $92,306 |
Household Income in Calimesa
Household Income Brackets in Calimesa
With 750 households falling in the category, the $50,000 to $74,999 income range is the most frequent in Calimesa, accounting for 19.9% of all households. In contrast, only 90 households (2.4%) fall into the $10,000 to $14,999 income bracket, making it the least populous group.
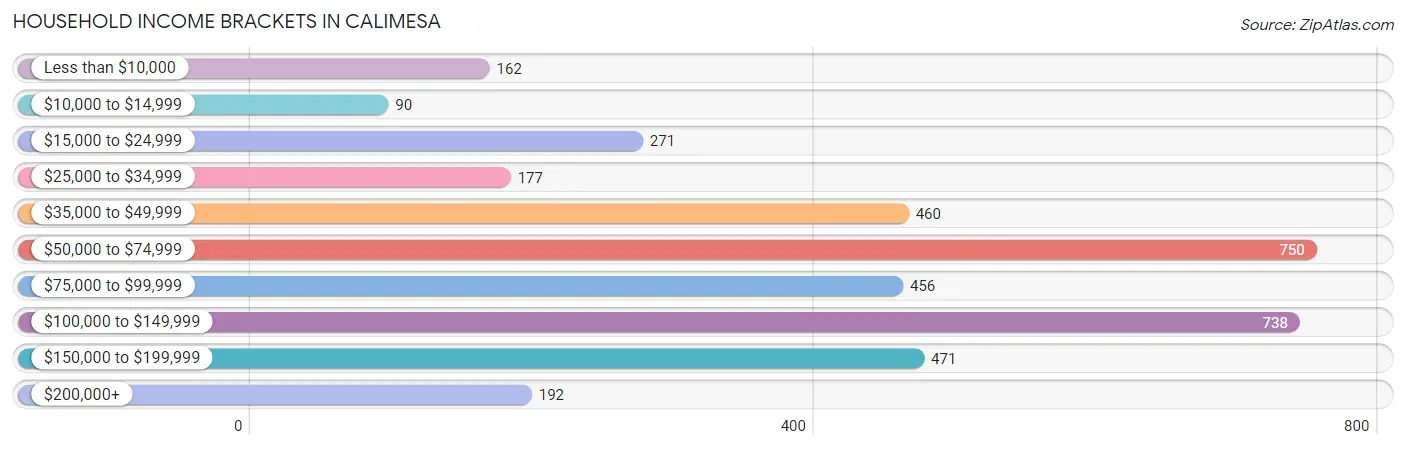
| Income Bracket | # Households | % Households |
| Less than $10,000 | 162 | 4.3% |
| $10,000 to $14,999 | 90 | 2.4% |
| $15,000 to $24,999 | 271 | 7.2% |
| $25,000 to $34,999 | 177 | 4.7% |
| $35,000 to $49,999 | 460 | 12.2% |
| $50,000 to $74,999 | 750 | 19.9% |
| $75,000 to $99,999 | 456 | 12.1% |
| $100,000 to $149,999 | 738 | 19.6% |
| $150,000 to $199,999 | 471 | 12.5% |
| $200,000+ | 192 | 5.1% |
Household Income by Householder Age in Calimesa
The median household income in Calimesa is $74,236, with the highest median household income of $105,120 found in the 45 to 64 years age bracket for the primary householder. A total of 1,247 households (33.1%) fall into this category. Meanwhile, the 15 to 24 years age bracket for the primary householder has the lowest median household income of $0, with 10 households (0.3%) in this group.
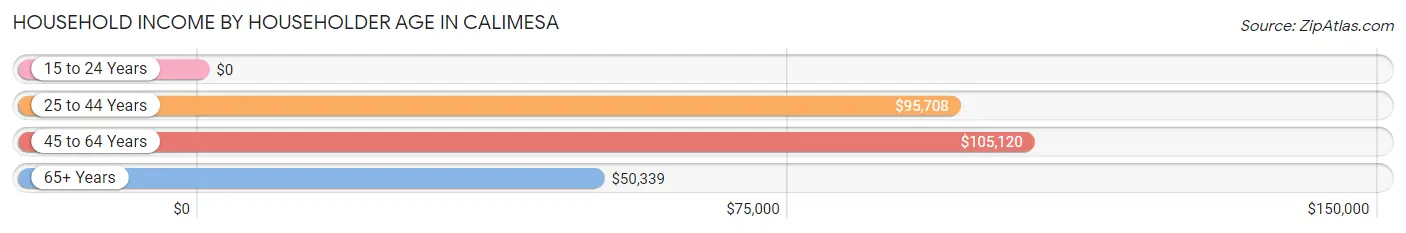
| Income Bracket | # Households | Median Income |
| 15 to 24 Years | 10 (0.3%) | $0 |
| 25 to 44 Years | 1,016 (27.0%) | $95,708 |
| 45 to 64 Years | 1,247 (33.1%) | $105,120 |
| 65+ Years | 1,494 (39.7%) | $50,339 |
| Total | 3,767 (100.0%) | $74,236 |
Poverty in Calimesa
Income Below Poverty by Sex and Age in Calimesa
With 8.0% poverty level for males and 7.2% for females among the residents of Calimesa, 15 year old males and under 5 year old females are the most vulnerable to poverty, with 21 males (35.0%) and 46 females (24.1%) in their respective age groups living below the poverty level.
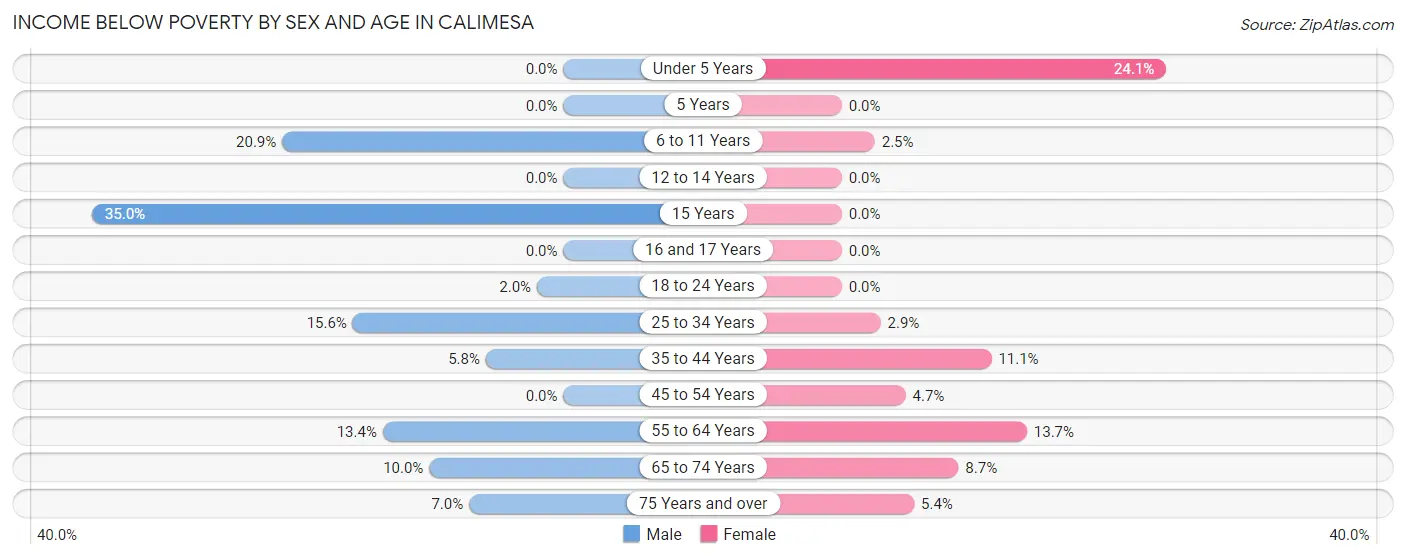
| Age Bracket | Male | Female |
| Under 5 Years | 0 (0.0%) | 46 (24.1%) |
| 5 Years | 0 (0.0%) | 0 (0.0%) |
| 6 to 11 Years | 90 (20.9%) | 9 (2.5%) |
| 12 to 14 Years | 0 (0.0%) | 0 (0.0%) |
| 15 Years | 21 (35.0%) | 0 (0.0%) |
| 16 and 17 Years | 0 (0.0%) | 0 (0.0%) |
| 18 to 24 Years | 7 (2.0%) | 0 (0.0%) |
| 25 to 34 Years | 76 (15.6%) | 15 (2.9%) |
| 35 to 44 Years | 35 (5.8%) | 76 (11.1%) |
| 45 to 54 Years | 0 (0.0%) | 26 (4.7%) |
| 55 to 64 Years | 77 (13.4%) | 107 (13.7%) |
| 65 to 74 Years | 73 (10.0%) | 56 (8.7%) |
| 75 Years and over | 29 (7.0%) | 40 (5.4%) |
| Total | 408 (8.0%) | 375 (7.2%) |
Income Above Poverty by Sex and Age in Calimesa
According to the poverty statistics in Calimesa, males aged under 5 years and females aged 12 to 14 years are the age groups that are most secure financially, with 100.0% of males and 100.0% of females in these age groups living above the poverty line.
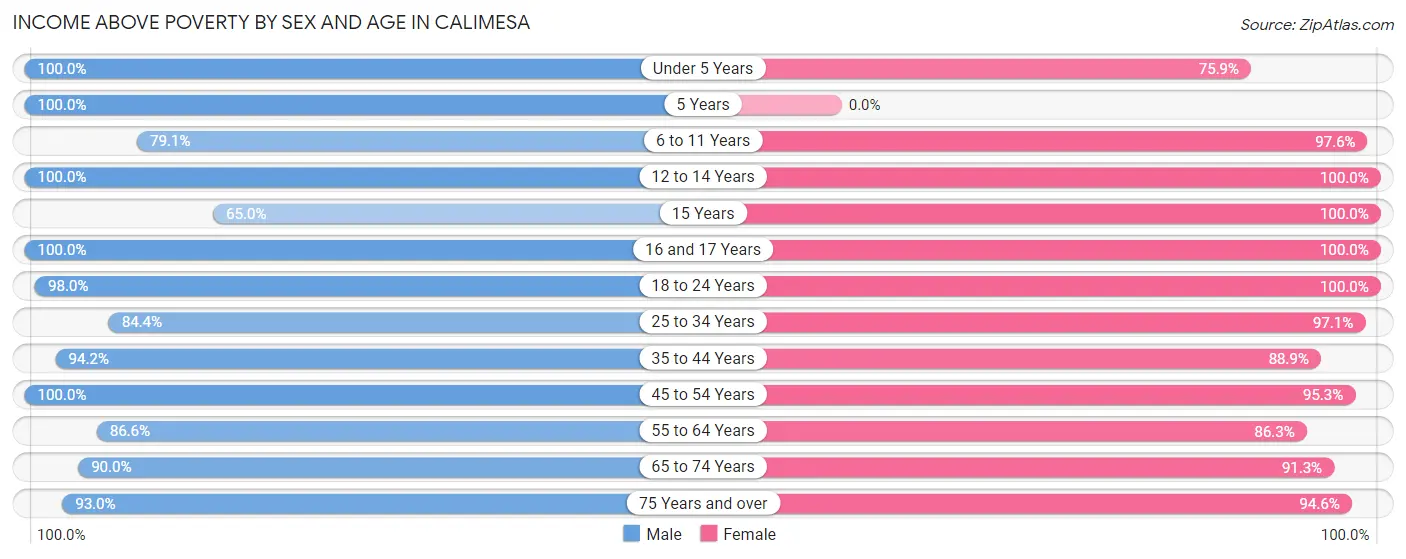
| Age Bracket | Male | Female |
| Under 5 Years | 324 (100.0%) | 145 (75.9%) |
| 5 Years | 5 (100.0%) | 0 (0.0%) |
| 6 to 11 Years | 341 (79.1%) | 359 (97.6%) |
| 12 to 14 Years | 305 (100.0%) | 194 (100.0%) |
| 15 Years | 39 (65.0%) | 10 (100.0%) |
| 16 and 17 Years | 139 (100.0%) | 190 (100.0%) |
| 18 to 24 Years | 350 (98.0%) | 327 (100.0%) |
| 25 to 34 Years | 410 (84.4%) | 505 (97.1%) |
| 35 to 44 Years | 573 (94.2%) | 608 (88.9%) |
| 45 to 54 Years | 682 (100.0%) | 523 (95.3%) |
| 55 to 64 Years | 497 (86.6%) | 672 (86.3%) |
| 65 to 74 Years | 660 (90.0%) | 591 (91.3%) |
| 75 Years and over | 385 (93.0%) | 705 (94.6%) |
| Total | 4,710 (92.0%) | 4,829 (92.8%) |
Income Below Poverty Among Married-Couple Families in Calimesa
The poverty statistics for married-couple families in Calimesa show that 1.3% or 30 of the total 2,233 families live below the poverty line. Families with no children have the highest poverty rate of 2.2%, comprising of 30 families. On the other hand, families with 1 or 2 children have the lowest poverty rate of 0.0%, which includes 0 families.
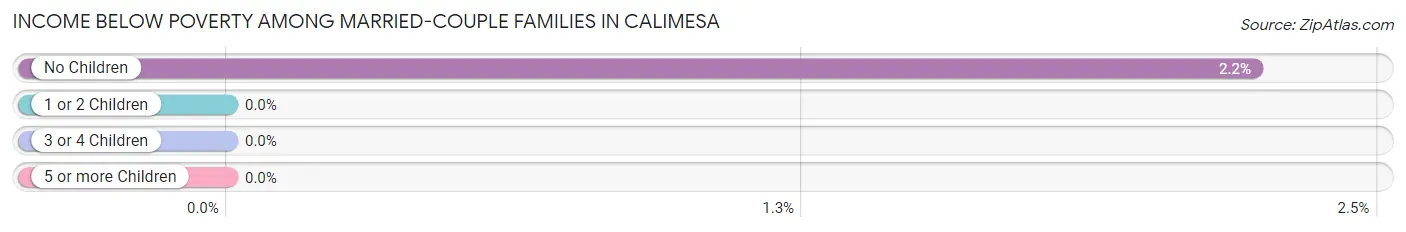
| Children | Above Poverty | Below Poverty |
| No Children | 1,317 (97.8%) | 30 (2.2%) |
| 1 or 2 Children | 662 (100.0%) | 0 (0.0%) |
| 3 or 4 Children | 224 (100.0%) | 0 (0.0%) |
| 5 or more Children | 0 (0.0%) | 0 (0.0%) |
| Total | 2,203 (98.7%) | 30 (1.3%) |
Income Below Poverty Among Single-Parent Households in Calimesa
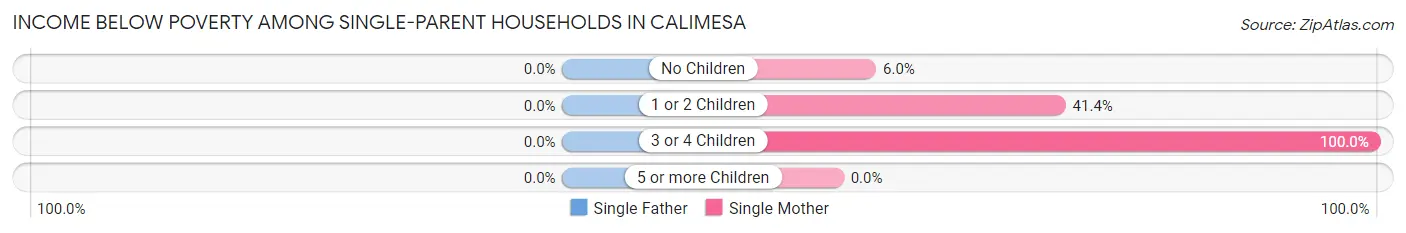
| Children | Single Father | Single Mother |
| No Children | 0 (0.0%) | 11 (6.0%) |
| 1 or 2 Children | 0 (0.0%) | 43 (41.3%) |
| 3 or 4 Children | 0 (0.0%) | 21 (100.0%) |
| 5 or more Children | 0 (0.0%) | 0 (0.0%) |
| Total | 0 (0.0%) | 75 (24.4%) |
Income Below Poverty Among Married-Couple vs Single-Parent Households in Calimesa
The poverty data for Calimesa shows that 30 of the married-couple family households (1.3%) and 75 of the single-parent households (15.8%) are living below the poverty level. Within the married-couple family households, those with no children have the highest poverty rate, with 30 households (2.2%) falling below the poverty line. Among the single-parent households, those with 3 or 4 children have the highest poverty rate, with 21 household (52.5%) living below poverty.
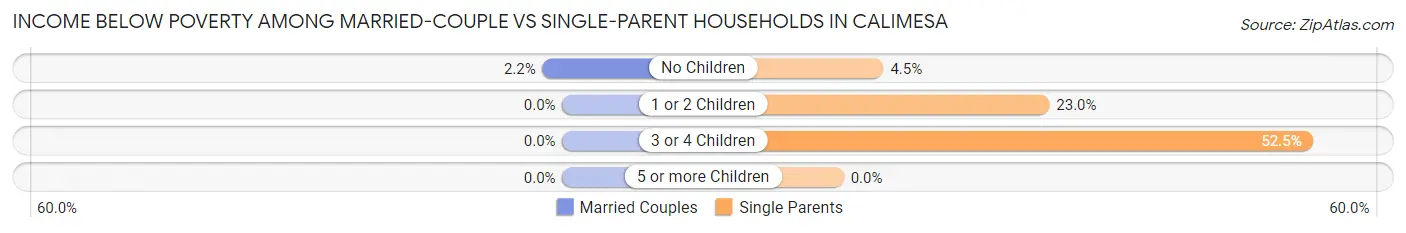
| Children | Married-Couple Families | Single-Parent Households |
| No Children | 30 (2.2%) | 11 (4.4%) |
| 1 or 2 Children | 0 (0.0%) | 43 (23.0%) |
| 3 or 4 Children | 0 (0.0%) | 21 (52.5%) |
| 5 or more Children | 0 (0.0%) | 0 (0.0%) |
| Total | 30 (1.3%) | 75 (15.8%) |
Race in Calimesa
The most populous races in Calimesa are White / Caucasian (6,978 | 67.3%), Hispanic or Latino (2,961 | 28.6%), and Some other Race (1,720 | 16.6%).
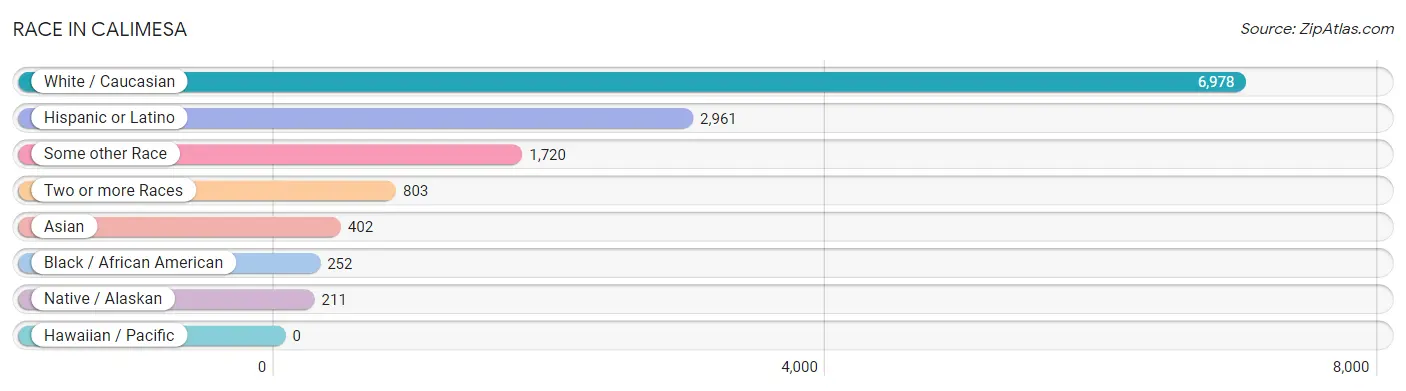
| Race | # Population | % Population |
| Asian | 402 | 3.9% |
| Black / African American | 252 | 2.4% |
| Hawaiian / Pacific | 0 | 0.0% |
| Hispanic or Latino | 2,961 | 28.6% |
| Native / Alaskan | 211 | 2.0% |
| White / Caucasian | 6,978 | 67.3% |
| Two or more Races | 803 | 7.7% |
| Some other Race | 1,720 | 16.6% |
| Total | 10,366 | 100.0% |
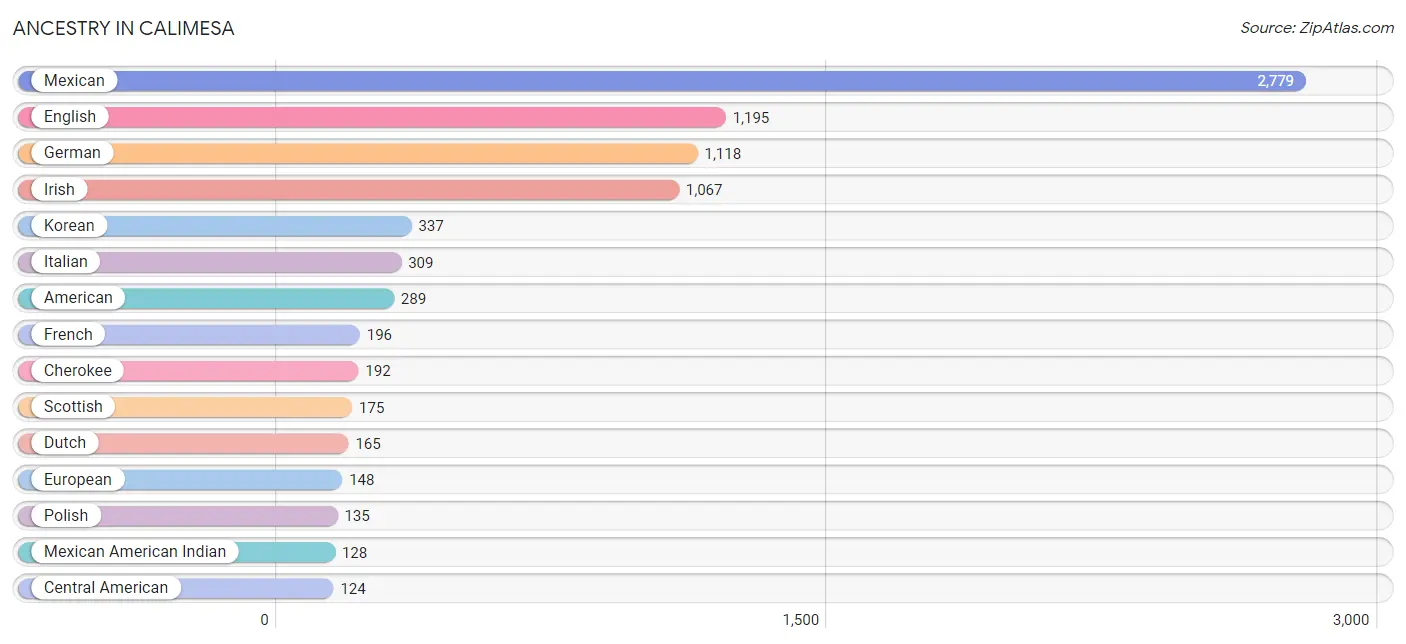
Ancestry in Calimesa
The most populous ancestries reported in Calimesa are Mexican (2,779 | 26.8%), English (1,195 | 11.5%), German (1,118 | 10.8%), Irish (1,067 | 10.3%), and Korean (337 | 3.3%), together accounting for 62.7% of all Calimesa residents.
| Ancestry | # Population | % Population |
| African | 8 | 0.1% |
| American | 289 | 2.8% |
| Arab | 48 | 0.5% |
| Basque | 19 | 0.2% |
| Belgian | 12 | 0.1% |
| Bhutanese | 15 | 0.1% |
| British | 73 | 0.7% |
| Burmese | 70 | 0.7% |
| Canadian | 11 | 0.1% |
| Central American | 124 | 1.2% |
| Central American Indian | 14 | 0.1% |
| Cherokee | 192 | 1.8% |
| Chippewa | 1 | 0.0% |
| Croatian | 22 | 0.2% |
| Cuban | 6 | 0.1% |
| Czech | 6 | 0.1% |
| Danish | 76 | 0.7% |
| Dutch | 165 | 1.6% |
| Eastern European | 5 | 0.1% |
| English | 1,195 | 11.5% |
| European | 148 | 1.4% |
| Finnish | 8 | 0.1% |
| French | 196 | 1.9% |
| French Canadian | 53 | 0.5% |
| German | 1,118 | 10.8% |
| Greek | 50 | 0.5% |
| Guatemalan | 78 | 0.7% |
| Honduran | 21 | 0.2% |
| Indian (Asian) | 9 | 0.1% |
| Irish | 1,067 | 10.3% |
| Italian | 309 | 3.0% |
| Korean | 337 | 3.3% |
| Laotian | 24 | 0.2% |
| Lebanese | 25 | 0.2% |
| Mexican | 2,779 | 26.8% |
| Mexican American Indian | 128 | 1.2% |
| Navajo | 65 | 0.6% |
| Nicaraguan | 25 | 0.2% |
| Nigerian | 46 | 0.4% |
| Northern European | 91 | 0.9% |
| Norwegian | 42 | 0.4% |
| Pima | 6 | 0.1% |
| Polish | 135 | 1.3% |
| Portuguese | 54 | 0.5% |
| Puerto Rican | 14 | 0.1% |
| Russian | 88 | 0.9% |
| Scandinavian | 5 | 0.1% |
| Scotch-Irish | 86 | 0.8% |
| Scottish | 175 | 1.7% |
| Spanish | 31 | 0.3% |
| Subsaharan African | 54 | 0.5% |
| Swedish | 51 | 0.5% |
| Swiss | 6 | 0.1% |
| Welsh | 19 | 0.2% | View All 54 Rows |
Immigrants in Calimesa
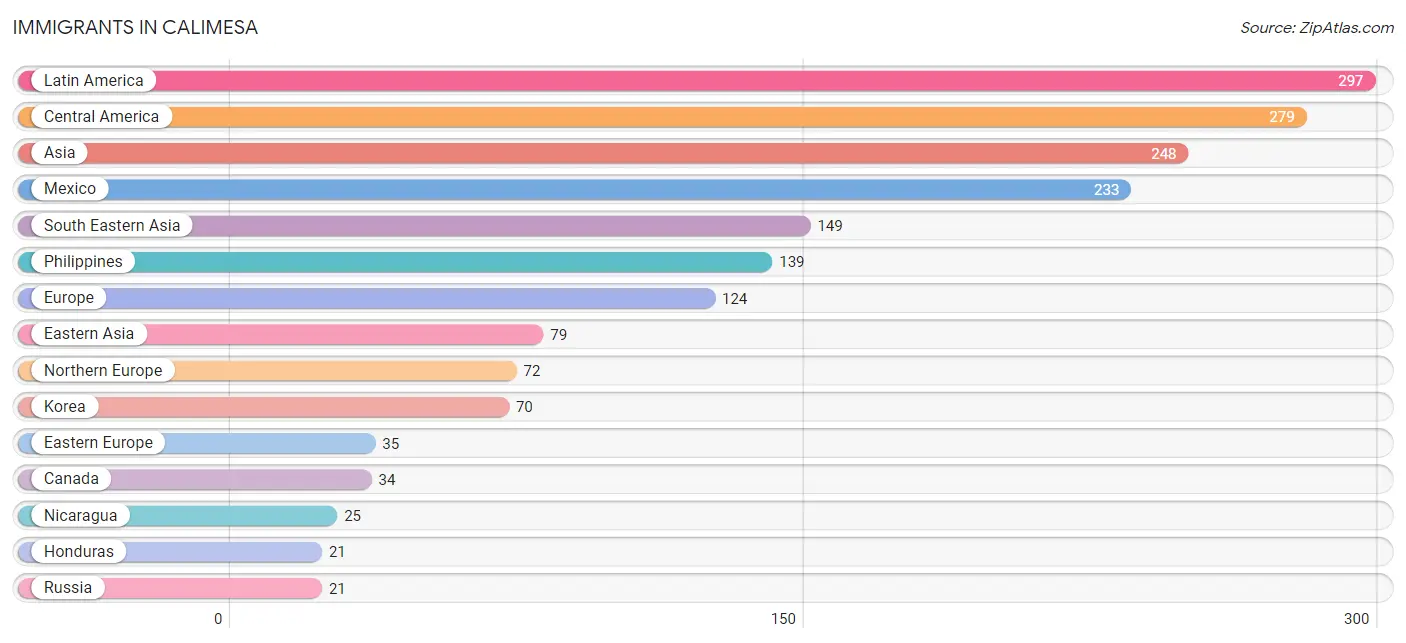
The most numerous immigrant groups reported in Calimesa came from Latin America (297 | 2.9%), Central America (279 | 2.7%), Asia (248 | 2.4%), Mexico (233 | 2.2%), and South Eastern Asia (149 | 1.4%), together accounting for 11.6% of all Calimesa residents.
| Immigration Origin | # Population | % Population |
| Argentina | 18 | 0.2% |
| Asia | 248 | 2.4% |
| Canada | 34 | 0.3% |
| Central America | 279 | 2.7% |
| China | 9 | 0.1% |
| Eastern Asia | 79 | 0.8% |
| Eastern Europe | 35 | 0.3% |
| England | 17 | 0.2% |
| Europe | 124 | 1.2% |
| France | 17 | 0.2% |
| Honduras | 21 | 0.2% |
| Indonesia | 10 | 0.1% |
| Ireland | 16 | 0.2% |
| Korea | 70 | 0.7% |
| Latin America | 297 | 2.9% |
| Lebanon | 11 | 0.1% |
| Mexico | 233 | 2.2% |
| Nepal | 9 | 0.1% |
| Nicaragua | 25 | 0.2% |
| Northern Europe | 72 | 0.7% |
| Philippines | 139 | 1.3% |
| Romania | 14 | 0.1% |
| Russia | 21 | 0.2% |
| Scotland | 19 | 0.2% |
| South America | 18 | 0.2% |
| South Central Asia | 9 | 0.1% |
| South Eastern Asia | 149 | 1.4% |
| Taiwan | 9 | 0.1% |
| Western Asia | 11 | 0.1% |
| Western Europe | 17 | 0.2% | View All 30 Rows |
Sex and Age in Calimesa
Sex and Age in Calimesa
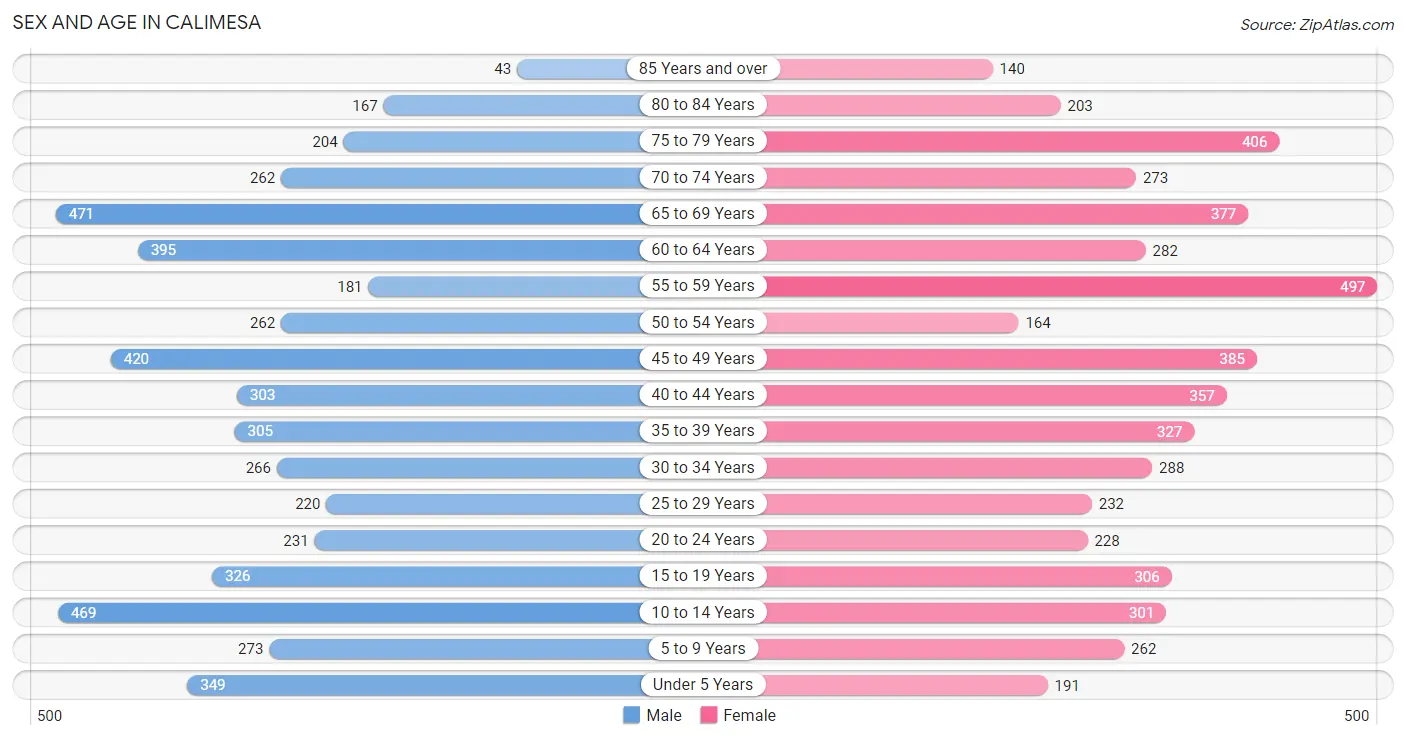
The most populous age groups in Calimesa are 65 to 69 Years (471 | 9.1%) for men and 55 to 59 Years (497 | 9.5%) for women.
| Age Bracket | Male | Female |
| Under 5 Years | 349 (6.8%) | 191 (3.7%) |
| 5 to 9 Years | 273 (5.3%) | 262 (5.0%) |
| 10 to 14 Years | 469 (9.1%) | 301 (5.8%) |
| 15 to 19 Years | 326 (6.3%) | 306 (5.9%) |
| 20 to 24 Years | 231 (4.5%) | 228 (4.4%) |
| 25 to 29 Years | 220 (4.3%) | 232 (4.4%) |
| 30 to 34 Years | 266 (5.2%) | 288 (5.5%) |
| 35 to 39 Years | 305 (5.9%) | 327 (6.3%) |
| 40 to 44 Years | 303 (5.9%) | 357 (6.8%) |
| 45 to 49 Years | 420 (8.2%) | 385 (7.4%) |
| 50 to 54 Years | 262 (5.1%) | 164 (3.1%) |
| 55 to 59 Years | 181 (3.5%) | 497 (9.5%) |
| 60 to 64 Years | 395 (7.7%) | 282 (5.4%) |
| 65 to 69 Years | 471 (9.1%) | 377 (7.2%) |
| 70 to 74 Years | 262 (5.1%) | 273 (5.2%) |
| 75 to 79 Years | 204 (4.0%) | 406 (7.8%) |
| 80 to 84 Years | 167 (3.2%) | 203 (3.9%) |
| 85 Years and over | 43 (0.8%) | 140 (2.7%) |
| Total | 5,147 (100.0%) | 5,219 (100.0%) |
Families and Households in Calimesa
Median Family Size in Calimesa
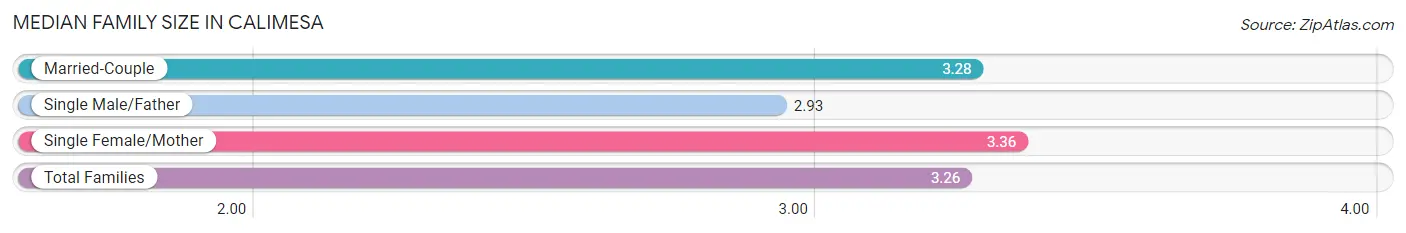
The median family size in Calimesa is 3.26 persons per family, with single female/mother families (307 | 11.3%) accounting for the largest median family size of 3.36 persons per family. On the other hand, single male/father families (167 | 6.2%) represent the smallest median family size with 2.93 persons per family.
| Family Type | # Families | Family Size |
| Married-Couple | 2,233 (82.5%) | 3.28 |
| Single Male/Father | 167 (6.2%) | 2.93 |
| Single Female/Mother | 307 (11.3%) | 3.36 |
| Total Families | 2,707 (100.0%) | 3.26 |
Median Household Size in Calimesa
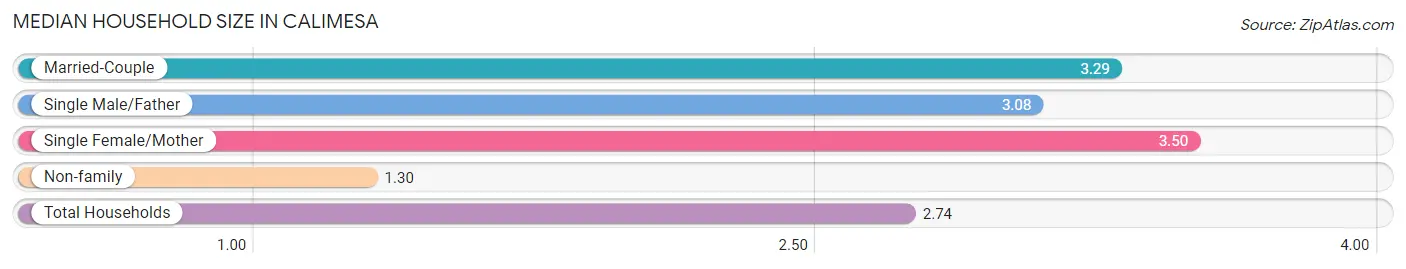
The median household size in Calimesa is 2.74 persons per household, with single female/mother households (307 | 8.2%) accounting for the largest median household size of 3.5 persons per household. non-family households (1,060 | 28.1%) represent the smallest median household size with 1.30 persons per household.
| Household Type | # Households | Household Size |
| Married-Couple | 2,233 (59.3%) | 3.29 |
| Single Male/Father | 167 (4.4%) | 3.08 |
| Single Female/Mother | 307 (8.2%) | 3.50 |
| Non-family | 1,060 (28.1%) | 1.30 |
| Total Households | 3,767 (100.0%) | 2.74 |
Household Size by Marriage Status in Calimesa
Out of a total of 3,767 households in Calimesa, 2,707 (71.9%) are family households, while 1,060 (28.1%) are nonfamily households. The most numerous type of family households are 2-person households, comprising 1,184, and the most common type of nonfamily households are 1-person households, comprising 812.
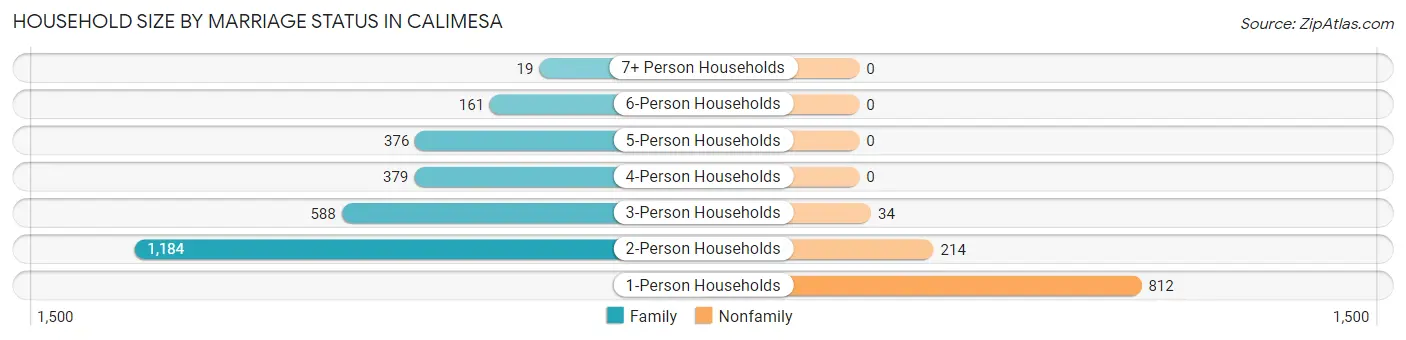
| Household Size | Family Households | Nonfamily Households |
| 1-Person Households | - | 812 (21.6%) |
| 2-Person Households | 1,184 (31.4%) | 214 (5.7%) |
| 3-Person Households | 588 (15.6%) | 34 (0.9%) |
| 4-Person Households | 379 (10.1%) | 0 (0.0%) |
| 5-Person Households | 376 (10.0%) | 0 (0.0%) |
| 6-Person Households | 161 (4.3%) | 0 (0.0%) |
| 7+ Person Households | 19 (0.5%) | 0 (0.0%) |
| Total | 2,707 (71.9%) | 1,060 (28.1%) |
Female Fertility in Calimesa
Fertility by Age in Calimesa
Average fertility rate in Calimesa is 56.0 births per 1,000 women. Women in the age bracket of 20 to 34 years have the highest fertility rate with 162.0 births per 1,000 women. Women in the age bracket of 20 to 34 years acount for 100.0% of all women with births.
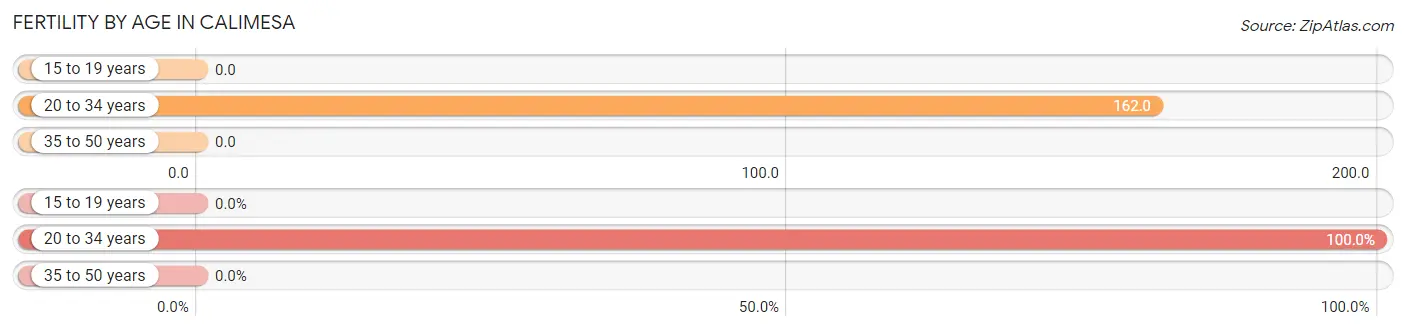
| Age Bracket | Women with Births | Births / 1,000 Women |
| 15 to 19 years | 0 (0.0%) | 0.0 |
| 20 to 34 years | 121 (100.0%) | 162.0 |
| 35 to 50 years | 0 (0.0%) | 0.0 |
| Total | 121 (100.0%) | 56.0 |
Fertility by Age by Marriage Status in Calimesa
73.6% of women with births (121) in Calimesa are married. The highest percentage of unmarried women with births falls into 20 to 34 years age bracket with 26.5% of them unmarried at the time of birth, while the lowest percentage of unmarried women with births belong to 20 to 34 years age bracket with 26.4% of them unmarried.
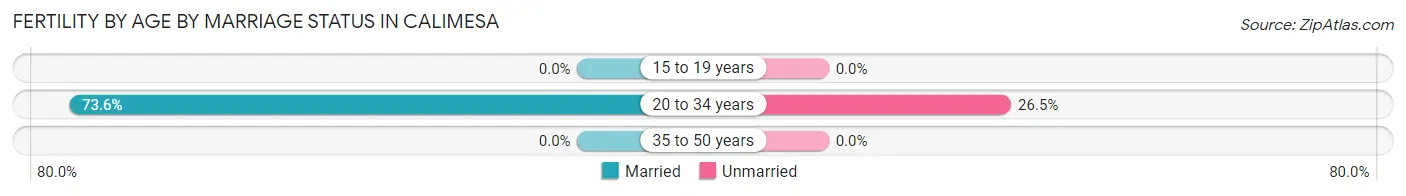
| Age Bracket | Married | Unmarried |
| 15 to 19 years | 0 (0.0%) | 0 (0.0%) |
| 20 to 34 years | 89 (73.6%) | 32 (26.5%) |
| 35 to 50 years | 0 (0.0%) | 0 (0.0%) |
| Total | 89 (73.6%) | 32 (26.5%) |
Fertility by Education in Calimesa
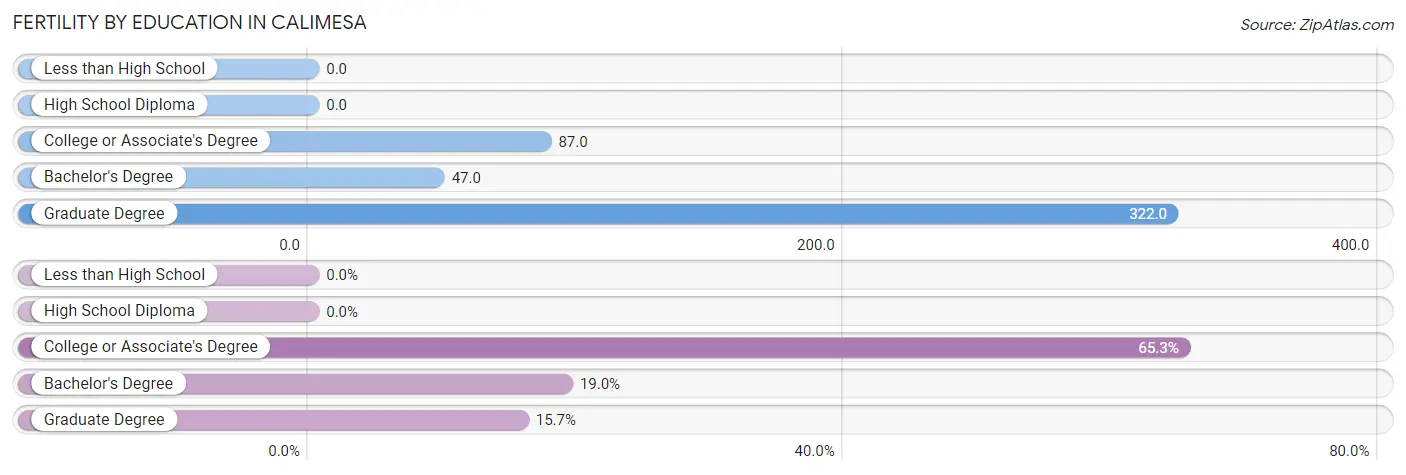
| Educational Attainment | Women with Births | Births / 1,000 Women |
| Less than High School | 0 (0.0%) | 0.0 |
| High School Diploma | 0 (0.0%) | 0.0 |
| College or Associate's Degree | 79 (65.3%) | 87.0 |
| Bachelor's Degree | 23 (19.0%) | 47.0 |
| Graduate Degree | 19 (15.7%) | 322.0 |
| Total | 121 (100.0%) | 56.0 |
Fertility by Education by Marriage Status in Calimesa
26.5% of women with births in Calimesa are unmarried. Women with the educational attainment of bachelor's degree are most likely to be married with 100.0% of them married at childbirth, while women with the educational attainment of college or associate's degree are least likely to be married with 40.5% of them unmarried at childbirth.
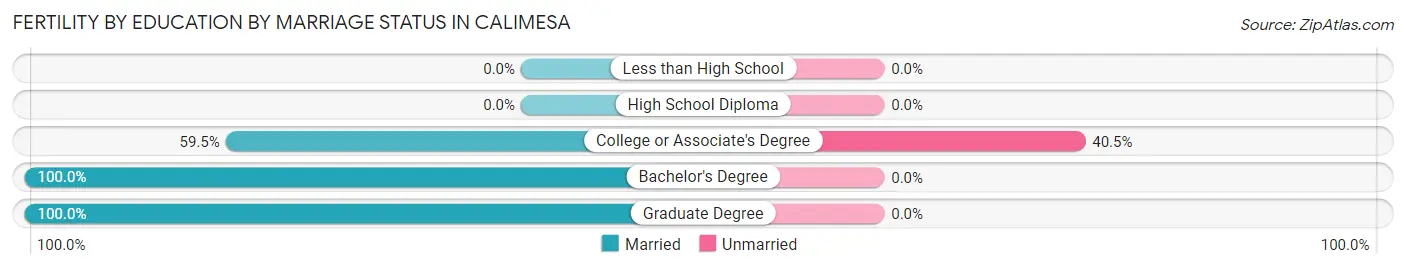
| Educational Attainment | Married | Unmarried |
| Less than High School | 0 (0.0%) | 0 (0.0%) |
| High School Diploma | 0 (0.0%) | 0 (0.0%) |
| College or Associate's Degree | 47 (59.5%) | 32 (40.5%) |
| Bachelor's Degree | 23 (100.0%) | 0 (0.0%) |
| Graduate Degree | 19 (100.0%) | 0 (0.0%) |
| Total | 89 (73.6%) | 32 (26.5%) |
Employment Characteristics in Calimesa
Employment by Class of Employer in Calimesa
Among the 4,391 employed individuals in Calimesa, private company employees (2,987 | 68.0%), local government employees (460 | 10.5%), and self-employed (not incorporated) (342 | 7.8%) make up the most common classes of employment.
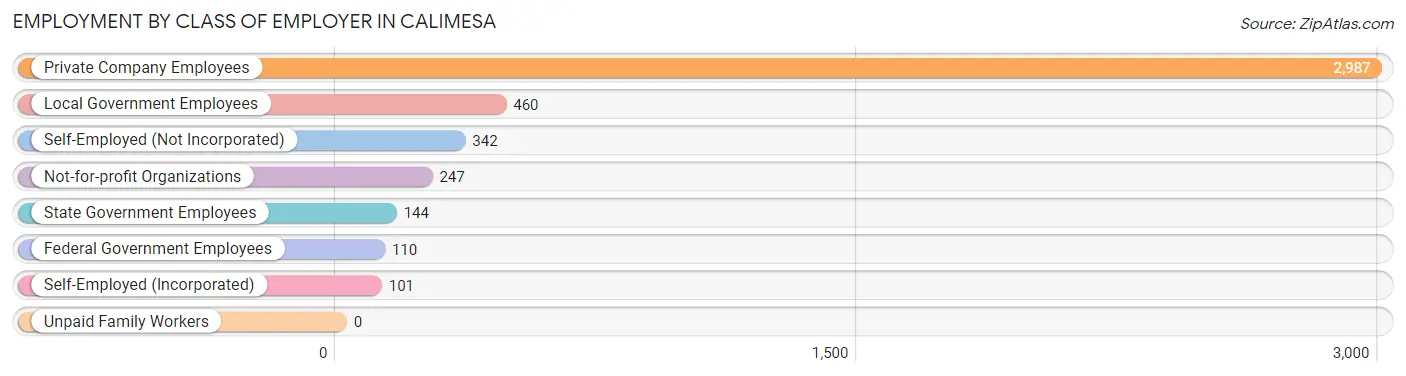
| Employer Class | # Employees | % Employees |
| Private Company Employees | 2,987 | 68.0% |
| Self-Employed (Incorporated) | 101 | 2.3% |
| Self-Employed (Not Incorporated) | 342 | 7.8% |
| Not-for-profit Organizations | 247 | 5.6% |
| Local Government Employees | 460 | 10.5% |
| State Government Employees | 144 | 3.3% |
| Federal Government Employees | 110 | 2.5% |
| Unpaid Family Workers | 0 | 0.0% |
| Total | 4,391 | 100.0% |
Employment Status by Age in Calimesa
According to the labor force statistics for Calimesa, out of the total population over 16 years of age (8,448), 54.3% or 4,587 individuals are in the labor force, with 2.3% or 106 of them unemployed. The age group with the highest labor force participation rate is 35 to 44 years, with 87.6% or 1,132 individuals in the labor force. Within the labor force, the 16 to 19 years age range has the highest percentage of unemployed individuals, with 10.3% or 21 of them being unemployed.
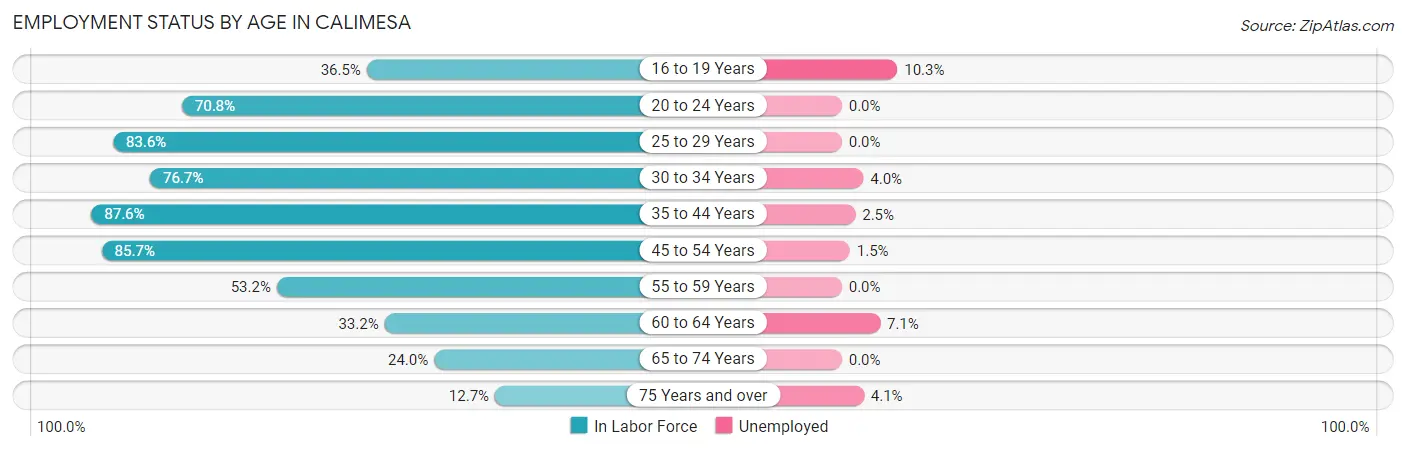
| Age Bracket | In Labor Force | Unemployed |
| 16 to 19 Years | 204 (36.5%) | 21 (10.3%) |
| 20 to 24 Years | 325 (70.8%) | 0 (0.0%) |
| 25 to 29 Years | 378 (83.6%) | 0 (0.0%) |
| 30 to 34 Years | 425 (76.7%) | 17 (4.0%) |
| 35 to 44 Years | 1,132 (87.6%) | 28 (2.5%) |
| 45 to 54 Years | 1,055 (85.7%) | 16 (1.5%) |
| 55 to 59 Years | 361 (53.2%) | 0 (0.0%) |
| 60 to 64 Years | 225 (33.2%) | 16 (7.1%) |
| 65 to 74 Years | 332 (24.0%) | 0 (0.0%) |
| 75 Years and over | 148 (12.7%) | 6 (4.1%) |
| Total | 4,587 (54.3%) | 106 (2.3%) |
Employment Status by Educational Attainment in Calimesa
According to labor force statistics for Calimesa, 73.2% of individuals (3,575) out of the total population between 25 and 64 years of age (4,884) are in the labor force, with 2.2% or 79 of them being unemployed. The group with the highest labor force participation rate are those with the educational attainment of bachelor's degree or higher, with 88.9% or 1,177 individuals in the labor force. Within the labor force, individuals with bachelor's degree or higher education have the highest percentage of unemployment, with 2.4% or 28 of them being unemployed.
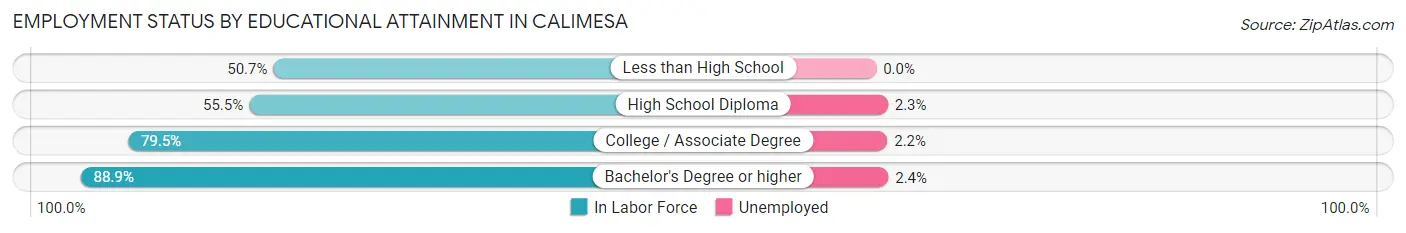
| Educational Attainment | In Labor Force | Unemployed |
| Less than High School | 233 (50.7%) | 0 (0.0%) |
| High School Diploma | 692 (55.5%) | 29 (2.3%) |
| College / Associate Degree | 1,474 (79.5%) | 41 (2.2%) |
| Bachelor's Degree or higher | 1,177 (88.9%) | 32 (2.4%) |
| Total | 3,575 (73.2%) | 107 (2.2%) |
Employment Occupations by Sex in Calimesa
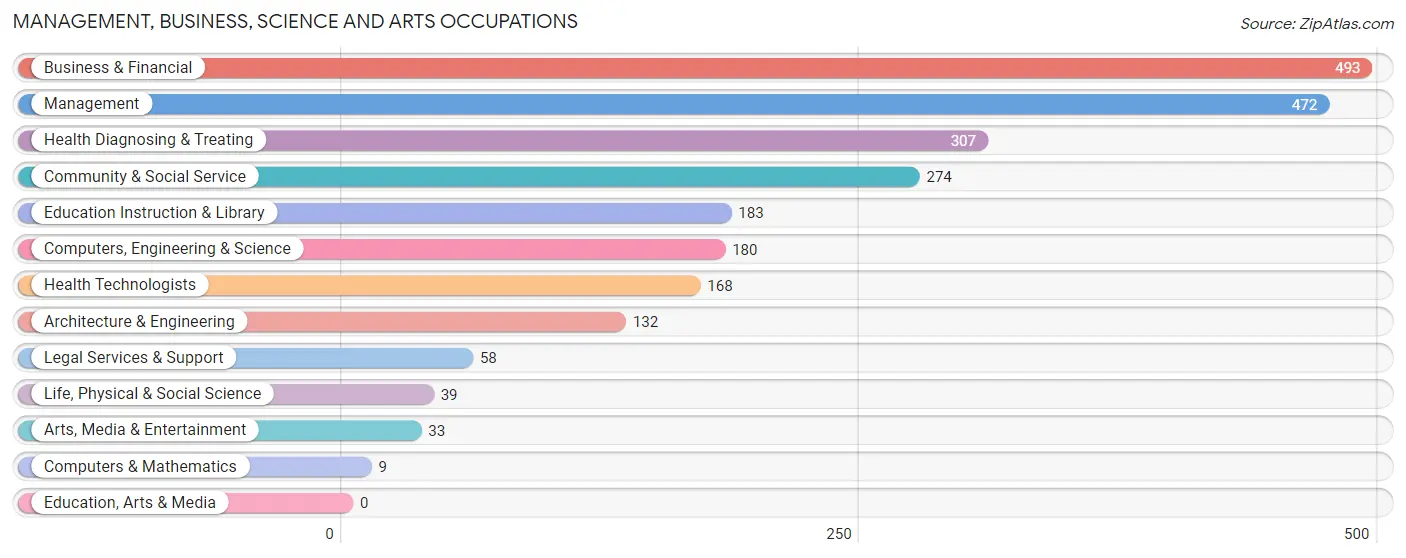
Management, Business, Science and Arts Occupations
The most common Management, Business, Science and Arts occupations in Calimesa are Business & Financial (493 | 11.0%), Management (472 | 10.5%), Health Diagnosing & Treating (307 | 6.9%), Community & Social Service (274 | 6.1%), and Education Instruction & Library (183 | 4.1%).
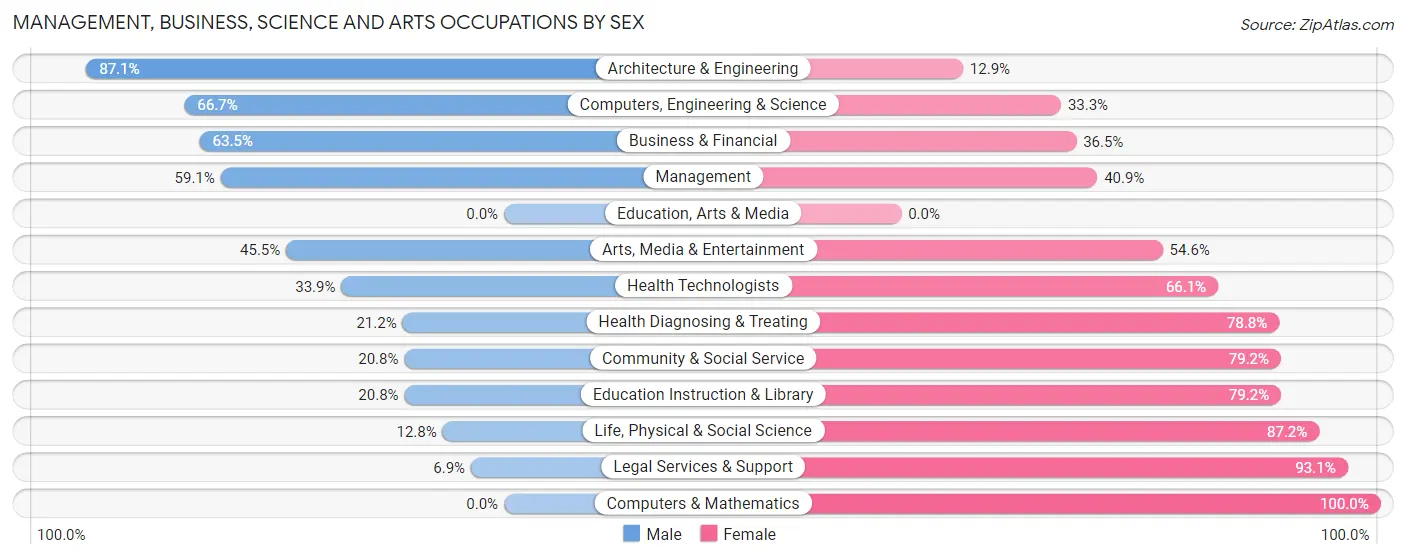
Management, Business, Science and Arts Occupations by Sex
Within the Management, Business, Science and Arts occupations in Calimesa, the most male-oriented occupations are Architecture & Engineering (87.1%), Computers, Engineering & Science (66.7%), and Business & Financial (63.5%), while the most female-oriented occupations are Computers & Mathematics (100.0%), Legal Services & Support (93.1%), and Life, Physical & Social Science (87.2%).
| Occupation | Male | Female |
| Management | 279 (59.1%) | 193 (40.9%) |
| Business & Financial | 313 (63.5%) | 180 (36.5%) |
| Computers, Engineering & Science | 120 (66.7%) | 60 (33.3%) |
| Computers & Mathematics | 0 (0.0%) | 9 (100.0%) |
| Architecture & Engineering | 115 (87.1%) | 17 (12.9%) |
| Life, Physical & Social Science | 5 (12.8%) | 34 (87.2%) |
| Community & Social Service | 57 (20.8%) | 217 (79.2%) |
| Education, Arts & Media | 0 (0.0%) | 0 (0.0%) |
| Legal Services & Support | 4 (6.9%) | 54 (93.1%) |
| Education Instruction & Library | 38 (20.8%) | 145 (79.2%) |
| Arts, Media & Entertainment | 15 (45.5%) | 18 (54.5%) |
| Health Diagnosing & Treating | 65 (21.2%) | 242 (78.8%) |
| Health Technologists | 57 (33.9%) | 111 (66.1%) |
| Total (Category) | 834 (48.3%) | 892 (51.7%) |
| Total (Overall) | 2,377 (53.0%) | 2,104 (46.9%) |
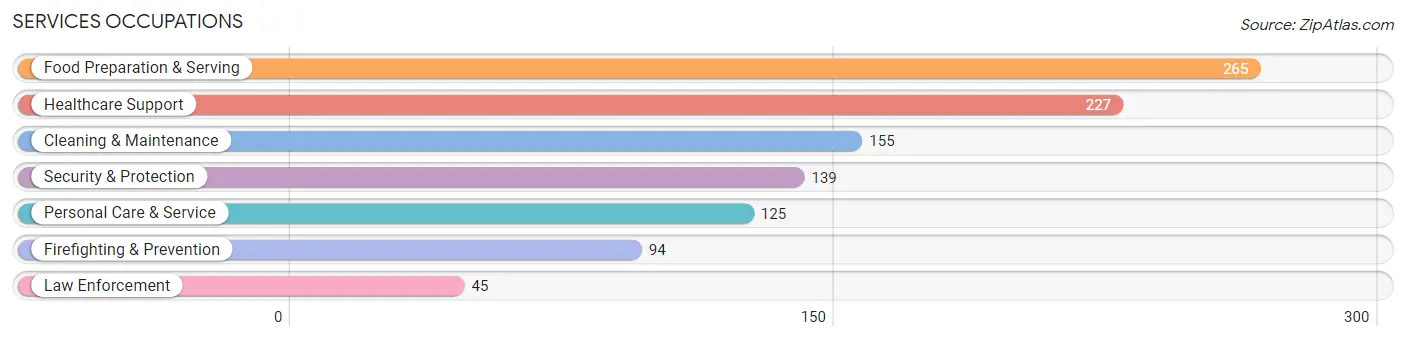
Services Occupations
The most common Services occupations in Calimesa are Food Preparation & Serving (265 | 5.9%), Healthcare Support (227 | 5.1%), Cleaning & Maintenance (155 | 3.5%), Security & Protection (139 | 3.1%), and Personal Care & Service (125 | 2.8%).
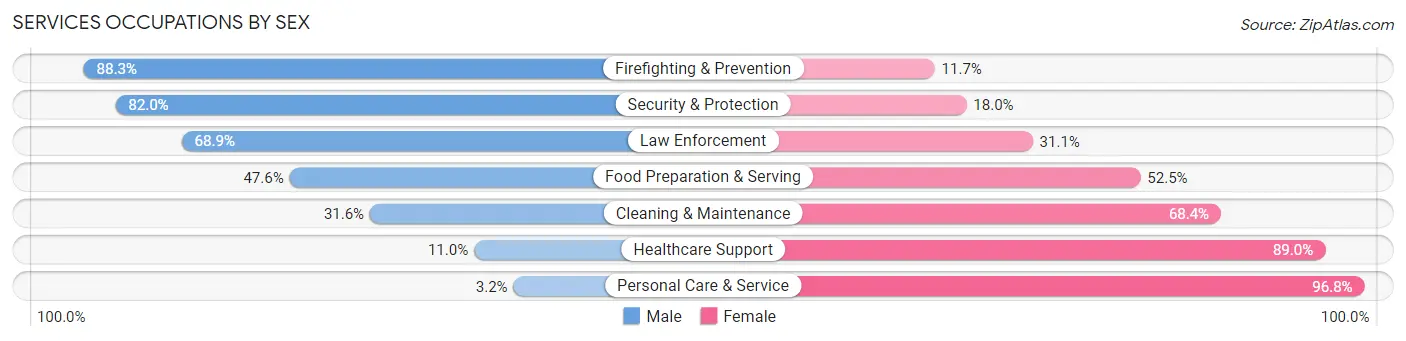
Services Occupations by Sex
Within the Services occupations in Calimesa, the most male-oriented occupations are Firefighting & Prevention (88.3%), Security & Protection (82.0%), and Law Enforcement (68.9%), while the most female-oriented occupations are Personal Care & Service (96.8%), Healthcare Support (89.0%), and Cleaning & Maintenance (68.4%).
| Occupation | Male | Female |
| Healthcare Support | 25 (11.0%) | 202 (89.0%) |
| Security & Protection | 114 (82.0%) | 25 (18.0%) |
| Firefighting & Prevention | 83 (88.3%) | 11 (11.7%) |
| Law Enforcement | 31 (68.9%) | 14 (31.1%) |
| Food Preparation & Serving | 126 (47.5%) | 139 (52.4%) |
| Cleaning & Maintenance | 49 (31.6%) | 106 (68.4%) |
| Personal Care & Service | 4 (3.2%) | 121 (96.8%) |
| Total (Category) | 318 (34.9%) | 593 (65.1%) |
| Total (Overall) | 2,377 (53.0%) | 2,104 (46.9%) |
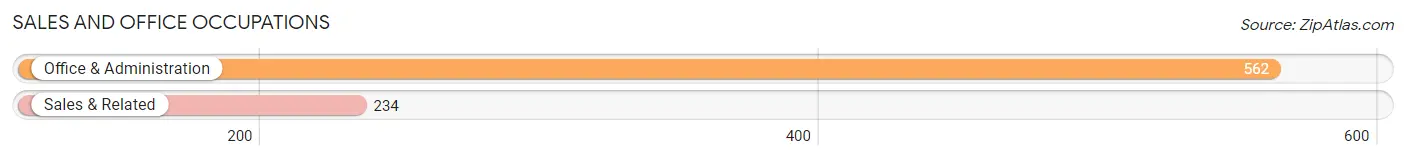
Sales and Office Occupations
The most common Sales and Office occupations in Calimesa are Office & Administration (562 | 12.5%), and Sales & Related (234 | 5.2%).
Sales and Office Occupations by Sex
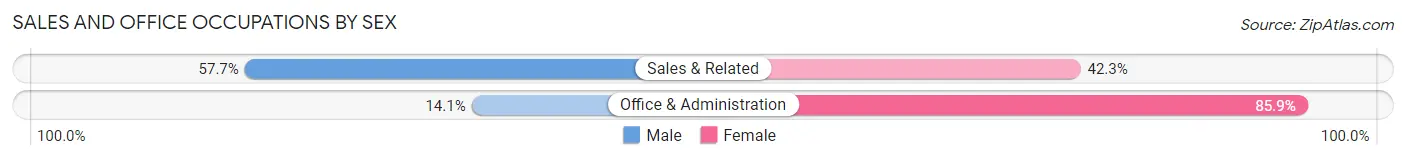
| Occupation | Male | Female |
| Sales & Related | 135 (57.7%) | 99 (42.3%) |
| Office & Administration | 79 (14.1%) | 483 (85.9%) |
| Total (Category) | 214 (26.9%) | 582 (73.1%) |
| Total (Overall) | 2,377 (53.0%) | 2,104 (46.9%) |
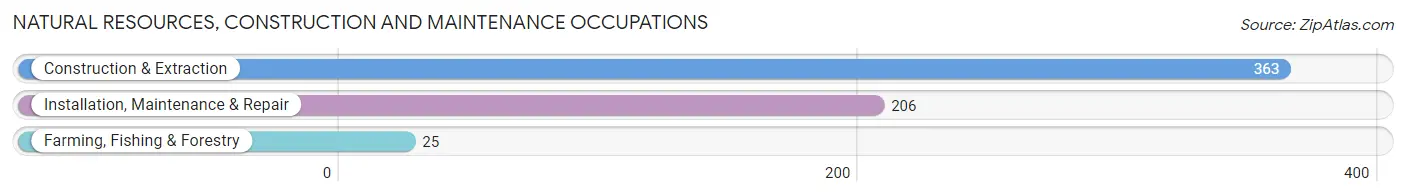
Natural Resources, Construction and Maintenance Occupations
The most common Natural Resources, Construction and Maintenance occupations in Calimesa are Construction & Extraction (363 | 8.1%), Installation, Maintenance & Repair (206 | 4.6%), and Farming, Fishing & Forestry (25 | 0.6%).
Natural Resources, Construction and Maintenance Occupations by Sex
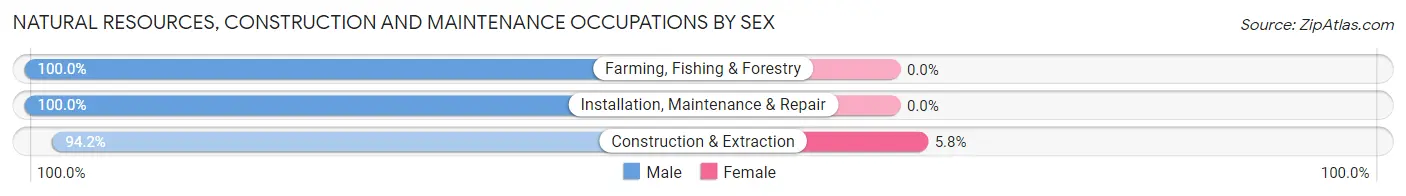
| Occupation | Male | Female |
| Farming, Fishing & Forestry | 25 (100.0%) | 0 (0.0%) |
| Construction & Extraction | 342 (94.2%) | 21 (5.8%) |
| Installation, Maintenance & Repair | 206 (100.0%) | 0 (0.0%) |
| Total (Category) | 573 (96.5%) | 21 (3.5%) |
| Total (Overall) | 2,377 (53.0%) | 2,104 (46.9%) |
Production, Transportation and Moving Occupations
The most common Production, Transportation and Moving occupations in Calimesa are Transportation (264 | 5.9%), Production (99 | 2.2%), and Material Moving (91 | 2.0%).
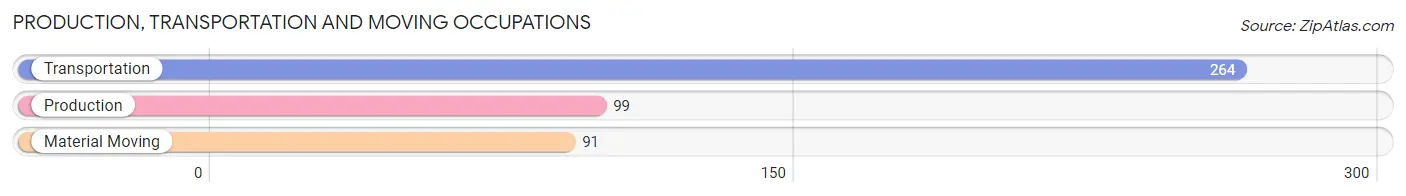
Production, Transportation and Moving Occupations by Sex
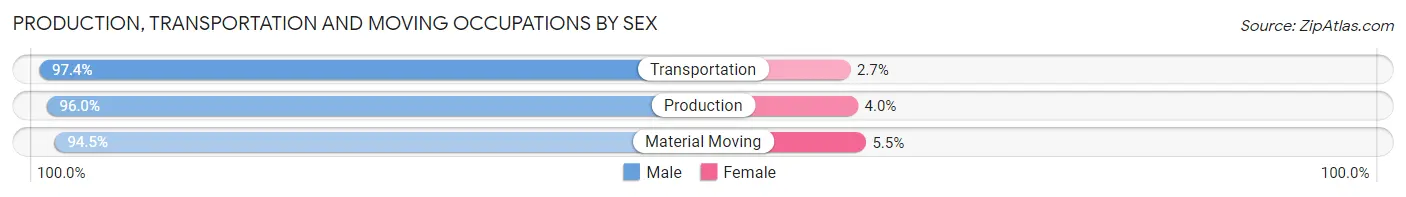
| Occupation | Male | Female |
| Production | 95 (96.0%) | 4 (4.0%) |
| Transportation | 257 (97.4%) | 7 (2.6%) |
| Material Moving | 86 (94.5%) | 5 (5.5%) |
| Total (Category) | 438 (96.5%) | 16 (3.5%) |
| Total (Overall) | 2,377 (53.0%) | 2,104 (46.9%) |
Employment Industries by Sex in Calimesa
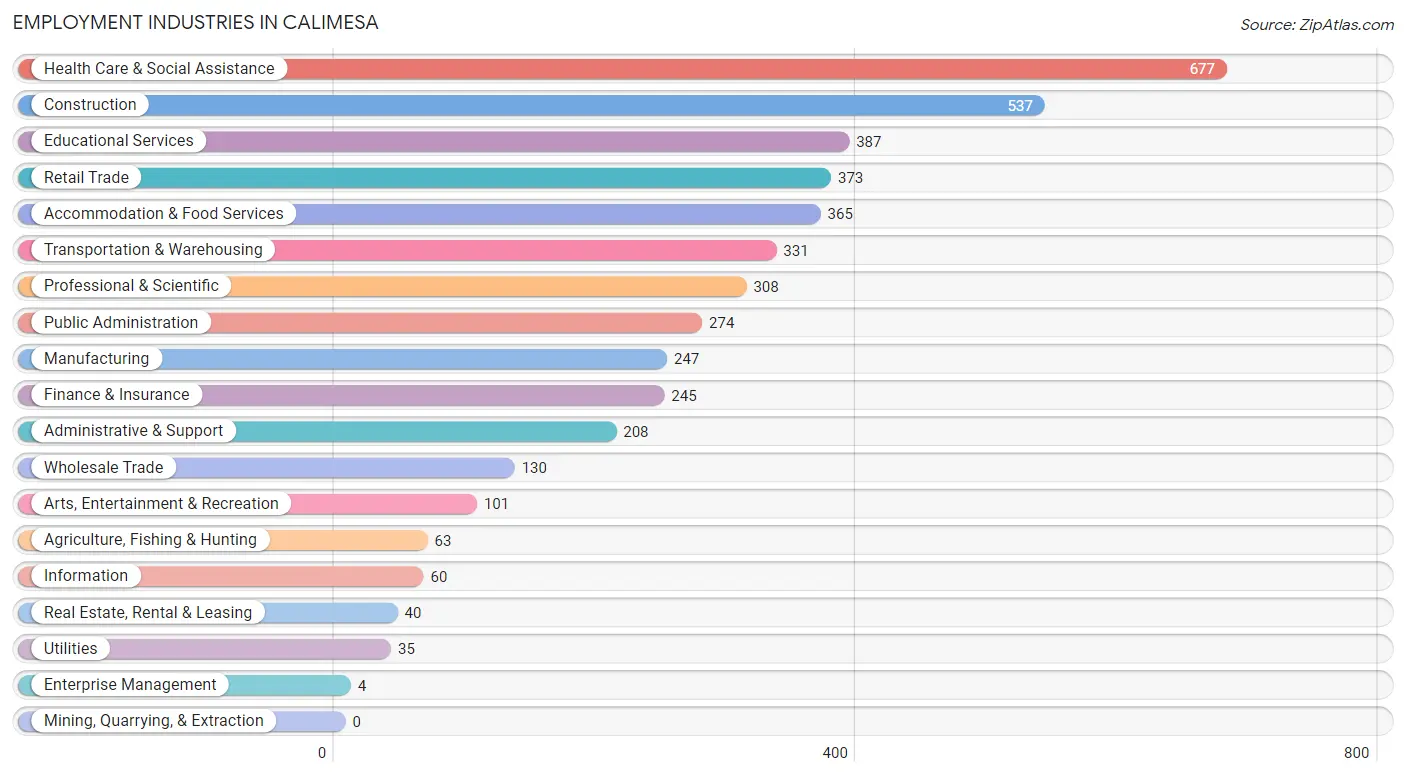
Employment Industries in Calimesa
The major employment industries in Calimesa include Health Care & Social Assistance (677 | 15.1%), Construction (537 | 12.0%), Educational Services (387 | 8.6%), Retail Trade (373 | 8.3%), and Accommodation & Food Services (365 | 8.2%).
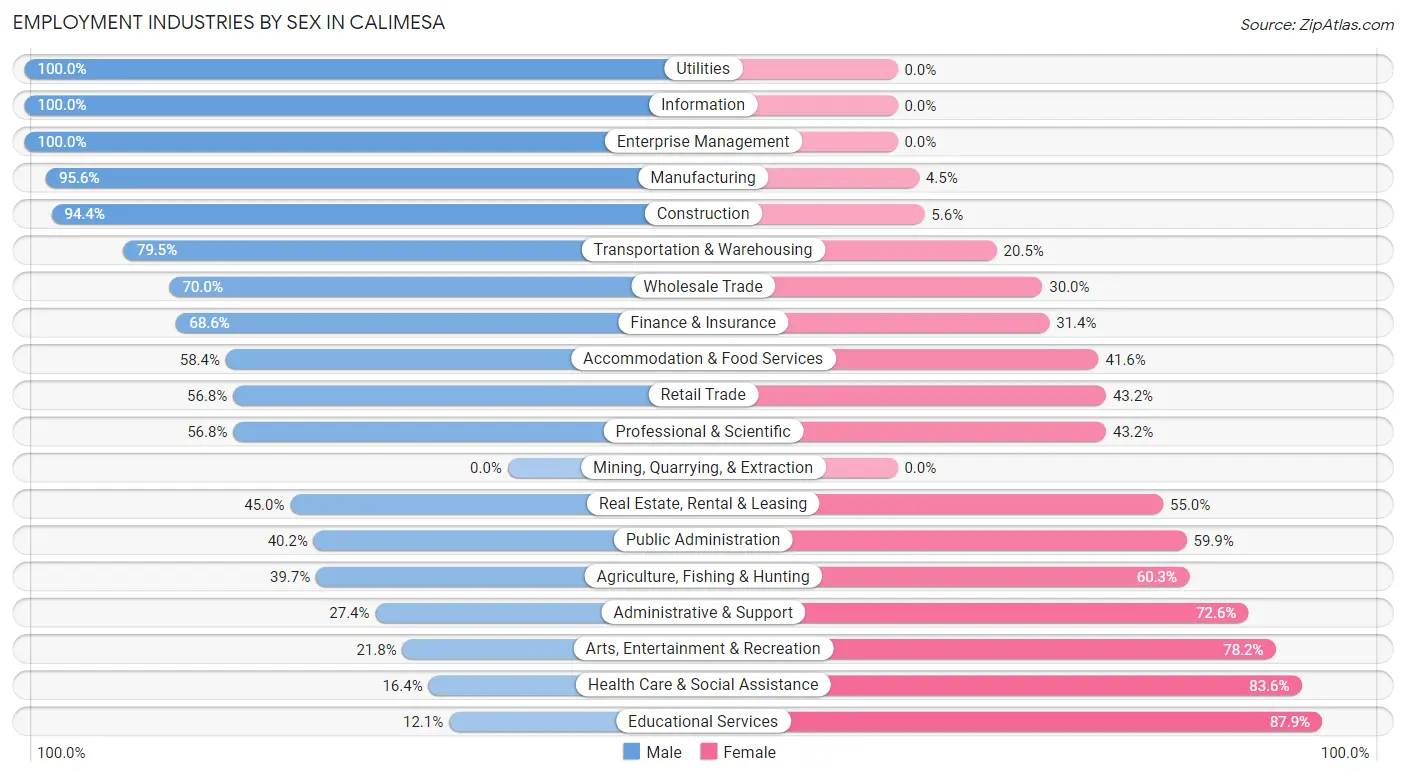
Employment Industries by Sex in Calimesa
The Calimesa industries that see more men than women are Utilities (100.0%), Information (100.0%), and Enterprise Management (100.0%), whereas the industries that tend to have a higher number of women are Educational Services (87.9%), Health Care & Social Assistance (83.6%), and Arts, Entertainment & Recreation (78.2%).
| Industry | Male | Female |
| Agriculture, Fishing & Hunting | 25 (39.7%) | 38 (60.3%) |
| Mining, Quarrying, & Extraction | 0 (0.0%) | 0 (0.0%) |
| Construction | 507 (94.4%) | 30 (5.6%) |
| Manufacturing | 236 (95.6%) | 11 (4.4%) |
| Wholesale Trade | 91 (70.0%) | 39 (30.0%) |
| Retail Trade | 212 (56.8%) | 161 (43.2%) |
| Transportation & Warehousing | 263 (79.5%) | 68 (20.5%) |
| Utilities | 35 (100.0%) | 0 (0.0%) |
| Information | 60 (100.0%) | 0 (0.0%) |
| Finance & Insurance | 168 (68.6%) | 77 (31.4%) |
| Real Estate, Rental & Leasing | 18 (45.0%) | 22 (55.0%) |
| Professional & Scientific | 175 (56.8%) | 133 (43.2%) |
| Enterprise Management | 4 (100.0%) | 0 (0.0%) |
| Administrative & Support | 57 (27.4%) | 151 (72.6%) |
| Educational Services | 47 (12.1%) | 340 (87.9%) |
| Health Care & Social Assistance | 111 (16.4%) | 566 (83.6%) |
| Arts, Entertainment & Recreation | 22 (21.8%) | 79 (78.2%) |
| Accommodation & Food Services | 213 (58.4%) | 152 (41.6%) |
| Public Administration | 110 (40.2%) | 164 (59.9%) |
| Total | 2,377 (53.0%) | 2,104 (46.9%) |
Education in Calimesa
School Enrollment in Calimesa
The most common levels of schooling among the 2,520 students in Calimesa are middle school (662 | 26.3%), elementary school (561 | 22.3%), and high school (553 | 21.9%).
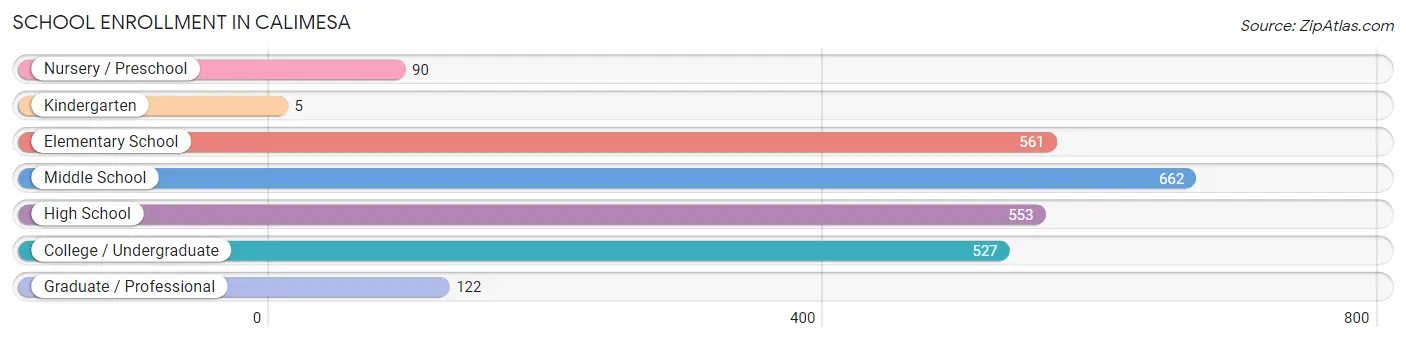
| School Level | # Students | % Students |
| Nursery / Preschool | 90 | 3.6% |
| Kindergarten | 5 | 0.2% |
| Elementary School | 561 | 22.3% |
| Middle School | 662 | 26.3% |
| High School | 553 | 21.9% |
| College / Undergraduate | 527 | 20.9% |
| Graduate / Professional | 122 | 4.8% |
| Total | 2,520 | 100.0% |
School Enrollment by Age by Funding Source in Calimesa
Out of a total of 2,520 students who are enrolled in schools in Calimesa, 746 (29.6%) attend a private institution, while the remaining 1,774 (70.4%) are enrolled in public schools. The age group of 35 years and over has the highest likelihood of being enrolled in private schools, with 101 (70.6% in the age bracket) enrolled. Conversely, the age group of 18 to 19 year olds has the lowest likelihood of being enrolled in a private school, with 165 (91.2% in the age bracket) attending a public institution.

| Age Bracket | Public School | Private School |
| 3 to 4 Year Olds | 67 (74.4%) | 23 (25.6%) |
| 5 to 9 Year Old | 445 (86.1%) | 72 (13.9%) |
| 10 to 14 Year Olds | 460 (59.7%) | 310 (40.3%) |
| 15 to 17 Year Olds | 288 (70.9%) | 118 (29.1%) |
| 18 to 19 Year Olds | 165 (91.2%) | 16 (8.8%) |
| 20 to 24 Year Olds | 167 (67.3%) | 81 (32.7%) |
| 25 to 34 Year Olds | 141 (85.5%) | 24 (14.5%) |
| 35 Years and over | 42 (29.4%) | 101 (70.6%) |
| Total | 1,774 (70.4%) | 746 (29.6%) |
Educational Attainment by Field of Study in Calimesa
Business (398 | 20.4%), science & technology (269 | 13.8%), education (249 | 12.8%), liberal arts & history (168 | 8.6%), and multidisciplinary studies (138 | 7.1%) are the most common fields of study among 1,946 individuals in Calimesa who have obtained a bachelor's degree or higher.
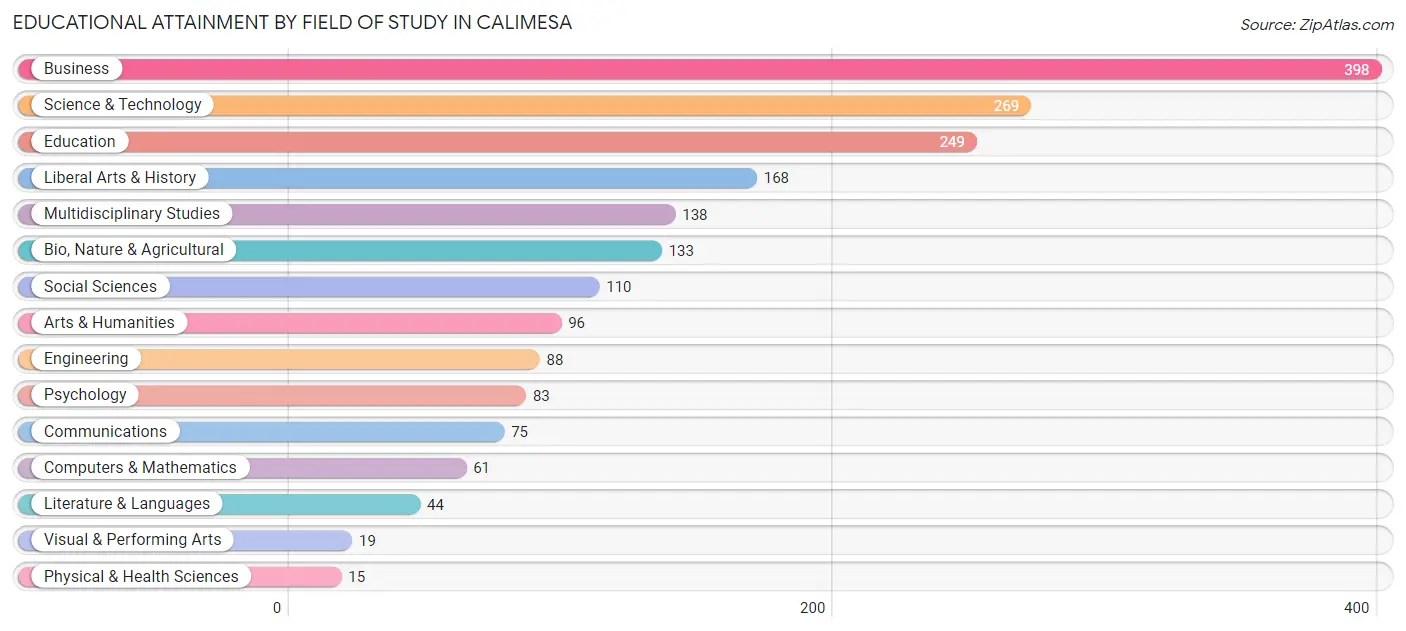
| Field of Study | # Graduates | % Graduates |
| Computers & Mathematics | 61 | 3.1% |
| Bio, Nature & Agricultural | 133 | 6.8% |
| Physical & Health Sciences | 15 | 0.8% |
| Psychology | 83 | 4.3% |
| Social Sciences | 110 | 5.7% |
| Engineering | 88 | 4.5% |
| Multidisciplinary Studies | 138 | 7.1% |
| Science & Technology | 269 | 13.8% |
| Business | 398 | 20.4% |
| Education | 249 | 12.8% |
| Literature & Languages | 44 | 2.3% |
| Liberal Arts & History | 168 | 8.6% |
| Visual & Performing Arts | 19 | 1.0% |
| Communications | 75 | 3.8% |
| Arts & Humanities | 96 | 4.9% |
| Total | 1,946 | 100.0% |
Transportation & Commute in Calimesa
Vehicle Availability by Sex in Calimesa
The most prevalent vehicle ownership categories in Calimesa are males with 2 vehicles (891, accounting for 38.5%) and females with 2 vehicles (559, making up 42.9%).
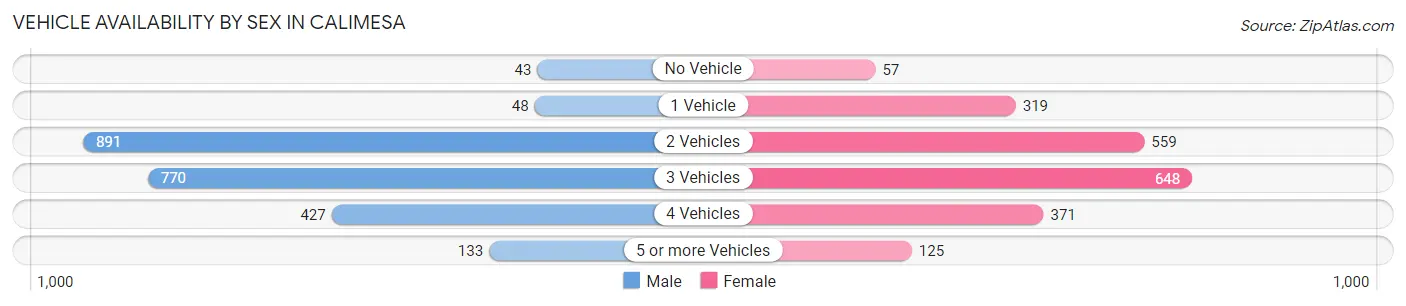
| Vehicles Available | Male | Female |
| No Vehicle | 43 (1.9%) | 57 (2.7%) |
| 1 Vehicle | 48 (2.1%) | 319 (15.3%) |
| 2 Vehicles | 891 (38.5%) | 559 (26.9%) |
| 3 Vehicles | 770 (33.3%) | 648 (31.2%) |
| 4 Vehicles | 427 (18.5%) | 371 (17.8%) |
| 5 or more Vehicles | 133 (5.8%) | 125 (6.0%) |
| Total | 2,312 (100.0%) | 2,079 (100.0%) |
Commute Time in Calimesa
The most frequently occuring commute durations in Calimesa are 45 to 59 minutes (580 commuters, 14.3%), 20 to 24 minutes (557 commuters, 13.7%), and 60 to 89 minutes (489 commuters, 12.1%).
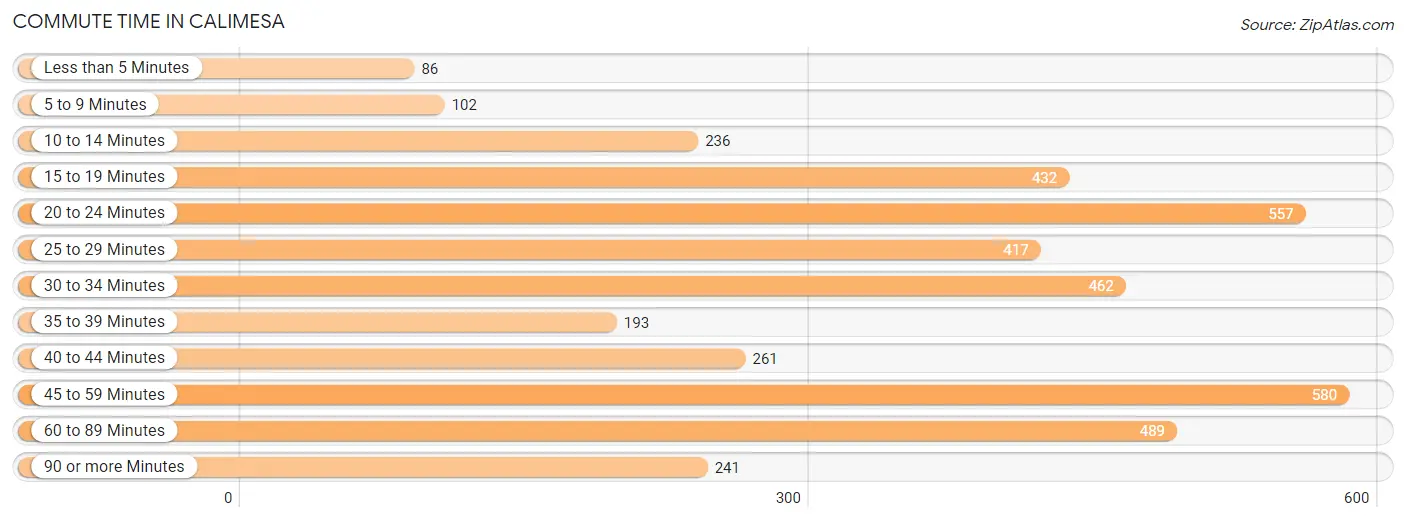
| Commute Time | # Commuters | % Commuters |
| Less than 5 Minutes | 86 | 2.1% |
| 5 to 9 Minutes | 102 | 2.5% |
| 10 to 14 Minutes | 236 | 5.8% |
| 15 to 19 Minutes | 432 | 10.6% |
| 20 to 24 Minutes | 557 | 13.7% |
| 25 to 29 Minutes | 417 | 10.3% |
| 30 to 34 Minutes | 462 | 11.4% |
| 35 to 39 Minutes | 193 | 4.8% |
| 40 to 44 Minutes | 261 | 6.4% |
| 45 to 59 Minutes | 580 | 14.3% |
| 60 to 89 Minutes | 489 | 12.1% |
| 90 or more Minutes | 241 | 5.9% |
Commute Time by Sex in Calimesa
The most common commute times in Calimesa are 45 to 59 minutes (466 commuters, 21.3%) for males and 20 to 24 minutes (351 commuters, 18.8%) for females.
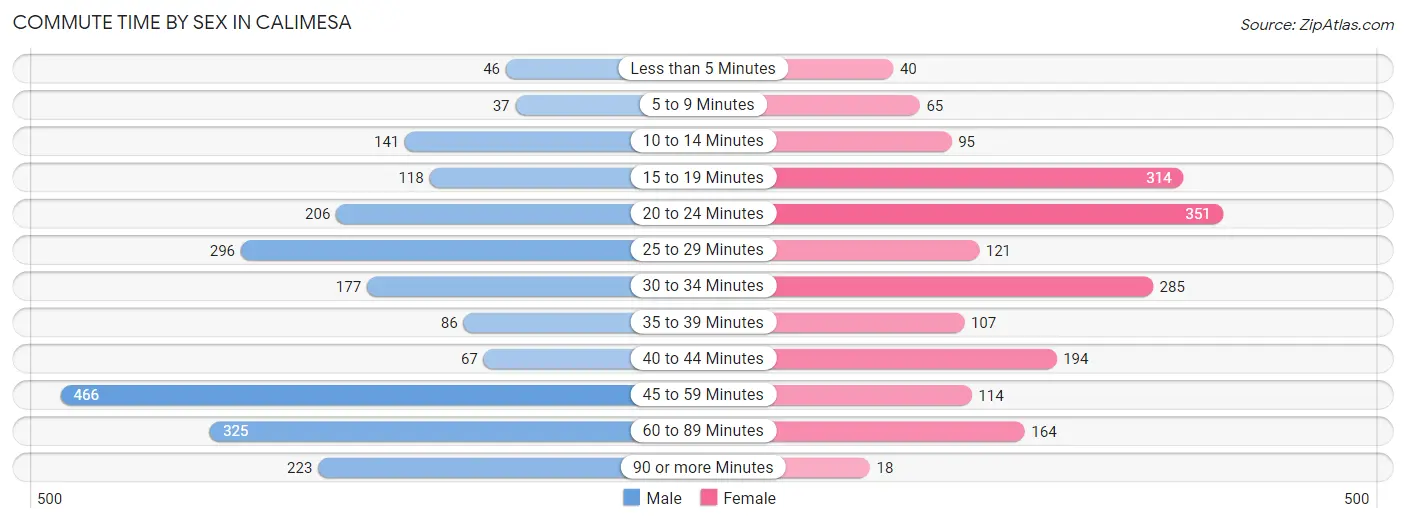
| Commute Time | Male | Female |
| Less than 5 Minutes | 46 (2.1%) | 40 (2.1%) |
| 5 to 9 Minutes | 37 (1.7%) | 65 (3.5%) |
| 10 to 14 Minutes | 141 (6.4%) | 95 (5.1%) |
| 15 to 19 Minutes | 118 (5.4%) | 314 (16.8%) |
| 20 to 24 Minutes | 206 (9.4%) | 351 (18.8%) |
| 25 to 29 Minutes | 296 (13.5%) | 121 (6.5%) |
| 30 to 34 Minutes | 177 (8.1%) | 285 (15.3%) |
| 35 to 39 Minutes | 86 (3.9%) | 107 (5.7%) |
| 40 to 44 Minutes | 67 (3.1%) | 194 (10.4%) |
| 45 to 59 Minutes | 466 (21.3%) | 114 (6.1%) |
| 60 to 89 Minutes | 325 (14.8%) | 164 (8.8%) |
| 90 or more Minutes | 223 (10.2%) | 18 (1.0%) |
Time of Departure to Work by Sex in Calimesa
The most frequent times of departure to work in Calimesa are 12:00 AM to 4:59 AM (478, 21.8%) for males and 7:00 AM to 7:29 AM (342, 18.3%) for females.
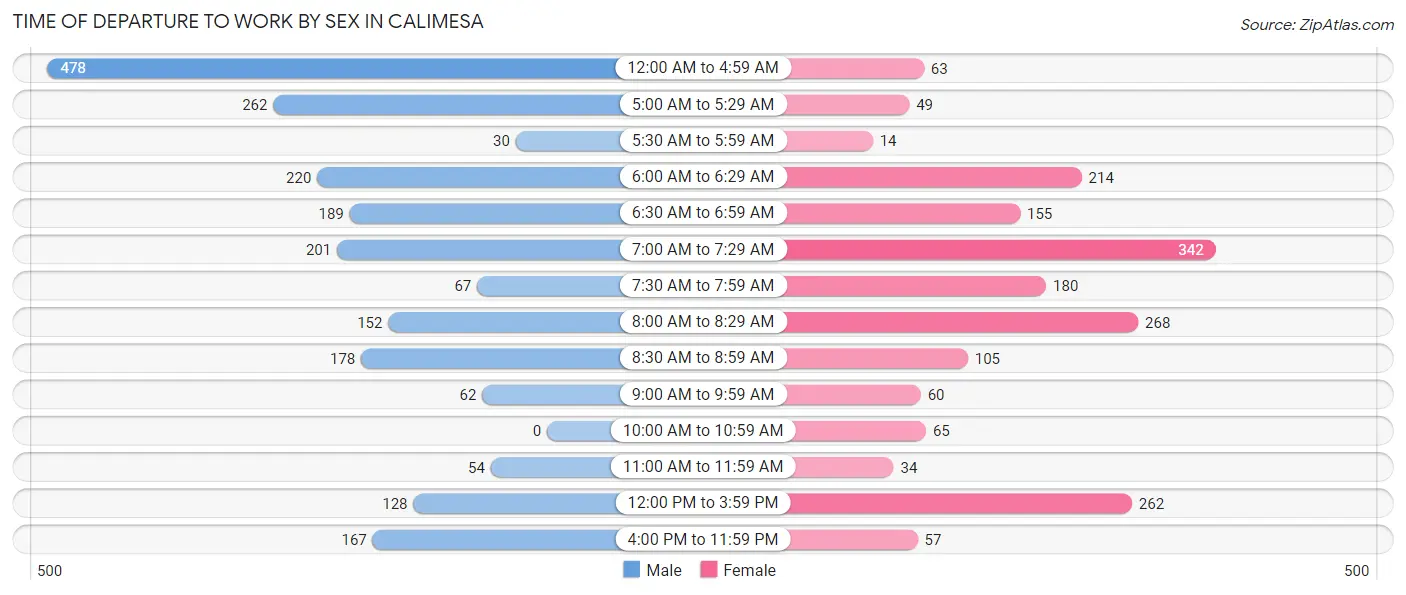
| Time of Departure | Male | Female |
| 12:00 AM to 4:59 AM | 478 (21.8%) | 63 (3.4%) |
| 5:00 AM to 5:29 AM | 262 (12.0%) | 49 (2.6%) |
| 5:30 AM to 5:59 AM | 30 (1.4%) | 14 (0.7%) |
| 6:00 AM to 6:29 AM | 220 (10.1%) | 214 (11.5%) |
| 6:30 AM to 6:59 AM | 189 (8.6%) | 155 (8.3%) |
| 7:00 AM to 7:29 AM | 201 (9.2%) | 342 (18.3%) |
| 7:30 AM to 7:59 AM | 67 (3.1%) | 180 (9.6%) |
| 8:00 AM to 8:29 AM | 152 (7.0%) | 268 (14.3%) |
| 8:30 AM to 8:59 AM | 178 (8.1%) | 105 (5.6%) |
| 9:00 AM to 9:59 AM | 62 (2.8%) | 60 (3.2%) |
| 10:00 AM to 10:59 AM | 0 (0.0%) | 65 (3.5%) |
| 11:00 AM to 11:59 AM | 54 (2.5%) | 34 (1.8%) |
| 12:00 PM to 3:59 PM | 128 (5.9%) | 262 (14.0%) |
| 4:00 PM to 11:59 PM | 167 (7.6%) | 57 (3.0%) |
| Total | 2,188 (100.0%) | 1,868 (100.0%) |
Housing Occupancy in Calimesa
Occupancy by Ownership in Calimesa
Of the total 3,767 dwellings in Calimesa, owner-occupied units account for 3,375 (89.6%), while renter-occupied units make up 392 (10.4%).
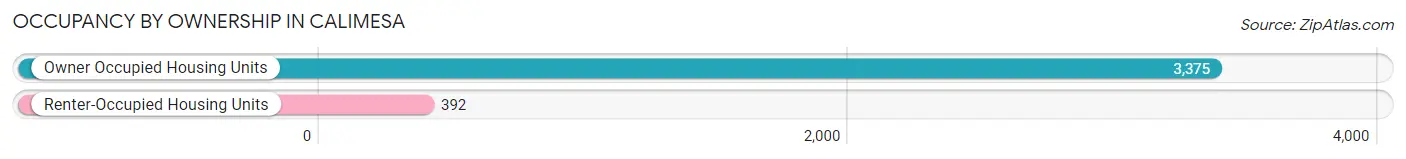
| Occupancy | # Housing Units | % Housing Units |
| Owner Occupied Housing Units | 3,375 | 89.6% |
| Renter-Occupied Housing Units | 392 | 10.4% |
| Total Occupied Housing Units | 3,767 | 100.0% |
Occupancy by Household Size in Calimesa
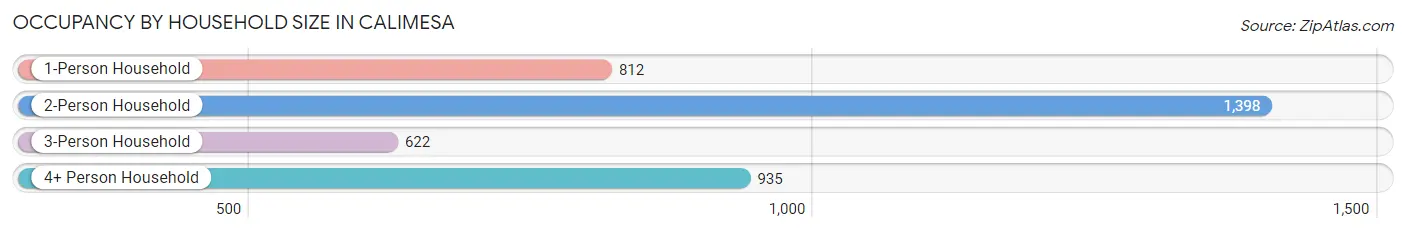
| Household Size | # Housing Units | % Housing Units |
| 1-Person Household | 812 | 21.6% |
| 2-Person Household | 1,398 | 37.1% |
| 3-Person Household | 622 | 16.5% |
| 4+ Person Household | 935 | 24.8% |
| Total Housing Units | 3,767 | 100.0% |
Occupancy by Ownership by Household Size in Calimesa
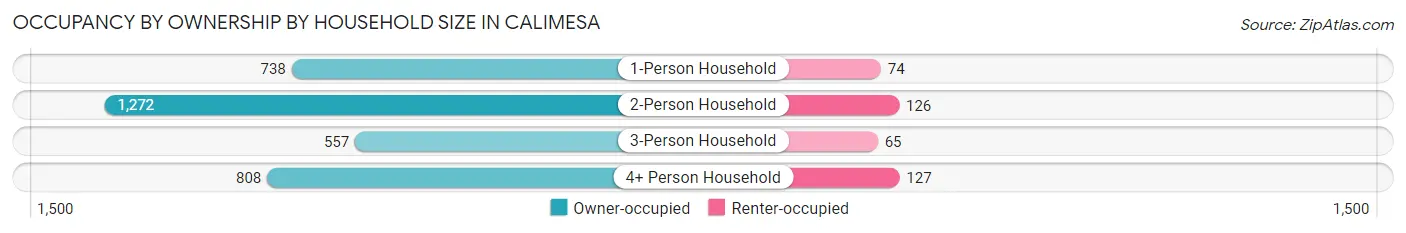
| Household Size | Owner-occupied | Renter-occupied |
| 1-Person Household | 738 (90.9%) | 74 (9.1%) |
| 2-Person Household | 1,272 (91.0%) | 126 (9.0%) |
| 3-Person Household | 557 (89.5%) | 65 (10.4%) |
| 4+ Person Household | 808 (86.4%) | 127 (13.6%) |
| Total Housing Units | 3,375 (89.6%) | 392 (10.4%) |
Occupancy by Educational Attainment in Calimesa
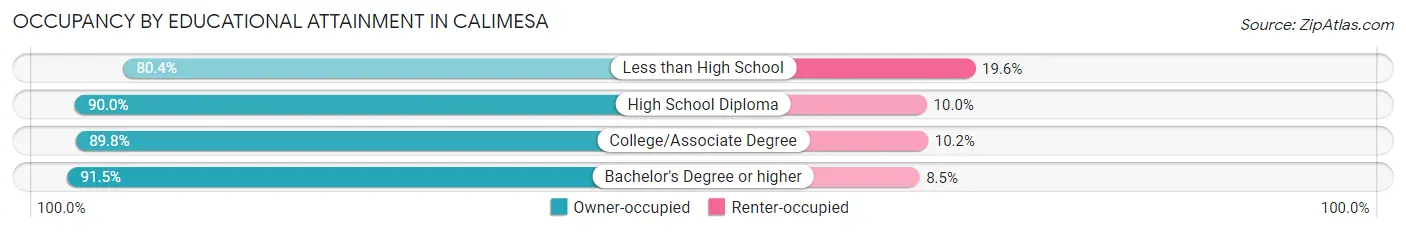
| Household Size | Owner-occupied | Renter-occupied |
| Less than High School | 205 (80.4%) | 50 (19.6%) |
| High School Diploma | 845 (90.0%) | 94 (10.0%) |
| College/Associate Degree | 1,490 (89.8%) | 170 (10.2%) |
| Bachelor's Degree or higher | 835 (91.5%) | 78 (8.5%) |
Occupancy by Age of Householder in Calimesa
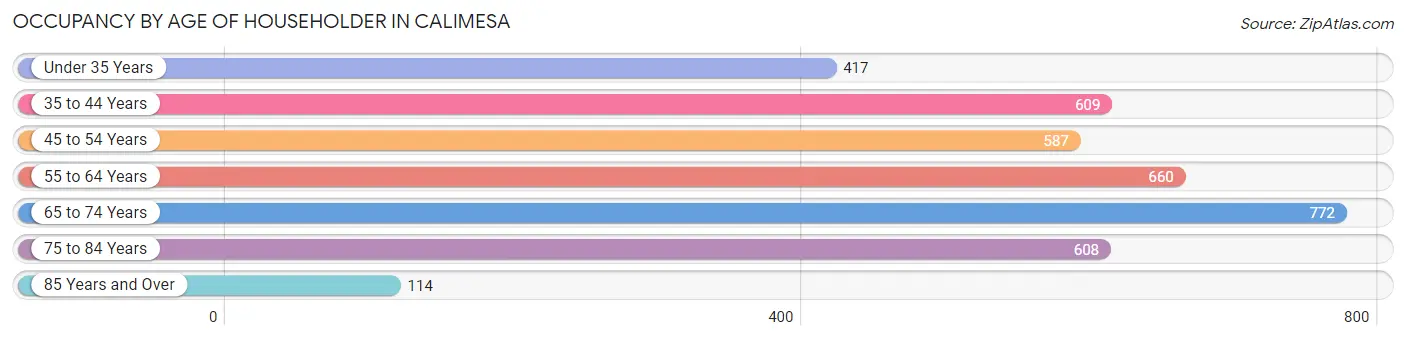
| Age Bracket | # Households | % Households |
| Under 35 Years | 417 | 11.1% |
| 35 to 44 Years | 609 | 16.2% |
| 45 to 54 Years | 587 | 15.6% |
| 55 to 64 Years | 660 | 17.5% |
| 65 to 74 Years | 772 | 20.5% |
| 75 to 84 Years | 608 | 16.1% |
| 85 Years and Over | 114 | 3.0% |
| Total | 3,767 | 100.0% |
Housing Finances in Calimesa
Median Income by Occupancy in Calimesa
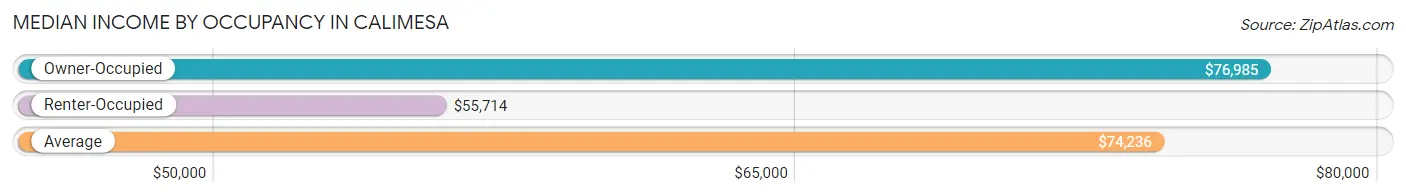
| Occupancy Type | # Households | Median Income |
| Owner-Occupied | 3,375 (89.6%) | $76,985 |
| Renter-Occupied | 392 (10.4%) | $55,714 |
| Average | 3,767 (100.0%) | $74,236 |
Occupancy by Householder Income Bracket in Calimesa
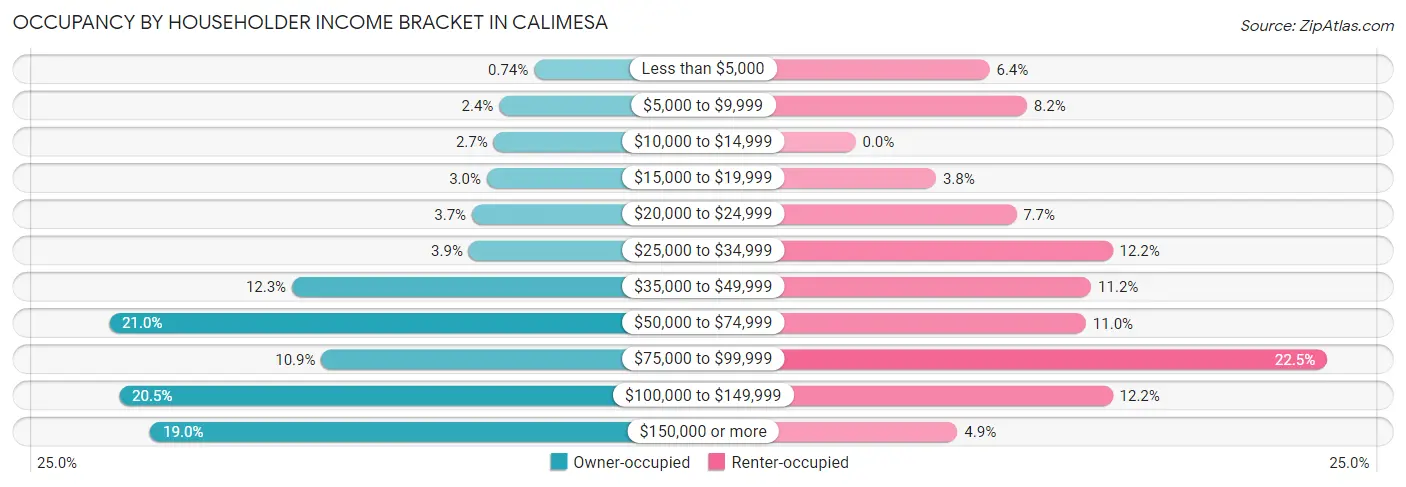
| Income Bracket | Owner-occupied | Renter-occupied |
| Less than $5,000 | 25 (0.7%) | 25 (6.4%) |
| $5,000 to $9,999 | 81 (2.4%) | 32 (8.2%) |
| $10,000 to $14,999 | 90 (2.7%) | 0 (0.0%) |
| $15,000 to $19,999 | 101 (3.0%) | 15 (3.8%) |
| $20,000 to $24,999 | 125 (3.7%) | 30 (7.6%) |
| $25,000 to $34,999 | 130 (3.8%) | 48 (12.2%) |
| $35,000 to $49,999 | 414 (12.3%) | 44 (11.2%) |
| $50,000 to $74,999 | 708 (21.0%) | 43 (11.0%) |
| $75,000 to $99,999 | 367 (10.9%) | 88 (22.5%) |
| $100,000 to $149,999 | 692 (20.5%) | 48 (12.2%) |
| $150,000 or more | 642 (19.0%) | 19 (4.9%) |
| Total | 3,375 (100.0%) | 392 (100.0%) |
Monthly Housing Cost Tiers in Calimesa
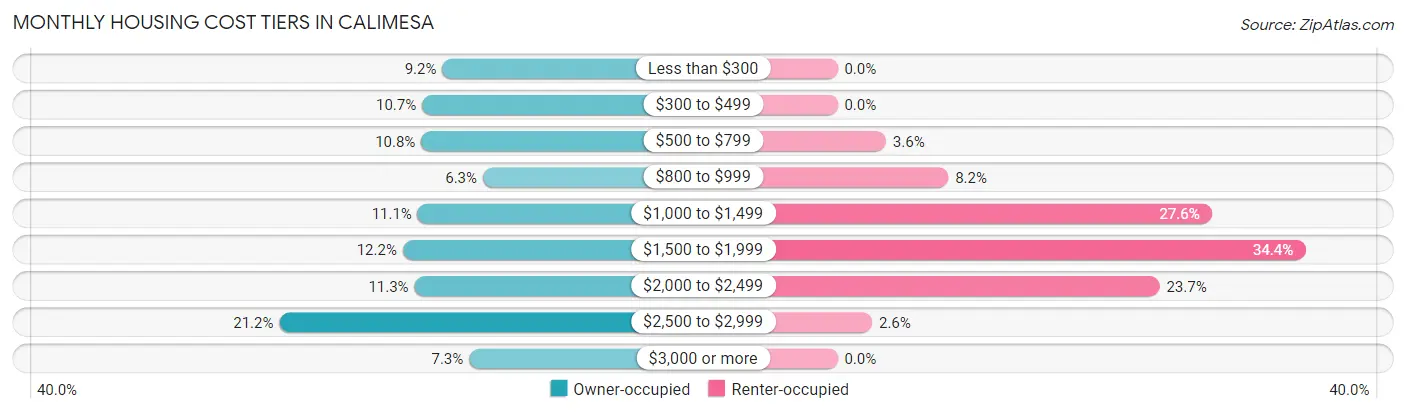
| Monthly Cost | Owner-occupied | Renter-occupied |
| Less than $300 | 312 (9.2%) | 0 (0.0%) |
| $300 to $499 | 362 (10.7%) | 0 (0.0%) |
| $500 to $799 | 364 (10.8%) | 14 (3.6%) |
| $800 to $999 | 211 (6.2%) | 32 (8.2%) |
| $1,000 to $1,499 | 373 (11.1%) | 108 (27.6%) |
| $1,500 to $1,999 | 410 (12.1%) | 135 (34.4%) |
| $2,000 to $2,499 | 381 (11.3%) | 93 (23.7%) |
| $2,500 to $2,999 | 717 (21.2%) | 10 (2.5%) |
| $3,000 or more | 245 (7.3%) | 0 (0.0%) |
| Total | 3,375 (100.0%) | 392 (100.0%) |
Physical Housing Characteristics in Calimesa
Housing Structures in Calimesa
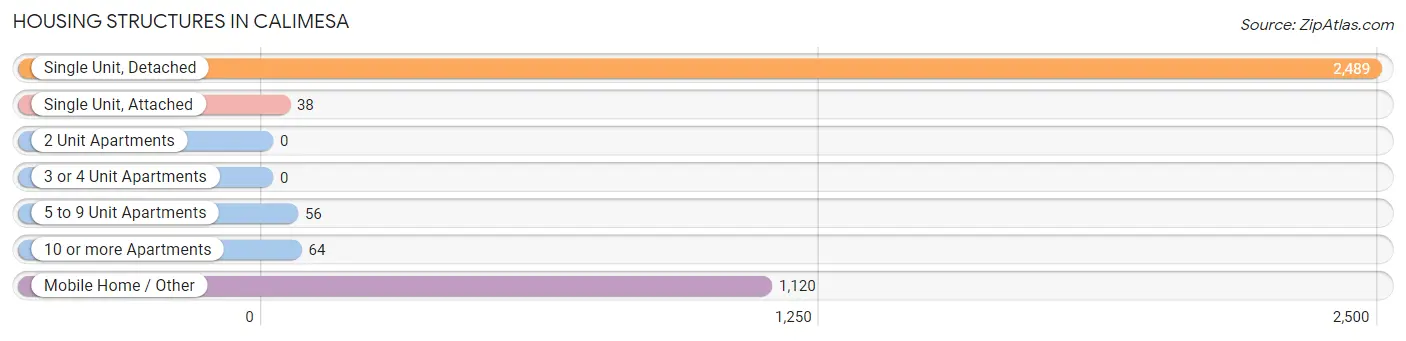
| Structure Type | # Housing Units | % Housing Units |
| Single Unit, Detached | 2,489 | 66.1% |
| Single Unit, Attached | 38 | 1.0% |
| 2 Unit Apartments | 0 | 0.0% |
| 3 or 4 Unit Apartments | 0 | 0.0% |
| 5 to 9 Unit Apartments | 56 | 1.5% |
| 10 or more Apartments | 64 | 1.7% |
| Mobile Home / Other | 1,120 | 29.7% |
| Total | 3,767 | 100.0% |
Housing Structures by Occupancy in Calimesa
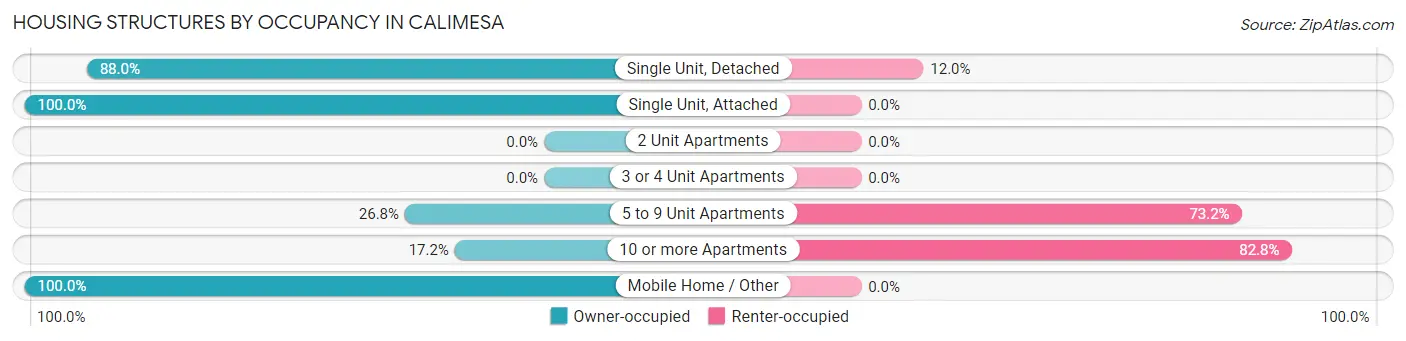
| Structure Type | Owner-occupied | Renter-occupied |
| Single Unit, Detached | 2,191 (88.0%) | 298 (12.0%) |
| Single Unit, Attached | 38 (100.0%) | 0 (0.0%) |
| 2 Unit Apartments | 0 (0.0%) | 0 (0.0%) |
| 3 or 4 Unit Apartments | 0 (0.0%) | 0 (0.0%) |
| 5 to 9 Unit Apartments | 15 (26.8%) | 41 (73.2%) |
| 10 or more Apartments | 11 (17.2%) | 53 (82.8%) |
| Mobile Home / Other | 1,120 (100.0%) | 0 (0.0%) |
| Total | 3,375 (89.6%) | 392 (10.4%) |
Housing Structures by Number of Rooms in Calimesa
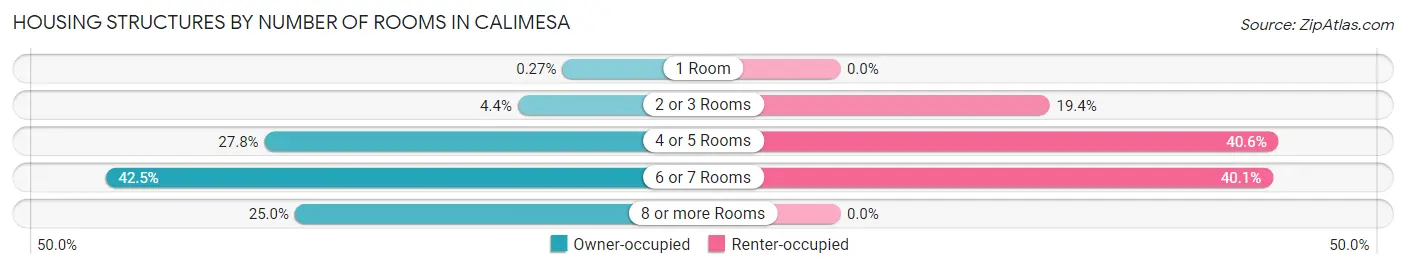
| Number of Rooms | Owner-occupied | Renter-occupied |
| 1 Room | 9 (0.3%) | 0 (0.0%) |
| 2 or 3 Rooms | 148 (4.4%) | 76 (19.4%) |
| 4 or 5 Rooms | 939 (27.8%) | 159 (40.6%) |
| 6 or 7 Rooms | 1,435 (42.5%) | 157 (40.1%) |
| 8 or more Rooms | 844 (25.0%) | 0 (0.0%) |
| Total | 3,375 (100.0%) | 392 (100.0%) |
Housing Structure by Heating Type in Calimesa
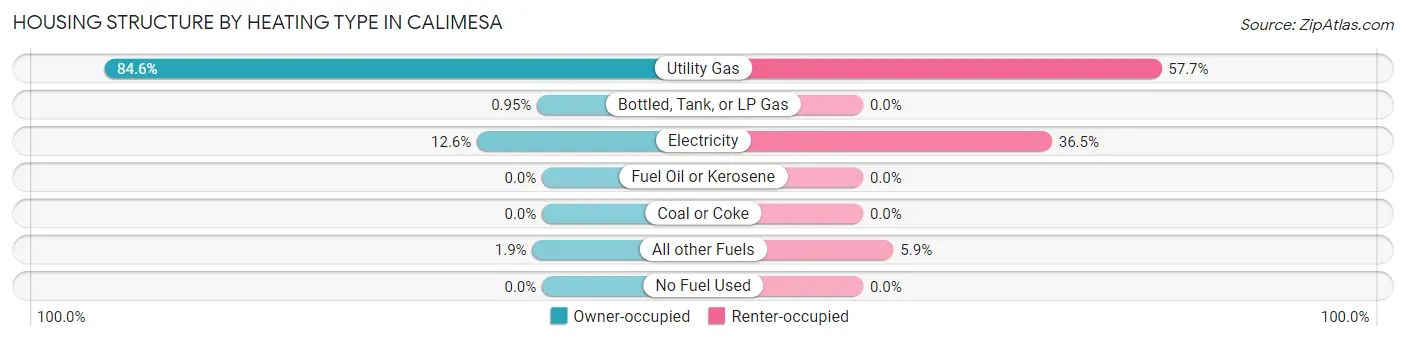
| Heating Type | Owner-occupied | Renter-occupied |
| Utility Gas | 2,856 (84.6%) | 226 (57.7%) |
| Bottled, Tank, or LP Gas | 32 (0.9%) | 0 (0.0%) |
| Electricity | 424 (12.6%) | 143 (36.5%) |
| Fuel Oil or Kerosene | 0 (0.0%) | 0 (0.0%) |
| Coal or Coke | 0 (0.0%) | 0 (0.0%) |
| All other Fuels | 63 (1.9%) | 23 (5.9%) |
| No Fuel Used | 0 (0.0%) | 0 (0.0%) |
| Total | 3,375 (100.0%) | 392 (100.0%) |
Household Vehicle Usage in Calimesa
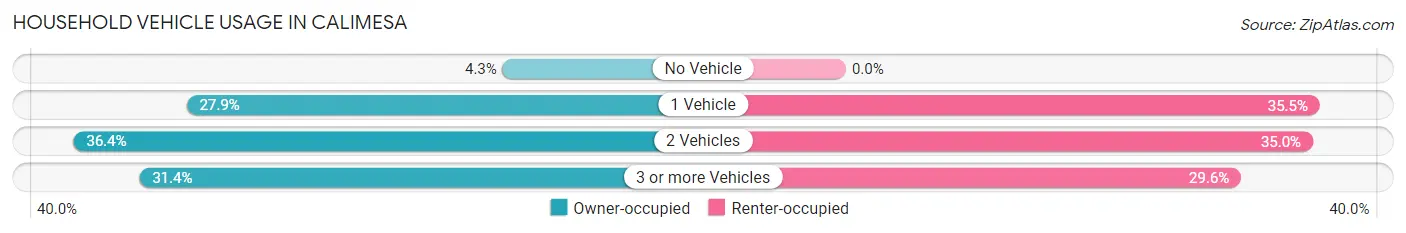
| Vehicles per Household | Owner-occupied | Renter-occupied |
| No Vehicle | 145 (4.3%) | 0 (0.0%) |
| 1 Vehicle | 942 (27.9%) | 139 (35.5%) |
| 2 Vehicles | 1,227 (36.4%) | 137 (34.9%) |
| 3 or more Vehicles | 1,061 (31.4%) | 116 (29.6%) |
| Total | 3,375 (100.0%) | 392 (100.0%) |
Real Estate & Mortgages in Calimesa
Real Estate and Mortgage Overview in Calimesa
| Characteristic | Without Mortgage | With Mortgage |
| Housing Units | 1,462 | 1,913 |
| Median Property Value | $167,200 | $451,200 |
| Median Household Income | $46,000 | $594 |
| Monthly Housing Costs | $548 | $245 |
| Real Estate Taxes | $791 | $15 |
Property Value by Mortgage Status in Calimesa
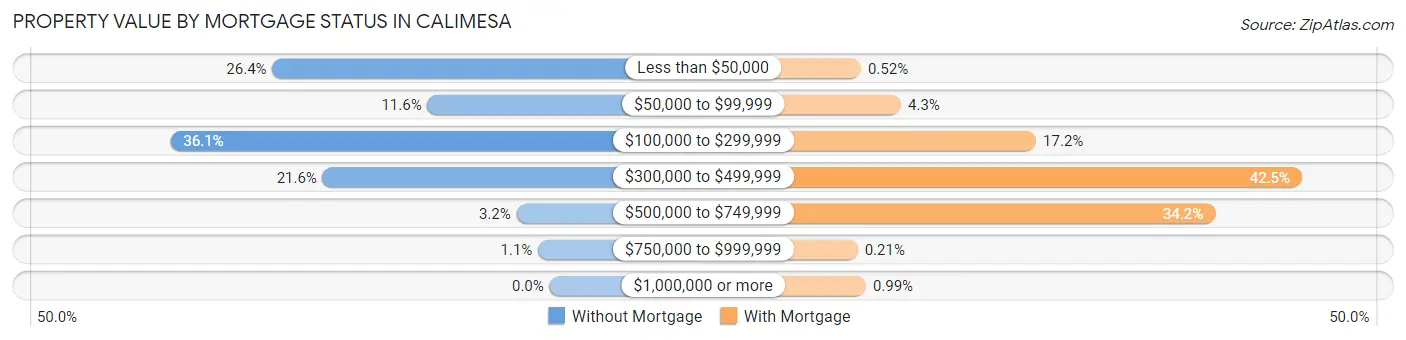
| Property Value | Without Mortgage | With Mortgage |
| Less than $50,000 | 386 (26.4%) | 10 (0.5%) |
| $50,000 to $99,999 | 170 (11.6%) | 83 (4.3%) |
| $100,000 to $299,999 | 528 (36.1%) | 329 (17.2%) |
| $300,000 to $499,999 | 316 (21.6%) | 813 (42.5%) |
| $500,000 to $749,999 | 46 (3.2%) | 655 (34.2%) |
| $750,000 to $999,999 | 16 (1.1%) | 4 (0.2%) |
| $1,000,000 or more | 0 (0.0%) | 19 (1.0%) |
| Total | 1,462 (100.0%) | 1,913 (100.0%) |
Household Income by Mortgage Status in Calimesa
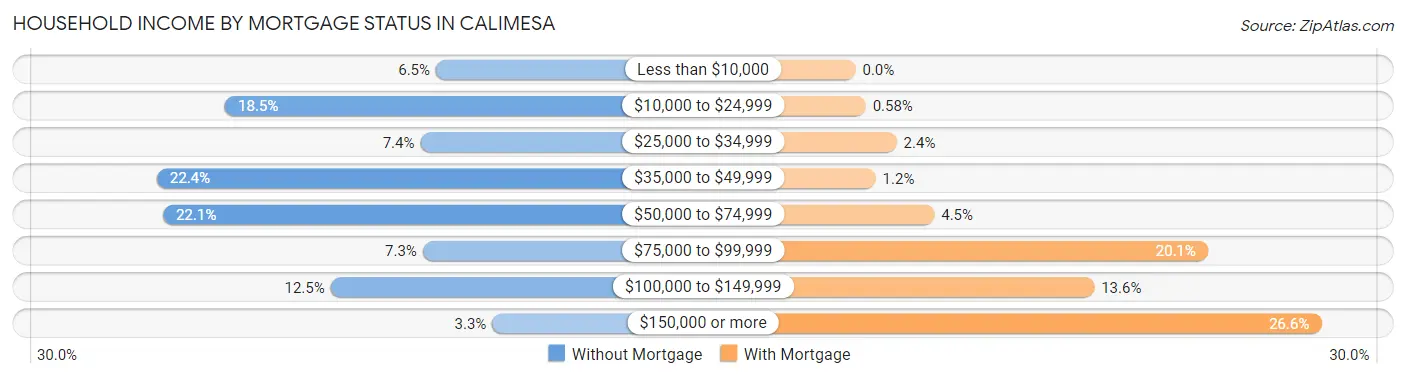
| Household Income | Without Mortgage | With Mortgage |
| Less than $10,000 | 95 (6.5%) | 0 (0.0%) |
| $10,000 to $24,999 | 271 (18.5%) | 11 (0.6%) |
| $25,000 to $34,999 | 108 (7.4%) | 45 (2.4%) |
| $35,000 to $49,999 | 328 (22.4%) | 22 (1.1%) |
| $50,000 to $74,999 | 323 (22.1%) | 86 (4.5%) |
| $75,000 to $99,999 | 106 (7.2%) | 385 (20.1%) |
| $100,000 to $149,999 | 183 (12.5%) | 261 (13.6%) |
| $150,000 or more | 48 (3.3%) | 509 (26.6%) |
| Total | 1,462 (100.0%) | 1,913 (100.0%) |
Property Value to Household Income Ratio in Calimesa
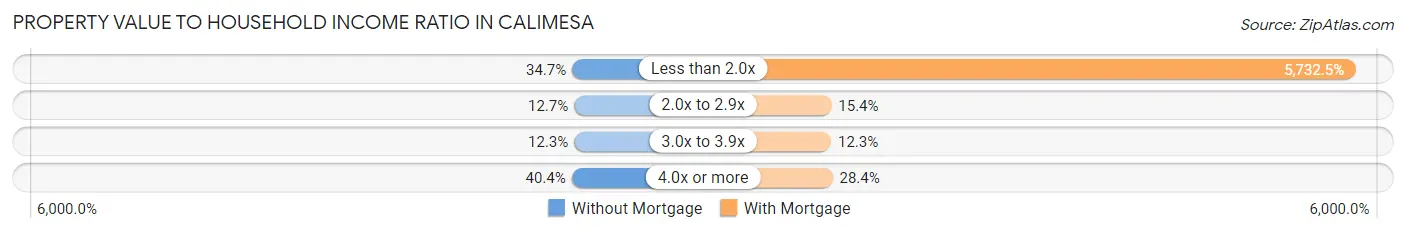
| Value-to-Income Ratio | Without Mortgage | With Mortgage |
| Less than 2.0x | 507 (34.7%) | 109,663 (5,732.5%) |
| 2.0x to 2.9x | 185 (12.7%) | 295 (15.4%) |
| 3.0x to 3.9x | 180 (12.3%) | 235 (12.3%) |
| 4.0x or more | 590 (40.4%) | 544 (28.4%) |
| Total | 1,462 (100.0%) | 1,913 (100.0%) |
Real Estate Taxes by Mortgage Status in Calimesa
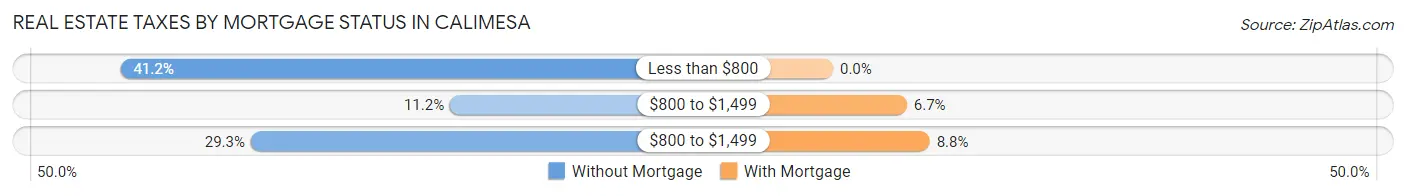
| Property Taxes | Without Mortgage | With Mortgage |
| Less than $800 | 603 (41.2%) | 0 (0.0%) |
| $800 to $1,499 | 163 (11.2%) | 129 (6.7%) |
| $800 to $1,499 | 429 (29.3%) | 169 (8.8%) |
| Total | 1,462 (100.0%) | 1,913 (100.0%) |
Health & Disability in Calimesa
Health Insurance Coverage by Age in Calimesa
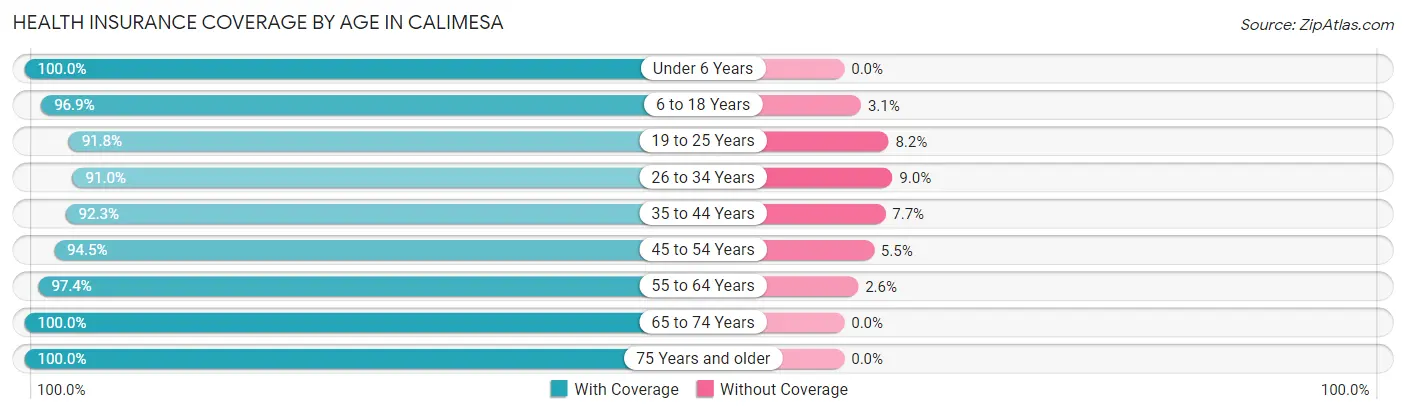
| Age Bracket | With Coverage | Without Coverage |
| Under 6 Years | 545 (100.0%) | 0 (0.0%) |
| 6 to 18 Years | 1,839 (96.9%) | 59 (3.1%) |
| 19 to 25 Years | 579 (91.8%) | 52 (8.2%) |
| 26 to 34 Years | 781 (91.0%) | 77 (9.0%) |
| 35 to 44 Years | 1,193 (92.3%) | 99 (7.7%) |
| 45 to 54 Years | 1,163 (94.5%) | 68 (5.5%) |
| 55 to 64 Years | 1,318 (97.4%) | 35 (2.6%) |
| 65 to 74 Years | 1,380 (100.0%) | 0 (0.0%) |
| 75 Years and older | 1,159 (100.0%) | 0 (0.0%) |
| Total | 9,957 (96.2%) | 390 (3.8%) |
Health Insurance Coverage by Citizenship Status in Calimesa
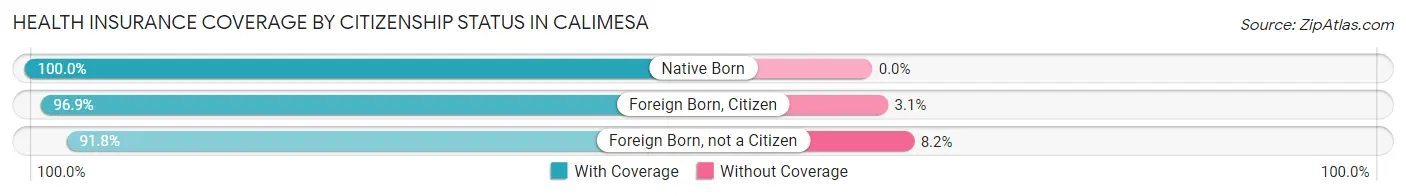
| Citizenship Status | With Coverage | Without Coverage |
| Native Born | 545 (100.0%) | 0 (0.0%) |
| Foreign Born, Citizen | 1,839 (96.9%) | 59 (3.1%) |
| Foreign Born, not a Citizen | 579 (91.8%) | 52 (8.2%) |
Health Insurance Coverage by Household Income in Calimesa
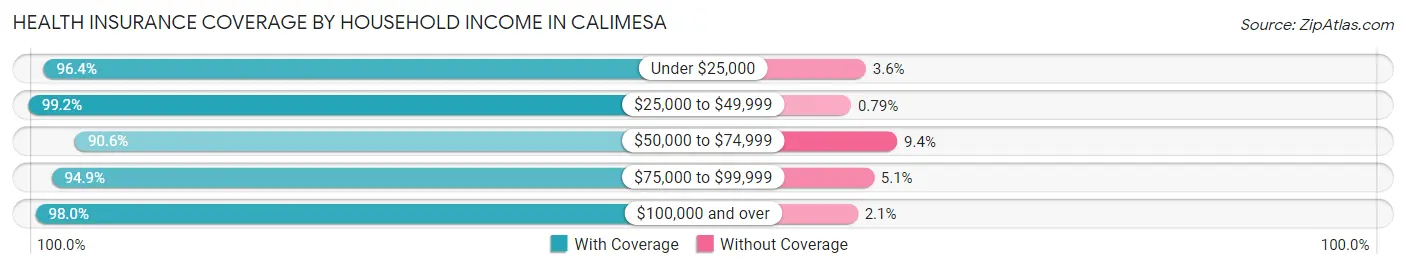
| Household Income | With Coverage | Without Coverage |
| Under $25,000 | 865 (96.4%) | 32 (3.6%) |
| $25,000 to $49,999 | 1,132 (99.2%) | 9 (0.8%) |
| $50,000 to $74,999 | 1,698 (90.6%) | 177 (9.4%) |
| $75,000 to $99,999 | 1,292 (94.9%) | 69 (5.1%) |
| $100,000 and over | 4,932 (98.0%) | 103 (2.1%) |
Public vs Private Health Insurance Coverage by Age in Calimesa
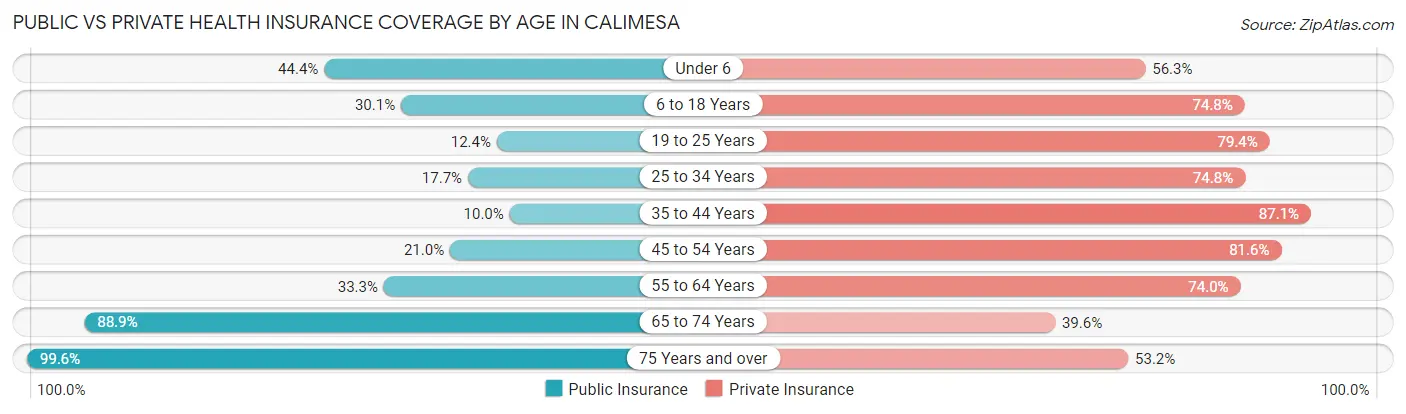
| Age Bracket | Public Insurance | Private Insurance |
| Under 6 | 242 (44.4%) | 307 (56.3%) |
| 6 to 18 Years | 572 (30.1%) | 1,419 (74.8%) |
| 19 to 25 Years | 78 (12.4%) | 501 (79.4%) |
| 25 to 34 Years | 152 (17.7%) | 642 (74.8%) |
| 35 to 44 Years | 129 (10.0%) | 1,125 (87.1%) |
| 45 to 54 Years | 259 (21.0%) | 1,004 (81.6%) |
| 55 to 64 Years | 451 (33.3%) | 1,001 (74.0%) |
| 65 to 74 Years | 1,227 (88.9%) | 546 (39.6%) |
| 75 Years and over | 1,154 (99.6%) | 616 (53.1%) |
| Total | 4,264 (41.2%) | 7,161 (69.2%) |
Disability Status by Sex by Age in Calimesa
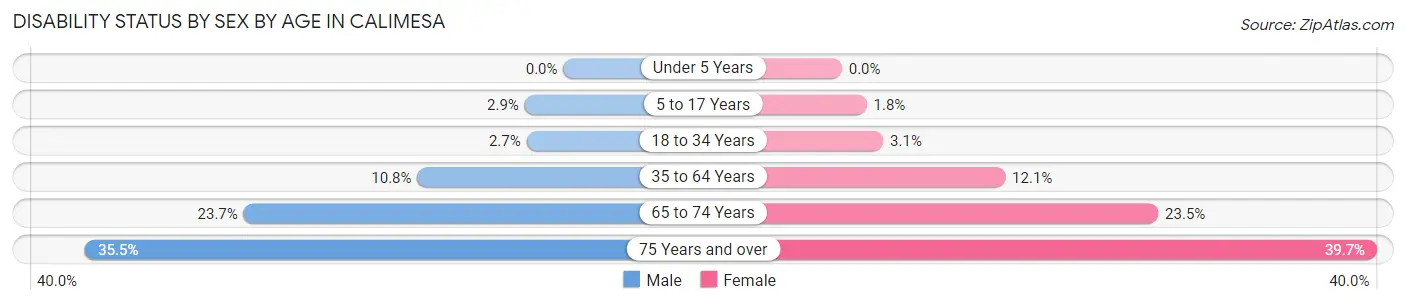
| Age Bracket | Male | Female |
| Under 5 Years | 0 (0.0%) | 0 (0.0%) |
| 5 to 17 Years | 27 (2.9%) | 14 (1.8%) |
| 18 to 34 Years | 23 (2.7%) | 26 (3.1%) |
| 35 to 64 Years | 202 (10.8%) | 244 (12.1%) |
| 65 to 74 Years | 174 (23.7%) | 152 (23.5%) |
| 75 Years and over | 147 (35.5%) | 296 (39.7%) |
Disability Class by Sex by Age in Calimesa
Disability Class: Hearing Difficulty
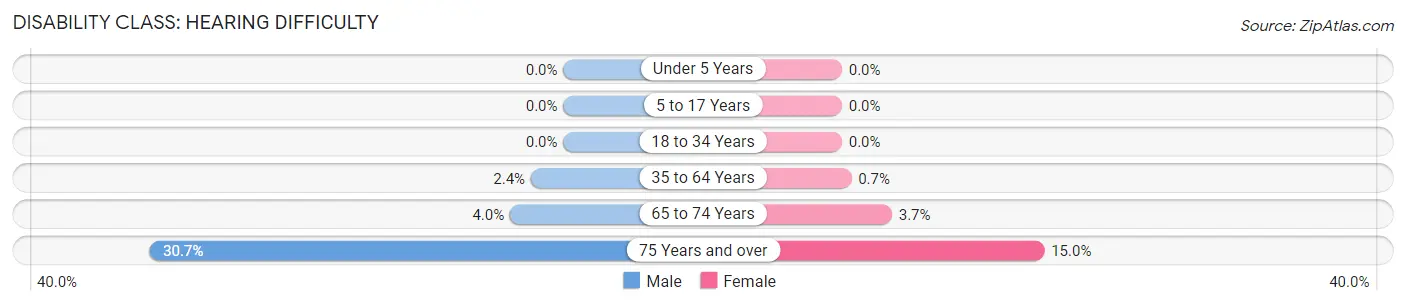
| Age Bracket | Male | Female |
| Under 5 Years | 0 (0.0%) | 0 (0.0%) |
| 5 to 17 Years | 0 (0.0%) | 0 (0.0%) |
| 18 to 34 Years | 0 (0.0%) | 0 (0.0%) |
| 35 to 64 Years | 45 (2.4%) | 14 (0.7%) |
| 65 to 74 Years | 29 (4.0%) | 24 (3.7%) |
| 75 Years and over | 127 (30.7%) | 112 (15.0%) |
Disability Class: Vision Difficulty
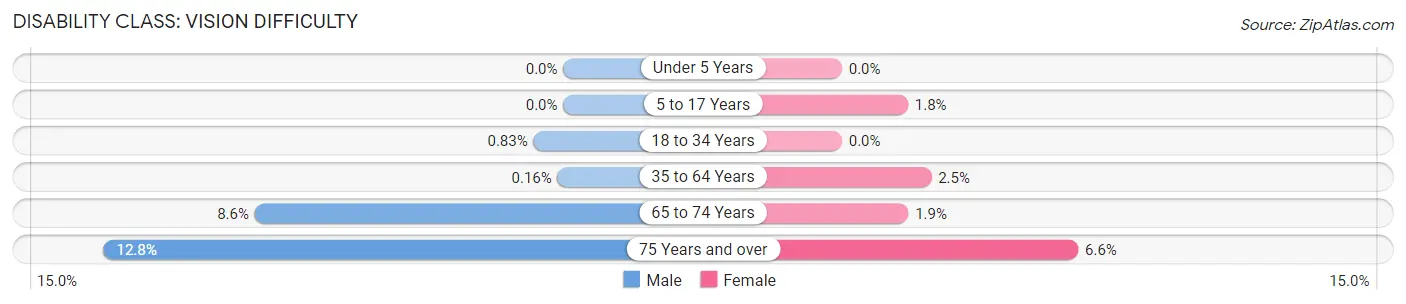
| Age Bracket | Male | Female |
| Under 5 Years | 0 (0.0%) | 0 (0.0%) |
| 5 to 17 Years | 0 (0.0%) | 14 (1.8%) |
| 18 to 34 Years | 7 (0.8%) | 0 (0.0%) |
| 35 to 64 Years | 3 (0.2%) | 50 (2.5%) |
| 65 to 74 Years | 63 (8.6%) | 12 (1.8%) |
| 75 Years and over | 53 (12.8%) | 49 (6.6%) |
Disability Class: Cognitive Difficulty
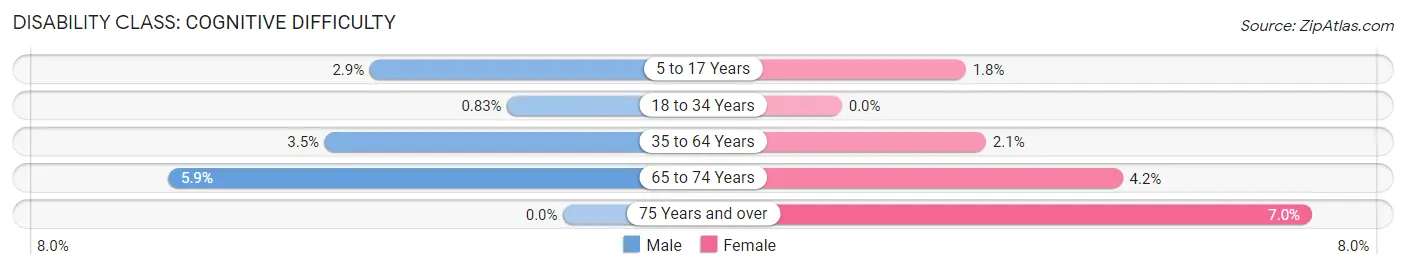
| Age Bracket | Male | Female |
| 5 to 17 Years | 27 (2.9%) | 14 (1.8%) |
| 18 to 34 Years | 7 (0.8%) | 0 (0.0%) |
| 35 to 64 Years | 66 (3.5%) | 43 (2.1%) |
| 65 to 74 Years | 43 (5.9%) | 27 (4.2%) |
| 75 Years and over | 0 (0.0%) | 52 (7.0%) |
Disability Class: Ambulatory Difficulty
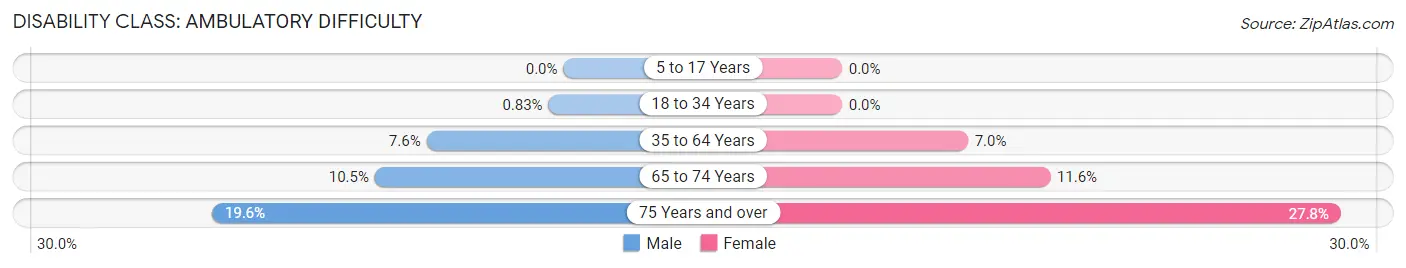
| Age Bracket | Male | Female |
| 5 to 17 Years | 0 (0.0%) | 0 (0.0%) |
| 18 to 34 Years | 7 (0.8%) | 0 (0.0%) |
| 35 to 64 Years | 142 (7.6%) | 141 (7.0%) |
| 65 to 74 Years | 77 (10.5%) | 75 (11.6%) |
| 75 Years and over | 81 (19.6%) | 207 (27.8%) |
Disability Class: Self-Care Difficulty
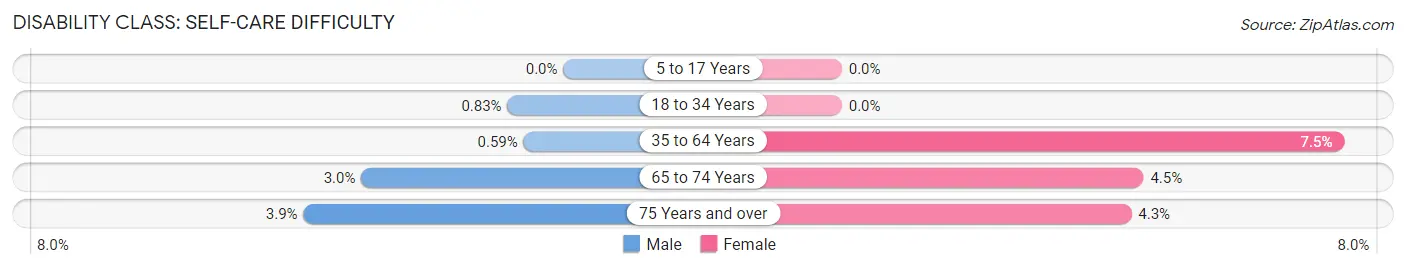
| Age Bracket | Male | Female |
| 5 to 17 Years | 0 (0.0%) | 0 (0.0%) |
| 18 to 34 Years | 7 (0.8%) | 0 (0.0%) |
| 35 to 64 Years | 11 (0.6%) | 150 (7.5%) |
| 65 to 74 Years | 22 (3.0%) | 29 (4.5%) |
| 75 Years and over | 16 (3.9%) | 32 (4.3%) |
Technology Access in Calimesa
Computing Device Access in Calimesa
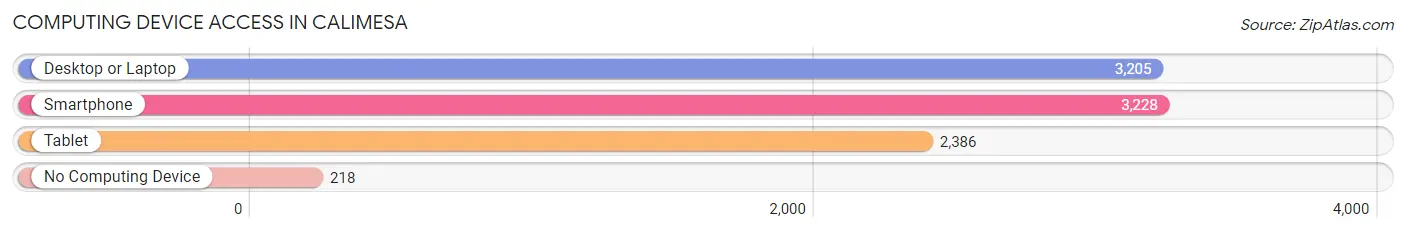
| Device Type | # Households | % Households |
| Desktop or Laptop | 3,205 | 85.1% |
| Smartphone | 3,228 | 85.7% |
| Tablet | 2,386 | 63.3% |
| No Computing Device | 218 | 5.8% |
| Total | 3,767 | 100.0% |
Internet Access in Calimesa
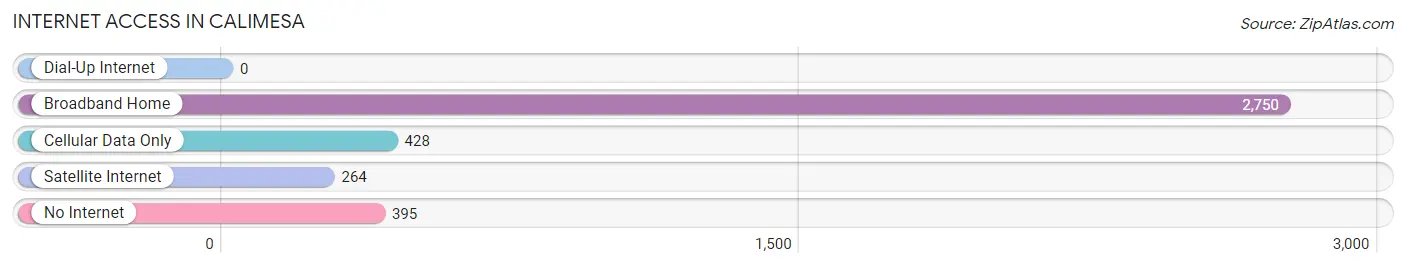
| Internet Type | # Households | % Households |
| Dial-Up Internet | 0 | 0.0% |
| Broadband Home | 2,750 | 73.0% |
| Cellular Data Only | 428 | 11.4% |
| Satellite Internet | 264 | 7.0% |
| No Internet | 395 | 10.5% |
| Total | 3,767 | 100.0% |
Calimesa Summary
Calimesa, California is a small city located in Riverside County, California. It is situated in the San Gorgonio Pass, which is a major pass through the San Bernardino Mountains. The city is located about 10 miles east of the city of San Bernardino and about 70 miles east of Los Angeles. The population of Calimesa was 8,890 at the 2010 census, up from 8,078 at the 2000 census.
History
Calimesa was founded in 1883 by two brothers, John and Fred Wiedman, who purchased the land from the San Gorgonio Ranch Company. The brothers named the town Calimesa, which is derived from the Spanish words “calma” and “mesa”, meaning “peaceful tableland”. The town was originally a stagecoach stop along the route between Los Angeles and San Bernardino.
In the early 1900s, Calimesa began to grow as a farming community. The town was known for its citrus groves and other agricultural products. The citrus industry was particularly important to the town’s economy, and the town was known as the “Citrus Capital of the World”.
In the 1950s, Calimesa began to experience a population boom as people moved to the area from Los Angeles and other parts of California. The population of Calimesa grew from 1,500 in 1950 to 8,078 in 2000.
Geography
Calimesa is located in the San Gorgonio Pass, which is a major pass through the San Bernardino Mountains. The city is situated at an elevation of 1,064 feet (324 m). The city covers an area of 4.3 square miles (11.2 km2).
The climate in Calimesa is semi-arid, with hot summers and mild winters. The average annual temperature is 68°F (20°C). The average annual precipitation is 8.5 inches (216 mm).
Economy
Calimesa’s economy is largely based on agriculture and tourism. The city is home to several citrus groves, as well as other agricultural products such as avocados, olives, and dates. The city is also home to several wineries and vineyards.
Tourism is also an important part of the economy. The city is home to several attractions, including the Calimesa Country Club, the Calimesa Nature Preserve, and the Calimesa Historical Museum.
Demographics
As of the 2010 census, the population of Calimesa was 8,890. The racial makeup of the city was 79.2% White, 0.7% African American, 1.2% Native American, 0.7% Asian, 0.1% Pacific Islander, 15.2% from other races, and 3.0% from two or more races. Hispanic or Latino of any race were 33.2% of the population.
The median household income in Calimesa was $50,945, and the median family income was $56,945. The per capita income was $22,945. About 11.2% of the population was below the poverty line.
Calimesa is a small city with a rich history and a diverse population. The city’s economy is largely based on agriculture and tourism, and the city is home to several attractions. The population of Calimesa has grown steadily over the past few decades, and the city is expected to continue to grow in the future.
Common Questions
What is Per Capita Income in Calimesa?
Per Capita income in Calimesa is $34,901.
What is the Median Family Income in Calimesa?
Median Family Income in Calimesa is $92,306.
What is the Median Household income in Calimesa?
Median Household Income in Calimesa is $74,236.
What is Income or Wage Gap in Calimesa?
Income or Wage Gap in Calimesa is 17.7%.
Women in Calimesa earn 82.3 cents for every dollar earned by a man.
What is Inequality or Gini Index in Calimesa?
Inequality or Gini Index in Calimesa is 0.41.
What is the Total Population of Calimesa?
Total Population of Calimesa is 10,366.
What is the Total Male Population of Calimesa?
Total Male Population of Calimesa is 5,147.
What is the Total Female Population of Calimesa?
Total Female Population of Calimesa is 5,219.
What is the Ratio of Males per 100 Females in Calimesa?
There are 98.62 Males per 100 Females in Calimesa.
What is the Ratio of Females per 100 Males in Calimesa?
There are 101.40 Females per 100 Males in Calimesa.
What is the Median Population Age in Calimesa?
Median Population Age in Calimesa is 44.0 Years.
What is the Average Family Size in Calimesa
Average Family Size in Calimesa is 3.3 People.
What is the Average Household Size in Calimesa
Average Household Size in Calimesa is 2.7 People.
How Large is the Labor Force in Calimesa?
There are 4,587 People in the Labor Forcein in Calimesa.
What is the Percentage of People in the Labor Force in Calimesa?
54.3% of People are in the Labor Force in Calimesa.
What is the Unemployment Rate in Calimesa?
Unemployment Rate in Calimesa is 2.3%.